Embed Size (px)
Citation preview
March 24, 2015
Initiating Coverage
ICICI Securities Ltd | Retail Equity Research
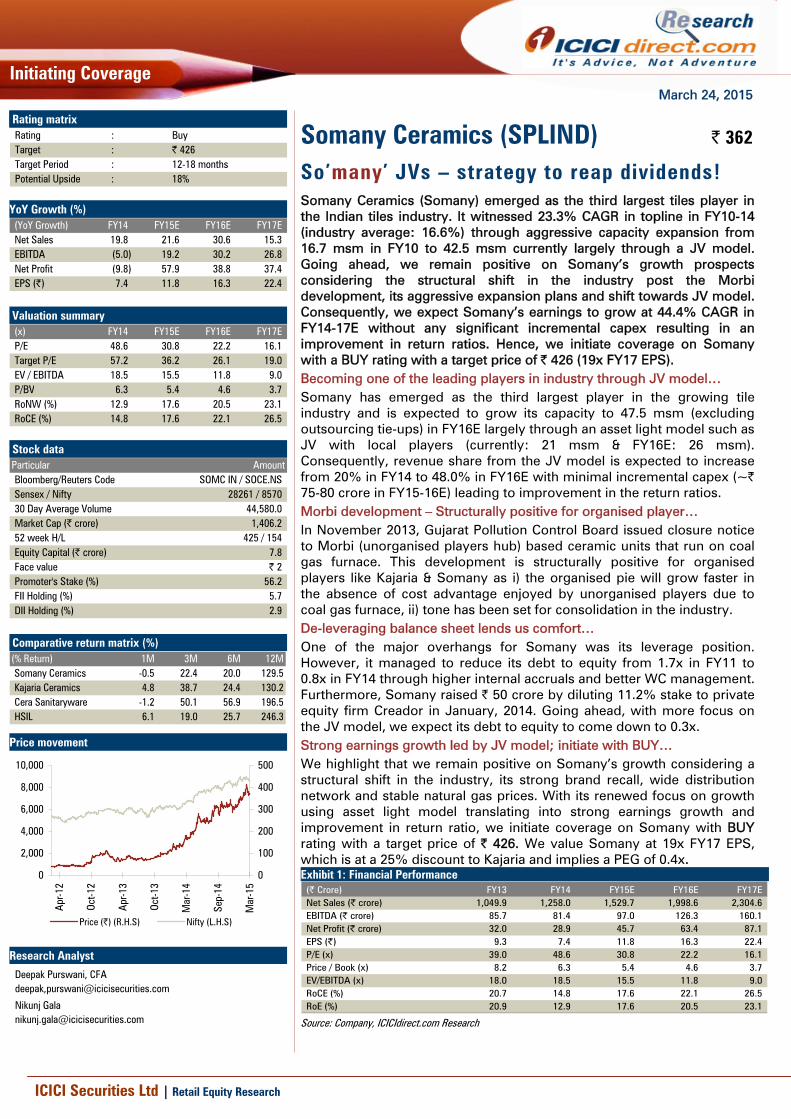
So’many’ JVs – strategy to reap dividends! Somany Ceramics (Somany) emerged as the third largest tiles player in the Indian tiles industry. It witnessed 23.3% CAGR in topline in FY10-14 (industry average: 16.6%) through aggressive capacity expansion from 16.7 msm in FY10 to 42.5 msm currently largely through a JV model. Going ahead, we remain positive on Somany’s growth prospects considering the structural shift in the industry post the Morbi development, its aggressive expansion plans and shift towards JV model. Consequently, we expect Somany’s earnings to grow at 44.4% CAGR in FY14-17E without any significant incremental capex resulting in an improvement in return ratios. Hence, we initiate coverage on Somany with a BUY rating with a target price of | 426 (19x FY17 EPS). Becoming one of the leading players in industry through JV model… Somany has emerged as the third largest player in the growing tile industry and is expected to grow its capacity to 47.5 msm (excluding outsourcing tie-ups) in FY16E largely through an asset light model such as JV with local players (currently: 21 msm & FY16E: 26 msm). Consequently, revenue share from the JV model is expected to increase from 20% in FY14 to 48.0% in FY16E with minimal incremental capex (~| 75-80 crore in FY15-16E) leading to improvement in the return ratios. Morbi development – Structurally positive for organised player… In November 2013, Gujarat Pollution Control Board issued closure notice to Morbi (unorganised players hub) based ceramic units that run on coal gas furnace. This development is structurally positive for organised players like Kajaria & Somany as i) the organised pie will grow faster in the absence of cost advantage enjoyed by unorganised players due to coal gas furnace, ii) tone has been set for consolidation in the industry. De-leveraging balance sheet lends us comfort… One of the major overhangs for Somany was its leverage position. However, it managed to reduce its debt to equity from 1.7x in FY11 to 0.8x in FY14 through higher internal accruals and better WC management. Furthermore, Somany raised | 50 crore by diluting 11.2% stake to private equity firm Creador in January, 2014. Going ahead, with more focus on the JV model, we expect its debt to equity to come down to 0.3x. Strong earnings growth led by JV model; initiate with BUY… We highlight that we remain positive on Somany’s growth considering a structural shift in the industry, its strong brand recall, wide distribution network and stable natural gas prices. With its renewed focus on growth using asset light model translating into strong earnings growth and improvement in return ratio, we initiate coverage on Somany with BUY rating with a target price of | 426. We value Somany at 19x FY17 EPS, which is at a 25% discount to Kajaria and implies a PEG of 0.4x. Exhibit 1: Financial Performance
(| Crore) FY13 FY14 FY15E FY16E FY17ENet Sales (| crore) 1,049.9 1,258.0 1,529.7 1,998.6 2,304.6 EBITDA (| crore) 85.7 81.4 97.0 126.3 160.1 Net Profit (| crore) 32.0 28.9 45.7 63.4 87.1 EPS (|) 9.3 7.4 11.8 16.3 22.4 P/E (x) 39.0 48.6 30.8 22.2 16.1 Price / Book (x) 8.2 6.3 5.4 4.6 3.7 EV/EBITDA (x) 18.0 18.5 15.5 11.8 9.0 RoCE (%) 20.7 14.8 17.6 22.1 26.5 RoE (%) 20.9 12.9 17.6 20.5 23.1
Source: Company, ICICIdirect.com Research
Somany Ceramics (SPLIND) | 362 Rating matrix
Rating : BuyTarget : | 426Target Period : 12-18 monthsPotential Upside : 18%
YoY Growth (%)
(YoY Growth) FY14 FY15E FY16E FY17ENet Sales 19.8 21.6 30.6 15.3 EBITDA (5.0) 19.2 30.2 26.8 Net Profit (9.8) 57.9 38.8 37.4 EPS (|) 7.4 11.8 16.3 22.4
Valuation summary
(x) FY14 FY15E FY16E FY17EP/E 48.6 30.8 22.2 16.1 Target P/E 57.2 36.2 26.1 19.0 EV / EBITDA 18.5 15.5 11.8 9.0 P/BV 6.3 5.4 4.6 3.7 RoNW (%) 12.9 17.6 20.5 23.1 RoCE (%) 14.8 17.6 22.1 26.5
Stock data Particular AmountBloomberg/Reuters Code SOMC IN / SOCE.NSSensex / Nifty 28261 / 857030 Day Average Volume 44,580.0 Market Cap (| crore) 1,406.2 52 week H/L 425 / 154Equity Capital (| crore) 7.8 Face value | 2Promoter's Stake (%) 56.2 FII Holding (%) 5.7 DII Holding (%) 2.9
Comparative return matrix (%) (% Return) 1M 3M 6M 12MSomany Ceramics -0.5 22.4 20.0 129.5Kajaria Ceramics 4.8 38.7 24.4 130.2Cera Sanitaryware -1.2 50.1 56.9 196.5HSIL 6.1 19.0 25.7 246.3
Price movement
0
100
200
300
400
500
Mar
-15
Sep-
14
Mar
-14
Oct-1
3
Apr
-13
Oct-1
2
Apr
-12
0
2,000
4,000
6,000
8,000
10,000
Price (|) (R.H.S) Nifty (L.H.S) Research Analyst
Deepak Purswani, CFA deepak,[email protected]
Nikunj Gala [email protected]
Page 2 ICICI Securities Ltd | Retail Equity Research
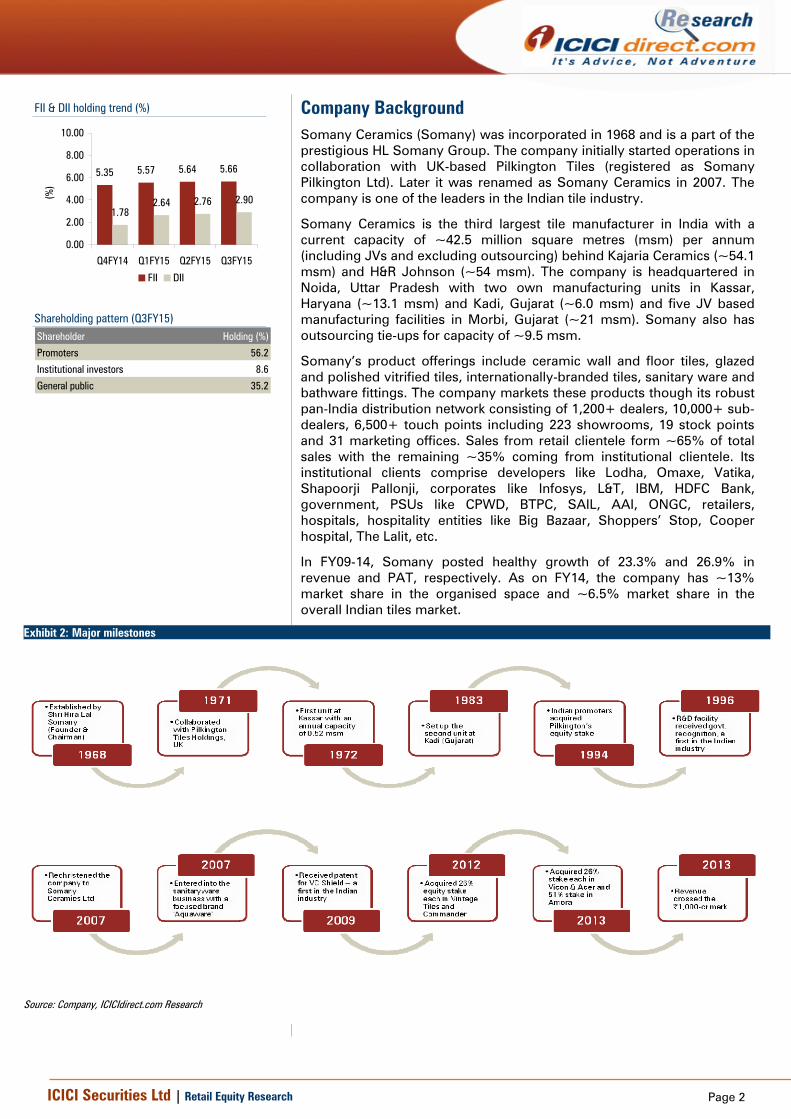
Company Background Somany Ceramics (Somany) was incorporated in 1968 and is a part of the prestigious HL Somany Group. The company initially started operations in collaboration with UK-based Pilkington Tiles (registered as Somany Pilkington Ltd). Later it was renamed as Somany Ceramics in 2007. The company is one of the leaders in the Indian tile industry.
Somany Ceramics is the third largest tile manufacturer in India with a current capacity of ~42.5 million square metres (msm) per annum (including JVs and excluding outsourcing) behind Kajaria Ceramics (~54.1 msm) and H&R Johnson (~54 msm). The company is headquartered in Noida, Uttar Pradesh with two own manufacturing units in Kassar, Haryana (~13.1 msm) and Kadi, Gujarat (~6.0 msm) and five JV based manufacturing facilities in Morbi, Gujarat (~21 msm). Somany also has outsourcing tie-ups for capacity of ~9.5 msm.
Somany’s product offerings include ceramic wall and floor tiles, glazed and polished vitrified tiles, internationally-branded tiles, sanitary ware and bathware fittings. The company markets these products though its robust pan-India distribution network consisting of 1,200+ dealers, 10,000+ sub-dealers, 6,500+ touch points including 223 showrooms, 19 stock points and 31 marketing offices. Sales from retail clientele form ~65% of total sales with the remaining ~35% coming from institutional clientele. Its institutional clients comprise developers like Lodha, Omaxe, Vatika, Shapoorji Pallonji, corporates like Infosys, L&T, IBM, HDFC Bank, government, PSUs like CPWD, BTPC, SAIL, AAI, ONGC, retailers, hospitals, hospitality entities like Big Bazaar, Shoppers’ Stop, Cooper hospital, The Lalit, etc.
In FY09-14, Somany posted healthy growth of 23.3% and 26.9% in revenue and PAT, respectively. As on FY14, the company has ~13% market share in the organised space and ~6.5% market share in the overall Indian tiles market.
Exhibit 2: Major milestones
Source: Company, ICICIdirect.com Research
FII & DII holding trend (%)
5.35 5.57 5.64 5.66
1.782.64 2.76 2.90
0.00
2.00
4.00
6.00
8.00
10.00
Q4FY14 Q1FY15 Q2FY15 Q3FY15
(%)
FII DII
Shareholding pattern (Q3FY15) Shareholder Holding (%)
Promoters 56.2
Institutional investors 8.6
General public 35.2
Page 3 ICICI Securities Ltd | Retail Equity Research
Investment Rationale Global tile industry - bird's eye view!!!
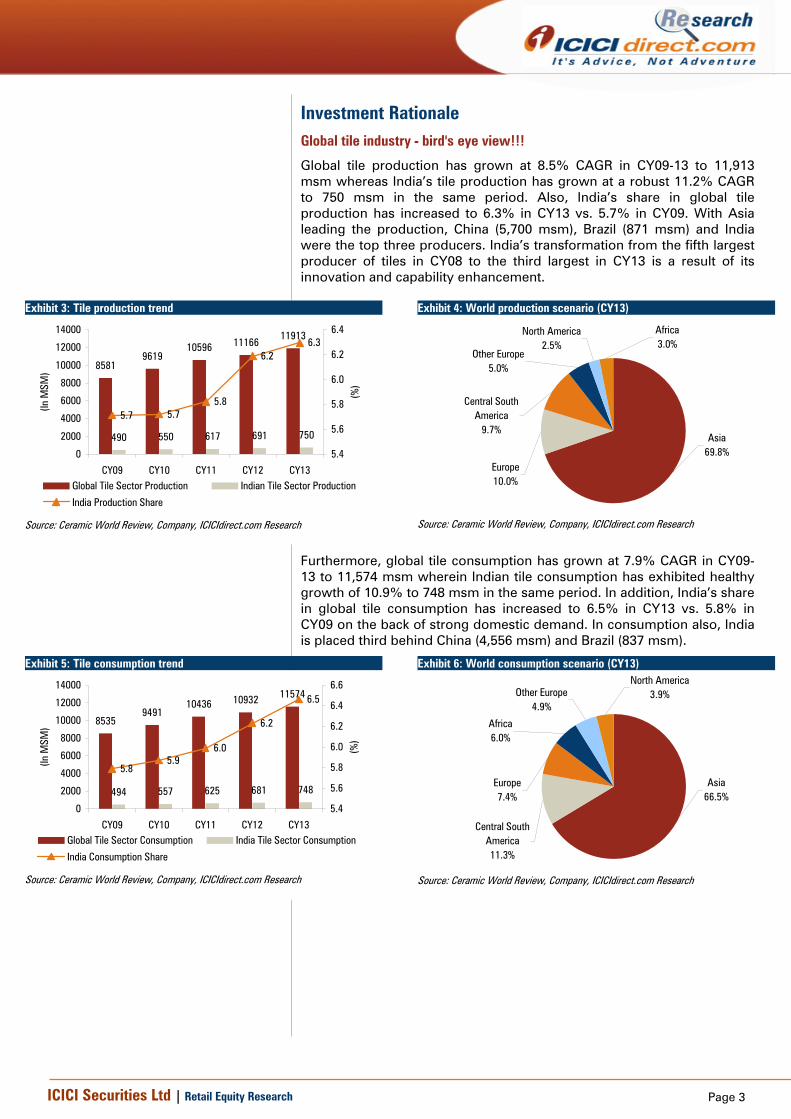
Global tile production has grown at 8.5% CAGR in CY09-13 to 11,913 msm whereas India’s tile production has grown at a robust 11.2% CAGR to 750 msm in the same period. Also, India’s share in global tile production has increased to 6.3% in CY13 vs. 5.7% in CY09. With Asia leading the production, China (5,700 msm), Brazil (871 msm) and India were the top three producers. India’s transformation from the fifth largest producer of tiles in CY08 to the third largest in CY13 is a result of its innovation and capability enhancement.
Exhibit 3: Tile production trend
85819619
10596 1116611913
490 550 617 691 750
5.7 5.75.8
6.26.3
0
2000
4000
6000
8000
10000
12000
14000
CY09 CY10 CY11 CY12 CY13
(In M
SM)
5.4
5.6
5.8
6.0
6.2
6.4
(%)
Global Tile Sector Production Indian Tile Sector Production
India Production Share
Source: Ceramic World Review, Company, ICICIdirect.com Research
Exhibit 4: World production scenario (CY13)
Africa3.0%
North America2.5%
Other Europe5.0%
Central South America
9.7%
Europe10.0%
Asia69.8%
Source: Ceramic World Review, Company, ICICIdirect.com Research
Furthermore, global tile consumption has grown at 7.9% CAGR in CY09-13 to 11,574 msm wherein Indian tile consumption has exhibited healthy growth of 10.9% to 748 msm in the same period. In addition, India’s share in global tile consumption has increased to 6.5% in CY13 vs. 5.8% in CY09 on the back of strong domestic demand. In consumption also, India is placed third behind China (4,556 msm) and Brazil (837 msm).
Exhibit 5: Tile consumption trend
85359491
10436 10932 11574
494 557 625 681 748
5.85.9
6.0
6.2
6.5
0
2000
4000
6000
8000
10000
12000
14000
CY09 CY10 CY11 CY12 CY13
(In M
SM)
5.4
5.6
5.8
6.0
6.2
6.4
6.6
(%)
Global Tile Sector Consumption India Tile Sector Consumption
India Consumption Share
Source: Ceramic World Review, Company, ICICIdirect.com Research
Exhibit 6: World consumption scenario (CY13) North America
3.9%Other Europe4.9%
Africa6.0%
Europe7.4%
Central South America11.3%
Asia66.5%
Source: Ceramic World Review, Company, ICICIdirect.com Research
Page 4 ICICI Securities Ltd | Retail Equity Research
Indian tile industry – Moving up the value chain!!!
The Indian tiles industry has exhibited strong growth vis-à-vis its global counterparts led by strong demand owing to the emergence of tiles as a durable, cost-effective and convenient flooring solution over other flooring material like natural stone, mud, cement, etc. Furthermore, increasing disposable income, affordability, urbanisation, brand aspiration and home aesthetics have led consumers to shift to branded and high value products. Also, lower cost of equipment and imposition of anti-dumping duty had given a major push to the domestic tiles industry, on the supply side.
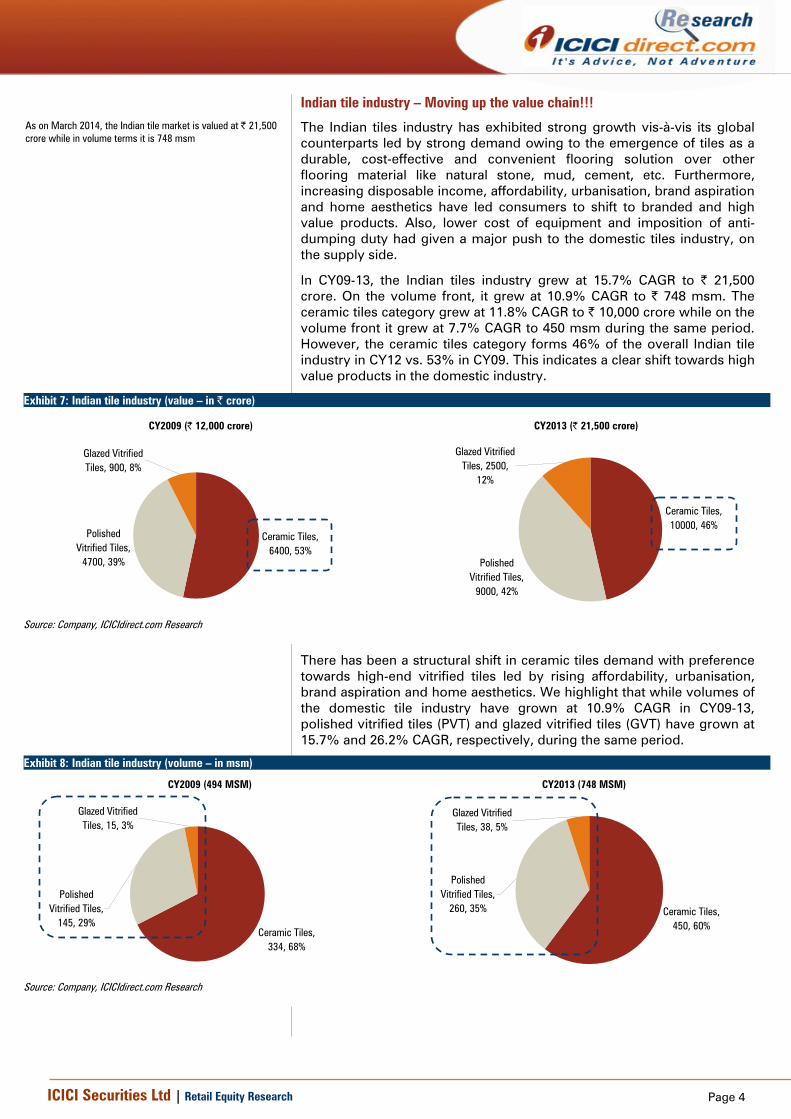
In CY09-13, the Indian tiles industry grew at 15.7% CAGR to | 21,500 crore. On the volume front, it grew at 10.9% CAGR to | 748 msm. The ceramic tiles category grew at 11.8% CAGR to | 10,000 crore while on the volume front it grew at 7.7% CAGR to 450 msm during the same period. However, the ceramic tiles category forms 46% of the overall Indian tile industry in CY12 vs. 53% in CY09. This indicates a clear shift towards high value products in the domestic industry.
Exhibit 7: Indian tile industry (value – in | crore)
CY2009 (| 12,000 crore)
Ceramic Tiles, 6400, 53%
Polished Vitrified Tiles,
4700, 39%
Glazed Vitrified Tiles, 900, 8%
CY2013 (| 21,500 crore)
Ceramic Tiles, 10000, 46%
Polished Vitrified Tiles,
9000, 42%
Glazed Vitrified Tiles, 2500,
12%
Source: Company, ICICIdirect.com Research
There has been a structural shift in ceramic tiles demand with preference towards high-end vitrified tiles led by rising affordability, urbanisation, brand aspiration and home aesthetics. We highlight that while volumes of the domestic tile industry have grown at 10.9% CAGR in CY09-13, polished vitrified tiles (PVT) and glazed vitrified tiles (GVT) have grown at 15.7% and 26.2% CAGR, respectively, during the same period.
Exhibit 8: Indian tile industry (volume – in msm)
CY2009 (494 MSM)
Glazed Vitrified Tiles, 15, 3%
Polished Vitrified Tiles,
145, 29%Ceramic Tiles,
334, 68%
CY2013 (748 MSM)
Ceramic Tiles, 450, 60%
Polished Vitrified Tiles,
260, 35%
Glazed Vitrified Tiles, 38, 5%
Source: Company, ICICIdirect.com Research
As on March 2014, the Indian tile market is valued at | 21,500 crore while in volume terms it is 748 msm
Page 5 ICICI Securities Ltd | Retail Equity Research
Morbi development…Structural shift towards organised players…
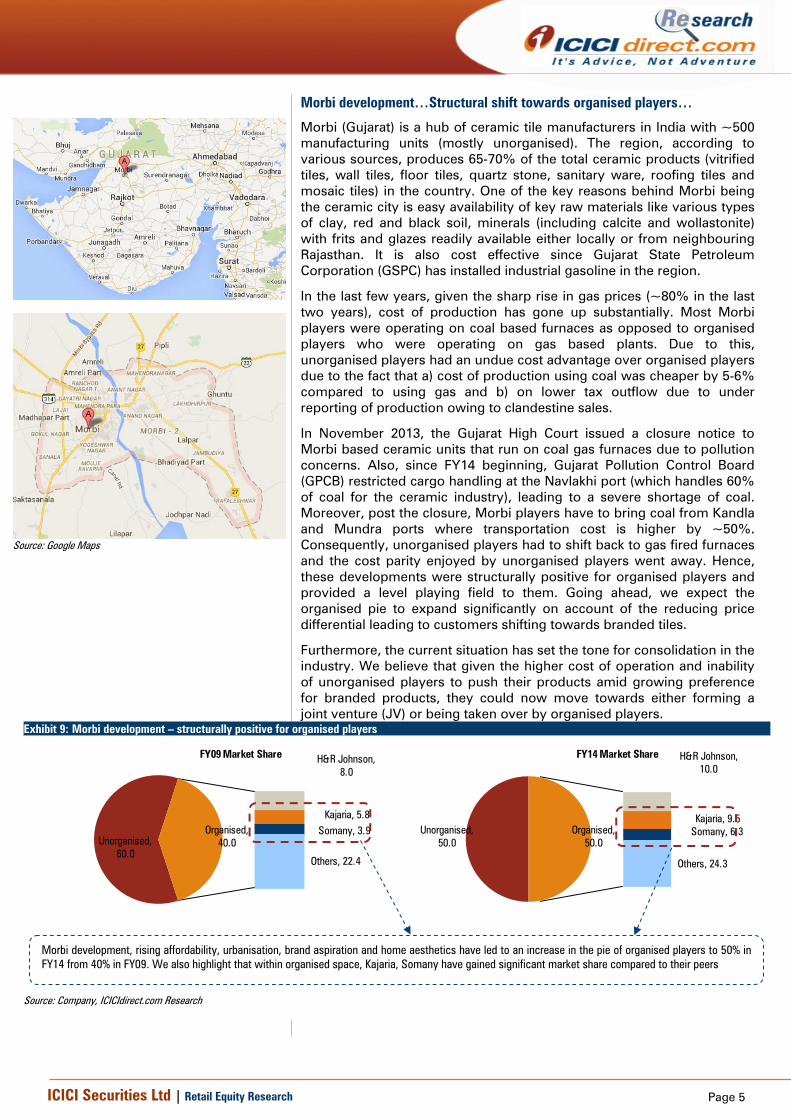
Morbi (Gujarat) is a hub of ceramic tile manufacturers in India with ~500 manufacturing units (mostly unorganised). The region, according to various sources, produces 65-70% of the total ceramic products (vitrified tiles, wall tiles, floor tiles, quartz stone, sanitary ware, roofing tiles and mosaic tiles) in the country. One of the key reasons behind Morbi being the ceramic city is easy availability of key raw materials like various types of clay, red and black soil, minerals (including calcite and wollastonite) with frits and glazes readily available either locally or from neighbouring Rajasthan. It is also cost effective since Gujarat State Petroleum Corporation (GSPC) has installed industrial gasoline in the region.
In the last few years, given the sharp rise in gas prices (~80% in the last two years), cost of production has gone up substantially. Most Morbi players were operating on coal based furnaces as opposed to organised players who were operating on gas based plants. Due to this, unorganised players had an undue cost advantage over organised players due to the fact that a) cost of production using coal was cheaper by 5-6% compared to using gas and b) on lower tax outflow due to under reporting of production owing to clandestine sales.
In November 2013, the Gujarat High Court issued a closure notice to Morbi based ceramic units that run on coal gas furnaces due to pollution concerns. Also, since FY14 beginning, Gujarat Pollution Control Board (GPCB) restricted cargo handling at the Navlakhi port (which handles 60% of coal for the ceramic industry), leading to a severe shortage of coal. Moreover, post the closure, Morbi players have to bring coal from Kandla and Mundra ports where transportation cost is higher by ~50%. Consequently, unorganised players had to shift back to gas fired furnaces and the cost parity enjoyed by unorganised players went away. Hence, these developments were structurally positive for organised players and provided a level playing field to them. Going ahead, we expect the organised pie to expand significantly on account of the reducing price differential leading to customers shifting towards branded tiles.
Furthermore, the current situation has set the tone for consolidation in the industry. We believe that given the higher cost of operation and inability of unorganised players to push their products amid growing preference for branded products, they could now move towards either forming a joint venture (JV) or being taken over by organised players.
Exhibit 9: Morbi development – structurally positive for organised players
Unorganised, 60.0
H&R Johnson, 8.0
Kajaria, 5.8Somany, 3.9
Others, 22.4
Organised, 40.0
FY09 Market Share
Unorganised, 50.0
H&R Johnson, 10.0
Kajaria, 9.5Somany, 6.3
Others, 24.3
Organised, 50.0
FY14 Market Share
Source: Company, ICICIdirect.com Research
Source: Google Maps
Morbi development, rising affordability, urbanisation, brand aspiration and home aesthetics have led to an increase in the pie of organised players to 50% in FY14 from 40% in FY09. We also highlight that within organised space, Kajaria, Somany have gained significant market share compared to their peers
Page 6 ICICI Securities Ltd | Retail Equity Research
Exhibit 10: Volume growth drivers
Urbanisation rate
18.0 19.923.3
25.727.8
31.2 32.0 32.3
0.0
5.0
10.0
15.0
20.0
25.0
30.0
35.0
1961 1971 1981 1991 2001 2011 2014P 2021E
(%)
810
11.914.8
18.7
24.7
5.1
5.3
5.5 5.5
5.3
4.9
0
5
10
15
20
25
30
1961 1971 1981 1991 2001 2011
(In c
rore
)
4.4
4.6
4.8
5
5.2
5.4
5.6
(nos
)
Number of households Average household size
186 180 151
3185 1482
823
0
50
100
150
200
250
300
350
2008 2020E 2030E
(Hou
seho
lds
in c
rore
)
Lower class Middle class Upper class
6.4 11.818.1
29.841.2
4.94.4
6.8
6.2
8.1
2.02.4
3.1
3.3
1.7
0.0
10.0
20.0
30.0
40.0
50.0
60.0
1961 1971 1981 1991 2001
(In m
illion
s)
Pucca house Semi pucca house Kutcha house
0.51.0 1.1
3.13.7 4.0
4.85.5
0
1
2
3
4
5
6
Indi
a
Indo
nesi
a
Russ
ia
Chin
a
Viet
nam
Braz
il
Iran
Euro
pe
(squ
are
met
er)
Per capita consumption
Percentage of households by material of floor(%)Material 1991 2001 2011 2001 2011 2001 2011Mud 67.0 57.1 46.5 72.3 62.6 18.0 12.2Stone 0.0 5.8 8.1 4.5 6.2 9.1 12.2Cement 21.3 26.5 31.1 18.0 24.2 48.3 45.8Mosaic / Floor tiles 3.8 7.3 10.8 2.2 3.7 20.5 25.9
Others 7.9 3.3 3.5 3.0 3.2 4.1 3.8
India Rural Urban
Source: Census Data, McKinsey Global Institute (MGI), MHUPA, Company, ICICIdirect.com Research
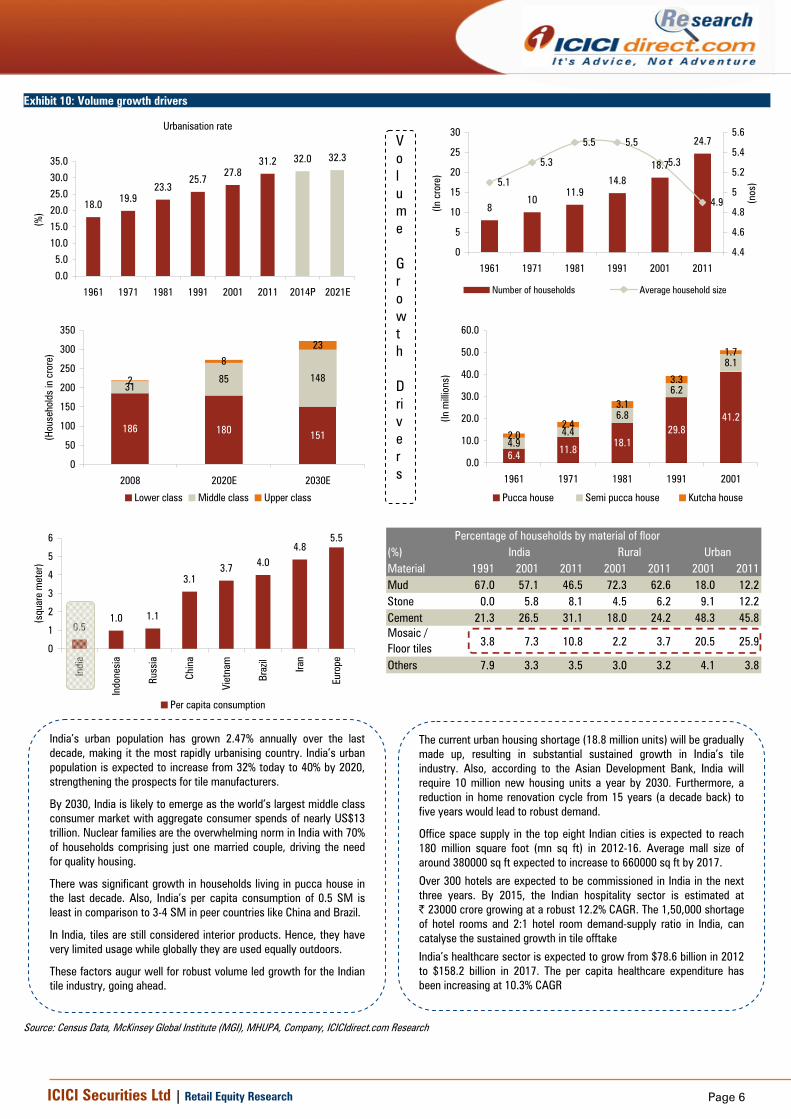
India’s urban population has grown 2.47% annually over the last decade, making it the most rapidly urbanising country. India’s urban population is expected to increase from 32% today to 40% by 2020, strengthening the prospects for tile manufacturers.
By 2030, India is likely to emerge as the world’s largest middle class consumer market with aggregate consumer spends of nearly US$13 trillion. Nuclear families are the overwhelming norm in India with 70% of households comprising just one married couple, driving the need for quality housing.
There was significant growth in households living in pucca house in the last decade. Also, India’s per capita consumption of 0.5 SM is least in comparison to 3-4 SM in peer countries like China and Brazil.
In India, tiles are still considered interior products. Hence, they have very limited usage while globally they are used equally outdoors.
These factors augur well for robust volume led growth for the Indian tile industry, going ahead.
The current urban housing shortage (18.8 million units) will be gradually made up, resulting in substantial sustained growth in India’s tile industry. Also, according to the Asian Development Bank, India will require 10 million new housing units a year by 2030. Furthermore, a reduction in home renovation cycle from 15 years (a decade back) to five years would lead to robust demand.
Office space supply in the top eight Indian cities is expected to reach 180 million square foot (mn sq ft) in 2012-16. Average mall size of around 380000 sq ft expected to increase to 660000 sq ft by 2017.
Over 300 hotels are expected to be commissioned in India in the next three years. By 2015, the Indian hospitality sector is estimated at | 23000 crore growing at a robust 12.2% CAGR. The 1,50,000 shortage of hotel rooms and 2:1 hotel room demand-supply ratio in India, can catalyse the sustained growth in tile offtake
India’s healthcare sector is expected to grow from $78.6 billion in 2012 to $158.2 billion in 2017. The per capita healthcare expenditure has been increasing at 10.3% CAGR
Volume Growth Drivers
Page 7 ICICI Securities Ltd | Retail Equity Research
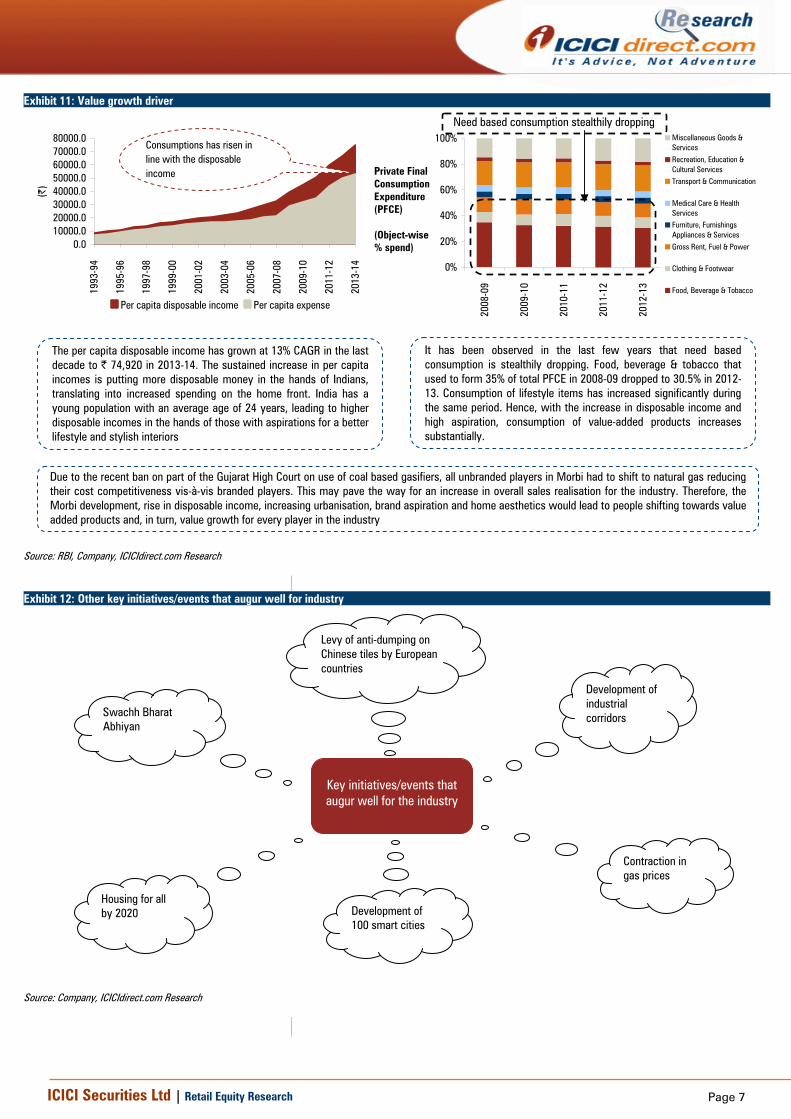
Exhibit 11: Value growth driver
0.010000.020000.030000.040000.050000.060000.070000.080000.0
1993
-94
1995
-96
1997
-98
1999
-00
2001
-02
2003
-04
2005
-06
2007
-08
2009
-10
2011
-12
2013
-14
(|)
Per capita disposable income Per capita expense
Consumptions has risen in line with the disposable income
0%
20%
40%
60%
80%
100%
2008
-09
2009
-10
2010
-11
2011
-12
2012
-13
Miscellaneous Goods &ServicesRecreation, Education &Cultural ServicesTransport & Communication
Medical Care & HealthServicesFurniture, FurnishingsAppliances & ServicesGross Rent, Fuel & Power
Clothing & Footwear
Food, Beverage & Tobacco
Source: RBI, Company, ICICIdirect.com Research
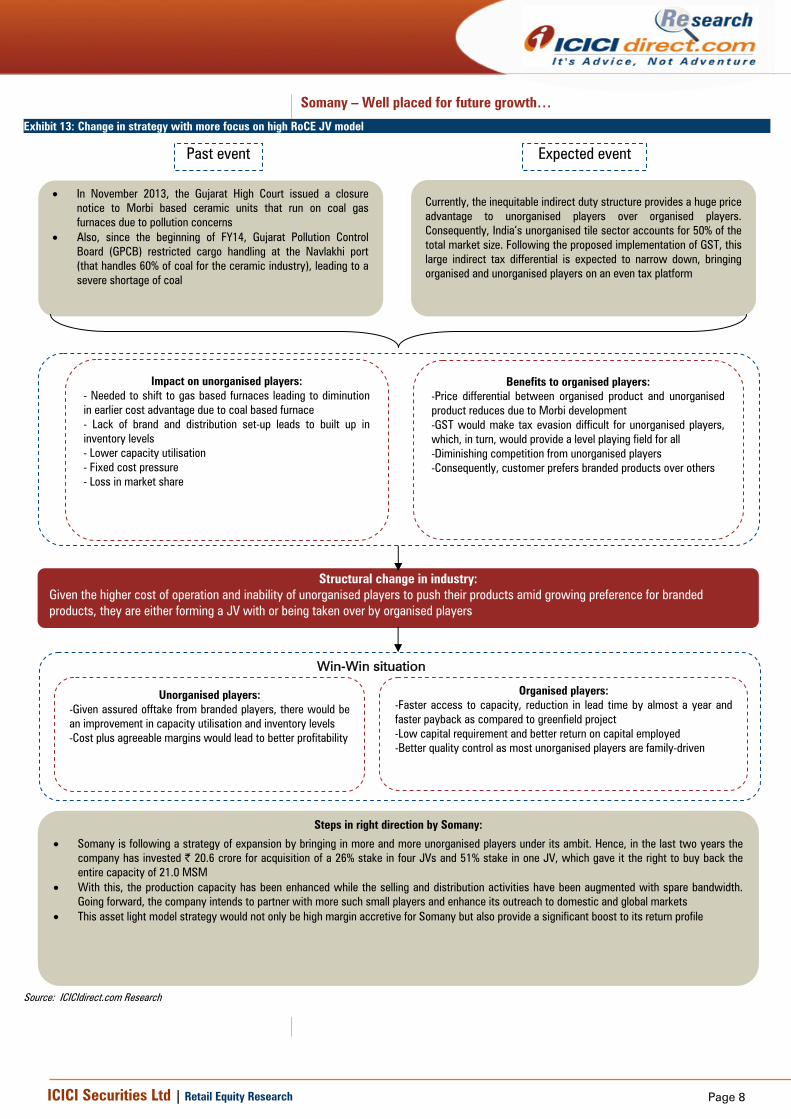
Exhibit 12: Other key initiatives/events that augur well for industry Source: Company, ICICIdirect.com Research
The per capita disposable income has grown at 13% CAGR in the last decade to | 74,920 in 2013-14. The sustained increase in per capita incomes is putting more disposable money in the hands of Indians, translating into increased spending on the home front. India has a young population with an average age of 24 years, leading to higher disposable incomes in the hands of those with aspirations for a better lifestyle and stylish interiors
Due to the recent ban on part of the Gujarat High Court on use of coal based gasifiers, all unbranded players in Morbi had to shift to natural gas reducing their cost competitiveness vis-à-vis branded players. This may pave the way for an increase in overall sales realisation for the industry. Therefore, the Morbi development, rise in disposable income, increasing urbanisation, brand aspiration and home aesthetics would lead to people shifting towards value added products and, in turn, value growth for every player in the industry
Swachh Bharat Abhiyan
Development of 100 smart cities
Development of industrial corridors
Housing for all by 2020
Contraction in gas prices
Levy of anti-dumping on Chinese tiles by European countries
It has been observed in the last few years that need based consumption is stealthily dropping. Food, beverage & tobacco that used to form 35% of total PFCE in 2008-09 dropped to 30.5% in 2012-13. Consumption of lifestyle items has increased significantly during the same period. Hence, with the increase in disposable income and high aspiration, consumption of value-added products increases substantially.
Need based consumption stealthily dropping
Private Final Consumption Expenditure (PFCE) (Object-wise % spend)
Key initiatives/events that augur well for the industry
Page 8 ICICI Securities Ltd | Retail Equity Research
Somany – Well placed for future growth…
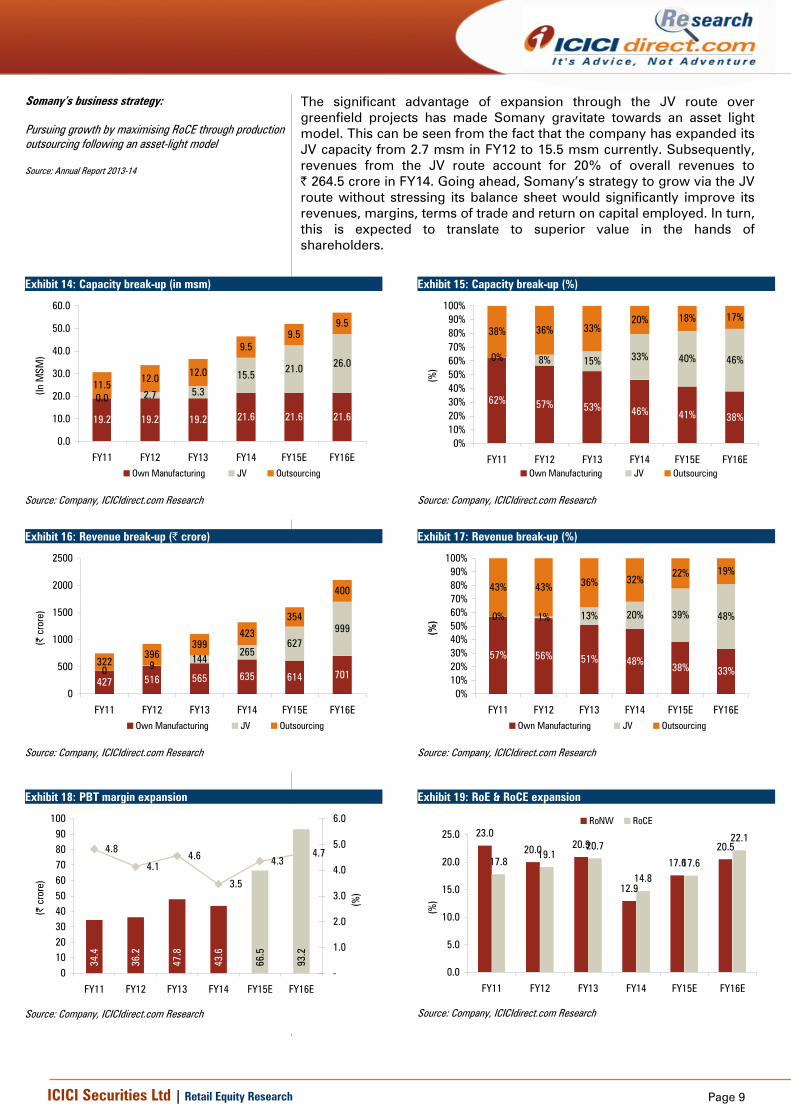
Exhibit 13: Change in strategy with more focus on high RoCE JV model
Source: ICICIdirect.com Research
• In November 2013, the Gujarat High Court issued a closure notice to Morbi based ceramic units that run on coal gas furnaces due to pollution concerns
• Also, since the beginning of FY14, Gujarat Pollution Control Board (GPCB) restricted cargo handling at the Navlakhi port (that handles 60% of coal for the ceramic industry), leading to a severe shortage of coal
Currently, the inequitable indirect duty structure provides a huge price advantage to unorganised players over organised players. Consequently, India’s unorganised tile sector accounts for 50% of the total market size. Following the proposed implementation of GST, this large indirect tax differential is expected to narrow down, bringing organised and unorganised players on an even tax platform
Past event Expected event
Impact on unorganised players:
- Needed to shift to gas based furnaces leading to diminution in earlier cost advantage due to coal based furnace - Lack of brand and distribution set-up leads to built up in inventory levels - Lower capacity utilisation - Fixed cost pressure - Loss in market share
Benefits to organised players: -Price differential between organised product and unorganised product reduces due to Morbi development -GST would make tax evasion difficult for unorganised players, which, in turn, would provide a level playing field for all -Diminishing competition from unorganised players -Consequently, customer prefers branded products over others
Win-Win situation
Steps in right direction by Somany:
• Somany is following a strategy of expansion by bringing in more and more unorganised players under its ambit. Hence, in the last two years the company has invested | 20.6 crore for acquisition of a 26% stake in four JVs and 51% stake in one JV, which gave it the right to buy back the entire capacity of 21.0 MSM
• With this, the production capacity has been enhanced while the selling and distribution activities have been augmented with spare bandwidth. Going forward, the company intends to partner with more such small players and enhance its outreach to domestic and global markets
• This asset light model strategy would not only be high margin accretive for Somany but also provide a significant boost to its return profile
Unorganised players: -Given assured offtake from branded players, there would be an improvement in capacity utilisation and inventory levels -Cost plus agreeable margins would lead to better profitability
Organised players: -Faster access to capacity, reduction in lead time by almost a year and faster payback as compared to greenfield project -Low capital requirement and better return on capital employed -Better quality control as most unorganised players are family-driven
Structural change in industry: Given the higher cost of operation and inability of unorganised players to push their products amid growing preference for branded products, they are either forming a JV with or being taken over by organised players
Page 9 ICICI Securities Ltd | Retail Equity Research
The significant advantage of expansion through the JV route over greenfield projects has made Somany gravitate towards an asset light model. This can be seen from the fact that the company has expanded its JV capacity from 2.7 msm in FY12 to 15.5 msm currently. Subsequently, revenues from the JV route account for 20% of overall revenues to | 264.5 crore in FY14. Going ahead, Somany’s strategy to grow via the JV route without stressing its balance sheet would significantly improve its revenues, margins, terms of trade and return on capital employed. In turn, this is expected to translate to superior value in the hands of shareholders.
Exhibit 14: Capacity break-up (in msm)
19.2 19.2 19.2 21.6 21.6 21.6
0.0 2.7 5.3
15.5 21.0 26.0
11.5 12.0 12.0
9.59.5
9.5
0.0
10.0
20.0
30.0
40.0
50.0
60.0
FY11 FY12 FY13 FY14 FY15E FY16E
(In M
SM)
Own Manufacturing JV Outsourcing
Source: Company, ICICIdirect.com Research
Exhibit 15: Capacity break-up (%)
62% 57% 53% 46% 41% 38%
0% 8% 15% 33% 40% 46%
38% 36% 33%20% 18% 17%
0%10%20%30%40%50%60%70%80%90%
100%
FY11 FY12 FY13 FY14 FY15E FY16E
(%)
Own Manufacturing JV Outsourcing
Source: Company, ICICIdirect.com Research
Exhibit 16: Revenue break-up (| crore)
427 516 565 635 614 7010 9 144265
627999
322396
399423
354
400
0
500
1000
1500
2000
2500
FY11 FY12 FY13 FY14 FY15E FY16E
(| c
rore
)
Own Manufacturing JV Outsourcing
Source: Company, ICICIdirect.com Research
Exhibit 17: Revenue break-up (%)
57% 56% 51% 48% 38% 33%
0% 1% 13% 20% 39% 48%
43% 43% 36% 32%22% 19%
0%10%20%30%40%50%60%70%80%90%
100%
FY11 FY12 FY13 FY14 FY15E FY16E
(%)
Own Manufacturing JV Outsourcing
Source: Company, ICICIdirect.com Research
Exhibit 18: PBT margin expansion
47.8
43.6
34.4
36.2
66.5
93.2
4.8
4.14.6
3.5
4.34.7
0102030405060708090
100
FY11 FY12 FY13 FY14 FY15E FY16E
(| c
rore
)
-
1.0
2.0
3.0
4.0
5.0
6.0
(%)
Source: Company, ICICIdirect.com Research
Exhibit 19: RoE & RoCE expansion
23.0
20.0 20.9
12.9
17.620.5
17.819.1
20.7
14.817.6
22.1
0.0
5.0
10.0
15.0
20.0
25.0
FY11 FY12 FY13 FY14 FY15E FY16E
(%)
RoNW RoCE
Source: Company, ICICIdirect.com Research
Somany’s business strategy: Pursuing growth by maximising RoCE through production outsourcing following an asset-light model Source: Annual Report 2013-14
Page 10 ICICI Securities Ltd | Retail Equity Research
Formidable distribution and marketing network…
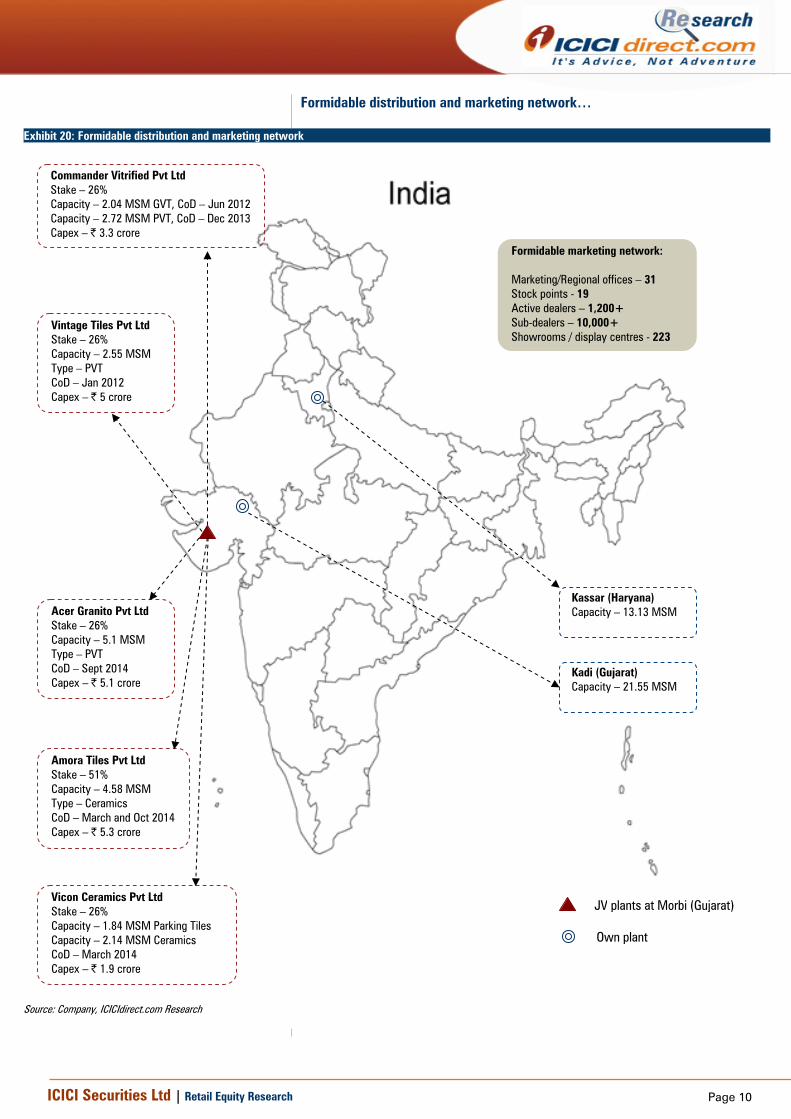
Exhibit 20: Formidable distribution and marketing network
Source: Company, ICICIdirect.com Research
Formidable marketing network: Marketing/Regional offices – 31 Stock points - 19 Active dealers – 1,200+ Sub-dealers – 10,000+ Showrooms / display centres - 223
Vintage Tiles Pvt Ltd Stake – 26% Capacity – 2.55 MSM Type – PVT CoD – Jan 2012 Capex – | 5 crore
Commander Vitrified Pvt Ltd Stake – 26% Capacity – 2.04 MSM GVT, CoD – Jun 2012 Capacity – 2.72 MSM PVT, CoD – Dec 2013 Capex – | 3.3 crore
Amora Tiles Pvt Ltd Stake – 51% Capacity – 4.58 MSM Type – Ceramics CoD – March and Oct 2014 Capex – | 5.3 crore
Vicon Ceramics Pvt Ltd Stake – 26% Capacity – 1.84 MSM Parking Tiles Capacity – 2.14 MSM Ceramics CoD – March 2014 Capex – | 1.9 crore
Acer Granito Pvt Ltd Stake – 26% Capacity – 5.1 MSM Type – PVT CoD – Sept 2014 Capex – | 5.1 crore
JV plants at Morbi (Gujarat)
Own plant
Kassar (Haryana) Capacity – 13.13 MSM
Kadi (Gujarat) Capacity – 21.55 MSM
Page 11 ICICI Securities Ltd | Retail Equity Research
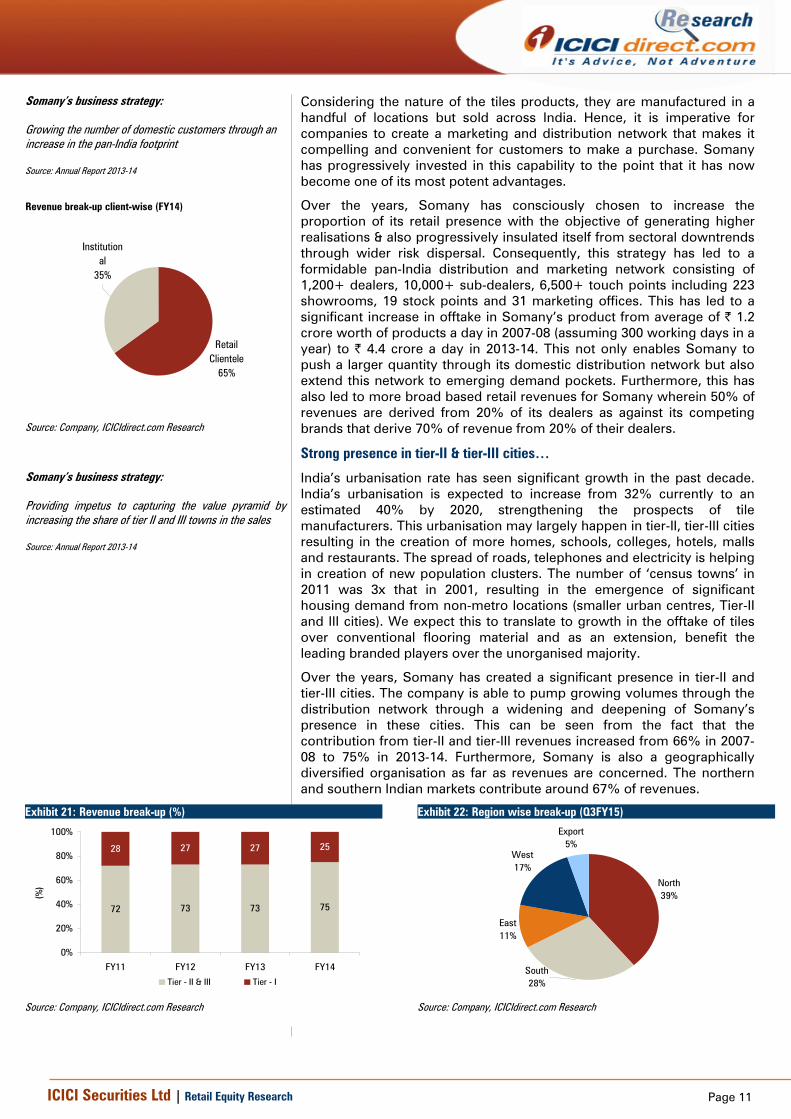
Considering the nature of the tiles products, they are manufactured in a handful of locations but sold across India. Hence, it is imperative for companies to create a marketing and distribution network that makes it compelling and convenient for customers to make a purchase. Somany has progressively invested in this capability to the point that it has now become one of its most potent advantages.
Over the years, Somany has consciously chosen to increase the proportion of its retail presence with the objective of generating higher realisations & also progressively insulated itself from sectoral downtrends through wider risk dispersal. Consequently, this strategy has led to a formidable pan-India distribution and marketing network consisting of 1,200+ dealers, 10,000+ sub-dealers, 6,500+ touch points including 223 showrooms, 19 stock points and 31 marketing offices. This has led to a significant increase in offtake in Somany’s product from average of | 1.2 crore worth of products a day in 2007-08 (assuming 300 working days in a year) to | 4.4 crore a day in 2013-14. This not only enables Somany to push a larger quantity through its domestic distribution network but also extend this network to emerging demand pockets. Furthermore, this has also led to more broad based retail revenues for Somany wherein 50% of revenues are derived from 20% of its dealers as against its competing brands that derive 70% of revenue from 20% of their dealers.
Strong presence in tier-II & tier-III cities…
India’s urbanisation rate has seen significant growth in the past decade. India’s urbanisation is expected to increase from 32% currently to an estimated 40% by 2020, strengthening the prospects of tile manufacturers. This urbanisation may largely happen in tier-II, tier-III cities resulting in the creation of more homes, schools, colleges, hotels, malls and restaurants. The spread of roads, telephones and electricity is helping in creation of new population clusters. The number of ‘census towns’ in 2011 was 3x that in 2001, resulting in the emergence of significant housing demand from non-metro locations (smaller urban centres, Tier-II and III cities). We expect this to translate to growth in the offtake of tiles over conventional flooring material and as an extension, benefit the leading branded players over the unorganised majority.
Over the years, Somany has created a significant presence in tier-II and tier-III cities. The company is able to pump growing volumes through the distribution network through a widening and deepening of Somany’s presence in these cities. This can be seen from the fact that the contribution from tier-II and tier-III revenues increased from 66% in 2007-08 to 75% in 2013-14. Furthermore, Somany is also a geographically diversified organisation as far as revenues are concerned. The northern and southern Indian markets contribute around 67% of revenues.
Exhibit 21: Revenue break-up (%)
72 73 73 75
28 27 27 25
0%
20%
40%
60%
80%
100%
FY11 FY12 FY13 FY14
(%)
Tier - II & III Tier - I
Source: Company, ICICIdirect.com Research
Exhibit 22: Region wise break-up (Q3FY15)
North39%
South28%
East11%
West17%
Export5%
Source: Company, ICICIdirect.com Research
Somany’s business strategy: Growing the number of domestic customers through an increase in the pan-India footprint Source: Annual Report 2013-14
Revenue break-up client-wise (FY14)
Institutional
35%
Retail Clientele
65%
Source: Company, ICICIdirect.com Research
Somany’s business strategy: Providing impetus to capturing the value pyramid by increasing the share of tier II and III towns in the sales Source: Annual Report 2013-14
Page 12 ICICI Securities Ltd | Retail Equity Research
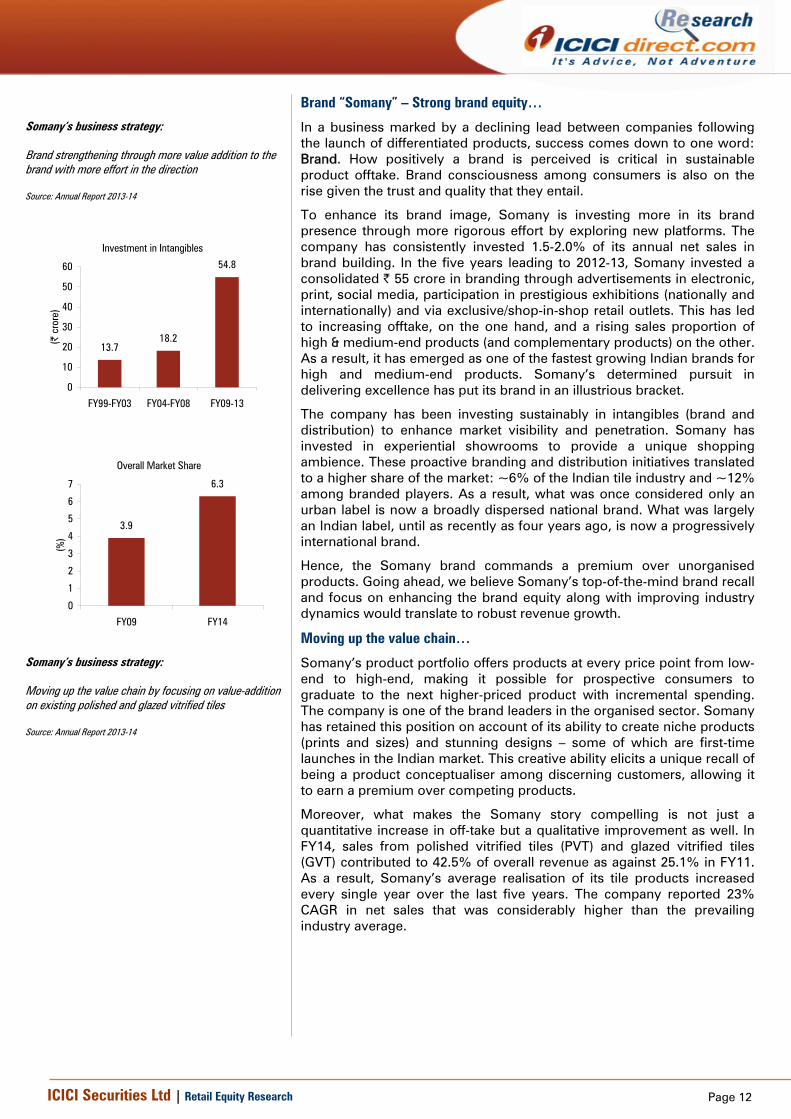
Brand “Somany” – Strong brand equity…
In a business marked by a declining lead between companies following the launch of differentiated products, success comes down to one word: Brand. How positively a brand is perceived is critical in sustainable product offtake. Brand consciousness among consumers is also on the rise given the trust and quality that they entail.
To enhance its brand image, Somany is investing more in its brand presence through more rigorous effort by exploring new platforms. The company has consistently invested 1.5-2.0% of its annual net sales in brand building. In the five years leading to 2012-13, Somany invested a consolidated | 55 crore in branding through advertisements in electronic, print, social media, participation in prestigious exhibitions (nationally and internationally) and via exclusive/shop-in-shop retail outlets. This has led to increasing offtake, on the one hand, and a rising sales proportion of high & medium-end products (and complementary products) on the other. As a result, it has emerged as one of the fastest growing Indian brands for high and medium-end products. Somany’s determined pursuit in delivering excellence has put its brand in an illustrious bracket.
The company has been investing sustainably in intangibles (brand and distribution) to enhance market visibility and penetration. Somany has invested in experiential showrooms to provide a unique shopping ambience. These proactive branding and distribution initiatives translated to a higher share of the market: ~6% of the Indian tile industry and ~12% among branded players. As a result, what was once considered only an urban label is now a broadly dispersed national brand. What was largely an Indian label, until as recently as four years ago, is now a progressively international brand.
Hence, the Somany brand commands a premium over unorganised products. Going ahead, we believe Somany’s top-of-the-mind brand recall and focus on enhancing the brand equity along with improving industry dynamics would translate to robust revenue growth.
Moving up the value chain…
Somany’s product portfolio offers products at every price point from low-end to high-end, making it possible for prospective consumers to graduate to the next higher-priced product with incremental spending. The company is one of the brand leaders in the organised sector. Somany has retained this position on account of its ability to create niche products (prints and sizes) and stunning designs – some of which are first-time launches in the Indian market. This creative ability elicits a unique recall of being a product conceptualiser among discerning customers, allowing it to earn a premium over competing products.
Moreover, what makes the Somany story compelling is not just a quantitative increase in off-take but a qualitative improvement as well. In FY14, sales from polished vitrified tiles (PVT) and glazed vitrified tiles (GVT) contributed to 42.5% of overall revenue as against 25.1% in FY11. As a result, Somany’s average realisation of its tile products increased every single year over the last five years. The company reported 23% CAGR in net sales that was considerably higher than the prevailing industry average.
Somany’s business strategy: Brand strengthening through more value addition to the brand with more effort in the direction Source: Annual Report 2013-14
Investment in Intangibles
13.718.2
54.8
0
10
20
30
40
50
60
FY99-FY03 FY04-FY08 FY09-13
(| c
rore
)
Overall Market Share
3.9
6.3
0
1
2
3
4
5
6
7
FY09 FY14
(%)
Somany’s business strategy: Moving up the value chain by focusing on value-addition on existing polished and glazed vitrified tiles Source: Annual Report 2013-14
Page 13 ICICI Securities Ltd | Retail Equity Research
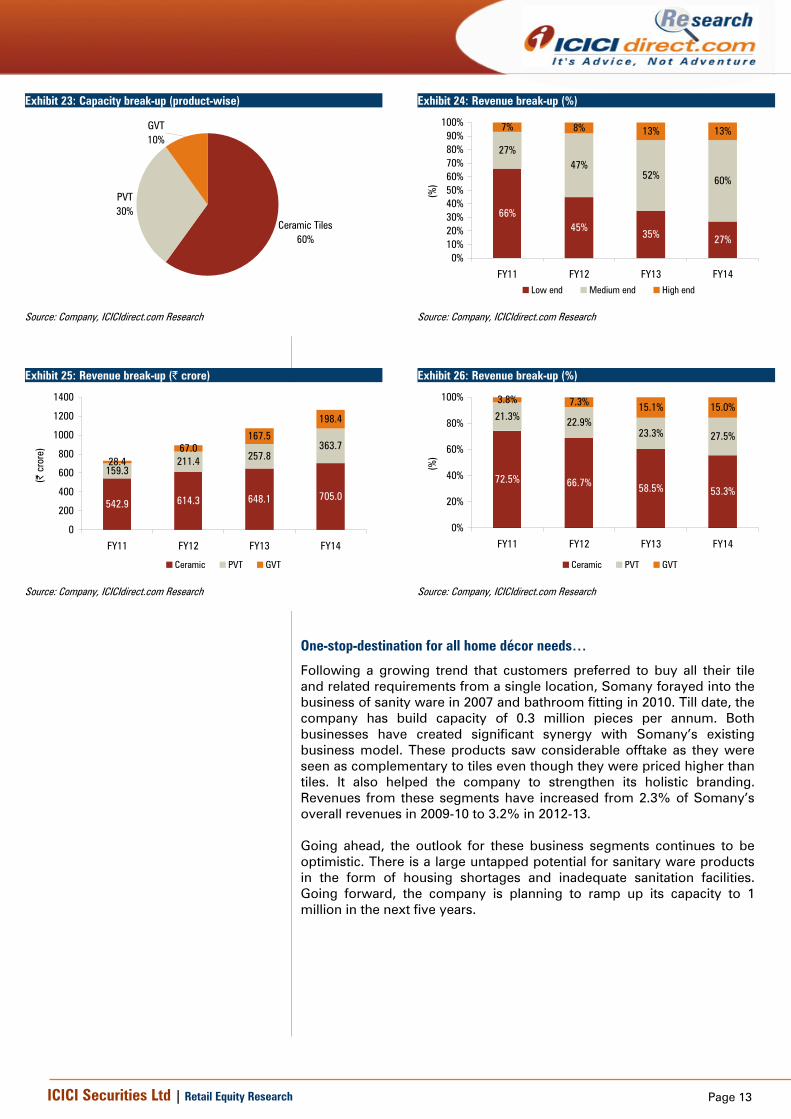
Exhibit 23: Capacity break-up (product-wise)
GVT10%
PVT30%
Ceramic Tiles60%
Source: Company, ICICIdirect.com Research
Exhibit 24: Revenue break-up (%)
66%45%
35% 27%
27%47%
52% 60%
7% 8% 13% 13%
0%10%20%30%40%50%60%70%80%90%
100%
FY11 FY12 FY13 FY14
(%)
Low end Medium end High end
Source: Company, ICICIdirect.com Research
Exhibit 25: Revenue break-up (| crore)
542.9 614.3 648.1 705.0
159.3211.4 257.8
363.7
28.467.0
167.5
198.4
0
200
400
600
800
1000
1200
1400
FY11 FY12 FY13 FY14
(| c
rore
)
Ceramic PVT GVT
Source: Company, ICICIdirect.com Research
Exhibit 26: Revenue break-up (%)
72.5% 66.7% 58.5% 53.3%
21.3% 22.9%23.3% 27.5%
3.8% 7.3% 15.1% 15.0%
0%
20%
40%
60%
80%
100%
FY11 FY12 FY13 FY14
(%)
Ceramic PVT GVT
Source: Company, ICICIdirect.com Research
One-stop-destination for all home décor needs…
Following a growing trend that customers preferred to buy all their tile and related requirements from a single location, Somany forayed into the business of sanity ware in 2007 and bathroom fitting in 2010. Till date, the company has build capacity of 0.3 million pieces per annum. Both businesses have created significant synergy with Somany’s existing business model. These products saw considerable offtake as they were seen as complementary to tiles even though they were priced higher than tiles. It also helped the company to strengthen its holistic branding. Revenues from these segments have increased from 2.3% of Somany’s overall revenues in 2009-10 to 3.2% in 2012-13. Going ahead, the outlook for these business segments continues to be optimistic. There is a large untapped potential for sanitary ware products in the form of housing shortages and inadequate sanitation facilities. Going forward, the company is planning to ramp up its capacity to 1 million in the next five years.
Page 14 ICICI Securities Ltd | Retail Equity Research
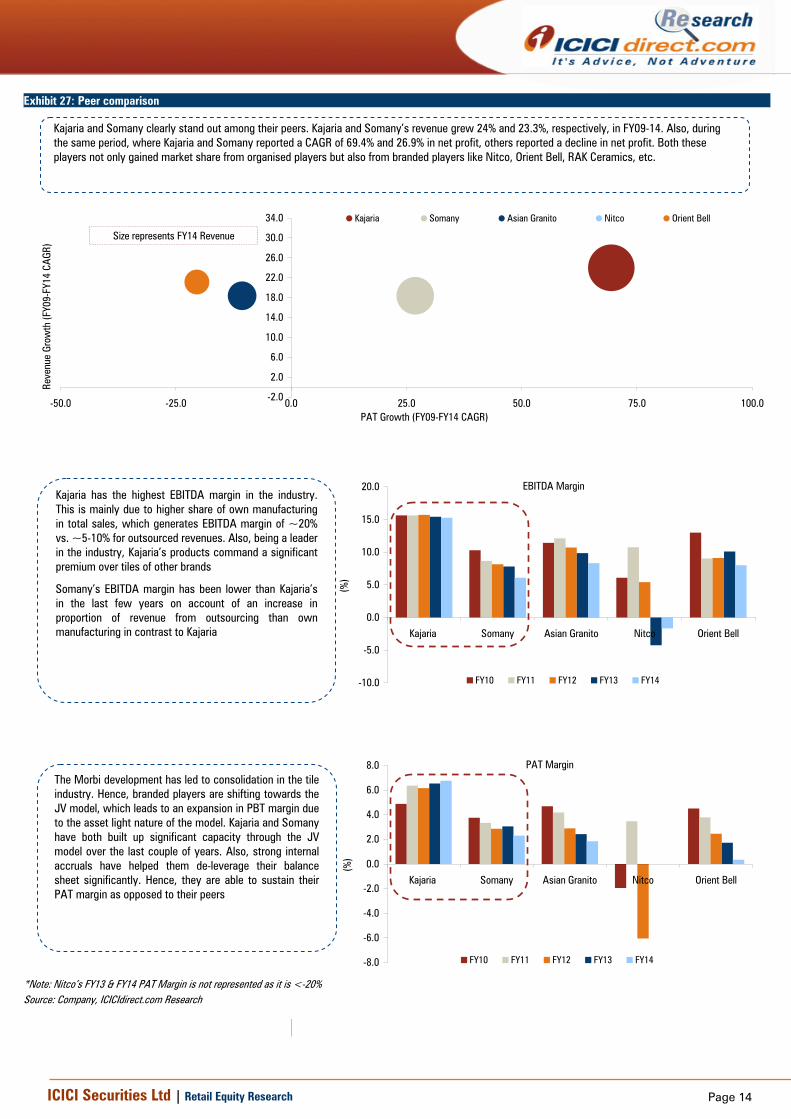
Exhibit 27: Peer comparison
-2.0
2.0
6.0
10.0
14.0
18.0
22.0
26.0
30.0
34.0
-50.0 -25.0 0.0 25.0 50.0 75.0 100.0PAT Growth (FY09-FY14 CAGR)
Reve
nue
Grow
th (F
Y09-
FY14
CAG
R)
Kajaria Somany Asian Granito Nitco Orient Bell
Size represents FY14 Revenue
EBITDA Margin
-10.0
-5.0
0.0
5.0
10.0
15.0
20.0
Kajaria Somany Asian Granito Nitco Orient Bell
(%)
FY10 FY11 FY12 FY13 FY14
PAT Margin
-8.0
-6.0
-4.0
-2.0
0.0
2.0
4.0
6.0
8.0
Kajaria Somany Asian Granito Nitco Orient Bell
(%)
FY10 FY11 FY12 FY13 FY14
*Note: Nitco’s FY13 & FY14 PAT Margin is not represented as it is <-20% Source: Company, ICICIdirect.com Research
Kajaria has the highest EBITDA margin in the industry. This is mainly due to higher share of own manufacturing in total sales, which generates EBITDA margin of ~20% vs. ~5-10% for outsourced revenues. Also, being a leader in the industry, Kajaria’s products command a significant premium over tiles of other brands
Somany’s EBITDA margin has been lower than Kajaria’s in the last few years on account of an increase in proportion of revenue from outsourcing than own manufacturing in contrast to Kajaria
The Morbi development has led to consolidation in the tile industry. Hence, branded players are shifting towards the JV model, which leads to an expansion in PBT margin due to the asset light nature of the model. Kajaria and Somany have both built up significant capacity through the JV model over the last couple of years. Also, strong internal accruals have helped them de-leverage their balance sheet significantly. Hence, they are able to sustain their PAT margin as opposed to their peers
Kajaria and Somany clearly stand out among their peers. Kajaria and Somany’s revenue grew 24% and 23.3%, respectively, in FY09-14. Also, during the same period, where Kajaria and Somany reported a CAGR of 69.4% and 26.9% in net profit, others reported a decline in net profit. Both these players not only gained market share from organised players but also from branded players like Nitco, Orient Bell, RAK Ceramics, etc.
Page 15 ICICI Securities Ltd | Retail Equity Research
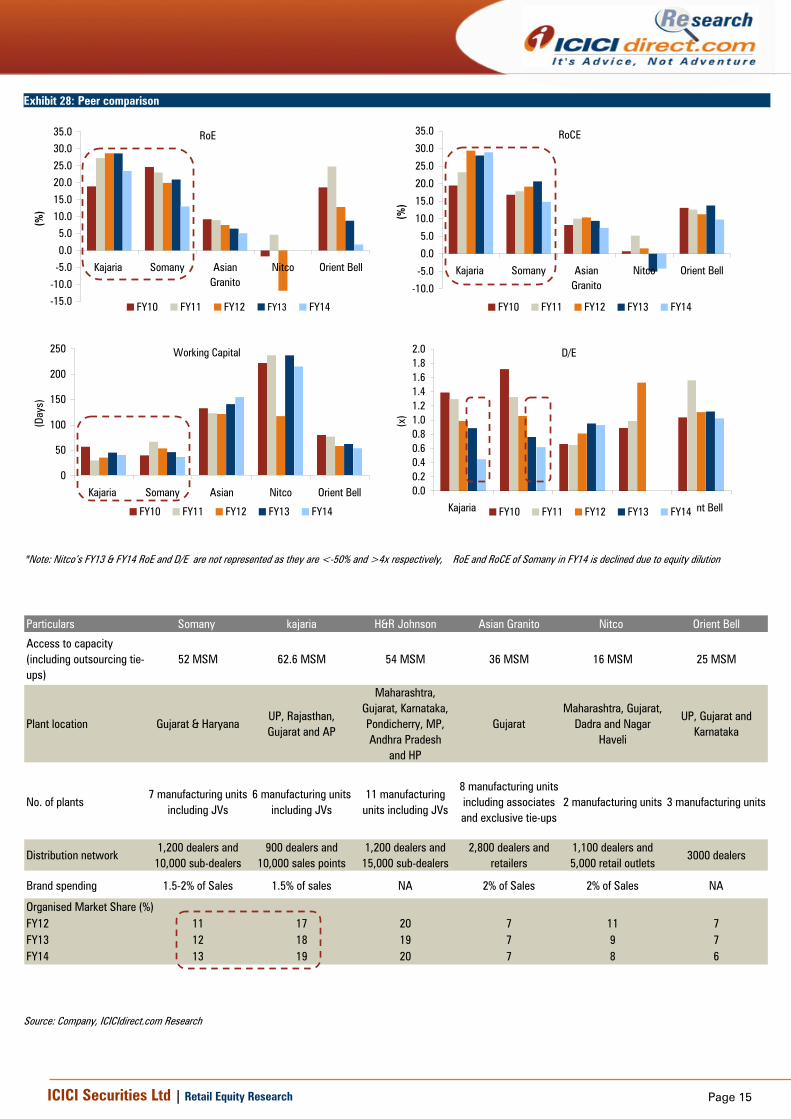
Exhibit 28: Peer comparison
RoE
-15.0
-10.0
-5.0
0.0
5.0
10.0
15.0
20.0
25.0
30.0
35.0
Kajaria Somany AsianGranito
Nitco Orient Bell
(%)
FY10 FY11 FY12 FY13 FY14
RoCE
-10.0
-5.0
0.0
5.0
10.0
15.0
20.0
25.0
30.0
35.0
Kajaria Somany AsianGranito
Nitco Orient Bell
(%)
FY10 FY11 FY12 FY13 FY14
Working Capital
0
50
100
150
200
250
Kajaria Somany AsianGranito
Nitco Orient Bell
(Day
s)
FY10 FY11 FY12 FY13 FY14
D/E
0.00.20.40.60.81.01.21.41.61.82.0
Kajaria Somany Asian Granito Nitco Orient Bell
(x)
FY10 FY11 FY12 FY13 FY14
*Note: Nitco’s FY13 & FY14 RoE and D/E are not represented as they are <-50% and >4x respectively, RoE and RoCE of Somany in FY14 is declined due to equity dilution
Particulars Somany kajaria H&R Johnson Asian Granito Nitco Orient Bell
Access to capacity (including outsourcing tie-ups)
52 MSM 62.6 MSM 54 MSM 36 MSM 16 MSM 25 MSM
Plant location Gujarat & HaryanaUP, Rajasthan, Gujarat and AP
Maharashtra,Gujarat, Karnataka,Pondicherry, MP,Andhra Pradesh
and HP
Gujarat Maharashtra, Gujarat,
Dadra and Nagar Haveli
UP, Gujarat and Karnataka
No. of plants7 manufacturing units
including JVs6 manufacturing units
including JVs11 manufacturing
units including JVs
8 manufacturing units including associates and exclusive tie-ups
2 manufacturing units 3 manufacturing units
Distribution network1,200 dealers and
10,000 sub-dealers900 dealers and
10,000 sales points1,200 dealers and
15,000 sub-dealers2,800 dealers and
retailers1,100 dealers and 5,000 retail outlets
3000 dealers
Brand spending 1.5-2% of Sales 1.5% of sales NA 2% of Sales 2% of Sales NA
Organised Market Share (%)FY12 11 17 20 7 11 7FY13 12 18 19 7 9 7FY14 13 19 20 7 8 6
Source: Company, ICICIdirect.com Research
Page 16 ICICI Securities Ltd | Retail Equity Research
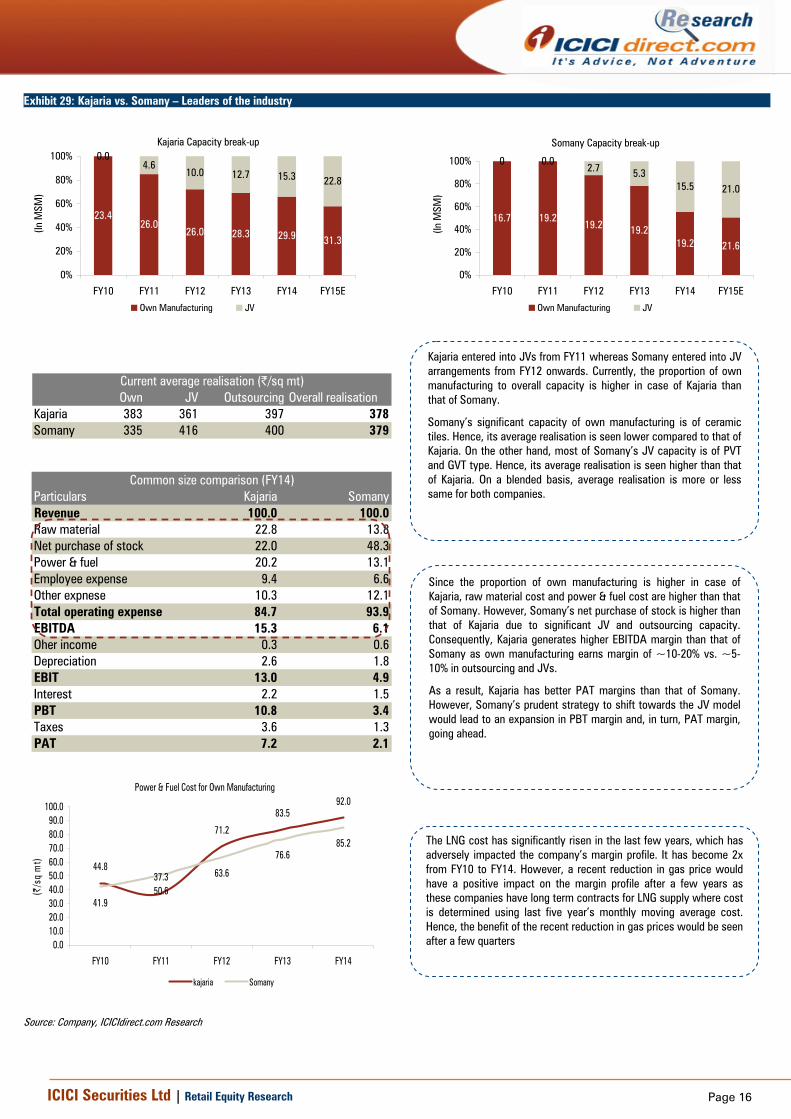
Exhibit 29: Kajaria vs. Somany – Leaders of the industry
Kajaria Capacity break-up
23.426.0
26.0 28.3 29.9 31.3
0.04.6
10.0 12.7 15.3 22.8
0%
20%
40%
60%
80%
100%
FY10 FY11 FY12 FY13 FY14 FY15E
(In M
SM)
Own Manufacturing JV
Somany Capacity break-up
16.7 19.219.2 19.2
19.2 21.6
0 0.02.7 5.3
15.5 21.0
0%
20%
40%
60%
80%
100%
FY10 FY11 FY12 FY13 FY14 FY15E
(In M
SM)
Own Manufacturing JV
Own JV Outsourcing Overall realisationKajaria 383 361 397 378Somany 335 416 400 379
Current average realisation (|/sq mt)
Particulars Kajaria SomanyRevenue 100.0 100.0Raw material 22.8 13.8Net purchase of stock 22.0 48.3Power & fuel 20.2 13.1Employee expense 9.4 6.6Other expnese 10.3 12.1Total operating expense 84.7 93.9EBITDA 15.3 6.1Oher income 0.3 0.6Depreciation 2.6 1.8EBIT 13.0 4.9Interest 2.2 1.5PBT 10.8 3.4Taxes 3.6 1.3PAT 7.2 2.1
Common size comparison (FY14)
Power & Fuel Cost for Own Manufacturing
44.837.3
71.2
83.592.0
41.950.6
63.6
76.685.2
0.010.020.030.040.050.060.070.080.090.0
100.0
FY10 FY11 FY12 FY13 FY14
(|/s
q m
t)
kajaria Somany
Source: Company, ICICIdirect.com Research
Kajaria entered into JVs from FY11 whereas Somany entered into JV arrangements from FY12 onwards. Currently, the proportion of own manufacturing to overall capacity is higher in case of Kajaria than that of Somany.
Somany’s significant capacity of own manufacturing is of ceramic tiles. Hence, its average realisation is seen lower compared to that of Kajaria. On the other hand, most of Somany’s JV capacity is of PVT and GVT type. Hence, its average realisation is seen higher than that of Kajaria. On a blended basis, average realisation is more or less same for both companies.
Since the proportion of own manufacturing is higher in case of Kajaria, raw material cost and power & fuel cost are higher than that of Somany. However, Somany’s net purchase of stock is higher than that of Kajaria due to significant JV and outsourcing capacity. Consequently, Kajaria generates higher EBITDA margin than that of Somany as own manufacturing earns margin of ~10-20% vs. ~5-10% in outsourcing and JVs.
As a result, Kajaria has better PAT margins than that of Somany. However, Somany’s prudent strategy to shift towards the JV model would lead to an expansion in PBT margin and, in turn, PAT margin, going ahead.
The LNG cost has significantly risen in the last few years, which has adversely impacted the company’s margin profile. It has become 2x from FY10 to FY14. However, a recent reduction in gas price would have a positive impact on the margin profile after a few years as these companies have long term contracts for LNG supply where cost is determined using last five year’s monthly moving average cost. Hence, the benefit of the recent reduction in gas prices would be seen after a few quarters
Page 17 ICICI Securities Ltd | Retail Equity Research
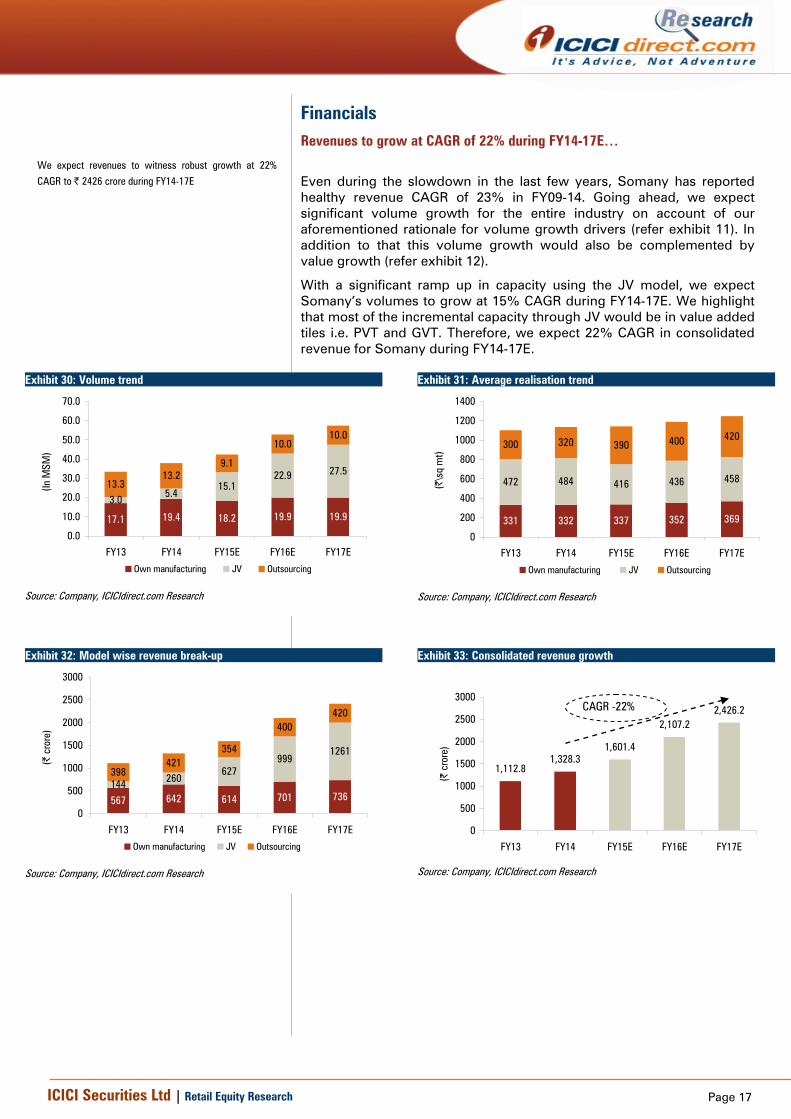
Financials Revenues to grow at CAGR of 22% during FY14-17E…
Even during the slowdown in the last few years, Somany has reported healthy revenue CAGR of 23% in FY09-14. Going ahead, we expect significant volume growth for the entire industry on account of our aforementioned rationale for volume growth drivers (refer exhibit 11). In addition to that this volume growth would also be complemented by value growth (refer exhibit 12).
With a significant ramp up in capacity using the JV model, we expect Somany’s volumes to grow at 15% CAGR during FY14-17E. We highlight that most of the incremental capacity through JV would be in value added tiles i.e. PVT and GVT. Therefore, we expect 22% CAGR in consolidated revenue for Somany during FY14-17E.
Exhibit 30: Volume trend
17.1 19.4 18.2 19.9 19.9
3.05.4
15.122.9 27.5
13.313.2
9.1
10.010.0
0.0
10.0
20.0
30.0
40.0
50.0
60.0
70.0
FY13 FY14 FY15E FY16E FY17E
(In M
SM)
Own manufacturing JV Outsourcing
Source: Company, ICICIdirect.com Research
Exhibit 31: Average realisation trend
331 332 337 352 369
472 484 416 436 458
300 320 390 400 420
0
200
400
600
800
1000
1200
1400
FY13 FY14 FY15E FY16E FY17E
(|\s
q m
t)
Own manufacturing JV Outsourcing
Source: Company, ICICIdirect.com Research
Exhibit 32: Model wise revenue break-up
567 642 614 701 736144 260
627999
1261
398421
354
400420
0
500
1000
1500
2000
2500
3000
FY13 FY14 FY15E FY16E FY17E
(| c
rore
)
Own manufacturing JV Outsourcing
Source: Company, ICICIdirect.com Research
Exhibit 33: Consolidated revenue growth
1,112.81,328.3
1,601.4
2,107.22,426.2
0
500
1000
1500
2000
2500
3000
FY13 FY14 FY15E FY16E FY17E
(| c
rore
)
CAGR -22%
Source: Company, ICICIdirect.com Research
We expect revenues to witness robust growth at 22%
CAGR to | 2426 crore during FY14-17E
Page 18 ICICI Securities Ltd | Retail Equity Research
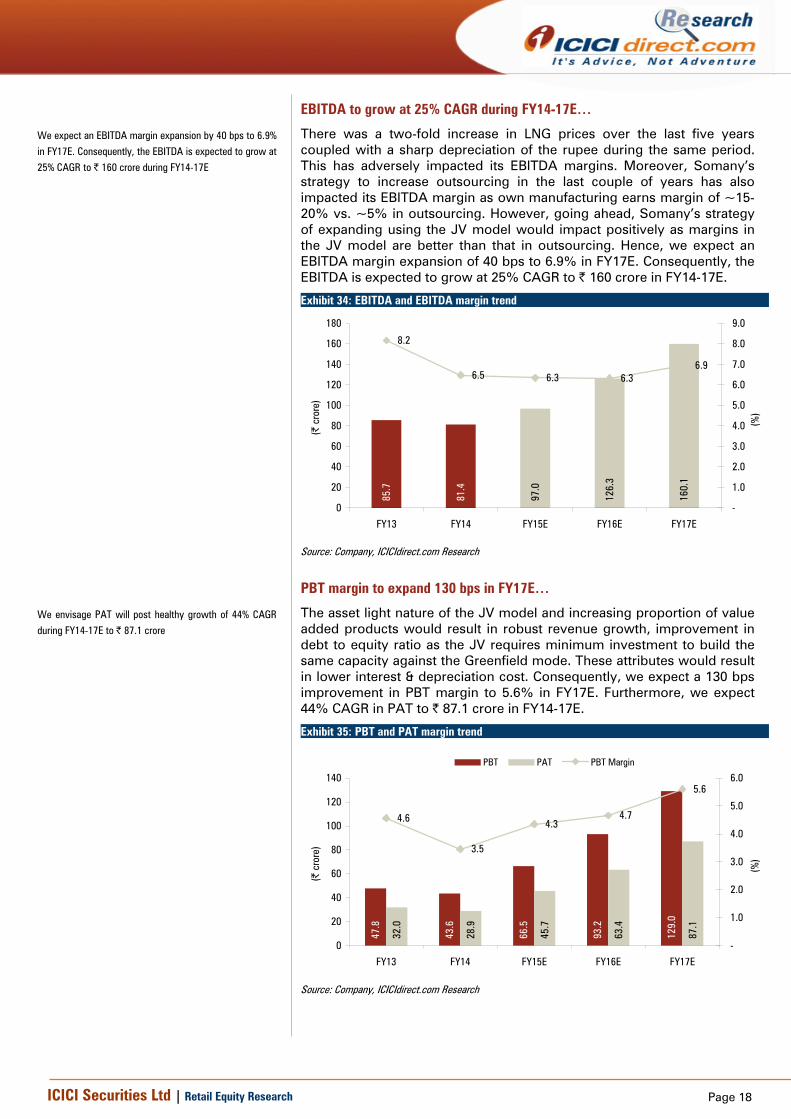
EBITDA to grow at 25% CAGR during FY14-17E…
There was a two-fold increase in LNG prices over the last five years coupled with a sharp depreciation of the rupee during the same period. This has adversely impacted its EBITDA margins. Moreover, Somany’s strategy to increase outsourcing in the last couple of years has also impacted its EBITDA margin as own manufacturing earns margin of ~15-20% vs. ~5% in outsourcing. However, going ahead, Somany’s strategy of expanding using the JV model would impact positively as margins in the JV model are better than that in outsourcing. Hence, we expect an EBITDA margin expansion of 40 bps to 6.9% in FY17E. Consequently, the EBITDA is expected to grow at 25% CAGR to | 160 crore in FY14-17E.
Exhibit 34: EBITDA and EBITDA margin trend
97.0
126.
3
160.
1
85.7
81.4
8.2
6.5 6.3 6.36.9
0
20
40
60
80
100
120
140
160
180
FY13 FY14 FY15E FY16E FY17E
(| c
rore
)
-
1.0
2.0
3.0
4.0
5.0
6.0
7.0
8.0
9.0
(%)
Source: Company, ICICIdirect.com Research
PBT margin to expand 130 bps in FY17E…
The asset light nature of the JV model and increasing proportion of value added products would result in robust revenue growth, improvement in debt to equity ratio as the JV requires minimum investment to build the same capacity against the Greenfield mode. These attributes would result in lower interest & depreciation cost. Consequently, we expect a 130 bps improvement in PBT margin to 5.6% in FY17E. Furthermore, we expect 44% CAGR in PAT to | 87.1 crore in FY14-17E.
Exhibit 35: PBT and PAT margin trend
66.5
93.2
129.
0
32.0
28.9
45.7
63.4
87.1
47.8
43.6
4.6
3.5
4.34.7
5.6
0
20
40
60
80
100
120
140
FY13 FY14 FY15E FY16E FY17E
(| c
rore
)
-
1.0
2.0
3.0
4.0
5.0
6.0
(%)
PBT PAT PBT Margin
Source: Company, ICICIdirect.com Research
We expect an EBITDA margin expansion by 40 bps to 6.9%
in FY17E. Consequently, the EBITDA is expected to grow at
25% CAGR to | 160 crore during FY14-17E
We envisage PAT will post healthy growth of 44% CAGR
during FY14-17E to | 87.1 crore
Page 19 ICICI Securities Ltd | Retail Equity Research
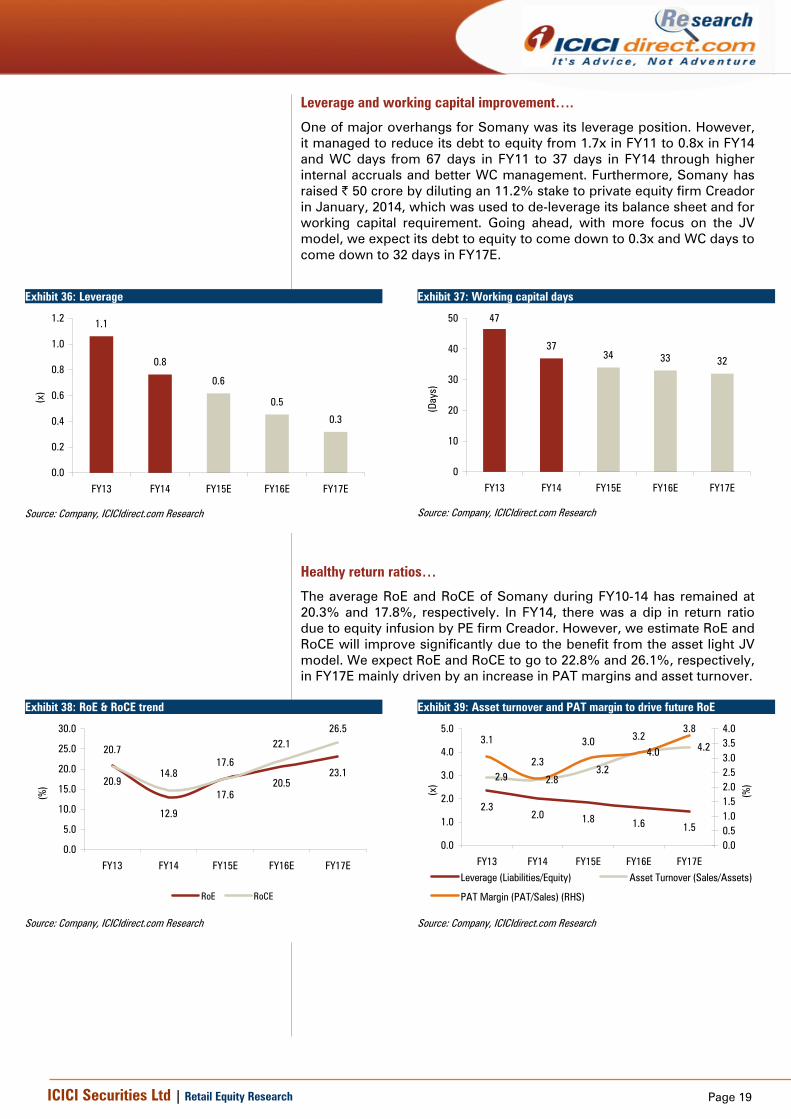
Leverage and working capital improvement….
One of major overhangs for Somany was its leverage position. However, it managed to reduce its debt to equity from 1.7x in FY11 to 0.8x in FY14 and WC days from 67 days in FY11 to 37 days in FY14 through higher internal accruals and better WC management. Furthermore, Somany has raised | 50 crore by diluting an 11.2% stake to private equity firm Creador in January, 2014, which was used to de-leverage its balance sheet and for working capital requirement. Going ahead, with more focus on the JV model, we expect its debt to equity to come down to 0.3x and WC days to come down to 32 days in FY17E.
Exhibit 36: Leverage
1.1
0.8
0.6
0.5
0.3
0.0
0.2
0.4
0.6
0.8
1.0
1.2
FY13 FY14 FY15E FY16E FY17E
(x)
Source: Company, ICICIdirect.com Research
Exhibit 37: Working capital days
47
3734 33 32
0
10
20
30
40
50
FY13 FY14 FY15E FY16E FY17E
(Day
s)
Source: Company, ICICIdirect.com Research
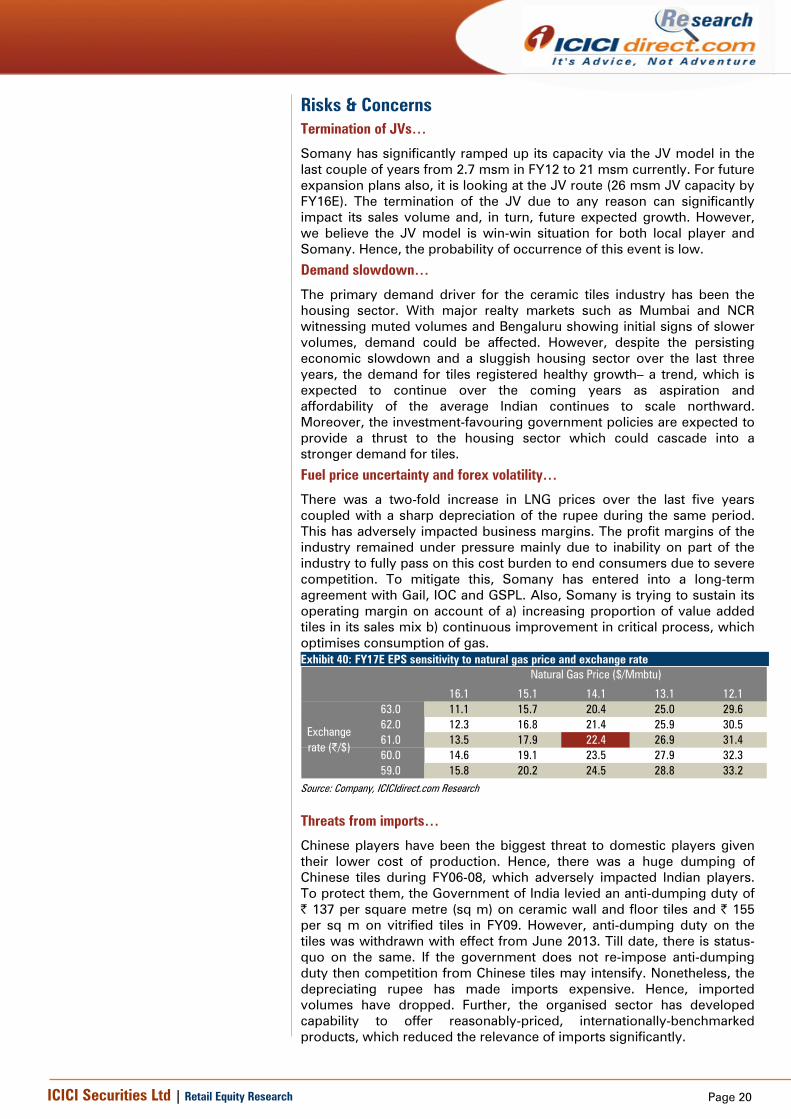
Healthy return ratios…
The average RoE and RoCE of Somany during FY10-14 has remained at 20.3% and 17.8%, respectively. In FY14, there was a dip in return ratio due to equity infusion by PE firm Creador. However, we estimate RoE and RoCE will improve significantly due to the benefit from the asset light JV model. We expect RoE and RoCE to go to 22.8% and 26.1%, respectively, in FY17E mainly driven by an increase in PAT margins and asset turnover.
Exhibit 38: RoE & RoCE trend
20.9
12.9
17.620.5
23.1
20.7
14.817.6
22.126.5
0.0
5.0
10.0
15.0
20.0
25.0
30.0
FY13 FY14 FY15E FY16E FY17E
(%)
RoE RoCE
Source: Company, ICICIdirect.com Research
Exhibit 39: Asset turnover and PAT margin to drive future RoE
2.32.0 1.8 1.6 1.5
2.9 2.83.2
4.0 4.23.1
2.3
3.0 3.23.8
0.0
1.0
2.0
3.0
4.0
5.0
FY13 FY14 FY15E FY16E FY17E
(x)
0.00.51.01.52.02.53.03.54.0
(%)
Leverage (Liabilities/Equity) Asset Turnover (Sales/Assets)
PAT Margin (PAT/Sales) (RHS)
Source: Company, ICICIdirect.com Research
Page 20 ICICI Securities Ltd | Retail Equity Research
Risks & Concerns Termination of JVs…
Somany has significantly ramped up its capacity via the JV model in the last couple of years from 2.7 msm in FY12 to 21 msm currently. For future expansion plans also, it is looking at the JV route (26 msm JV capacity by FY16E). The termination of the JV due to any reason can significantly impact its sales volume and, in turn, future expected growth. However, we believe the JV model is win-win situation for both local player and Somany. Hence, the probability of occurrence of this event is low.
Demand slowdown…
The primary demand driver for the ceramic tiles industry has been the housing sector. With major realty markets such as Mumbai and NCR witnessing muted volumes and Bengaluru showing initial signs of slower volumes, demand could be affected. However, despite the persisting economic slowdown and a sluggish housing sector over the last three years, the demand for tiles registered healthy growth– a trend, which is expected to continue over the coming years as aspiration and affordability of the average Indian continues to scale northward. Moreover, the investment-favouring government policies are expected to provide a thrust to the housing sector which could cascade into a stronger demand for tiles.
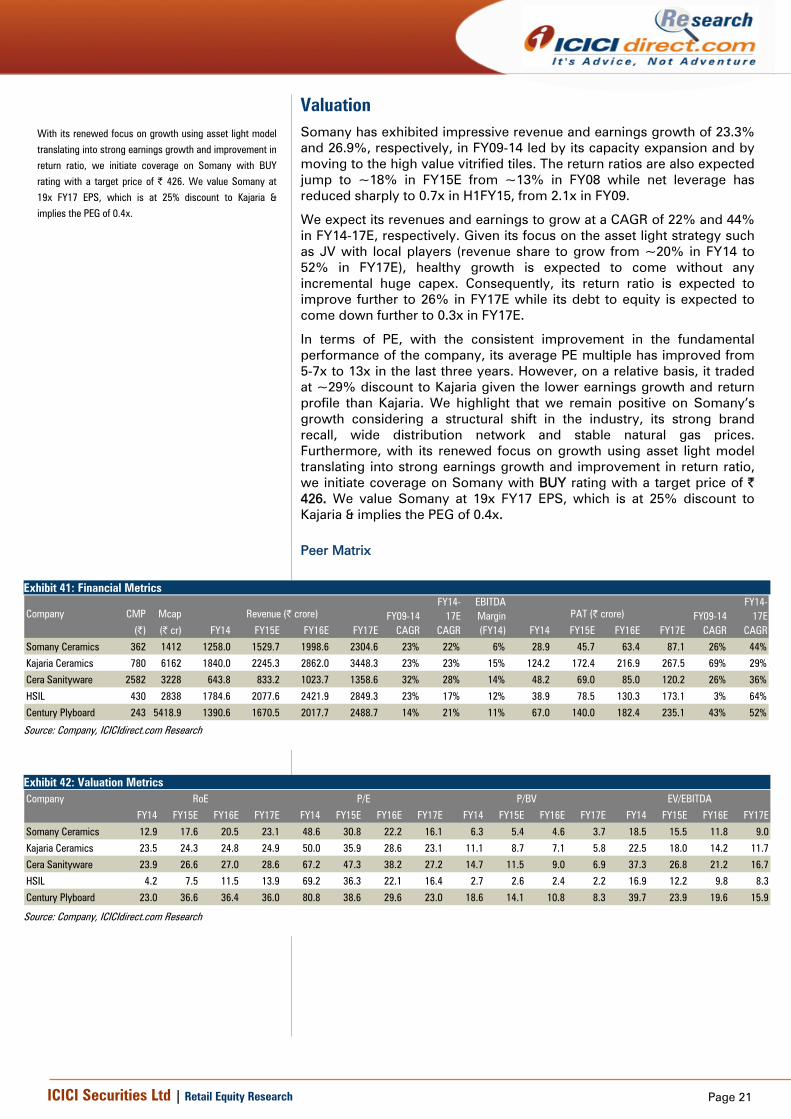
Fuel price uncertainty and forex volatility…
There was a two-fold increase in LNG prices over the last five years coupled with a sharp depreciation of the rupee during the same period. This has adversely impacted business margins. The profit margins of the industry remained under pressure mainly due to inability on part of the industry to fully pass on this cost burden to end consumers due to severe competition. To mitigate this, Somany has entered into a long-term agreement with Gail, IOC and GSPL. Also, Somany is trying to sustain its operating margin on account of a) increasing proportion of value added tiles in its sales mix b) continuous improvement in critical process, which optimises consumption of gas. Exhibit 40: FY17E EPS sensitivity to natural gas price and exchange rate
22.4 16.1 15.1 14.1 13.1 12.163.0 11.1 15.7 20.4 25.0 29.662.0 12.3 16.8 21.4 25.9 30.561.0 13.5 17.9 22.4 26.9 31.460.0 14.6 19.1 23.5 27.9 32.359.0 15.8 20.2 24.5 28.8 33.2
Natural Gas Price ($/Mmbtu)
Exchange rate (|/$)
Source: Company, ICICIdirect.com Research
Threats from imports…
Chinese players have been the biggest threat to domestic players given their lower cost of production. Hence, there was a huge dumping of Chinese tiles during FY06-08, which adversely impacted Indian players. To protect them, the Government of India levied an anti-dumping duty of | 137 per square metre (sq m) on ceramic wall and floor tiles and | 155 per sq m on vitrified tiles in FY09. However, anti-dumping duty on the tiles was withdrawn with effect from June 2013. Till date, there is status-quo on the same. If the government does not re-impose anti-dumping duty then competition from Chinese tiles may intensify. Nonetheless, the depreciating rupee has made imports expensive. Hence, imported volumes have dropped. Further, the organised sector has developed capability to offer reasonably-priced, internationally-benchmarked products, which reduced the relevance of imports significantly.
Page 21 ICICI Securities Ltd | Retail Equity Research
Valuation Somany has exhibited impressive revenue and earnings growth of 23.3% and 26.9%, respectively, in FY09-14 led by its capacity expansion and by moving to the high value vitrified tiles. The return ratios are also expected jump to ~18% in FY15E from ~13% in FY08 while net leverage has reduced sharply to 0.7x in H1FY15, from 2.1x in FY09.
We expect its revenues and earnings to grow at a CAGR of 22% and 44% in FY14-17E, respectively. Given its focus on the asset light strategy such as JV with local players (revenue share to grow from ~20% in FY14 to 52% in FY17E), healthy growth is expected to come without any incremental huge capex. Consequently, its return ratio is expected to improve further to 26% in FY17E while its debt to equity is expected to come down further to 0.3x in FY17E.
In terms of PE, with the consistent improvement in the fundamental performance of the company, its average PE multiple has improved from 5-7x to 13x in the last three years. However, on a relative basis, it traded at ~29% discount to Kajaria given the lower earnings growth and return profile than Kajaria. We highlight that we remain positive on Somany’s growth considering a structural shift in the industry, its strong brand recall, wide distribution network and stable natural gas prices. Furthermore, with its renewed focus on growth using asset light model translating into strong earnings growth and improvement in return ratio, we initiate coverage on Somany with BUY rating with a target price of | 426. We value Somany at 19x FY17 EPS, which is at 25% discount to Kajaria & implies the PEG of 0.4x. Peer Matrix
Exhibit 41: Financial Metrics
Company CMP Mcap
(|) (| cr) FY14 FY15E FY16E FY17E FY14 FY15E FY16E FY17E
Somany Ceramics 362 1412 1258.0 1529.7 1998.6 2304.6 23% 22% 6% 28.9 45.7 63.4 87.1 26% 44%
Kajaria Ceramics 780 6162 1840.0 2245.3 2862.0 3448.3 23% 23% 15% 124.2 172.4 216.9 267.5 69% 29%
Cera Sanityware 2582 3228 643.8 833.2 1023.7 1358.6 32% 28% 14% 48.2 69.0 85.0 120.2 26% 36%
HSIL 430 2838 1784.6 2077.6 2421.9 2849.3 23% 17% 12% 38.9 78.5 130.3 173.1 3% 64%
Century Plyboard 243 5418.9 1390.6 1670.5 2017.7 2488.7 14% 21% 11% 67.0 140.0 182.4 235.1 43% 52%
FY14-17E
CAGR
Revenue (| crore) FY09-14CAGR
FY14-17E
CAGR
EBITDA Margin (FY14)
PAT (| crore) FY09-14CAGR
Source: Company, ICICIdirect.com Research
Exhibit 42: Valuation Metrics Company
FY14 FY15E FY16E FY17E FY14 FY15E FY16E FY17E FY14 FY15E FY16E FY17E FY14 FY15E FY16E FY17E
Somany Ceramics 12.9 17.6 20.5 23.1 48.6 30.8 22.2 16.1 6.3 5.4 4.6 3.7 18.5 15.5 11.8 9.0
Kajaria Ceramics 23.5 24.3 24.8 24.9 50.0 35.9 28.6 23.1 11.1 8.7 7.1 5.8 22.5 18.0 14.2 11.7
Cera Sanityware 23.9 26.6 27.0 28.6 67.2 47.3 38.2 27.2 14.7 11.5 9.0 6.9 37.3 26.8 21.2 16.7
HSIL 4.2 7.5 11.5 13.9 69.2 36.3 22.1 16.4 2.7 2.6 2.4 2.2 16.9 12.2 9.8 8.3
Century Plyboard 23.0 36.6 36.4 36.0 80.8 38.6 29.6 23.0 18.6 14.1 10.8 8.3 39.7 23.9 19.6 15.9
RoE P/E P/BV EV/EBITDA
Source: Company, ICICIdirect.com Research
With its renewed focus on growth using asset light model
translating into strong earnings growth and improvement in
return ratio, we initiate coverage on Somany with BUY
rating with a target price of | 426. We value Somany at
19x FY17 EPS, which is at 25% discount to Kajaria &
implies the PEG of 0.4x.
Page 22 ICICI Securities Ltd | Retail Equity Research
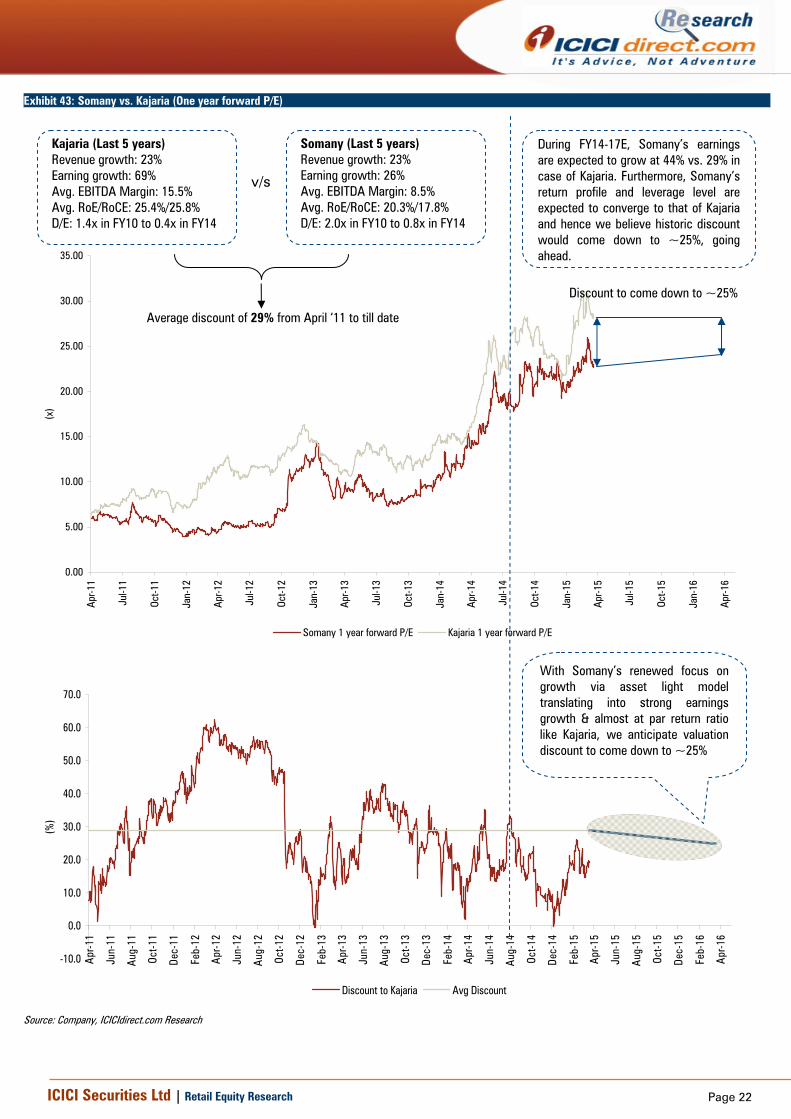
Exhibit 43: Somany vs. Kajaria (One year forward P/E)
0.00
5.00
10.00
15.00
20.00
25.00
30.00
35.00
Apr-1
1
Jul-1
1
Oct-1
1
Jan-
12
Apr-1
2
Jul-1
2
Oct-1
2
Jan-
13
Apr-1
3
Jul-1
3
Oct-1
3
Jan-
14
Apr-1
4
Jul-1
4
Oct-1
4
Jan-
15
Apr-1
5
Jul-1
5
Oct-1
5
Jan-
16
Apr-1
6
(x)
Somany 1 year forward P/E Kajaria 1 year forward P/E
-10.0
0.0
10.0
20.0
30.0
40.0
50.0
60.0
70.0
Apr
-11
Jun-
11
Aug-
11
Oct-1
1
Dec-
11
Feb-
12
Apr
-12
Jun-
12
Aug-
12
Oct-1
2
Dec-
12
Feb-
13
Apr
-13
Jun-
13
Aug-
13
Oct-1
3
Dec-
13
Feb-
14
Apr
-14
Jun-
14
Aug-
14
Oct-1
4
Dec-
14
Feb-
15
Apr
-15
Jun-
15
Aug-
15
Oct-1
5
Dec-
15
Feb-
16
Apr
-16
(%)
Discount to Kajaria Avg Discount
Source: Company, ICICIdirect.com Research
Kajaria (Last 5 years) Revenue growth: 23% Earning growth: 69% Avg. EBITDA Margin: 15.5% Avg. RoE/RoCE: 25.4%/25.8% D/E: 1.4x in FY10 to 0.4x in FY14
During FY14-17E, Somany’s earnings are expected to grow at 44% vs. 29% in case of Kajaria. Furthermore, Somany’s return profile and leverage level are expected to converge to that of Kajaria and hence we believe historic discount would come down to ~25%, going ahead.
With Somany’s renewed focus on growth via asset light model translating into strong earnings growth & almost at par return ratio like Kajaria, we anticipate valuation discount to come down to ~25%
Somany (Last 5 years) Revenue growth: 23% Earning growth: 26% Avg. EBITDA Margin: 8.5% Avg. RoE/RoCE: 20.3%/17.8% D/E: 2.0x in FY10 to 0.8x in FY14
v/s
Average discount of 29% from April ‘11 to till date
Discount to come down to ~25%

Page 23 ICICI Securities Ltd | Retail Equity Research
Exhibit 44: One year forward P/E chart of Somany
0
50
100
150
200
250
300
350
400
450
500
550
600
Apr-0
9
Jul-0
9
Oct-0
9
Jan-
10
Apr-1
0
Jul-1
0
Oct-1
0
Jan-
11
Apr-1
1
Jul-1
1
Oct-1
1
Jan-
12
Apr-1
2
Jul-1
2
Oct-1
2
Jan-
13
Apr-1
3
Jul-1
3
Oct-1
3
Jan-
14
Apr-1
4
Jul-1
4
Oct-1
4
Jan-
15
Apr-1
5
Jul-1
5
Oct-1
5
Jan-
16
Apr-1
6
Pric
e (|
)
Price 5x 10x 15x 20x 25x
Target Price 426
Source: Company, ICICIdirect.com Research
Sensitivity Analysis
We have built in natural gas price of 14.1 $/Mmbtu and exchange rate conversion of | 61 |/$ for our FY17E. Our sensitivity analysis indicates with every one dollar change in natural gas prices keeping | to $ conversion constant would impact FY17E EPS by 20% and with every one rupee change in | to $ conversion keeping natural gas price constant would impact FY17E EPS by 5%.
Exhibit 45: FY17E EPS sensitivity to natural gas price, exchange rate
22.4 16.1 15.1 14.1 13.1 12.163.0 11.1 15.7 20.4 25.0 29.662.0 12.3 16.8 21.4 25.9 30.561.0 13.5 17.9 22.4 26.9 31.460.0 14.6 19.1 23.5 27.9 32.359.0 15.8 20.2 24.5 28.8 33.2
Natural Gas Price ($/Mmbtu)
Exchange rate (|/$)
Source: Company, ICICIdirect.com Research
Page 24 ICICI Securities Ltd | Retail Equity Research
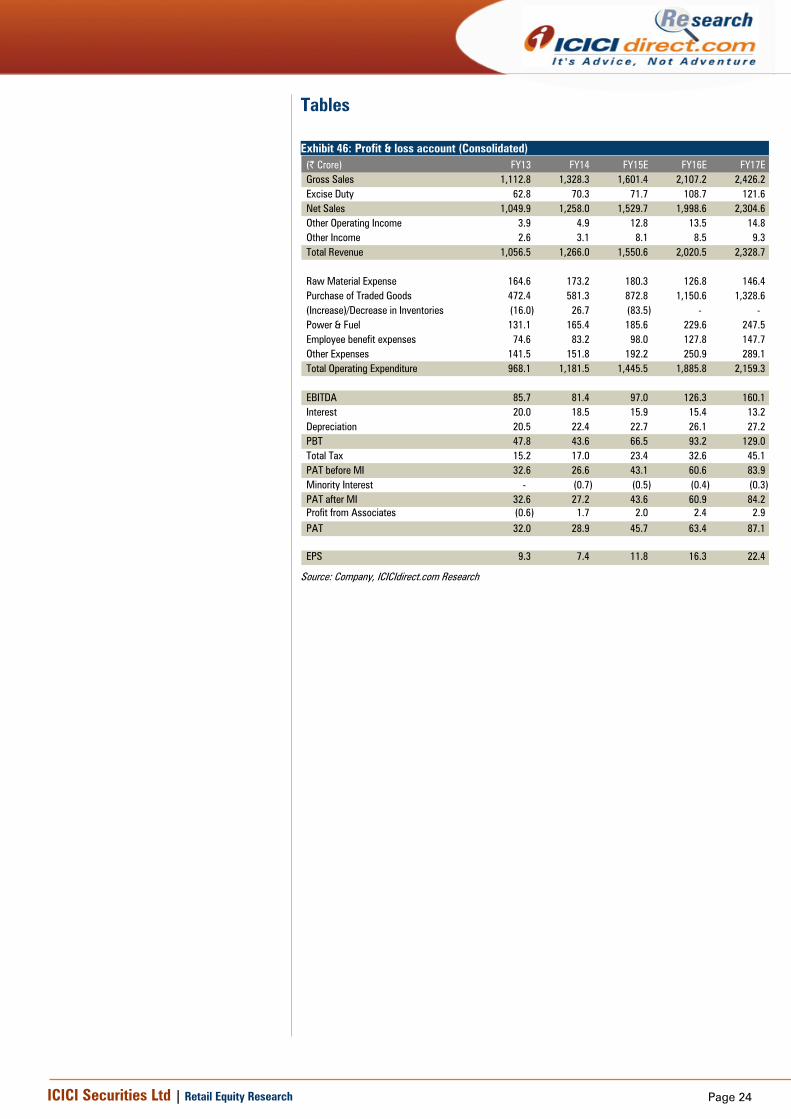
Tables Exhibit 46: Profit & loss account (Consolidated)
(| Crore) FY13 FY14 FY15E FY16E FY17EGross Sales 1,112.8 1,328.3 1,601.4 2,107.2 2,426.2 Excise Duty 62.8 70.3 71.7 108.7 121.6 Net Sales 1,049.9 1,258.0 1,529.7 1,998.6 2,304.6 Other Operating Income 3.9 4.9 12.8 13.5 14.8 Other Income 2.6 3.1 8.1 8.5 9.3 Total Revenue 1,056.5 1,266.0 1,550.6 2,020.5 2,328.7
Raw Material Expense 164.6 173.2 180.3 126.8 146.4 Purchase of Traded Goods 472.4 581.3 872.8 1,150.6 1,328.6 (Increase)/Decrease in Inventories (16.0) 26.7 (83.5) - - Power & Fuel 131.1 165.4 185.6 229.6 247.5 Employee benefit expenses 74.6 83.2 98.0 127.8 147.7 Other Expenses 141.5 151.8 192.2 250.9 289.1 Total Operating Expenditure 968.1 1,181.5 1,445.5 1,885.8 2,159.3
EBITDA 85.7 81.4 97.0 126.3 160.1 Interest 20.0 18.5 15.9 15.4 13.2 Depreciation 20.5 22.4 22.7 26.1 27.2 PBT 47.8 43.6 66.5 93.2 129.0 Total Tax 15.2 17.0 23.4 32.6 45.1 PAT before MI 32.6 26.6 43.1 60.6 83.9 Minority Interest - (0.7) (0.5) (0.4) (0.3) PAT after MI 32.6 27.2 43.6 60.9 84.2 Profit from Associates (0.6) 1.7 2.0 2.4 2.9 PAT 32.0 28.9 45.7 63.4 87.1
EPS 9.3 7.4 11.8 16.3 22.4
Source: Company, ICICIdirect.com Research
Page 25 ICICI Securities Ltd | Retail Equity Research
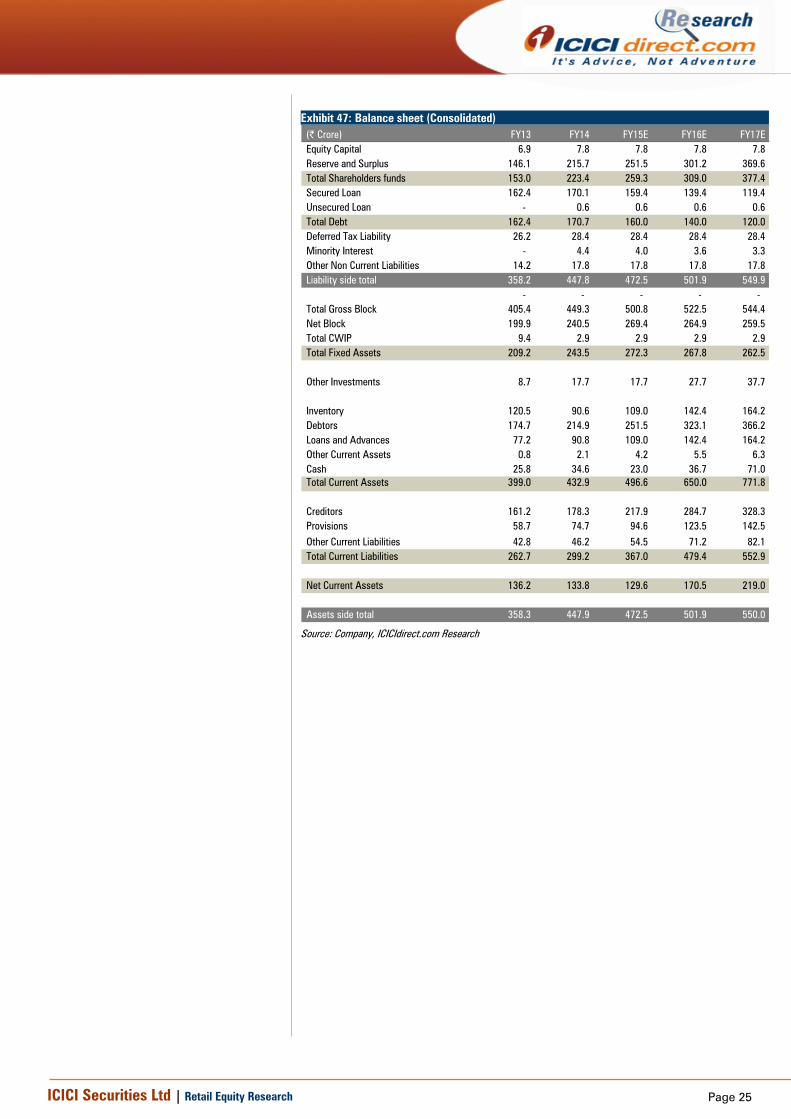
Exhibit 47: Balance sheet (Consolidated)
(| Crore) FY13 FY14 FY15E FY16E FY17EEquity Capital 6.9 7.8 7.8 7.8 7.8 Reserve and Surplus 146.1 215.7 251.5 301.2 369.6 Total Shareholders funds 153.0 223.4 259.3 309.0 377.4 Secured Loan 162.4 170.1 159.4 139.4 119.4 Unsecured Loan - 0.6 0.6 0.6 0.6 Total Debt 162.4 170.7 160.0 140.0 120.0 Deferred Tax Liability 26.2 28.4 28.4 28.4 28.4 Minority Interest - 4.4 4.0 3.6 3.3 Other Non Current Liabilities 14.2 17.8 17.8 17.8 17.8 Liability side total 358.2 447.8 472.5 501.9 549.9
- - - - - Total Gross Block 405.4 449.3 500.8 522.5 544.4 Net Block 199.9 240.5 269.4 264.9 259.5 Total CWIP 9.4 2.9 2.9 2.9 2.9 Total Fixed Assets 209.2 243.5 272.3 267.8 262.5
Other Investments 8.7 17.7 17.7 27.7 37.7
Inventory 120.5 90.6 109.0 142.4 164.2 Debtors 174.7 214.9 251.5 323.1 366.2 Loans and Advances 77.2 90.8 109.0 142.4 164.2 Other Current Assets 0.8 2.1 4.2 5.5 6.3 Cash 25.8 34.6 23.0 36.7 71.0 Total Current Assets 399.0 432.9 496.6 650.0 771.8
Creditors 161.2 178.3 217.9 284.7 328.3 Provisions 58.7 74.7 94.6 123.5 142.5 Other Current Liabilities 42.8 46.2 54.5 71.2 82.1 Total Current Liabilities 262.7 299.2 367.0 479.4 552.9
Net Current Assets 136.2 133.8 129.6 170.5 219.0
Assets side total 358.3 447.9 472.5 501.9 550.0
Source: Company, ICICIdirect.com Research
Page 26 ICICI Securities Ltd | Retail Equity Research
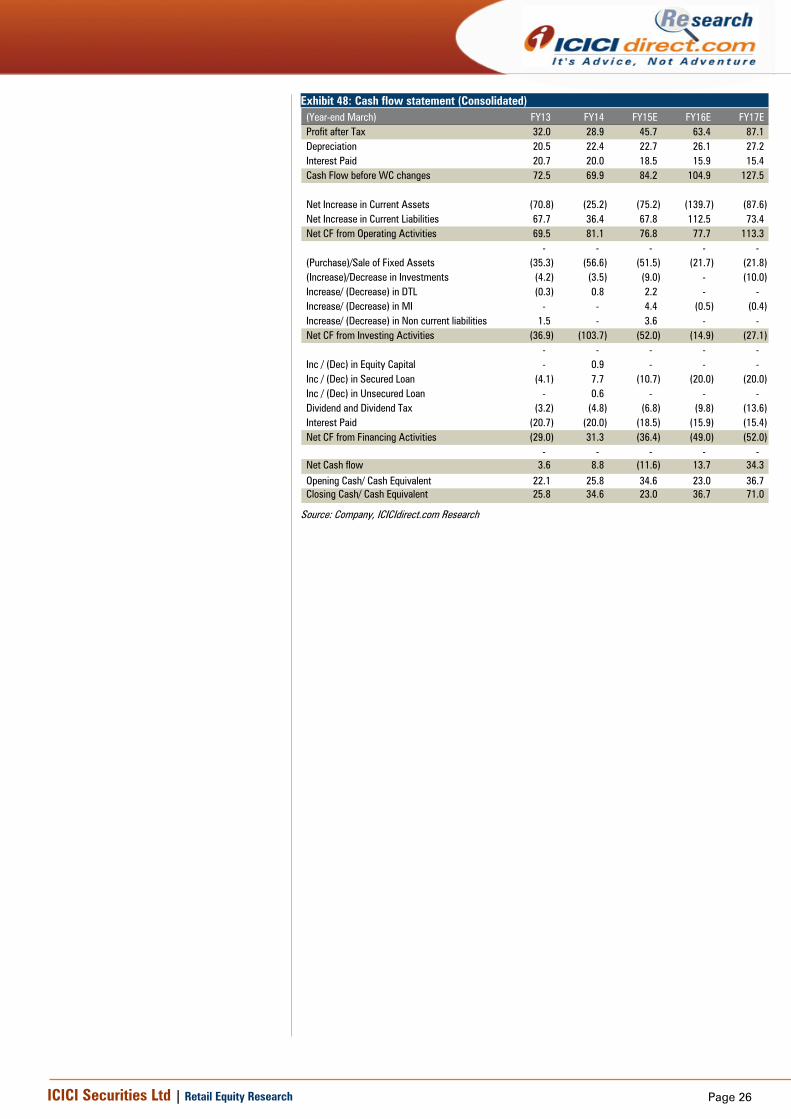
Exhibit 48: Cash flow statement (Consolidated) (Year-end March) FY13 FY14 FY15E FY16E FY17EProfit after Tax 32.0 28.9 45.7 63.4 87.1 Depreciation 20.5 22.4 22.7 26.1 27.2 Interest Paid 20.7 20.0 18.5 15.9 15.4 Cash Flow before WC changes 72.5 69.9 84.2 104.9 127.5
Net Increase in Current Assets (70.8) (25.2) (75.2) (139.7) (87.6) Net Increase in Current Liabilities 67.7 36.4 67.8 112.5 73.4 Net CF from Operating Activities 69.5 81.1 76.8 77.7 113.3
- - - - - (Purchase)/Sale of Fixed Assets (35.3) (56.6) (51.5) (21.7) (21.8) (Increase)/Decrease in Investments (4.2) (3.5) (9.0) - (10.0) Increase/ (Decrease) in DTL (0.3) 0.8 2.2 - - Increase/ (Decrease) in MI - - 4.4 (0.5) (0.4) Increase/ (Decrease) in Non current liabilities 1.5 - 3.6 - - Net CF from Investing Activities (36.9) (103.7) (52.0) (14.9) (27.1)
- - - - - Inc / (Dec) in Equity Capital - 0.9 - - - Inc / (Dec) in Secured Loan (4.1) 7.7 (10.7) (20.0) (20.0) Inc / (Dec) in Unsecured Loan - 0.6 - - - Dividend and Dividend Tax (3.2) (4.8) (6.8) (9.8) (13.6) Interest Paid (20.7) (20.0) (18.5) (15.9) (15.4) Net CF from Financing Activities (29.0) 31.3 (36.4) (49.0) (52.0)
- - - - - Net Cash flow 3.6 8.8 (11.6) 13.7 34.3 Opening Cash/ Cash Equivalent 22.1 25.8 34.6 23.0 36.7 Closing Cash/ Cash Equivalent 25.8 34.6 23.0 36.7 71.0
Source: Company, ICICIdirect.com Research
Page 27 ICICI Securities Ltd | Retail Equity Research
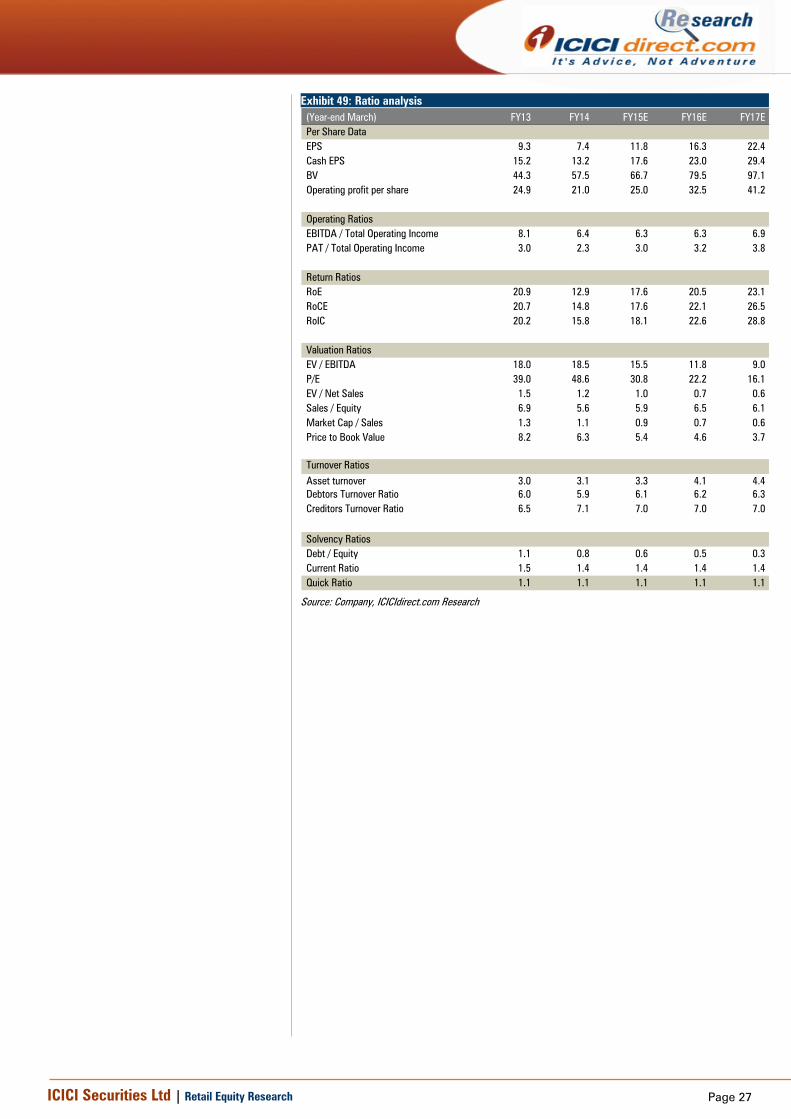
Exhibit 49: Ratio analysis (Year-end March) FY13 FY14 FY15E FY16E FY17EPer Share DataEPS 9.3 7.4 11.8 16.3 22.4 Cash EPS 15.2 13.2 17.6 23.0 29.4 BV 44.3 57.5 66.7 79.5 97.1 Operating profit per share 24.9 21.0 25.0 32.5 41.2
Operating RatiosEBITDA / Total Operating Income 8.1 6.4 6.3 6.3 6.9 PAT / Total Operating Income 3.0 2.3 3.0 3.2 3.8
Return RatiosRoE 20.9 12.9 17.6 20.5 23.1 RoCE 20.7 14.8 17.6 22.1 26.5 RoIC 20.2 15.8 18.1 22.6 28.8
Valuation RatiosEV / EBITDA 18.0 18.5 15.5 11.8 9.0 P/E 39.0 48.6 30.8 22.2 16.1 EV / Net Sales 1.5 1.2 1.0 0.7 0.6 Sales / Equity 6.9 5.6 5.9 6.5 6.1 Market Cap / Sales 1.3 1.1 0.9 0.7 0.6 Price to Book Value 8.2 6.3 5.4 4.6 3.7
Turnover RatiosAsset turnover 3.0 3.1 3.3 4.1 4.4 Debtors Turnover Ratio 6.0 5.9 6.1 6.2 6.3 Creditors Turnover Ratio 6.5 7.1 7.0 7.0 7.0
Solvency RatiosDebt / Equity 1.1 0.8 0.6 0.5 0.3 Current Ratio 1.5 1.4 1.4 1.4 1.4 Quick Ratio 1.1 1.1 1.1 1.1 1.1
Source: Company, ICICIdirect.com Research
Page 28 ICICI Securities Ltd | Retail Equity Research
RATING RATIONALE ICICIdirect.com endeavours to provide objective opinions and recommendations. ICICIdirect.com assigns ratings to its stocks according to their notional target price vs. current market price and then categorises them as Strong Buy, Buy, Hold and Sell. The performance horizon is two years unless specified and the notional target price is defined as the analysts' valuation for a stock. Strong Buy: >15%/20% for large caps/midcaps, respectively, with high conviction; Buy: >10%/15% for large caps/midcaps, respectively; Hold: Up to +/-10%; Sell: -10% or more;
Pankaj Pandey Head – Research [email protected]
ICICIdirect.com Research Desk, ICICI Securities Limited, 1st Floor, Akruti Trade Centre, Road No 7, MIDC, Andheri (East) Mumbai – 400 093
Page 29 ICICI Securities Ltd | Retail Equity Research
Disclaimer
ANALYST CERTIFICATION We , Deepak Purswani, MBA (Finance), CFA; Nikunj Gala, MBA (Capital Markets) research analysts, authors and the names subscribed to this report, hereby certify that all of the views expressed in this research report accurately reflect our views about the subject issuer(s) or securities. We also certify that no part of our compensation was, is, or will be directly or indirectly related to the specific recommendation(s) or view(s) in this report.
Terms & conditions and other disclosures: ICICI Securities Limited (ICICI Securities) is full-service, integrated investment banking and is, inter alia, engaged in the business of stock brokering and distribution of financial products. ICICI Securities is a wholly-owned subsidiary of ICICI Bank which is India’s largest private sector bank and has its various subsidiaries engaged in businesses of housing finance, asset management, life insurance, general insurance, venture capital fund management, etc. (“associates”), the details in respect of which are available on www.icicibank.com. ICICI Securities is one of the leading merchant bankers/ underwriters of securities and participate in virtually all securities trading markets in India. We and our associates might have investment banking and other business relationship with a significant percentage of companies covered by our Investment Research Department. ICICI Securities generally prohibits its analysts, persons reporting to analysts and their relatives from maintaining a financial interest in the securities or derivatives of any companies that the analysts cover. The information and opinions in this report have been prepared by ICICI Securities and are subject to change without any notice. The report and information contained herein is strictly confidential and meant solely for the selected recipient and may not be altered in any way, transmitted to, copied or distributed, in part or in whole, to any other person or to the media or reproduced in any form, without prior written consent of ICICI Securities. While we would endeavour to update the information herein on a reasonable basis, ICICI Securities is is under no obligation to update or keep the information current. Also, there may be regulatory, compliance or other reasons that may prevent ICICI Securities from doing so. Non-rated securities indicate that rating on a particular security has been suspended temporarily and such suspension is in compliance with applicable regulations and/or ICICI Securities policies, in circumstances where ICICI Securities might be acting in an advisory capacity to this company, or in certain other circumstances. This report is based on information obtained from public sources and sources believed to be reliable, but no independent verification has been made nor is its accuracy or completeness guaranteed. This report and information herein is solely for informational purpose and shall not be used or considered as an offer document or solicitation of offer to buy or sell or subscribe for securities or other financial instruments. Though disseminated to all the customers simultaneously, not all customers may receive this report at the same time. ICICI Securities will not treat recipients as customers by virtue of their receiving this report. Nothing in this report constitutes investment, legal, accounting and tax advice or a representation that any investment or strategy is suitable or appropriate to your specific circumstances. The securities discussed and opinions expressed in this report may not be suitable for all investors, who must make their own investment decisions, based on their own investment objectives, financial positions and needs of specific recipient. This may not be taken in substitution for the exercise of independent judgment by any recipient. The recipient should independently evaluate the investment risks. The value and return on investment may vary because of changes in interest rates, foreign exchange rates or any other reason. ICICI Securities accepts no liabilities whatsoever for any loss or damage of any kind arising out of the use of this report. Past performance is not necessarily a guide to future performance. Investors are advised to see Risk Disclosure Document to understand the risks associated before investing in the securities markets. Actual results may differ materially from those set forth in projections. Forward-looking statements are not predictions and may be subject to change without notice. ICICI Securities or its associates might have managed or co-managed public offering of securities for the subject company or might have been mandated by the subject company for any other assignment in the past twelve months. ICICI Securities or its associates might have received any compensation from the companies mentioned in the report during the period preceding twelve months from the date of this report for services in respect of managing or co-managing public offerings, corporate finance, investment banking or merchant banking, brokerage services or other advisory service in a merger or specific transaction. ICICI Securities or its associates might have received any compensation for products or services other than investment banking or merchant banking or brokerage services from the companies mentioned in the report in the past twelve months. ICICI Securities encourages independence in research report preparation and strives to minimize conflict in preparation of research report. ICICI Securities or its analysts did not receive any compensation or other benefits from the companies mentioned in the report or third party in connection with preparation of the research report. Accordingly, neither ICICI Securities nor Research Analysts have any material conflict of interest at the time of publication of this report. It is confirmed that Deepak Purswani, MBA (Finance), CFA; Nikunj Gala, MBA (Capital Markets) research analysts of this report have not received any compensation from the companies mentioned in the report in the preceding twelve months. Compensation of our Research Analysts is not based on any specific merchant banking, investment banking or brokerage service transactions. ICICI Securities or its subsidiaries collectively or Research Analysts do not own 1% or more of the equity securities of the Company mentioned in the report as of the last day of the month preceding the publication of the research report. Since associates of ICICI Securities are engaged in various financial service businesses, they might have financial interests or beneficial ownership in various companies including the subject company/companies mentioned in this report. It is confirmed that Deepak Purswani, MBA (Finance), CFA; Nikunj Gala, MBA (Capital Markets) research analysts do not serve as an officer, director or employee of the companies mentioned in the report. ICICI Securities may have issued other reports that are inconsistent with and reach different conclusion from the information presented in this report. Neither the Research Analysts nor ICICI Securities have been engaged in market making activity for the companies mentioned in the report. We submit that no material disciplinary action has been taken on ICICI Securities by any Regulatory Authority impacting Equity Research Analysis activities. This report is not directed or intended for distribution to, or use by, any person or entity who is a citizen or resident of or located in any locality, state, country or other jurisdiction, where such distribution, publication, availability or use would be contrary to law, regulation or which would subject ICICI Securities and affiliates to any registration or licensing requirement within such jurisdiction. The securities described herein may or may not be eligible for sale in all jurisdictions or to certain category of investors. Persons in whose possession this document may come are required to inform themselves of and to observe such restriction.