Embed Size (px)
Citation preview

ICICI Securities Ltd | Retail Equity Research
September 22, 2017
Cementing its path to growth!
Ramco Cement (Ramco) is one of the largest cement players in south
India with a total production capacity of 16.5 MT. Further, its
EBITDA/tonne is one of the highest in the industry mainly due to cost
efficiency and premium positioning in the south. Going forward, we
expect revenues to increase at 12.2% CAGR in FY17-20E mainly led by
capacity expansion and increased government spending. This coupled
with healthy EBITDA margins (over 25%), comfortable balance sheet (0.2x
FY20E D/E) and attractive valuation augurs well for the company. We
initiate coverage on Ramco with a SOTP based TP of | 822.
Operating markets key beneficiary of increased infra spends…
Out of total 1.2 crore affordable houses to be built by Government of India
over FY18E-19E, ~40% of these houses (48 lakh) has been allotted in
Ramco’s operating markets. This, coupled with higher budgetary
allocation towards roads and irrigation by states and central government
in which Ramco has a major presence, is expected to drive cement
demand in the next three years. We expect Ramco’s operating markets to
grow at a CAGR of 7-8% over the next three to four years.
Capacity expansion, geographical diversification to drive growth…
Ramco plans to expand its capacity by ~20% to 19.5 MT over the next 18
months. Of the 3 MT capacity expansion, 2 MT will be in the east (1 MT
each in West Bengal, Odisha) while 1 MT will be set up in the south (in
Andhra Pradesh). The capacity expansion in the east will enable the
company to remove capacity constraint and also increase its market
share. Apart from expansion in the east, the capacity expansion in AP
(south) will enable it to tap the growing opportunity of this market (that is
expected to grow at 14% CAGR in the next two or three years).
Healthy cash flow generation to keep balance sheet light!
During the downturn in the south over FY10-15, efficient management of
cash flows has enabled the company to reduce debt-equity from 1.6x to
1.0x in FY15 and further to 0.4x in FY17. Going forward, we believe the
company’s robust cash flow generation (~| 3,500 crore in FY17-20E) will
not only enable to fund its capex through internal accruals but also
reduce its debt-equity further to 0.2x.
Initiate coverage on Ramco with BUY recommendation
At the CMP, Ramco is trading at a valuation of US$150/t and 11.0x FY20E
EV/Tonne & EV/EBITDA. Considering the capacity expansion, better
leverage (D/E: 0.2x) and cost efficiency, Ramco is currently trading at
attractive valuations. We initiate coverage on Ramco with a BUY rating
and an SOTP based target price of | 822 (i.e. 13x FY20E EV/EBITDA).
Exhibit 1: Financial Summary
| crore FY17 FY18E FY19E FY20E
Net Sales 3949.5 4307.1 4851.4 5574.9
EBITDA 1176.4 1165.1 1326.2 1548.4
Net Profit 649.3 602.3 697.6 870.3
EPS (|) 27.3 25.5 29.6 36.9
P/E (x) 25.8 27.6 23.7 19.0
Price/book (x) 4.5 4.1 3.7 3.2
EV/EBITDA (x) 15.3 15.7 13.6 11.3
EV/Tonne (US$) 182.1 184.5 171.9 149.3
RoCE (%) 12.7 11.1 11.9 13.6
ROE (%) 17.4 14.9 15.4 16.8
Source: Company, ICICIdirect.com Research
Ramco Cements (RAMCEM)
| 703
Rating matrix
Rating : Buy
Target : | 822
Target Period : 9-12 months
Potential Upside : 17%
YoY Growth (%)
(%) FY17 FY18E FY19E FY20E
Net Sales 10.5 9.1 12.6 14.9
EBITDA 9.8 -1.0 13.8 16.8
Net Profit 19.8 -7.2 15.8 24.7
EPS (|) 19.8 -6.7 16.3 24.7
Valuation summary
(x) FY17 FY18E FY19E FY20E
P/E 25.8 27.6 23.7 19.0
Target P/E 30.2 32.3 27.8 22.3
EV/EBITDA 15.3 15.7 13.6 11.3
EV/Tonne (US$) 182.1 184.5 171.9 149.3
P/BV 4.5 4.1 3.7 3.2
RoNW (%) 17.4 14.9 15.4 16.8
RoCE (%) 12.7 11.1 11.9 13.6
Stock data
Particulars Amount (| crore)
Market Capitalisation 16736.8
Total Debt (FY17) 1424.8
Cash (FY17) 144.6
EV 18017.0
52 week H/L (|) 765/479
Equity Capital 23.6
Face Value (|) 1.0
Comparative Return Matrix (%)
1M 3M 6M 12M
ACC -2.4 5.6 23.8 7.4
Ambuja Cement 0.9 15.1 16.7 4.7
Shree Cement 7.5 6.0 13.0 11.1
UltraTech Cement 3.9 3.7 3.9 5.2
Ramco Cement 8.7 3.2 9.9 24.2
Price Movement
0
200
400
600
800
Sep-17Feb-17Jun-16Nov-15Apr-15Aug-14
2,000
4,000
6,000
8,000
10,000
12,000
Price (R.H.S) Nifty (L.H.S)
Research Analyst
Rashesh Shah
Devang Bhatt
Initiating Coverage

Page 2 ICICI Securities Ltd | Retail Equity Research
Company background
The Ramco Cement (Ramco) started its operations in 1962 with an
installed capacity of 0.07 MT. Today, the company is one of the largest
cement players in south India with a total production capacity of 16.5 MT
(out of which capacity of satellite grinding units is 4 MT). Further, it is also
one of the most cost efficient cement producers, with cost advantage
emerging from the captive thermal power of 175 MW and strategic plant
locations (split grinding unit near the markets and clinker plant near the
mines). The company sells cement in Tamil Nadu (TN), Kerala, Karnataka,
Andhra Pradesh (AP), West Bengal and Odisha. Out of the total cement
sales 59% is sold in TN and Kerala, 11% in West Bengal, 10% each in
Karnataka, AP and Odisha. Apart from cement, the company also
produces ready mix concrete and dry mix mortar.
The company also owns windmill farms. Ramco had set up its first
windmill in 1993 with a total installed capacity of 4.0 MW. Over the years,
the company has expanded its capacity. As of FY17, the total installed
windmill capacity in Tamil Nadu was 165.8 MW (including subsidiaries).
Out of the total capacity, 9.9 MW of windmill power goes to the captive
use of Salem, Chengalpet grinding units, dry mix plant and for Nagercoil
packing plant. The balance capacity of 155.9 MW is sold to Tamil Nadu
Electricity Board and group companies. Out of total 165.8 MW, 39.8 MW
is under a subsidiary (i.e. Ramco Windfarms) in which the company owns
71.5%. The revenue and PAT for the subsidiary company for FY17 were
| 17.8 crore and | 4.4 crore compared to | 8.6 crore and | 0.3 crore,
respectively, of the previous year.
The company reported gross revenue of | 4,564.2 crore in FY17. Out of
total gross revenues, sale from cement was | 4,434.9 crore (~97.2% of
total gross revenues), sale of power accounted for 1.6% of total gross
revenues while the balance 1.2% of gross revenues was from sale of
ready mix concrete and dry mortar.
In the current fiscal year, the company has bought back 25 lakh shares at
an average price of | 670.8/share amounting to | 167.7 crore.
Exhibit 2: Ramco capacity trend…
6.0
8.0
10.0
12.4 12.4 12.4
15.5 15.5
16.5 16.5 16.5
0.0
2.0
4.0
6.0
8.0
10.0
12.0
14.0
16.0
18.0
FY07 FY08 FY09 FY10 FY11 FY12 FY13 FY14 FY15 FY16 FY17
in M
illion T
onne (
MT)
Capacity
Source: Company, ICICIdirect.com Research
Shareholding pattern (Q1FY18)
Shareholder Holding (%)
Promoter 42.7
FII 14.5
DII 18.5
Government of TN 3.4
Total 20.9
Source: BSE Filing, ICICIdirect.com Research
Shareholding pattern (Q1FY18)
14.5 14.5
18.9 18.5
0.0
5.0
10.0
15.0
20.0
Q4FY17 Q1FY18
FII DII
Source: BSE Filing, ICICIdirect.com Research

Page 3 ICICI Securities Ltd | Retail Equity Research
Exhibit 3: Ramco Cement brands…
b
Source: Company, ICICIdirect.com Research
Exhibit 4: Location wise capacity details
Integrated unit Capacity (in mt)
RR Nagar, Tamil Nadu 2.0
Alathiyur, Tamil Nadu 3.1
Ariyalur, Tamil Nadu 3.5
Chitradurga, Karnataka 0.3
Jayanthipuram, Andhra Pradesh 3.7
Total 12.5
Grinding Unit Capacity (in MT)
Uthiramerur, Tamil Nadu 0.5
Salem, Tamil Nadu 1.6
Kolaghat, West Bengal 1.0
Vizag, Andhra Pradesh 1.0
Total 4.0
Total Capacity 16.5
Source: Company, ICICIdirect.com Research
Exhibit 5: Ramco historical performance
Cement Capacity FY09 FY10 FY11 FY12 FY13 FY14 FY15 FY16 FY17
10.0 10.5 10.5 10.5 12.5 12.5 12.5 12.5 12.5
0.0 2.0 2.0 2.0 3.1 3.1 4.0 4.0 4.0
10.0 12.4 12.4 12.4 15.5 15.5 16.5 16.5 16.5
6.5 8.0 7.3 7.5 8.5 8.6 7.7 7.2 8.3
181.6 185.6 159.2 159.2 159.2 159.2 159.2 165.8 165.8
2814.0 3105.8 2957.5 3652.4 4387.9 4238.2 4181.9 4130.9 4564.2
357.8 304.8 352.6 428.8 557.1 554.7 537.0 557.7 614.7
2456.2 2801.0 2605.0 3223.6 3830.8 3683.5 3644.9 3573.3 3949.5
778.4 857.0 617.5 936.9 1005.9 563.0 713.2 1071.6 1176.4
31.7 30.6 23.7 29.1 26.3 15.3 19.6 30.0 29.8
1192.1 1067.3 845.3 1245.6 1186.9 655.5 926.8 1481.5 1415.6
2447.0 2583.0 2593.0 2626.0 2787.0 2937.0 2883.0 2846.0 2883.0
15.0 15.0 9.0 16.0 17.0 6.0 10.0 22.8 27.3
2.0 2.0 1.3 2.5 3.0 1.0 1.5 3.0 0.0
Poduction (in MT)
Windfarm
Capacity (MW) (including subsidiary)
Intergrated Cement Capacity (in MT)
Grinding Unit (in MT)
Total Cement Capacity (in MT)
Less Exicse Duty (in | crore)
Net Revenues (in | crore)
Gross Revenues (in | crore)
EBITDA (in | crore)
EBITDA margin (%)
EBITDA/tonne (in |)
Number of Employees
EPS (in |)
DPS (in |)
Source: Company, ICICIdirect.com Research
Ramco’s regional sales mix
Orrisa
10%
Bengal
11%
AP
10%
Karnataka
10%
TN and
Kerala
59%
Source: Company, ICICIdirect.com Research

Page 4 ICICI Securities Ltd | Retail Equity Research
Investment Rationale
Ramco operating markets (south, east) key beneficiary of affordable housing
Out of the overall infra spend, affordable housing has remained a key
focus of the government due to its positive multiplier impact. As per the
government study, total shortage of houses in rural areas is ~4.4 crore
and ~1.2 crore in urban areas. The government plans to build this in
FY17-22E under the “Housing for All” scheme. This translates to overall
cement requirement of 285.6 MT or 57.1 MTPA (~21.1% of FY17 cement
consumption) assuming an area of 300 sq ft and cement consumption of
17 kg/sq ft.
For the next two years (i.e. FY18E-19E), the government has set a target
of building 1.2 crore houses (i.e. 68 lakh in rural and 52 lakh in urban).
This would require cement of 61.2 MT or ~31 MTPA. However, factoring
in execution misses, if 30% of the stated target (i.e. 18.0 lakh houses per
annum that is in line with past record of Indira Awas Yojana of 18 lakh
houses p.a. over 2012-16) is achieved, it would result in cement demand
of ~9.2MTPA (~3.4% of current pan India cement consumption).
Exhibit 6: Pan-India cement demand from affordable housing in next five
years
In crore
4.4
1.2
5.6
300.0
17.0
5,100.0
285.6
57.1Annual demand (in MT)
Per unit minimum sq ft
Cement consumption per sq ft (in kg)
Total cement required in one unit (in kg)
Cumilative cement required (in MT)
Particulars
Rural housing shortage
Urban housing shortage
Total housing shortage
Source: The Ministry of Rural Development (MoRD), The Ministry of Housing and Urban
Poverty Alleviation (MoHUPA), ICICIdirect.com, Research
Exhibit 7: Pan-India cement demand from affordable housing in FY18E-19E
In crore
0.7
0.5
1.2
300.0
17.0
5100.0
61.2
30.6
Particulars
Rural housing target
Total cement required in one unit (in kg)
Cumilative cement required (in MT)
Urban housing target
Annual demand (in MT)
Total target
Per unit minimum sq ft
Cement consumption per sq ft (in kg)
Source: MoRD, MoHUPA, ICICIdirect.com, Research
Out of the total 1.2 crore affordable houses (as per Exhibit 7), Ramco’s
operating markets have been allotted 48 lakh houses (~40.2% of overall
households). This will result in annual cement demand of ~12 MTPA. If
we assume only 30% of this cement demand is achieved, it will translate
into cement demand of 3.7 MTPA.
Exhibit 8: Cement demand from affordable housing in Ramco's key markets over FY18E-19E
Region Rural Urban Total
Andhra Pradesh 89,160.0 1,082,600.0 1,171,760.0
Telangana 32,577.0 166,072.0 198,649.0
Karnataka 88,469.0 406,520.0 494,989.0
Kerala 18,090.0 65,060.0 83,150.0
Tamil Nadu 261,780.0 670,078.0 931,858.0
West Bengal 806,093.0 289,808.0 1,095,901.0
Odisha 733,132.0 119,030.0 852,162.0
Total low cost housing targeted (units) 2,029,301.0 2,799,168.0 4,828,469.0
Per unit minimum sq ft 300.0 300.0 300.0
Cement consumption per sq ft (in kg) 17.0 17.0 17.0
Total cement required in one unit (in kg) 5100.0 5100.0 5100.0
Cumilative cement required (in MT) 10.3 14.3 24.6
Annual demand (in MT) 5.2 7.1 12.3
as % of total cement demand p.a over FY17-19E 40.2
Source: Ministry of Housing and Urban Affairs, Government of India, ICICIdirect.com Research
Source: ICICIdirect.com Research
Source: ICICIdirect.com Research
Total number of units to be built 200,000
Per unit minimum sq ft 560.0
Cement consumption per sq ft (in kg) 17.0
Total cement required in one unit (in kg) 9520.0
Cumilative cement required (in MT) 1.9
Annual demand (in MT) 0.4
Telangana 2BHK housing scheme
Source: Telangana Government, ICICIdirect.com Research
Source: ICICIdirect.com, Research

Page 5 ICICI Securities Ltd | Retail Equity Research
…..roads to further boost cement demand
Over the next five years, the government is planning to construct 51,182
km of roads, which has the potential to generate cement demand of ~51
MT in FY17-22E. In FY18, the government set a target of constructing
15,000 km (41.1 km road construction per day) of roads, which could
generate annual cement demand of ~15 MT (~5.6% of overall cement
consumption). However, considering the historical track record, we
believe it will be difficult to achieve the 41 km per day target. Hence,
based on FY16 road construction trend (of 22.6 km per day), we believe
25 km of road construction per day is achievable. Thus, based on our
assumption ~60% of the target (9,000 km) can be achieved in the current
year leading to a cement demand of 9.0 MT (~3.3% of current cement
consumption) based on our assumption of 1000 tonnes of cement for 2
lanes per KM.
Exhibit 9: Historical trend in road construction
Particulars FY12 FY13 FY14 FY15 FY16 FY17 FY18E
Awarding 9794.0 1961.0 3625.0 7980 10098.0 16271.0 25000.0
Construction 5013.0 5732.0 4260.0 4410 6061.0 8231.0 15000.0
Road construction km per day 13.7 15.7 11.7 12.1 16.6 22.6 41.1
Source: Ministry of Road Development (MRD), ICICIdirect.com Research
Exhibit 10: Annual cement demand from road construction
Particulars Km
Road construction target over the next 5 years 51182.0
Road construction target for FY18 15000.0
Cement consumption per km (in tonnes) 1000.0
Annual cement required (in MT) 15.0
Achievable target p.a 9.0
Source: MRD, ICICIdirect.com Research
Out of the total cement demand from roads, ~2.4 MT (27.0% of overall
cement demand from roads) would be from Ramco’s operating markets.
If we assume only 60% execution rate it will result in 1.4 MT of cement
demand per annum.
Exhibit 11: Cement demand from roads in Ramco's key markets in FY18
Regions KM Cement required Cement demand (in MT)
AP 435.6 1000 tonnes for 2 lanes per Km 0.4
Telangana 180.0 1000 tonnes for 2 lanes per Km 0.2
Karnataka 356.4 1000 tonnes for 2 lanes per Km 0.4
Tamil Nadu 357.0 1000 tonnes for 2 lanes per Km 0.4
Kerala 134.0 1000 tonnes for 2 lanes per Km 0.1
Odisha 627.0 1000 tonnes for 2 lanes per Km 0.6
West Bengal 311.0 1000 tonnes for 2 lanes per Km 0.3
Annual cement required (in MT) 2401.1 2.4
Source: MRD, ICICIdirect.com Research
Source: ICICIdirect.com Research
Source:ICICIdirect.com, Research
Source: Company, ICICIdirect.com Research
Cement roads to drive demand
Source:ICICIdirect.com Research
Source: Company, ICICIdirect.com Research

Page 6ICICI Securities Ltd | Retail Equity Research
…Irrigation, other infra projects to act as additional kicker Apart from affordable housing and road construction, infra spending in irrigation and other miscellaneous projects would also drive cement demand, going forward. Over the past three years, many irrigation contracts have been tendered. While some are being executed, some are still pending execution. We have attempted to arrive at an opportunity by assuming that pending tenders will be executed in the next three years. We assume that cement will constitute 5.0% of overall project cost.
State, central allocation for infra projects remains robust
In affordable housing (esp rural), the government will provide assistance of | 1,20,000 to construct a house in plain areas and | 1,30,000 to construct a house in hilly & north-eastern regions. Thus, based on these estimates, construction of 1 crore rural houses (in FY17-19E) will work out to a | 1.2 lakh crore opportunity. Construction cost will be shared between Centre and state in the ratio of 60:40 in plain areas and 90:10 in hilly areas.
Hence, the Centre’s cost has been calculated at | 81,975 crore in the next three years with the balance to be funded by states. So far, the government has released | 39,000 crore. Another | 21,000 crore is expected in the next Budget. The remaining | 21,975 crore will be borrowed from Nabard for which the Ministry of Rural Development will have to pay interest.
Exhibit 12: Central budgetary allocation highest towards roads and housing
| crore FY16 FY17BE FY17RE FY18BE Growth (%)
Ministry of road transport and highways 27532.0 17453.0 41103.0 54176 31.8Pradhan Mantri Gram Sadak Yojna 18290.0 19000.0 19000.0 19000 0.0
Minsitry of Urban development 10589.0 11502.0 17182.0 19332 12.5Pradhan Mantri Awas Yojana (Rural) 10116.0 15000.0 16000.0 23000 43.8
Total 66527.0 62955.0 93285.0 115508 23.8 Source: Budget Document, ICICIdirect.com Research
Exhibit 13: State-wise budget allocation towards infrastructure developments (in company’s key states) In | crore
RE 2016-17 BE 2017-18 YoY (%) RE 2016-17 BE 2017-18 YoY (%) RE 2016-17 BE 2017-18 YoY (%) RE 2016-17 BE 2017-18 YoY (%)Road 4227.2 4081.0 (3.5) 6471.2 8619.6 33.2 5651.0 5990.6 6.0 2723.0 2678.3 (1.6)Irrigation 21365.1 26481.6 23.9 1336.6 2851.3 113.3 8944.3 12398.4 38.6 1036.3 1497.1 44.5 Urban infra (includes housing) 2580.5 4961.8 92.3 3547.4 4943.1 39.3 1573.1 2671.7 69.8 2209.0 3491.1 58.0Total 28172.8 35524.4 26.1 11355.2 16414.0 44.6 16168.4 21060.7 30.3 5968.3 7666.6 28.5
Karnataka West BengalAP and Telangana Tamil Nadu
Source: Budget documents of Andhra Pradesh, Telangana, Tamil Nadu, Karnataka, West Bengal, ICICIdirect.com Research
Based on the above demand scenario, we expect Ramco’s operating markets to grow at a CAGR of 7-8% in the next few years. Exhibit 14: Annual incremental cement demand (in MT)
Particulars MTRoads 1.4
Low cost housing 3.72 BHk housing 0.1
Irrigation projects 3.0other projects 0.1
Total Cement Demand 8.4Current cement consumption 115.1
YoY growth (%) 7.3 Source: ICICIdirect.com Research
Tenders pending (in
| crore)
Cement opportunity in
the projects (in | crore)
Cement required (in
MT)Annual demand (in
MT)
77770.6 3888.5 7.8 2.6
Cement demand from irrigation based on pending tenders
Source: Projects Today, ICICIdirect.com Research
Polavaram Project Particulars AmountOverall Project Cost (in | crore) 40000.0
of which land cost (in | crore) 28000.0Infra requirement (in | crore) 12000.0
Cement requirement (in | crore) 600.0Cement requirement (in MT) 1.3
Annual demand 0.4 Source: ICICIdirect.com Research
Source: ICICIdirect.com, Research
Irrigation to further drive growth

Page 7 ICICI Securities Ltd | Retail Equity Research
Cement demand in south to outpace capacity expansion…
New capacity expansion in the southern region in FY14-17 slowed down
to 10 MT vs. about 27 MT in the preceding four years. Going forward, we
expect capacity expansion to further slow down to ~8 MT in FY17-20E.
Hence, supply pressure from new players/capacity should remain low.
Further, with an improvement in demand led by infra projects and
individual house builders, we expect demand (22 MT) to outpace supply
(8 MT) positively impacting utilisation levels. We expect utilisation to
improve from 58% in FY17 to 69% in FY20E thereby positively impacting
margins levels.
Exhibit 15: Cement demand supply scenario in south
South FY16 FY17 FY18E FY19E FY20E
Cement Capacity 143.0 148.0 148.7 154.2 155.9
Capacity Utitilisation 55.6 57.5 61.5 64.2 68.9
Cement Demand 79.5 85.1 91.5 99.0 107.4
Growth 7.0% 7.5% 8.3% 8.5%
Source: Company, ICICIdirect.com, Research
Exhibit 16: Capacity addition in south
Company FY18E FY19E FY20E
KCP 1.7
Sagar Cement 1.5
NCL industries 0.7
Shree cement 4.0
Total 0.7 5.5 1.7
Source: Company, ICICIdirect.com, Research
Single digit returns, higher leverage position primary reason for
slowdown in capacity addition….
The cost of setting up a new integrated cement unit has significantly
increased over the past few years mainly due to surging land cost, higher
construction cost and general inflation. This, coupled with low capacity
utilisation due to an overcapacity scenario in the southern market, has
made it difficult for a greenfield expansion. In addition, a slowdown in
demand and increase in competition in previous years has made most
companies debt heavy. Further, except Tamil Nadu and Karnataka,
cement prices in the south are at ~| 300/bag. Hence, in the current
scenario (of 60% utilisation and | 300/bag realisation) a company setting
up an integrated unit will make low single digit returns. In order to earn a
reasonable rate of return (of ~12% RoCE) a company needs to have an
utilisation of 80% and retail price of | 350/bag. Hence, we believe the
capacity addition in southern region will stay subdued in coming years.
Exhibit 17: Lower return making it difficult for greenfield project
Particulars Current scenario Scenario 1 Scenario 2
Capacity (mt) 1.0 1.0 1.0
Capex (| crore) 750.0 750.0 750.0
Capacity utilisation 60.0 70.0 80.0
Sales Volumes (in mt) 0.6 0.7 0.8
Gross realisation 6000.0 6600.0 7040.0
Net realisation 4260.0 4686.0 4998.4
Revenues (in | crore) 255.6 328.0 399.9
Operating cost/t 3400.0 3400.0 3400.0
Operating cost (in | crore) 204.0 238.0 272.0
EBITDA (in | crore) 51.6 90.0 127.9
EBITDA margin (%) 20.2 27.4 32.0
EBITDA/t 860.0 1286.0 1598.4
Depreciation (5.0%) 37.5 37.5 37.5
EBIT (in | crore) 14.1 52.5 90.4
RoCE (%) 1.9 7.0 12.0
Source: Industry,ICICIdirect.com Research
Page 8 ICICI Securities Ltd | Retail Equity Research
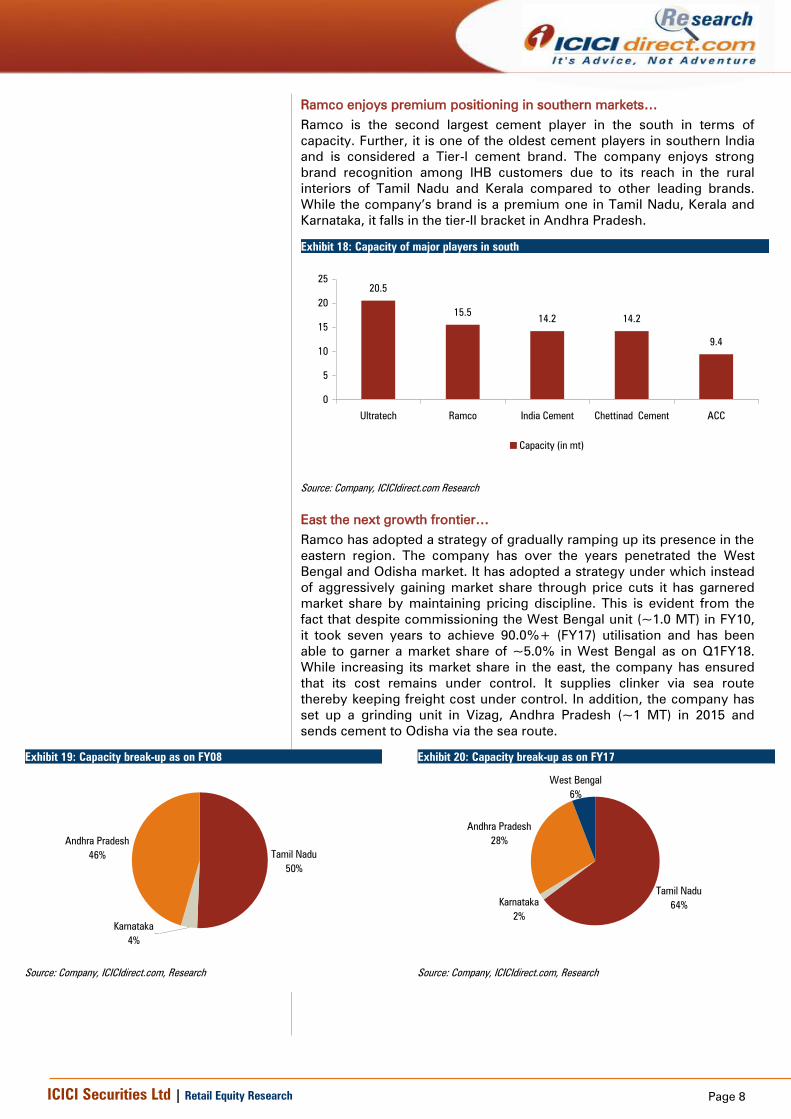
Ramco enjoys premium positioning in southern markets…
Ramco is the second largest cement player in the south in terms of
capacity. Further, it is one of the oldest cement players in southern India
and is considered a Tier-I cement brand. The company enjoys strong
brand recognition among IHB customers due to its reach in the rural
interiors of Tamil Nadu and Kerala compared to other leading brands.
While the company’s brand is a premium one in Tamil Nadu, Kerala and
Karnataka, it falls in the tier-II bracket in Andhra Pradesh.
Exhibit 18: Capacity of major players in south
20.5
15.514.2 14.2
9.4
0
5
10
15
20
25
Ultratech Ramco India Cement Chettinad Cement ACC
Capacity (in mt)
Source: Company, ICICIdirect.com Research
East the next growth frontier…
Ramco has adopted a strategy of gradually ramping up its presence in the
eastern region. The company has over the years penetrated the West
Bengal and Odisha market. It has adopted a strategy under which instead
of aggressively gaining market share through price cuts it has garnered
market share by maintaining pricing discipline. This is evident from the
fact that despite commissioning the West Bengal unit (~1.0 MT) in FY10,
it took seven years to achieve 90.0%+ (FY17) utilisation and has been
able to garner a market share of ~5.0% in West Bengal as on Q1FY18.
While increasing its market share in the east, the company has ensured
that its cost remains under control. It supplies clinker via sea route
thereby keeping freight cost under control. In addition, the company has
set up a grinding unit in Vizag, Andhra Pradesh (~1 MT) in 2015 and
sends cement to Odisha via the sea route.
Exhibit 19: Capacity break-up as on FY08
Andhra Pradesh
46%
Karnataka
4%
Tamil Nadu
50%
Source: Company, ICICIdirect.com, Research
Exhibit 20: Capacity break-up as on FY17
West Bengal
6%
Andhra Pradesh
28%
Karnataka
2%
Tamil Nadu
64%
Source: Company, ICICIdirect.com, Research

Page 9 ICICI Securities Ltd | Retail Equity Research
Exhibit 21: Clinker transport from Tamil Nadu to West Bengal via Sea route
Source: Ministry of External Affairs GOI, ICICIdirect.com Research
Exhibit 22: Cement transfer from Vizag to Odisha via Sea route
Source: Ministry of External Affairs GOI, ICICIdirect.com Research
Transportation by the sea route is cheaper by ~80%
compared to rail and ~90% compared to road transport.
Hence, despite longer lead distance, the company has
been able to remain EBITDA positive
Vizag, Andhra Pradesh
Paradip, Odisha
Karaikal, Tamil Nadu
Haldia Port, West Bengal

Page 10 ICICI Securities Ltd | Retail Equity Research
….Capacity expansion from 16.5 MT to 19.5 MT to further boost growth
The company plans to expand its capacity to 19.5 MT from the current
16.5 MT. Of the 3 MT capacity expansion, 2 MT capacity will be in the
East (1 MT each in West Bengal and Odisha) and 1 MT in the south (in
Andhra Pradesh). These projects are expected to be commissioned within
18 months. The total cost of expansion is expected to be | 1,095 crore.
Commissioning of grinding unit in east to remove capacity constraint and
further rationalise freight cost
Since its West Bengal (WB) capacity is fully utilised, Ramco plans to
expand it further to 2 MT from the current 1 MT. We believe this will help
gain further market share and also consolidate its position in the West
Bengal market. The company will also commission a new grinding unit at
Odisha of 1 MT, which will help rationalise freight cost. Currently, Ramco
is supplying cement to Odisha via the sea route. The commissioning of
the new grinding unit will enable the company to supply clinker to Odisha
via the sea route.
Capacity expansion in Andhra Pradesh to help tap growing market
Apart from expansion in the east, the company aims to tap the growing
opportunity in the Andhra Pradesh market (a key growth driver in the
southern market). It will increase its existing grinding unit capacity at
Vizag, Andhra Pradesh from ~1.0 MT to 2.0 MT.
Exhibit 23: Historical capacity addition trend
10.5 10.5 10.5
12.5 12.5 12.5 12.5 12.5
2.0 2.0 2.03.1 3.1
4.0 4.0 4.0
12.4 12.4 12.4
15.5 15.516.5 16.5 16.5
0.0
5.0
10.0
15.0
20.0
FY10 FY11 FY12 FY13 FY14 FY15 FY16 FY17
Intergrated unit Grinding unit Total
Source: Company, ICICIdirect.com, Research
Exhibit 24: Future capacity additions
Integrated unit FY17 FY18E FY19E FY20E
RR Nagar, Tamil Nadu 2.0 2.0 2.0 2.0
Alathiyur, Tamil Nadu 3.1 3.1 3.1 3.1
Ariyalur, Tamil Nadu 3.5 3.5 3.5 3.5
Chitradurga, Karnataka 0.3 0.3 0.3 0.3
Jayanthipuram, Andhra Pradesh 3.7 3.7 3.7 3.7
Total [A] 12.5 12.5 12.5 12.5
Grinding Unit
Uthiramerur, Tamil Nadu 0.5 0.5 0.5 0.5
Salem, Tamil Nadu 1.6 1.6 1.6 1.6
Kolaghat, West Bengal 1.0 1.0 1.5 2.0
Vizag, Andhra Pradesh 1.0 1.0 1.5 2.0
Odisha Grinding Unit 1.0
Total [B] 4.0 4.0 5.0 7.1
Total Capacity [A+B] 16.5 16.5 17.5 19.5
Source: Company, ICICIdirect.com, Research
Exhibit 25: Pre-expansion capacity mix
Tamil Nadu
64%Karnataka
2%
Andhra Pradesh
28%
West Bengal
6%
Source: Company, ICICIdirect.com, Research
Exhibit 26: Post-expansion capacity mix
Tamil Nadu
55%
Karnataka
1%
Andhra Pradesh
29%
West Bengal
10%
Odisha
5%
Source: Company, ICICIdirect.com, Research
Page 11 ICICI Securities Ltd | Retail Equity Research
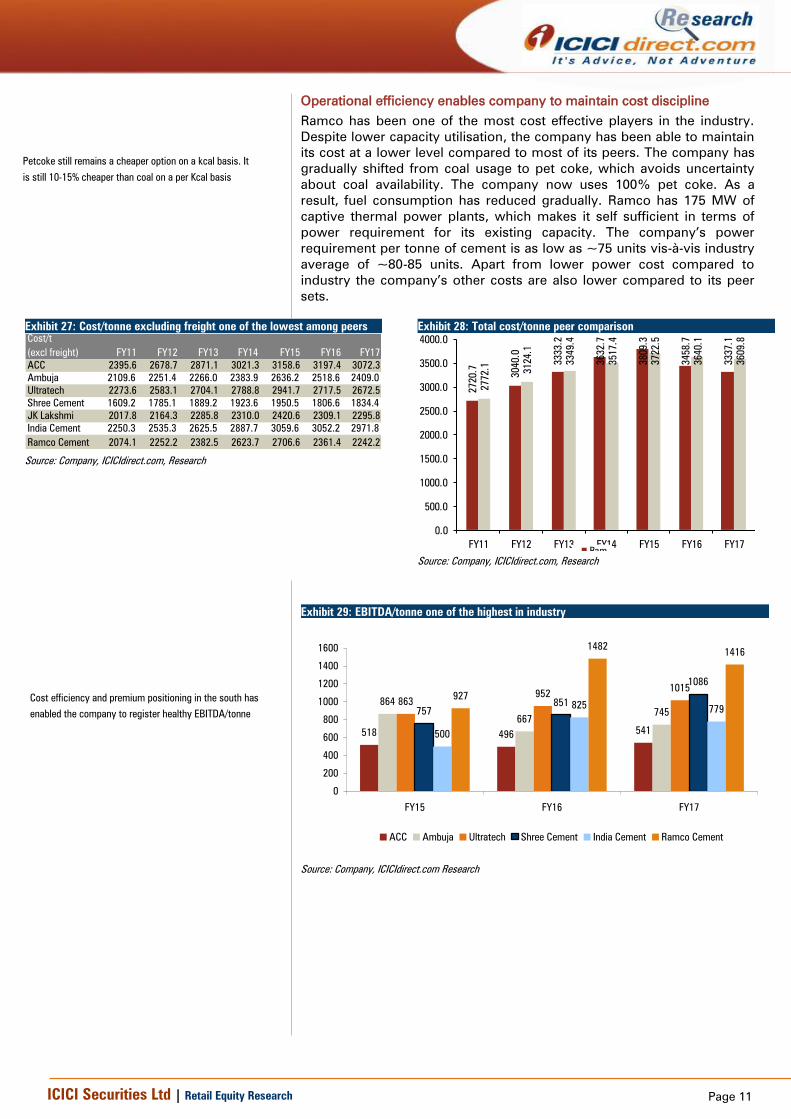
Operational efficiency enables company to maintain cost discipline
Ramco has been one of the most cost effective players in the industry.
Despite lower capacity utilisation, the company has been able to maintain
its cost at a lower level compared to most of its peers. The company has
gradually shifted from coal usage to pet coke, which avoids uncertainty
about coal availability. The company now uses 100% pet coke. As a
result, fuel consumption has reduced gradually. Ramco has 175 MW of
captive thermal power plants, which makes it self sufficient in terms of
power requirement for its existing capacity. The company’s power
requirement per tonne of cement is as low as ~75 units vis-à-vis industry
average of ~80-85 units. Apart from lower power cost compared to
industry the company’s other costs are also lower compared to its peer
sets.
Exhibit 27: Cost/tonne excluding freight one of the lowest among peers
Cost/t
(excl freight) FY11 FY12 FY13 FY14 FY15 FY16 FY17
ACC 2395.6 2678.7 2871.1 3021.3 3158.6 3197.4 3072.3
Ambuja 2109.6 2251.4 2266.0 2383.9 2636.2 2518.6 2409.0
Ultratech 2273.6 2583.1 2704.1 2788.8 2941.7 2717.5 2672.5
Shree Cement 1609.2 1785.1 1889.2 1923.6 1950.5 1806.6 1834.4
JK Lakshmi 2017.8 2164.3 2285.8 2310.0 2420.6 2309.1 2295.8
India Cement 2250.3 2535.3 2625.5 2887.7 3059.6 3052.2 2971.8
Ramco Cement 2074.1 2252.2 2382.5 2623.7 2706.6 2361.4 2242.2
Source: Company, ICICIdirect.com, Research
Exhibit 28: Total cost/tonne peer comparison
2720.7
3040.0
3333.2
3632.7
3809.3
3458.7
3337.1
2772.1
3124.1
3349.4
3517.4
3722.5
3640.1
3609.8
0.0
500.0
1000.0
1500.0
2000.0
2500.0
3000.0
3500.0
4000.0
FY11 FY12 FY13 FY14 FY15 FY16 FY17Ram…
Source: Company, ICICIdirect.com, Research
Exhibit 29: EBITDA/tonne one of the highest in industry
518 496541
864
667745
863
9521015
757
851
1086
500
825779
927
14821416
0
200
400
600
800
1000
1200
1400
1600
FY15 FY16 FY17
ACC Ambuja Ultratech Shree Cement India Cement Ramco Cement
Source: Company, ICICIdirect.com Research
Petcoke still remains a cheaper option on a kcal basis. It
is still 10-15% cheaper than coal on a per Kcal basis
Cost efficiency and premium positioning in the south has
enabled the company to register healthy EBITDA/tonne

Page 12 ICICI Securities Ltd | Retail Equity Research
Ramco shows capital prudence while incurring capex
In the table below, we attempt to arrive at capex efficiency by measuring
capex required per tonne of cement. Over the years, Ramco has
expanded its capacity at a reasonable cost and shown capex efficiency by
incurring a cost/tonne of | 4,728, which is more or less in line with
industry average cost per tonne.
Exhibit 30: Industry wide capex efficiency
FY17 Gross Block Capacity
Gross Block
per tonne
EBITDA/
Gross Block EBITDA/t
Capacity
utilisation
Shree Cement 10300 29.3 3515 23.0 1086.1 75.0
Acc 13936 33.2 4197 9.3 540.5 71.0
Ambuja 12616 29.7 4248 12.5 745.4 71.0
Ramco Cement 7802 16.5 4729 15.1 1415.6 50.4
JK lakshmi 4612 9.2 5013 7.9 459.7 83.0
India Cements 7502 15.0 5018 11.5 779.0 73.0
Ultratech (ex JP) 36364 67.9 5356 13.7 1015.5 73.0
Ultratech (incl JP) 52734 89.1 5919
Source: Company, ICICIdirect.com Research
Healthy cash flow management helps keeping balance sheet light despite
capacity expansion
During FY10-15, the southern market witnessed a downturn. However,
despite this weak demand, Ramco was able to make profit at the net level.
Further, cash flow generated in FY10-15 was efficiently utilised to pay off
debt and incurring minimal capex. This has helped the company reduce
its D/E from 1.6x in FY10 to 0.4x in FY17.
With the lower D/E ratio and operating cash flow generation of ~ | 3,500
crore over the next three years, a further expansion will not create any
balance sheet burden. In addition, we expect the D/E ratio to further come
down to 0.2x by FY20E.
Exhibit 31: D/E ratio trend
1.61.6
1.3
1.11.2
1.0
0.7
0.4 0.4
0.3
0.2
0.0
0.2
0.4
0.6
0.8
1.0
1.2
1.4
1.6
1.8
FY10 FY11 FY12 FY13 FY14 FY15 FY16 FY17 FY18E FY19E FY20E
Source: Company, ICICIdirect.com Research

Page 13ICICI Securities Ltd | Retail Equity Research
Financials Revenues to grow at 12.2% CAGR in FY17-20E…
Ramco’s revenues have grown at a modest pace of CAGR 2.4% in FY14-17 mainly due to weak market condition in the south and lower utilisation in the east. However, in FY17, the revenues increased 10.5% YoY due to a pick-up in cement demand and increased market share in the eastern region. Going forward, we expect revenues to increase at a CAGR of 12.2% in FY17-20E mainly led by capacity expansion, revival in the rural economy and increased government spending.
Exhibit 32: Revenue trend…
3949.54307.1
4851.4
5574.9
500.0
1500.0
2500.0
3500.0
4500.0
5500.0
6500.0
FY17 FY18E FY19E FY20E
CAGR of 12.2%
Source: Company, ICICIdirect.com Research
EBITDA to grow at 9.6% CAGR over FY17-20E…
EBITDA is expected to increase at a CAGR of 9.6% in FY17-20E mainly led by higher topline growth. A sharp rise in petcoke prices and higher lead distance would impact the EBITDA margin in FY18E. However, we expect the EBITDA margin to improve from FY18E onwards mainly led by stabilisation of power costs and freight costs on commissioning of grinding units.
Exhibit 33: [EBITDA & EBITDA margin trend...
1176.4 1165.11326.2
1548.4
500.0
1000.0
1500.0
2000.0
FY17 FY18E FY19E FY20E
CAGR of 9.6%
Source: Company, ICICIdirect.com Research
We expect revenues to grow at a CAGR of 12.2% to
| 5,574.9 crore in FY17-20E
We expect a 72 bps expansion in margin to 27.8% in FY20E
from 27.1% in FY18E

Page 14 ICICI Securities Ltd | Retail Equity Research
PAT to grow at 10.3% CAGR in FY17-20E…
Going forward, we expect the bottomline to grow at 10.3% CAGR to
| 870.3 crore in FY17-20E on the back of robust topline growth. Further,
over FY18E-20E we expect PAT to increase at a CAGR of 20.2% on the
back of an improving operating performance and lower interest expenses.
Exhibit 34: PAT growth trend…
649.3
602.3
697.6
870.3
200.0
300.0
400.0
500.0
600.0
700.0
800.0
900.0
1000.0
FY17 FY18E FY19E FY20E
Source: Company, ICICIdirect.com Research
Return ratios to improve from FY18E onwards…
Given the improvement in EBITDA margins and strong bottomline show,
we expect return ratios to improve significantly from FY18E onwards. We
anticipate the RoCE and RoE will improve significantly from 11.1%, 14.9%
to 13.6%, 16.8% in FY18E-20E, respectively. Despite operating at a low
capacity utilisation, Ramco’s RoEs are higher than peers.
Exhibit 35: Return ratios trend…
12.7
11.1
11.9
13.617.4
14.9
15.4
16.8
0.0
2.0
4.0
6.0
8.0
10.0
12.0
14.0
16.0
FY17 FY18E FY19E FY20E
13.0
13.5
14.0
14.5
15.0
15.5
16.0
16.5
17.0
17.5
18.0
RoCE RoE
Source: Company, ICICIdirect.com Research
We expect the bottomline to grow at 10.3% CAGR in FY17-
20E on the back of robust topline growth
Despite operating in low capacity utilisation Ramco’s
RoEs are higher than peers
RoE FY16 FY17
ACC 8.9 8.5
Ambuja 7.8 9.4
Ultratech 11.3 11.0
Shree Cement 16.7 17.4
India Cement 2.6 3.3
Ramco Cement 17.5 17.4
Source: Company, ICICIdirect.com Research
Page 15 ICICI Securities Ltd | Retail Equity Research
Risks & Concerns
Capacity expansion in east to outpace demand…
Although demand in the east is expected to grow at 7.8% per annum,
capacity addition is expected to grow at a CAGR of 8.2% per annum. We
believe this will keep utilisation levels lower and also limit price hikes in
the region. Due to higher lead distance, Ramco operates at a lower
margin compared to its other markets. Hence, any deterioration in
demand in the region or adverse price movements could hamper the
company’s revenue and profitability.
Sand mining issues in Tamil Nadu may impact volumes…
Despite capacity expansion in the east, we believe the company would
still generate more than 80% of its sales from the southern region. The
southern region is historically plagued by an overcapacity situation. In
addition, a sand mining issue in Tamil Nadu (Ramco sells 59% of its
volumes in Tamil Nadu) could create headwinds in growth in the near
term. We assume lower growth in Tamil Nadu (of 5% in FY18E) but if the
same persists over a longer term it could adversely impact the company’s
growth prospects.
Restricting use of pet coke
The Supreme Court-appointed India’s Environmental Pollution Control
Authority (EPCA) has recommended ban on petcoke import into India and
a ban on the use of petcoke in all industries other than cement. Most of
the players in the cement industry are using 80.0% pet coke in their fuel
mix. If the usage of pet coke is banned in cement industry as well then it
will lead to higher power cost for the entire industry. Pet coke is still 10-
15% cheaper than coal on per KCAL basis, if the ban is imposed on
cement industry then it would result in ~| 100/t increase in power cost.
Delay in expansion may dent growth, return ratios…
The company is planning to increase its capacity by 3 MT at a cost of
| 1095 crore (US$60). Out of the 3 MT, 2 MT is brownfield while 1 MT
expansion at Odisha is greenfield. These projects are expected to be
commissioned in 18 months from the date of obtaining necessary
statutory clearances. Hence, any delay in statutory clearances could lead
to cost overrun and also hamper growth in the near to medium term.
Page 16 ICICI Securities Ltd | Retail Equity Research
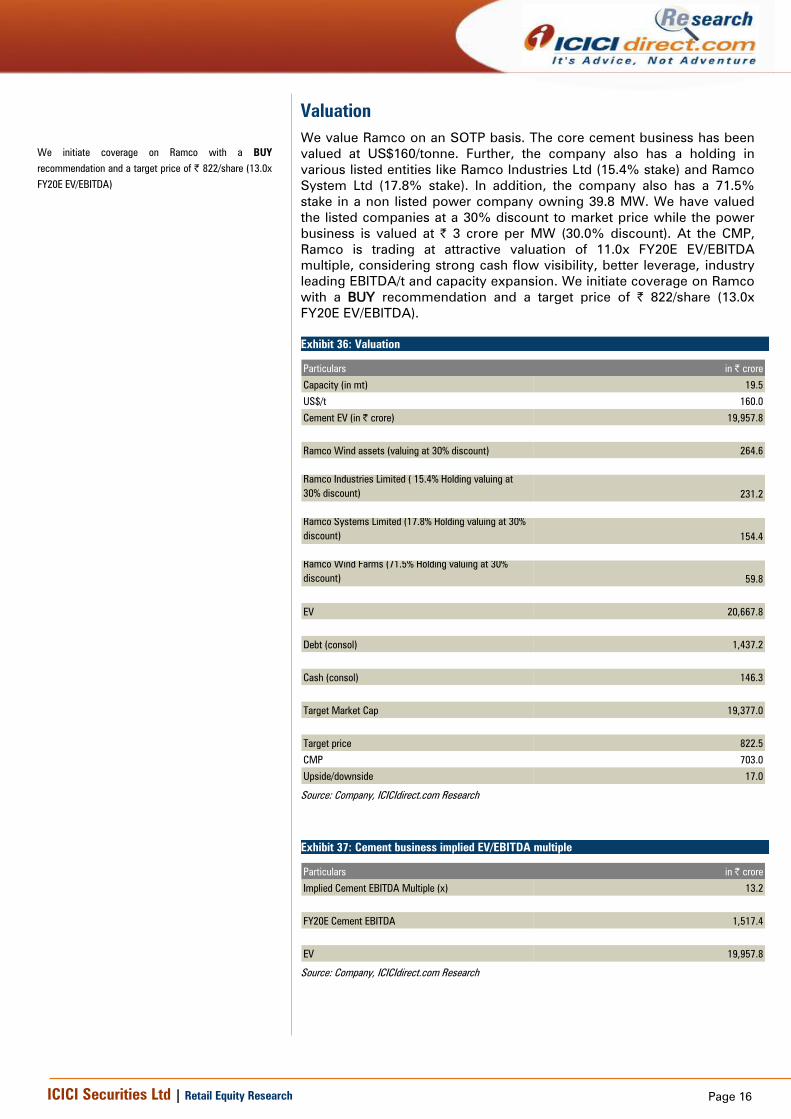
Valuation
We value Ramco on an SOTP basis. The core cement business has been
valued at US$160/tonne. Further, the company also has a holding in
various listed entities like Ramco Industries Ltd (15.4% stake) and Ramco
System Ltd (17.8% stake). In addition, the company also has a 71.5%
stake in a non listed power company owning 39.8 MW. We have valued
the listed companies at a 30% discount to market price while the power
business is valued at | 3 crore per MW (30.0% discount). At the CMP,
Ramco is trading at attractive valuation of 11.0x FY20E EV/EBITDA
multiple, considering strong cash flow visibility, better leverage, industry
leading EBITDA/t and capacity expansion. We initiate coverage on Ramco
with a BUY recommendation and a target price of | 822/share (13.0x
FY20E EV/EBITDA).
Exhibit 36: Valuation
Particulars in | crore
Capacity (in mt) 19.5
US$/t 160.0
Cement EV (in | crore) 19,957.8
Ramco Wind assets (valuing at 30% discount) 264.6
Ramco Industries Limited ( 15.4% Holding valuing at
30% discount) 231.2
Ramco Systems Limited (17.8% Holding valuing at 30%
discount) 154.4
Ramco Wind Farms (71.5% Holding valuing at 30%
discount) 59.8
EV 20,667.8
Debt (consol) 1,437.2
Cash (consol) 146.3
Target Market Cap 19,377.0
Target price 822.5
CMP 703.0
Upside/downside 17.0
Source: Company, ICICIdirect.com Research
Exhibit 37: Cement business implied EV/EBITDA multiple
Particulars in | crore
Implied Cement EBITDA Multiple (x) 13.2
FY20E Cement EBITDA 1,517.4
EV 19,957.8
Source: Company, ICICIdirect.com Research
We initiate coverage on Ramco with a BUY
recommendation and a target price of | 822/share (13.0x
FY20E EV/EBITDA)

Page 17 ICICI Securities Ltd | Retail Equity Research
Exhibit 38: Peer valuation...
CMP
(|) FY17 FY18E FY19E FY17 FY18E FY19E FY17 FY18E FY19E FY17 FY18E FY19E
ACC* 1,690.0 31,761.9 39.0 58.8 68.1 23.2 16.9 14.4 162.6 142.1 141.2 8.5 11.9 12.6
Ambuja Cement* 267.0 53,016.9 4.9 6.5 6.9 22.8 17.6 15.3 187.1 173.7 173.7 5.1 6.6 6.8
UltraTech Cem 3,994.0 109,595.4 96.3 91.5 130.8 21.8 21.0 14.8 251.6 222.2 208.7 11.0 9.8 12.6
Shree Cement 17,800.0 61,944.0 384.8 455.1 537.6 25.1 20.4 16.3 360.3 345.9 277.1 17.4 17.3 17.3
India Cement 176.0 5,406.7 5.4 7.3 11.1 9.7 9.2 7.5 89.9 90.2 81.4 3.3 4.3 6.1
Industry Average N.A N.A N.A N.A N.A 20.5 17.0 13.7 210.3 194.8 176.4 9.0 10.0 11.1
Ramco Cement 703.0 16,736.8 27.3 25.5 29.6 15.3 15.7 13.6 182.1 184.5 171.9 17.4 14.9 15.4
EV/Tonne (US$) RoE
Company TP (|)
EPS (|) EV/EBITDA (x)
Source: Company, ICICIdirect.com Research, *CY16
Exhibit 39: One year forward EV/EBITDA
1000.0
5000.0
9000.0
13000.0
17000.0
21000.0
25000.0
Sep-10
Mar-11
Sep-11
Mar-12
Sep-12
Mar-13
Sep-13
Mar-14
Sep-14
Mar-15
Sep-15
Mar-16
Sep-16
Mar-17
Sep-17
EV 18.0x 15.0x 12.0x 10.0x 8.0x 6.0x
Source: Company, ICICIdirect.com Research
Exhibit 40: One year forward EV/tonne
0
1000
2000
3000
4000
5000
Sep-10
Mar-11
Sep-11
Mar-12
Sep-12
Mar-13
Sep-13
Mar-14
Sep-14
Mar-15
Sep-15
Mar-16
Sep-16
Mar-17
Sep-17
Million $
EV $240 $200 $175 $125 $80
Source: Company, ICICIdirect.com Research

Page 18 ICICI Securities Ltd | Retail Equity Research
Tables
Exhibit 41: Profit & loss account
(Year-end March) FY17 FY18E FY19E FY20E
Total operating Income 3,949.5 4,307.1 4,851.4 5,574.9
Growth (%) 10.5 9.1 12.6 14.9
Raw material cost 515.0 534.7 603.4 692.8
Employee Expenses 277.7 300.6 327.7 376.8
Power, Oil & Fuel 518.5 698.6 775.8 888.4
Freight cost 909.9 1021.6 1185.6 1340.9
Other Expenses 552.1 586.5 632.7 727.6
Total Operating Exp. 2,773.1 3,142.0 3,525.2 4,026.6
EBITDA 1,176.4 1,165.1 1,326.2 1,548.4
Growth (%) 9.8 -1.0 13.8 16.8
Depreciation 265.5 286.7 326.3 345.1
Interest 103.5 112.6 108.1 81.3
Other Income 42.8 37.6 38.4 38.4
Exceptional items 0.0 0.0 0.0 0.0
PBT 850.1 803.5 930.2 1,160.3
Total Tax 200.9 201.2 232.5 290.1
PAT 649.3 602.3 697.6 870.3
Adjusted PAT 649.3 602.3 697.6 870.3
Growth (%) 19.8 -7.2 15.8 24.7
EPS (|) 27.3 25.5 29.6 36.9
Source: Company, ICICIdirect.com Research
Exhibit 42: Balance sheet
(Year-end March) FY17 FY18E FY19E FY20E
Liabilities
Equity Capital 23.8 23.6 23.6 23.6
Reserve and Surplus 3,717.7 4,009.7 4,494.3 5,152.5
Total Shareholders funds 3,741.5 4,033.2 4,517.9 5,176.1
Total Debt 1,424.8 1,613.3 1,355.4 776.4
Deferred Tax Liability 728.1 796.8 897.5 1,031.4
Other Non Current Liabilities 15.1 15.8 16.3 17.1
Total Liabilities 5,909.6 6,459.1 6,787.1 7,000.9
Assets
Gross Block 7,802.1 8,172.4 8,672.4 9,922.4
Less: Acc Depreciation 2,859.7 3,146.4 3,472.7 3,817.8
Net Block 4,942.4 5,026.0 5,199.7 6,104.6
Capital WIP 120.3 600.0 750.0 0.0
Total Fixed Assets 5,062.6 5,626.0 5,949.7 6,104.6
Investments 389.0 389.0 389.0 389.0
Inventory 575.4 627.8 707.1 812.6
Debtors 554.9 605.1 681.6 783.3
Loans and Advances 27.3 30.1 34.0 39.0
Other Current Assets 281.6 305.8 344.4 395.8
Cash 118.1 73.8 31.2 28.3
Total Current Assets 1,557.3 1,642.6 1,798.3 2,059.0
Creditors 255.8 278.5 313.7 360.5
Other Current Liability 843.6 919.9 1,036.2 1,191.2
Total Current Liabilities 1,099.4 1,198.4 1,349.9 1,551.6
Net Current Assets 458.0 444.2 448.5 507.4
Application of Funds 5,909.6 6,459.1 6,787.1 7,000.9
Source: Company, ICICIdirect.com Research

Page 19 ICICI Securities Ltd | Retail Equity Research
Exhibit 43: Cash flow statement
(Year-end March) FY17 FY18E FY19E FY20E
Profit after Tax 649.3 602.3 697.6 870.3
Add: Depreciation 265.5 286.7 326.3 345.1
(Inc)/dec in Current Assets -58.8 -117.6 -179.2 -238.2
Inc/(dec) in CL and Provisions 146.6 99.1 151.5 201.8
CF from operating activities 1,085.0 1,002.7 1,148.1 1,331.1
(Inc)/dec in investment 25.4 37.6 38.4 38.4
(Inc)/dec in Fixed Assets -280.2 -850.0 -650.0 -500.0
CF from investing activities -254.7 -812.3 -611.6 -461.6
Issue/(Buy back) of Equity -1.2 -167.7 0.0 0.0
Inc/(dec) in loan funds -698.2 188.5 -257.9 -578.9
Dividend paid & dividend tax 0.0 -142.8 -213.0 -212.0
Interest paid -103.5 -112.6 -108.1 -81.3
CF from financing activities -803.0 -234.6 -579.0 -872.3
Net Cash flow 27.3 -44.3 -42.5 -2.9
Opening Cash 90.8 118.1 73.8 31.2
Closing Cash 118.1 73.8 31.2 28.3
Source: Company, ICICIdirect.com Research
Exhibit 44: Ratio Analysis
(Year-end March) FY17 FY18E FY19E FY20E
Per share data (|)
Adjusted EPS 27.3 25.5 29.6 36.9
Cash EPS 38.4 37.6 43.5 51.6
BV 157.2 170.4 191.8 219.7
DPS 0.0 6.0 9.0 9.0
Cash Per Share 5.0 3.1 1.3 1.2
Operating Ratios (%)
EBITDA Margin 29.8 27.1 27.3 27.8
PAT Margin 16.4 14.0 14.4 15.6
Inventory days 53.2 53.2 53.2 53.2
Debtor days 51.3 51.3 51.3 51.3
Creditor days 23.6 23.6 23.6 23.6
Return Ratios (%)
RoE 17.4 14.9 15.4 16.8
RoCE 12.7 11.1 11.9 13.6
RoIC 12.6 11.8 12.8 13.1
Valuation Ratios (x)
P/E 25.8 27.6 23.7 19.0
EV / EBITDA 15.3 15.7 13.6 11.3
EV / Net Sales 4.6 4.2 3.7 3.1
Market Cap / Sales 4.2 3.9 3.4 3.0
Price to Book Value 4.5 4.1 3.7 3.2
Solvency Ratios
Debt/EBITDA 1.2 1.4 1.0 0.5
Debt / Equity 0.4 0.4 0.3 0.2
Current Ratio 1.3 1.3 1.3 1.3
Quick Ratio 0.8 0.8 0.8 0.8
Source: Company, ICICIdirect.com Research
Page 20 ICICI Securities Ltd | Retail Equity Research
RATING RATIONALE
ICICIdirect.com endeavours to provide objective opinions and recommendations. ICICIdirect.com assigns
ratings to its stocks according to their notional target price vs. current market price and then categorises them
as Strong Buy, Buy, Hold and Sell. The performance horizon is two years unless specified and the notional
target price is defined as the analysts' valuation for a stock.
Strong Buy: >15%/20% for large caps/midcaps, respectively, with high conviction;
Buy: >10%/15% for large caps/midcaps, respectively;
Hold: Up to +/-10%;
Sell: -10% or more;
Pankaj Pandey Head – Research [email protected]
ICICIdirect.com Research Desk,
ICICI Securities Limited,
1st Floor, Akruti Trade Centre,
Road No 7, MIDC,
Andheri (East)
Mumbai – 400 093

Page 21 ICICI Securities Ltd | Retail Equity Research
ANALYST CERTIFICATION
We /I, Rashesh Shah, CA, and Devang Bhatt, PGDBM Research Analysts, authors and the names subscribed to this report, hereby certify that all of the views expressed in this research report accurately
reflect our views about the subject issuer(s) or securities. We also certify that no part of our compensation was, is, or will be directly or indirectly related to the specific recommendation(s) or view(s) in this
report.
Terms & conditions and other disclosures:
ICICI Securities Limited (ICICI Securities) is a full-service, integrated investment banking and is, inter alia, engaged in the business of stock brokering and distribution of financial products. ICICI Securities
Limited is a Sebi registered Research Analyst with Sebi Registration Number – INH000000990. ICICI Securities is a wholly-owned subsidiary of ICICI Bank which is India’s largest private sector bank and has
its various subsidiaries engaged in businesses of housing finance, asset management, life insurance, general insurance, venture capital fund management, etc. (“associates”), the details in respect of which
are available on www.icicibank.com.
ICICI Securities is one of the leading merchant bankers/ underwriters of securities and participate in virtually all securities trading markets in India. We and our associates might have investment banking
and other business relationship with a significant percentage of companies covered by our Investment Research Department. ICICI Securities generally prohibits its analysts, persons reporting to analysts
and their relatives from maintaining a financial interest in the securities or derivatives of any companies that the analysts cover.
The information and opinions in this report have been prepared by ICICI Securities and are subject to change without any notice. The report and information contained herein is strictly confidential and
meant solely for the selected recipient and may not be altered in any way, transmitted to, copied or distributed, in part or in whole, to any other person or to the media or reproduced in any form, without
prior written consent of ICICI Securities. While we would endeavour to update the information herein on a reasonable basis, ICICI Securities is under no obligation to update or keep the information current.
Also, there may be regulatory, compliance or other reasons that may prevent ICICI Securities from doing so. Non-rated securities indicate that rating on a particular security has been suspended
temporarily and such suspension is in compliance with applicable regulations and/or ICICI Securities policies, in circumstances where ICICI Securities might be acting in an advisory capacity to this
company, or in certain other circumstances.
This report is based on information obtained from public sources and sources believed to be reliable, but no independent verification has been made nor is its accuracy or completeness guaranteed. This
report and information herein is solely for informational purpose and shall not be used or considered as an offer document or solicitation of offer to buy or sell or subscribe for securities or other financial
instruments. Though disseminated to all the customers simultaneously, not all customers may receive this report at the same time. ICICI Securities will not treat recipients as customers by virtue of their
receiving this report. Nothing in this report constitutes investment, legal, accounting and tax advice or a representation that any investment or strategy is suitable or appropriate to your specific
circumstances. The securities discussed and opinions expressed in this report may not be suitable for all investors, who must make their own investment decisions, based on their own investment
objectives, financial positions and needs of specific recipient. This may not be taken in substitution for the exercise of independent judgment by any recipient. The recipient should independently evaluate
the investment risks. The value and return on investment may vary because of changes in interest rates, foreign exchange rates or any other reason. ICICI Securities accepts no liabilities whatsoever for any
loss or damage of any kind arising out of the use of this report. Past performance is not necessarily a guide to future performance. Investors are advised to see Risk Disclosure Document to understand the
risks associated before investing in the securities markets. Actual results may differ materially from those set forth in projections. Forward-looking statements are not predictions and may be subject to
change without notice.
ICICI Securities or its associates might have managed or co-managed public offering of securities for the subject company or might have been mandated by the subject company for any other assignment
in the past twelve months.
ICICI Securities or its associates might have received any compensation from the companies mentioned in the report during the period preceding twelve months from the date of this report for services in
respect of managing or co-managing public offerings, corporate finance, investment banking or merchant banking, brokerage services or other advisory service in a merger or specific transaction.
ICICI Securities or its associates might have received any compensation for products or services other than investment banking or merchant banking or brokerage services from the companies mentioned
in the report in the past twelve months.
ICICI Securities encourages independence in research report preparation and strives to minimize conflict in preparation of research report. ICICI Securities or its associates or its analysts did not receive any
compensation or other benefits from the companies mentioned in the report or third party in connection with preparation of the research report. Accordingly, neither ICICI Securities nor Research Analysts
and their relatives have any material conflict of interest at the time of publication of this report.
It is confirmed that Rashesh Shah, CA, and Devang Bhatt, PGDBM Research Analysts of this report have not received any compensation from the companies mentioned in the report in the preceding
twelve months.
Compensation of our Research Analysts is not based on any specific merchant banking, investment banking or brokerage service transactions.
ICICI Securities or its subsidiaries collectively or Research Analysts or their relatives do not own 1% or more of the equity securities of the Company mentioned in the report as of the last day of the month
preceding the publication of the research report.
Since associates of ICICI Securities are engaged in various financial service businesses, they might have financial interests or beneficial ownership in various companies including the subject
company/companies mentioned in this report.
It is confirmed that Rashesh Shah, CA, and Devang Bhatt, PGDBM Research Analysts do not serve as an officer, director or employee of the companies mentioned in the report.
ICICI Securities may have issued other reports that are inconsistent with and reach different conclusion from the information presented in this report.
Neither the Research Analysts nor ICICI Securities have been engaged in market making activity for the companies mentioned in the report.
We submit that no material disciplinary action has been taken on ICICI Securities by any Regulatory Authority impacting Equity Research Analysis activities.
This report is not directed or intended for distribution to, or use by, any person or entity who is a citizen or resident of or located in any locality, state, country or other jurisdiction, where such distribution,
publication, availability or use would be contrary to law, regulation or which would subject ICICI Securities and affiliates to any registration or licensing requirement within such jurisdiction. The securities
described herein may or may not be eligible for sale in all jurisdictions or to certain category of investors. Persons in whose possession this document may come are required to inform themselves of and
to observe such restriction.