Embed Size (px)
Citation preview
November 6, 2015
ICICI Securities Ltd | Retail Equity Research
Result Update
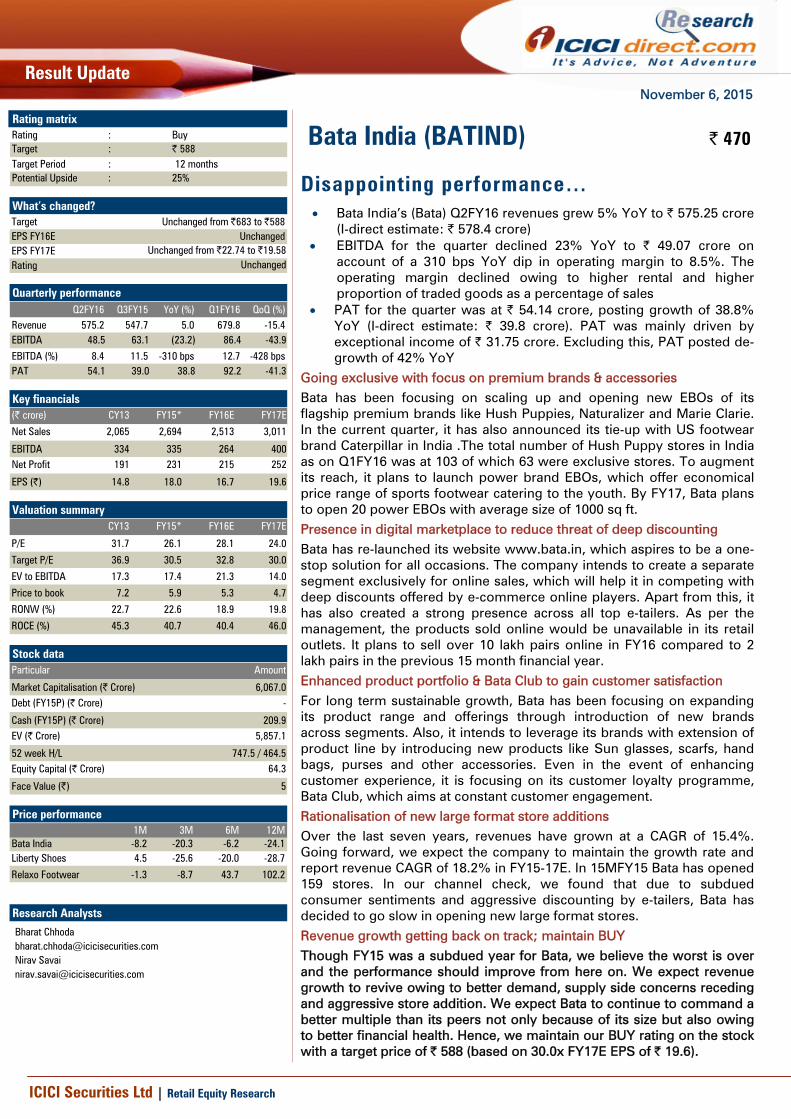
Disappointing performance… • Bata India’s (Bata) Q2FY16 revenues grew 5% YoY to | 575.25 crore
(I-direct estimate: | 578.4 crore) • EBITDA for the quarter declined 23% YoY to | 49.07 crore on
account of a 310 bps YoY dip in operating margin to 8.5%. The operating margin declined owing to higher rental and higher proportion of traded goods as a percentage of sales
• PAT for the quarter was at | 54.14 crore, posting growth of 38.8% YoY (I-direct estimate: | 39.8 crore). PAT was mainly driven by exceptional income of | 31.75 crore. Excluding this, PAT posted de-growth of 42% YoY
Going exclusive with focus on premium brands & accessories Bata has been focusing on scaling up and opening new EBOs of its flagship premium brands like Hush Puppies, Naturalizer and Marie Clarie. In the current quarter, it has also announced its tie-up with US footwear brand Caterpillar in India .The total number of Hush Puppy stores in India as on Q1FY16 was at 103 of which 63 were exclusive stores. To augment its reach, it plans to launch power brand EBOs, which offer economical price range of sports footwear catering to the youth. By FY17, Bata plans to open 20 power EBOs with average size of 1000 sq ft. Presence in digital marketplace to reduce threat of deep discounting Bata has re-launched its website www.bata.in, which aspires to be a one-stop solution for all occasions. The company intends to create a separate segment exclusively for online sales, which will help it in competing with deep discounts offered by e-commerce online players. Apart from this, it has also created a strong presence across all top e-tailers. As per the management, the products sold online would be unavailable in its retail outlets. It plans to sell over 10 lakh pairs online in FY16 compared to 2 lakh pairs in the previous 15 month financial year. Enhanced product portfolio & Bata Club to gain customer satisfaction For long term sustainable growth, Bata has been focusing on expanding its product range and offerings through introduction of new brands across segments. Also, it intends to leverage its brands with extension of product line by introducing new products like Sun glasses, scarfs, hand bags, purses and other accessories. Even in the event of enhancing customer experience, it is focusing on its customer loyalty programme, Bata Club, which aims at constant customer engagement. Rationalisation of new large format store additions Over the last seven years, revenues have grown at a CAGR of 15.4%. Going forward, we expect the company to maintain the growth rate and report revenue CAGR of 18.2% in FY15-17E. In 15MFY15 Bata has opened 159 stores. In our channel check, we found that due to subdued consumer sentiments and aggressive discounting by e-tailers, Bata has decided to go slow in opening new large format stores. Revenue growth getting back on track; maintain BUY Though FY15 was a subdued year for Bata, we believe the worst is over and the performance should improve from here on. We expect revenue growth to revive owing to better demand, supply side concerns receding and aggressive store addition. We expect Bata to continue to command a better multiple than its peers not only because of its size but also owing to better financial health. Hence, we maintain our BUY rating on the stock with a target price of | 588 (based on 30.0x FY17E EPS of | 19.6).
Bata India (BATIND) | 470 Rating matrix Rating : BuyTarget : | 588Target Period : 12 monthsPotential Upside : 25%
What’s changed? Target Unchanged from |683 to |588EPS FY16E UnchangedEPS FY17E Unchanged from |22.74 to |19.58Rating Unchanged
Quarterly performance
Q2FY16 Q3FY15 YoY (%) Q1FY16 QoQ (%)Revenue 575.2 547.7 5.0 679.8 -15.4EBITDA 48.5 63.1 (23.2) 86.4 -43.9
EBITDA (%) 8.4 11.5 -310 bps 12.7 -428 bpsPAT 54.1 39.0 38.8 92.2 -41.3
Key financials (| crore) CY13 FY15* FY16E FY17E
Net Sales 2,065 2,694 2,513 3,011
EBITDA 334 335 264 400 Net Profit 191 231 215 252
EPS (|) 14.8 18.0 16.7 19.6 Valuation summary
CY13 FY15* FY16E FY17E
P/E 31.7 26.1 28.1 24.0
Target P/E 36.9 30.5 32.8 30.0
EV to EBITDA 17.3 17.4 21.3 14.0
Price to book 7.2 5.9 5.3 4.7
RONW (%) 22.7 22.6 18.9 19.8
ROCE (%) 45.3 40.7 40.4 46.0 Stock data Particular Amount
Market Capitalisation (| Crore) 6,067.0 Debt (FY15P) (| Crore) -
Cash (FY15P) (| Crore) 209.9 EV (| Crore) 5,857.1
52 week H/L 747.5 / 464.5 Equity Capital (| Crore) 64.3
Face Value (|) 5 Price performance
1M 3M 6M 12MBata India -8.2 -20.3 -6.2 -24.1Liberty Shoes 4.5 -25.6 -20.0 -28.7
Relaxo Footwear -1.3 -8.7 43.7 102.2 Research Analysts
Bharat Chhoda [email protected] Nirav Savai [email protected]
ICICI Securities Ltd | Retail Equity Research Page 2
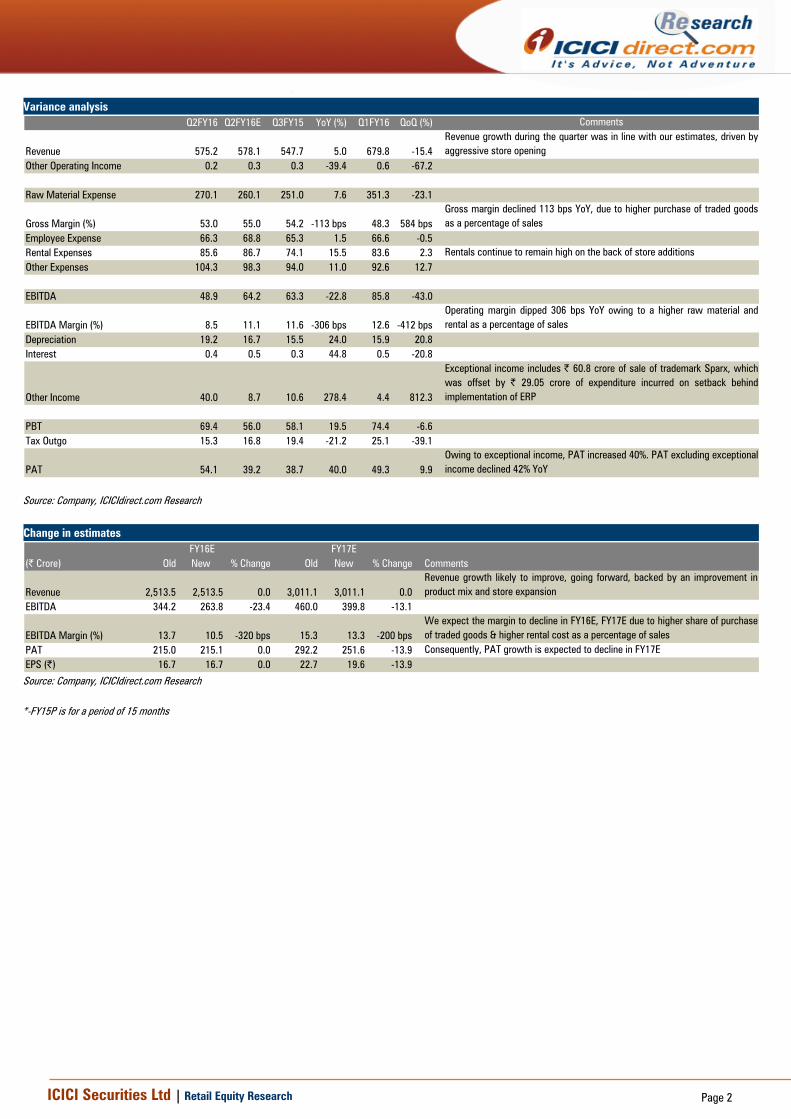
Variance analysis Q2FY16 Q2FY16E Q3FY15 YoY (%) Q1FY16 QoQ (%) Comments
Revenue 575.2 578.1 547.7 5.0 679.8 -15.4Revenue growth during the quarter was in line with our estimates, driven byaggressive store opening
Other Operating Income 0.2 0.3 0.3 -39.4 0.6 -67.2
Raw Material Expense 270.1 260.1 251.0 7.6 351.3 -23.1
Gross Margin (%) 53.0 55.0 54.2 -113 bps 48.3 584 bpsGross margin declined 113 bps YoY, due to higher purchase of traded goodsas a percentage of sales
Employee Expense 66.3 68.8 65.3 1.5 66.6 -0.5Rental Expenses 85.6 86.7 74.1 15.5 83.6 2.3 Rentals continue to remain high on the back of store additionsOther Expenses 104.3 98.3 94.0 11.0 92.6 12.7
EBITDA 48.9 64.2 63.3 -22.8 85.8 -43.0
EBITDA Margin (%) 8.5 11.1 11.6 -306 bps 12.6 -412 bpsOperating margin dipped 306 bps YoY owing to a higher raw material andrental as a percentage of sales
Depreciation 19.2 16.7 15.5 24.0 15.9 20.8Interest 0.4 0.5 0.3 44.8 0.5 -20.8
Other Income 40.0 8.7 10.6 278.4 4.4 812.3
Exceptional income includes | 60.8 crore of sale of trademark Sparx, whichwas offset by | 29.05 crore of expenditure incurred on setback behindimplementation of ERP
PBT 69.4 56.0 58.1 19.5 74.4 -6.6Tax Outgo 15.3 16.8 19.4 -21.2 25.1 -39.1
PAT 54.1 39.2 38.7 40.0 49.3 9.9Owing to exceptional income, PAT increased 40%. PAT excluding exceptionalincome declined 42% YoY
Source: Company, ICICIdirect.com Research Change in estimates
(| Crore) Old New % Change Old New % Change Comments
Revenue 2,513.5 2,513.5 0.0 3,011.1 3,011.1 0.0Revenue growth likely to improve, going forward, backed by an improvement inproduct mix and store expansion
EBITDA 344.2 263.8 -23.4 460.0 399.8 -13.1
EBITDA Margin (%) 13.7 10.5 -320 bps 15.3 13.3 -200 bpsWe expect the margin to decline in FY16E, FY17E due to higher share of purchaseof traded goods & higher rental cost as a percentage of sales
PAT 215.0 215.1 0.0 292.2 251.6 -13.9 Consequently, PAT growth is expected to decline in FY17EEPS (|) 16.7 16.7 0.0 22.7 19.6 -13.9
FY16E FY17E
Source: Company, ICICIdirect.com Research *-FY15P is for a period of 15 months
ICICI Securities Ltd | Retail Equity Research Page 3
Company Analysis Future revenues to be driven by premium product mix
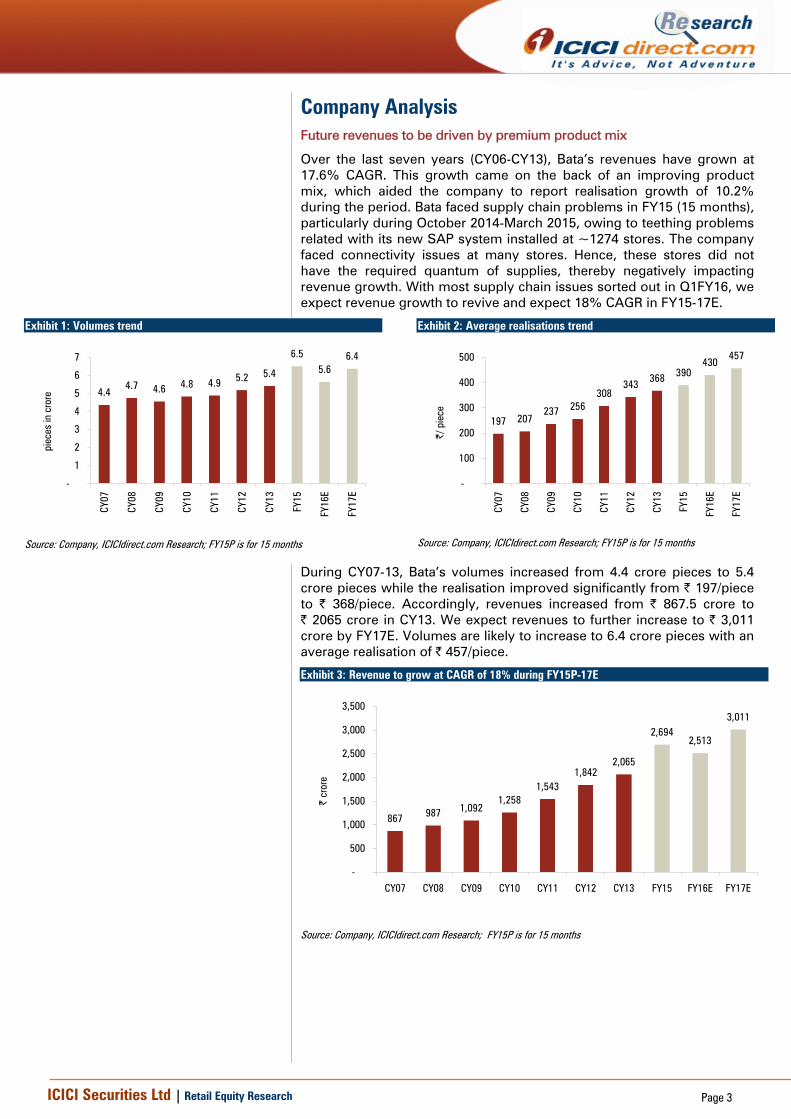
Over the last seven years (CY06-CY13), Bata’s revenues have grown at 17.6% CAGR. This growth came on the back of an improving product mix, which aided the company to report realisation growth of 10.2% during the period. Bata faced supply chain problems in FY15 (15 months), particularly during October 2014-March 2015, owing to teething problems related with its new SAP system installed at ~1274 stores. The company faced connectivity issues at many stores. Hence, these stores did not have the required quantum of supplies, thereby negatively impacting revenue growth. With most supply chain issues sorted out in Q1FY16, we expect revenue growth to revive and expect 18% CAGR in FY15-17E.
Exhibit 1: Volumes trend
4.44.7 4.6 4.8 4.9 5.2 5.4
6.55.6
6.4
-
1
2
3
4
5
6
7
CY07
CY08
CY09
CY10
CY11
CY12
CY13
FY15
FY16
E
FY17
E
piec
es in
cro
re
Source: Company, ICICIdirect.com Research; FY15P is for 15 months
Exhibit 2: Average realisations trend
197 207237 256
308343 368 390
430457
-
100
200
300
400
500
CY07
CY08
CY09
CY10
CY11
CY12
CY13
FY15
FY16
E
FY17
E
|/ p
iece
Source: Company, ICICIdirect.com Research; FY15P is for 15 months
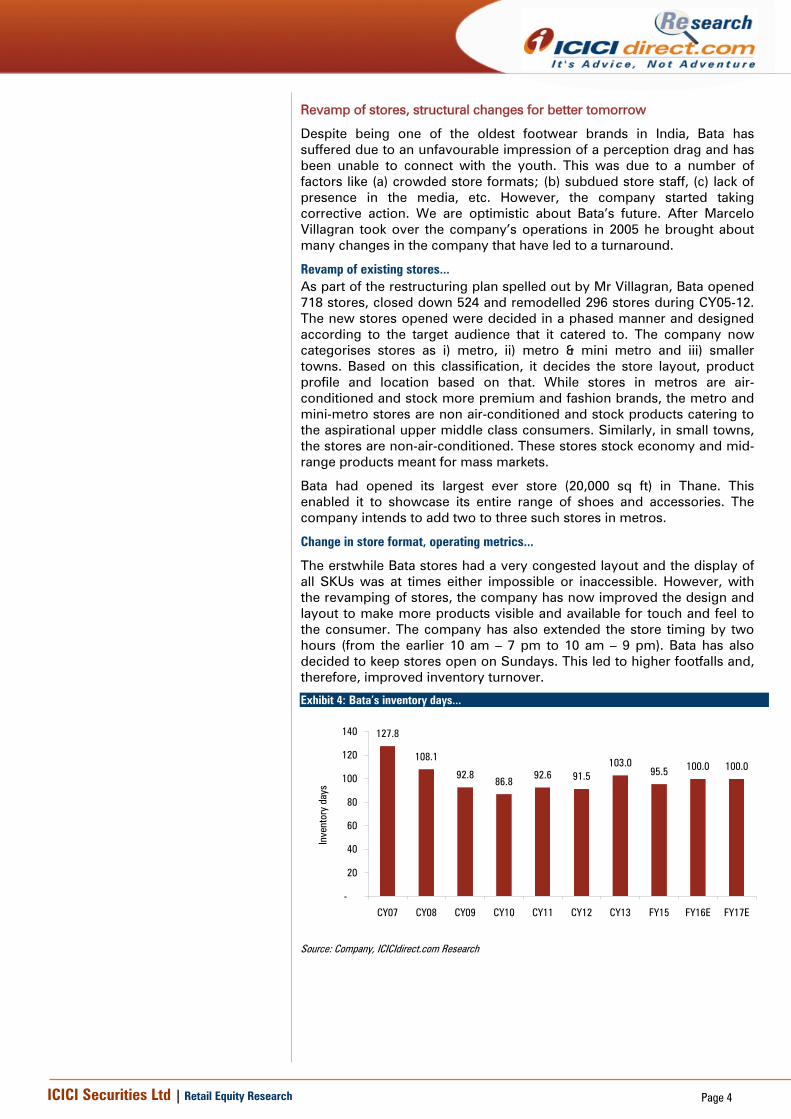
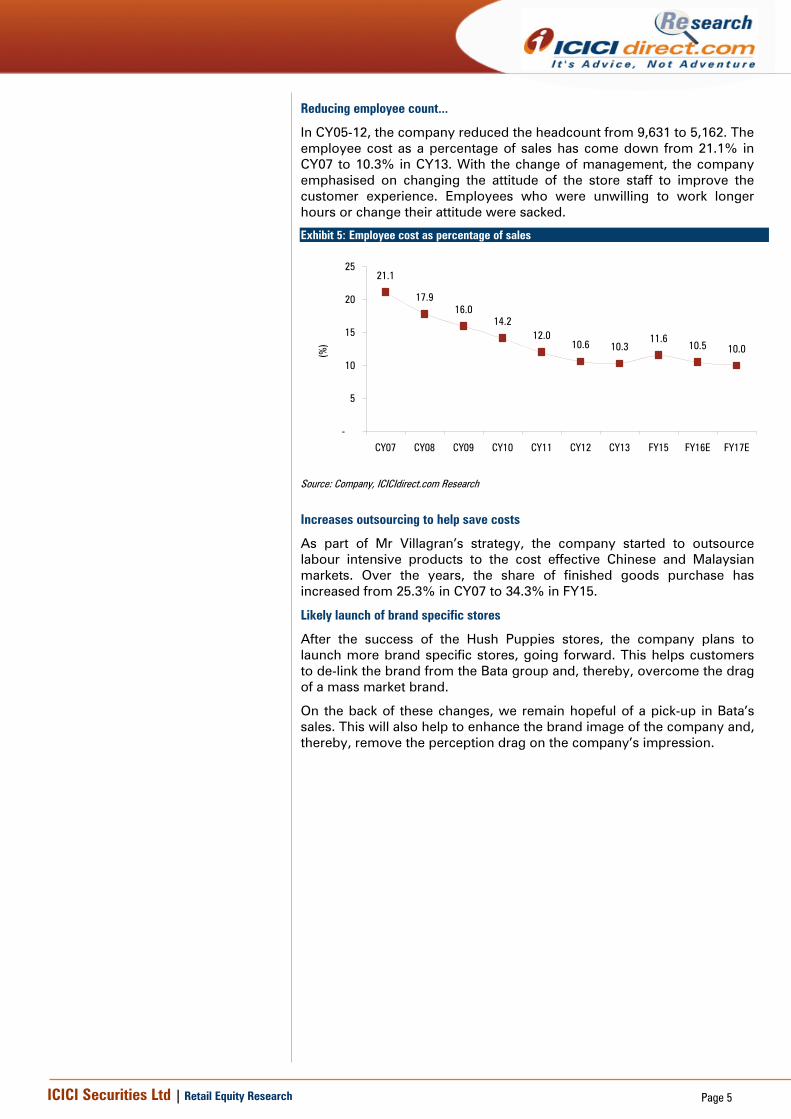
During CY07-13, Bata’s volumes increased from 4.4 crore pieces to 5.4 crore pieces while the realisation improved significantly from | 197/piece to | 368/piece. Accordingly, revenues increased from | 867.5 crore to | 2065 crore in CY13. We expect revenues to further increase to | 3,011 crore by FY17E. Volumes are likely to increase to 6.4 crore pieces with an average realisation of | 457/piece.
Exhibit 3: Revenue to grow at CAGR of 18% during FY15P-17E
867 987 1,0921,258
1,5431,842
2,065
2,6942,513
3,011
-
500
1,000
1,500
2,000
2,500
3,000
3,500
CY07 CY08 CY09 CY10 CY11 CY12 CY13 FY15 FY16E FY17E
| cr
ore
Source: Company, ICICIdirect.com Research; FY15P is for 15 months
ICICI Securities Ltd | Retail Equity Research Page 4
Revamp of stores, structural changes for better tomorrow
Despite being one of the oldest footwear brands in India, Bata has suffered due to an unfavourable impression of a perception drag and has been unable to connect with the youth. This was due to a number of factors like (a) crowded store formats; (b) subdued store staff, (c) lack of presence in the media, etc. However, the company started taking corrective action. We are optimistic about Bata’s future. After Marcelo Villagran took over the company’s operations in 2005 he brought about many changes in the company that have led to a turnaround.
Revamp of existing stores... As part of the restructuring plan spelled out by Mr Villagran, Bata opened 718 stores, closed down 524 and remodelled 296 stores during CY05-12. The new stores opened were decided in a phased manner and designed according to the target audience that it catered to. The company now categorises stores as i) metro, ii) metro & mini metro and iii) smaller towns. Based on this classification, it decides the store layout, product profile and location based on that. While stores in metros are air-conditioned and stock more premium and fashion brands, the metro and mini-metro stores are non air-conditioned and stock products catering to the aspirational upper middle class consumers. Similarly, in small towns, the stores are non-air-conditioned. These stores stock economy and mid-range products meant for mass markets.
Bata had opened its largest ever store (20,000 sq ft) in Thane. This enabled it to showcase its entire range of shoes and accessories. The company intends to add two to three such stores in metros.
Change in store format, operating metrics...
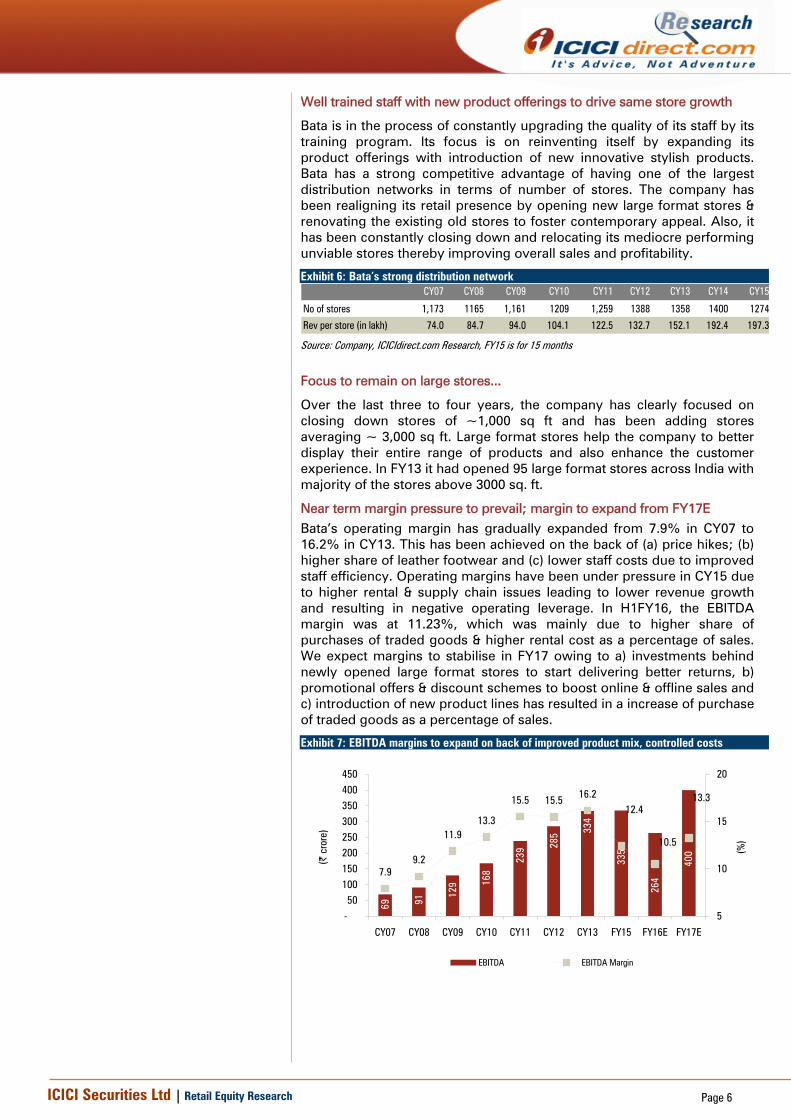
The erstwhile Bata stores had a very congested layout and the display of all SKUs was at times either impossible or inaccessible. However, with the revamping of stores, the company has now improved the design and layout to make more products visible and available for touch and feel to the consumer. The company has also extended the store timing by two hours (from the earlier 10 am – 7 pm to 10 am – 9 pm). Bata has also decided to keep stores open on Sundays. This led to higher footfalls and, therefore, improved inventory turnover.
Exhibit 4: Bata’s inventory days...
127.8
108.1
92.886.8
92.6 91.5103.0
95.5 100.0 100.0
-
20
40
60
80
100
120
140
CY07 CY08 CY09 CY10 CY11 CY12 CY13 FY15 FY16E FY17E
Inve
ntor
y da
ys
Source: Company, ICICIdirect.com Research
ICICI Securities Ltd | Retail Equity Research Page 5
Reducing employee count...
In CY05-12, the company reduced the headcount from 9,631 to 5,162. The employee cost as a percentage of sales has come down from 21.1% in CY07 to 10.3% in CY13. With the change of management, the company emphasised on changing the attitude of the store staff to improve the customer experience. Employees who were unwilling to work longer hours or change their attitude were sacked.
Exhibit 5: Employee cost as percentage of sales
21.1
17.916.0
14.212.0
10.6 10.311.6
10.5 10.0
-
5
10
15
20
25
CY07 CY08 CY09 CY10 CY11 CY12 CY13 FY15 FY16E FY17E
(%)
Source: Company, ICICIdirect.com Research
Increases outsourcing to help save costs
As part of Mr Villagran’s strategy, the company started to outsource labour intensive products to the cost effective Chinese and Malaysian markets. Over the years, the share of finished goods purchase has increased from 25.3% in CY07 to 34.3% in FY15.
Likely launch of brand specific stores
After the success of the Hush Puppies stores, the company plans to launch more brand specific stores, going forward. This helps customers to de-link the brand from the Bata group and, thereby, overcome the drag of a mass market brand.
On the back of these changes, we remain hopeful of a pick-up in Bata’s sales. This will also help to enhance the brand image of the company and, thereby, remove the perception drag on the company’s impression.
ICICI Securities Ltd | Retail Equity Research Page 6
Well trained staff with new product offerings to drive same store growth
Bata is in the process of constantly upgrading the quality of its staff by its training program. Its focus is on reinventing itself by expanding its product offerings with introduction of new innovative stylish products. Bata has a strong competitive advantage of having one of the largest distribution networks in terms of number of stores. The company has been realigning its retail presence by opening new large format stores & renovating the existing old stores to foster contemporary appeal. Also, it has been constantly closing down and relocating its mediocre performing unviable stores thereby improving overall sales and profitability.
Exhibit 6: Bata’s strong distribution network CY07 CY08 CY09 CY10 CY11 CY12 CY13 CY14 CY15
No of stores 1,173 1165 1,161 1209 1,259 1388 1358 1400 1274
Rev per store (in lakh) 74.0 84.7 94.0 104.1 122.5 132.7 152.1 192.4 197.3
Source: Company, ICICIdirect.com Research, FY15 is for 15 months
Focus to remain on large stores...
Over the last three to four years, the company has clearly focused on closing down stores of ~1,000 sq ft and has been adding stores averaging ~ 3,000 sq ft. Large format stores help the company to better display their entire range of products and also enhance the customer experience. In FY13 it had opened 95 large format stores across India with majority of the stores above 3000 sq. ft.
Near term margin pressure to prevail; margin to expand from FY17E Bata’s operating margin has gradually expanded from 7.9% in CY07 to 16.2% in CY13. This has been achieved on the back of (a) price hikes; (b) higher share of leather footwear and (c) lower staff costs due to improved staff efficiency. Operating margins have been under pressure in CY15 due to higher rental & supply chain issues leading to lower revenue growth and resulting in negative operating leverage. In H1FY16, the EBITDA margin was at 11.23%, which was mainly due to higher share of purchases of traded goods & higher rental cost as a percentage of sales. We expect margins to stabilise in FY17 owing to a) investments behind newly opened large format stores to start delivering better returns, b) promotional offers & discount schemes to boost online & offline sales and c) introduction of new product lines has resulted in a increase of purchase of traded goods as a percentage of sales.
Exhibit 7: EBITDA margins to expand on back of improved product mix, controlled costs
69 91
129 16
8
239 28
5 334
335
264
400
7.99.2
11.913.3
15.5 15.5 16.212.4
10.5
13.3
-50
100150200250300350400450
CY07 CY08 CY09 CY10 CY11 CY12 CY13 FY15 FY16E FY17E
(| c
rore
)
5
10
15
20
(%)
EBITDA EBITDA Margin
ICICI Securities Ltd | Retail Equity Research Page 7
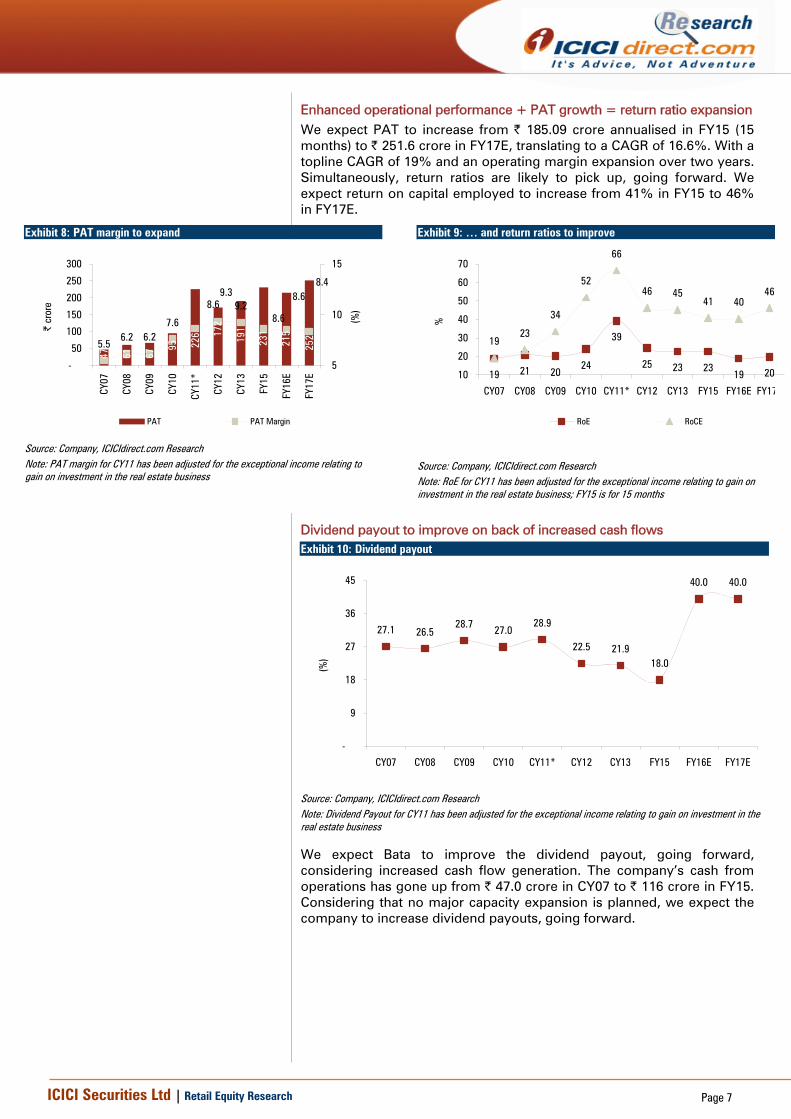
Enhanced operational performance + PAT growth = return ratio expansion We expect PAT to increase from | 185.09 crore annualised in FY15 (15 months) to | 251.6 crore in FY17E, translating to a CAGR of 16.6%. With a topline CAGR of 19% and an operating margin expansion over two years. Simultaneously, return ratios are likely to pick up, going forward. We expect return on capital employed to increase from 41% in FY15 to 46% in FY17E.
Exhibit 8: PAT margin to expand
47 61 67
95 226 17
2
191
231
215
252
5.56.2 6.2
7.6
9.28.69.3
8.6
8.68.4
-
50
100
150
200
250
300
CY07
CY08
CY09
CY10
CY11
*
CY12
CY13
FY15
FY16
E
FY17
E
| cr
ore
5
10
15
(%)
PAT PAT Margin
Source: Company, ICICIdirect.com Research Note: PAT margin for CY11 has been adjusted for the exceptional income relating to gain on investment in the real estate business
Exhibit 9: … and return ratios to improve
19 21 2024
39
25 23 2319 20
1923
34
52
66
46 4541 40
46
10
20
30
40
50
60
70
CY07 CY08 CY09 CY10 CY11* CY12 CY13 FY15 FY16E FY17
%
RoE RoCE
Source: Company, ICICIdirect.com Research Note: RoE for CY11 has been adjusted for the exceptional income relating to gain on investment in the real estate business; FY15 is for 15 months
Dividend payout to improve on back of increased cash flows Exhibit 10: Dividend payout
27.1 26.528.7 27.0
28.9
22.5 21.918.0
40.0 40.0
-
9
18
27
36
45
CY07 CY08 CY09 CY10 CY11* CY12 CY13 FY15 FY16E FY17E
(%)
Source: Company, ICICIdirect.com Research Note: Dividend Payout for CY11 has been adjusted for the exceptional income relating to gain on investment in the real estate business
We expect Bata to improve the dividend payout, going forward, considering increased cash flow generation. The company’s cash from operations has gone up from | 47.0 crore in CY07 to | 116 crore in FY15. Considering that no major capacity expansion is planned, we expect the company to increase dividend payouts, going forward.
ICICI Securities Ltd | Retail Equity Research Page 8
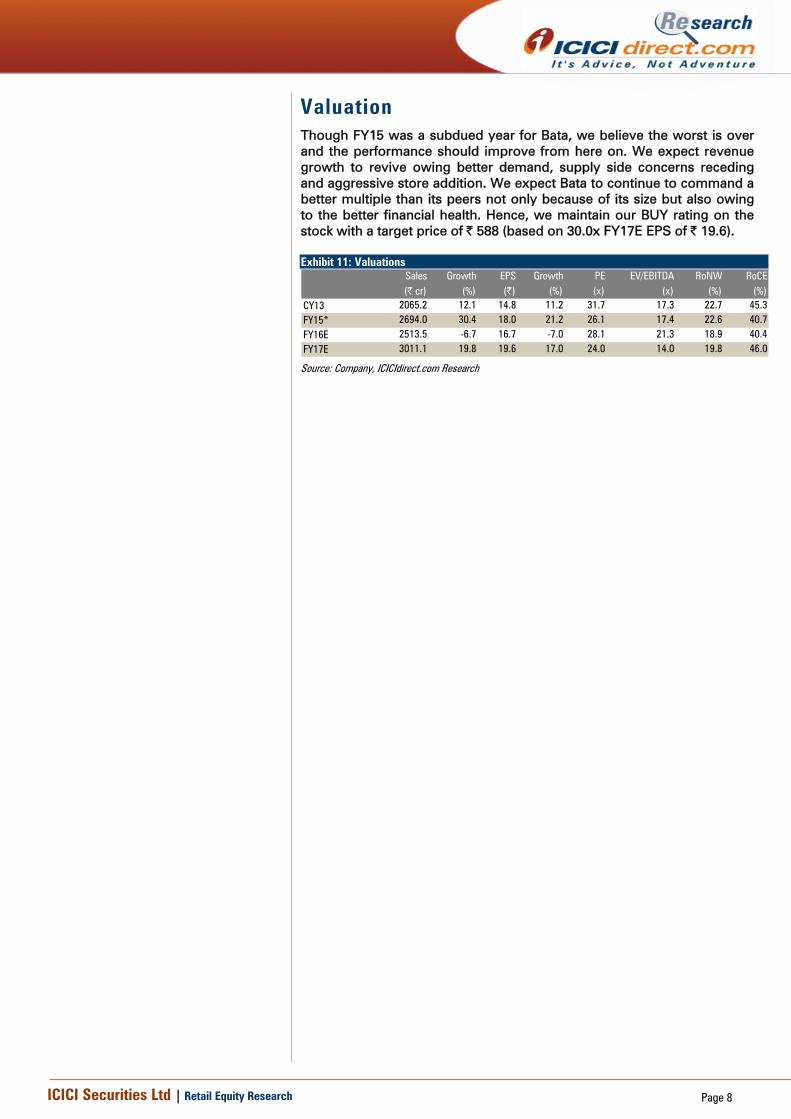
Valuation Though FY15 was a subdued year for Bata, we believe the worst is over and the performance should improve from here on. We expect revenue growth to revive owing better demand, supply side concerns receding and aggressive store addition. We expect Bata to continue to command a better multiple than its peers not only because of its size but also owing to the better financial health. Hence, we maintain our BUY rating on the stock with a target price of | 588 (based on 30.0x FY17E EPS of | 19.6). Exhibit 11: Valuations
Sales Growth EPS Growth PE EV/EBITDA RoNW RoCE (| cr) (%) (|) (%) (x) (x) (%) (%)
CY13 2065.2 12.1 14.8 11.2 31.7 17.3 22.7 45.3FY15* 2694.0 30.4 18.0 21.2 26.1 17.4 22.6 40.7FY16E 2513.5 -6.7 16.7 -7.0 28.1 21.3 18.9 40.4FY17E 3011.1 19.8 19.6 17.0 24.0 14.0 19.8 46.0
Source: Company, ICICIdirect.com Research
ICICI Securities Ltd | Retail Equity Research Page 9
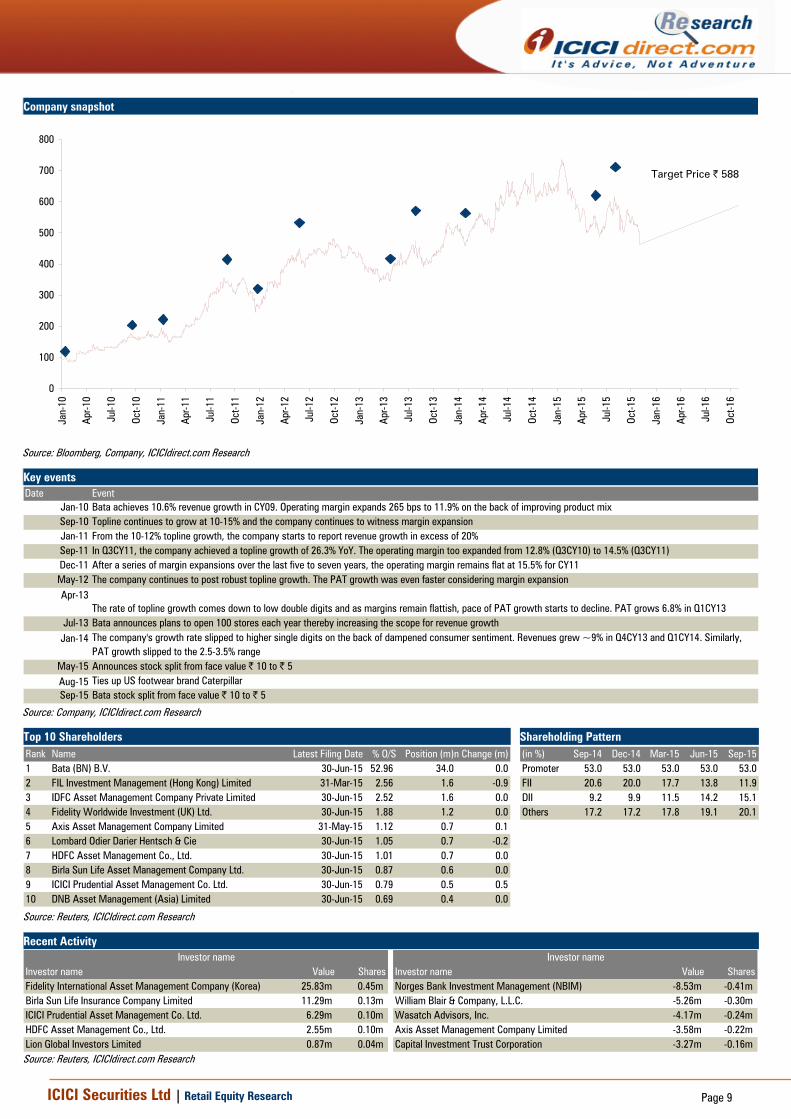
Company snapshot
0
100
200
300
400
500
600
700
800
Jan-
10
Apr-1
0
Jul-1
0
Oct-1
0
Jan-
11
Apr-1
1
Jul-1
1
Oct-1
1
Jan-
12
Apr-1
2
Jul-1
2
Oct-1
2
Jan-
13
Apr-1
3
Jul-1
3
Oct-1
3
Jan-
14
Apr-1
4
Jul-1
4
Oct-1
4
Jan-
15
Apr-1
5
Jul-1
5
Oct-1
5
Jan-
16
Apr-1
6
Jul-1
6
Oct-1
6
Source: Bloomberg, Company, ICICIdirect.com Research
Key events Date Event
Jan-10 Bata achieves 10.6% revenue growth in CY09. Operating margin expands 265 bps to 11.9% on the back of improving product mixSep-10 Topline continues to grow at 10-15% and the company continues to witness margin expansionJan-11 From the 10-12% topline growth, the company starts to report revenue growth in excess of 20%Sep-11 In Q3CY11, the company achieved a topline growth of 26.3% YoY. The operating margin too expanded from 12.8% (Q3CY10) to 14.5% (Q3CY11)Dec-11 After a series of margin expansions over the last five to seven years, the operating margin remains flat at 15.5% for CY11May-12 The company continues to post robust topline growth. The PAT growth was even faster considering margin expansionApr-13
The rate of topline growth comes down to low double digits and as margins remain flattish, pace of PAT growth starts to decline. PAT grows 6.8% in Q1CY13Jul-13 Bata announces plans to open 100 stores each year thereby increasing the scope for revenue growth
Jan-14 The company's growth rate slipped to higher single digits on the back of dampened consumer sentiment. Revenues grew ~9% in Q4CY13 and Q1CY14. Similarly, PAT growth slipped to the 2.5-3.5% range
May-15 Announces stock split from face value | 10 to | 5Aug-15 Ties up US footwear brand CaterpillarSep-15 Bata stock split from face value | 10 to | 5
Source: Company, ICICIdirect.com Research
Top 10 Shareholders Shareholding Pattern Rank Name Latest Filing Date % O/S Position (m)n Change (m)1 Bata (BN) B.V. 30-Jun-15 52.96 34.0 0.02 FIL Investment Management (Hong Kong) Limited 31-Mar-15 2.56 1.6 -0.93 IDFC Asset Management Company Private Limited 30-Jun-15 2.52 1.6 0.04 Fidelity Worldwide Investment (UK) Ltd. 30-Jun-15 1.88 1.2 0.05 Axis Asset Management Company Limited 31-May-15 1.12 0.7 0.16 Lombard Odier Darier Hentsch & Cie 30-Jun-15 1.05 0.7 -0.27 HDFC Asset Management Co., Ltd. 30-Jun-15 1.01 0.7 0.08 Birla Sun Life Asset Management Company Ltd. 30-Jun-15 0.87 0.6 0.09 ICICI Prudential Asset Management Co. Ltd. 30-Jun-15 0.79 0.5 0.510 DNB Asset Management (Asia) Limited 30-Jun-15 0.69 0.4 0.0
(in %) Sep-14 Dec-14 Mar-15 Jun-15 Sep-15Promoter 53.0 53.0 53.0 53.0 53.0FII 20.6 20.0 17.7 13.8 11.9DII 9.2 9.9 11.5 14.2 15.1Others 17.2 17.2 17.8 19.1 20.1
Source: Reuters, ICICIdirect.com Research
Recent Activity
Investor name Value Shares Investor name Value SharesFidelity International Asset Management Company (Korea) 25.83m 0.45m Norges Bank Investment Management (NBIM) -8.53m -0.41m Birla Sun Life Insurance Company Limited 11.29m 0.13m William Blair & Company, L.L.C. -5.26m -0.30m ICICI Prudential Asset Management Co. Ltd. 6.29m 0.10m Wasatch Advisors, Inc. -4.17m -0.24m HDFC Asset Management Co., Ltd. 2.55m 0.10m Axis Asset Management Company Limited -3.58m -0.22m Lion Global Investors Limited 0.87m 0.04m Capital Investment Trust Corporation -3.27m -0.16m
Investor name Investor name
Source: Reuters, ICICIdirect.com Research
Target Price | 588

ICICI Securities Ltd | Retail Equity Research Page 10
.
Financial summary Profit and loss statement | Crore (Year-end March) CY13 FY15* FY16E FY17ETotal operating Income 2,065.2 2,694.0 2,513.5 3,011.1Growth (%) 12.1 30.4 -6.7 19.8Raw Material Expenses 948.8 1,237.8 1,249.3 1,482.2Employee Expenses 213.3 311.9 263.9 301.1Manufacturing Expenses 326.8 462.0 409.7 451.7Selling & Distribution Expenses 121.1 174.0 163.4 188.2Admin & Other Expenses 121.5 173.0 163.4 188.2Total Operating Expenditure 1,731.5 2,358.7 2,249.7 2,611.3EBITDA 333.7 335.3 263.8 399.8Growth (%) 16.9 0.4 -21.2 51.6Depreciation 59.2 79.2 68.3 83.9Interest 13.1 1.8 2.5 3.0Other Income 31.3 43.2 15.1 59.9Exceptional Item -10.1 31.5 74.7 0.0PBT 282.6 329.0 282.7 372.7Growth (%) 16.2 1.5 -30.0 79.2Total Tax 91.9 97.5 67.6 121.1PAT 190.7 231.5 215.1 251.6Growth (%) 11.2 21.2 -7.0 17.0EPS (|) 14.8 18.0 16.7 19.6
Source: Company, ICICIdirect.com Research
Cash flow statement | Crore
(Year-end March) CY13 FY15* FY16E FY17EProfit before Tax 282.6 328.7 208.0 372.7Add: Depreciation 59.2 79.2 68.3 83.9(Inc)/dec in Current Assets -141.1 -168.1 42.0 -184.7Inc/(dec) in CL and Provisions 79.2 46.3 -2.8 98.3Taxes Paid -110.5 -143.4 -67.6 -121.1Others 12.1 -27.1 -2.0 -15.0CF from operating activities 181.5 115.6 245.9 234.1(Inc)/dec in Fixed Assets -78.7 -133.5 0.5 -104.4Others -38.0 -28.1 4.5 18.0CF from investing activities -116.7 -161.6 5.0 -86.4Issue/(Buy back) of Equity 0.0 0.0 0.0 0.0Inc/(dec) in loan funds 0.0 0.0 0.0 0.0Dividend paid & dividend tax -44.9 -48.6 -99.8 -116.7Others -1.3 -1.8 -2.5 -3.0CF from financing activities -46.2 -50.3 -102.3 -119.8Net Cash flow 18.6 -96.4 148.6 28.0Opening Cash 32.7 51.3 -45.1 103.5Deposits with maturity > 3 months 204.4 255.0 327.8 324.0Closing Cash 255.7 209.9 431.3 455.5
Source: Company, ICICIdirect.com Research
Balance sheet | Crore (Year-end March) CY13 FY15* FY16E FY17ELiabilitiesEquity Capital 64.3 64.3 64.3 64.3 Reserve and Surplus 776.7 957.8 1,073.1 1,207.9 Total Shareholders funds 841.0 1,022.1 1,137.4 1,272.2 Total Debt - - - - Deferred Tax Liability - - - - Minority Interest / Others - - - - Total Liabilities 841.0 1,022.1 1,137.4 1,272.2
AssetsGross Block 601.5 772.8 775.6 882.6 Less: Acc Depreciation 355.3 434.6 502.9 586.8 Net Block 246.2 338.2 272.7 295.8 Capital WIP 23.7 16.6 13.3 10.6 Total Fixed Assets 269.9 354.8 286.0 306.4 Investments 4.9 5.0 5.0 5.0 Inventory 582.7 704.6 688.6 824.9 Debtors 50.9 58.4 58.5 70.1 Loans and Advances 141.0 207.9 181.0 216.8 Other Current Assets 9.5 8.7 9.6 10.5 Cash 255.7 209.9 431.3 455.7 Total Current Assets 1,039.9 1,189.6 1,369.0 1,578.1 Current Liabilities 453.1 539.5 497.5 575.8 Provisions 88.6 75.4 114.6 134.6 Total Current Liabilities 541.7 614.9 612.1 710.4 Net Current Assets 498.2 574.7 756.9 867.7 Deferred Tax Assets 68.0 87.6 89.6 93.1 Application of Funds 841.0 1,022.1 1,137.4 1,272.2
Source: Company, ICICIdirect.com Research *-FY15E is for a period of 15 months
Key ratios (Year-end March) CY13 FY15* FY16E FY17EPer share data (|)EPS 14.8 18.0 16.7 19.6Cash EPS 19.4 24.2 22.1 26.1BV 65.4 79.5 88.5 99.0DPS 3.2 3.2 6.7 7.8Cash Per Share 19.9 16.3 33.6 35.5Operating RatiosEBITDA Margin (%) 16.2 12.4 10.5 13.3PBT Margin (%) 13.7 12.2 11.2 12.4PAT Margin (%) 9.2 8.6 8.6 8.4Inventory days 103.0 95.5 100.0 100.0Debtor days 9.0 7.9 8.5 8.5Creditor days 80.1 73.1 72.2 69.8Return Ratios (%)RoE 22.7 22.6 18.9 19.8RoCE 45.3 40.7 40.4 46.0RoIC 32.9 28.6 30.7 31.0Valuation Ratios (x)P/E 31.7 26.1 28.1 24.0EV / EBITDA 17.3 17.4 21.3 14.0EV / Net Sales 2.8 2.2 2.2 1.9Market Cap / Sales 2.9 2.2 2.4 2.0Price to Book Value 7.2 5.9 5.3 4.7Solvency RatiosDebt/EBITDA 0.0 0.0 0.0 0.0Debt / Equity 0.0 0.0 0.0 0.0Current Ratio 1.2 1.6 1.5 1.6Quick Ratio 0.1 0.4 0.4 0.4
Source: Company, ICICIdirect.com Research
ICICI Securities Ltd | Retail Equity Research Page 11
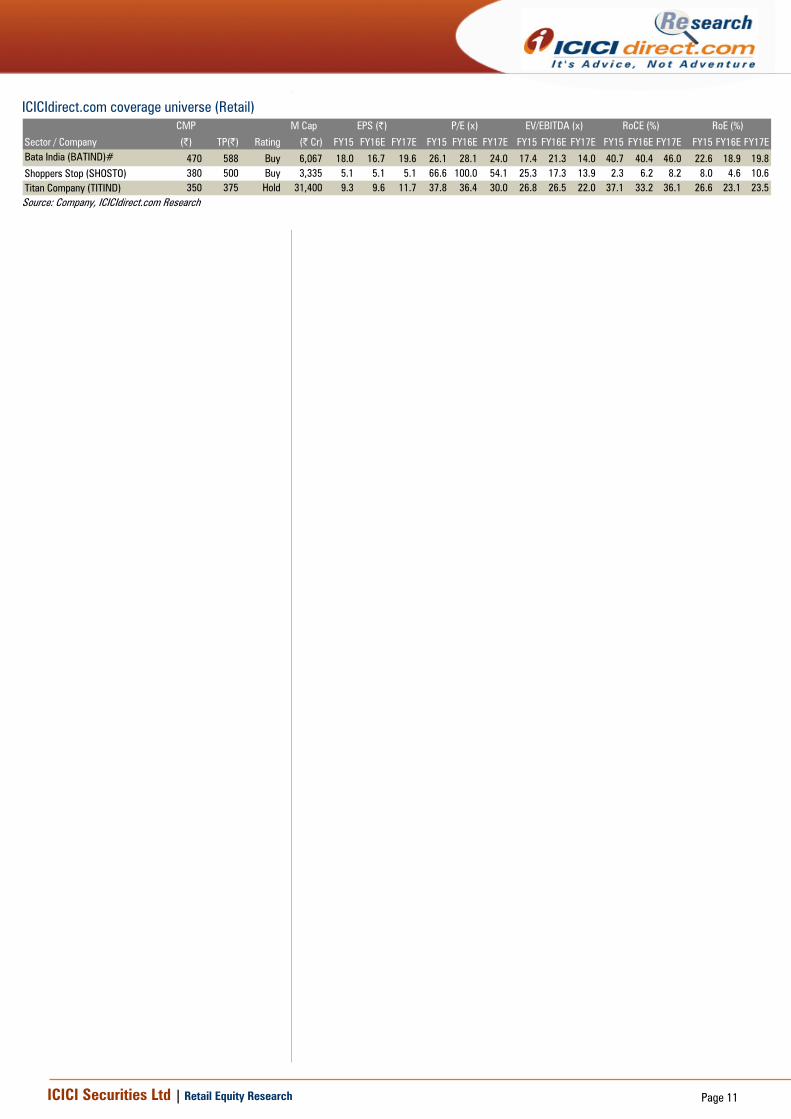
ICICIdirect.com coverage universe (Retail) CMP M Cap
(|) TP(|) Rating (| Cr) FY15 FY16E FY17E FY15 FY16E FY17E FY15 FY16E FY17E FY15 FY16E FY17E FY15 FY16E FY17EBata India (BATIND)# 470 588 Buy 6,067 18.0 16.7 19.6 26.1 28.1 24.0 17.4 21.3 14.0 40.7 40.4 46.0 22.6 18.9 19.8Shoppers Stop (SHOSTO) 380 500 Buy 3,335 5.1 5.1 5.1 66.6 100.0 54.1 25.3 17.3 13.9 2.3 6.2 8.2 8.0 4.6 10.6Titan Company (TITIND) 350 375 Hold 31,400 9.3 9.6 11.7 37.8 36.4 30.0 26.8 26.5 22.0 37.1 33.2 36.1 26.6 23.1 23.5
Sector / Company
RoE (%)EPS (|) P/E (x) EV/EBITDA (x) RoCE (%)
Source: Company, ICICIdirect.com Research
ICICI Securities Ltd | Retail Equity Research Page 12
RATING RATIONALE ICICIdirect.com endeavours to provide objective opinions and recommendations. ICICIdirect.com assigns ratings to its stocks according to their notional target price vs. current market price and then categorises them as Strong Buy, Buy, Hold and Sell. The performance horizon is two years unless specified and the notional target price is defined as the analysts' valuation for a stock. Strong Buy: >15%/20% for large caps/midcaps, respectively, with high conviction; Buy: >10%/15% for large caps/midcaps, respectively; Hold: Up to +/-10%; Sell: -10% or more;
Pankaj Pandey Head – Research [email protected]
ICICIdirect.com Research Desk, ICICI Securities Limited, 1st Floor, Akruti Trade Centre, Road No 7, MIDC, Andheri (East) Mumbai – 400 093
ICICI Securities Ltd | Retail Equity Research Page 13
ANALYST CERTIFICATION We /I, Bharat Chhoda, MBA, Nirav Savai , MBA Research Analysts, authors and the names subscribed to this report, hereby certify that all of the views expressed in this research report accurately reflect our views about the subject issuer(s) or securities. We also certify that no part of our compensation was, is, or will be directly or indirectly related to the specific recommendation(s) or view(s) in this report.
Terms & conditions and other disclosures: ICICI Securities Limited (ICICI Securities) is a Sebi registered Research Analyst having registration no. INH000000990. ICICI Securities is full-service, integrated investment banking and is, inter alia, engaged in the business of stock brokering and distribution of financial products. ICICI Securities is a wholly-owned subsidiary of ICICI Bank which is India’s largest private sector bank and has its various subsidiaries engaged in businesses of housing finance, asset management, life insurance, general insurance, venture capital fund management, etc. (“associates”), the details in respect of which are available on www.icicibank.com. ICICI Securities is one of the leading merchant bankers/ underwriters of securities and participate in virtually all securities trading markets in India. We and our associates might have investment banking and other business relationship with a significant percentage of companies covered by our Investment Research Department. ICICI Securities generally prohibits its analysts, persons reporting to analysts and their relatives from maintaining a financial interest in the securities or derivatives of any companies that the analysts cover. The information and opinions in this report have been prepared by ICICI Securities and are subject to change without any notice. The report and information contained herein is strictly confidential and meant solely for the selected recipient and may not be altered in any way, transmitted to, copied or distributed, in part or in whole, to any other person or to the media or reproduced in any form, without prior written consent of ICICI Securities. While we would endeavour to update the information herein on a reasonable basis, ICICI Securities is under no obligation to update or keep the information current. Also, there may be regulatory, compliance or other reasons that may prevent ICICI Securities from doing so. Non-rated securities indicate that rating on a particular security has been suspended temporarily and such suspension is in compliance with applicable regulations and/or ICICI Securities policies, in circumstances where ICICI Securities might be acting in an advisory capacity to this company, or in certain other circumstances. This report is based on information obtained from public sources and sources believed to be reliable, but no independent verification has been made nor is its accuracy or completeness guaranteed. This report and information herein is solely for informational purpose and shall not be used or considered as an offer document or solicitation of offer to buy or sell or subscribe for securities or other financial instruments. Though disseminated to all the customers simultaneously, not all customers may receive this report at the same time. ICICI Securities will not treat recipients as customers by virtue of their receiving this report. Nothing in this report constitutes investment, legal, accounting and tax advice or a representation that any investment or strategy is suitable or appropriate to your specific circumstances. The securities discussed and opinions expressed in this report may not be suitable for all investors, who must make their own investment decisions, based on their own investment objectives, financial positions and needs of specific recipient. This may not be taken in substitution for the exercise of independent judgment by any recipient. The recipient should independently evaluate the investment risks. The value and return on investment may vary because of changes in interest rates, foreign exchange rates or any other reason. ICICI Securities accepts no liabilities whatsoever for any loss or damage of any kind arising out of the use of this report. Past performance is not necessarily a guide to future performance. Investors are advised to see Risk Disclosure Document to understand the risks associated before investing in the securities markets. Actual results may differ materially from those set forth in projections. Forward-looking statements are not predictions and may be subject to change without notice. ICICI Securities or its associates might have managed or co-managed public offering of securities for the subject company or might have been mandated by the subject company for any other assignment in the past twelve months. ICICI Securities or its associates might have received any compensation from the companies mentioned in the report during the period preceding twelve months from the date of this report for services in respect of managing or co-managing public offerings, corporate finance, investment banking or merchant banking, brokerage services or other advisory service in a merger or specific transaction. ICICI Securities or its associates might have received any compensation for products or services other than investment banking or merchant banking or brokerage services from the companies mentioned in the report in the past twelve months. ICICI Securities encourages independence in research report preparation and strives to minimize conflict in preparation of research report. ICICI Securities or its analysts did not receive any compensation or other benefits from the companies mentioned in the report or third party in connection with preparation of the research report. Accordingly, neither ICICI Securities nor Research Analysts have any material conflict of interest at the time of publication of this report. It is confirmed that Bharat Chhoda, MBA, Nirav Savai MBA, Research Analysts of this report have not received any compensation from the companies mentioned in the report in the preceding twelve months. Compensation of our Research Analysts is not based on any specific merchant banking, investment banking or brokerage service transactions. ICICI Securities or its subsidiaries collectively or Research Analysts do not own 1% or more of the equity securities of the Company mentioned in the report as of the last day of the month preceding the publication of the research report. Since associates of ICICI Securities are engaged in various financial service businesses, they might have financial interests or beneficial ownership in various companies including the subject company/companies mentioned in this report. It is confirmed that Bharat Chhoda, MBA, Nirav Savai, MBA ,Research Analysts do not serve as an officer, director or employee of the companies mentioned in the report. ICICI Securities may have issued other reports that are inconsistent with and reach different conclusion from the information presented in this report. Neither the Research Analysts nor ICICI Securities have been engaged in market making activity for the companies mentioned in the report. We submit that no material disciplinary action has been taken on ICICI Securities by any Regulatory Authority impacting Equity Research Analysis activities. This report is not directed or intended for distribution to, or use by, any person or entity who is a citizen or resident of or located in any locality, state, country or other jurisdiction, where such distribution, publication, availability or use would be contrary to law, regulation or which would subject ICICI Securities and affiliates to any registration or licensing requirement within such jurisdiction. The securities described herein may or may not be eligible for sale in all jurisdictions or to certain category of investors. Persons in whose possession this document may come are required to inform themselves of and to observe such restriction.