Embed Size (px)
Citation preview

Initiating Coverage
ICICI Securities Ltd | Retail Equity Research
Set to enjoy smooth ride.... Castrol India, a 71% subsidiary of British Petroleum plc, is one of the leading players in the domestic lubricants business catering mainly to the automotive and industrial segments. The main focus of the company is on the lucrative automotive lubricant segment where it commands a market share of ~22% in value terms. The company derives ~90% of its revenues from the automotive segment out of which passenger cars and two-wheelers contribute ~40% and ~35%, respectively, followed by the commercial vehicles segment, which contributes ~20% of revenues. Personal mobility (passenger cars and two wheelers) lubricant sales that had witnessed strong momentum over the past few years, will continue to remain the key growth driver for the company. The industrial segment, which constitutes ~10% of revenues, is also expected to pick up with an improvement in industrial activities. We expect Castrol to grow at a CAGR of 7.1% in revenues over CY13-16E on the back of strong growth in volumes and gross margins. Profit is expected to increase at 20.5% CAGR over CY13-16E to | 889.1 crore in CY16E. We initiate coverage on Castrol India with a BUY rating.
Revival in Indian economy to fuel volume growth
Castrol’s volume had remained subdued over the past few years due to the slowdown in the Indian economy. With the revival expected in the automobile sales and industrial growth, we believe Castrol’s volumes will increase at 3.8% CAGR over CY13-16E from 196.8 million litre in CY13 to 220 million litre in CY16E.
Sharp decline in crude oil prices to boost margins
With the sharp decline in crude oil prices over the past few months, raw material costs (base oil prices) are expected to come down, aiding the improvement in margins. The impact of lower base oil prices will be reflected in raw material costs from Q1CY15E. We expect Castrol’s EBITDA to increase from | 34.9 per litre in CY13 to | 60.4 per litre in CY16E on account of stable realisations and decline in raw material costs.
Bet on largest private player with strong pricing power
Castrol’s strong brand positioning and superior distribution network allows it to command higher pricing power and premium for its products over its competitors. The company’s focus on the personal mobility segment will remain the key driver for the automotive lubricant business and will create value for shareholders, going forward. We value Castrol India at 34x CY16E EPS of | 18 to arrive at a target price of | 611 with a BUY rating.
Exhibit 1: Financial Performance
(Year-end December) CY12 CY13 CY14E CY15E CY16ERevenues (| crore) 3,120.9 3,179.6 3,405.0 3,641.0 3,910.9 EBITDA (| crore) 622.8 687.6 714.9 1,207.1 1,328.6 Net Profit (| crore) 447.4 508.6 480.1 812.0 889.1 EPS (|) 9.0 10.3 9.7 16.4 18.0 P/E (x) 56.2 49.4 52.3 30.9 28.3 Price / Book (x) 38.7 33.4 43.4 36.1 31.2 EV/EBITDA (x) 39.4 35.7 34.5 20.2 18.2 RoCE (%) 91.8 87.4 117.6 168.2 160.2 RoE (%) 68.9 67.7 82.9 116.5 110.5
Source: Company, ICICIdirect.com Research
Castrol India (CASIND)| 508
Rating Matrix Rating : BuyTarget : | 611Target Period : 12-18 monthsPotential Upside : 20%
YoY growth (%)
(YoY Growth) CY13 CY14E CY15E CY16ERevenues 1.9 7.1 6.9 7.4 EBITDA 10.4 4.0 68.8 10.1 Net Profit 13.7 (5.6) 69.1 9.5 EPS 13.7 (5.6) 69.1 9.5
Valuation summary
CY13 CY14E CY15E CY16EP/E 49.4 52.3 30.9 28.3 Target P/E 59.4 62.9 37.2 34.0 EV / EBITDA 35.7 34.5 20.2 18.2 P/BV 33.4 43.4 36.1 31.2 RoNW (%) 67.7 82.9 116.5 110.5 RoCE (%) 87.4 117.6 168.2 160.2
Stock Data
Bloomberg/Reuters Code CSTRL IN/ CAST NSSensex 27,371 Average volumes 388,278 Market Cap (| crore) 25,123.6 52 week H/L 543/282Equity Capital (| crore) 247.3 Promoter's Stake (%) 71.0 FII Holding (%) 8.2 DII Holding (%) 6.2
Comparative return matrix (%)
Return % 1M 3M 6M 12M
Castrol India 10.8 15.0 56.5 68.3
Tide Water Oil 11.1 25.9 79.4 161.1
Gulf Oil Lubricant 41.8 73.9 - -
Price movement
0100200300400500600700
Dec-
14
Jul-1
4
Mar
-14
Oct-1
3
Jun-
13
Feb-
13
Sep-
12
May
-12
Jan-
12
3,0004,0005,0006,0007,0008,0009,000
10,000
Price (R.H.S) Nifty (L.H.S)
Research Analyst
Mayur Matani
Utkarsh Tathagath
December 19, 2014

Page 2ICICI Securities Ltd | Retail Equity Research
Company background Castrol India, a 71% subsidiary of British Petroleum plc, is the largest private sector lubricant player in India. The history of Castrol in India dates back to 1910 when certain automotive lubricants from CC Wakefield & Co made an entry into the Indian market. The company was founded as an overseas branch of a British company and started operations as a trading unit. It was later renamed as Castrol in 1960. The company caters to the automotive, industrial and marine & energy segments. Castrol gets majority of its revenues from the automotive segment (~90%) out of which the passenger cars and two-wheelers segments contribute ~40% and ~35%, respectively, followed by the commercial vehicles segment that contributes ~20% of revenues. The company commands a market share of ~22% (value terms) in the automotive lubricant segment that has historically been dominated by PSU companies. Castrol operates three manufacturing plants in India and has the largest distribution network of 380 distributors, servicing over 105,000 retail sites. The company has a close association with OEM partners like Maruti Suzuki, Jaguar Land Rover, BMW, Volkswagen, Tata Motors, etc. in the automotive segment. The industrial segment contributes ~10% of total revenues for Castrol. In the industrial segment, Castrol has its strength in OEM tie-ups and onsite service in the B2B segment. The company mainly uses group 1 and group 2 base oils as its raw material. Castrol imports ~50% of its base oil requirements while the rest is procured from domestic oil companies. The royalty to British Petroleum is currently at 3.5% of sales subject to 10% (maximum) of profits. This is revised yearly and is expected to remain at this level in future. The company spends aggressively on advertising & marketing by way of tie-ups and sponsorships of cricket tournaments, car racing, etc. Castrol’s marketing initiative with sporting events and brand focused approach has also helped it to maintain its market share and remain among the top positions in the competitive lubricant market. The largest selling brand for the company is the “Activ” brand with a sale of ~32 million litre. Its other products like CRB plus, which is the largest selling diesel engine oil in the country, had volumes of 18 million litre. In the last 10 years, revenues and profits have grown at a CAGR of 10.2% and 14%, respectively. However, due to adverse economic conditions and slowdown in volumes, revenues and profits in the last two years have recorded growth at a CAGR of 3% and 2.8%, respectively. Exhibit 2: Overview of Castrol’s business in CY13
Source: Company, ICICIdirect.com Research
Shareholding pattern (%) – Q3CY14
(in %) Sep-13 Dec-13 Mar-14 Jun-14 Sep-14Promoter 71.0 71.0 71.0 71.0 71.0FII 9.2 9.0 8.3 8.2 8.2DII 5.5 5.5 5.9 5.6 6.2Others 14.3 14.5 14.8 15.2 14.6
FII & DII holding trend (%)
9.08.3 8.2 8.2
9.2
5.5 5.9 5.66.2
5.5
-
2.0
4.0
6.0
8.0
10.0
Q3CY
14
Q4CY
14
Q1CY
15
Q2CY
15
Q3CY
15
%
FII DII

Page 3ICICI Securities Ltd | Retail Equity Research
Overview of Indian lubricant sector The domestic lubricant industry is a US$4.8-5.1 billion market with volumes of ~2350 million litre growing at a CAGR of 2-3% in the past few years. The lubricants industry comprises automotive, industrial and process oils segments with volumes of ~1100 million litre, ~550 million litre and ~700 million litre, respectively. Listed Indian lubricant players mainly cater to the automotive and industrial lubricants segments. The automotive lubricants segment, currently comprising oil PSUs, multinational companies and a number of small and regional players, is highly fragmented. Historically, pre-liberalisation, the lubricants market was dominated by PSU oil companies that controlled more than 90% of the market. There were restrictions on import of base oil in India and lower trade margins that led to poor availability and service to customers. Post liberalisation, base oil imports were de-canalised and the administered pricing mechanism was gradually scrapped. A reduction of import duty and allowing the PSU oil majors to form JVs led to the entry of all major global oil companies in India. The entry of many players in the market led to a shift in the lube business from petrol pumps to the Bazaar trade. Increased spends & brand building efforts to gain market share increased the competitive activities in the market. Due to this situation, PSU oil companies lost ground and gave way to private companies. Exhibit 3: Overview of Indian lubricant market (FY14)
Source: Industry, ICICIdirect.com Research
Currently, multinational and oil PSUs dominate the automotive lubricants business in India. Within the automotive segment, original equipment manufacturers (OEMs) have a market share of ~10% (115 million litre) while the replacement segment commands a market share of ~90% (985 million litre). Petrol pumps now constitute only ~17% (170 million litre) while bazaar trade (retailers, mechanics, workshops & spare part dealers) constitute ~83% (815 million litre) of the total replacement market. The bazaar trade segment, which had stable growth, continues to remain the key driver for lubricant players. Oil PSUs, which used to command ~90% of the market pre-liberalisation, now only contribute ~30% to the bazaar trade segment. Multinational companies like Castrol, Total, Shell, etc, through their strong brands and differentiated marketing, have more than 30% market share of the bazaar trade segment. Other private sector players are currently investing aggressively in advertising & marketing and aiming to gain market share through competitive pricing.
Currently, multinational and oil PSUs dominate the
automotive lubricants business in India. Within the
automotive segment, original equipment manufacturers
(OEMs) have a market share of ~10% (115 million litre)
while the replacement segment commands a market share
of ~90% (985 million litre).

Page 4ICICI Securities Ltd | Retail Equity Research
Exhibit 4: Market share of lubricant companies in bazaar trade segment (FY14)
4%7%
7%
6%
5%
21%28%
22%
Castrol PSU's others Shell Total Gulf Oil Lubricants Veedol Valvoline
Source: Industry, ICICIdirect.com Research
Exhibit 5: Product portfolio of Indian lubricant companies
Two wheelers Petrol vehicles Diesel vehicles
Bharat Petroleum Corporation Ltd MAK MAK 2T, Mak 4T Plus SL MAK Elite MAK multigrade, MAK gold plus
Hindustan Petroleum Corporation Ltd HP HP Racer, Super Brake Fluid Hp Extra Super Motor oil, Hp Cruise Hp Laal Ghoda, Milcy
Indian Oil Corporation Ltd SERVO Servo-2T, Servo-4T Servo-Pride tc Super multigrade, Servo-Xtrapremium, Pride 40
Castrol India Ltd. Castrol Castrol Activ, Castrol Go GTX Petrol, Castrol Edge GTX Diesel, CRB Plus, CRB Turbo
Gulf Oil Corporation Ltd Superfleet Gulf Pride 2T, Gulf Pride 4T Gulf Super Fleet 15w-40 Gulf XHD Plus, Superfleet LE Max
Tide Water Oil Corporation Ltd Veedol Super Swift, Take-off Blue Blood, Turbostar Max-Pro, Turbo, HDB, Deep Sea
Company Name Brand NameMajor Products
Source: Industry, ICICIdirect.com Research
Multinational companies like Castrol, Total, Shell, etc,
through their strong brands and differentiated marketing,
have more than 30% market share of the bazaar trade
segment.
Page 5ICICI Securities Ltd | Retail Equity Research
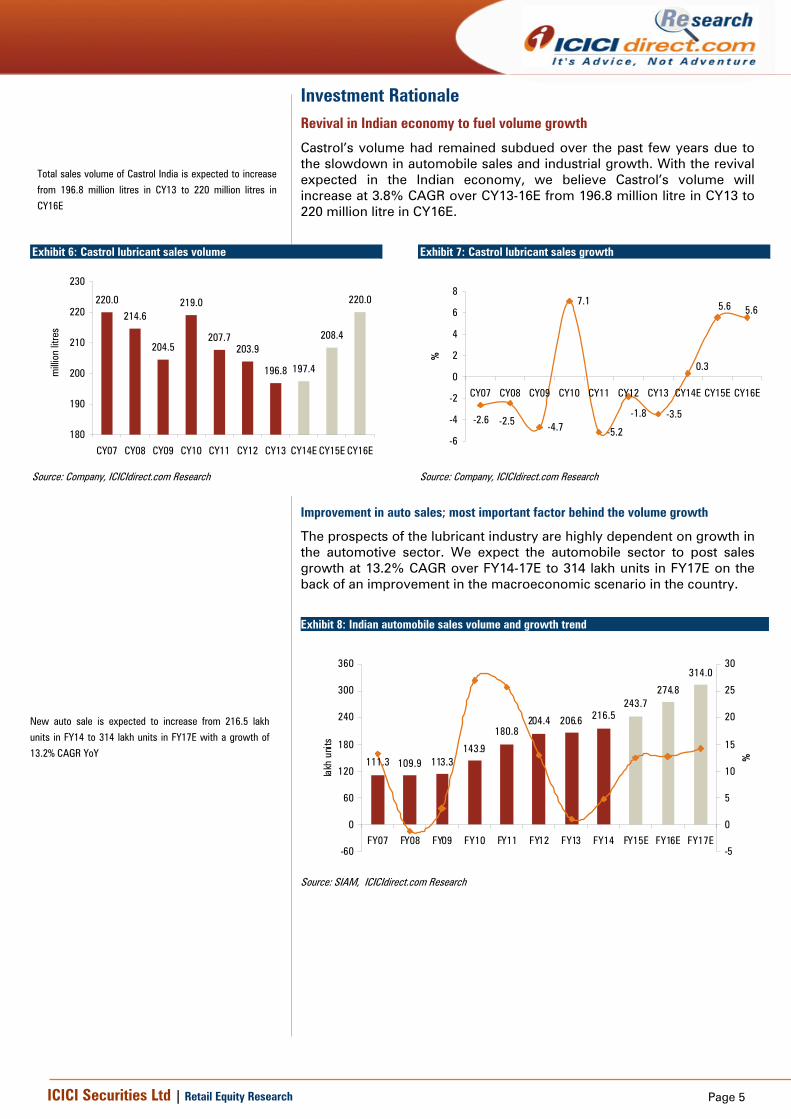
Investment Rationale Revival in Indian economy to fuel volume growth
Castrol’s volume had remained subdued over the past few years due to the slowdown in automobile sales and industrial growth. With the revival expected in the Indian economy, we believe Castrol’s volume will increase at 3.8% CAGR over CY13-16E from 196.8 million litre in CY13 to 220 million litre in CY16E.
Exhibit 6: Castrol lubricant sales volume
220.0
214.6
204.5
219.0
207.7203.9
196.8 197.4
208.4
220.0
180
190
200
210
220
230
CY07 CY08 CY09 CY10 CY11 CY12 CY13 CY14E CY15E CY16E
milli
on li
tres
Source: Company, ICICIdirect.com Research
Exhibit 7: Castrol lubricant sales growth
-4.7
7.1
-5.2
-3.5-2.5-2.6
-1.8
0.3
5.65.6
-6
-4
-2
0
2
4
6
8
CY07 CY08 CY09 CY10 CY11 CY12 CY13 CY14E CY15E CY16E
%
Source: Company, ICICIdirect.com Research
Improvement in auto sales; most important factor behind the volume growth
The prospects of the lubricant industry are highly dependent on growth in the automotive sector. We expect the automobile sector to post sales growth at 13.2% CAGR over FY14-17E to 314 lakh units in FY17E on the back of an improvement in the macroeconomic scenario in the country.
Exhibit 8: Indian automobile sales volume and growth trend
111.3 109.9 113.3143.9
180.8204.4 206.6 216.5
243.7274.8
314.0
-60
0
60
120
180
240
300
360
FY07 FY08 FY09 FY10 FY11 FY12 FY13 FY14 FY15E FY16E FY17E
lakh
uni
ts
-5
0
5
10
15
20
25
30
%
Source: SIAM, ICICIdirect.com Research
Total sales volume of Castrol India is expected to increase
from 196.8 million litres in CY13 to 220 million litres in
CY16E
New auto sale is expected to increase from 216.5 lakh
units in FY14 to 314 lakh units in FY17E with a growth of
13.2% CAGR YoY
Page 6ICICI Securities Ltd | Retail Equity Research
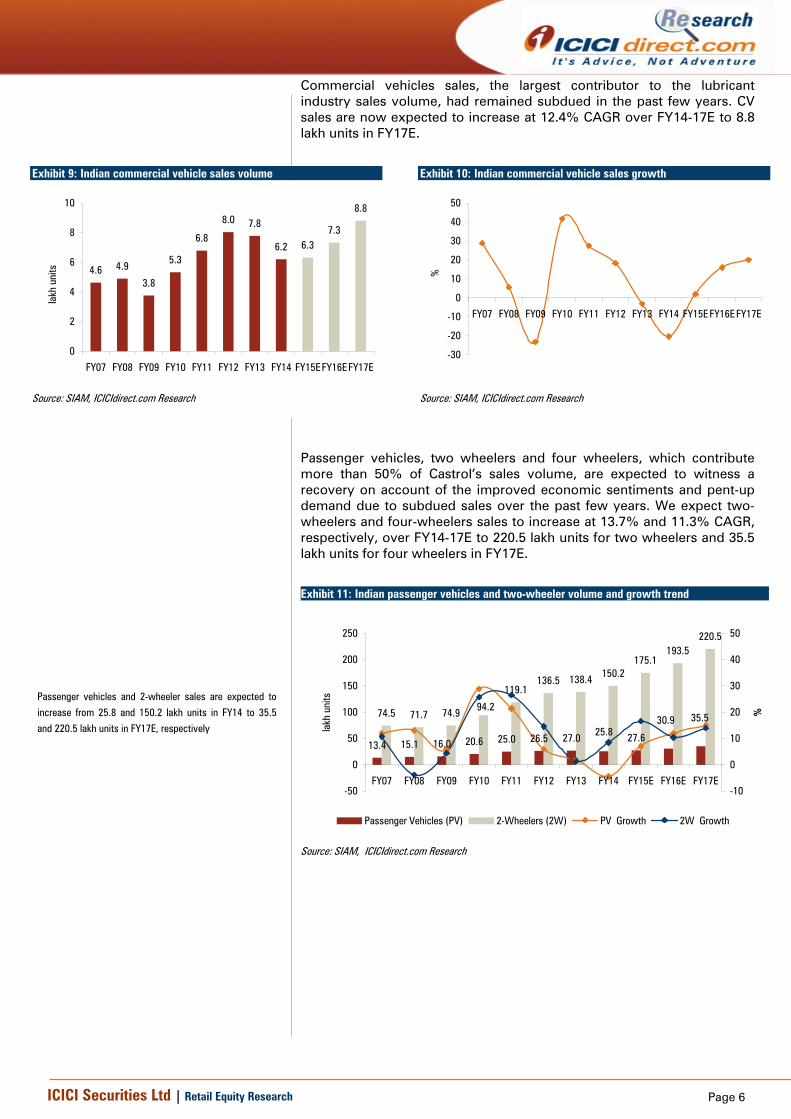
Commercial vehicles sales, the largest contributor to the lubricant industry sales volume, had remained subdued in the past few years. CV sales are now expected to increase at 12.4% CAGR over FY14-17E to 8.8 lakh units in FY17E.
Exhibit 9: Indian commercial vehicle sales volume
4.6 4.9
3.8
5.3
6.8
8.0 7.8
6.2 6.37.3
8.8
0
2
4
6
8
10
FY07 FY08 FY09 FY10 FY11 FY12 FY13 FY14 FY15EFY16EFY17E
lakh
uni
ts
Source: SIAM, ICICIdirect.com Research
Exhibit 10: Indian commercial vehicle sales growth
-30
-20
-10
0
10
20
30
40
50
FY07 FY08 FY09 FY10 FY11 FY12 FY13 FY14 FY15E FY16E FY17E
%
Source: SIAM, ICICIdirect.com Research
Passenger vehicles, two wheelers and four wheelers, which contribute more than 50% of Castrol’s sales volume, are expected to witness a recovery on account of the improved economic sentiments and pent-up demand due to subdued sales over the past few years. We expect two-wheelers and four-wheelers sales to increase at 13.7% and 11.3% CAGR, respectively, over FY14-17E to 220.5 lakh units for two wheelers and 35.5 lakh units for four wheelers in FY17E.
Exhibit 11: Indian passenger vehicles and two-wheeler volume and growth trend
13.4 15.1 16.0 20.6 25.0 26.5 27.0 27.6
74.5 71.7 74.9
119.1136.5 138.4 150.2
175.1193.5
220.5
30.9 35.525.8
94.2
-50
0
50
100
150
200
250
FY07 FY08 FY09 FY10 FY11 FY12 FY13 FY14 FY15E FY16E FY17E
lakh
uni
ts
-10
0
10
20
30
40
50
%
Passenger Vehicles (PV) 2-Wheelers (2W) PV Growth 2W Growth
Source: SIAM, ICICIdirect.com Research
Passenger vehicles and 2-wheeler sales are expected to
increase from 25.8 and 150.2 lakh units in FY14 to 35.5
and 220.5 lakh units in FY17E, respectively

Page 7ICICI Securities Ltd | Retail Equity Research
Hence, on the back of an improvement in automotive demand, we expect Castrol’s automotive sales to improve at 3.5% CAGR over CY13-16E from 169.3 million litre in CY13 to 187.9 million litre in CY16E.
Exhibit 12: Castrol auto sales volumes and growth trend
20.7 21.7 24.4 27.5 31.4
202.9222.5
244.2269.0
169.3 168.8 178.1 187.9181.4 175.6
-100
-50
0
50
100
150
200
250
300
CY12 CY13 CY14E CY15E CY16Em
illion
uni
ts
-8
-4
0
4
8
12
16
20
24
%
Vehicle Sales Registered Vehicles (E) Auto lubricants sales volume
Auto lubricants sales Growth Vehicle Sales Growth
Source: SIAM, ICICIdirect.com Research
Industry growth pick up will contribute to higher industrial sales volume
The demand for lubricants in the industrial sector is primarily driven by industrial production. The last few years have been challenging for Castrol in industrial sales due to subdued economic activity triggered by sustained inflation, higher raw material prices and lower demand for consumer goods & capital goods. Castrol’s lubricant sales volumes were also impacted due to aggressive pricing by PSU oil companies and other regional players.
Exhibit 13: IIP and industrial lubricants growth
-0.15.3
8.3
3.11.2
-2.9
-11.3
-14.1
10.4
5.5
-18
-12
-6
0
6
12
18
FY10/CY09 FY11/CY10 FY12/CY11 FY13/CY12 FY14/CY13
%
IIP Growth Castrol's Industrial lubricants volume Growth
Source: Bloomberg, Company, ICICIdirect.com Research
We expect Castrol’s automotive sales to improve at 3.5%
CAGR over CY13-16E from 169.3 million litre in CY13 to
187.9 million litre in CY16E
Castrol’s lubricant sales volumes were impacted in period
CY09-13 due to aggressive pricing by PSU oil companies
and other regional players
Page 8ICICI Securities Ltd | Retail Equity Research
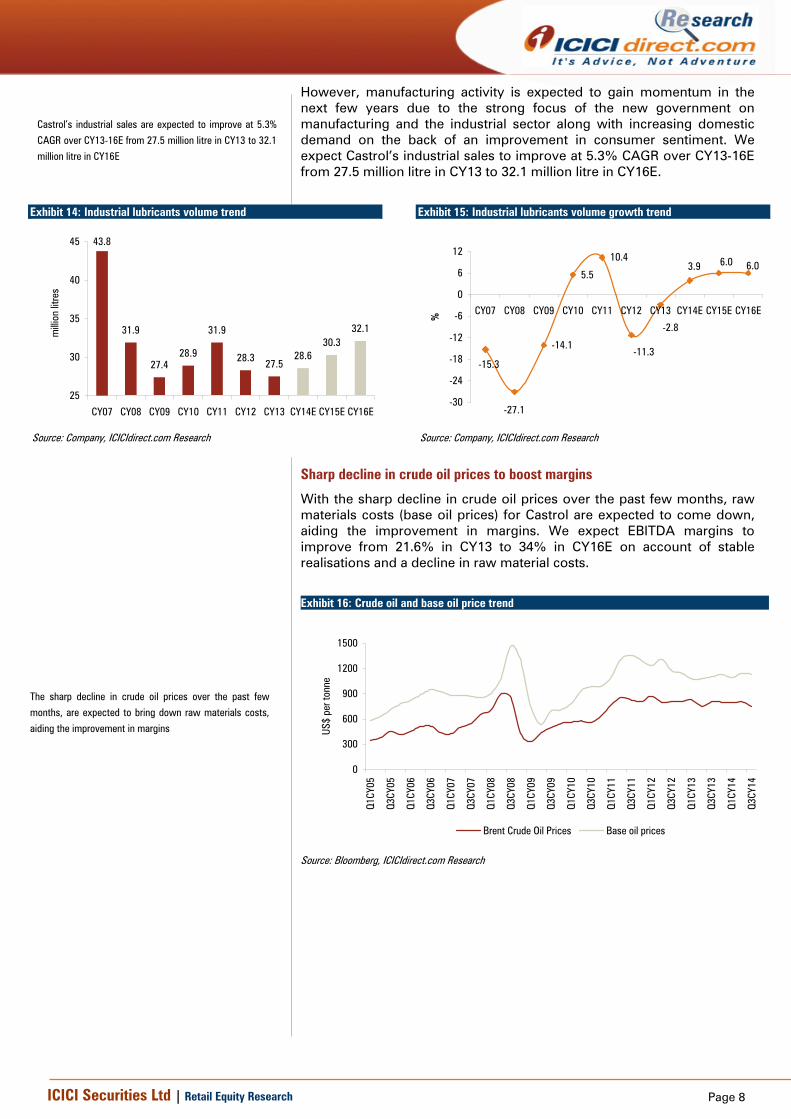
However, manufacturing activity is expected to gain momentum in the next few years due to the strong focus of the new government on manufacturing and the industrial sector along with increasing domestic demand on the back of an improvement in consumer sentiment. We expect Castrol’s industrial sales to improve at 5.3% CAGR over CY13-16E from 27.5 million litre in CY13 to 32.1 million litre in CY16E.
Exhibit 14: Industrial lubricants volume trend
43.8
31.9
27.428.9
31.9
28.3 27.528.6
30.332.1
25
30
35
40
45
CY07 CY08 CY09 CY10 CY11 CY12 CY13 CY14E CY15E CY16E
milli
on li
tres
Source: Company, ICICIdirect.com Research
Exhibit 15: Industrial lubricants volume growth trend
-14.1
5.5
10.4
-2.8
6.0 6.03.9
-11.3-15.3
-27.1-30
-24
-18
-12
-6
0
6
12
CY07 CY08 CY09 CY10 CY11 CY12 CY13 CY14E CY15E CY16E
%
Source: Company, ICICIdirect.com Research
Sharp decline in crude oil prices to boost margins
With the sharp decline in crude oil prices over the past few months, raw materials costs (base oil prices) for Castrol are expected to come down, aiding the improvement in margins. We expect EBITDA margins to improve from 21.6% in CY13 to 34% in CY16E on account of stable realisations and a decline in raw material costs.
Exhibit 16: Crude oil and base oil price trend
0
300
600
900
1200
1500
Q1CY
05
Q3CY
05
Q1CY
06
Q3CY
06
Q1CY
07
Q3CY
07
Q1CY
08
Q3CY
08
Q1CY
09
Q3CY
09
Q1CY
10
Q3CY
10
Q1CY
11
Q3CY
11
Q1CY
12
Q3CY
12
Q1CY
13
Q3CY
13
Q1CY
14
Q3CY
14
US$
per t
onne
Brent Crude Oil Prices Base oil prices
Source: Bloomberg, ICICIdirect.com Research
Castrol’s industrial sales are expected to improve at 5.3%
CAGR over CY13-16E from 27.5 million litre in CY13 to 32.1
million litre in CY16E
The sharp decline in crude oil prices over the past few
months, are expected to bring down raw materials costs,
aiding the improvement in margins
Page 9ICICI Securities Ltd | Retail Equity Research
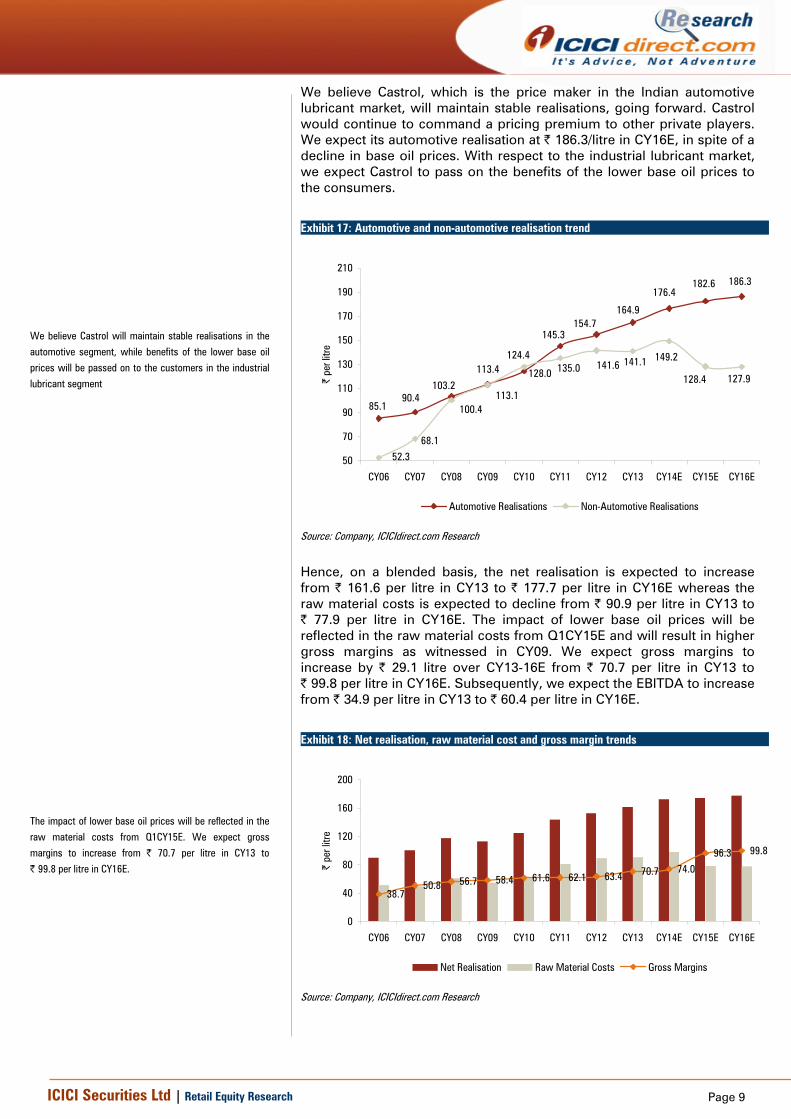
We believe Castrol, which is the price maker in the Indian automotive lubricant market, will maintain stable realisations, going forward. Castrol would continue to command a pricing premium to other private players. We expect its automotive realisation at | 186.3/litre in CY16E, in spite of a decline in base oil prices. With respect to the industrial lubricant market, we expect Castrol to pass on the benefits of the lower base oil prices to the consumers.
Exhibit 17: Automotive and non-automotive realisation trend
90.4
164.9154.7
103.2
113.4124.4
145.3
176.4182.6 186.3
85.1
52.3
68.1
141.1141.6128.0 135.0
113.1100.4
149.2
128.4 127.9
50
70
90
110
130
150
170
190
210
CY06 CY07 CY08 CY09 CY10 CY11 CY12 CY13 CY14E CY15E CY16E
| pe
r litr
e
Automotive Realisations Non-Automotive Realisations
Source: Company, ICICIdirect.com Research
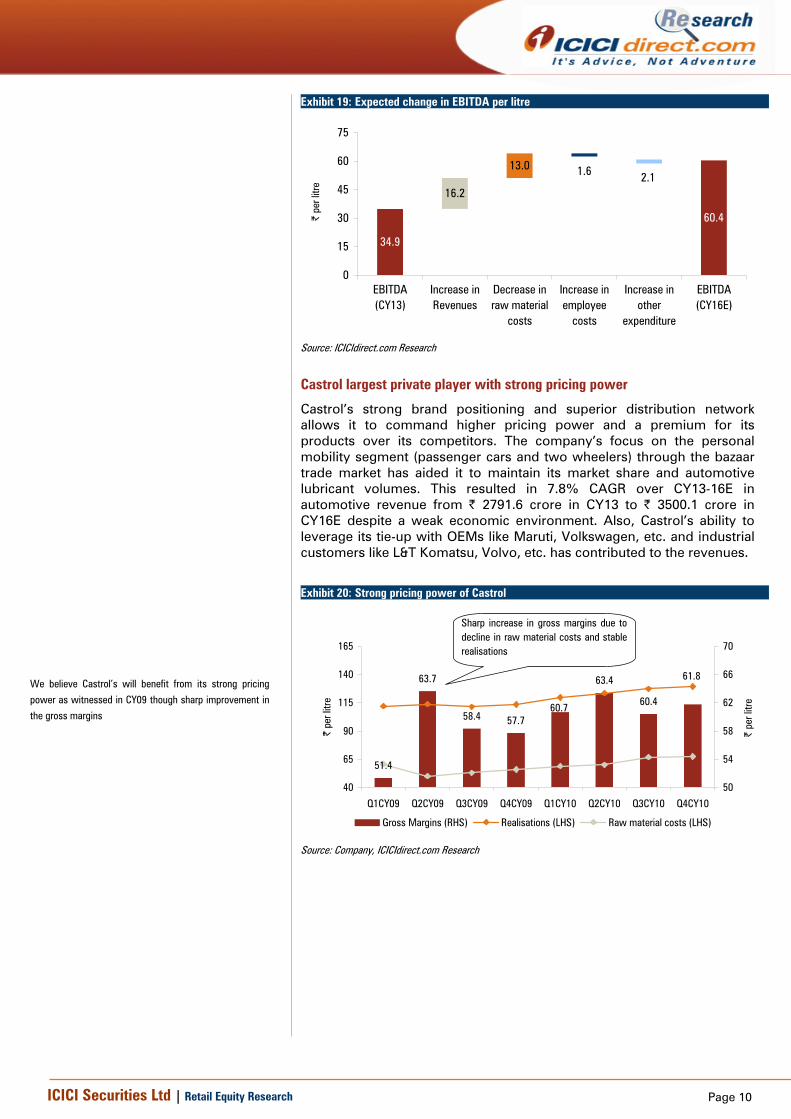
Hence, on a blended basis, the net realisation is expected to increase from | 161.6 per litre in CY13 to | 177.7 per litre in CY16E whereas the raw material costs is expected to decline from | 90.9 per litre in CY13 to | 77.9 per litre in CY16E. The impact of lower base oil prices will be reflected in the raw material costs from Q1CY15E and will result in higher gross margins as witnessed in CY09. We expect gross margins to increase by | 29.1 litre over CY13-16E from | 70.7 per litre in CY13 to | 99.8 per litre in CY16E. Subsequently, we expect the EBITDA to increase from | 34.9 per litre in CY13 to | 60.4 per litre in CY16E.
Exhibit 18: Net realisation, raw material cost and gross margin trends
38.750.8 56.7 58.4 61.6 62.1 63.4 70.7 74.0
96.3 99.8
0
40
80
120
160
200
CY06 CY07 CY08 CY09 CY10 CY11 CY12 CY13 CY14E CY15E CY16E
| pe
r litr
e
Net Realisation Raw Material Costs Gross Margins
Source: Company, ICICIdirect.com Research
We believe Castrol will maintain stable realisations in the
automotive segment, while benefits of the lower base oil
prices will be passed on to the customers in the industrial
lubricant segment
The impact of lower base oil prices will be reflected in the
raw material costs from Q1CY15E. We expect gross
margins to increase from | 70.7 per litre in CY13 to
| 99.8 per litre in CY16E.
Page 10ICICI Securities Ltd | Retail Equity Research
Exhibit 19: Expected change in EBITDA per litre
16.2
13.0 1.6 2.1
60.4
34.9
0
15
30
45
60
75
EBITDA(CY13)
Increase inRevenues
Decrease inraw material
costs
Increase inemployee
costs
Increase inother
expenditure
EBITDA(CY16E)
| pe
r litr
e
Source: ICICIdirect.com Research
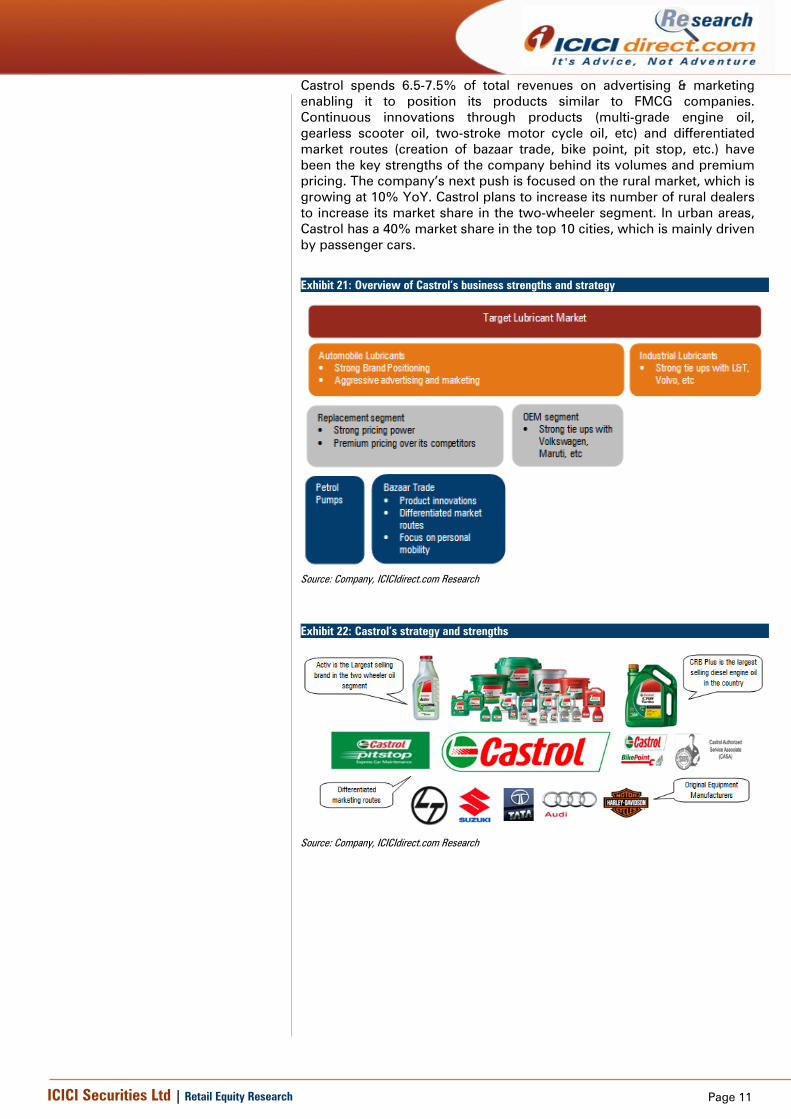
Castrol largest private player with strong pricing power
Castrol’s strong brand positioning and superior distribution network allows it to command higher pricing power and a premium for its products over its competitors. The company’s focus on the personal mobility segment (passenger cars and two wheelers) through the bazaar trade market has aided it to maintain its market share and automotive lubricant volumes. This resulted in 7.8% CAGR over CY13-16E in automotive revenue from | 2791.6 crore in CY13 to | 3500.1 crore in CY16E despite a weak economic environment. Also, Castrol’s ability to leverage its tie-up with OEMs like Maruti, Volkswagen, etc. and industrial customers like L&T Komatsu, Volvo, etc. has contributed to the revenues.
Exhibit 20: Strong pricing power of Castrol
51.4
63.7
58.4 57.7
63.4
60.4
61.8
60.7
40
65
90
115
140
165
Q1CY09 Q2CY09 Q3CY09 Q4CY09 Q1CY10 Q2CY10 Q3CY10 Q4CY10
| pe
r litr
e
50
54
58
62
66
70
| pe
r litr
e
Gross Margins (RHS) Realisations (LHS) Raw material costs (LHS)
Sharp increase in gross margins due todecline in raw material costs and stablerealisations
Source: Company, ICICIdirect.com Research
We believe Castrol’s will benefit from its strong pricing
power as witnessed in CY09 though sharp improvement in
the gross margins
Page 11ICICI Securities Ltd | Retail Equity Research
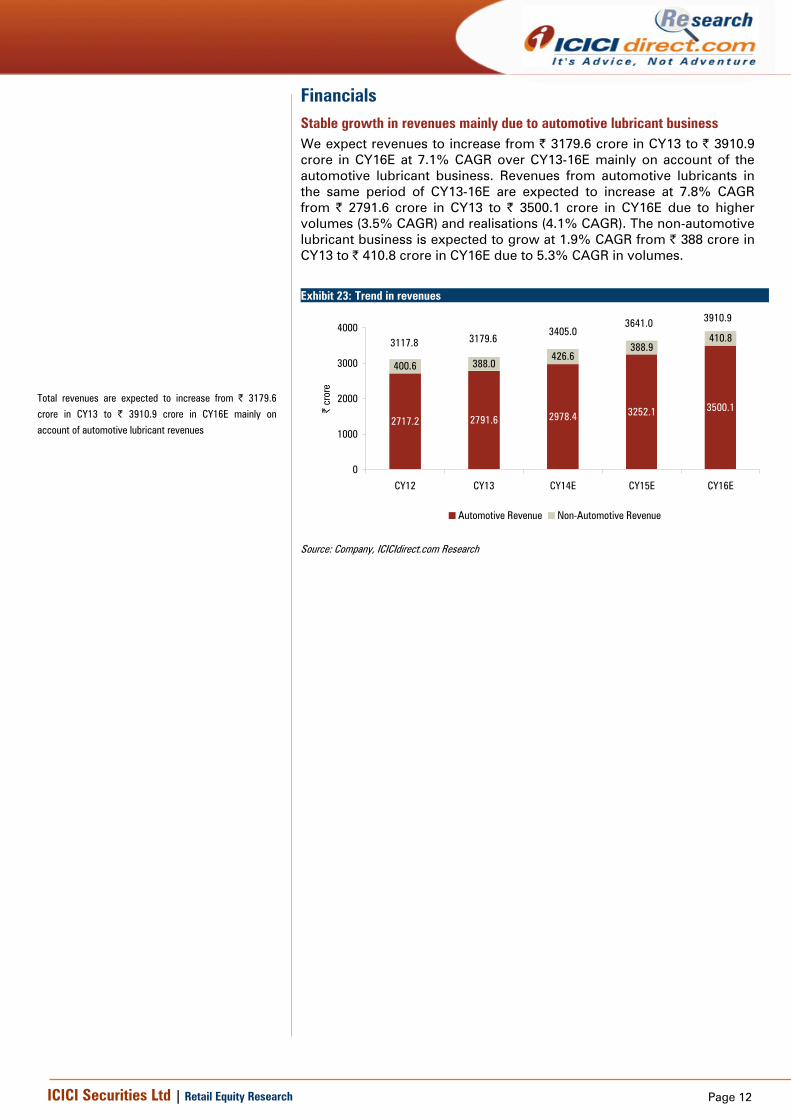
Castrol spends 6.5-7.5% of total revenues on advertising & marketing enabling it to position its products similar to FMCG companies. Continuous innovations through products (multi-grade engine oil, gearless scooter oil, two-stroke motor cycle oil, etc) and differentiated market routes (creation of bazaar trade, bike point, pit stop, etc.) have been the key strengths of the company behind its volumes and premium pricing. The company’s next push is focused on the rural market, which is growing at 10% YoY. Castrol plans to increase its number of rural dealers to increase its market share in the two-wheeler segment. In urban areas, Castrol has a 40% market share in the top 10 cities, which is mainly driven by passenger cars.
Exhibit 21: Overview of Castrol’s business strengths and strategy
Source: Company, ICICIdirect.com Research
Exhibit 22: Castrol’s strategy and strengths
Source: Company, ICICIdirect.com Research
Page 12ICICI Securities Ltd | Retail Equity Research
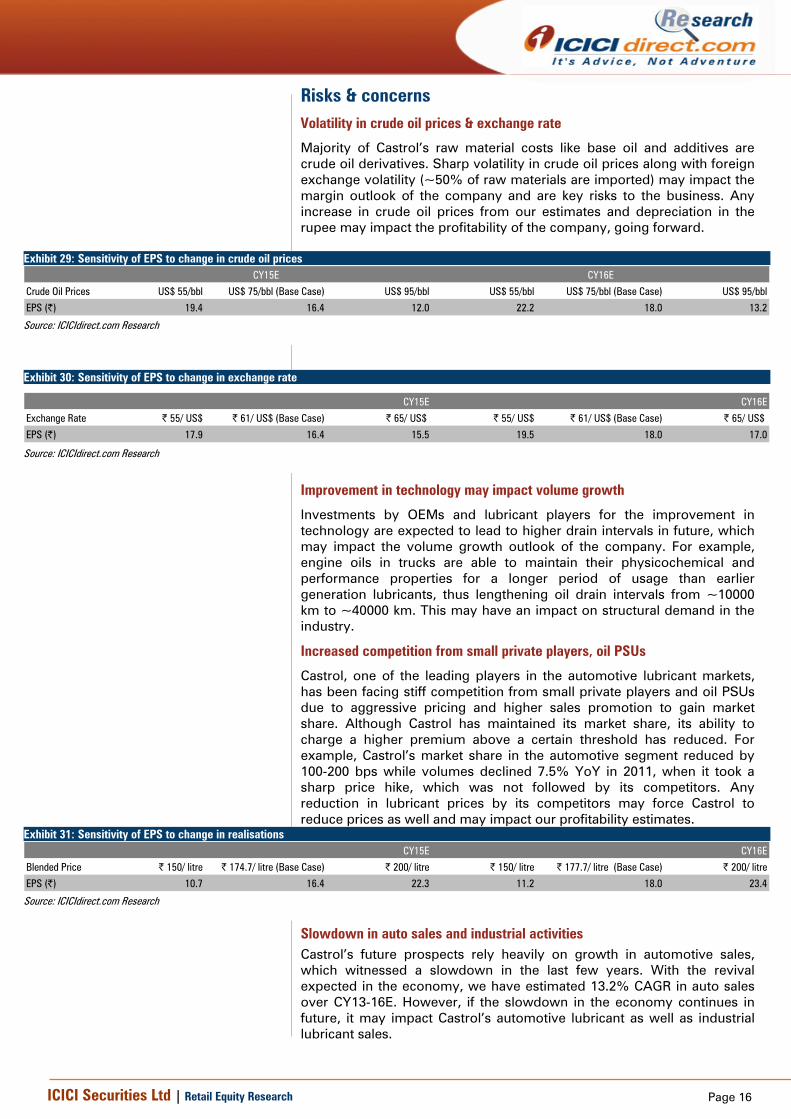
Financials Stable growth in revenues mainly due to automotive lubricant business We expect revenues to increase from | 3179.6 crore in CY13 to | 3910.9 crore in CY16E at 7.1% CAGR over CY13-16E mainly on account of the automotive lubricant business. Revenues from automotive lubricants in the same period of CY13-16E are expected to increase at 7.8% CAGR from | 2791.6 crore in CY13 to | 3500.1 crore in CY16E due to higher volumes (3.5% CAGR) and realisations (4.1% CAGR). The non-automotive lubricant business is expected to grow at 1.9% CAGR from | 388 crore in CY13 to | 410.8 crore in CY16E due to 5.3% CAGR in volumes.
Exhibit 23: Trend in revenues
2717.2 2791.6 2978.4 3252.1 3500.1
400.6 388.0426.6
388.9410.8
3910.93641.03405.0
3179.63117.8
0
1000
2000
3000
4000
CY12 CY13 CY14E CY15E CY16E
| cr
ore
Automotive Revenue Non-Automotive Revenue
Source: Company, ICICIdirect.com Research
Total revenues are expected to increase from | 3179.6
crore in CY13 to | 3910.9 crore in CY16E mainly on
account of automotive lubricant revenues

Page 13ICICI Securities Ltd | Retail Equity Research
Higher gross margins to drive EBITDA growth
The EBITDA of Castrol had marginally declined from | 733.2 crore in CY10 to | 687.6 crore in CY13 on the back of 10.1% decline in volumes from 219 million litre to 196.8 million litre. However, the gross margins per litre continued to remain strong during the same period. With the revival now expected in Indian automobile sales & industrial growth and due to the decline in crude oil prices, we expect gross margins per litre to increase from | 70.7 per litre in CY13 to | 99.8 per litre in CY16E (at 12.2% CAGR over CY13-16E) and volumes to increase from 196.8 million litre in CY13 to 220 million litre in CY16E at 3.8% CAGR over CY13-16E. Subsequently, the EBITDA is expected to increase from | 687.6 crore in CY13 to | 1328.6 crore in CY16E at 24.6% CAGR over CY13-16E. The EBITDA margin during the same period is expected to increase 1240 bps from 21.6% in CY13 to 34% in CY16E.
Exhibit 24: EBITDA and EBITDA margins trend
622.8 687.6 714.9
1207.11328.6
20.021.6 21.0
33.2 34.0
300
600
900
1200
1500
CY12 CY13 CY14E CY15E CY16E
| cr
ore
15
20
25
30
35
%
EBITDA EBITDA Margins
Source: Company, ICICIdirect.com Research
Exhibit 25: Trends in operational revenue break-up
58.5 56.2 57.144.9 43.8
4.1 4.6 4.7
4.9 5.1
17.5 17.5 17.2
17.1 17.1
20.0 21.6 21.033.2 34.0
0.0
20.0
40.0
60.0
80.0
100.0
CY12 CY13 CY14E CY15E CY16E
%
Raw Material Cost Employees Cost Other Expenditure EBITDA
Source: Company, ICICIdirect.com Research
EBITDA is expected to increase from | 687.6 crore in CY13
to | 1328.6 crore in CY16E with margins improving from
21.6% in CY13 to 34% in CY16E
Lower raw material costs as a percentage of revenues will
drive EBITDA margins

Page 14ICICI Securities Ltd | Retail Equity Research
Net profit to increase at 20.5% CAGR over CY13-16E
We expect PAT to grow at a CAGR of 20.5% over CY13-16E on the back of an 11.8% improvement in sales volumes and 41.1% increase in gross margins per litre during the same period. The PAT is expected to grow from | 508.6 crore in CY13 to | 889.1 crore in CY16E.
Exhibit 26: PAT trend
447.4 508.6 480.1
812.0 889.1
0
200
400
600
800
1000
CY12 CY13 CY14E CY15E CY16E
| cr
ore
Source: Company, ICICIdirect.com Research
With increasing profitability, we expect the company’s return ratios to improve, going forward. We expect the RoE to improve from 67.7% in CY13 to 110.5% in CY16E. The RoCE is also expected to improve from 87.4% in CY13 to 160.2% in CY16E. We expect the dividend to increase from | 7 per share in CY13 to | 13.5 per share in CY16E, with a dividend payout ratio of ~75%.
Exhibit 27: RoE and RoCE trend
68.9 67.782.9
116.5 110.5
91.8 87.4
117.6
168.2 160.2
-
40
80
120
160
200
CY12 CY13 CY14E CY15E CY16E
%
ROE ROCE
Source: Company, ICICIdirect.com Research
The PAT is expected to grow from | 508.6 crore in CY13 to
| 889.1 crore in CY16E at a CAGR of 20.5% over CY13-16E
Castrol’s ROE and ROCE is expected to increase from
67.7% and 87.4% in CY13 to 110.5% and 160.2% in CY16E,
respectively

Page 15ICICI Securities Ltd | Retail Equity Research
Exhibit 28: Dividend and payout ratio trend
7.0 7.0 7.0
12.013.5
75.173.172.168.1
77.4
-
3
6
9
12
15
CY12 CY13 CY14E CY15E CY16E
| pe
r sha
re
0
20
40
60
80
100
%
DPS Payout Ratio
Source: Company, ICICIdirect.com Research
We expect the dividend to increase from | 7 per share inCY13 to | 13.5 per share in CY16E, with a dividend payoutratio of ~75%.
Page 16ICICI Securities Ltd | Retail Equity Research
Risks & concerns Volatility in crude oil prices & exchange rate
Majority of Castrol’s raw material costs like base oil and additives are crude oil derivatives. Sharp volatility in crude oil prices along with foreign exchange volatility (~50% of raw materials are imported) may impact the margin outlook of the company and are key risks to the business. Any increase in crude oil prices from our estimates and depreciation in the rupee may impact the profitability of the company, going forward.
Exhibit 29: Sensitivity of EPS to change in crude oil prices
Crude Oil Prices US$ 55/bbl US$ 75/bbl (Base Case) US$ 95/bbl US$ 55/bbl US$ 75/bbl (Base Case) US$ 95/bbl
EPS (|) 19.4 16.4 12.0 22.2 18.0 13.2
CY15E CY16E
Source: ICICIdirect.com Research
Exhibit 30: Sensitivity of EPS to change in exchange rate
Exchange Rate | 55/ US$ | 61/ US$ (Base Case) | 65/ US$ | 55/ US$ | 61/ US$ (Base Case) | 65/ US$
EPS (|) 17.9 16.4 15.5 19.5 18.0 17.0
CY15E CY16E
Source: ICICIdirect.com Research
Improvement in technology may impact volume growth
Investments by OEMs and lubricant players for the improvement in technology are expected to lead to higher drain intervals in future, which may impact the volume growth outlook of the company. For example, engine oils in trucks are able to maintain their physicochemical and performance properties for a longer period of usage than earlier generation lubricants, thus lengthening oil drain intervals from ~10000 km to ~40000 km. This may have an impact on structural demand in the industry.
Increased competition from small private players, oil PSUs
Castrol, one of the leading players in the automotive lubricant markets, has been facing stiff competition from small private players and oil PSUs due to aggressive pricing and higher sales promotion to gain market share. Although Castrol has maintained its market share, its ability to charge a higher premium above a certain threshold has reduced. For example, Castrol’s market share in the automotive segment reduced by 100-200 bps while volumes declined 7.5% YoY in 2011, when it took a sharp price hike, which was not followed by its competitors. Any reduction in lubricant prices by its competitors may force Castrol to reduce prices as well and may impact our profitability estimates.
Exhibit 31: Sensitivity of EPS to change in realisations
Blended Price | 150/ litre | 174.7/ litre (Base Case) | 200/ litre | 150/ litre | 177.7/ litre (Base Case) | 200/ litre
EPS (|) 10.7 16.4 22.3 11.2 18.0 23.4
CY15E CY16E
Source: ICICIdirect.com Research
Slowdown in auto sales and industrial activities Castrol’s future prospects rely heavily on growth in automotive sales, which witnessed a slowdown in the last few years. With the revival expected in the economy, we have estimated 13.2% CAGR in auto sales over CY13-16E. However, if the slowdown in the economy continues in future, it may impact Castrol’s automotive lubricant as well as industrial lubricant sales.
Page 17ICICI Securities Ltd | Retail Equity Research
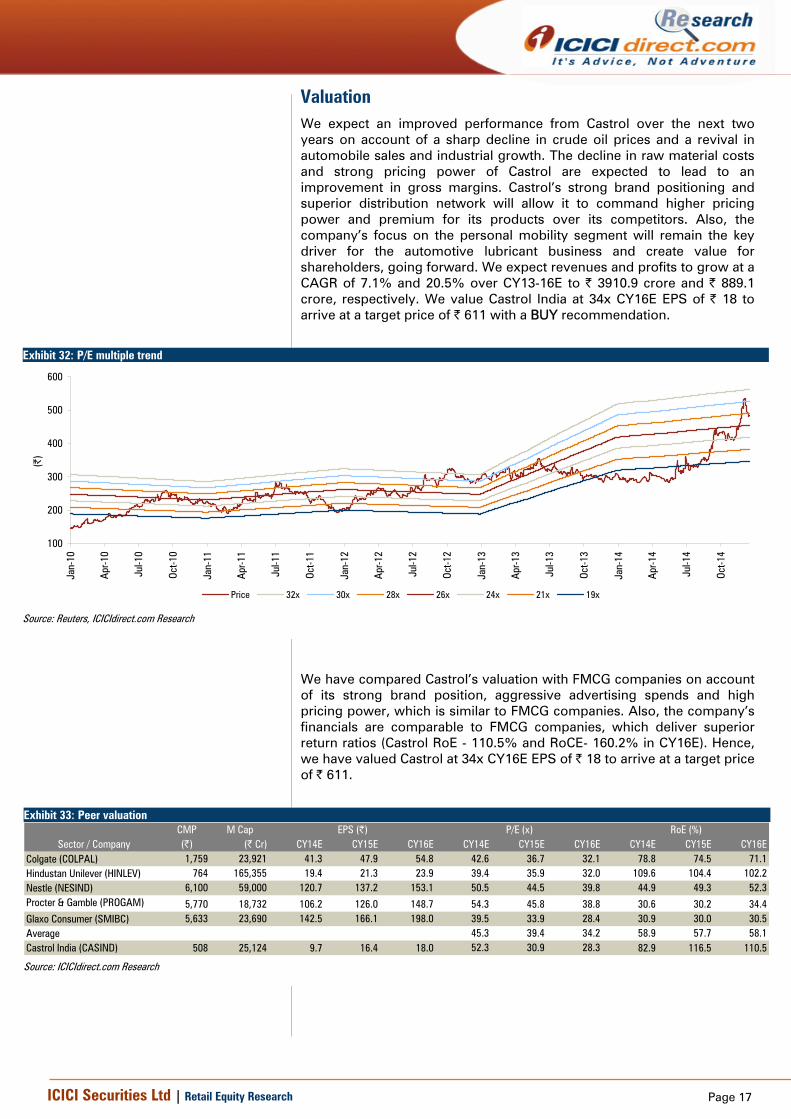
Valuation We expect an improved performance from Castrol over the next two years on account of a sharp decline in crude oil prices and a revival in automobile sales and industrial growth. The decline in raw material costs and strong pricing power of Castrol are expected to lead to an improvement in gross margins. Castrol’s strong brand positioning and superior distribution network will allow it to command higher pricing power and premium for its products over its competitors. Also, the company’s focus on the personal mobility segment will remain the key driver for the automotive lubricant business and create value for shareholders, going forward. We expect revenues and profits to grow at a CAGR of 7.1% and 20.5% over CY13-16E to | 3910.9 crore and | 889.1 crore, respectively. We value Castrol India at 34x CY16E EPS of | 18 to arrive at a target price of | 611 with a BUY recommendation.
Exhibit 32: P/E multiple trend
100
200
300
400
500
600
Jan-
10
Apr-1
0
Jul-1
0
Oct-1
0
Jan-
11
Apr-1
1
Jul-1
1
Oct-1
1
Jan-
12
Apr-1
2
Jul-1
2
Oct-1
2
Jan-
13
Apr-1
3
Jul-1
3
Oct-1
3
Jan-
14
Apr-1
4
Jul-1
4
Oct-1
4
(|)
Price 32x 30x 28x 26x 24x 21x 19x
Source: Reuters, ICICIdirect.com Research
We have compared Castrol’s valuation with FMCG companies on account of its strong brand position, aggressive advertising spends and high pricing power, which is similar to FMCG companies. Also, the company’s financials are comparable to FMCG companies, which deliver superior return ratios (Castrol RoE - 110.5% and RoCE- 160.2% in CY16E). Hence, we have valued Castrol at 34x CY16E EPS of | 18 to arrive at a target price of | 611.
Exhibit 33: Peer valuation
CMP M Cap(|) (| Cr) CY14E CY15E CY16E CY14E CY15E CY16E CY14E CY15E CY16E
Colgate (COLPAL) 1,759 23,921 41.3 47.9 54.8 42.6 36.7 32.1 78.8 74.5 71.1Hindustan Unilever (HINLEV) 764 165,355 19.4 21.3 23.9 39.4 35.9 32.0 109.6 104.4 102.2Nestle (NESIND) 6,100 59,000 120.7 137.2 153.1 50.5 44.5 39.8 44.9 49.3 52.3Procter & Gamble (PROGAM) 5,770 18,732 106.2 126.0 148.7 54.3 45.8 38.8 30.6 30.2 34.4Glaxo Consumer (SMIBC) 5,633 23,690 142.5 166.1 198.0 39.5 33.9 28.4 30.9 30.0 30.5Average 45.3 39.4 34.2 58.9 57.7 58.1Castrol India (CASIND) 508 25,124 9.7 16.4 18.0 52.3 30.9 28.3 82.9 116.5 110.5
Sector / CompanyEPS (|) P/E (x) RoE (%)
Source: ICICIdirect.com Research

Page 18ICICI Securities Ltd | Retail Equity Research
Financial Summary Exhibit 34: Profit and Loss Statement (| crore) (Year-end December) CY12 CY13 CY14E CY15E CY16ERevenue 3120.9 3179.6 3405.0 3641.0 3910.9Growth (%) 4.3 1.9 7.1 6.9 7.4(Inc.)/(Dec.) in stock in trade -17.3 -31.4 -4.5 0.0 0.0Raw material Costs 1694.8 1681.4 1782.8 1494.6 1570.6Purchase of Products 146.8 138.5 165.7 138.8 143.7Employee Costs 128.4 146.0 158.8 177.9 199.2Other Expenditure 545.4 557.5 587.3 622.6 668.8Op. Expenditure 2,498.1 2,492.0 2,690.1 2,433.9 2,582.3EBITDA 622.8 687.6 714.9 1207.1 1328.6Growth (%) -7.0 10.4 4.0 68.8 10.1Depreciation 26.6 30.5 33.6 35.0 39.4EBIT 596.2 657.1 681.3 1172.1 1289.2Interest 2.1 1.7 2.2 1.8 2.0Other Income 72.2 106.4 49.3 60.0 60.0PBT 666.3 761.8 728.4 1230.3 1347.2Growth (%) -6.9 14.3 -4.4 68.9 9.5Tax 218.9 253.2 248.4 418.3 458.0Reported PAT 447.4 508.6 480.1 812.0 889.1Growth (%) -7.0 13.7 -5.6 69.1 9.5EPS 9.0 10.3 9.7 16.4 18.0
Source: Company, ICICIdirect.com Research
Exhibit 35: Balance Sheet (| crore)
(Year-end December) CY12 CY13 CY14E CY15E CY16ESource of FundsEquity Capital 494.6 494.6 247.3 247.3 247.3Preference capital 0.0 0.0 0.0 0.0 0.0Reserves & Surplus 154.7 256.9 331.9 449.5 557.5Shareholder's Fund 649.2 751.4 579.2 696.8 804.8Loan Funds 0.0 0.0 0.0 0.0 0.0Deferred Tax Liability -65.9 -53.0 -53.0 -53.0 -53.0Minority Interest 0.0 0.0 0.0 0.0 0.0Source of Funds 583.3 698.5 526.2 643.8 751.8
Application of FundsGross Block 202.6 193.1 226.8 261.8 301.2Less: Acc. Depreciation 126.1 143.5 124.8 104.8 80.4Net Block 31.0 31.9 31.9 31.9 31.9Capital WIP 157.1 175.3 156.7 136.7 112.3Total Fixed Assets 188.0 207.2 188.6 168.6 144.1Investments 0.0 0.0 0.0 0.0 0.0Inventories 315.8 374.0 401.1 428.9 460.7Debtor 219.6 237.2 251.9 269.3 289.3Cash 573.8 594.2 435.0 746.0 918.6Loan & Advance, Other CA 147.4 181.3 191.3 201.3 211.3Total Current assets 1256.6 1386.7 1279.2 1645.5 1879.9Current Liabilities 563.5 604.6 648.4 693.3 744.7Provisions 266.8 259.0 261.4 445.1 495.7Total CL and Provisions 830.3 863.6 909.7 1138.4 1240.4Net Working Capital 426.2 523.1 369.5 507.2 639.6Miscellaneous expense 0.0 0.0 0.0 0.0 0.0Application of Funds 583.3 698.5 526.2 643.8 751.8
Source: Company, ICICIdirect.com Research

Page 19ICICI Securities Ltd | Retail Equity Research
Exhibit 36: Cash Flow Statement (| crore) (Year-end December) CY12 CY13 CY14E CY15E CY16EProfit after Tax 447.4 508.6 480.1 812.0 889.1Less: Dividend Paid 402.4 405.0 405.0 694.4 781.2Add: Depreciation 26.6 30.5 33.6 35.0 39.4Add: Others 0.0 0.0 0.0 0.0 0.0Cash Profit 62.0 147.0 108.6 152.6 147.4Increase/(Decrease) in CL 31.2 33.3 46.1 228.6 102.0(Increase)/Decrease in CA -28.3 -109.7 -51.8 -55.3 -61.8CF from Operating Activities 64.9 70.6 103.0 326.0 187.6Purchase of Fixed Assets 40.1 48.7 15.0 15.0 15.0(Inc)/Dec in Investments 0.0 0.0 0.0 0.0 0.0Others 0.0 0.0 1.0 2.0 3.0CF from Investing Activities -40.1 -48.7 -15.0 -15.0 -15.0Inc/(Dec) in Loan Funds 0.0 0.0 0.0 0.0 0.0Inc/(Dec) in Sh. Cap. & Res. 0.0 -1.3 -247.3 0.0 0.0Others 0.0 0.0 1.0 2.0 3.0CF from financing activities 0.0 -1.3 -247.3 0.0 0.0Change in cash Eq. 24.8 20.5 -159.2 311.0 172.6Op. Cash and cash Eq. 549.0 573.8 594.2 435.0 746.0Cl. Cash and cash Eq. 573.8 594.2 435.0 746.0 918.6
Source: Company, ICICIdirect.com Research
Exhibit 37: Ratio Analysis
(Year-end December) CY12 CY13 CY14E CY15E CY16EPer share data (|)Book Value 13.1 15.2 11.7 14.1 16.3Cash per share 11.6 12.0 8.8 15.1 18.6EPS 9.0 10.3 9.7 16.4 18.0Cash EPS 9.6 10.9 10.4 17.1 18.8DPS 7.0 7.0 7.0 12.0 13.5Profitability & Operating RatiosEBITDA Margin (%) 20.0 21.6 21.0 33.2 34.0PAT Margin (%) 14.3 16.0 14.1 22.3 22.7Fixed Asset Turnover (x) 19.9 18.1 21.7 26.6 34.8Inventory Turnover (Days) 36.9 42.9 43.0 43.0 43.0Debtor (Days) 25.7 27.2 27.0 27.0 27.0Current Liabilities (Days) 65.9 69.4 69.5 69.5 69.5Return Ratios (%)RoE 68.9 67.7 82.9 116.5 110.5RoCE 91.8 87.4 117.6 168.2 160.2RoIC 790.2 418.0 472.5 NA NAValuation Ratios (x)PE 56.2 49.4 52.3 30.9 28.3Price to Book Value 38.7 33.4 43.4 36.1 31.2EV/EBITDA 39.4 35.7 34.5 20.2 18.2EV/Sales 7.9 7.7 7.3 6.7 6.2Leverage & Solvency RatiosDebt to equity (x) 0.0 0.0 0.0 0.0 0.0Interest Coverage (x) 283.9 386.5 309.7 651.2 644.6Debt to EBITDA (x) 0.0 0.0 0.0 0.0 0.0Current Ratio 1.5 1.6 1.4 1.4 1.5Quick ratio 1.1 1.2 1.0 1.1 1.1
Source: Company, ICICIdirect.com Research

Page 20ICICI Securities Ltd | Retail Equity Research
Annexure Overview of BP-Castrol’s global lubricant operations
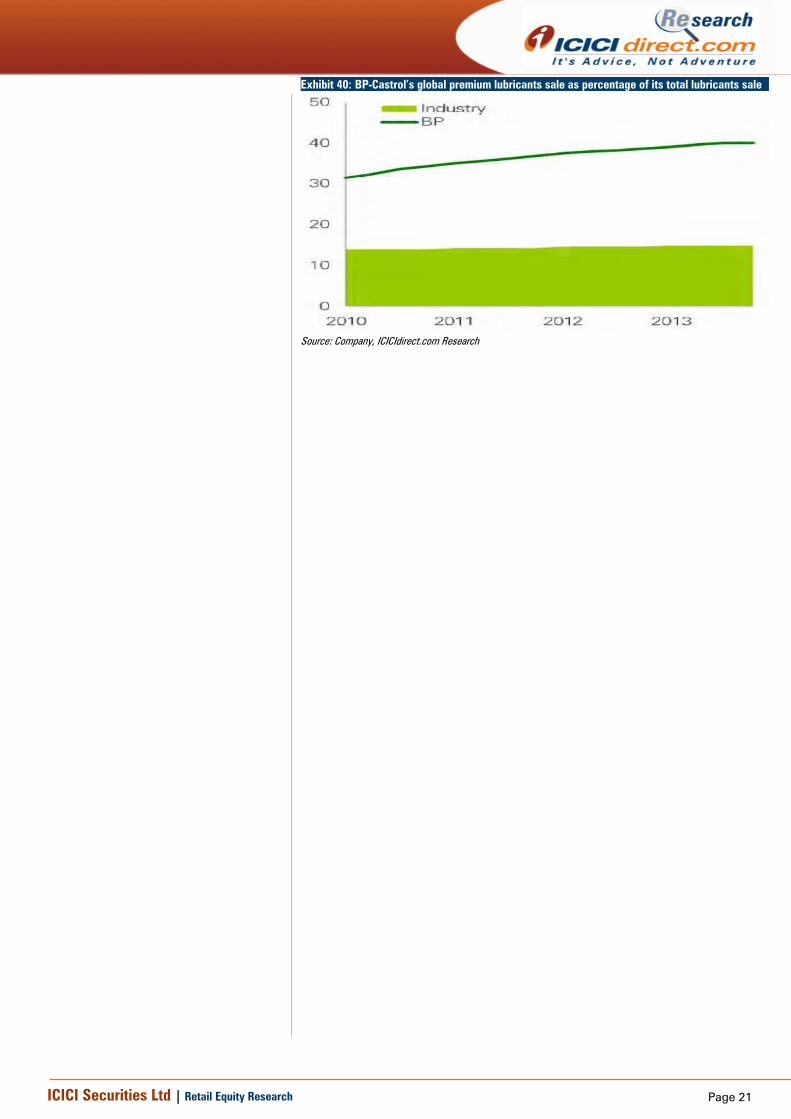
Castrol’s global lubricants business is focused on quality premium lubricants and high growth markets, with competitive advantage driven by leading brands, advantaged formulation technology and distinctive partner and customer relationships. The Lubricants business has become a material part of Downstream with pre-tax profits of nearly $1.3bn in 2013 representing over 4% p.a. growth over the last five years. Castrol’s earnings from outside the OECD markets have increased by over 250% since 2007. The company has been re-shaping earnings in the OECD as they aim to expand margins and secure customers through a focus on premium lubricants with advantaged formulation technology, and pursue efficiencies through differentiated routes to market.
Exhibit 38: BP-Castrol’s global lubricants pre-tax earnings (US$ million)
Source: Company, ICICIdirect.com Research
Exhibit 39: BP-Castrol’s global downstream performance
Source: Company, ICICIdirect.com Research
Page 21ICICI Securities Ltd | Retail Equity Research
Exhibit 40: BP-Castrol’s global premium lubricants sale as percentage of its total lubricants sale
Source: Company, ICICIdirect.com Research

Page 22ICICI Securities Ltd | Retail Equity Research
RATING RATIONALE ICICIdirect.com endeavours to provide objective opinions and recommendations. ICICIdirect.com assigns ratings to its stocks according to their notional target price vs. current market price and then categorises them as Strong Buy, Buy, Hold and Sell. The performance horizon is two years unless specified and the notional target price is defined as the analysts' valuation for a stock. Strong Buy: >15%/20% for large caps/midcaps, respectively, with high conviction; Buy: >10%/15% for large caps/midcaps, respectively; Hold: Up to +/-10%; Sell: -10% or more;
Pankaj Pandey Head – Research [email protected]
ICICIdirect.com Research Desk, ICICI Securities Limited, 1st Floor, Akruti Trade Centre, Road No 7, MIDC, Andheri (East) Mumbai – 400 093

Page 23ICICI Securities Ltd | Retail Equity Research
ANALYST CERTIFICATION We /I, Mayur Matani, MBA and Utkarsh Tathagath, MBA Research Analysts, authors and the names subscribed to this report, hereby certify that all of the views expressed in this research report accurately reflect our views about the subject issuer(s) or securities. We also certify that no part of our compensation was, is, or will be directly or indirectly related to the specific recommendation(s) or view(s) in this report.
Terms & conditions and other disclosures: ICICI Securities Limited (ICICI Securities) is a full-service, integrated investment banking and is, inter alia, engaged in the business of stock brokering and distribution of financial products. ICICI Securities is a wholly-owned subsidiary of ICICI Bank which is India’s largest private sector bank and has its various subsidiaries engaged in businesses of housing finance, asset management, life insurance, general insurance, venture capital fund management, etc. (“associates”), the details in respect of which are available on www.icicibank.com. ICICI Securities is one of the leading merchant bankers/ underwriters of securities and participate in virtually all securities trading markets in India. We and our associates might have investment banking and other business relationship with a significant percentage of companies covered by our Investment Research Department. ICICI Securities generally prohibits its analysts, persons reporting to analysts and their relatives from maintaining a financial interest in the securities or derivatives of any companies that the analysts cover. The information and opinions in this report have been prepared by ICICI Securities and are subject to change without any notice. The report and information contained herein is strictly confidential and meant solely for the selected recipient and may not be altered in any way, transmitted to, copied or distributed, in part or in whole, to any other person or to the media or reproduced in any form, without prior written consent of ICICI Securities. While we would endeavour to update the information herein on a reasonable basis, ICICI Securities is under no obligation to update or keep the information current. Also, there may be regulatory, compliance or other reasons that may prevent ICICI Securities from doing so. Non-rated securities indicate that rating on a particular security has been suspended temporarily and such suspension is in compliance with applicable regulations and/or ICICI Securities policies, in circumstances where ICICI Securities might be acting in an advisory capacity to this company, or in certain other circumstances. This report is based on information obtained from public sources and sources believed to be reliable, but no independent verification has been made nor is its accuracy or completeness guaranteed. This report and information herein is solely for informational purpose and shall not be used or considered as an offer document or solicitation of offer to buy or sell or subscribe for securities or other financial instruments. Though disseminated to all the customers simultaneously, not all customers may receive this report at the same time. ICICI Securities will not treat recipients as customers by virtue of their receiving this report. Nothing in this report constitutes investment, legal, accounting and tax advice or a representation that any investment or strategy is suitable or appropriate to your specific circumstances. The securities discussed and opinions expressed in this report may not be suitable for all investors, who must make their own investment decisions, based on their own investment objectives, financial positions and needs of specific recipient. This may not be taken in substitution for the exercise of independent judgment by any recipient. The recipient should independently evaluate the investment risks. The value and return on investment may vary because of changes in interest rates, foreign exchange rates or any other reason. ICICI Securities accepts no liabilities whatsoever for any loss or damage of any kind arising out of the use of this report. Past performance is not necessarily a guide to future performance. Investors are advised to see Risk Disclosure Document to understand the risks associated before investing in the securities markets. Actual results may differ materially from those set forth in projections. Forward-looking statements are not predictions and may be subject to change without notice. ICICI Securities or its associates might have managed or co-managed public offering of securities for the subject company or might have been mandated by the subject company for any other assignment in the past twelve months. ICICI Securities or its associates might have received any compensation from the companies mentioned in the report during the period preceding twelve months from the date of this report for services in respect of managing or co-managing public offerings, corporate finance, investment banking or merchant banking, brokerage services or other advisory service in a merger or specific transaction. ICICI Securities or its associates might have received any compensation for products or services other than investment banking or merchant banking or brokerage services from the companies mentioned in the report in the past twelve months. ICICI Securities encourages independence in research report preparation and strives to minimize conflict in preparation of research report. ICICI Securities or its analysts did not receive any compensation or other benefits from the companies mentioned in the report or third party in connection with preparation of the research report. Accordingly, neither ICICI Securities nor Research Analysts have any material conflict of interest at the time of publication of this report. It is confirmed that Mayur Matani, MBA and Utkarsh Tathagath, MBA, Research Analysts of this report have not received any compensation from the companies mentioned in the report in the preceding twelve months. Compensation of our Research Analysts is not based on any specific merchant banking, investment banking or brokerage service transactions. ICICI Securities or its subsidiaries collectively or Research Analysts do not own 1% or more of the equity securities of the Company mentioned in the report as of the last day of the month preceding the publication of the research report. Since associates of ICICI Securities are engaged in various financial service businesses, they might have financial interests or beneficial ownership in various companies including the subject company/companies mentioned in this report. It is confirmed that Mayur Matani, MBA and Utkarsh Tathagath, MBA, Research Analysts do not serve as an officer, director or employee of the companies mentioned in the report. ICICI Securities may have issued other reports that are inconsistent with and reach different conclusion from the information presented in this report. Neither the Research Analysts nor ICICI Securities have been engaged in market making activity for the companies mentioned in the report. We submit that no material disciplinary action has been taken on ICICI Securities by any Regulatory Authority impacting Equity Research Analysis activities. This report is not directed or intended for distribution to, or use by, any person or entity who is a citizen or resident of or located in any locality, state, country or other jurisdiction, where such distribution, publication, availability or use would be contrary to law, regulation or which would subject ICICI Securities and affiliates to any registration or licensing requirement within such jurisdiction. The securities described herein may or may not be eligible for sale in all jurisdictions or to certain category of investors. Persons in whose possession this document may come are required to inform themselves of and to observe such restriction.