Embed Size (px)
Citation preview
SEE
R C
ancer Statistics Review
1975-2016N
ational Cancer Institute
Joinpoint Regression Program Version 47 February 2019 National Cancer Institute (httpssurveillancecancergovjoinpoint)The APC is the Annual Percent Change based on rates age-adjusted to the 2000 US Std Population (19 age groups - Census P25-1130)
a Trends are from the SEER 9 areas (San Francisco Connecticut Detroit Hawaii Iowa New Mexico Seattle Utah and Atlanta)b Trends are from the SEER 21 areas (SEER 9 areas Los Angeles Alaska Native Registry Rural Georgia California excluding
SFSJMLA Kentucky Louisiana New Jersey Georgia excluding ATLRG Idaho New York and Massachusetts)c Trends are from US Mortality Files National Center for Health Statistics Centers for Disease Control and Preventiond The AAPC is the Average Annual Percent Change and is based on the APCs calculated by Joinpointe API - AsianPacific Islander AIAN - American IndianAlaska Native NH - Non-Hispanicf Hispanic and Non-Hispanic are not mutually exclusive from whites blacks AsianPacific Islanders and American IndiansAlaska
Natives Incidence data for Hispanics and Non-Hispanics are based on NHIA and exclude cases from the Alaska Native Registryg Data for American IndianAlaska Native are based on the PurchasedReferred Care Delivery Area (PRCDA) counties The APCAAPC is significantly different from zero (plt05)- Joinpoint regression line analysis could not be performed on data series
JP Trend 1 JP Trend 2 JP Trend 3 JP Trend 4 JP Trend 5 JP Trend 6 AAPCd
Years APC Years APC Years APC Years APC Years APC Years APC 2007-16 2012-16
SEER 9 Delay-Adjusted Incidencea 1975-2016
All Races 1975-98 02 1998-16 08 08 08
White 1975-98 03 1998-16 10 10 10
Black 1975-16 03 03 03
SEER 21 Delay-Adjusted Incidenceb 2000-2016
All Races 2000-07 01 2007-11 27 2011-16 00 12 00
White 2000-08 05 2008-11 33 2011-16 00 12 00
White NHef 2000-08 05 2008-11 37 2011-16 01 13 01
Black 2000-07 -10 2007-16 22 22 22
Black NHef 2000-07 -10 2007-16 22 22 22
APIe 2000-16 07 07 07
AIANeg 2000-16 19 19 19
Hispanicf 2000-16 07 07 07
US Cancer Mortalityc 1975-2016
All Races 1975-80 06 1980-88 -06 1988-91 07 1991-01 -06 2001-13 -10 2013-16 -27 -16 -23
White 1975-00 -03 2000-13 -09 2013-16 -26 -14 -22
Black 1975-93 05 1993-16 -14 -14 -14
US Cancer Mortalityc 2000-2016
All Races 2000-13 -10 2013-16 -27 -16 -23
White 2000-13 -09 2013-16 -26 -14 -22
White NHef 2000-13 -08 2013-16 -25 -14 -21
Black 2000-16 -15 -15 -15
Black NHef 2000-16 -15 -15 -15
APIe 2000-12 02 2012-16 -42 -18 -42
AIANeg 2000-16 -16 -16 -16
Hispanicf 2000-16 -08 -08 -08
Table 131
Leukemia
Trends in SEER Incidenceab and US Mortalityc Using the Joinpoint Regression Program
1975-2016 With up to Five Joinpoints 2000-2016 With up to Three Joinpoints
Both Sexes by RaceEthnicity
SEE
R C
ancer Statistics Review
1975-2016N
ational Cancer Institute
Joinpoint Regression Program Version 47 February 2019 National Cancer Institute (httpssurveillancecancergovjoinpoint)The APC is the Annual Percent Change based on rates age-adjusted to the 2000 US Std Population (19 age groups - Census P25-1130)
a Trends are from the SEER 9 areas (San Francisco Connecticut Detroit Hawaii Iowa New Mexico Seattle Utah and Atlanta)b Trends are from the SEER 21 areas (SEER 9 areas Los Angeles Alaska Native Registry Rural Georgia California excluding
SFSJMLA Kentucky Louisiana New Jersey Georgia excluding ATLRG Idaho New York and Massachusetts)c Trends are from US Mortality Files National Center for Health Statistics Centers for Disease Control and Preventiond The AAPC is the Average Annual Percent Change and is based on the APCs calculated by Joinpointe API - AsianPacific Islander AIAN - American IndianAlaska Native NH - Non-Hispanicf Hispanic and Non-Hispanic are not mutually exclusive from whites blacks AsianPacific Islanders and American IndiansAlaska
Natives Incidence data for Hispanics and Non-Hispanics are based on NHIA and exclude cases from the Alaska Native Registryg Data for American IndianAlaska Native are based on the PurchasedReferred Care Delivery Area (PRCDA) counties The APCAAPC is significantly different from zero (plt05)- Joinpoint regression line analysis could not be performed on data series
JP Trend 1 JP Trend 2 JP Trend 3 JP Trend 4 JP Trend 5 JP Trend 6 AAPCd
Years APC Years APC Years APC Years APC Years APC Years APC 2007-16 2012-16
SEER 9 Delay-Adjusted Incidencea 1975-2016
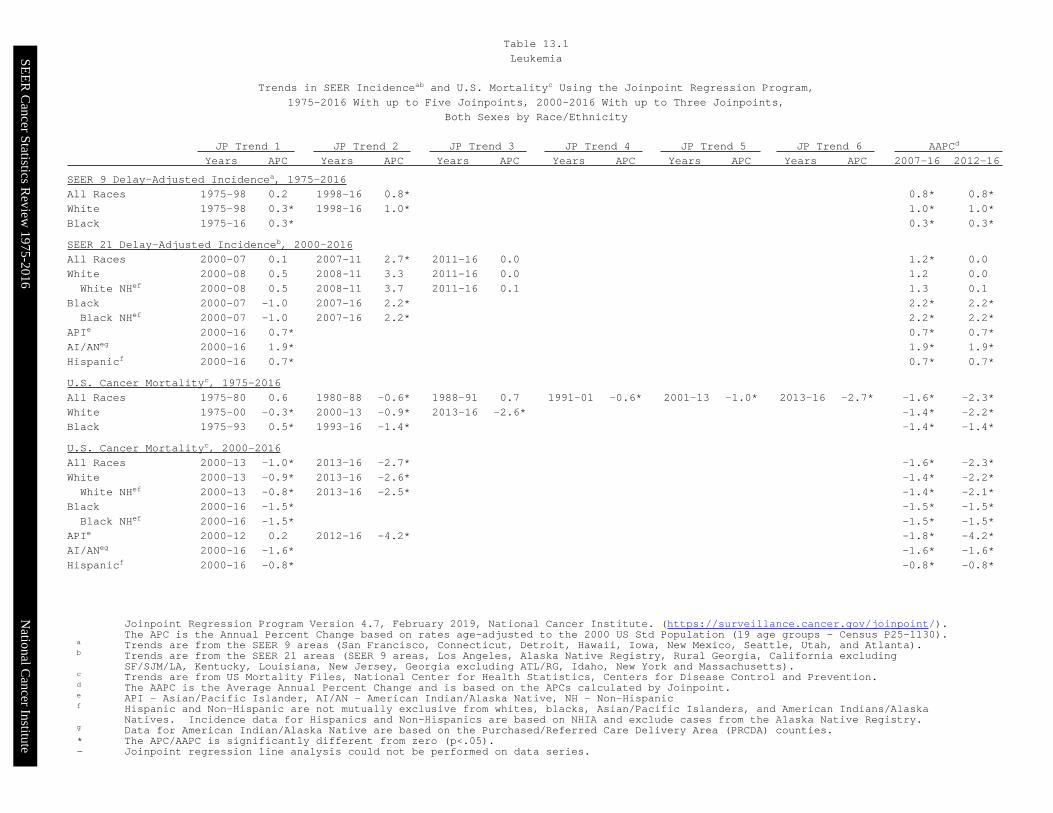
All Races 1975-98 00 1998-16 07 07 07
White 1975-98 01 1998-16 08 08 08
Black 1975-16 02 02 02
SEER 21 Delay-Adjusted Incidenceb 2000-2016
All Races 2000-07 00 2007-11 26 2011-16 00 12 00
White 2000-06 01 2006-13 19 2013-16 -07 10 -01
White NHef 2000-08 04 2008-11 36 2011-16 02 13 02
Black 2000-16 08 08 08
Black NHef 2000-16 09 09 09
APIe 2000-16 06 06 06
AIANeg 2000-16 32 32 32
Hispanicf 2000-16 05 05 05
US Cancer Mortalityc 1975-2016
All Races 1975-96 -02 1996-13 -08 2013-16 -33 -17 -27
White 1975-00 -03 2000-13 -08 2013-16 -30 -16 -24
Black 1975-93 08 1993-16 -15 -15 -15
US Cancer Mortalityc 2000-2016
All Races 2000-13 -10 2013-16 -32 -17 -26
White 2000-13 -09 2013-16 -30 -16 -24
White NHef 2000-13 -08 2013-16 -30 -15 -24
Black 2000-16 -17 -17 -17
Black NHef 2000-16 -16 -16 -16
APIe 2000-16 -07 -07 -07
AIANeg 2000-16 -05 -05 -05
Hispanicf 2000-16 -09 -09 -09
Table 132
Leukemia
Trends in SEER Incidenceab and US Mortalityc Using the Joinpoint Regression Program
1975-2016 With up to Five Joinpoints 2000-2016 With up to Three Joinpoints
Males by RaceEthnicity
SEE
R C
ancer Statistics Review
1975-2016N
ational Cancer Institute
Joinpoint Regression Program Version 47 February 2019 National Cancer Institute (httpssurveillancecancergovjoinpoint)The APC is the Annual Percent Change based on rates age-adjusted to the 2000 US Std Population (19 age groups - Census P25-1130)
a Trends are from the SEER 9 areas (San Francisco Connecticut Detroit Hawaii Iowa New Mexico Seattle Utah and Atlanta)b Trends are from the SEER 21 areas (SEER 9 areas Los Angeles Alaska Native Registry Rural Georgia California excluding
SFSJMLA Kentucky Louisiana New Jersey Georgia excluding ATLRG Idaho New York and Massachusetts)c Trends are from US Mortality Files National Center for Health Statistics Centers for Disease Control and Preventiond The AAPC is the Average Annual Percent Change and is based on the APCs calculated by Joinpointe API - AsianPacific Islander AIAN - American IndianAlaska Native NH - Non-Hispanicf Hispanic and Non-Hispanic are not mutually exclusive from whites blacks AsianPacific Islanders and American IndiansAlaska
Natives Incidence data for Hispanics and Non-Hispanics are based on NHIA and exclude cases from the Alaska Native Registryg Data for American IndianAlaska Native are based on the PurchasedReferred Care Delivery Area (PRCDA) counties The APCAAPC is significantly different from zero (plt05)- Joinpoint regression line analysis could not be performed on data series
JP Trend 1 JP Trend 2 JP Trend 3 JP Trend 4 JP Trend 5 JP Trend 6 AAPCd
Years APC Years APC Years APC Years APC Years APC Years APC 2007-16 2012-16
SEER 9 Delay-Adjusted Incidencea 1975-2016
All Races 1975-98 02 1998-16 08 08 08
White 1975-16 06 06 06
Black 1975-16 03 03 03
SEER 21 Delay-Adjusted Incidenceb 2000-2016
All Races 2000-05 -02 2005-14 16 2014-16 -29 06 -07
White 2000-16 10 10 10
White NHef 2000-16 11 11 11
Black 2000-06 -17 2006-16 22 22 22
Black NHef 2000-06 -18 2006-16 23 23 23
APIe 2000-16 08 08 08
AIANeg 2000-16 08 08 08
Hispanicf 2000-16 08 08 08
US Cancer Mortalityc 1975-2016
All Races 1975-80 07 1980-00 -04 2000-16 -13 -13 -13
White 1975-00 -03 2000-16 -12 -12 -12
Black 1975-93 04 1993-16 -13 -13 -13
US Cancer Mortalityc 2000-2016
All Races 2000-16 -13 -13 -13
White 2000-16 -12 -12 -12
White NHef 2000-16 -12 -12 -12
Black 2000-16 -15 -15 -15
Black NHef 2000-16 -14 -14 -14
APIe 2000-11 08 2011-16 -47 -23 -47
AIANeg 2000-16 -28 -28 -28
Hispanicf 2000-16 -07 -07 -07
Table 133
Leukemia
Trends in SEER Incidenceab and US Mortalityc Using the Joinpoint Regression Program
1975-2016 With up to Five Joinpoints 2000-2016 With up to Three Joinpoints
Females by RaceEthnicity
SEE
R C
ancer Statistics Review
1975-2016N
ational Cancer Institute
Reference Cancer Incidence Rates Adjusted for Reporting DelayIndividual rates for diagnosis years 1975-1979 available in web browser version of Cancer Statistics Review
a SEER 9 areas (San Francisco Connecticut Detroit Hawaii Iowa New Mexico Seattle Utah and Atlanta)Rates are per 100000 and are age-adjusted to the 2000 US Std Population (19 age groups - Census P25-1130)
- Delay-adjusted rate is not shown for observed rates based on less than 16 cases for the time interval
All Races Whites Blacks Total Males Females Total Males Females Total Males Females
Year of Diagnosis1975-1979 1289 1714 997 1334 1789 1024 1052 1376 8301980 1293 1738 985 1329 1792 1012 1218 1611 9471981 1238 1647 965 1265 1703 982 1227 1447 10371982 1315 1823 971 1350 1877 995 1075 1516 7911983 1314 1780 991 1348 1842 1007 1248 1595 10061984 1300 1711 1012 1346 1797 1035 1068 1187 9611985 1339 1778 1039 1376 1832 1066 1232 1703 9301986 1284 1754 951 1339 1839 992 1023 1320 8091987 1337 1777 1033 1382 1848 1064 1257 1760 9261988 1299 1752 973 1344 1830 1003 1155 1403 9421989 1348 1770 1049 1402 1836 1102 1126 1580 8111990 1293 1736 981 1356 1830 1028 1134 1478 8891991 1308 1682 1025 1371 1778 1060 1081 1209 9981992 1307 1756 982 1366 1872 1004 1068 1391 8421993 1309 1711 1008 1367 1804 1037 1168 1529 9141994 1312 1705 1023 1382 1798 1077 986 1271 7781995 1364 1780 1054 1453 1893 1127 997 1369 7421996 1320 1705 1045 1380 1786 1090 1077 1400 8731997 1326 1770 1004 1410 1880 1068 1067 1423 8291998 1328 1726 1033 1409 1819 1104 1002 1444 7271999 1289 1722 968 1353 1803 1017 1062 1423 8272000 1382 1795 1072 1452 1889 1124 1193 1405 10342001 1449 1886 1119 1545 1999 1201 1200 1460 10202002 1370 1812 1036 1478 1950 1119 914 1207 7092003 1379 1806 1054 1461 1925 1107 1158 1509 9062004 1407 1830 1085 1481 1920 1139 1306 1784 10042005 1399 1832 1066 1491 1977 1111 1155 1310 10412006 1408 1760 1144 1512 1871 1243 1131 1540 8482007 1364 1788 1043 1473 1924 1123 1003 1377 7752008 1430 1868 1085 1526 1992 1154 1112 1516 8182009 1403 1810 1087 1497 1936 1146 1151 1563 8782010 1493 1955 1142 1608 2099 1225 1127 1501 9022011 1525 1956 1179 1628 2083 1257 1303 1545 11082012 1510 1907 1197 1625 2037 1292 1238 1582 10082013 1512 1948 1165 1639 2093 1273 1223 1628 9222014 1533 2000 1163 1655 2138 1261 1200 1515 9812015 1497 1907 1160 1630 2081 1246 1150 1345 10282016 1525 1986 1147 1661 2157 1241 1312 1689 1050
Table 134Leukemia
Delay-adjusted SEER Incidencea Rates by Year Race and Sex
SEE
R C
ancer Statistics Review
1975-2016N
ational Cancer Institute
Individual rates for diagnosis years 1975-1979 available in web browser version of Cancer Statistics Reviewa SEER 9 areas (San Francisco Connecticut Detroit Hawaii Iowa New Mexico Seattle Utah and Atlanta)
Rates are per 100000 and are age-adjusted to the 2000 US Std Population (19 age groups - Census P25-1130)- Statistic not shown Rate based on less than 16 cases for the time interval
All Races Whites Blacks Total Males Females Total Males Females Total Males Females
Year of Diagnosis1975-2016 1354 1775 1041 1425 1874 1091 1120 1446 8951975-1979 1289 1714 997 1334 1789 1024 1052 1376 8301980 1293 1738 985 1329 1792 1012 1218 1611 9471981 1238 1647 965 1265 1703 982 1227 1447 10371982 1315 1823 971 1350 1877 995 1075 1516 7911983 1314 1780 991 1348 1842 1007 1248 1595 10061984 1300 1711 1012 1346 1797 1035 1068 1187 9611985 1339 1778 1039 1376 1832 1066 1232 1703 9301986 1284 1754 951 1339 1839 992 1023 1320 8091987 1337 1777 1033 1382 1848 1064 1257 1760 9261988 1299 1752 973 1344 1830 1003 1155 1403 9421989 1348 1770 1049 1402 1836 1102 1126 1580 8111990 1293 1736 981 1356 1830 1028 1134 1478 8891991 1308 1682 1025 1371 1778 1060 1081 1209 9981992 1307 1756 982 1366 1872 1004 1068 1391 8421993 1309 1711 1008 1367 1804 1037 1168 1529 9141994 1312 1705 1023 1382 1798 1077 986 1271 7781995 1364 1780 1054 1453 1893 1127 997 1369 7421996 1320 1705 1045 1380 1786 1090 1077 1400 8731997 1326 1770 1004 1410 1880 1068 1067 1423 8291998 1328 1726 1033 1409 1819 1104 1002 1444 7271999 1289 1722 968 1353 1803 1017 1062 1423 8272000 1382 1795 1072 1452 1889 1124 1193 1405 10342001 1449 1886 1119 1545 1999 1201 1200 1460 10202002 1370 1812 1036 1478 1950 1119 914 1207 7092003 1379 1806 1054 1461 1925 1107 1158 1509 9062004 1407 1830 1085 1481 1920 1139 1306 1784 10042005 1399 1832 1066 1491 1977 1111 1155 1310 10412006 1408 1760 1144 1512 1871 1243 1131 1540 8482007 1364 1788 1043 1473 1924 1123 1003 1377 7752008 1419 1853 1077 1512 1974 1143 1106 1508 8132009 1381 1781 1070 1469 1899 1125 1137 1543 8682010 1458 1907 1116 1563 2040 1191 1107 1473 8872011 1478 1894 1143 1569 2006 1212 1271 1510 10802012 1452 1832 1151 1550 1943 1234 1201 1532 9802013 1441 1856 1111 1550 1978 1204 1177 1566 8882014 1442 1879 1096 1542 1991 1176 1136 1432 9302015 1384 1761 1074 1488 1899 1138 1071 1250 9602016 1380 1792 1041 1479 1919 1107 1189 1529 952
Table 135Leukemia
Age-adjusted SEER Incidencea Rates by Year Race and Sex
SEE
R C
ancer Statistics Review
1975-2016N
ational Cancer Institute
Individual rates for diagnosis years 1975-1979 available in web browser version of Cancer Statistics Reviewa SEER 9 areas (San Francisco Connecticut Detroit Hawaii Iowa New Mexico Seattle Utah and Atlanta)
Rates are per 100000 and are age-adjusted to the 2000 US Std Population (19 age groups - Census P25-1130)- Statistic not shown Rate based on less than 16 cases for the time interval
All Races Whites Blacks Total Males Females Total Males Females Total Males Females
Year of Diagnosis1975-2016 139 159 120 147 168 126 086 098 0761975-1979 103 122 086 108 129 090 054 059 0491980 112 140 088 116 147 090 073 - -1981 124 131 118 130 139 123 095 - -1982 123 150 099 130 156 105 - - -1983 129 152 108 139 164 118 080 - -1984 132 148 120 134 149 124 092 - -1985 130 155 109 135 162 112 - - -1986 130 167 096 138 182 096 077 - -1987 132 148 119 136 154 121 089 - 1151988 140 179 107 144 184 112 098 - -1989 162 182 143 169 190 149 103 - -1990 142 176 116 152 185 129 057 - -1991 138 172 105 151 194 109 086 - -1992 135 159 114 140 173 109 091 - -1993 126 141 109 138 157 115 082 - -1994 119 148 093 128 159 101 068 - -1995 150 180 121 161 187 136 098 132 -1996 139 156 121 146 165 126 085 - -1997 133 151 116 144 160 128 079 098 -1998 146 161 131 157 169 144 093 116 -1999 131 149 114 140 156 124 068 - -2000 140 151 129 152 161 145 087 - -2001 146 166 126 158 182 134 070 - -2002 150 179 120 165 200 129 062 - -2003 143 166 122 147 170 127 078 097 -2004 155 171 139 167 196 138 112 - 1432005 158 188 129 166 194 138 097 118 -2006 145 163 128 151 164 139 097 142 -2007 152 167 138 160 171 150 095 106 -2008 150 186 115 168 203 132 091 132 -2009 147 161 135 157 174 142 096 108 0852010 146 155 136 158 164 151 097 110 0852011 178 189 167 194 200 189 133 164 1012012 148 153 143 160 163 158 112 145 0892013 162 179 145 175 192 158 097 132 -2014 159 174 144 168 191 146 085 - 1062015 149 172 126 158 181 134 079 096 -2016 169 188 149 171 200 141 104 118 092
Table 136Acute Lymphocytic Leukemia
Age-adjusted SEER Incidencea Rates by Year Race and Sex
SEE
R C
ancer Statistics Review
1975-2016N
ational Cancer Institute
Individual rates for diagnosis years 1975-1979 available in web browser version of Cancer Statistics Reviewa SEER 9 areas (San Francisco Connecticut Detroit Hawaii Iowa New Mexico Seattle Utah and Atlanta)
Rates are per 100000 and are age-adjusted to the 2000 US Std Population (19 age groups - Census P25-1130)- Statistic not shown Rate based on less than 16 cases for the time interval
All Races Whites Blacks Total Males Females Total Males Females Total Males Females
Year of Diagnosis1975-2016 489 678 348 532 739 379 383 541 2741975-1979 432 600 317 454 635 332 381 535 2781980 452 631 333 470 655 346 451 706 2891981 427 630 290 447 663 306 382 541 2471982 430 614 301 450 639 318 377 665 -1983 445 640 313 467 678 325 421 611 3031984 443 630 312 472 682 329 345 446 2651985 449 621 331 480 663 354 411 615 2871986 450 633 324 487 685 354 279 418 -1987 466 681 307 495 726 328 403 614 2451988 455 646 315 477 688 327 443 532 3531989 470 644 347 501 691 368 391 515 3041990 461 631 342 492 678 363 451 613 3431991 460 620 343 500 681 364 340 375 3151992 462 674 317 506 743 343 321 496 2081993 446 615 317 474 656 336 452 679 2891994 462 614 347 506 672 384 319 413 2321995 456 644 320 499 702 352 339 534 2061996 474 637 356 518 690 394 352 536 2261997 451 610 331 493 665 363 357 518 2521998 427 599 301 471 658 335 285 373 2291999 418 607 277 453 655 301 387 600 2602000 470 660 325 520 734 354 344 450 2722001 534 741 379 590 817 420 395 489 3282002 514 724 356 574 807 399 319 453 2202003 539 747 383 596 830 418 439 621 3122004 560 768 402 611 819 450 501 816 2892005 545 777 367 607 876 395 402 485 3462006 585 770 447 648 845 500 460 676 3172007 542 754 380 612 842 432 314 480 2252008 557 749 409 621 824 463 386 583 2412009 545 752 382 606 834 421 406 593 2902010 562 781 395 626 858 444 365 528 2642011 556 749 401 611 822 439 452 551 3792012 531 711 387 593 783 437 372 493 2932013 524 724 363 586 803 410 436 650 2772014 531 748 355 595 827 404 379 606 2202015 507 684 360 572 764 407 345 461 2642016 476 656 327 537 736 368 381 509 289
Table 137Chronic Lymphocytic Leukemia
Age-adjusted SEER Incidencea Rates by Year Race and Sex
SEE
R C
ancer Statistics Review
1975-2016N
ational Cancer Institute
Individual rates for diagnosis years 1975-1979 available in web browser version of Cancer Statistics Reviewa SEER 9 areas (San Francisco Connecticut Detroit Hawaii Iowa New Mexico Seattle Utah and Atlanta)
Rates are per 100000 and are age-adjusted to the 2000 US Std Population (19 age groups - Census P25-1130)- Statistic not shown Rate based on less than 16 cases for the time interval
All Races Whites Blacks Total Males Females Total Males Females Total Males Females
Year of Diagnosis1975-2016 366 455 304 373 464 309 324 386 2841975-1979 343 425 288 351 438 293 261 297 2341980 314 410 243 317 411 249 288 328 2531981 317 399 265 321 411 268 315 322 3021982 342 479 260 347 490 263 250 322 2091983 321 422 253 317 428 241 293 302 2921984 330 406 273 335 417 277 235 210 2441985 333 415 287 325 402 284 378 506 2991986 300 391 240 295 385 238 321 404 2681987 302 397 247 303 400 247 305 473 2121988 303 379 252 308 387 257 279 314 2491989 320 401 262 330 404 279 222 379 -1990 304 391 243 312 407 246 249 289 2191991 333 393 288 338 390 298 334 453 2591992 322 385 276 328 403 275 305 299 3051993 345 431 286 352 445 286 248 262 2551994 346 414 302 348 424 297 294 324 2771995 366 417 331 381 432 345 262 262 2731996 347 433 291 346 429 294 321 405 2731997 353 461 277 366 482 285 302 383 2551998 393 494 321 406 506 332 305 464 2111999 373 451 318 385 463 330 303 345 2762000 405 495 341 404 495 339 441 488 4012001 406 495 339 420 500 361 345 408 3002002 363 458 298 378 478 311 291 331 2672003 360 449 296 367 460 302 333 352 2962004 342 415 293 351 423 300 339 431 3012005 359 426 317 365 438 319 349 347 3582006 355 411 315 367 422 327 284 334 2572007 355 438 298 366 448 309 338 445 2722008 382 469 318 386 485 308 307 378 2742009 364 442 308 376 464 310 313 398 2552010 424 539 341 444 568 350 336 454 2622011 421 514 347 425 518 349 422 452 3992012 458 561 377 468 572 387 385 449 3422013 448 542 380 466 555 402 416 508 3472014 439 531 371 460 548 395 378 453 3182015 426 518 358 442 539 367 372 415 3512016 431 542 347 447 556 361 408 489 358
Table 138Acute Myeloid Leukemia
Age-adjusted SEER Incidencea Rates by Year Race and Sex
SEE
R C
ancer Statistics Review
1975-2016N
ational Cancer Institute
Individual rates for diagnosis years 1975-1979 available in web browser version of Cancer Statistics Reviewa SEER 9 areas (San Francisco Connecticut Detroit Hawaii Iowa New Mexico Seattle Utah and Atlanta)
Rates are per 100000 and are age-adjusted to the 2000 US Std Population (19 age groups - Census P25-1130)- Statistic not shown Rate based on less than 16 cases for the time interval
All Races Whites Blacks Total Males Females Total Males Females Total Males Females
Year of Diagnosis1975-2016 181 238 138 184 242 141 183 237 1441975-1979 183 244 141 184 247 141 180 239 1361980 170 206 146 173 210 151 148 - -1981 164 197 141 159 190 139 238 300 1811982 168 216 135 165 219 131 175 - 1791983 169 223 133 164 215 132 251 344 1851984 168 240 118 163 241 110 258 261 2591985 197 276 143 200 280 147 206 289 -1986 168 219 129 171 225 131 154 - -1987 188 233 158 191 239 158 214 288 -1988 191 254 150 192 259 149 208 288 -1989 170 222 135 168 218 135 221 312 -1990 176 247 124 175 250 120 263 366 1951991 188 244 147 191 255 146 156 - 1751992 176 216 147 180 222 149 149 173 -1993 192 253 148 195 252 155 228 356 -1994 187 249 142 190 249 150 170 257 -1995 190 256 138 196 269 139 159 209 -1996 181 245 135 180 251 128 206 254 1831997 187 268 130 194 274 137 167 253 -1998 166 195 143 173 198 154 161 231 1201999 180 249 128 177 244 128 172 230 1262000 179 234 135 180 233 140 159 180 1332001 180 236 138 185 237 146 197 283 1362002 164 209 130 167 212 134 113 - -2003 166 224 120 176 237 127 147 218 -2004 181 256 122 187 266 125 151 206 1112005 169 226 125 177 235 131 178 244 1342006 184 240 141 194 251 151 158 217 1112007 171 232 123 180 249 123 143 183 1192008 185 239 143 186 232 151 189 267 1212009 180 238 134 179 231 139 190 289 1282010 188 251 140 188 254 136 191 212 1832011 195 255 147 206 271 151 166 195 1392012 193 233 161 197 238 165 212 281 1622013 193 260 139 198 267 140 172 226 1422014 197 259 146 195 252 146 205 196 2132015 185 230 146 194 241 152 169 185 1562016 204 265 156 216 272 171 198 288 140
Table 139Chronic Myeloid Leukemia
Age-adjusted SEER Incidencea Rates by Year Race and Sex
SEE
R C
ancer Statistics Review
1975-2016N
ational Cancer Institute
Individual rates for years of death 1975-1979 available in web browser version of Cancer Statistics Reviewa US Mortality Files National Center for Health Statistics Centers for Disease Control and Prevention
Rates are per 100000 and are age-adjusted to the 2000 US Std Population (19 age groups - Census P25-1130)- Statistic not shown Rate based on less than 16 cases for the time interval
All Races Whites Blacks Total Males Females Total Males Females Total Males Females
Year of Death1975-2016 752 1008 575 773 1038 589 656 865 5201975-1979 812 1092 624 829 1120 634 678 880 5361980 836 1121 646 854 1151 656 705 909 5671981 810 1089 624 824 1116 631 711 892 5861982 819 1104 631 833 1129 639 714 936 5671983 811 1093 626 824 1119 632 722 921 5901984 808 1068 637 823 1091 647 708 916 5691985 807 1077 631 823 1097 644 708 962 5421986 796 1071 616 810 1097 623 725 926 5911987 780 1031 614 791 1050 620 724 941 5851988 783 1060 600 795 1079 608 724 983 5581989 795 1062 615 807 1075 626 736 1034 5451990 798 1071 618 810 1090 626 744 996 5831991 799 1050 632 812 1064 644 745 1005 5801992 796 1071 613 811 1094 624 716 941 5681993 793 1066 609 804 1084 616 736 976 5771994 785 1057 603 800 1078 613 712 959 5541995 790 1080 598 804 1103 605 717 975 5531996 784 1053 605 797 1071 613 746 1009 5901997 771 1042 589 789 1068 601 683 923 5291998 758 1011 582 772 1031 591 704 937 5551999 768 1022 596 787 1047 609 674 878 5432000 769 1028 591 789 1054 605 671 907 5272001 764 1019 588 783 1046 602 674 880 5412002 754 1018 573 775 1046 585 673 891 5382003 745 1002 563 768 1037 576 654 847 5302004 729 981 552 747 1004 564 677 894 5392005 726 982 546 750 1014 563 607 811 4782006 723 970 546 748 997 566 627 884 4702007 708 954 533 730 986 546 619 807 5052008 709 954 533 732 983 549 627 865 4782009 706 953 525 731 986 541 605 814 4712010 691 925 520 716 958 537 575 746 4592011 695 928 524 718 960 539 599 774 4852012 683 921 507 708 957 522 577 756 4622013 675 909 503 703 943 523 568 770 4372014 662 882 496 691 921 515 547 717 4372015 628 846 464 655 882 482 520 684 4152016 627 828 475 653 864 491 543 687 449
Table 1310Leukemia
Age-adjusted US Deatha Rates by Year Race and Sex
SEE
R C
ancer Statistics Review
1975-2016N
ational Cancer Institute
a SEER 21 areas Rates are per 100000 and are age-adjusted to the 2000 US Std Population (19 age groups - Census P25-1130)unless noted
b US Mortality Files National Center for Health Statistics Centers for Disease Control and PreventionRates are per 100000 and are age-adjusted to the 2000 US Std Population (19 age groups - Census P25-1130) unless noted
c Rates are per 100000 and are age-adjusted to the world (WHO 2000-2025) standard million- Statistic not shown Rate based on less than 16 cases for the time interval
All Races Whites Blacks Total Males Females Total Males Females Total Males Females
SEER IncidenceAge at DiagnosisAge-Adjusted Rates 2012-2016All ages 141 181 109 149 191 115 109 139 89Under 65 71 83 58 74 87 61 58 66 5165 and over 625 855 457 668 909 487 460 641 349
All ages (WHO world std)c 109 137 86 116 145 90 85 105 71
Age-Specific Rates 2012-2016lt1 45 43 48 45 44 47 34 - 441-4 89 91 87 97 101 94 46 43 495-9 43 47 38 47 53 41 22 20 2410-14 33 38 28 34 38 30 26 31 2015-19 31 38 24 33 41 25 20 25 1520-24 29 32 25 30 35 25 24 22 2625-29 30 34 26 30 34 26 26 28 2430-34 37 42 32 37 43 32 33 33 3335-39 45 51 39 46 52 39 45 48 4240-44 61 71 51 63 73 53 58 69 4945-49 84 97 71 86 99 73 85 96 7450-54 127 156 99 133 164 103 104 123 8755-59 182 223 143 192 234 151 150 183 12260-64 271 346 202 285 365 210 230 279 19065-69 404 533 290 429 564 306 330 428 25670-74 549 735 394 584 777 419 416 563 31275-79 706 954 513 757 1015 552 535 755 39380-84 843 1180 611 902 1256 653 585 869 42885+ 880 1262 683 941 1356 725 567 810 466
US MortalityAge at DeathAge-Adjusted Rates 2012-2016All ages 65 88 49 68 91 51 55 72 44Under 65 18 22 15 18 22 15 20 23 1765 and over 392 544 283 411 570 296 299 410 232
All ages (WHO world std)c 37 48 28 38 49 29 33 43 27
Age-Specific Rates 2012-2016lt1 05 04 06 05 05 05 06 - -1-4 07 07 07 07 07 07 07 07 075-9 05 05 04 05 06 04 04 04 0310-14 06 06 05 06 06 05 05 06 0515-19 07 09 06 08 09 06 05 06 0420-24 09 11 06 09 11 07 09 10 0725-29 09 11 07 09 11 08 08 10 0730-34 10 12 08 10 12 08 11 13 1035-39 12 14 10 12 14 10 14 15 1240-44 16 17 14 16 17 15 18 18 1745-49 22 25 20 23 25 21 26 30 2250-54 34 40 28 34 41 28 39 44 3555-59 56 68 43 56 69 44 62 77 5060-64 93 118 70 95 121 70 101 130 7765-69 160 215 111 166 223 114 150 203 11070-74 272 364 194 285 380 202 231 302 18175-79 428 589 300 450 618 314 333 460 25180-84 615 863 441 647 903 462 457 633 35885+ 827 1192 638 875 1259 672 525 746 433
Table 1311Leukemia
SEER Incidencea and US Deathb Rates Age-Adjusted and Age-Specific Rates by Race and Sex
SEE
R C
ancer Statistics Review
1975-2016N
ational Cancer Institute
a SEER 21 areas Rates are per 100000 and are age-adjusted to the 2000 US Std Population (19 age groups - Census P25-1130)unless noted
b Rates are per 100000 and are age-adjusted to the world (WHO 2000-2025) standard million- Statistic not shown Rate based on less than 16 cases for the time interval
All Races Whites Blacks Total Males Females Total Males Females Total Males Females
Acute Lymphocytic LeukemiaAge at DiagnosisAge-Adjusted Rates 2012-2016All ages 17 19 15 19 21 16 10 11 09Under 65 17 20 15 19 22 16 10 11 0965 and over 16 18 13 17 20 14 10 12 09
All ages (WHO world std)b 19 21 16 20 23 18 10 11 09
Age-Specific Rates 2012-2016lt1 19 16 22 19 16 23 14 - -1-4 76 77 74 84 87 81 33 30 375-9 36 40 33 41 46 36 18 15 2010-14 23 26 19 24 27 21 14 19 0915-19 18 24 12 20 27 13 07 12 -20-24 10 14 07 12 16 07 05 06 0525-29 08 10 06 08 11 06 05 - -30-34 07 09 06 08 09 06 04 - -35-39 08 10 06 08 10 07 06 07 -40-44 08 09 06 08 10 06 06 07 -45-49 09 09 09 09 09 10 04 - -50-54 09 10 08 09 10 09 07 09 -55-59 11 12 11 12 13 11 11 12 1060-64 13 15 11 13 15 11 11 13 0965-69 14 14 13 15 16 14 07 - -70-74 16 19 13 17 20 14 - - -75-79 17 20 15 18 21 16 13 - -80-84 17 23 13 17 24 13 - - -85+ 15 19 13 16 20 14 - - -
Chronic Lymphocytic LeukemiaAge at DiagnosisAge-Adjusted Rates 2012-2016All ages 49 68 35 54 73 38 34 49 24Under 65 17 22 12 18 24 13 12 16 0865 and over 275 383 195 298 411 212 185 273 129
All ages (WHO world std)b 35 47 24 38 51 27 24 34 17
Age-Specific Rates 2012-2016lt1 - - - - - - - - -1-4 - - - - - - - - -5-9 - - - - - - - - -10-14 - - - - - - - - -15-19 - - - - - - - - -20-24 - - - - - - - - -25-29 01 01 - 01 - - - - -30-34 01 02 - 01 02 - - - -35-39 04 04 03 04 05 04 04 - -40-44 10 12 08 10 13 08 08 12 -45-49 22 28 17 24 30 19 18 24 1250-54 48 65 32 53 70 36 32 46 2055-59 80 103 58 88 113 64 51 66 3760-64 125 170 84 134 180 90 94 129 6665-69 189 258 129 204 274 140 135 188 9570-74 245 338 167 265 361 182 176 263 11675-79 306 423 216 333 455 236 213 321 14580-84 354 502 252 385 541 275 222 360 14685+ 379 543 294 413 594 318 218 302 183
Table 1312Lymphocytic Leukemia
SEER Incidencea Rates Age-Adjusted and Age-Specific Rates by Race and Sex
SEE
R C
ancer Statistics Review
1975-2016N
ational Cancer Institute
a SEER 21 areas Rates are per 100000 and are age-adjusted to the 2000 US Std Population (19 age groups - Census P25-1130)unless noted
b Rates are per 100000 and are age-adjusted to the world (WHO 2000-2025) standard million- Statistic not shown Rate based on less than 16 cases for the time interval
All Races Whites Blacks Total Males Females Total Males Females Total Males Females
Acute Myeloid LeukemiaAge at DiagnosisAge-Adjusted Rates 2012-2016All ages 43 52 35 44 54 36 37 44 33Under 65 20 21 19 20 21 19 20 20 2065 and over 201 269 152 213 284 160 155 210 123
All ages (WHO world std)b 32 38 28 33 40 28 29 33 27
Age-Specific Rates 2012-2016lt1 16 16 16 15 15 15 - - -1-4 10 10 10 09 09 09 11 10 115-9 04 04 04 04 04 04 03 - -10-14 07 08 06 07 08 06 09 09 0815-19 09 09 09 09 10 09 08 07 0820-24 11 10 12 11 10 12 12 11 1325-29 12 11 12 11 11 12 11 10 1230-34 14 15 14 14 15 14 17 15 1935-39 16 16 16 15 16 15 18 16 2040-44 21 22 21 22 22 22 22 21 2245-49 25 25 25 25 25 25 28 27 2950-54 35 38 32 36 40 33 33 32 3355-59 49 56 43 49 56 43 49 57 4360-64 78 91 67 82 97 68 70 75 6665-69 121 152 94 129 163 98 100 118 8670-74 183 236 139 192 247 145 151 189 12575-79 233 310 174 248 326 186 185 256 14080-84 286 393 212 302 413 223 207 314 14885+ 263 380 203 277 403 212 174 254 141
Chronic Myeloid LeukemiaAge at DiagnosisAge-Adjusted Rates 2012-2016All ages 19 24 14 19 25 15 18 22 15Under 65 11 13 09 11 12 09 11 13 1065 and over 76 106 55 80 111 57 62 82 49
All ages (WHO world std)b 15 19 11 15 19 12 14 17 12
Age-Specific Rates 2012-2016lt1 05 05 - 04 - - - - -1-4 01 - - 01 - - - - -5-9 01 - 01 01 - - - - -10-14 01 02 01 01 01 01 - - -15-19 03 03 02 02 03 02 03 - -20-24 05 06 04 05 06 04 04 - -25-29 07 09 06 07 08 06 07 10 -30-34 10 12 08 11 12 09 08 09 0835-39 11 13 09 11 13 10 12 13 1040-44 14 18 11 14 18 11 16 22 1045-49 18 21 15 17 20 14 25 28 2350-54 22 26 17 21 26 17 23 25 2055-59 25 29 22 26 29 23 25 28 2260-64 35 43 27 35 44 27 34 41 2965-69 49 67 34 50 68 33 55 68 4570-74 65 85 48 68 89 51 49 66 3675-79 91 124 65 97 132 69 69 98 5080-84 105 147 75 112 156 80 76 92 6785+ 102 155 75 107 164 76 75 109 60
Table 1313Myeloid Leukemia
SEER Incidencea Rates Age-Adjusted and Age-Specific Rates by Race and Sex
SEE
R C
ancer Statistics Review
1975-2016N
ational Cancer Institute
a Based on End Results data from a series of hospital registries and one population-based registryb SEER 9 areas (San Francisco Connecticut Detroit Hawaii Iowa New Mexico Seattle Utah Atlanta)
Based on follow-up of patients into 2016 Expected survival rates are derived from the US Annual Life Tablesc SEER 18 areas (San Francisco Connecticut Detroit Hawaii Iowa New Mexico Seattle Utah Atlanta San Jose-Monterey
Los Angeles Alaska Native Registry Rural Georgia California excluding SFSJMLA Kentucky Louisiana New Jersey andGeorgia excluding ATLRG) Expected survival rates are derived from life tables by socio-economic status geography and racedeveloped by the SEER programBased on follow-up of patients into 2016
d Period survival provides a 2015 estimate of survival by piecing together the most recent conditional survival estimatesfrom several cohorts It is computed here using three year calendar blocks (2010-2012 0-1 year survival)(2009-2011 1-2 year survival) (2008-2010 2-3 year survival) (2007-2009 3-4 year survival) (2006-2008 4-5 years survival)
e The difference between 1975-1977 and 2009-2015 is statistically significant (plt05)f The standard error is between 5 and 10 percentage pointsg The standard error is greater than 10 percentage points- Statistic could not be calculated due to fewer than 25 cases during the time period
All Races Whites Blacks Total Males Females Total Males Females Total Males Females
5-Year Relative Survival (Percent)Year of Diagnosis1960-1963a - - - 14 - - - - -1970-1973a - - - 22 - - - - -1975-1977b 341 330 356 345 336 358 334 304 3671978-1980b 360 350 373 367 358 380 282 273 2931981-1983b 373 369 378 381 378 385 339 334 3431984-1986b 405 401 411 416 413 420 327 315 3411987-1989b 429 440 413 439 455 418 350 327 3781990-1992b 452 446 461 465 463 468 357 305 4131993-1995b 476 484 464 487 495 475 413 416 4091996-1998b 484 486 481 498 497 498 386 390 3801999-2001b 510 520 495 520 530 507 437 451 4212002-2004b 583 584 581 591 594 588 540 543 5342005-2008b 623 635 607 633 643 620 560 599 5112009-2015b 658e 673e 637e 668e 682e 649e 596e 609e 582e
5-Year Period Survival (Percent)cd
2015 632 643 619 634 640 624 582 617 544
5-Year Relative Survival (Percent) 2009-2015c
Age at DiagnosisAges lt45 762 758 768 773 764 786 677 677 677Ages 45-54 722 737 698 735 746 716 628 662 586Ages 55-64 693 699 683 704 707 698 589 605 566Ages 65-74 610 610 611 614 610 620 541 553 523Ages 75+ 421 424 417 427 428 425 337 357 316Ages lt65 729 731 725 739 738 741 637 650 621Ages 65+ 508 517 496 511 518 502 446 474 415
Table 1314Leukemia
5-Year Relative and Period Survival (Percent) by Race Sex Diagnosis Year and Age
SEE
R C
ancer Statistics Review
1975-2016N
ational Cancer Institute
a SEER 9 areas (San Francisco Connecticut Detroit Hawaii Iowa New Mexico Seattle Utah Atlanta)Based on follow-up of patients into 2016 Expected survival rates are derived from the US Annual Life Tables
b SEER 18 areas (San Francisco Connecticut Detroit Hawaii Iowa New Mexico Seattle Utah Atlanta San Jose-MontereyLos Angeles Alaska Native Registry Rural Georgia California excluding SFSJMLA Kentucky Louisiana New Jersey andGeorgia excluding ATLRG) Expected survival rates are derived from life tables by socio-economic status geography and racedeveloped by the SEER programBased on follow-up of patients into 2016
c Period survival provides a 2015 estimate of survival by piecing together the most recent conditional survival estimatesfrom several cohorts It is computed here using three year calendar blocks (2010-2012 0-1 year survival)(2009-2011 1-2 year survival) (2008-2010 2-3 year survival) (2007-2009 3-4 year survival) (2006-2008 4-5 years survival)
d The difference between 1975-1977 and 2009-2015 is statistically significant (plt05)e The standard error is between 5 and 10 percentage pointsf The standard error is greater than 10 percentage points- Statistic could not be calculated due to fewer than 25 cases during the time period
All Races Whites Blacks Total Males Females Total Males Females Total Males Females
Acute Lymphocytic Leukemia5-Year Relative Survival (Percent)Year of Diagnosis1975-1977a 406 369 456 408 374 457 335e - -1987-1989a 544 537 552 550 547 553 447e 420e 471e1990-1992a 580 545 631 577 549 620 571e 504e 633e1993-1995a 602 578 636 598 578 627 532e 459e 638e1996-1998a 655 644 669 664 643 690 556e 591e 502e1999-2001a 635 634 635 648 652 642 566e 503e 630e2002-2004a 673 661 689 676 666 691 645e 594e 697e2005-2008a 701 693 713 700 686 720 652 700 551e2009-2015a 717d 723d 710d 726d 737d 713d 625d 607 647e
5-Year Period Survival (Percent)bc2015 691 684 698 685 674 700 650 650 648
5-Year Relative Survival (Percent) 2009-2015bAge at DiagnosisAges lt45 806 795 821 807 791 828 763 757 770Ages 45-54 381 365 403 379 373 389 257e - -Ages 55-64 280 275 284 294 288 298 173e 228e -Ages 65-74 239 188 291 214 170 259 - - -Ages 75+ 91 97 83 100 96 100 00 - -Ages lt65 733 725 743 735 724 749 668 668 668Ages 65+ 174 151 196 166 141 191 154e - 189e
Chronic Lymphocytic Leukemia5-Year Relative Survival (Percent)Year of Diagnosis1975-1977a 671 647 703 679 654 711 569e 551e 590e1987-1989a 727 727 729 739 740 737 581 555e 615e1990-1992a 741 718 773 753 731 784 522 434e 609e1993-1995a 772 771 773 783 781 786 633 640e 621e1996-1998a 756 739 778 767 752 787 581 515e 660e1999-2001a 786 782 792 794 788 803 666 655e 666e2002-2004a 840 832 852 845 837 856 770 742e 807e2005-2008a 862 861 863 864 863 864 841 857 8122009-2015a 882d 887d 875d 886d 889d 883d 785d 801d 763
5-Year Period Survival (Percent)bc2015 856 855 858 853 848 860 772 818 710
5-Year Relative Survival (Percent) 2009-2015bAge at DiagnosisAges lt45 940 927 960 942 932 954 905e 879e -Ages 45-54 939 934 948 945 935 964 840 889 761eAges 55-64 922 916 933 924 916 938 836 831 843Ages 65-74 874 856 905 876 853 913 773 784 756Ages 75+ 731 727 736 729 724 734 584 586e 564eAges lt65 928 922 939 931 923 947 843 854 824Ages 65+ 801 796 807 799 792 807 691 713 662
Table 1315Lymphocytic Leukemia
5-Year Relative and Period Survival (Percent) by Race Sex Diagnosis Year and Age
SEE
R C
ancer Statistics Review
1975-2016N
ational Cancer Institute
a SEER 9 areas (San Francisco Connecticut Detroit Hawaii Iowa New Mexico Seattle Utah Atlanta)Based on follow-up of patients into 2016 Expected survival rates are derived from the US Annual Life Tables
b SEER 18 areas (San Francisco Connecticut Detroit Hawaii Iowa New Mexico Seattle Utah Atlanta San Jose-MontereyLos Angeles Alaska Native Registry Rural Georgia California excluding SFSJMLA Kentucky Louisiana New Jersey andGeorgia excluding ATLRG) Expected survival rates are derived from life tables by socio-economic status geography and racedeveloped by the SEER programBased on follow-up of patients into 2016
c Period survival provides a 2015 estimate of survival by piecing together the most recent conditional survival estimatesfrom several cohorts It is computed here using three year calendar blocks (2010-2012 0-1 year survival)(2009-2011 1-2 year survival) (2008-2010 2-3 year survival) (2007-2009 3-4 year survival) (2006-2008 4-5 years survival)
d The difference between 1975-1977 and 2009-2015 is statistically significant (plt05)e The standard error is between 5 and 10 percentage pointsf The standard error is greater than 10 percentage points- Statistic could not be calculated due to fewer than 25 cases during the time period
All Races Whites Blacks Total Males Females Total Males Females Total Males Females
Acute Myeloid Leukemia5-Year Relative Survival (Percent)Year of Diagnosis1975-1977a 62 55 70 58 54 62 101 82 1171987-1989a 115 92 141 113 97 132 92 44 157e1990-1992a 138 126 152 135 122 150 135 129 1391993-1995a 161 149 174 153 141 167 215 206e 2201996-1998a 170 159 183 156 145 171 221 252 1821999-2001a 192 188 197 187 176 199 193 248 1422002-2004a 234 209 264 232 208 260 253 265 2402005-2008a 249 235 265 242 228 257 239 193 2772009-2015a 294d 291d 298d 290d 284d 299d 292d 280d 301d
5-Year Period Survival (Percent)bc2015 286 278 294 282 276 289 283 262 301
5-Year Relative Survival (Percent) 2009-2015bAge at DiagnosisAges lt45 604 585 624 621 599 645 511 482 538Ages 45-54 441 439 444 456 450 463 337 342 336Ages 55-64 300 281 325 308 285 338 231 234 224Ages 65-74 139 137 141 145 144 146 103 78 131Ages 75+ 34 40 27 34 41 27 24 - 20Ages lt65 466 444 491 474 449 504 393 371 414Ages 65+ 79 85 72 82 89 73 64 58 71
Chronic Myeloid Leukemia5-Year Relative Survival (Percent)Year of Diagnosis1975-1977a 218 193 251 205 184 234 277e 216e 355e1987-1989a 303 306 298 301 310 290 333e 281e 413e1990-1992a 307 296 322 303 300 306 349e 255e 449e1993-1995a 355 353 358 352 351 352 356e 328e 402e1996-1998a 371 377 363 380 376 385 310 304e 314e1999-2001a 473 459 492 459 441 483 490e 496e 481e2002-2004a 543 530 561 526 514 541 630e 621e 640e2005-2008a 631 632 629 617 615 621 643 664e 608e2009-2015a 697d 681d 718d 690d 677d 707d 736d 711d 763d
5-Year Period Survival (Percent)bc2015 695 683 712 681 666 702 723 714 735
5-Year Relative Survival (Percent) 2009-2015bAge at DiagnosisAges lt45 899 889 913 916 905 934 797 786 812Ages 45-54 874 860 891 871 858 888 871 842 900Ages 55-64 776 748 816 781 750 826 698 676e 719eAges 65-74 611 579 656 609 578 654 584e 526e 637eAges 75+ 326 305 346 321 302 336 362e 362f 362eAges lt65 851 836 873 856 839 883 790 773 808Ages 65+ 462 444 484 456 441 475 495 471e 515e
Table 1316Myeloid Leukemia
5-Year Relative and Period Survival (Percent) by Race Sex Diagnosis Year and Age
SEE
R C
ancer Statistics Review
1975-2016N
ational Cancer Institute
a Based on the SEER 9 areas (San Francisco Connecticut Detroit Hawaii Iowa New Mexico Seattle Utah and Atlanta)Expected survival rates are derived from the US Annual Life Tables
1975- 1980- 1985- 1990-1979 1984 1989 1994 1995 1996 1997 1998 1999 2000 2001 2002 2003 2004 2005 2006 2007 2008 2009 2010 2011 2012 2013 2014 2015
Survival Time
1-year 608 626 648 669 681 682 679 667 659 669 706 722 732 751 742 765 769 766 774 783 794 791 790 791 8062-year 501 525 553 575 589 599 598 580 583 590 630 649 662 677 684 705 706 702 709 725 732 725 732 7343-year 437 465 496 528 543 554 549 541 547 551 590 619 624 643 647 673 676 665 684 692 703 692 6984-year 388 417 455 491 507 519 509 503 516 520 567 596 595 619 627 647 653 639 658 676 683 6735-year 346 376 423 461 481 487 483 482 484 499 543 578 575 596 610 626 637 619 635 659 6656-year 314 351 399 435 457 465 458 461 462 485 524 560 556 572 593 607 622 604 613 6477-year 291 325 371 409 442 451 438 446 444 473 510 544 537 560 579 591 614 587 6018-year 270 304 350 388 417 438 432 431 430 457 496 535 519 546 561 573 603 5769-year 250 285 330 373 406 420 418 421 421 449 483 519 507 530 546 561 59310-year 237 269 316 360 390 406 406 410 406 438 471 504 489 515 532 54511-year 224 257 299 347 378 398 387 397 392 426 459 492 473 499 52712-year 212 246 288 336 371 387 377 390 383 419 449 483 460 49213-year 204 236 280 327 367 382 370 380 372 404 442 466 45414-year 198 229 272 318 356 371 368 370 367 392 434 45615-year 192 223 267 313 353 361 362 358 359 383 42316-year 185 214 261 306 350 359 361 350 353 37417-year 181 207 256 300 340 355 352 346 34718-year 177 201 253 294 330 351 346 34319-year 171 195 248 291 326 343 34420-year 166 191 244 286 319 338
Table 1317Leukemia
SEERa Relative Survival (Percent)By Year of Diagnosis
All Races Males and Females
Year of Diagnosis
SEE
R C
ancer Statistics Review
1975-2016N
ational Cancer Institute
a Based on the SEER 9 areas (San Francisco Connecticut Detroit Hawaii Iowa New Mexico Seattle Utah and Atlanta)Expected survival rates are derived from the US Annual Life Tables
1975- 1980- 1985- 1990-1979 1984 1989 1994 1995 1996 1997 1998 1999 2000 2001 2002 2003 2004 2005 2006 2007 2008 2009 2010 2011 2012 2013 2014 2015
Survival Time
1-year 604 628 655 679 692 697 688 667 668 688 729 731 742 767 761 770 780 775 791 793 806 797 803 812 8172-year 494 524 561 583 604 616 611 585 590 608 648 652 669 687 701 706 719 716 727 740 746 733 749 7513-year 427 460 499 532 556 573 552 546 552 573 608 624 627 653 664 674 689 679 699 712 719 698 7144-year 377 411 459 494 516 535 505 505 520 539 581 598 601 627 650 648 667 650 677 690 697 6775-year 334 371 429 462 482 495 479 484 480 523 553 573 578 602 630 626 653 632 656 673 6846-year 303 343 404 435 452 471 459 461 461 508 529 554 557 575 609 602 635 615 631 6617-year 277 318 373 409 439 458 438 444 439 498 514 531 535 564 594 588 625 595 6168-year 254 294 354 385 417 446 430 430 423 478 500 520 514 549 572 563 616 5839-year 232 275 332 371 404 423 421 419 415 464 486 507 501 526 553 548 60510-year 219 260 317 358 382 407 413 410 401 454 473 490 479 511 539 52611-year 205 249 302 346 377 398 391 393 383 444 461 474 464 496 53312-year 193 242 290 334 371 390 380 384 375 437 452 467 455 49113-year 186 234 283 325 367 389 373 369 363 420 442 455 44714-year 179 227 277 315 357 379 370 358 357 410 433 44715-year 175 221 269 309 352 371 365 349 351 399 42216-year 168 212 263 303 347 369 360 341 346 38717-year 164 204 260 296 339 366 348 335 34318-year 159 199 257 290 324 364 345 33119-year 154 192 253 288 322 355 34120-year 146 187 249 283 316 347
Table 1318Leukemia
SEERa Relative Survival (Percent)By Year of Diagnosis
All Races Males
Year of Diagnosis
SEE
R C
ancer Statistics Review
1975-2016N
ational Cancer Institute
a Based on the SEER 9 areas (San Francisco Connecticut Detroit Hawaii Iowa New Mexico Seattle Utah and Atlanta)Expected survival rates are derived from the US Annual Life Tables
1975- 1980- 1985- 1990-1979 1984 1989 1994 1995 1996 1997 1998 1999 2000 2001 2002 2003 2004 2005 2006 2007 2008 2009 2010 2011 2012 2013 2014 2015
Survival Time
1-year 613 623 638 655 665 664 666 667 646 643 675 710 719 729 715 759 755 754 751 769 778 782 772 761 7912-year 509 527 542 564 569 578 580 574 573 564 606 645 653 664 660 705 689 684 684 705 714 716 709 7093-year 450 471 492 523 525 529 544 534 539 522 564 612 619 628 624 673 657 647 663 666 681 685 6774-year 402 424 449 485 495 498 514 500 511 494 548 594 587 608 595 646 633 624 633 658 664 6685-year 361 384 414 459 480 475 489 479 489 466 530 584 570 588 582 627 615 601 607 641 6396-year 328 360 392 435 464 457 456 461 463 455 516 567 556 569 572 613 602 589 588 6297-year 309 334 367 410 447 443 438 448 450 438 504 561 539 556 558 594 598 575 5798-year 290 316 344 391 416 428 433 433 438 428 490 556 526 542 546 585 582 5639-year 273 299 326 376 409 416 413 424 429 428 477 535 515 534 535 576 57610-year 259 281 315 364 399 405 396 409 414 416 468 522 502 521 521 56811-year 247 269 295 347 378 398 383 403 403 401 456 515 486 503 51812-year 235 250 285 338 372 382 373 397 393 395 445 505 468 49313-year 228 239 276 329 365 373 366 392 385 383 442 481 46314-year 220 232 267 323 355 361 363 385 380 367 434 46815-year 214 225 264 318 353 348 359 369 368 363 42416-year 206 217 258 310 353 344 359 361 363 35817-year 201 210 252 305 342 340 357 358 35018-year 198 205 248 301 336 334 347 35819-year 193 198 241 296 330 326 34620-year 190 195 238 290 321 323
Table 1319Leukemia
SEERa Relative Survival (Percent)By Year of Diagnosis
All Races Females
Year of Diagnosis
SEE
R C
ancer Statistics Review
1975-2016N
ational Cancer Institute
Devcan 677 April 2019 National Cancer Institute (httpssurveillancecancergovdevcan)Source Incidence data are from the SEER 21 areas (San Francisco Connecticut Detroit Hawaii Iowa New Mexico Seattle Utah Atlanta
San Jose-Monterey Los Angeles Alaska Native Registry Rural Georgia California excluding SFSJMLA Kentucky Louisiana New JerseyGeorgia excluding ATLRG Idaho New York and Massachusetts) Mortality data are from the NCHS public use data file for the total US
a Underlying incidence and mortality data for American IndianAlaska Native are based on the PRCDA(PurchasedReferred Care DeliveryAreas) counties
b Hispanic is not mutually exclusive from whites blacks AsianPacific Islanders and American IndiansAlaska NativesUnderlying incidence data for Hispanics are based on NHIA and exclude cases from the Alaska Native Registry
- Statistic could not be calculatedA percent of 000 represents a value that is below 0005
Risk of Being Risk of Being
Race Current Diagnosed with Cancer Risk of Dying Race Current Diagnosed with Cancer Risk of Dying
Ethnicity Age +10 yrs +20 yrs +30 yrs Ever from Cancer Ethnicity Age +10 yrs +20 yrs +30 yrs Ever from Cancer
All Races 0 006 009 012 156 082 Asian 0 005 008 011 099 058
10 003 006 010 152 082 Pacific 10 003 006 009 095 058
20 003 007 014 149 082 Islander 20 003 006 010 092 058
30 004 011 026 147 082 30 003 008 016 090 057
40 007 022 051 145 082 40 004 012 026 087 057
50 015 045 089 141 082 50 008 022 047 083 056
60 031 079 121 134 082 60 014 040 066 078 054
70 053 101 - 115 080 70 028 055 - 067 051
80 062 - - 082 068 80 032 - - 047 040
White 0 006 010 013 164 085 American 0 005 007 009 085 040
10 003 007 011 159 086 Indian 10 002 004 008 081 040
20 003 007 014 156 085 Alaska 20 002 006 010 079 039
30 004 011 027 155 085 Nativea 30 004 008 019 078 039
40 007 023 053 153 085 40 004 015 030 076 040
50 016 047 095 149 086 50 012 027 051 075 040
60 033 083 127 141 086 60 017 042 061 068 040
70 057 106 - 121 084 70 029 051 - 058 038
80 066 - - 086 071 80 029 - - 038 025
Black 0 003 006 008 107 058 Hispanicb 0 007 011 015 124 066
10 002 005 009 105 059 10 005 008 012 118 066
20 003 006 013 104 059 20 004 008 014 114 065
30 004 011 022 102 058 30 004 010 021 111 064
40 007 019 041 100 058 40 006 017 037 108 064
50 013 035 066 097 058 50 011 031 063 104 063
60 025 058 083 091 058 60 021 054 085 097 062
70 039 069 - 079 057 70 037 070 - 083 058
80 042 - - 056 048 80 042 - - 058 049
Table 1320
Leukemia
Risk of Being Diagnosed With Cancer in 10 20 and 30 Years
Lifetime Risk of Being Diagnosed with Cancer Given Alive and Cancer-Free at Current Age and
Lifetime Risk of Dying from Cancer Given Alive at Current Age
Both Sexes 2014-2016 By RaceEthnicity
SEE
R C
ancer Statistics Review
1975-2016N
ational Cancer Institute
Devcan 677 April 2019 National Cancer Institute (httpssurveillancecancergovdevcan)Source Incidence data are from the SEER 21 areas (San Francisco Connecticut Detroit Hawaii Iowa New Mexico Seattle Utah Atlanta
San Jose-Monterey Los Angeles Alaska Native Registry Rural Georgia California excluding SFSJMLA Kentucky Louisiana New JerseyGeorgia excluding ATLRG Idaho New York and Massachusetts) Mortality data are from the NCHS public use data file for the total US
a Underlying incidence and mortality data for American IndianAlaska Native are based on the PRCDA(PurchasedReferred Care DeliveryAreas) counties
b Hispanic is not mutually exclusive from whites blacks AsianPacific Islanders and American IndiansAlaska NativesUnderlying incidence data for Hispanics are based on NHIA and exclude cases from the Alaska Native Registry
- Statistic could not be calculatedA percent of 000 represents a value that is below 0005
Risk of Being Risk of Being
Race Current Diagnosed with Cancer Risk of Dying Race Current Diagnosed with Cancer Risk of Dying
Ethnicity Age +10 yrs +20 yrs +30 yrs Ever from Cancer Ethnicity Age +10 yrs +20 yrs +30 yrs Ever from Cancer
All Races 0 006 010 013 186 096 Asian 0 005 009 011 119 072
10 004 007 012 182 097 Pacific 10 004 007 010 115 072
20 003 008 016 179 097 Islander 20 003 007 012 111 071
30 005 013 030 177 097 30 004 009 019 109 071
40 008 026 062 176 098 40 005 015 033 106 070
50 018 056 112 173 099 50 010 028 062 102 069
60 040 101 152 166 101 60 019 054 084 096 068
70 071 129 - 146 101 70 038 071 - 084 065
80 082 - - 105 088 80 040 - - 056 052
White 0 007 011 014 195 101 American 0 006 009 011 110 048
10 004 008 012 190 102 Indian 10 003 005 010 105 048
20 004 008 016 187 101 Alaska 20 002 007 011 103 048
30 005 013 031 186 101 Nativea 30 005 009 021 103 048
40 009 027 065 184 102 40 005 017 041 102 049
50 019 058 118 181 103 50 013 039 075 102 051
60 042 107 160 174 106 60 028 067 087 097 051
70 075 136 - 153 105 70 046 070 - 081 049
80 087 - - 110 091 80 034 - - 049 030
Black 0 003 006 008 122 065 Hispanicb 0 007 013 017 141 080
10 003 006 009 122 066 10 005 010 015 135 080
20 003 006 014 120 065 20 005 009 016 130 079
30 004 011 025 119 066 30 005 011 023 127 078
40 008 022 048 118 066 40 007 018 040 124 078
50 015 042 079 115 067 50 012 034 072 120 078
60 031 071 102 112 068 60 024 064 100 114 078
70 051 089 - 101 068 70 046 086 - 102 077
80 058 - - 077 061 80 053 - - 074 070
Table 1321
Leukemia
Risk of Being Diagnosed With Cancer in 10 20 and 30 Years
Lifetime Risk of Being Diagnosed with Cancer Given Alive and Cancer-Free at Current Age and
Lifetime Risk of Dying from Cancer Given Alive at Current Age
Males 2014-2016 By RaceEthnicity
SEE
R C
ancer Statistics Review
1975-2016N
ational Cancer Institute
Devcan 677 April 2019 National Cancer Institute (httpssurveillancecancergovdevcan)Source Incidence data are from the SEER 21 areas (San Francisco Connecticut Detroit Hawaii Iowa New Mexico Seattle Utah Atlanta
San Jose-Monterey Los Angeles Alaska Native Registry Rural Georgia California excluding SFSJMLA Kentucky Louisiana New JerseyGeorgia excluding ATLRG Idaho New York and Massachusetts) Mortality data are from the NCHS public use data file for the total US
a Underlying incidence and mortality data for American IndianAlaska Native are based on the PRCDA(PurchasedReferred Care DeliveryAreas) counties
b Hispanic is not mutually exclusive from whites blacks AsianPacific Islanders and American IndiansAlaska NativesUnderlying incidence data for Hispanics are based on NHIA and exclude cases from the Alaska Native Registry
- Statistic could not be calculatedA percent of 000 represents a value that is below 0005
Risk of Being Risk of Being
Race Current Diagnosed with Cancer Risk of Dying Race Current Diagnosed with Cancer Risk of Dying
Ethnicity Age +10 yrs +20 yrs +30 yrs Ever from Cancer Ethnicity Age +10 yrs +20 yrs +30 yrs Ever from Cancer
All Races 0 006 008 011 129 068 Asian 0 005 008 010 083 048
10 003 005 009 125 069 Pacific 10 003 005 008 078 047
20 003 006 012 122 068 Islander 20 002 005 009 075 047
30 003 009 021 120 068 30 003 006 013 073 046
40 006 018 039 118 068 40 004 010 021 071 046
50 012 034 068 114 067 50 007 017 035 068 045
60 023 059 093 106 067 60 011 029 051 063 044
70 039 077 - 091 064 70 019 042 - 054 040
80 048 - - 066 055 80 026 - - 040 033
White 0 006 009 011 135 071 American 0 003 005 007 061 031
10 003 005 009 131 071 Indian 10 002 003 007 058 031
20 003 006 012 128 071 Alaska 20 002 005 008 056 031
30 003 010 022 126 071 Nativea 30 004 007 017 055 031
40 006 019 042 124 070 40 003 014 020 053 031
50 013 036 072 120 070 50 011 017 030 051 031
60 024 062 099 112 069 60 007 021 038 042 030
70 042 081 - 096 067 70 015 035 - 039 029
80 051 - - 069 057 80 025 - - 030 022
Black 0 004 006 008 095 053 Hispanicb 0 006 010 013 110 056
10 002 004 008 093 054 10 004 007 010 105 056
20 002 006 012 091 053 20 003 006 012 101 055
30 004 010 020 089 053 30 003 009 019 099 054
40 006 016 035 087 053 40 006 016 034 096 054
50 011 029 054 083 052 50 010 028 055 091 052
60 020 047 069 077 051 60 019 046 073 084 050
70 030 055 - 065 049 70 030 059 - 070 046
80 033 - - 046 042 80 035 - - 048 037
Table 1322
Leukemia
Risk of Being Diagnosed With Cancer in 10 20 and 30 Years
Lifetime Risk of Being Diagnosed with Cancer Given Alive and Cancer-Free at Current Age and
Lifetime Risk of Dying from Cancer Given Alive at Current Age
Females 2014-2016 By RaceEthnicity
SEER Cancer Statistics Review 1975-2016 National Cancer Institute
The AAPC is the Average Annual Percent Change over the time interval The AAPCs are calculated bythe Joinpoint Regression Program Version 47 February 2019 National Cancer Institute
- Statistic not shown Rate based on less than 16 cases for the time intervalTrend based on less than 10 cases for at least one year within the time interval
a Rates are age-adjusted to the 2000 US Std Population (19 age groups - Census P25-1130) Trendsare based on rates age-adjusted to the 2000 US Std Population (19 age groups - Census P25-1130)
b The SEER 9 areas are San Francisco Connecticut Detroit Hawaii Iowa New Mexico SeattleUtah and AtlantaThe SEER 21 areas comprise the SEER 9 areas plus San Jose-Monterey Los Angeles the AlaskaNative Registry Rural Georgia California excluding SFSJMLA Kentucky Louisiana New JerseyGeorgia excluding ATLRG Idaho New York and Massachusetts
c The 2007-2016 AAPC estimates are based on a Joinpoint analysis with up to 3 Joinpoints overdiagnosis years 2000-2016
d The 2007-2016 AAPC estimates are based on a Joinpoint analysis with up to 5 Joinpoints overdiagnosis years 1975-2016
e Hispanic and Non-Hispanic are not mutually exclusive from whites blacks AsianPacificIslanders and American IndiansAlaska Natives Incidence data for Hispanics and Non-Hispanicsare based on NHIA and exclude cases from the Alaska Native Registry
f Incidence data for American IndianAlaska Native are based on the PurchasedReferred CareDelivery Area (PRCDA) counties
g US Mortality Files National Center for Health Statistics CDCh The 2007-2016 mortality AAPCs are based on a Joinpoint analysis using years of death 2000-2016 The APC is significantly different from zero (plt05)
SEER Incidence SEER 21 Areasb SEER 21 Areasb SEER 9 Areasb
Rate 2012-2016 Trend 2007-2016c Trend 2007-2016d
Rate per 100000 persons AAPC () AAPC ()
Total Males Females Total Males Females Total Males Females RaceEthnicity
All Races 141 181 109 -04 -02 -06 -03 02 03
White 149 191 115 -05 -05 -07 04 03 05White Hispanice 112 134 94 01 -02 03 - - -White Non-Hispanice 153 197 116 -05 -05 -08 - - -
Black 109 139 89 06 02 07 01 01 02
AsianPacific Islander 78 97 63 01 00 02 - - -
Amer IndAlaska Natf 86 110 66 08 21 -01 - - -
Hispanice 108 130 91 02 00 03 - - -
US Mortalityg Rate 2012-2016 Trend 2007-2016h
Rate per 100000 persons AAPC ()
Total Males Females Total Males FemalesRaceEthnicity
All Races 65 88 49 -16 -17 -13
White 68 91 51 -14 -16 -12White Hispanice 50 63 41 -07 -08 -06White Non-Hispanice 69 93 51 -14 -15 -12
Black 55 72 44 -15 -17 -15
AsianPacific Islander 36 47 28 -18 -07 -23
Amer IndAlaska NatTotal US 31 42 23 -22 -09 -36PRCDA Counties 41 54 30 -16 -05 -28Non-PRCDA Counties 20 28 15 -31 -13 -50
Hispanice 47 60 38 -08 -09 -07
Table 1323Leukemia
SEER Incidence and US MortalityAge-Adjusted Rates and Trendsa
By RaceEthnicity and Sex
SEE
R C
ancer Statistics Review
1975-2016N
ational Cancer Institute
a Rates are per 100000 and are age-adjusted to the 2000 US Std Population (19 age groups - Census P25-1130)b The SEER 9 areas are San Francisco Connecticut Detroit Hawaii Iowa New Mexico Seattle Utah and Atlanta
The SEER 13 areas comprise the SEER 9 areas plus San Jose-Monterey Los Angeles the Alaska Native Registry and Rural GeorgiaThe SEER 18 areas comprise the SEER 13 areas plus California excluding SFSJMLA Kentucky Louisiana New Jersey and Georgiaexcluding ATLRGThe SEER 21 areas comprise the SEER 18 areas plus Idaho New York and Massachusetts
- Statistic not shown Rate based on less than 16 cases for the time interval
All Races Whites Blacks Total Males Females Total Males Females Total Males Females
SEER Incidence Ratesa 2012-2016
California 1239 1590 949 1337 1715 1020 1039 1334 813Greater Bay Area 1231 1619 915 1400 1844 1028 1098 1406 859San Francisco-Oakland 1212 1596 906 1389 1823 1034 1077 1336 881San Jose-Monterey 1259 1651 925 1410 1869 1011 1239 1787 -
Los Angeles 1173 1469 933 1291 1622 1016 1050 1294 884Greater California 1271 1633 968 1334 1709 1017 1007 1338 729
Connecticut 1406 1768 1117 1431 1790 1142 976 1126 867Detroit 1584 2050 1230 1707 2222 1300 1204 1485 1018Georgia 1430 1841 1120 1537 1970 1189 1139 1487 935Atlanta 1382 1819 1064 1563 2017 1207 1138 1557 884Rural Georgia 1411 1586 1206 1510 1773 1196 1248 - 1236Greater Georgia 1455 1863 1144 1531 1965 1182 1140 1450 968
Hawaii 1073 1339 843 1388 1612 1139 - - -Idaho 1588 1950 1263 1604 1973 1272 - - -Iowa 1627 2127 1222 1630 2133 1221 1416 1743 1076Kentucky 1566 1983 1234 1577 1995 1241 1159 1446 922Louisiana 1405 1789 1104 1518 1918 1197 1103 1393 890Massachusetts 1108 1429 854 1118 1448 856 787 1050 620New Jersey 1524 1962 1188 1541 1982 1199 1136 1469 928New Mexico 1299 1550 1086 1310 1556 1101 1045 - -New York 1623 2119 1244 1752 2281 1335 1068 1360 887Seattle-Puget Sound 1568 2020 1188 1634 2084 1249 1486 1929 1077Utah 1375 1793 1009 1401 1825 1029 - - -
SEER 9 Areasb 1419 1823 1094 1521 1945 1171 1154 1460 941SEER 13 Areasb 1357 1737 1049 1473 1882 1134 1126 1419 922SEER 18 Areasb 1376 1761 1066 1461 1867 1127 1114 1414 907SEER 21 Areasb 1407 1807 1088 1491 1912 1147 1089 1386 889
Table 1324Leukemia
Age-Adjusted SEER Incidence Ratesa
By Registry Race and Sex
SEE
R C
ancer Statistics Review
1975-2016N
ational Cancer Institute
a US Mortality Files National Center for Health Statistics Centers for Disease Control and PreventionRates are per 100000 and are age-adjusted to the 2000 US Std Population (19 age groups - Census P25-1130)
b The SEER 9 areas are San Francisco Connecticut Detroit Hawaii Iowa New Mexico Seattle Utah and AtlantaThe SEER 13 areas comprise the SEER 9 areas plus San Jose-Monterey Los Angeles the Alaska Native Registry and Rural GeorgiaThe SEER 18 areas comprise the SEER 13 areas plus California excluding SFSJMLA Kentucky Louisiana New Jersey and Georgiaexcluding ATLRGThe SEER 21 areas comprise the SEER 18 areas plus Idaho New York and Massachusetts
- Statistic not shown Rate based on less than 16 cases for the time interval
All Races Whites Blacks Total Males Females Total Males Females Total Males Females
SEER Death Ratesa 2012-2016
California 617 811 470 671 885 507 560 711 461Greater Bay Area 563 759 419 640 869 470 551 742 424San Francisco-Oakland 551 753 405 631 871 455 544 726 421San Jose-Monterey 584 768 446 653 863 495 604 - -
Los Angeles 608 797 468 675 894 513 571 717 483Greater California 639 835 489 677 886 515 553 687 458
Connecticut 622 837 465 639 862 474 536 665 449Detroit 662 915 485 691 967 494 573 723 475Georgia 614 817 467 642 855 478 538 706 438Atlanta 568 757 437 615 802 483 487 658 374Rural Georgia 581 628 538 579 635 - - - -Greater Georgia 639 851 482 654 879 477 576 745 483
Hawaii 463 593 362 543 632 440 - - -Idaho 655 846 497 661 865 492 - - -Iowa 693 961 498 700 963 508 - - -Kentucky 742 949 592 750 953 603 633 894 455Louisiana 677 906 514 705 953 520 603 776 498Massachusetts 622 830 478 647 869 490 463 524 444New Jersey 615 810 478 657 871 504 474 549 429New Mexico 560 759 400 589 794 421 - - -New York 621 842 466 675 910 506 450 602 356Seattle-Puget Sound 618 795 481 637 807 503 708 975 499Utah 679 865 526 693 876 542 - - -
SEER 9 Areasb 610 818 457 651 869 487 540 711 427SEER 13 Areasb 609 810 460 658 874 494 544 708 437SEER 18 Areasb 630 832 480 671 887 508 552 705 455SEER 21 Areasb 628 834 477 670 889 506 520 670 426
Total US 654 876 489 681 912 506 550 721 439
Table 1325Leukemia
Age-Adjusted SEER Death Ratesa
By Registry Race and Sex
SEER Cancer Statistics Review 1975-2016 National Cancer Institute
a US Mortality Files National Center for Health Statistics Centers for Disease Control andPrevention Rates are per 100000 and are age-adjusted to the 2000 US Std Population (19age groups - Census P25-1130)
b Difference between state rate and total US rate is statistically significant (plt=0002)c Absolute percent difference between state rate and total US rate is 15 or mored Rank of state level death rate and the 95 confidence intervals (low high) for the rankSE Standard error of the ratePD Percent difference between state rate and total US rate- Statistic not shown Rate based on less than 16 cases for the time interval
State Rate SE Rank(CI)d PD TOTAL US 654 002
High Five StatesOklahoma 790 019 01(0108) 2083c
West Virginia 749 025 02(0123) 1449South Dakota 747 040 03(0133) 1415Kentucky 742 018 04(0116) 1352Kansas 742 022 05(0122) 1350
Low Five StatesColorado 609 016 47(2649) -692Alaska 596 050 48(0451) -885New Mexico 560 022 49(3650) -1430DC 504 041 50(3251) -2293c
Hawaii 463 024 51(4951) -2913c
State Rate SE Rank(CI)d PD State Rate SE Rank(CI)d PD
Alabama 689 016 17(0532) 533 Montana 613 032 45(0950) -634Alaska 596 050 48(0451) -885 Nebraska 718 026 10(0131) 983Arizona 632 013 36(2248) -329 Nevada 644 021 28(1148) -157Arkansas 719 021 09(0127) 993 New Hampshire 638 029 31(0749) -238California 617 006 42(3248) -572 New Jersey 615 011 43(2849) -592Colorado 609 016 47(2649) -692 New Mexico 560 022 49(3650) -1430Connecticut 622 017 40(2249) -490 New York 621 007 41(2948) -499Delaware 664 035 24(0249) 152 North Carolina 634 011 34(2347) -310DC 504 041 50(3251) -2293c North Dakota 656 040 26(0249) 029Florida 630 007 38(2645) -370 Ohio 694 010 13(0626) 608Georgia 614 012 44(2849) -604 Oklahoma 790 019 01(0108) 2083c
Hawaii 463 024 51(4951) -2913c Oregon 632 017 37(1948) -331Idaho 655 028 27(0548) 012 Pennsylvania 680 009 21(1029) 396Illinois 684 010 19(0928) 463 Rhode Island 656 033 25(0349) 037Indiana 719 014 08(0222) 994 South Carolina 682 016 20(0634) 435Iowa 693 019 14(0334) 604 South Dakota 747 040 03(0133) 1415Kansas 742 022 05(0122) 1350 Tennessee 702 014 12(0327) 729Kentucky 742 018 04(0116) 1352 Texas 640 007 30(2342) -215Louisiana 677 017 23(0637) 356 Utah 679 024 22(0346) 387Maine 638 027 32(0949) -240 Vermont 636 041 33(0350) -277Maryland 633 014 35(2148) -323 Virginia 611 012 46(2849) -661Massachusetts 622 013 39(2548) -482 Washington 640 013 29(2047) -209Michigan 685 011 18(0829) 476 West Virginia 749 025 02(0123) 1449Minnesota 691 015 16(0430) 564 Wisconsin 727 015 06(0219) 1110Mississippi 692 021 15(0337) 580 Wyoming 721 049 07(0148) 1028Missouri 711 014 11(0324) 874
Table 1326Leukemia
Age-Adjusted Cancer Deatha Rates By State All Races 2012-2016
Males and Females
SEER Cancer Statistics Review 1975-2016 National Cancer Institute
a US Mortality Files National Center for Health Statistics Centers for Disease Control andPrevention Rates are per 100000 and are age-adjusted to the 2000 US Std Population (19age groups - Census P25-1130)
b Difference between state rate and total US rate is statistically significant (plt=0002)c Absolute percent difference between state rate and total US rate is 15 or mored Rank of state level death rate and the 95 confidence intervals (low high) for the rankSE Standard error of the ratePD Percent difference between state rate and total US rate- Statistic not shown Rate based on less than 16 cases for the time interval
State Rate SE Rank(CI)d PD TOTAL US 876 003
High Five StatesOklahoma 1022 034 01(0120) 1669c
Kansas 1018 039 02(0123) 1625c
Arkansas 991 037 03(0127) 1309South Dakota 985 068 04(0147) 1249Delaware 984 065 05(0144) 1236
Low Five StatesMontana 795 053 47(1150) -921New Mexico 759 039 48(2650) -1336Alaska 711 081 49(0851) -1887c
DC 704 078 50(1051) -1959c
Hawaii 593 040 51(4951) -3228c
State Rate SE Rank(CI)d PD State Rate SE Rank(CI)d PD
Alabama 939 029 17(0233) 725 Montana 795 053 47(1150) -921Alaska 711 081 49(0851) -1887c Nebraska 958 046 12(0141) 935Arizona 827 022 41(2449) -555 Nevada 858 037 33(0849) -210Arkansas 991 037 03(0127) 1309 New Hampshire 884 051 25(0149) 088California 811 010 43(3348) -738 New Jersey 810 020 44(2749) -747Colorado 834 028 39(2049) -484 New Mexico 759 039 48(2650) -1336Connecticut 837 031 37(1549) -441 New York 842 013 35(2546) -387Delaware 984 065 05(0144) 1236 North Carolina 863 020 31(1945) -149DC 704 078 50(1051) -1959c North Dakota 873 070 27(0150) -030Florida 839 012 36(2645) -422 Ohio 931 018 19(0529) 627Georgia 817 021 42(2649) -677 Oklahoma 1022 034 01(0120) 1669c
Hawaii 593 040 51(4951) -3228c Oregon 866 029 29(1147) -112Idaho 846 047 34(0550) -339 Pennsylvania 912 016 21(0931) 416Illinois 928 018 20(0529) 594 Rhode Island 911 059 22(0149) 400Indiana 960 025 11(0127) 959 South Carolina 951 029 13(0131) 853Iowa 961 035 08(0131) 969 South Dakota 985 068 04(0147) 1249Kansas 1018 039 02(0123) 1625c Tennessee 960 025 10(0127) 959Kentucky 949 031 15(0133) 832 Texas 870 013 28(2139) -069Louisiana 906 030 23(0442) 342 Utah 865 041 30(0549) -122Maine 803 046 46(1450) -836 Vermont 874 074 26(0150) -026Maryland 861 026 32(1447) -176 Virginia 809 021 45(2650) -770Massachusetts 830 023 40(2349) -529 Washington 835 023 38(2248) -463Michigan 937 020 18(0428) 702 West Virginia 972 044 06(0135) 1095Minnesota 948 027 16(0229) 826 Wisconsin 960 026 09(0127) 961Mississippi 970 039 07(0132) 1077 Wyoming 885 081 24(0150) 102Missouri 951 025 14(0228) 852
Table 1327Leukemia
Age-Adjusted Cancer Deatha Rates By State All Races 2012-2016
Males
SEER Cancer Statistics Review 1975-2016 National Cancer Institute
a US Mortality Files National Center for Health Statistics Centers for Disease Control andPrevention Rates are per 100000 and are age-adjusted to the 2000 US Std Population (19age groups - Census P25-1130)
b Difference between state rate and total US rate is statistically significant (plt=0002)c Absolute percent difference between state rate and total US rate is 15 or mored Rank of state level death rate and the 95 confidence intervals (low high) for the rankSE Standard error of the ratePD Percent difference between state rate and total US rate- Statistic not shown Rate based on less than 16 cases for the time interval
State Rate SE Rank(CI)d PD TOTAL US 489 002
High Five StatesOklahoma 615 023 01(0108) 2584c
Wyoming 596 060 02(0147) 2194c
Kentucky 592 021 03(0111) 2126c
West Virginia 576 030 04(0126) 1792c
South Dakota 564 047 05(0145) 1551c
Low Five StatesColorado 441 018 47(2250) -972Delaware 428 037 48(0751) -1247New Mexico 400 025 49(3151) -1803c
DC 381 046 50(1251) -2203c
Hawaii 362 029 51(4151) -2598c
State Rate SE Rank(CI)d PD State Rate SE Rank(CI)d PD
Alabama 512 019 18(0440) 483 Montana 452 037 43(0551) -745Alaska 485 062 27(0151) -073 Nebraska 531 030 10(0144) 864Arizona 473 015 31(1347) -308 Nevada 455 025 42(1150) -695Arkansas 516 024 15(0344) 554 New Hampshire 449 033 45(0651) -807California 470 007 34(2345) -383 New Jersey 478 013 30(1346) -223Colorado 441 018 47(2250) -972 New Mexico 400 025 49(3151) -1803c
Connecticut 465 020 40(1249) -487 New York 466 009 38(2246) -456Delaware 428 037 48(0751) -1247 North Carolina 471 012 32(1747) -350DC 381 046 50(1251) -2203c North Dakota 479 046 28(0151) -189Florida 460 008 41(2647) -582 Ohio 520 012 12(0529) 653Georgia 467 013 37(1747) -433 Oklahoma 615 023 01(0108) 2584c
Hawaii 362 029 51(4151) -2598c Oregon 449 019 44(1850) -799Idaho 497 033 22(0249) 174 Pennsylvania 516 011 14(0629) 556Illinois 514 011 16(0631) 526 Rhode Island 471 037 33(0351) -363Indiana 540 017 07(0226) 1052 South Carolina 495 018 23(0645) 133Iowa 498 022 20(0547) 200 South Dakota 564 047 05(0145) 1551c
Kansas 539 025 08(0137) 1032 Tennessee 517 016 13(0435) 590Kentucky 592 021 03(0111) 2126c Texas 467 008 36(2246) -431Louisiana 514 020 17(0442) 520 Utah 526 029 11(0146) 778Maine 508 032 19(0248) 403 Vermont 444 045 46(0351) -906Maryland 470 016 35(1448) -389 Virginia 465 014 39(1848) -474Massachusetts 478 015 29(1247) -220 Washington 487 016 25(0946) -022Michigan 498 013 21(0939) 192 West Virginia 576 030 04(0126) 1792c
Minnesota 494 017 24(0745) 121 Wisconsin 545 017 06(0225) 1162Mississippi 485 023 26(0548) -067 Wyoming 596 060 02(0147) 2194c
Missouri 535 017 09(0327) 953
Table 1328Leukemia
Age-Adjusted Cancer Deatha Rates By State All Races 2012-2016
Females
SEE
R C
ancer Statistics Review
1975-2016N
ational Cancer Institute
a US 2016 cancer prevalence counts are based on 2016 cancer prevalence proportions from the SEER 13 Areas (excluding the AlaskaNative Registry) and 112016 US population estimates based on the average of 2015 and 2016 population estimates from theUS Bureau of the CensusPrevalence was calculated using the first invasive tumor for each cancer site diagnosed during the previous 24 years
b Maximum limited-duration prevalence is 24 years for 1992-2016 datac Percentages are age-adjusted to the 2000 US Standard Population (19 age groups - Census P25-1130) by 5-year age groupsd Cases diagnosed more than 24 years ago were estimated using the completeness index method (Capocaccia et al 1997
Merrill et al 2000)e Complete prevalence is obtained by summing 0 to lt24 and gt=24- Statistic not shown Statistic based on fewer than 5 cases estimated alive in SEER for the time interval+ Not available
Years Since Diagnosis 0 to lt5 5 to lt10 10 to lt15 15 to lt20 20 to lt24 0 to lt24b gt=24d Completee
Race Sex All Races Both Sexes 153253 100309 63581 38012 21353 376508 38265 414773
Males 90192 57683 36029 21220 12020 217145 18411 235556Females 63061 42625 27552 16792 9333 159363 19854 179217
White Both Sexes 132173 87961 56051 33596 19035 328814 32999 370135Males 78368 50894 32033 18770 10845 190910 15102 210930Females 53805 37067 24018 14826 8190 137905 17897 159205
Black Both Sexes 12734 6564 4233 2487 1259 27277 4070 31347Males 6847 3556 2204 1334 637 14578 1776 16354Females 5887 3008 2029 1153 622 12699 2294 14992
Asian Both Sexes 3926 2561 1778 1164 690 10120 + +Pacific Males 2235 1462 936 646 351 5630 + +Islander Females 1691 1100 842 519 339 4490 + +
Hispanic Both Sexes 14464 9581 6796 4462 2630 37933 + +Males 8166 5374 3794 2408 1538 21280 + +Females 6298 4207 3002 2055 1092 16654 + +
Age Specific (Crude) Age-Adjustedc Age at Prevalence All Ages 0-9 10-19 20-29 30-39 40-49 50-59 60-69 70-79 80+ All Ages
Race Sex All Races Both Sexes 01168 00328 00640 00628 00377 00561 01053 02263 04023 05111 01054
Males 01369 00339 00706 00685 00419 00657 01287 02888 05282 07048 01306Females 00974 00317 00572 00570 00333 00466 00829 01696 02974 03919 00844
White Both Sexes 01304 00369 00715 00712 00410 00584 01106 02389 04249 05386 01127Males 01528 00379 00789 00771 00457 00682 01349 03042 05558 07387 01389Females 01084 00359 00637 00650 00362 00484 00869 01784 03135 04133 00904
Black Both Sexes 00605 00145 00322 00320 00267 00463 00752 01455 02470 03076 00660Males 00674 00142 00357 00338 00281 00530 00919 01737 03249 04580 00816Females 00541 00148 00286 00301 00255 00402 00605 01230 01927 02334 00552
Asian Both Sexes 00497 00264 00531 00426 00230 00390 00553 00882 01245 01389 00513Pacific Males 00577 00298 00555 00507 00249 00461 00665 01122 01552 01904 00613Islander Females 00423 00228 00507 00345 00212 00327 00456 00688 00999 01057 00430
Hispanic Both Sexes 00664 00375 00737 00728 00395 00485 00723 01191 01987 02074 00746Males 00737 00397 00827 00807 00471 00576 00831 01350 02221 02551 00854Females 00589 00352 00642 00641 00312 00391 00617 01050 01809 01780 00647
Table 1329Leukemia
Estimated United States Cancer Prevalence Countsa on January 1 2016By RaceEthnicity Sex and Years Since Diagnosis
Estimated prevalence percenta on January 1 2016 of the SEER population diagnosed in the previous 24 yearsBy Age at Prevalence RaceEthnicity and Sex
SEE
R C
ancer Statistics Review
1975-2016N
ational Cancer Institute
a US 2016 cancer prevalence counts are based on 2016 cancer prevalence proportions from the SEER 13 Areas (excluding the AlaskaNative Registry) and 112016 US population estimates based on the average of 2015 and 2016 population estimates from theUS Bureau of the CensusPrevalence was calculated using the first invasive tumor for each cancer site diagnosed during the previous 24 years
b Maximum limited-duration prevalence is 24 years for 1992-2016 datac Percentages are age-adjusted to the 2000 US Standard Population (19 age groups - Census P25-1130) by 5-year age groupsd Cases diagnosed more than 24 years ago were estimated using the completeness index method (Capocaccia et al 1997
Merrill et al 2000)e Complete prevalence is obtained by summing 0 to lt24 and gt=24- Statistic not shown Statistic based on fewer than 5 cases estimated alive in SEER for the time interval+ Not available
Years Since Diagnosis 0 to lt5 5 to lt10 10 to lt15 15 to lt20 20 to lt24 0 to lt24b gt=24d Completee
Race Sex All Races Both Sexes 20277 16033 13721 12074 8203 70308 25456 95764
Males 11203 9049 7751 6542 4634 39179 12997 52176Females 9074 6984 5971 5531 3568 31129 12460 43589
White Both Sexes 17123 13855 11870 10663 7154 60665 21823 83282Males 9549 7741 6768 5696 4084 33839 11286 45559Females 7573 6114 5102 4967 3070 26826 10537 37723
Black Both Sexes 1590 1133 923 727 553 4926 1609 6535Males 809 734 473 411 290 2716 592 3308Females 781 399 450 317 263 2210 1017 3227
Asian Both Sexes 998 720 669 486 361 3234 + +Pacific Males 527 406 369 313 178 1793 + +Islander Females 472 314 300 173 183 1441 + +
Hispanic Both Sexes 5905 4543 3352 2717 1749 18266 + +Males 3302 2686 1899 1465 1058 10409 + +Females 2603 1857 1454 1252 692 7857 + +
Age Specific (Crude) Age-Adjustedc Age at Prevalence All Ages 0-9 10-19 20-29 30-39 40-49 50-59 60-69 70-79 80+ All Ages
Race Sex All Races Both Sexes 00218 00276 00541 00467 00139 00078 00059 00065 00053 00033 00228
Males 00247 00286 00591 00520 00163 00095 00066 00069 00056 00035 00251Females 00190 00266 00488 00410 00115 00062 00053 00062 00050 00032 00204
White Both Sexes 00241 00315 00612 00542 00161 00086 00063 00070 00056 00033 00259Males 00271 00323 00670 00598 00186 00107 00069 00074 00060 00032 00284Females 00211 00306 00551 00482 00135 00064 00057 00066 00053 00033 00232
Black Both Sexes 00109 00107 00250 00197 00067 00042 00039 00029 00012 00027 00102Males 00126 00112 00281 00224 00079 00035 00052 00026 00012 00027 00112Females 00094 00102 00219 00171 00056 00047 00028 00032 00013 00027 00092
Asian Both Sexes 00159 00208 00418 00289 00071 00064 00045 00050 00054 00036 00163Pacific Males 00184 00226 00427 00360 00086 00069 00055 00054 00033 00055 00180Islander Females 00136 00190 00408 00219 00058 00059 00036 00047 00071 00023 00146
Hispanic Both Sexes 00320 00328 00637 00574 00165 00107 00093 00100 00084 00012 00279Males 00361 00342 00710 00648 00205 00131 00110 00063 00072 - 00309Females 00278 00312 00562 00494 00122 00082 00077 00133 00093 00020 00246
Table 1330Acute Lymphocytic Leukemia
Estimated United States Cancer Prevalence Countsa on January 1 2016By RaceEthnicity Sex and Years Since Diagnosis
Estimated prevalence percenta on January 1 2016 of the SEER population diagnosed in the previous 24 yearsBy Age at Prevalence RaceEthnicity and Sex
0
5
10
15
20
25
1975 1985 1995 2005 20160
5
10
15
20
25
1975 1985 1995 2005 20160
3
6
9
12
15
1975 1985 1995 2005 20160
3
6
9
12
15
1975 1985 1995 2005 2016
Delay-Adj IncidenceDelay-Adj Incidence
Observed IncidenceObserved Incidence
MortalityMortality
SEER Observed Incidence SEER Delay Adjusted Incidence and US Death RatesLeukemia by Race and Sex
a
Figure 131
Source SEER 9 areas and US Mortality Files (National Center for Health Statistics CDC)Rates are age-adjusted to the 2000 US Std Population (19 age groups - Census P25-1103)Regression lines and APCs are calculated using the Joinpoint Regression Program Version 47 February 2019 National Cancer InstituteThe APC is the Annual Percent Change for the regression line segments The APC shown on the graph is for the most recent trendThe APC is significantly different from zero (p lt 005)
a
White Male Black Male White Female Black FemaleRate per 100000 Rate per 100000 Rate per 100000 Rate per 100000
Year of DiagnosisDeath Year of DiagnosisDeath Year of DiagnosisDeath Year of DiagnosisDeath
SEER Incidence APCsDelay Adj 1998-16 = 08Observed 1975-16 = 03
US Mortality APC2013-16 = -30
SEER Incidence APCsDelay Adj 1975-16 = 02Observed 1975-16 = 01
US Mortality APC1993-16 = -15
SEER Incidence APCsDelay Adj 1975-16 = 06Observed 1975-16 = 05
US Mortality APC2000-16 = -12
SEER Incidence APCsDelay Adj 1975-16 = 03Observed 1975-16 = 02
US Mortality APC1993-16 = -13
SEE
R C
ancer Statistics Review
1975-2016N
ational Cancer Institute
0
1
2
3
4
5
6
7
8
1975 1985 1995 2005 20160
1
2
3
4
5
6
7
8
1975 1985 1995 2005 20160
1
2
3
4
5
6
7
8
1975 1985 1995 2005 20160
1
2
3
4
5
6
7
8
1975 1985 1995 2005 2016
Chronic
Acute
SEER Observed Incidence RatesLymphocytic and Myeloid Leukemia (Acute and Chronic) by Sex
a
Figure 132
Source SEER 9 areas Rates are age-adjusted to the 2000 US Std Population (19 age groups - Census P25-1103)Regression lines and APCs are calculated using the Joinpoint Regression Program Version 47 February 2019 National Cancer Institute
a
Male Female Male FemaleLymphocytic Leukemia Myeloid Leukemia
Rate per 100000 Rate per 100000 Rate per 100000 Rate per 100000
Year of Diagnosis Year of Diagnosis Year of Diagnosis Year of Diagnosis
SEE
R C
ancer Statistics Review
1975-2016N
ational Cancer Institute
Joinpoint Analyses for Whites and Blacks from 1975-2016and for AsianPacific Islanders American IndiansAlaska Natives and Hispanics from 2000-2016
0
5
10
15
20
1975 1985 1995 2005 20160
5
10
15
20
1975 1985 1995 2005 2016
White
Black
API
AIAN
Hispanic
SEER Incidence and US Death RatesLeukemia Both Sexes
Figure 133
Source Incidence data for whites and blacks are from the SEER 9 areas (San Francisco Connecticut Detroit Hawaii Iowa New Mexico Seattle Utah Atlanta)Incidence data for AsianPacific Islanders American IndiansAlaska Natives and Hispanics are from the SEER 21 areas (SEER 9 areas San Jose-MontereyLos Angeles Alaska Native Registry Rural Georgia California excluding SFSJMLA Kentucky Louisiana New Jersey Georgia excluding ATLRG Idaho New York andMassachusetts)Mortality data are from US Mortality Files National Center for Health Statistics CDCRates are age-adjusted to the 2000 US Std Population (19 age groups - Census P25-1103)Regression lines are calculated using the Joinpoint Regression Program Version 47 February 2019 National Cancer Institute Joinpoint analyses for Whites andBlacks during the 1975-2016 period allow a maximum of 5 joinpoints Analyses for other ethnic groups during the period 2000-2016 allow a maximum of 3 joinpointsAPI = AsianPacific IslanderAIAN = American IndianAlaska Native Rates for American IndianAlaska Native are based on the PurchasedReferred Care Delivery Area (PRCDA) countiesHispanic is not mutually exclusive from whites blacks AsianPacific Islanders and American IndiansAlaska Natives Incidence data for Hispanics are based onNHIA and exclude cases from the Alaska Native Registry
Incidence MortalityRate per 100000 Rate per 100000
Year of Diagnosis Year of Death
a
d
a
b
c
c
b
d
SEE
R C
ancer Statistics Review
1975-2016N
ational Cancer Institute
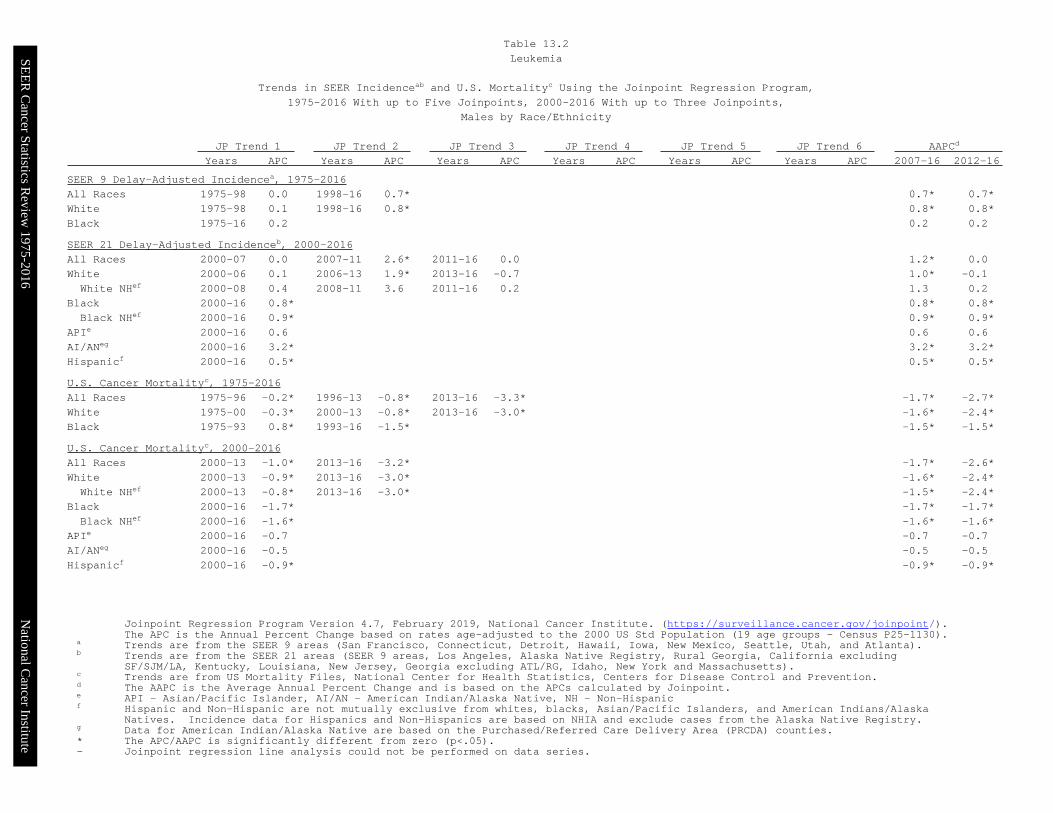
SEE
R C
ancer Statistics Review
1975-2016N
ational Cancer Institute
Joinpoint Regression Program Version 47 February 2019 National Cancer Institute (httpssurveillancecancergovjoinpoint)The APC is the Annual Percent Change based on rates age-adjusted to the 2000 US Std Population (19 age groups - Census P25-1130)
a Trends are from the SEER 9 areas (San Francisco Connecticut Detroit Hawaii Iowa New Mexico Seattle Utah and Atlanta)b Trends are from the SEER 21 areas (SEER 9 areas Los Angeles Alaska Native Registry Rural Georgia California excluding
SFSJMLA Kentucky Louisiana New Jersey Georgia excluding ATLRG Idaho New York and Massachusetts)c Trends are from US Mortality Files National Center for Health Statistics Centers for Disease Control and Preventiond The AAPC is the Average Annual Percent Change and is based on the APCs calculated by Joinpointe API - AsianPacific Islander AIAN - American IndianAlaska Native NH - Non-Hispanicf Hispanic and Non-Hispanic are not mutually exclusive from whites blacks AsianPacific Islanders and American IndiansAlaska
Natives Incidence data for Hispanics and Non-Hispanics are based on NHIA and exclude cases from the Alaska Native Registryg Data for American IndianAlaska Native are based on the PurchasedReferred Care Delivery Area (PRCDA) counties The APCAAPC is significantly different from zero (plt05)- Joinpoint regression line analysis could not be performed on data series
JP Trend 1 JP Trend 2 JP Trend 3 JP Trend 4 JP Trend 5 JP Trend 6 AAPCd
Years APC Years APC Years APC Years APC Years APC Years APC 2007-16 2012-16
SEER 9 Delay-Adjusted Incidencea 1975-2016
All Races 1975-98 00 1998-16 07 07 07
White 1975-98 01 1998-16 08 08 08
Black 1975-16 02 02 02
SEER 21 Delay-Adjusted Incidenceb 2000-2016
All Races 2000-07 00 2007-11 26 2011-16 00 12 00
White 2000-06 01 2006-13 19 2013-16 -07 10 -01
White NHef 2000-08 04 2008-11 36 2011-16 02 13 02
Black 2000-16 08 08 08
Black NHef 2000-16 09 09 09
APIe 2000-16 06 06 06
AIANeg 2000-16 32 32 32
Hispanicf 2000-16 05 05 05
US Cancer Mortalityc 1975-2016
All Races 1975-96 -02 1996-13 -08 2013-16 -33 -17 -27
White 1975-00 -03 2000-13 -08 2013-16 -30 -16 -24
Black 1975-93 08 1993-16 -15 -15 -15
US Cancer Mortalityc 2000-2016
All Races 2000-13 -10 2013-16 -32 -17 -26
White 2000-13 -09 2013-16 -30 -16 -24
White NHef 2000-13 -08 2013-16 -30 -15 -24
Black 2000-16 -17 -17 -17
Black NHef 2000-16 -16 -16 -16
APIe 2000-16 -07 -07 -07
AIANeg 2000-16 -05 -05 -05
Hispanicf 2000-16 -09 -09 -09
Table 132
Leukemia
Trends in SEER Incidenceab and US Mortalityc Using the Joinpoint Regression Program
1975-2016 With up to Five Joinpoints 2000-2016 With up to Three Joinpoints
Males by RaceEthnicity
SEE
R C
ancer Statistics Review
1975-2016N
ational Cancer Institute
Joinpoint Regression Program Version 47 February 2019 National Cancer Institute (httpssurveillancecancergovjoinpoint)The APC is the Annual Percent Change based on rates age-adjusted to the 2000 US Std Population (19 age groups - Census P25-1130)
a Trends are from the SEER 9 areas (San Francisco Connecticut Detroit Hawaii Iowa New Mexico Seattle Utah and Atlanta)b Trends are from the SEER 21 areas (SEER 9 areas Los Angeles Alaska Native Registry Rural Georgia California excluding
SFSJMLA Kentucky Louisiana New Jersey Georgia excluding ATLRG Idaho New York and Massachusetts)c Trends are from US Mortality Files National Center for Health Statistics Centers for Disease Control and Preventiond The AAPC is the Average Annual Percent Change and is based on the APCs calculated by Joinpointe API - AsianPacific Islander AIAN - American IndianAlaska Native NH - Non-Hispanicf Hispanic and Non-Hispanic are not mutually exclusive from whites blacks AsianPacific Islanders and American IndiansAlaska
Natives Incidence data for Hispanics and Non-Hispanics are based on NHIA and exclude cases from the Alaska Native Registryg Data for American IndianAlaska Native are based on the PurchasedReferred Care Delivery Area (PRCDA) counties The APCAAPC is significantly different from zero (plt05)- Joinpoint regression line analysis could not be performed on data series
JP Trend 1 JP Trend 2 JP Trend 3 JP Trend 4 JP Trend 5 JP Trend 6 AAPCd
Years APC Years APC Years APC Years APC Years APC Years APC 2007-16 2012-16
SEER 9 Delay-Adjusted Incidencea 1975-2016
All Races 1975-98 02 1998-16 08 08 08
White 1975-16 06 06 06
Black 1975-16 03 03 03
SEER 21 Delay-Adjusted Incidenceb 2000-2016
All Races 2000-05 -02 2005-14 16 2014-16 -29 06 -07
White 2000-16 10 10 10
White NHef 2000-16 11 11 11
Black 2000-06 -17 2006-16 22 22 22
Black NHef 2000-06 -18 2006-16 23 23 23
APIe 2000-16 08 08 08
AIANeg 2000-16 08 08 08
Hispanicf 2000-16 08 08 08
US Cancer Mortalityc 1975-2016
All Races 1975-80 07 1980-00 -04 2000-16 -13 -13 -13
White 1975-00 -03 2000-16 -12 -12 -12
Black 1975-93 04 1993-16 -13 -13 -13
US Cancer Mortalityc 2000-2016
All Races 2000-16 -13 -13 -13
White 2000-16 -12 -12 -12
White NHef 2000-16 -12 -12 -12
Black 2000-16 -15 -15 -15
Black NHef 2000-16 -14 -14 -14
APIe 2000-11 08 2011-16 -47 -23 -47
AIANeg 2000-16 -28 -28 -28
Hispanicf 2000-16 -07 -07 -07
Table 133
Leukemia
Trends in SEER Incidenceab and US Mortalityc Using the Joinpoint Regression Program
1975-2016 With up to Five Joinpoints 2000-2016 With up to Three Joinpoints
Females by RaceEthnicity
SEE
R C
ancer Statistics Review
1975-2016N
ational Cancer Institute
Reference Cancer Incidence Rates Adjusted for Reporting DelayIndividual rates for diagnosis years 1975-1979 available in web browser version of Cancer Statistics Review
a SEER 9 areas (San Francisco Connecticut Detroit Hawaii Iowa New Mexico Seattle Utah and Atlanta)Rates are per 100000 and are age-adjusted to the 2000 US Std Population (19 age groups - Census P25-1130)
- Delay-adjusted rate is not shown for observed rates based on less than 16 cases for the time interval
All Races Whites Blacks Total Males Females Total Males Females Total Males Females
Year of Diagnosis1975-1979 1289 1714 997 1334 1789 1024 1052 1376 8301980 1293 1738 985 1329 1792 1012 1218 1611 9471981 1238 1647 965 1265 1703 982 1227 1447 10371982 1315 1823 971 1350 1877 995 1075 1516 7911983 1314 1780 991 1348 1842 1007 1248 1595 10061984 1300 1711 1012 1346 1797 1035 1068 1187 9611985 1339 1778 1039 1376 1832 1066 1232 1703 9301986 1284 1754 951 1339 1839 992 1023 1320 8091987 1337 1777 1033 1382 1848 1064 1257 1760 9261988 1299 1752 973 1344 1830 1003 1155 1403 9421989 1348 1770 1049 1402 1836 1102 1126 1580 8111990 1293 1736 981 1356 1830 1028 1134 1478 8891991 1308 1682 1025 1371 1778 1060 1081 1209 9981992 1307 1756 982 1366 1872 1004 1068 1391 8421993 1309 1711 1008 1367 1804 1037 1168 1529 9141994 1312 1705 1023 1382 1798 1077 986 1271 7781995 1364 1780 1054 1453 1893 1127 997 1369 7421996 1320 1705 1045 1380 1786 1090 1077 1400 8731997 1326 1770 1004 1410 1880 1068 1067 1423 8291998 1328 1726 1033 1409 1819 1104 1002 1444 7271999 1289 1722 968 1353 1803 1017 1062 1423 8272000 1382 1795 1072 1452 1889 1124 1193 1405 10342001 1449 1886 1119 1545 1999 1201 1200 1460 10202002 1370 1812 1036 1478 1950 1119 914 1207 7092003 1379 1806 1054 1461 1925 1107 1158 1509 9062004 1407 1830 1085 1481 1920 1139 1306 1784 10042005 1399 1832 1066 1491 1977 1111 1155 1310 10412006 1408 1760 1144 1512 1871 1243 1131 1540 8482007 1364 1788 1043 1473 1924 1123 1003 1377 7752008 1430 1868 1085 1526 1992 1154 1112 1516 8182009 1403 1810 1087 1497 1936 1146 1151 1563 8782010 1493 1955 1142 1608 2099 1225 1127 1501 9022011 1525 1956 1179 1628 2083 1257 1303 1545 11082012 1510 1907 1197 1625 2037 1292 1238 1582 10082013 1512 1948 1165 1639 2093 1273 1223 1628 9222014 1533 2000 1163 1655 2138 1261 1200 1515 9812015 1497 1907 1160 1630 2081 1246 1150 1345 10282016 1525 1986 1147 1661 2157 1241 1312 1689 1050
Table 134Leukemia
Delay-adjusted SEER Incidencea Rates by Year Race and Sex
SEE
R C
ancer Statistics Review
1975-2016N
ational Cancer Institute
Individual rates for diagnosis years 1975-1979 available in web browser version of Cancer Statistics Reviewa SEER 9 areas (San Francisco Connecticut Detroit Hawaii Iowa New Mexico Seattle Utah and Atlanta)
Rates are per 100000 and are age-adjusted to the 2000 US Std Population (19 age groups - Census P25-1130)- Statistic not shown Rate based on less than 16 cases for the time interval
All Races Whites Blacks Total Males Females Total Males Females Total Males Females
Year of Diagnosis1975-2016 1354 1775 1041 1425 1874 1091 1120 1446 8951975-1979 1289 1714 997 1334 1789 1024 1052 1376 8301980 1293 1738 985 1329 1792 1012 1218 1611 9471981 1238 1647 965 1265 1703 982 1227 1447 10371982 1315 1823 971 1350 1877 995 1075 1516 7911983 1314 1780 991 1348 1842 1007 1248 1595 10061984 1300 1711 1012 1346 1797 1035 1068 1187 9611985 1339 1778 1039 1376 1832 1066 1232 1703 9301986 1284 1754 951 1339 1839 992 1023 1320 8091987 1337 1777 1033 1382 1848 1064 1257 1760 9261988 1299 1752 973 1344 1830 1003 1155 1403 9421989 1348 1770 1049 1402 1836 1102 1126 1580 8111990 1293 1736 981 1356 1830 1028 1134 1478 8891991 1308 1682 1025 1371 1778 1060 1081 1209 9981992 1307 1756 982 1366 1872 1004 1068 1391 8421993 1309 1711 1008 1367 1804 1037 1168 1529 9141994 1312 1705 1023 1382 1798 1077 986 1271 7781995 1364 1780 1054 1453 1893 1127 997 1369 7421996 1320 1705 1045 1380 1786 1090 1077 1400 8731997 1326 1770 1004 1410 1880 1068 1067 1423 8291998 1328 1726 1033 1409 1819 1104 1002 1444 7271999 1289 1722 968 1353 1803 1017 1062 1423 8272000 1382 1795 1072 1452 1889 1124 1193 1405 10342001 1449 1886 1119 1545 1999 1201 1200 1460 10202002 1370 1812 1036 1478 1950 1119 914 1207 7092003 1379 1806 1054 1461 1925 1107 1158 1509 9062004 1407 1830 1085 1481 1920 1139 1306 1784 10042005 1399 1832 1066 1491 1977 1111 1155 1310 10412006 1408 1760 1144 1512 1871 1243 1131 1540 8482007 1364 1788 1043 1473 1924 1123 1003 1377 7752008 1419 1853 1077 1512 1974 1143 1106 1508 8132009 1381 1781 1070 1469 1899 1125 1137 1543 8682010 1458 1907 1116 1563 2040 1191 1107 1473 8872011 1478 1894 1143 1569 2006 1212 1271 1510 10802012 1452 1832 1151 1550 1943 1234 1201 1532 9802013 1441 1856 1111 1550 1978 1204 1177 1566 8882014 1442 1879 1096 1542 1991 1176 1136 1432 9302015 1384 1761 1074 1488 1899 1138 1071 1250 9602016 1380 1792 1041 1479 1919 1107 1189 1529 952
Table 135Leukemia
Age-adjusted SEER Incidencea Rates by Year Race and Sex
SEE
R C
ancer Statistics Review
1975-2016N
ational Cancer Institute
Individual rates for diagnosis years 1975-1979 available in web browser version of Cancer Statistics Reviewa SEER 9 areas (San Francisco Connecticut Detroit Hawaii Iowa New Mexico Seattle Utah and Atlanta)
Rates are per 100000 and are age-adjusted to the 2000 US Std Population (19 age groups - Census P25-1130)- Statistic not shown Rate based on less than 16 cases for the time interval
All Races Whites Blacks Total Males Females Total Males Females Total Males Females
Year of Diagnosis1975-2016 139 159 120 147 168 126 086 098 0761975-1979 103 122 086 108 129 090 054 059 0491980 112 140 088 116 147 090 073 - -1981 124 131 118 130 139 123 095 - -1982 123 150 099 130 156 105 - - -1983 129 152 108 139 164 118 080 - -1984 132 148 120 134 149 124 092 - -1985 130 155 109 135 162 112 - - -1986 130 167 096 138 182 096 077 - -1987 132 148 119 136 154 121 089 - 1151988 140 179 107 144 184 112 098 - -1989 162 182 143 169 190 149 103 - -1990 142 176 116 152 185 129 057 - -1991 138 172 105 151 194 109 086 - -1992 135 159 114 140 173 109 091 - -1993 126 141 109 138 157 115 082 - -1994 119 148 093 128 159 101 068 - -1995 150 180 121 161 187 136 098 132 -1996 139 156 121 146 165 126 085 - -1997 133 151 116 144 160 128 079 098 -1998 146 161 131 157 169 144 093 116 -1999 131 149 114 140 156 124 068 - -2000 140 151 129 152 161 145 087 - -2001 146 166 126 158 182 134 070 - -2002 150 179 120 165 200 129 062 - -2003 143 166 122 147 170 127 078 097 -2004 155 171 139 167 196 138 112 - 1432005 158 188 129 166 194 138 097 118 -2006 145 163 128 151 164 139 097 142 -2007 152 167 138 160 171 150 095 106 -2008 150 186 115 168 203 132 091 132 -2009 147 161 135 157 174 142 096 108 0852010 146 155 136 158 164 151 097 110 0852011 178 189 167 194 200 189 133 164 1012012 148 153 143 160 163 158 112 145 0892013 162 179 145 175 192 158 097 132 -2014 159 174 144 168 191 146 085 - 1062015 149 172 126 158 181 134 079 096 -2016 169 188 149 171 200 141 104 118 092
Table 136Acute Lymphocytic Leukemia
Age-adjusted SEER Incidencea Rates by Year Race and Sex
SEE
R C
ancer Statistics Review
1975-2016N
ational Cancer Institute
Individual rates for diagnosis years 1975-1979 available in web browser version of Cancer Statistics Reviewa SEER 9 areas (San Francisco Connecticut Detroit Hawaii Iowa New Mexico Seattle Utah and Atlanta)
Rates are per 100000 and are age-adjusted to the 2000 US Std Population (19 age groups - Census P25-1130)- Statistic not shown Rate based on less than 16 cases for the time interval
All Races Whites Blacks Total Males Females Total Males Females Total Males Females
Year of Diagnosis1975-2016 489 678 348 532 739 379 383 541 2741975-1979 432 600 317 454 635 332 381 535 2781980 452 631 333 470 655 346 451 706 2891981 427 630 290 447 663 306 382 541 2471982 430 614 301 450 639 318 377 665 -1983 445 640 313 467 678 325 421 611 3031984 443 630 312 472 682 329 345 446 2651985 449 621 331 480 663 354 411 615 2871986 450 633 324 487 685 354 279 418 -1987 466 681 307 495 726 328 403 614 2451988 455 646 315 477 688 327 443 532 3531989 470 644 347 501 691 368 391 515 3041990 461 631 342 492 678 363 451 613 3431991 460 620 343 500 681 364 340 375 3151992 462 674 317 506 743 343 321 496 2081993 446 615 317 474 656 336 452 679 2891994 462 614 347 506 672 384 319 413 2321995 456 644 320 499 702 352 339 534 2061996 474 637 356 518 690 394 352 536 2261997 451 610 331 493 665 363 357 518 2521998 427 599 301 471 658 335 285 373 2291999 418 607 277 453 655 301 387 600 2602000 470 660 325 520 734 354 344 450 2722001 534 741 379 590 817 420 395 489 3282002 514 724 356 574 807 399 319 453 2202003 539 747 383 596 830 418 439 621 3122004 560 768 402 611 819 450 501 816 2892005 545 777 367 607 876 395 402 485 3462006 585 770 447 648 845 500 460 676 3172007 542 754 380 612 842 432 314 480 2252008 557 749 409 621 824 463 386 583 2412009 545 752 382 606 834 421 406 593 2902010 562 781 395 626 858 444 365 528 2642011 556 749 401 611 822 439 452 551 3792012 531 711 387 593 783 437 372 493 2932013 524 724 363 586 803 410 436 650 2772014 531 748 355 595 827 404 379 606 2202015 507 684 360 572 764 407 345 461 2642016 476 656 327 537 736 368 381 509 289
Table 137Chronic Lymphocytic Leukemia
Age-adjusted SEER Incidencea Rates by Year Race and Sex
SEE
R C
ancer Statistics Review
1975-2016N
ational Cancer Institute
Individual rates for diagnosis years 1975-1979 available in web browser version of Cancer Statistics Reviewa SEER 9 areas (San Francisco Connecticut Detroit Hawaii Iowa New Mexico Seattle Utah and Atlanta)
Rates are per 100000 and are age-adjusted to the 2000 US Std Population (19 age groups - Census P25-1130)- Statistic not shown Rate based on less than 16 cases for the time interval
All Races Whites Blacks Total Males Females Total Males Females Total Males Females
Year of Diagnosis1975-2016 366 455 304 373 464 309 324 386 2841975-1979 343 425 288 351 438 293 261 297 2341980 314 410 243 317 411 249 288 328 2531981 317 399 265 321 411 268 315 322 3021982 342 479 260 347 490 263 250 322 2091983 321 422 253 317 428 241 293 302 2921984 330 406 273 335 417 277 235 210 2441985 333 415 287 325 402 284 378 506 2991986 300 391 240 295 385 238 321 404 2681987 302 397 247 303 400 247 305 473 2121988 303 379 252 308 387 257 279 314 2491989 320 401 262 330 404 279 222 379 -1990 304 391 243 312 407 246 249 289 2191991 333 393 288 338 390 298 334 453 2591992 322 385 276 328 403 275 305 299 3051993 345 431 286 352 445 286 248 262 2551994 346 414 302 348 424 297 294 324 2771995 366 417 331 381 432 345 262 262 2731996 347 433 291 346 429 294 321 405 2731997 353 461 277 366 482 285 302 383 2551998 393 494 321 406 506 332 305 464 2111999 373 451 318 385 463 330 303 345 2762000 405 495 341 404 495 339 441 488 4012001 406 495 339 420 500 361 345 408 3002002 363 458 298 378 478 311 291 331 2672003 360 449 296 367 460 302 333 352 2962004 342 415 293 351 423 300 339 431 3012005 359 426 317 365 438 319 349 347 3582006 355 411 315 367 422 327 284 334 2572007 355 438 298 366 448 309 338 445 2722008 382 469 318 386 485 308 307 378 2742009 364 442 308 376 464 310 313 398 2552010 424 539 341 444 568 350 336 454 2622011 421 514 347 425 518 349 422 452 3992012 458 561 377 468 572 387 385 449 3422013 448 542 380 466 555 402 416 508 3472014 439 531 371 460 548 395 378 453 3182015 426 518 358 442 539 367 372 415 3512016 431 542 347 447 556 361 408 489 358
Table 138Acute Myeloid Leukemia
Age-adjusted SEER Incidencea Rates by Year Race and Sex
SEE
R C
ancer Statistics Review
1975-2016N
ational Cancer Institute
Individual rates for diagnosis years 1975-1979 available in web browser version of Cancer Statistics Reviewa SEER 9 areas (San Francisco Connecticut Detroit Hawaii Iowa New Mexico Seattle Utah and Atlanta)
Rates are per 100000 and are age-adjusted to the 2000 US Std Population (19 age groups - Census P25-1130)- Statistic not shown Rate based on less than 16 cases for the time interval
All Races Whites Blacks Total Males Females Total Males Females Total Males Females
Year of Diagnosis1975-2016 181 238 138 184 242 141 183 237 1441975-1979 183 244 141 184 247 141 180 239 1361980 170 206 146 173 210 151 148 - -1981 164 197 141 159 190 139 238 300 1811982 168 216 135 165 219 131 175 - 1791983 169 223 133 164 215 132 251 344 1851984 168 240 118 163 241 110 258 261 2591985 197 276 143 200 280 147 206 289 -1986 168 219 129 171 225 131 154 - -1987 188 233 158 191 239 158 214 288 -1988 191 254 150 192 259 149 208 288 -1989 170 222 135 168 218 135 221 312 -1990 176 247 124 175 250 120 263 366 1951991 188 244 147 191 255 146 156 - 1751992 176 216 147 180 222 149 149 173 -1993 192 253 148 195 252 155 228 356 -1994 187 249 142 190 249 150 170 257 -1995 190 256 138 196 269 139 159 209 -1996 181 245 135 180 251 128 206 254 1831997 187 268 130 194 274 137 167 253 -1998 166 195 143 173 198 154 161 231 1201999 180 249 128 177 244 128 172 230 1262000 179 234 135 180 233 140 159 180 1332001 180 236 138 185 237 146 197 283 1362002 164 209 130 167 212 134 113 - -2003 166 224 120 176 237 127 147 218 -2004 181 256 122 187 266 125 151 206 1112005 169 226 125 177 235 131 178 244 1342006 184 240 141 194 251 151 158 217 1112007 171 232 123 180 249 123 143 183 1192008 185 239 143 186 232 151 189 267 1212009 180 238 134 179 231 139 190 289 1282010 188 251 140 188 254 136 191 212 1832011 195 255 147 206 271 151 166 195 1392012 193 233 161 197 238 165 212 281 1622013 193 260 139 198 267 140 172 226 1422014 197 259 146 195 252 146 205 196 2132015 185 230 146 194 241 152 169 185 1562016 204 265 156 216 272 171 198 288 140
Table 139Chronic Myeloid Leukemia
Age-adjusted SEER Incidencea Rates by Year Race and Sex
SEE
R C
ancer Statistics Review
1975-2016N
ational Cancer Institute
Individual rates for years of death 1975-1979 available in web browser version of Cancer Statistics Reviewa US Mortality Files National Center for Health Statistics Centers for Disease Control and Prevention
Rates are per 100000 and are age-adjusted to the 2000 US Std Population (19 age groups - Census P25-1130)- Statistic not shown Rate based on less than 16 cases for the time interval
All Races Whites Blacks Total Males Females Total Males Females Total Males Females
Year of Death1975-2016 752 1008 575 773 1038 589 656 865 5201975-1979 812 1092 624 829 1120 634 678 880 5361980 836 1121 646 854 1151 656 705 909 5671981 810 1089 624 824 1116 631 711 892 5861982 819 1104 631 833 1129 639 714 936 5671983 811 1093 626 824 1119 632 722 921 5901984 808 1068 637 823 1091 647 708 916 5691985 807 1077 631 823 1097 644 708 962 5421986 796 1071 616 810 1097 623 725 926 5911987 780 1031 614 791 1050 620 724 941 5851988 783 1060 600 795 1079 608 724 983 5581989 795 1062 615 807 1075 626 736 1034 5451990 798 1071 618 810 1090 626 744 996 5831991 799 1050 632 812 1064 644 745 1005 5801992 796 1071 613 811 1094 624 716 941 5681993 793 1066 609 804 1084 616 736 976 5771994 785 1057 603 800 1078 613 712 959 5541995 790 1080 598 804 1103 605 717 975 5531996 784 1053 605 797 1071 613 746 1009 5901997 771 1042 589 789 1068 601 683 923 5291998 758 1011 582 772 1031 591 704 937 5551999 768 1022 596 787 1047 609 674 878 5432000 769 1028 591 789 1054 605 671 907 5272001 764 1019 588 783 1046 602 674 880 5412002 754 1018 573 775 1046 585 673 891 5382003 745 1002 563 768 1037 576 654 847 5302004 729 981 552 747 1004 564 677 894 5392005 726 982 546 750 1014 563 607 811 4782006 723 970 546 748 997 566 627 884 4702007 708 954 533 730 986 546 619 807 5052008 709 954 533 732 983 549 627 865 4782009 706 953 525 731 986 541 605 814 4712010 691 925 520 716 958 537 575 746 4592011 695 928 524 718 960 539 599 774 4852012 683 921 507 708 957 522 577 756 4622013 675 909 503 703 943 523 568 770 4372014 662 882 496 691 921 515 547 717 4372015 628 846 464 655 882 482 520 684 4152016 627 828 475 653 864 491 543 687 449
Table 1310Leukemia
Age-adjusted US Deatha Rates by Year Race and Sex
SEE
R C
ancer Statistics Review
1975-2016N
ational Cancer Institute
a SEER 21 areas Rates are per 100000 and are age-adjusted to the 2000 US Std Population (19 age groups - Census P25-1130)unless noted
b US Mortality Files National Center for Health Statistics Centers for Disease Control and PreventionRates are per 100000 and are age-adjusted to the 2000 US Std Population (19 age groups - Census P25-1130) unless noted
c Rates are per 100000 and are age-adjusted to the world (WHO 2000-2025) standard million- Statistic not shown Rate based on less than 16 cases for the time interval
All Races Whites Blacks Total Males Females Total Males Females Total Males Females
SEER IncidenceAge at DiagnosisAge-Adjusted Rates 2012-2016All ages 141 181 109 149 191 115 109 139 89Under 65 71 83 58 74 87 61 58 66 5165 and over 625 855 457 668 909 487 460 641 349
All ages (WHO world std)c 109 137 86 116 145 90 85 105 71
Age-Specific Rates 2012-2016lt1 45 43 48 45 44 47 34 - 441-4 89 91 87 97 101 94 46 43 495-9 43 47 38 47 53 41 22 20 2410-14 33 38 28 34 38 30 26 31 2015-19 31 38 24 33 41 25 20 25 1520-24 29 32 25 30 35 25 24 22 2625-29 30 34 26 30 34 26 26 28 2430-34 37 42 32 37 43 32 33 33 3335-39 45 51 39 46 52 39 45 48 4240-44 61 71 51 63 73 53 58 69 4945-49 84 97 71 86 99 73 85 96 7450-54 127 156 99 133 164 103 104 123 8755-59 182 223 143 192 234 151 150 183 12260-64 271 346 202 285 365 210 230 279 19065-69 404 533 290 429 564 306 330 428 25670-74 549 735 394 584 777 419 416 563 31275-79 706 954 513 757 1015 552 535 755 39380-84 843 1180 611 902 1256 653 585 869 42885+ 880 1262 683 941 1356 725 567 810 466
US MortalityAge at DeathAge-Adjusted Rates 2012-2016All ages 65 88 49 68 91 51 55 72 44Under 65 18 22 15 18 22 15 20 23 1765 and over 392 544 283 411 570 296 299 410 232
All ages (WHO world std)c 37 48 28 38 49 29 33 43 27
Age-Specific Rates 2012-2016lt1 05 04 06 05 05 05 06 - -1-4 07 07 07 07 07 07 07 07 075-9 05 05 04 05 06 04 04 04 0310-14 06 06 05 06 06 05 05 06 0515-19 07 09 06 08 09 06 05 06 0420-24 09 11 06 09 11 07 09 10 0725-29 09 11 07 09 11 08 08 10 0730-34 10 12 08 10 12 08 11 13 1035-39 12 14 10 12 14 10 14 15 1240-44 16 17 14 16 17 15 18 18 1745-49 22 25 20 23 25 21 26 30 2250-54 34 40 28 34 41 28 39 44 3555-59 56 68 43 56 69 44 62 77 5060-64 93 118 70 95 121 70 101 130 7765-69 160 215 111 166 223 114 150 203 11070-74 272 364 194 285 380 202 231 302 18175-79 428 589 300 450 618 314 333 460 25180-84 615 863 441 647 903 462 457 633 35885+ 827 1192 638 875 1259 672 525 746 433
Table 1311Leukemia
SEER Incidencea and US Deathb Rates Age-Adjusted and Age-Specific Rates by Race and Sex
SEE
R C
ancer Statistics Review
1975-2016N
ational Cancer Institute
a SEER 21 areas Rates are per 100000 and are age-adjusted to the 2000 US Std Population (19 age groups - Census P25-1130)unless noted
b Rates are per 100000 and are age-adjusted to the world (WHO 2000-2025) standard million- Statistic not shown Rate based on less than 16 cases for the time interval
All Races Whites Blacks Total Males Females Total Males Females Total Males Females
Acute Lymphocytic LeukemiaAge at DiagnosisAge-Adjusted Rates 2012-2016All ages 17 19 15 19 21 16 10 11 09Under 65 17 20 15 19 22 16 10 11 0965 and over 16 18 13 17 20 14 10 12 09
All ages (WHO world std)b 19 21 16 20 23 18 10 11 09
Age-Specific Rates 2012-2016lt1 19 16 22 19 16 23 14 - -1-4 76 77 74 84 87 81 33 30 375-9 36 40 33 41 46 36 18 15 2010-14 23 26 19 24 27 21 14 19 0915-19 18 24 12 20 27 13 07 12 -20-24 10 14 07 12 16 07 05 06 0525-29 08 10 06 08 11 06 05 - -30-34 07 09 06 08 09 06 04 - -35-39 08 10 06 08 10 07 06 07 -40-44 08 09 06 08 10 06 06 07 -45-49 09 09 09 09 09 10 04 - -50-54 09 10 08 09 10 09 07 09 -55-59 11 12 11 12 13 11 11 12 1060-64 13 15 11 13 15 11 11 13 0965-69 14 14 13 15 16 14 07 - -70-74 16 19 13 17 20 14 - - -75-79 17 20 15 18 21 16 13 - -80-84 17 23 13 17 24 13 - - -85+ 15 19 13 16 20 14 - - -
Chronic Lymphocytic LeukemiaAge at DiagnosisAge-Adjusted Rates 2012-2016All ages 49 68 35 54 73 38 34 49 24Under 65 17 22 12 18 24 13 12 16 0865 and over 275 383 195 298 411 212 185 273 129
All ages (WHO world std)b 35 47 24 38 51 27 24 34 17
Age-Specific Rates 2012-2016lt1 - - - - - - - - -1-4 - - - - - - - - -5-9 - - - - - - - - -10-14 - - - - - - - - -15-19 - - - - - - - - -20-24 - - - - - - - - -25-29 01 01 - 01 - - - - -30-34 01 02 - 01 02 - - - -35-39 04 04 03 04 05 04 04 - -40-44 10 12 08 10 13 08 08 12 -45-49 22 28 17 24 30 19 18 24 1250-54 48 65 32 53 70 36 32 46 2055-59 80 103 58 88 113 64 51 66 3760-64 125 170 84 134 180 90 94 129 6665-69 189 258 129 204 274 140 135 188 9570-74 245 338 167 265 361 182 176 263 11675-79 306 423 216 333 455 236 213 321 14580-84 354 502 252 385 541 275 222 360 14685+ 379 543 294 413 594 318 218 302 183
Table 1312Lymphocytic Leukemia
SEER Incidencea Rates Age-Adjusted and Age-Specific Rates by Race and Sex
SEE
R C
ancer Statistics Review
1975-2016N
ational Cancer Institute
a SEER 21 areas Rates are per 100000 and are age-adjusted to the 2000 US Std Population (19 age groups - Census P25-1130)unless noted
b Rates are per 100000 and are age-adjusted to the world (WHO 2000-2025) standard million- Statistic not shown Rate based on less than 16 cases for the time interval
All Races Whites Blacks Total Males Females Total Males Females Total Males Females
Acute Myeloid LeukemiaAge at DiagnosisAge-Adjusted Rates 2012-2016All ages 43 52 35 44 54 36 37 44 33Under 65 20 21 19 20 21 19 20 20 2065 and over 201 269 152 213 284 160 155 210 123
All ages (WHO world std)b 32 38 28 33 40 28 29 33 27
Age-Specific Rates 2012-2016lt1 16 16 16 15 15 15 - - -1-4 10 10 10 09 09 09 11 10 115-9 04 04 04 04 04 04 03 - -10-14 07 08 06 07 08 06 09 09 0815-19 09 09 09 09 10 09 08 07 0820-24 11 10 12 11 10 12 12 11 1325-29 12 11 12 11 11 12 11 10 1230-34 14 15 14 14 15 14 17 15 1935-39 16 16 16 15 16 15 18 16 2040-44 21 22 21 22 22 22 22 21 2245-49 25 25 25 25 25 25 28 27 2950-54 35 38 32 36 40 33 33 32 3355-59 49 56 43 49 56 43 49 57 4360-64 78 91 67 82 97 68 70 75 6665-69 121 152 94 129 163 98 100 118 8670-74 183 236 139 192 247 145 151 189 12575-79 233 310 174 248 326 186 185 256 14080-84 286 393 212 302 413 223 207 314 14885+ 263 380 203 277 403 212 174 254 141
Chronic Myeloid LeukemiaAge at DiagnosisAge-Adjusted Rates 2012-2016All ages 19 24 14 19 25 15 18 22 15Under 65 11 13 09 11 12 09 11 13 1065 and over 76 106 55 80 111 57 62 82 49
All ages (WHO world std)b 15 19 11 15 19 12 14 17 12
Age-Specific Rates 2012-2016lt1 05 05 - 04 - - - - -1-4 01 - - 01 - - - - -5-9 01 - 01 01 - - - - -10-14 01 02 01 01 01 01 - - -15-19 03 03 02 02 03 02 03 - -20-24 05 06 04 05 06 04 04 - -25-29 07 09 06 07 08 06 07 10 -30-34 10 12 08 11 12 09 08 09 0835-39 11 13 09 11 13 10 12 13 1040-44 14 18 11 14 18 11 16 22 1045-49 18 21 15 17 20 14 25 28 2350-54 22 26 17 21 26 17 23 25 2055-59 25 29 22 26 29 23 25 28 2260-64 35 43 27 35 44 27 34 41 2965-69 49 67 34 50 68 33 55 68 4570-74 65 85 48 68 89 51 49 66 3675-79 91 124 65 97 132 69 69 98 5080-84 105 147 75 112 156 80 76 92 6785+ 102 155 75 107 164 76 75 109 60
Table 1313Myeloid Leukemia
SEER Incidencea Rates Age-Adjusted and Age-Specific Rates by Race and Sex
SEE
R C
ancer Statistics Review
1975-2016N
ational Cancer Institute
a Based on End Results data from a series of hospital registries and one population-based registryb SEER 9 areas (San Francisco Connecticut Detroit Hawaii Iowa New Mexico Seattle Utah Atlanta)
Based on follow-up of patients into 2016 Expected survival rates are derived from the US Annual Life Tablesc SEER 18 areas (San Francisco Connecticut Detroit Hawaii Iowa New Mexico Seattle Utah Atlanta San Jose-Monterey
Los Angeles Alaska Native Registry Rural Georgia California excluding SFSJMLA Kentucky Louisiana New Jersey andGeorgia excluding ATLRG) Expected survival rates are derived from life tables by socio-economic status geography and racedeveloped by the SEER programBased on follow-up of patients into 2016
d Period survival provides a 2015 estimate of survival by piecing together the most recent conditional survival estimatesfrom several cohorts It is computed here using three year calendar blocks (2010-2012 0-1 year survival)(2009-2011 1-2 year survival) (2008-2010 2-3 year survival) (2007-2009 3-4 year survival) (2006-2008 4-5 years survival)
e The difference between 1975-1977 and 2009-2015 is statistically significant (plt05)f The standard error is between 5 and 10 percentage pointsg The standard error is greater than 10 percentage points- Statistic could not be calculated due to fewer than 25 cases during the time period
All Races Whites Blacks Total Males Females Total Males Females Total Males Females
5-Year Relative Survival (Percent)Year of Diagnosis1960-1963a - - - 14 - - - - -1970-1973a - - - 22 - - - - -1975-1977b 341 330 356 345 336 358 334 304 3671978-1980b 360 350 373 367 358 380 282 273 2931981-1983b 373 369 378 381 378 385 339 334 3431984-1986b 405 401 411 416 413 420 327 315 3411987-1989b 429 440 413 439 455 418 350 327 3781990-1992b 452 446 461 465 463 468 357 305 4131993-1995b 476 484 464 487 495 475 413 416 4091996-1998b 484 486 481 498 497 498 386 390 3801999-2001b 510 520 495 520 530 507 437 451 4212002-2004b 583 584 581 591 594 588 540 543 5342005-2008b 623 635 607 633 643 620 560 599 5112009-2015b 658e 673e 637e 668e 682e 649e 596e 609e 582e
5-Year Period Survival (Percent)cd
2015 632 643 619 634 640 624 582 617 544
5-Year Relative Survival (Percent) 2009-2015c
Age at DiagnosisAges lt45 762 758 768 773 764 786 677 677 677Ages 45-54 722 737 698 735 746 716 628 662 586Ages 55-64 693 699 683 704 707 698 589 605 566Ages 65-74 610 610 611 614 610 620 541 553 523Ages 75+ 421 424 417 427 428 425 337 357 316Ages lt65 729 731 725 739 738 741 637 650 621Ages 65+ 508 517 496 511 518 502 446 474 415
Table 1314Leukemia
5-Year Relative and Period Survival (Percent) by Race Sex Diagnosis Year and Age
SEE
R C
ancer Statistics Review
1975-2016N
ational Cancer Institute
a SEER 9 areas (San Francisco Connecticut Detroit Hawaii Iowa New Mexico Seattle Utah Atlanta)Based on follow-up of patients into 2016 Expected survival rates are derived from the US Annual Life Tables
b SEER 18 areas (San Francisco Connecticut Detroit Hawaii Iowa New Mexico Seattle Utah Atlanta San Jose-MontereyLos Angeles Alaska Native Registry Rural Georgia California excluding SFSJMLA Kentucky Louisiana New Jersey andGeorgia excluding ATLRG) Expected survival rates are derived from life tables by socio-economic status geography and racedeveloped by the SEER programBased on follow-up of patients into 2016
c Period survival provides a 2015 estimate of survival by piecing together the most recent conditional survival estimatesfrom several cohorts It is computed here using three year calendar blocks (2010-2012 0-1 year survival)(2009-2011 1-2 year survival) (2008-2010 2-3 year survival) (2007-2009 3-4 year survival) (2006-2008 4-5 years survival)
d The difference between 1975-1977 and 2009-2015 is statistically significant (plt05)e The standard error is between 5 and 10 percentage pointsf The standard error is greater than 10 percentage points- Statistic could not be calculated due to fewer than 25 cases during the time period
All Races Whites Blacks Total Males Females Total Males Females Total Males Females
Acute Lymphocytic Leukemia5-Year Relative Survival (Percent)Year of Diagnosis1975-1977a 406 369 456 408 374 457 335e - -1987-1989a 544 537 552 550 547 553 447e 420e 471e1990-1992a 580 545 631 577 549 620 571e 504e 633e1993-1995a 602 578 636 598 578 627 532e 459e 638e1996-1998a 655 644 669 664 643 690 556e 591e 502e1999-2001a 635 634 635 648 652 642 566e 503e 630e2002-2004a 673 661 689 676 666 691 645e 594e 697e2005-2008a 701 693 713 700 686 720 652 700 551e2009-2015a 717d 723d 710d 726d 737d 713d 625d 607 647e
5-Year Period Survival (Percent)bc2015 691 684 698 685 674 700 650 650 648
5-Year Relative Survival (Percent) 2009-2015bAge at DiagnosisAges lt45 806 795 821 807 791 828 763 757 770Ages 45-54 381 365 403 379 373 389 257e - -Ages 55-64 280 275 284 294 288 298 173e 228e -Ages 65-74 239 188 291 214 170 259 - - -Ages 75+ 91 97 83 100 96 100 00 - -Ages lt65 733 725 743 735 724 749 668 668 668Ages 65+ 174 151 196 166 141 191 154e - 189e
Chronic Lymphocytic Leukemia5-Year Relative Survival (Percent)Year of Diagnosis1975-1977a 671 647 703 679 654 711 569e 551e 590e1987-1989a 727 727 729 739 740 737 581 555e 615e1990-1992a 741 718 773 753 731 784 522 434e 609e1993-1995a 772 771 773 783 781 786 633 640e 621e1996-1998a 756 739 778 767 752 787 581 515e 660e1999-2001a 786 782 792 794 788 803 666 655e 666e2002-2004a 840 832 852 845 837 856 770 742e 807e2005-2008a 862 861 863 864 863 864 841 857 8122009-2015a 882d 887d 875d 886d 889d 883d 785d 801d 763
5-Year Period Survival (Percent)bc2015 856 855 858 853 848 860 772 818 710
5-Year Relative Survival (Percent) 2009-2015bAge at DiagnosisAges lt45 940 927 960 942 932 954 905e 879e -Ages 45-54 939 934 948 945 935 964 840 889 761eAges 55-64 922 916 933 924 916 938 836 831 843Ages 65-74 874 856 905 876 853 913 773 784 756Ages 75+ 731 727 736 729 724 734 584 586e 564eAges lt65 928 922 939 931 923 947 843 854 824Ages 65+ 801 796 807 799 792 807 691 713 662
Table 1315Lymphocytic Leukemia
5-Year Relative and Period Survival (Percent) by Race Sex Diagnosis Year and Age
SEE
R C
ancer Statistics Review
1975-2016N
ational Cancer Institute
a SEER 9 areas (San Francisco Connecticut Detroit Hawaii Iowa New Mexico Seattle Utah Atlanta)Based on follow-up of patients into 2016 Expected survival rates are derived from the US Annual Life Tables
b SEER 18 areas (San Francisco Connecticut Detroit Hawaii Iowa New Mexico Seattle Utah Atlanta San Jose-MontereyLos Angeles Alaska Native Registry Rural Georgia California excluding SFSJMLA Kentucky Louisiana New Jersey andGeorgia excluding ATLRG) Expected survival rates are derived from life tables by socio-economic status geography and racedeveloped by the SEER programBased on follow-up of patients into 2016
c Period survival provides a 2015 estimate of survival by piecing together the most recent conditional survival estimatesfrom several cohorts It is computed here using three year calendar blocks (2010-2012 0-1 year survival)(2009-2011 1-2 year survival) (2008-2010 2-3 year survival) (2007-2009 3-4 year survival) (2006-2008 4-5 years survival)
d The difference between 1975-1977 and 2009-2015 is statistically significant (plt05)e The standard error is between 5 and 10 percentage pointsf The standard error is greater than 10 percentage points- Statistic could not be calculated due to fewer than 25 cases during the time period
All Races Whites Blacks Total Males Females Total Males Females Total Males Females
Acute Myeloid Leukemia5-Year Relative Survival (Percent)Year of Diagnosis1975-1977a 62 55 70 58 54 62 101 82 1171987-1989a 115 92 141 113 97 132 92 44 157e1990-1992a 138 126 152 135 122 150 135 129 1391993-1995a 161 149 174 153 141 167 215 206e 2201996-1998a 170 159 183 156 145 171 221 252 1821999-2001a 192 188 197 187 176 199 193 248 1422002-2004a 234 209 264 232 208 260 253 265 2402005-2008a 249 235 265 242 228 257 239 193 2772009-2015a 294d 291d 298d 290d 284d 299d 292d 280d 301d
5-Year Period Survival (Percent)bc2015 286 278 294 282 276 289 283 262 301
5-Year Relative Survival (Percent) 2009-2015bAge at DiagnosisAges lt45 604 585 624 621 599 645 511 482 538Ages 45-54 441 439 444 456 450 463 337 342 336Ages 55-64 300 281 325 308 285 338 231 234 224Ages 65-74 139 137 141 145 144 146 103 78 131Ages 75+ 34 40 27 34 41 27 24 - 20Ages lt65 466 444 491 474 449 504 393 371 414Ages 65+ 79 85 72 82 89 73 64 58 71
Chronic Myeloid Leukemia5-Year Relative Survival (Percent)Year of Diagnosis1975-1977a 218 193 251 205 184 234 277e 216e 355e1987-1989a 303 306 298 301 310 290 333e 281e 413e1990-1992a 307 296 322 303 300 306 349e 255e 449e1993-1995a 355 353 358 352 351 352 356e 328e 402e1996-1998a 371 377 363 380 376 385 310 304e 314e1999-2001a 473 459 492 459 441 483 490e 496e 481e2002-2004a 543 530 561 526 514 541 630e 621e 640e2005-2008a 631 632 629 617 615 621 643 664e 608e2009-2015a 697d 681d 718d 690d 677d 707d 736d 711d 763d
5-Year Period Survival (Percent)bc2015 695 683 712 681 666 702 723 714 735
5-Year Relative Survival (Percent) 2009-2015bAge at DiagnosisAges lt45 899 889 913 916 905 934 797 786 812Ages 45-54 874 860 891 871 858 888 871 842 900Ages 55-64 776 748 816 781 750 826 698 676e 719eAges 65-74 611 579 656 609 578 654 584e 526e 637eAges 75+ 326 305 346 321 302 336 362e 362f 362eAges lt65 851 836 873 856 839 883 790 773 808Ages 65+ 462 444 484 456 441 475 495 471e 515e
Table 1316Myeloid Leukemia
5-Year Relative and Period Survival (Percent) by Race Sex Diagnosis Year and Age
SEE
R C
ancer Statistics Review
1975-2016N
ational Cancer Institute
a Based on the SEER 9 areas (San Francisco Connecticut Detroit Hawaii Iowa New Mexico Seattle Utah and Atlanta)Expected survival rates are derived from the US Annual Life Tables
1975- 1980- 1985- 1990-1979 1984 1989 1994 1995 1996 1997 1998 1999 2000 2001 2002 2003 2004 2005 2006 2007 2008 2009 2010 2011 2012 2013 2014 2015
Survival Time
1-year 608 626 648 669 681 682 679 667 659 669 706 722 732 751 742 765 769 766 774 783 794 791 790 791 8062-year 501 525 553 575 589 599 598 580 583 590 630 649 662 677 684 705 706 702 709 725 732 725 732 7343-year 437 465 496 528 543 554 549 541 547 551 590 619 624 643 647 673 676 665 684 692 703 692 6984-year 388 417 455 491 507 519 509 503 516 520 567 596 595 619 627 647 653 639 658 676 683 6735-year 346 376 423 461 481 487 483 482 484 499 543 578 575 596 610 626 637 619 635 659 6656-year 314 351 399 435 457 465 458 461 462 485 524 560 556 572 593 607 622 604 613 6477-year 291 325 371 409 442 451 438 446 444 473 510 544 537 560 579 591 614 587 6018-year 270 304 350 388 417 438 432 431 430 457 496 535 519 546 561 573 603 5769-year 250 285 330 373 406 420 418 421 421 449 483 519 507 530 546 561 59310-year 237 269 316 360 390 406 406 410 406 438 471 504 489 515 532 54511-year 224 257 299 347 378 398 387 397 392 426 459 492 473 499 52712-year 212 246 288 336 371 387 377 390 383 419 449 483 460 49213-year 204 236 280 327 367 382 370 380 372 404 442 466 45414-year 198 229 272 318 356 371 368 370 367 392 434 45615-year 192 223 267 313 353 361 362 358 359 383 42316-year 185 214 261 306 350 359 361 350 353 37417-year 181 207 256 300 340 355 352 346 34718-year 177 201 253 294 330 351 346 34319-year 171 195 248 291 326 343 34420-year 166 191 244 286 319 338
Table 1317Leukemia
SEERa Relative Survival (Percent)By Year of Diagnosis
All Races Males and Females
Year of Diagnosis
SEE
R C
ancer Statistics Review
1975-2016N
ational Cancer Institute
a Based on the SEER 9 areas (San Francisco Connecticut Detroit Hawaii Iowa New Mexico Seattle Utah and Atlanta)Expected survival rates are derived from the US Annual Life Tables
1975- 1980- 1985- 1990-1979 1984 1989 1994 1995 1996 1997 1998 1999 2000 2001 2002 2003 2004 2005 2006 2007 2008 2009 2010 2011 2012 2013 2014 2015
Survival Time
1-year 604 628 655 679 692 697 688 667 668 688 729 731 742 767 761 770 780 775 791 793 806 797 803 812 8172-year 494 524 561 583 604 616 611 585 590 608 648 652 669 687 701 706 719 716 727 740 746 733 749 7513-year 427 460 499 532 556 573 552 546 552 573 608 624 627 653 664 674 689 679 699 712 719 698 7144-year 377 411 459 494 516 535 505 505 520 539 581 598 601 627 650 648 667 650 677 690 697 6775-year 334 371 429 462 482 495 479 484 480 523 553 573 578 602 630 626 653 632 656 673 6846-year 303 343 404 435 452 471 459 461 461 508 529 554 557 575 609 602 635 615 631 6617-year 277 318 373 409 439 458 438 444 439 498 514 531 535 564 594 588 625 595 6168-year 254 294 354 385 417 446 430 430 423 478 500 520 514 549 572 563 616 5839-year 232 275 332 371 404 423 421 419 415 464 486 507 501 526 553 548 60510-year 219 260 317 358 382 407 413 410 401 454 473 490 479 511 539 52611-year 205 249 302 346 377 398 391 393 383 444 461 474 464 496 53312-year 193 242 290 334 371 390 380 384 375 437 452 467 455 49113-year 186 234 283 325 367 389 373 369 363 420 442 455 44714-year 179 227 277 315 357 379 370 358 357 410 433 44715-year 175 221 269 309 352 371 365 349 351 399 42216-year 168 212 263 303 347 369 360 341 346 38717-year 164 204 260 296 339 366 348 335 34318-year 159 199 257 290 324 364 345 33119-year 154 192 253 288 322 355 34120-year 146 187 249 283 316 347
Table 1318Leukemia
SEERa Relative Survival (Percent)By Year of Diagnosis
All Races Males
Year of Diagnosis
SEE
R C
ancer Statistics Review
1975-2016N
ational Cancer Institute
a Based on the SEER 9 areas (San Francisco Connecticut Detroit Hawaii Iowa New Mexico Seattle Utah and Atlanta)Expected survival rates are derived from the US Annual Life Tables
1975- 1980- 1985- 1990-1979 1984 1989 1994 1995 1996 1997 1998 1999 2000 2001 2002 2003 2004 2005 2006 2007 2008 2009 2010 2011 2012 2013 2014 2015
Survival Time
1-year 613 623 638 655 665 664 666 667 646 643 675 710 719 729 715 759 755 754 751 769 778 782 772 761 7912-year 509 527 542 564 569 578 580 574 573 564 606 645 653 664 660 705 689 684 684 705 714 716 709 7093-year 450 471 492 523 525 529 544 534 539 522 564 612 619 628 624 673 657 647 663 666 681 685 6774-year 402 424 449 485 495 498 514 500 511 494 548 594 587 608 595 646 633 624 633 658 664 6685-year 361 384 414 459 480 475 489 479 489 466 530 584 570 588 582 627 615 601 607 641 6396-year 328 360 392 435 464 457 456 461 463 455 516 567 556 569 572 613 602 589 588 6297-year 309 334 367 410 447 443 438 448 450 438 504 561 539 556 558 594 598 575 5798-year 290 316 344 391 416 428 433 433 438 428 490 556 526 542 546 585 582 5639-year 273 299 326 376 409 416 413 424 429 428 477 535 515 534 535 576 57610-year 259 281 315 364 399 405 396 409 414 416 468 522 502 521 521 56811-year 247 269 295 347 378 398 383 403 403 401 456 515 486 503 51812-year 235 250 285 338 372 382 373 397 393 395 445 505 468 49313-year 228 239 276 329 365 373 366 392 385 383 442 481 46314-year 220 232 267 323 355 361 363 385 380 367 434 46815-year 214 225 264 318 353 348 359 369 368 363 42416-year 206 217 258 310 353 344 359 361 363 35817-year 201 210 252 305 342 340 357 358 35018-year 198 205 248 301 336 334 347 35819-year 193 198 241 296 330 326 34620-year 190 195 238 290 321 323
Table 1319Leukemia
SEERa Relative Survival (Percent)By Year of Diagnosis
All Races Females
Year of Diagnosis
SEE
R C
ancer Statistics Review
1975-2016N
ational Cancer Institute
Devcan 677 April 2019 National Cancer Institute (httpssurveillancecancergovdevcan)Source Incidence data are from the SEER 21 areas (San Francisco Connecticut Detroit Hawaii Iowa New Mexico Seattle Utah Atlanta
San Jose-Monterey Los Angeles Alaska Native Registry Rural Georgia California excluding SFSJMLA Kentucky Louisiana New JerseyGeorgia excluding ATLRG Idaho New York and Massachusetts) Mortality data are from the NCHS public use data file for the total US
a Underlying incidence and mortality data for American IndianAlaska Native are based on the PRCDA(PurchasedReferred Care DeliveryAreas) counties
b Hispanic is not mutually exclusive from whites blacks AsianPacific Islanders and American IndiansAlaska NativesUnderlying incidence data for Hispanics are based on NHIA and exclude cases from the Alaska Native Registry
- Statistic could not be calculatedA percent of 000 represents a value that is below 0005
Risk of Being Risk of Being
Race Current Diagnosed with Cancer Risk of Dying Race Current Diagnosed with Cancer Risk of Dying
Ethnicity Age +10 yrs +20 yrs +30 yrs Ever from Cancer Ethnicity Age +10 yrs +20 yrs +30 yrs Ever from Cancer
All Races 0 006 009 012 156 082 Asian 0 005 008 011 099 058
10 003 006 010 152 082 Pacific 10 003 006 009 095 058
20 003 007 014 149 082 Islander 20 003 006 010 092 058
30 004 011 026 147 082 30 003 008 016 090 057
40 007 022 051 145 082 40 004 012 026 087 057
50 015 045 089 141 082 50 008 022 047 083 056
60 031 079 121 134 082 60 014 040 066 078 054
70 053 101 - 115 080 70 028 055 - 067 051
80 062 - - 082 068 80 032 - - 047 040
White 0 006 010 013 164 085 American 0 005 007 009 085 040
10 003 007 011 159 086 Indian 10 002 004 008 081 040
20 003 007 014 156 085 Alaska 20 002 006 010 079 039
30 004 011 027 155 085 Nativea 30 004 008 019 078 039
40 007 023 053 153 085 40 004 015 030 076 040
50 016 047 095 149 086 50 012 027 051 075 040
60 033 083 127 141 086 60 017 042 061 068 040
70 057 106 - 121 084 70 029 051 - 058 038
80 066 - - 086 071 80 029 - - 038 025
Black 0 003 006 008 107 058 Hispanicb 0 007 011 015 124 066
10 002 005 009 105 059 10 005 008 012 118 066
20 003 006 013 104 059 20 004 008 014 114 065
30 004 011 022 102 058 30 004 010 021 111 064
40 007 019 041 100 058 40 006 017 037 108 064
50 013 035 066 097 058 50 011 031 063 104 063
60 025 058 083 091 058 60 021 054 085 097 062
70 039 069 - 079 057 70 037 070 - 083 058
80 042 - - 056 048 80 042 - - 058 049
Table 1320
Leukemia
Risk of Being Diagnosed With Cancer in 10 20 and 30 Years
Lifetime Risk of Being Diagnosed with Cancer Given Alive and Cancer-Free at Current Age and
Lifetime Risk of Dying from Cancer Given Alive at Current Age
Both Sexes 2014-2016 By RaceEthnicity
SEE
R C
ancer Statistics Review
1975-2016N
ational Cancer Institute
Devcan 677 April 2019 National Cancer Institute (httpssurveillancecancergovdevcan)Source Incidence data are from the SEER 21 areas (San Francisco Connecticut Detroit Hawaii Iowa New Mexico Seattle Utah Atlanta
San Jose-Monterey Los Angeles Alaska Native Registry Rural Georgia California excluding SFSJMLA Kentucky Louisiana New JerseyGeorgia excluding ATLRG Idaho New York and Massachusetts) Mortality data are from the NCHS public use data file for the total US
a Underlying incidence and mortality data for American IndianAlaska Native are based on the PRCDA(PurchasedReferred Care DeliveryAreas) counties
b Hispanic is not mutually exclusive from whites blacks AsianPacific Islanders and American IndiansAlaska NativesUnderlying incidence data for Hispanics are based on NHIA and exclude cases from the Alaska Native Registry
- Statistic could not be calculatedA percent of 000 represents a value that is below 0005
Risk of Being Risk of Being
Race Current Diagnosed with Cancer Risk of Dying Race Current Diagnosed with Cancer Risk of Dying
Ethnicity Age +10 yrs +20 yrs +30 yrs Ever from Cancer Ethnicity Age +10 yrs +20 yrs +30 yrs Ever from Cancer
All Races 0 006 010 013 186 096 Asian 0 005 009 011 119 072
10 004 007 012 182 097 Pacific 10 004 007 010 115 072
20 003 008 016 179 097 Islander 20 003 007 012 111 071
30 005 013 030 177 097 30 004 009 019 109 071
40 008 026 062 176 098 40 005 015 033 106 070
50 018 056 112 173 099 50 010 028 062 102 069
60 040 101 152 166 101 60 019 054 084 096 068
70 071 129 - 146 101 70 038 071 - 084 065
80 082 - - 105 088 80 040 - - 056 052
White 0 007 011 014 195 101 American 0 006 009 011 110 048
10 004 008 012 190 102 Indian 10 003 005 010 105 048
20 004 008 016 187 101 Alaska 20 002 007 011 103 048
30 005 013 031 186 101 Nativea 30 005 009 021 103 048
40 009 027 065 184 102 40 005 017 041 102 049
50 019 058 118 181 103 50 013 039 075 102 051
60 042 107 160 174 106 60 028 067 087 097 051
70 075 136 - 153 105 70 046 070 - 081 049
80 087 - - 110 091 80 034 - - 049 030
Black 0 003 006 008 122 065 Hispanicb 0 007 013 017 141 080
10 003 006 009 122 066 10 005 010 015 135 080
20 003 006 014 120 065 20 005 009 016 130 079
30 004 011 025 119 066 30 005 011 023 127 078
40 008 022 048 118 066 40 007 018 040 124 078
50 015 042 079 115 067 50 012 034 072 120 078
60 031 071 102 112 068 60 024 064 100 114 078
70 051 089 - 101 068 70 046 086 - 102 077
80 058 - - 077 061 80 053 - - 074 070
Table 1321
Leukemia
Risk of Being Diagnosed With Cancer in 10 20 and 30 Years
Lifetime Risk of Being Diagnosed with Cancer Given Alive and Cancer-Free at Current Age and
Lifetime Risk of Dying from Cancer Given Alive at Current Age
Males 2014-2016 By RaceEthnicity
SEE
R C
ancer Statistics Review
1975-2016N
ational Cancer Institute
Devcan 677 April 2019 National Cancer Institute (httpssurveillancecancergovdevcan)Source Incidence data are from the SEER 21 areas (San Francisco Connecticut Detroit Hawaii Iowa New Mexico Seattle Utah Atlanta
San Jose-Monterey Los Angeles Alaska Native Registry Rural Georgia California excluding SFSJMLA Kentucky Louisiana New JerseyGeorgia excluding ATLRG Idaho New York and Massachusetts) Mortality data are from the NCHS public use data file for the total US
a Underlying incidence and mortality data for American IndianAlaska Native are based on the PRCDA(PurchasedReferred Care DeliveryAreas) counties
b Hispanic is not mutually exclusive from whites blacks AsianPacific Islanders and American IndiansAlaska NativesUnderlying incidence data for Hispanics are based on NHIA and exclude cases from the Alaska Native Registry
- Statistic could not be calculatedA percent of 000 represents a value that is below 0005
Risk of Being Risk of Being
Race Current Diagnosed with Cancer Risk of Dying Race Current Diagnosed with Cancer Risk of Dying
Ethnicity Age +10 yrs +20 yrs +30 yrs Ever from Cancer Ethnicity Age +10 yrs +20 yrs +30 yrs Ever from Cancer
All Races 0 006 008 011 129 068 Asian 0 005 008 010 083 048
10 003 005 009 125 069 Pacific 10 003 005 008 078 047
20 003 006 012 122 068 Islander 20 002 005 009 075 047
30 003 009 021 120 068 30 003 006 013 073 046
40 006 018 039 118 068 40 004 010 021 071 046
50 012 034 068 114 067 50 007 017 035 068 045
60 023 059 093 106 067 60 011 029 051 063 044
70 039 077 - 091 064 70 019 042 - 054 040
80 048 - - 066 055 80 026 - - 040 033
White 0 006 009 011 135 071 American 0 003 005 007 061 031
10 003 005 009 131 071 Indian 10 002 003 007 058 031
20 003 006 012 128 071 Alaska 20 002 005 008 056 031
30 003 010 022 126 071 Nativea 30 004 007 017 055 031
40 006 019 042 124 070 40 003 014 020 053 031
50 013 036 072 120 070 50 011 017 030 051 031
60 024 062 099 112 069 60 007 021 038 042 030
70 042 081 - 096 067 70 015 035 - 039 029
80 051 - - 069 057 80 025 - - 030 022
Black 0 004 006 008 095 053 Hispanicb 0 006 010 013 110 056
10 002 004 008 093 054 10 004 007 010 105 056
20 002 006 012 091 053 20 003 006 012 101 055
30 004 010 020 089 053 30 003 009 019 099 054
40 006 016 035 087 053 40 006 016 034 096 054
50 011 029 054 083 052 50 010 028 055 091 052
60 020 047 069 077 051 60 019 046 073 084 050
70 030 055 - 065 049 70 030 059 - 070 046
80 033 - - 046 042 80 035 - - 048 037
Table 1322
Leukemia
Risk of Being Diagnosed With Cancer in 10 20 and 30 Years
Lifetime Risk of Being Diagnosed with Cancer Given Alive and Cancer-Free at Current Age and
Lifetime Risk of Dying from Cancer Given Alive at Current Age
Females 2014-2016 By RaceEthnicity
SEER Cancer Statistics Review 1975-2016 National Cancer Institute
The AAPC is the Average Annual Percent Change over the time interval The AAPCs are calculated bythe Joinpoint Regression Program Version 47 February 2019 National Cancer Institute
- Statistic not shown Rate based on less than 16 cases for the time intervalTrend based on less than 10 cases for at least one year within the time interval
a Rates are age-adjusted to the 2000 US Std Population (19 age groups - Census P25-1130) Trendsare based on rates age-adjusted to the 2000 US Std Population (19 age groups - Census P25-1130)
b The SEER 9 areas are San Francisco Connecticut Detroit Hawaii Iowa New Mexico SeattleUtah and AtlantaThe SEER 21 areas comprise the SEER 9 areas plus San Jose-Monterey Los Angeles the AlaskaNative Registry Rural Georgia California excluding SFSJMLA Kentucky Louisiana New JerseyGeorgia excluding ATLRG Idaho New York and Massachusetts
c The 2007-2016 AAPC estimates are based on a Joinpoint analysis with up to 3 Joinpoints overdiagnosis years 2000-2016
d The 2007-2016 AAPC estimates are based on a Joinpoint analysis with up to 5 Joinpoints overdiagnosis years 1975-2016
e Hispanic and Non-Hispanic are not mutually exclusive from whites blacks AsianPacificIslanders and American IndiansAlaska Natives Incidence data for Hispanics and Non-Hispanicsare based on NHIA and exclude cases from the Alaska Native Registry
f Incidence data for American IndianAlaska Native are based on the PurchasedReferred CareDelivery Area (PRCDA) counties
g US Mortality Files National Center for Health Statistics CDCh The 2007-2016 mortality AAPCs are based on a Joinpoint analysis using years of death 2000-2016 The APC is significantly different from zero (plt05)
SEER Incidence SEER 21 Areasb SEER 21 Areasb SEER 9 Areasb
Rate 2012-2016 Trend 2007-2016c Trend 2007-2016d
Rate per 100000 persons AAPC () AAPC ()
Total Males Females Total Males Females Total Males Females RaceEthnicity
All Races 141 181 109 -04 -02 -06 -03 02 03
White 149 191 115 -05 -05 -07 04 03 05White Hispanice 112 134 94 01 -02 03 - - -White Non-Hispanice 153 197 116 -05 -05 -08 - - -
Black 109 139 89 06 02 07 01 01 02
AsianPacific Islander 78 97 63 01 00 02 - - -
Amer IndAlaska Natf 86 110 66 08 21 -01 - - -
Hispanice 108 130 91 02 00 03 - - -
US Mortalityg Rate 2012-2016 Trend 2007-2016h
Rate per 100000 persons AAPC ()
Total Males Females Total Males FemalesRaceEthnicity
All Races 65 88 49 -16 -17 -13
White 68 91 51 -14 -16 -12White Hispanice 50 63 41 -07 -08 -06White Non-Hispanice 69 93 51 -14 -15 -12
Black 55 72 44 -15 -17 -15
AsianPacific Islander 36 47 28 -18 -07 -23
Amer IndAlaska NatTotal US 31 42 23 -22 -09 -36PRCDA Counties 41 54 30 -16 -05 -28Non-PRCDA Counties 20 28 15 -31 -13 -50
Hispanice 47 60 38 -08 -09 -07
Table 1323Leukemia
SEER Incidence and US MortalityAge-Adjusted Rates and Trendsa
By RaceEthnicity and Sex
SEE
R C
ancer Statistics Review
1975-2016N
ational Cancer Institute
a Rates are per 100000 and are age-adjusted to the 2000 US Std Population (19 age groups - Census P25-1130)b The SEER 9 areas are San Francisco Connecticut Detroit Hawaii Iowa New Mexico Seattle Utah and Atlanta
The SEER 13 areas comprise the SEER 9 areas plus San Jose-Monterey Los Angeles the Alaska Native Registry and Rural GeorgiaThe SEER 18 areas comprise the SEER 13 areas plus California excluding SFSJMLA Kentucky Louisiana New Jersey and Georgiaexcluding ATLRGThe SEER 21 areas comprise the SEER 18 areas plus Idaho New York and Massachusetts
- Statistic not shown Rate based on less than 16 cases for the time interval
All Races Whites Blacks Total Males Females Total Males Females Total Males Females
SEER Incidence Ratesa 2012-2016
California 1239 1590 949 1337 1715 1020 1039 1334 813Greater Bay Area 1231 1619 915 1400 1844 1028 1098 1406 859San Francisco-Oakland 1212 1596 906 1389 1823 1034 1077 1336 881San Jose-Monterey 1259 1651 925 1410 1869 1011 1239 1787 -
Los Angeles 1173 1469 933 1291 1622 1016 1050 1294 884Greater California 1271 1633 968 1334 1709 1017 1007 1338 729
Connecticut 1406 1768 1117 1431 1790 1142 976 1126 867Detroit 1584 2050 1230 1707 2222 1300 1204 1485 1018Georgia 1430 1841 1120 1537 1970 1189 1139 1487 935Atlanta 1382 1819 1064 1563 2017 1207 1138 1557 884Rural Georgia 1411 1586 1206 1510 1773 1196 1248 - 1236Greater Georgia 1455 1863 1144 1531 1965 1182 1140 1450 968
Hawaii 1073 1339 843 1388 1612 1139 - - -Idaho 1588 1950 1263 1604 1973 1272 - - -Iowa 1627 2127 1222 1630 2133 1221 1416 1743 1076Kentucky 1566 1983 1234 1577 1995 1241 1159 1446 922Louisiana 1405 1789 1104 1518 1918 1197 1103 1393 890Massachusetts 1108 1429 854 1118 1448 856 787 1050 620New Jersey 1524 1962 1188 1541 1982 1199 1136 1469 928New Mexico 1299 1550 1086 1310 1556 1101 1045 - -New York 1623 2119 1244 1752 2281 1335 1068 1360 887Seattle-Puget Sound 1568 2020 1188 1634 2084 1249 1486 1929 1077Utah 1375 1793 1009 1401 1825 1029 - - -
SEER 9 Areasb 1419 1823 1094 1521 1945 1171 1154 1460 941SEER 13 Areasb 1357 1737 1049 1473 1882 1134 1126 1419 922SEER 18 Areasb 1376 1761 1066 1461 1867 1127 1114 1414 907SEER 21 Areasb 1407 1807 1088 1491 1912 1147 1089 1386 889
Table 1324Leukemia
Age-Adjusted SEER Incidence Ratesa
By Registry Race and Sex
SEE
R C
ancer Statistics Review
1975-2016N
ational Cancer Institute
a US Mortality Files National Center for Health Statistics Centers for Disease Control and PreventionRates are per 100000 and are age-adjusted to the 2000 US Std Population (19 age groups - Census P25-1130)
b The SEER 9 areas are San Francisco Connecticut Detroit Hawaii Iowa New Mexico Seattle Utah and AtlantaThe SEER 13 areas comprise the SEER 9 areas plus San Jose-Monterey Los Angeles the Alaska Native Registry and Rural GeorgiaThe SEER 18 areas comprise the SEER 13 areas plus California excluding SFSJMLA Kentucky Louisiana New Jersey and Georgiaexcluding ATLRGThe SEER 21 areas comprise the SEER 18 areas plus Idaho New York and Massachusetts
- Statistic not shown Rate based on less than 16 cases for the time interval
All Races Whites Blacks Total Males Females Total Males Females Total Males Females
SEER Death Ratesa 2012-2016
California 617 811 470 671 885 507 560 711 461Greater Bay Area 563 759 419 640 869 470 551 742 424San Francisco-Oakland 551 753 405 631 871 455 544 726 421San Jose-Monterey 584 768 446 653 863 495 604 - -
Los Angeles 608 797 468 675 894 513 571 717 483Greater California 639 835 489 677 886 515 553 687 458
Connecticut 622 837 465 639 862 474 536 665 449Detroit 662 915 485 691 967 494 573 723 475Georgia 614 817 467 642 855 478 538 706 438Atlanta 568 757 437 615 802 483 487 658 374Rural Georgia 581 628 538 579 635 - - - -Greater Georgia 639 851 482 654 879 477 576 745 483
Hawaii 463 593 362 543 632 440 - - -Idaho 655 846 497 661 865 492 - - -Iowa 693 961 498 700 963 508 - - -Kentucky 742 949 592 750 953 603 633 894 455Louisiana 677 906 514 705 953 520 603 776 498Massachusetts 622 830 478 647 869 490 463 524 444New Jersey 615 810 478 657 871 504 474 549 429New Mexico 560 759 400 589 794 421 - - -New York 621 842 466 675 910 506 450 602 356Seattle-Puget Sound 618 795 481 637 807 503 708 975 499Utah 679 865 526 693 876 542 - - -
SEER 9 Areasb 610 818 457 651 869 487 540 711 427SEER 13 Areasb 609 810 460 658 874 494 544 708 437SEER 18 Areasb 630 832 480 671 887 508 552 705 455SEER 21 Areasb 628 834 477 670 889 506 520 670 426
Total US 654 876 489 681 912 506 550 721 439
Table 1325Leukemia
Age-Adjusted SEER Death Ratesa
By Registry Race and Sex
SEER Cancer Statistics Review 1975-2016 National Cancer Institute
a US Mortality Files National Center for Health Statistics Centers for Disease Control andPrevention Rates are per 100000 and are age-adjusted to the 2000 US Std Population (19age groups - Census P25-1130)
b Difference between state rate and total US rate is statistically significant (plt=0002)c Absolute percent difference between state rate and total US rate is 15 or mored Rank of state level death rate and the 95 confidence intervals (low high) for the rankSE Standard error of the ratePD Percent difference between state rate and total US rate- Statistic not shown Rate based on less than 16 cases for the time interval
State Rate SE Rank(CI)d PD TOTAL US 654 002
High Five StatesOklahoma 790 019 01(0108) 2083c
West Virginia 749 025 02(0123) 1449South Dakota 747 040 03(0133) 1415Kentucky 742 018 04(0116) 1352Kansas 742 022 05(0122) 1350
Low Five StatesColorado 609 016 47(2649) -692Alaska 596 050 48(0451) -885New Mexico 560 022 49(3650) -1430DC 504 041 50(3251) -2293c
Hawaii 463 024 51(4951) -2913c
State Rate SE Rank(CI)d PD State Rate SE Rank(CI)d PD
Alabama 689 016 17(0532) 533 Montana 613 032 45(0950) -634Alaska 596 050 48(0451) -885 Nebraska 718 026 10(0131) 983Arizona 632 013 36(2248) -329 Nevada 644 021 28(1148) -157Arkansas 719 021 09(0127) 993 New Hampshire 638 029 31(0749) -238California 617 006 42(3248) -572 New Jersey 615 011 43(2849) -592Colorado 609 016 47(2649) -692 New Mexico 560 022 49(3650) -1430Connecticut 622 017 40(2249) -490 New York 621 007 41(2948) -499Delaware 664 035 24(0249) 152 North Carolina 634 011 34(2347) -310DC 504 041 50(3251) -2293c North Dakota 656 040 26(0249) 029Florida 630 007 38(2645) -370 Ohio 694 010 13(0626) 608Georgia 614 012 44(2849) -604 Oklahoma 790 019 01(0108) 2083c
Hawaii 463 024 51(4951) -2913c Oregon 632 017 37(1948) -331Idaho 655 028 27(0548) 012 Pennsylvania 680 009 21(1029) 396Illinois 684 010 19(0928) 463 Rhode Island 656 033 25(0349) 037Indiana 719 014 08(0222) 994 South Carolina 682 016 20(0634) 435Iowa 693 019 14(0334) 604 South Dakota 747 040 03(0133) 1415Kansas 742 022 05(0122) 1350 Tennessee 702 014 12(0327) 729Kentucky 742 018 04(0116) 1352 Texas 640 007 30(2342) -215Louisiana 677 017 23(0637) 356 Utah 679 024 22(0346) 387Maine 638 027 32(0949) -240 Vermont 636 041 33(0350) -277Maryland 633 014 35(2148) -323 Virginia 611 012 46(2849) -661Massachusetts 622 013 39(2548) -482 Washington 640 013 29(2047) -209Michigan 685 011 18(0829) 476 West Virginia 749 025 02(0123) 1449Minnesota 691 015 16(0430) 564 Wisconsin 727 015 06(0219) 1110Mississippi 692 021 15(0337) 580 Wyoming 721 049 07(0148) 1028Missouri 711 014 11(0324) 874
Table 1326Leukemia
Age-Adjusted Cancer Deatha Rates By State All Races 2012-2016
Males and Females
SEER Cancer Statistics Review 1975-2016 National Cancer Institute
a US Mortality Files National Center for Health Statistics Centers for Disease Control andPrevention Rates are per 100000 and are age-adjusted to the 2000 US Std Population (19age groups - Census P25-1130)
b Difference between state rate and total US rate is statistically significant (plt=0002)c Absolute percent difference between state rate and total US rate is 15 or mored Rank of state level death rate and the 95 confidence intervals (low high) for the rankSE Standard error of the ratePD Percent difference between state rate and total US rate- Statistic not shown Rate based on less than 16 cases for the time interval
State Rate SE Rank(CI)d PD TOTAL US 876 003
High Five StatesOklahoma 1022 034 01(0120) 1669c
Kansas 1018 039 02(0123) 1625c
Arkansas 991 037 03(0127) 1309South Dakota 985 068 04(0147) 1249Delaware 984 065 05(0144) 1236
Low Five StatesMontana 795 053 47(1150) -921New Mexico 759 039 48(2650) -1336Alaska 711 081 49(0851) -1887c
DC 704 078 50(1051) -1959c
Hawaii 593 040 51(4951) -3228c
State Rate SE Rank(CI)d PD State Rate SE Rank(CI)d PD
Alabama 939 029 17(0233) 725 Montana 795 053 47(1150) -921Alaska 711 081 49(0851) -1887c Nebraska 958 046 12(0141) 935Arizona 827 022 41(2449) -555 Nevada 858 037 33(0849) -210Arkansas 991 037 03(0127) 1309 New Hampshire 884 051 25(0149) 088California 811 010 43(3348) -738 New Jersey 810 020 44(2749) -747Colorado 834 028 39(2049) -484 New Mexico 759 039 48(2650) -1336Connecticut 837 031 37(1549) -441 New York 842 013 35(2546) -387Delaware 984 065 05(0144) 1236 North Carolina 863 020 31(1945) -149DC 704 078 50(1051) -1959c North Dakota 873 070 27(0150) -030Florida 839 012 36(2645) -422 Ohio 931 018 19(0529) 627Georgia 817 021 42(2649) -677 Oklahoma 1022 034 01(0120) 1669c
Hawaii 593 040 51(4951) -3228c Oregon 866 029 29(1147) -112Idaho 846 047 34(0550) -339 Pennsylvania 912 016 21(0931) 416Illinois 928 018 20(0529) 594 Rhode Island 911 059 22(0149) 400Indiana 960 025 11(0127) 959 South Carolina 951 029 13(0131) 853Iowa 961 035 08(0131) 969 South Dakota 985 068 04(0147) 1249Kansas 1018 039 02(0123) 1625c Tennessee 960 025 10(0127) 959Kentucky 949 031 15(0133) 832 Texas 870 013 28(2139) -069Louisiana 906 030 23(0442) 342 Utah 865 041 30(0549) -122Maine 803 046 46(1450) -836 Vermont 874 074 26(0150) -026Maryland 861 026 32(1447) -176 Virginia 809 021 45(2650) -770Massachusetts 830 023 40(2349) -529 Washington 835 023 38(2248) -463Michigan 937 020 18(0428) 702 West Virginia 972 044 06(0135) 1095Minnesota 948 027 16(0229) 826 Wisconsin 960 026 09(0127) 961Mississippi 970 039 07(0132) 1077 Wyoming 885 081 24(0150) 102Missouri 951 025 14(0228) 852
Table 1327Leukemia
Age-Adjusted Cancer Deatha Rates By State All Races 2012-2016
Males
SEER Cancer Statistics Review 1975-2016 National Cancer Institute
a US Mortality Files National Center for Health Statistics Centers for Disease Control andPrevention Rates are per 100000 and are age-adjusted to the 2000 US Std Population (19age groups - Census P25-1130)
b Difference between state rate and total US rate is statistically significant (plt=0002)c Absolute percent difference between state rate and total US rate is 15 or mored Rank of state level death rate and the 95 confidence intervals (low high) for the rankSE Standard error of the ratePD Percent difference between state rate and total US rate- Statistic not shown Rate based on less than 16 cases for the time interval
State Rate SE Rank(CI)d PD TOTAL US 489 002
High Five StatesOklahoma 615 023 01(0108) 2584c
Wyoming 596 060 02(0147) 2194c
Kentucky 592 021 03(0111) 2126c
West Virginia 576 030 04(0126) 1792c
South Dakota 564 047 05(0145) 1551c
Low Five StatesColorado 441 018 47(2250) -972Delaware 428 037 48(0751) -1247New Mexico 400 025 49(3151) -1803c
DC 381 046 50(1251) -2203c
Hawaii 362 029 51(4151) -2598c
State Rate SE Rank(CI)d PD State Rate SE Rank(CI)d PD
Alabama 512 019 18(0440) 483 Montana 452 037 43(0551) -745Alaska 485 062 27(0151) -073 Nebraska 531 030 10(0144) 864Arizona 473 015 31(1347) -308 Nevada 455 025 42(1150) -695Arkansas 516 024 15(0344) 554 New Hampshire 449 033 45(0651) -807California 470 007 34(2345) -383 New Jersey 478 013 30(1346) -223Colorado 441 018 47(2250) -972 New Mexico 400 025 49(3151) -1803c
Connecticut 465 020 40(1249) -487 New York 466 009 38(2246) -456Delaware 428 037 48(0751) -1247 North Carolina 471 012 32(1747) -350DC 381 046 50(1251) -2203c North Dakota 479 046 28(0151) -189Florida 460 008 41(2647) -582 Ohio 520 012 12(0529) 653Georgia 467 013 37(1747) -433 Oklahoma 615 023 01(0108) 2584c
Hawaii 362 029 51(4151) -2598c Oregon 449 019 44(1850) -799Idaho 497 033 22(0249) 174 Pennsylvania 516 011 14(0629) 556Illinois 514 011 16(0631) 526 Rhode Island 471 037 33(0351) -363Indiana 540 017 07(0226) 1052 South Carolina 495 018 23(0645) 133Iowa 498 022 20(0547) 200 South Dakota 564 047 05(0145) 1551c
Kansas 539 025 08(0137) 1032 Tennessee 517 016 13(0435) 590Kentucky 592 021 03(0111) 2126c Texas 467 008 36(2246) -431Louisiana 514 020 17(0442) 520 Utah 526 029 11(0146) 778Maine 508 032 19(0248) 403 Vermont 444 045 46(0351) -906Maryland 470 016 35(1448) -389 Virginia 465 014 39(1848) -474Massachusetts 478 015 29(1247) -220 Washington 487 016 25(0946) -022Michigan 498 013 21(0939) 192 West Virginia 576 030 04(0126) 1792c
Minnesota 494 017 24(0745) 121 Wisconsin 545 017 06(0225) 1162Mississippi 485 023 26(0548) -067 Wyoming 596 060 02(0147) 2194c
Missouri 535 017 09(0327) 953
Table 1328Leukemia
Age-Adjusted Cancer Deatha Rates By State All Races 2012-2016
Females
SEE
R C
ancer Statistics Review
1975-2016N
ational Cancer Institute
a US 2016 cancer prevalence counts are based on 2016 cancer prevalence proportions from the SEER 13 Areas (excluding the AlaskaNative Registry) and 112016 US population estimates based on the average of 2015 and 2016 population estimates from theUS Bureau of the CensusPrevalence was calculated using the first invasive tumor for each cancer site diagnosed during the previous 24 years
b Maximum limited-duration prevalence is 24 years for 1992-2016 datac Percentages are age-adjusted to the 2000 US Standard Population (19 age groups - Census P25-1130) by 5-year age groupsd Cases diagnosed more than 24 years ago were estimated using the completeness index method (Capocaccia et al 1997
Merrill et al 2000)e Complete prevalence is obtained by summing 0 to lt24 and gt=24- Statistic not shown Statistic based on fewer than 5 cases estimated alive in SEER for the time interval+ Not available
Years Since Diagnosis 0 to lt5 5 to lt10 10 to lt15 15 to lt20 20 to lt24 0 to lt24b gt=24d Completee
Race Sex All Races Both Sexes 153253 100309 63581 38012 21353 376508 38265 414773
Males 90192 57683 36029 21220 12020 217145 18411 235556Females 63061 42625 27552 16792 9333 159363 19854 179217
White Both Sexes 132173 87961 56051 33596 19035 328814 32999 370135Males 78368 50894 32033 18770 10845 190910 15102 210930Females 53805 37067 24018 14826 8190 137905 17897 159205
Black Both Sexes 12734 6564 4233 2487 1259 27277 4070 31347Males 6847 3556 2204 1334 637 14578 1776 16354Females 5887 3008 2029 1153 622 12699 2294 14992
Asian Both Sexes 3926 2561 1778 1164 690 10120 + +Pacific Males 2235 1462 936 646 351 5630 + +Islander Females 1691 1100 842 519 339 4490 + +
Hispanic Both Sexes 14464 9581 6796 4462 2630 37933 + +Males 8166 5374 3794 2408 1538 21280 + +Females 6298 4207 3002 2055 1092 16654 + +
Age Specific (Crude) Age-Adjustedc Age at Prevalence All Ages 0-9 10-19 20-29 30-39 40-49 50-59 60-69 70-79 80+ All Ages
Race Sex All Races Both Sexes 01168 00328 00640 00628 00377 00561 01053 02263 04023 05111 01054
Males 01369 00339 00706 00685 00419 00657 01287 02888 05282 07048 01306Females 00974 00317 00572 00570 00333 00466 00829 01696 02974 03919 00844
White Both Sexes 01304 00369 00715 00712 00410 00584 01106 02389 04249 05386 01127Males 01528 00379 00789 00771 00457 00682 01349 03042 05558 07387 01389Females 01084 00359 00637 00650 00362 00484 00869 01784 03135 04133 00904
Black Both Sexes 00605 00145 00322 00320 00267 00463 00752 01455 02470 03076 00660Males 00674 00142 00357 00338 00281 00530 00919 01737 03249 04580 00816Females 00541 00148 00286 00301 00255 00402 00605 01230 01927 02334 00552
Asian Both Sexes 00497 00264 00531 00426 00230 00390 00553 00882 01245 01389 00513Pacific Males 00577 00298 00555 00507 00249 00461 00665 01122 01552 01904 00613Islander Females 00423 00228 00507 00345 00212 00327 00456 00688 00999 01057 00430
Hispanic Both Sexes 00664 00375 00737 00728 00395 00485 00723 01191 01987 02074 00746Males 00737 00397 00827 00807 00471 00576 00831 01350 02221 02551 00854Females 00589 00352 00642 00641 00312 00391 00617 01050 01809 01780 00647
Table 1329Leukemia
Estimated United States Cancer Prevalence Countsa on January 1 2016By RaceEthnicity Sex and Years Since Diagnosis
Estimated prevalence percenta on January 1 2016 of the SEER population diagnosed in the previous 24 yearsBy Age at Prevalence RaceEthnicity and Sex
SEE
R C
ancer Statistics Review
1975-2016N
ational Cancer Institute
a US 2016 cancer prevalence counts are based on 2016 cancer prevalence proportions from the SEER 13 Areas (excluding the AlaskaNative Registry) and 112016 US population estimates based on the average of 2015 and 2016 population estimates from theUS Bureau of the CensusPrevalence was calculated using the first invasive tumor for each cancer site diagnosed during the previous 24 years
b Maximum limited-duration prevalence is 24 years for 1992-2016 datac Percentages are age-adjusted to the 2000 US Standard Population (19 age groups - Census P25-1130) by 5-year age groupsd Cases diagnosed more than 24 years ago were estimated using the completeness index method (Capocaccia et al 1997
Merrill et al 2000)e Complete prevalence is obtained by summing 0 to lt24 and gt=24- Statistic not shown Statistic based on fewer than 5 cases estimated alive in SEER for the time interval+ Not available
Years Since Diagnosis 0 to lt5 5 to lt10 10 to lt15 15 to lt20 20 to lt24 0 to lt24b gt=24d Completee
Race Sex All Races Both Sexes 20277 16033 13721 12074 8203 70308 25456 95764
Males 11203 9049 7751 6542 4634 39179 12997 52176Females 9074 6984 5971 5531 3568 31129 12460 43589
White Both Sexes 17123 13855 11870 10663 7154 60665 21823 83282Males 9549 7741 6768 5696 4084 33839 11286 45559Females 7573 6114 5102 4967 3070 26826 10537 37723
Black Both Sexes 1590 1133 923 727 553 4926 1609 6535Males 809 734 473 411 290 2716 592 3308Females 781 399 450 317 263 2210 1017 3227
Asian Both Sexes 998 720 669 486 361 3234 + +Pacific Males 527 406 369 313 178 1793 + +Islander Females 472 314 300 173 183 1441 + +
Hispanic Both Sexes 5905 4543 3352 2717 1749 18266 + +Males 3302 2686 1899 1465 1058 10409 + +Females 2603 1857 1454 1252 692 7857 + +
Age Specific (Crude) Age-Adjustedc Age at Prevalence All Ages 0-9 10-19 20-29 30-39 40-49 50-59 60-69 70-79 80+ All Ages
Race Sex All Races Both Sexes 00218 00276 00541 00467 00139 00078 00059 00065 00053 00033 00228
Males 00247 00286 00591 00520 00163 00095 00066 00069 00056 00035 00251Females 00190 00266 00488 00410 00115 00062 00053 00062 00050 00032 00204
White Both Sexes 00241 00315 00612 00542 00161 00086 00063 00070 00056 00033 00259Males 00271 00323 00670 00598 00186 00107 00069 00074 00060 00032 00284Females 00211 00306 00551 00482 00135 00064 00057 00066 00053 00033 00232
Black Both Sexes 00109 00107 00250 00197 00067 00042 00039 00029 00012 00027 00102Males 00126 00112 00281 00224 00079 00035 00052 00026 00012 00027 00112Females 00094 00102 00219 00171 00056 00047 00028 00032 00013 00027 00092
Asian Both Sexes 00159 00208 00418 00289 00071 00064 00045 00050 00054 00036 00163Pacific Males 00184 00226 00427 00360 00086 00069 00055 00054 00033 00055 00180Islander Females 00136 00190 00408 00219 00058 00059 00036 00047 00071 00023 00146
Hispanic Both Sexes 00320 00328 00637 00574 00165 00107 00093 00100 00084 00012 00279Males 00361 00342 00710 00648 00205 00131 00110 00063 00072 - 00309Females 00278 00312 00562 00494 00122 00082 00077 00133 00093 00020 00246
Table 1330Acute Lymphocytic Leukemia
Estimated United States Cancer Prevalence Countsa on January 1 2016By RaceEthnicity Sex and Years Since Diagnosis
Estimated prevalence percenta on January 1 2016 of the SEER population diagnosed in the previous 24 yearsBy Age at Prevalence RaceEthnicity and Sex
0
5
10
15
20
25
1975 1985 1995 2005 20160
5
10
15
20
25
1975 1985 1995 2005 20160
3
6
9
12
15
1975 1985 1995 2005 20160
3
6
9
12
15
1975 1985 1995 2005 2016
Delay-Adj IncidenceDelay-Adj Incidence
Observed IncidenceObserved Incidence
MortalityMortality
SEER Observed Incidence SEER Delay Adjusted Incidence and US Death RatesLeukemia by Race and Sex
a
Figure 131
Source SEER 9 areas and US Mortality Files (National Center for Health Statistics CDC)Rates are age-adjusted to the 2000 US Std Population (19 age groups - Census P25-1103)Regression lines and APCs are calculated using the Joinpoint Regression Program Version 47 February 2019 National Cancer InstituteThe APC is the Annual Percent Change for the regression line segments The APC shown on the graph is for the most recent trendThe APC is significantly different from zero (p lt 005)
a
White Male Black Male White Female Black FemaleRate per 100000 Rate per 100000 Rate per 100000 Rate per 100000
Year of DiagnosisDeath Year of DiagnosisDeath Year of DiagnosisDeath Year of DiagnosisDeath
SEER Incidence APCsDelay Adj 1998-16 = 08Observed 1975-16 = 03
US Mortality APC2013-16 = -30
SEER Incidence APCsDelay Adj 1975-16 = 02Observed 1975-16 = 01
US Mortality APC1993-16 = -15
SEER Incidence APCsDelay Adj 1975-16 = 06Observed 1975-16 = 05
US Mortality APC2000-16 = -12
SEER Incidence APCsDelay Adj 1975-16 = 03Observed 1975-16 = 02
US Mortality APC1993-16 = -13
SEE
R C
ancer Statistics Review
1975-2016N
ational Cancer Institute
0
1
2
3
4
5
6
7
8
1975 1985 1995 2005 20160
1
2
3
4
5
6
7
8
1975 1985 1995 2005 20160
1
2
3
4
5
6
7
8
1975 1985 1995 2005 20160
1
2
3
4
5
6
7
8
1975 1985 1995 2005 2016
Chronic
Acute
SEER Observed Incidence RatesLymphocytic and Myeloid Leukemia (Acute and Chronic) by Sex
a
Figure 132
Source SEER 9 areas Rates are age-adjusted to the 2000 US Std Population (19 age groups - Census P25-1103)Regression lines and APCs are calculated using the Joinpoint Regression Program Version 47 February 2019 National Cancer Institute
a
Male Female Male FemaleLymphocytic Leukemia Myeloid Leukemia
Rate per 100000 Rate per 100000 Rate per 100000 Rate per 100000
Year of Diagnosis Year of Diagnosis Year of Diagnosis Year of Diagnosis
SEE
R C
ancer Statistics Review
1975-2016N
ational Cancer Institute
Joinpoint Analyses for Whites and Blacks from 1975-2016and for AsianPacific Islanders American IndiansAlaska Natives and Hispanics from 2000-2016
0
5
10
15
20
1975 1985 1995 2005 20160
5
10
15
20
1975 1985 1995 2005 2016
White
Black
API
AIAN
Hispanic
SEER Incidence and US Death RatesLeukemia Both Sexes
Figure 133
Source Incidence data for whites and blacks are from the SEER 9 areas (San Francisco Connecticut Detroit Hawaii Iowa New Mexico Seattle Utah Atlanta)Incidence data for AsianPacific Islanders American IndiansAlaska Natives and Hispanics are from the SEER 21 areas (SEER 9 areas San Jose-MontereyLos Angeles Alaska Native Registry Rural Georgia California excluding SFSJMLA Kentucky Louisiana New Jersey Georgia excluding ATLRG Idaho New York andMassachusetts)Mortality data are from US Mortality Files National Center for Health Statistics CDCRates are age-adjusted to the 2000 US Std Population (19 age groups - Census P25-1103)Regression lines are calculated using the Joinpoint Regression Program Version 47 February 2019 National Cancer Institute Joinpoint analyses for Whites andBlacks during the 1975-2016 period allow a maximum of 5 joinpoints Analyses for other ethnic groups during the period 2000-2016 allow a maximum of 3 joinpointsAPI = AsianPacific IslanderAIAN = American IndianAlaska Native Rates for American IndianAlaska Native are based on the PurchasedReferred Care Delivery Area (PRCDA) countiesHispanic is not mutually exclusive from whites blacks AsianPacific Islanders and American IndiansAlaska Natives Incidence data for Hispanics are based onNHIA and exclude cases from the Alaska Native Registry
Incidence MortalityRate per 100000 Rate per 100000
Year of Diagnosis Year of Death
a
d
a
b
c
c
b
d
SEE
R C
ancer Statistics Review
1975-2016N
ational Cancer Institute
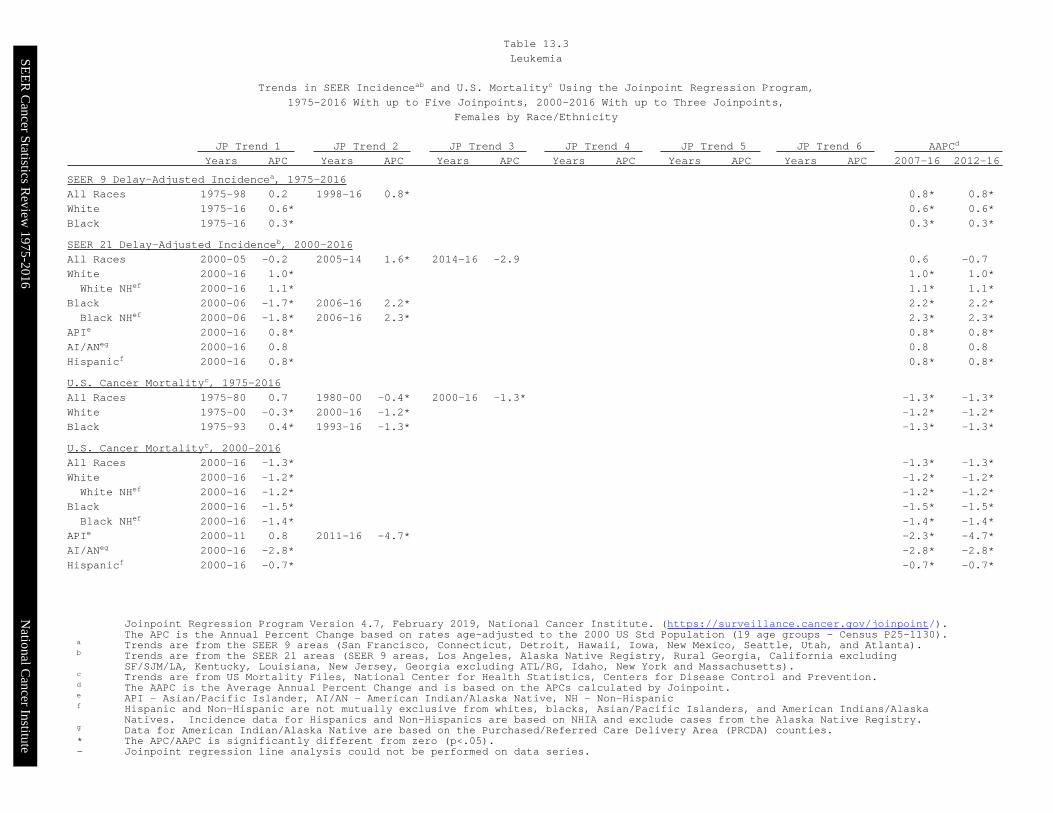
SEE
R C
ancer Statistics Review
1975-2016N
ational Cancer Institute
Joinpoint Regression Program Version 47 February 2019 National Cancer Institute (httpssurveillancecancergovjoinpoint)The APC is the Annual Percent Change based on rates age-adjusted to the 2000 US Std Population (19 age groups - Census P25-1130)
a Trends are from the SEER 9 areas (San Francisco Connecticut Detroit Hawaii Iowa New Mexico Seattle Utah and Atlanta)b Trends are from the SEER 21 areas (SEER 9 areas Los Angeles Alaska Native Registry Rural Georgia California excluding
SFSJMLA Kentucky Louisiana New Jersey Georgia excluding ATLRG Idaho New York and Massachusetts)c Trends are from US Mortality Files National Center for Health Statistics Centers for Disease Control and Preventiond The AAPC is the Average Annual Percent Change and is based on the APCs calculated by Joinpointe API - AsianPacific Islander AIAN - American IndianAlaska Native NH - Non-Hispanicf Hispanic and Non-Hispanic are not mutually exclusive from whites blacks AsianPacific Islanders and American IndiansAlaska
Natives Incidence data for Hispanics and Non-Hispanics are based on NHIA and exclude cases from the Alaska Native Registryg Data for American IndianAlaska Native are based on the PurchasedReferred Care Delivery Area (PRCDA) counties The APCAAPC is significantly different from zero (plt05)- Joinpoint regression line analysis could not be performed on data series
JP Trend 1 JP Trend 2 JP Trend 3 JP Trend 4 JP Trend 5 JP Trend 6 AAPCd
Years APC Years APC Years APC Years APC Years APC Years APC 2007-16 2012-16
SEER 9 Delay-Adjusted Incidencea 1975-2016
All Races 1975-98 02 1998-16 08 08 08
White 1975-16 06 06 06
Black 1975-16 03 03 03
SEER 21 Delay-Adjusted Incidenceb 2000-2016
All Races 2000-05 -02 2005-14 16 2014-16 -29 06 -07
White 2000-16 10 10 10
White NHef 2000-16 11 11 11
Black 2000-06 -17 2006-16 22 22 22
Black NHef 2000-06 -18 2006-16 23 23 23
APIe 2000-16 08 08 08
AIANeg 2000-16 08 08 08
Hispanicf 2000-16 08 08 08
US Cancer Mortalityc 1975-2016
All Races 1975-80 07 1980-00 -04 2000-16 -13 -13 -13
White 1975-00 -03 2000-16 -12 -12 -12
Black 1975-93 04 1993-16 -13 -13 -13
US Cancer Mortalityc 2000-2016
All Races 2000-16 -13 -13 -13
White 2000-16 -12 -12 -12
White NHef 2000-16 -12 -12 -12
Black 2000-16 -15 -15 -15
Black NHef 2000-16 -14 -14 -14
APIe 2000-11 08 2011-16 -47 -23 -47
AIANeg 2000-16 -28 -28 -28
Hispanicf 2000-16 -07 -07 -07
Table 133
Leukemia
Trends in SEER Incidenceab and US Mortalityc Using the Joinpoint Regression Program
1975-2016 With up to Five Joinpoints 2000-2016 With up to Three Joinpoints
Females by RaceEthnicity
SEE
R C
ancer Statistics Review
1975-2016N
ational Cancer Institute
Reference Cancer Incidence Rates Adjusted for Reporting DelayIndividual rates for diagnosis years 1975-1979 available in web browser version of Cancer Statistics Review
a SEER 9 areas (San Francisco Connecticut Detroit Hawaii Iowa New Mexico Seattle Utah and Atlanta)Rates are per 100000 and are age-adjusted to the 2000 US Std Population (19 age groups - Census P25-1130)
- Delay-adjusted rate is not shown for observed rates based on less than 16 cases for the time interval
All Races Whites Blacks Total Males Females Total Males Females Total Males Females
Year of Diagnosis1975-1979 1289 1714 997 1334 1789 1024 1052 1376 8301980 1293 1738 985 1329 1792 1012 1218 1611 9471981 1238 1647 965 1265 1703 982 1227 1447 10371982 1315 1823 971 1350 1877 995 1075 1516 7911983 1314 1780 991 1348 1842 1007 1248 1595 10061984 1300 1711 1012 1346 1797 1035 1068 1187 9611985 1339 1778 1039 1376 1832 1066 1232 1703 9301986 1284 1754 951 1339 1839 992 1023 1320 8091987 1337 1777 1033 1382 1848 1064 1257 1760 9261988 1299 1752 973 1344 1830 1003 1155 1403 9421989 1348 1770 1049 1402 1836 1102 1126 1580 8111990 1293 1736 981 1356 1830 1028 1134 1478 8891991 1308 1682 1025 1371 1778 1060 1081 1209 9981992 1307 1756 982 1366 1872 1004 1068 1391 8421993 1309 1711 1008 1367 1804 1037 1168 1529 9141994 1312 1705 1023 1382 1798 1077 986 1271 7781995 1364 1780 1054 1453 1893 1127 997 1369 7421996 1320 1705 1045 1380 1786 1090 1077 1400 8731997 1326 1770 1004 1410 1880 1068 1067 1423 8291998 1328 1726 1033 1409 1819 1104 1002 1444 7271999 1289 1722 968 1353 1803 1017 1062 1423 8272000 1382 1795 1072 1452 1889 1124 1193 1405 10342001 1449 1886 1119 1545 1999 1201 1200 1460 10202002 1370 1812 1036 1478 1950 1119 914 1207 7092003 1379 1806 1054 1461 1925 1107 1158 1509 9062004 1407 1830 1085 1481 1920 1139 1306 1784 10042005 1399 1832 1066 1491 1977 1111 1155 1310 10412006 1408 1760 1144 1512 1871 1243 1131 1540 8482007 1364 1788 1043 1473 1924 1123 1003 1377 7752008 1430 1868 1085 1526 1992 1154 1112 1516 8182009 1403 1810 1087 1497 1936 1146 1151 1563 8782010 1493 1955 1142 1608 2099 1225 1127 1501 9022011 1525 1956 1179 1628 2083 1257 1303 1545 11082012 1510 1907 1197 1625 2037 1292 1238 1582 10082013 1512 1948 1165 1639 2093 1273 1223 1628 9222014 1533 2000 1163 1655 2138 1261 1200 1515 9812015 1497 1907 1160 1630 2081 1246 1150 1345 10282016 1525 1986 1147 1661 2157 1241 1312 1689 1050
Table 134Leukemia
Delay-adjusted SEER Incidencea Rates by Year Race and Sex
SEE
R C
ancer Statistics Review
1975-2016N
ational Cancer Institute
Individual rates for diagnosis years 1975-1979 available in web browser version of Cancer Statistics Reviewa SEER 9 areas (San Francisco Connecticut Detroit Hawaii Iowa New Mexico Seattle Utah and Atlanta)
Rates are per 100000 and are age-adjusted to the 2000 US Std Population (19 age groups - Census P25-1130)- Statistic not shown Rate based on less than 16 cases for the time interval
All Races Whites Blacks Total Males Females Total Males Females Total Males Females
Year of Diagnosis1975-2016 1354 1775 1041 1425 1874 1091 1120 1446 8951975-1979 1289 1714 997 1334 1789 1024 1052 1376 8301980 1293 1738 985 1329 1792 1012 1218 1611 9471981 1238 1647 965 1265 1703 982 1227 1447 10371982 1315 1823 971 1350 1877 995 1075 1516 7911983 1314 1780 991 1348 1842 1007 1248 1595 10061984 1300 1711 1012 1346 1797 1035 1068 1187 9611985 1339 1778 1039 1376 1832 1066 1232 1703 9301986 1284 1754 951 1339 1839 992 1023 1320 8091987 1337 1777 1033 1382 1848 1064 1257 1760 9261988 1299 1752 973 1344 1830 1003 1155 1403 9421989 1348 1770 1049 1402 1836 1102 1126 1580 8111990 1293 1736 981 1356 1830 1028 1134 1478 8891991 1308 1682 1025 1371 1778 1060 1081 1209 9981992 1307 1756 982 1366 1872 1004 1068 1391 8421993 1309 1711 1008 1367 1804 1037 1168 1529 9141994 1312 1705 1023 1382 1798 1077 986 1271 7781995 1364 1780 1054 1453 1893 1127 997 1369 7421996 1320 1705 1045 1380 1786 1090 1077 1400 8731997 1326 1770 1004 1410 1880 1068 1067 1423 8291998 1328 1726 1033 1409 1819 1104 1002 1444 7271999 1289 1722 968 1353 1803 1017 1062 1423 8272000 1382 1795 1072 1452 1889 1124 1193 1405 10342001 1449 1886 1119 1545 1999 1201 1200 1460 10202002 1370 1812 1036 1478 1950 1119 914 1207 7092003 1379 1806 1054 1461 1925 1107 1158 1509 9062004 1407 1830 1085 1481 1920 1139 1306 1784 10042005 1399 1832 1066 1491 1977 1111 1155 1310 10412006 1408 1760 1144 1512 1871 1243 1131 1540 8482007 1364 1788 1043 1473 1924 1123 1003 1377 7752008 1419 1853 1077 1512 1974 1143 1106 1508 8132009 1381 1781 1070 1469 1899 1125 1137 1543 8682010 1458 1907 1116 1563 2040 1191 1107 1473 8872011 1478 1894 1143 1569 2006 1212 1271 1510 10802012 1452 1832 1151 1550 1943 1234 1201 1532 9802013 1441 1856 1111 1550 1978 1204 1177 1566 8882014 1442 1879 1096 1542 1991 1176 1136 1432 9302015 1384 1761 1074 1488 1899 1138 1071 1250 9602016 1380 1792 1041 1479 1919 1107 1189 1529 952
Table 135Leukemia
Age-adjusted SEER Incidencea Rates by Year Race and Sex
SEE
R C
ancer Statistics Review
1975-2016N
ational Cancer Institute
Individual rates for diagnosis years 1975-1979 available in web browser version of Cancer Statistics Reviewa SEER 9 areas (San Francisco Connecticut Detroit Hawaii Iowa New Mexico Seattle Utah and Atlanta)
Rates are per 100000 and are age-adjusted to the 2000 US Std Population (19 age groups - Census P25-1130)- Statistic not shown Rate based on less than 16 cases for the time interval
All Races Whites Blacks Total Males Females Total Males Females Total Males Females
Year of Diagnosis1975-2016 139 159 120 147 168 126 086 098 0761975-1979 103 122 086 108 129 090 054 059 0491980 112 140 088 116 147 090 073 - -1981 124 131 118 130 139 123 095 - -1982 123 150 099 130 156 105 - - -1983 129 152 108 139 164 118 080 - -1984 132 148 120 134 149 124 092 - -1985 130 155 109 135 162 112 - - -1986 130 167 096 138 182 096 077 - -1987 132 148 119 136 154 121 089 - 1151988 140 179 107 144 184 112 098 - -1989 162 182 143 169 190 149 103 - -1990 142 176 116 152 185 129 057 - -1991 138 172 105 151 194 109 086 - -1992 135 159 114 140 173 109 091 - -1993 126 141 109 138 157 115 082 - -1994 119 148 093 128 159 101 068 - -1995 150 180 121 161 187 136 098 132 -1996 139 156 121 146 165 126 085 - -1997 133 151 116 144 160 128 079 098 -1998 146 161 131 157 169 144 093 116 -1999 131 149 114 140 156 124 068 - -2000 140 151 129 152 161 145 087 - -2001 146 166 126 158 182 134 070 - -2002 150 179 120 165 200 129 062 - -2003 143 166 122 147 170 127 078 097 -2004 155 171 139 167 196 138 112 - 1432005 158 188 129 166 194 138 097 118 -2006 145 163 128 151 164 139 097 142 -2007 152 167 138 160 171 150 095 106 -2008 150 186 115 168 203 132 091 132 -2009 147 161 135 157 174 142 096 108 0852010 146 155 136 158 164 151 097 110 0852011 178 189 167 194 200 189 133 164 1012012 148 153 143 160 163 158 112 145 0892013 162 179 145 175 192 158 097 132 -2014 159 174 144 168 191 146 085 - 1062015 149 172 126 158 181 134 079 096 -2016 169 188 149 171 200 141 104 118 092
Table 136Acute Lymphocytic Leukemia
Age-adjusted SEER Incidencea Rates by Year Race and Sex
SEE
R C
ancer Statistics Review
1975-2016N
ational Cancer Institute
Individual rates for diagnosis years 1975-1979 available in web browser version of Cancer Statistics Reviewa SEER 9 areas (San Francisco Connecticut Detroit Hawaii Iowa New Mexico Seattle Utah and Atlanta)
Rates are per 100000 and are age-adjusted to the 2000 US Std Population (19 age groups - Census P25-1130)- Statistic not shown Rate based on less than 16 cases for the time interval
All Races Whites Blacks Total Males Females Total Males Females Total Males Females
Year of Diagnosis1975-2016 489 678 348 532 739 379 383 541 2741975-1979 432 600 317 454 635 332 381 535 2781980 452 631 333 470 655 346 451 706 2891981 427 630 290 447 663 306 382 541 2471982 430 614 301 450 639 318 377 665 -1983 445 640 313 467 678 325 421 611 3031984 443 630 312 472 682 329 345 446 2651985 449 621 331 480 663 354 411 615 2871986 450 633 324 487 685 354 279 418 -1987 466 681 307 495 726 328 403 614 2451988 455 646 315 477 688 327 443 532 3531989 470 644 347 501 691 368 391 515 3041990 461 631 342 492 678 363 451 613 3431991 460 620 343 500 681 364 340 375 3151992 462 674 317 506 743 343 321 496 2081993 446 615 317 474 656 336 452 679 2891994 462 614 347 506 672 384 319 413 2321995 456 644 320 499 702 352 339 534 2061996 474 637 356 518 690 394 352 536 2261997 451 610 331 493 665 363 357 518 2521998 427 599 301 471 658 335 285 373 2291999 418 607 277 453 655 301 387 600 2602000 470 660 325 520 734 354 344 450 2722001 534 741 379 590 817 420 395 489 3282002 514 724 356 574 807 399 319 453 2202003 539 747 383 596 830 418 439 621 3122004 560 768 402 611 819 450 501 816 2892005 545 777 367 607 876 395 402 485 3462006 585 770 447 648 845 500 460 676 3172007 542 754 380 612 842 432 314 480 2252008 557 749 409 621 824 463 386 583 2412009 545 752 382 606 834 421 406 593 2902010 562 781 395 626 858 444 365 528 2642011 556 749 401 611 822 439 452 551 3792012 531 711 387 593 783 437 372 493 2932013 524 724 363 586 803 410 436 650 2772014 531 748 355 595 827 404 379 606 2202015 507 684 360 572 764 407 345 461 2642016 476 656 327 537 736 368 381 509 289
Table 137Chronic Lymphocytic Leukemia
Age-adjusted SEER Incidencea Rates by Year Race and Sex
SEE
R C
ancer Statistics Review
1975-2016N
ational Cancer Institute
Individual rates for diagnosis years 1975-1979 available in web browser version of Cancer Statistics Reviewa SEER 9 areas (San Francisco Connecticut Detroit Hawaii Iowa New Mexico Seattle Utah and Atlanta)
Rates are per 100000 and are age-adjusted to the 2000 US Std Population (19 age groups - Census P25-1130)- Statistic not shown Rate based on less than 16 cases for the time interval
All Races Whites Blacks Total Males Females Total Males Females Total Males Females
Year of Diagnosis1975-2016 366 455 304 373 464 309 324 386 2841975-1979 343 425 288 351 438 293 261 297 2341980 314 410 243 317 411 249 288 328 2531981 317 399 265 321 411 268 315 322 3021982 342 479 260 347 490 263 250 322 2091983 321 422 253 317 428 241 293 302 2921984 330 406 273 335 417 277 235 210 2441985 333 415 287 325 402 284 378 506 2991986 300 391 240 295 385 238 321 404 2681987 302 397 247 303 400 247 305 473 2121988 303 379 252 308 387 257 279 314 2491989 320 401 262 330 404 279 222 379 -1990 304 391 243 312 407 246 249 289 2191991 333 393 288 338 390 298 334 453 2591992 322 385 276 328 403 275 305 299 3051993 345 431 286 352 445 286 248 262 2551994 346 414 302 348 424 297 294 324 2771995 366 417 331 381 432 345 262 262 2731996 347 433 291 346 429 294 321 405 2731997 353 461 277 366 482 285 302 383 2551998 393 494 321 406 506 332 305 464 2111999 373 451 318 385 463 330 303 345 2762000 405 495 341 404 495 339 441 488 4012001 406 495 339 420 500 361 345 408 3002002 363 458 298 378 478 311 291 331 2672003 360 449 296 367 460 302 333 352 2962004 342 415 293 351 423 300 339 431 3012005 359 426 317 365 438 319 349 347 3582006 355 411 315 367 422 327 284 334 2572007 355 438 298 366 448 309 338 445 2722008 382 469 318 386 485 308 307 378 2742009 364 442 308 376 464 310 313 398 2552010 424 539 341 444 568 350 336 454 2622011 421 514 347 425 518 349 422 452 3992012 458 561 377 468 572 387 385 449 3422013 448 542 380 466 555 402 416 508 3472014 439 531 371 460 548 395 378 453 3182015 426 518 358 442 539 367 372 415 3512016 431 542 347 447 556 361 408 489 358
Table 138Acute Myeloid Leukemia
Age-adjusted SEER Incidencea Rates by Year Race and Sex
SEE
R C
ancer Statistics Review
1975-2016N
ational Cancer Institute
Individual rates for diagnosis years 1975-1979 available in web browser version of Cancer Statistics Reviewa SEER 9 areas (San Francisco Connecticut Detroit Hawaii Iowa New Mexico Seattle Utah and Atlanta)
Rates are per 100000 and are age-adjusted to the 2000 US Std Population (19 age groups - Census P25-1130)- Statistic not shown Rate based on less than 16 cases for the time interval
All Races Whites Blacks Total Males Females Total Males Females Total Males Females
Year of Diagnosis1975-2016 181 238 138 184 242 141 183 237 1441975-1979 183 244 141 184 247 141 180 239 1361980 170 206 146 173 210 151 148 - -1981 164 197 141 159 190 139 238 300 1811982 168 216 135 165 219 131 175 - 1791983 169 223 133 164 215 132 251 344 1851984 168 240 118 163 241 110 258 261 2591985 197 276 143 200 280 147 206 289 -1986 168 219 129 171 225 131 154 - -1987 188 233 158 191 239 158 214 288 -1988 191 254 150 192 259 149 208 288 -1989 170 222 135 168 218 135 221 312 -1990 176 247 124 175 250 120 263 366 1951991 188 244 147 191 255 146 156 - 1751992 176 216 147 180 222 149 149 173 -1993 192 253 148 195 252 155 228 356 -1994 187 249 142 190 249 150 170 257 -1995 190 256 138 196 269 139 159 209 -1996 181 245 135 180 251 128 206 254 1831997 187 268 130 194 274 137 167 253 -1998 166 195 143 173 198 154 161 231 1201999 180 249 128 177 244 128 172 230 1262000 179 234 135 180 233 140 159 180 1332001 180 236 138 185 237 146 197 283 1362002 164 209 130 167 212 134 113 - -2003 166 224 120 176 237 127 147 218 -2004 181 256 122 187 266 125 151 206 1112005 169 226 125 177 235 131 178 244 1342006 184 240 141 194 251 151 158 217 1112007 171 232 123 180 249 123 143 183 1192008 185 239 143 186 232 151 189 267 1212009 180 238 134 179 231 139 190 289 1282010 188 251 140 188 254 136 191 212 1832011 195 255 147 206 271 151 166 195 1392012 193 233 161 197 238 165 212 281 1622013 193 260 139 198 267 140 172 226 1422014 197 259 146 195 252 146 205 196 2132015 185 230 146 194 241 152 169 185 1562016 204 265 156 216 272 171 198 288 140
Table 139Chronic Myeloid Leukemia
Age-adjusted SEER Incidencea Rates by Year Race and Sex
SEE
R C
ancer Statistics Review
1975-2016N
ational Cancer Institute
Individual rates for years of death 1975-1979 available in web browser version of Cancer Statistics Reviewa US Mortality Files National Center for Health Statistics Centers for Disease Control and Prevention
Rates are per 100000 and are age-adjusted to the 2000 US Std Population (19 age groups - Census P25-1130)- Statistic not shown Rate based on less than 16 cases for the time interval
All Races Whites Blacks Total Males Females Total Males Females Total Males Females
Year of Death1975-2016 752 1008 575 773 1038 589 656 865 5201975-1979 812 1092 624 829 1120 634 678 880 5361980 836 1121 646 854 1151 656 705 909 5671981 810 1089 624 824 1116 631 711 892 5861982 819 1104 631 833 1129 639 714 936 5671983 811 1093 626 824 1119 632 722 921 5901984 808 1068 637 823 1091 647 708 916 5691985 807 1077 631 823 1097 644 708 962 5421986 796 1071 616 810 1097 623 725 926 5911987 780 1031 614 791 1050 620 724 941 5851988 783 1060 600 795 1079 608 724 983 5581989 795 1062 615 807 1075 626 736 1034 5451990 798 1071 618 810 1090 626 744 996 5831991 799 1050 632 812 1064 644 745 1005 5801992 796 1071 613 811 1094 624 716 941 5681993 793 1066 609 804 1084 616 736 976 5771994 785 1057 603 800 1078 613 712 959 5541995 790 1080 598 804 1103 605 717 975 5531996 784 1053 605 797 1071 613 746 1009 5901997 771 1042 589 789 1068 601 683 923 5291998 758 1011 582 772 1031 591 704 937 5551999 768 1022 596 787 1047 609 674 878 5432000 769 1028 591 789 1054 605 671 907 5272001 764 1019 588 783 1046 602 674 880 5412002 754 1018 573 775 1046 585 673 891 5382003 745 1002 563 768 1037 576 654 847 5302004 729 981 552 747 1004 564 677 894 5392005 726 982 546 750 1014 563 607 811 4782006 723 970 546 748 997 566 627 884 4702007 708 954 533 730 986 546 619 807 5052008 709 954 533 732 983 549 627 865 4782009 706 953 525 731 986 541 605 814 4712010 691 925 520 716 958 537 575 746 4592011 695 928 524 718 960 539 599 774 4852012 683 921 507 708 957 522 577 756 4622013 675 909 503 703 943 523 568 770 4372014 662 882 496 691 921 515 547 717 4372015 628 846 464 655 882 482 520 684 4152016 627 828 475 653 864 491 543 687 449
Table 1310Leukemia
Age-adjusted US Deatha Rates by Year Race and Sex
SEE
R C
ancer Statistics Review
1975-2016N
ational Cancer Institute
a SEER 21 areas Rates are per 100000 and are age-adjusted to the 2000 US Std Population (19 age groups - Census P25-1130)unless noted
b US Mortality Files National Center for Health Statistics Centers for Disease Control and PreventionRates are per 100000 and are age-adjusted to the 2000 US Std Population (19 age groups - Census P25-1130) unless noted
c Rates are per 100000 and are age-adjusted to the world (WHO 2000-2025) standard million- Statistic not shown Rate based on less than 16 cases for the time interval
All Races Whites Blacks Total Males Females Total Males Females Total Males Females
SEER IncidenceAge at DiagnosisAge-Adjusted Rates 2012-2016All ages 141 181 109 149 191 115 109 139 89Under 65 71 83 58 74 87 61 58 66 5165 and over 625 855 457 668 909 487 460 641 349
All ages (WHO world std)c 109 137 86 116 145 90 85 105 71
Age-Specific Rates 2012-2016lt1 45 43 48 45 44 47 34 - 441-4 89 91 87 97 101 94 46 43 495-9 43 47 38 47 53 41 22 20 2410-14 33 38 28 34 38 30 26 31 2015-19 31 38 24 33 41 25 20 25 1520-24 29 32 25 30 35 25 24 22 2625-29 30 34 26 30 34 26 26 28 2430-34 37 42 32 37 43 32 33 33 3335-39 45 51 39 46 52 39 45 48 4240-44 61 71 51 63 73 53 58 69 4945-49 84 97 71 86 99 73 85 96 7450-54 127 156 99 133 164 103 104 123 8755-59 182 223 143 192 234 151 150 183 12260-64 271 346 202 285 365 210 230 279 19065-69 404 533 290 429 564 306 330 428 25670-74 549 735 394 584 777 419 416 563 31275-79 706 954 513 757 1015 552 535 755 39380-84 843 1180 611 902 1256 653 585 869 42885+ 880 1262 683 941 1356 725 567 810 466
US MortalityAge at DeathAge-Adjusted Rates 2012-2016All ages 65 88 49 68 91 51 55 72 44Under 65 18 22 15 18 22 15 20 23 1765 and over 392 544 283 411 570 296 299 410 232
All ages (WHO world std)c 37 48 28 38 49 29 33 43 27
Age-Specific Rates 2012-2016lt1 05 04 06 05 05 05 06 - -1-4 07 07 07 07 07 07 07 07 075-9 05 05 04 05 06 04 04 04 0310-14 06 06 05 06 06 05 05 06 0515-19 07 09 06 08 09 06 05 06 0420-24 09 11 06 09 11 07 09 10 0725-29 09 11 07 09 11 08 08 10 0730-34 10 12 08 10 12 08 11 13 1035-39 12 14 10 12 14 10 14 15 1240-44 16 17 14 16 17 15 18 18 1745-49 22 25 20 23 25 21 26 30 2250-54 34 40 28 34 41 28 39 44 3555-59 56 68 43 56 69 44 62 77 5060-64 93 118 70 95 121 70 101 130 7765-69 160 215 111 166 223 114 150 203 11070-74 272 364 194 285 380 202 231 302 18175-79 428 589 300 450 618 314 333 460 25180-84 615 863 441 647 903 462 457 633 35885+ 827 1192 638 875 1259 672 525 746 433
Table 1311Leukemia
SEER Incidencea and US Deathb Rates Age-Adjusted and Age-Specific Rates by Race and Sex
SEE
R C
ancer Statistics Review
1975-2016N
ational Cancer Institute
a SEER 21 areas Rates are per 100000 and are age-adjusted to the 2000 US Std Population (19 age groups - Census P25-1130)unless noted
b Rates are per 100000 and are age-adjusted to the world (WHO 2000-2025) standard million- Statistic not shown Rate based on less than 16 cases for the time interval
All Races Whites Blacks Total Males Females Total Males Females Total Males Females
Acute Lymphocytic LeukemiaAge at DiagnosisAge-Adjusted Rates 2012-2016All ages 17 19 15 19 21 16 10 11 09Under 65 17 20 15 19 22 16 10 11 0965 and over 16 18 13 17 20 14 10 12 09
All ages (WHO world std)b 19 21 16 20 23 18 10 11 09
Age-Specific Rates 2012-2016lt1 19 16 22 19 16 23 14 - -1-4 76 77 74 84 87 81 33 30 375-9 36 40 33 41 46 36 18 15 2010-14 23 26 19 24 27 21 14 19 0915-19 18 24 12 20 27 13 07 12 -20-24 10 14 07 12 16 07 05 06 0525-29 08 10 06 08 11 06 05 - -30-34 07 09 06 08 09 06 04 - -35-39 08 10 06 08 10 07 06 07 -40-44 08 09 06 08 10 06 06 07 -45-49 09 09 09 09 09 10 04 - -50-54 09 10 08 09 10 09 07 09 -55-59 11 12 11 12 13 11 11 12 1060-64 13 15 11 13 15 11 11 13 0965-69 14 14 13 15 16 14 07 - -70-74 16 19 13 17 20 14 - - -75-79 17 20 15 18 21 16 13 - -80-84 17 23 13 17 24 13 - - -85+ 15 19 13 16 20 14 - - -
Chronic Lymphocytic LeukemiaAge at DiagnosisAge-Adjusted Rates 2012-2016All ages 49 68 35 54 73 38 34 49 24Under 65 17 22 12 18 24 13 12 16 0865 and over 275 383 195 298 411 212 185 273 129
All ages (WHO world std)b 35 47 24 38 51 27 24 34 17
Age-Specific Rates 2012-2016lt1 - - - - - - - - -1-4 - - - - - - - - -5-9 - - - - - - - - -10-14 - - - - - - - - -15-19 - - - - - - - - -20-24 - - - - - - - - -25-29 01 01 - 01 - - - - -30-34 01 02 - 01 02 - - - -35-39 04 04 03 04 05 04 04 - -40-44 10 12 08 10 13 08 08 12 -45-49 22 28 17 24 30 19 18 24 1250-54 48 65 32 53 70 36 32 46 2055-59 80 103 58 88 113 64 51 66 3760-64 125 170 84 134 180 90 94 129 6665-69 189 258 129 204 274 140 135 188 9570-74 245 338 167 265 361 182 176 263 11675-79 306 423 216 333 455 236 213 321 14580-84 354 502 252 385 541 275 222 360 14685+ 379 543 294 413 594 318 218 302 183
Table 1312Lymphocytic Leukemia
SEER Incidencea Rates Age-Adjusted and Age-Specific Rates by Race and Sex
SEE
R C
ancer Statistics Review
1975-2016N
ational Cancer Institute
a SEER 21 areas Rates are per 100000 and are age-adjusted to the 2000 US Std Population (19 age groups - Census P25-1130)unless noted
b Rates are per 100000 and are age-adjusted to the world (WHO 2000-2025) standard million- Statistic not shown Rate based on less than 16 cases for the time interval
All Races Whites Blacks Total Males Females Total Males Females Total Males Females
Acute Myeloid LeukemiaAge at DiagnosisAge-Adjusted Rates 2012-2016All ages 43 52 35 44 54 36 37 44 33Under 65 20 21 19 20 21 19 20 20 2065 and over 201 269 152 213 284 160 155 210 123
All ages (WHO world std)b 32 38 28 33 40 28 29 33 27
Age-Specific Rates 2012-2016lt1 16 16 16 15 15 15 - - -1-4 10 10 10 09 09 09 11 10 115-9 04 04 04 04 04 04 03 - -10-14 07 08 06 07 08 06 09 09 0815-19 09 09 09 09 10 09 08 07 0820-24 11 10 12 11 10 12 12 11 1325-29 12 11 12 11 11 12 11 10 1230-34 14 15 14 14 15 14 17 15 1935-39 16 16 16 15 16 15 18 16 2040-44 21 22 21 22 22 22 22 21 2245-49 25 25 25 25 25 25 28 27 2950-54 35 38 32 36 40 33 33 32 3355-59 49 56 43 49 56 43 49 57 4360-64 78 91 67 82 97 68 70 75 6665-69 121 152 94 129 163 98 100 118 8670-74 183 236 139 192 247 145 151 189 12575-79 233 310 174 248 326 186 185 256 14080-84 286 393 212 302 413 223 207 314 14885+ 263 380 203 277 403 212 174 254 141
Chronic Myeloid LeukemiaAge at DiagnosisAge-Adjusted Rates 2012-2016All ages 19 24 14 19 25 15 18 22 15Under 65 11 13 09 11 12 09 11 13 1065 and over 76 106 55 80 111 57 62 82 49
All ages (WHO world std)b 15 19 11 15 19 12 14 17 12
Age-Specific Rates 2012-2016lt1 05 05 - 04 - - - - -1-4 01 - - 01 - - - - -5-9 01 - 01 01 - - - - -10-14 01 02 01 01 01 01 - - -15-19 03 03 02 02 03 02 03 - -20-24 05 06 04 05 06 04 04 - -25-29 07 09 06 07 08 06 07 10 -30-34 10 12 08 11 12 09 08 09 0835-39 11 13 09 11 13 10 12 13 1040-44 14 18 11 14 18 11 16 22 1045-49 18 21 15 17 20 14 25 28 2350-54 22 26 17 21 26 17 23 25 2055-59 25 29 22 26 29 23 25 28 2260-64 35 43 27 35 44 27 34 41 2965-69 49 67 34 50 68 33 55 68 4570-74 65 85 48 68 89 51 49 66 3675-79 91 124 65 97 132 69 69 98 5080-84 105 147 75 112 156 80 76 92 6785+ 102 155 75 107 164 76 75 109 60
Table 1313Myeloid Leukemia
SEER Incidencea Rates Age-Adjusted and Age-Specific Rates by Race and Sex
SEE
R C
ancer Statistics Review
1975-2016N
ational Cancer Institute
a Based on End Results data from a series of hospital registries and one population-based registryb SEER 9 areas (San Francisco Connecticut Detroit Hawaii Iowa New Mexico Seattle Utah Atlanta)
Based on follow-up of patients into 2016 Expected survival rates are derived from the US Annual Life Tablesc SEER 18 areas (San Francisco Connecticut Detroit Hawaii Iowa New Mexico Seattle Utah Atlanta San Jose-Monterey
Los Angeles Alaska Native Registry Rural Georgia California excluding SFSJMLA Kentucky Louisiana New Jersey andGeorgia excluding ATLRG) Expected survival rates are derived from life tables by socio-economic status geography and racedeveloped by the SEER programBased on follow-up of patients into 2016
d Period survival provides a 2015 estimate of survival by piecing together the most recent conditional survival estimatesfrom several cohorts It is computed here using three year calendar blocks (2010-2012 0-1 year survival)(2009-2011 1-2 year survival) (2008-2010 2-3 year survival) (2007-2009 3-4 year survival) (2006-2008 4-5 years survival)
e The difference between 1975-1977 and 2009-2015 is statistically significant (plt05)f The standard error is between 5 and 10 percentage pointsg The standard error is greater than 10 percentage points- Statistic could not be calculated due to fewer than 25 cases during the time period
All Races Whites Blacks Total Males Females Total Males Females Total Males Females
5-Year Relative Survival (Percent)Year of Diagnosis1960-1963a - - - 14 - - - - -1970-1973a - - - 22 - - - - -1975-1977b 341 330 356 345 336 358 334 304 3671978-1980b 360 350 373 367 358 380 282 273 2931981-1983b 373 369 378 381 378 385 339 334 3431984-1986b 405 401 411 416 413 420 327 315 3411987-1989b 429 440 413 439 455 418 350 327 3781990-1992b 452 446 461 465 463 468 357 305 4131993-1995b 476 484 464 487 495 475 413 416 4091996-1998b 484 486 481 498 497 498 386 390 3801999-2001b 510 520 495 520 530 507 437 451 4212002-2004b 583 584 581 591 594 588 540 543 5342005-2008b 623 635 607 633 643 620 560 599 5112009-2015b 658e 673e 637e 668e 682e 649e 596e 609e 582e
5-Year Period Survival (Percent)cd
2015 632 643 619 634 640 624 582 617 544
5-Year Relative Survival (Percent) 2009-2015c
Age at DiagnosisAges lt45 762 758 768 773 764 786 677 677 677Ages 45-54 722 737 698 735 746 716 628 662 586Ages 55-64 693 699 683 704 707 698 589 605 566Ages 65-74 610 610 611 614 610 620 541 553 523Ages 75+ 421 424 417 427 428 425 337 357 316Ages lt65 729 731 725 739 738 741 637 650 621Ages 65+ 508 517 496 511 518 502 446 474 415
Table 1314Leukemia
5-Year Relative and Period Survival (Percent) by Race Sex Diagnosis Year and Age
SEE
R C
ancer Statistics Review
1975-2016N
ational Cancer Institute
a SEER 9 areas (San Francisco Connecticut Detroit Hawaii Iowa New Mexico Seattle Utah Atlanta)Based on follow-up of patients into 2016 Expected survival rates are derived from the US Annual Life Tables
b SEER 18 areas (San Francisco Connecticut Detroit Hawaii Iowa New Mexico Seattle Utah Atlanta San Jose-MontereyLos Angeles Alaska Native Registry Rural Georgia California excluding SFSJMLA Kentucky Louisiana New Jersey andGeorgia excluding ATLRG) Expected survival rates are derived from life tables by socio-economic status geography and racedeveloped by the SEER programBased on follow-up of patients into 2016
c Period survival provides a 2015 estimate of survival by piecing together the most recent conditional survival estimatesfrom several cohorts It is computed here using three year calendar blocks (2010-2012 0-1 year survival)(2009-2011 1-2 year survival) (2008-2010 2-3 year survival) (2007-2009 3-4 year survival) (2006-2008 4-5 years survival)
d The difference between 1975-1977 and 2009-2015 is statistically significant (plt05)e The standard error is between 5 and 10 percentage pointsf The standard error is greater than 10 percentage points- Statistic could not be calculated due to fewer than 25 cases during the time period
All Races Whites Blacks Total Males Females Total Males Females Total Males Females
Acute Lymphocytic Leukemia5-Year Relative Survival (Percent)Year of Diagnosis1975-1977a 406 369 456 408 374 457 335e - -1987-1989a 544 537 552 550 547 553 447e 420e 471e1990-1992a 580 545 631 577 549 620 571e 504e 633e1993-1995a 602 578 636 598 578 627 532e 459e 638e1996-1998a 655 644 669 664 643 690 556e 591e 502e1999-2001a 635 634 635 648 652 642 566e 503e 630e2002-2004a 673 661 689 676 666 691 645e 594e 697e2005-2008a 701 693 713 700 686 720 652 700 551e2009-2015a 717d 723d 710d 726d 737d 713d 625d 607 647e
5-Year Period Survival (Percent)bc2015 691 684 698 685 674 700 650 650 648
5-Year Relative Survival (Percent) 2009-2015bAge at DiagnosisAges lt45 806 795 821 807 791 828 763 757 770Ages 45-54 381 365 403 379 373 389 257e - -Ages 55-64 280 275 284 294 288 298 173e 228e -Ages 65-74 239 188 291 214 170 259 - - -Ages 75+ 91 97 83 100 96 100 00 - -Ages lt65 733 725 743 735 724 749 668 668 668Ages 65+ 174 151 196 166 141 191 154e - 189e
Chronic Lymphocytic Leukemia5-Year Relative Survival (Percent)Year of Diagnosis1975-1977a 671 647 703 679 654 711 569e 551e 590e1987-1989a 727 727 729 739 740 737 581 555e 615e1990-1992a 741 718 773 753 731 784 522 434e 609e1993-1995a 772 771 773 783 781 786 633 640e 621e1996-1998a 756 739 778 767 752 787 581 515e 660e1999-2001a 786 782 792 794 788 803 666 655e 666e2002-2004a 840 832 852 845 837 856 770 742e 807e2005-2008a 862 861 863 864 863 864 841 857 8122009-2015a 882d 887d 875d 886d 889d 883d 785d 801d 763
5-Year Period Survival (Percent)bc2015 856 855 858 853 848 860 772 818 710
5-Year Relative Survival (Percent) 2009-2015bAge at DiagnosisAges lt45 940 927 960 942 932 954 905e 879e -Ages 45-54 939 934 948 945 935 964 840 889 761eAges 55-64 922 916 933 924 916 938 836 831 843Ages 65-74 874 856 905 876 853 913 773 784 756Ages 75+ 731 727 736 729 724 734 584 586e 564eAges lt65 928 922 939 931 923 947 843 854 824Ages 65+ 801 796 807 799 792 807 691 713 662
Table 1315Lymphocytic Leukemia
5-Year Relative and Period Survival (Percent) by Race Sex Diagnosis Year and Age
SEE
R C
ancer Statistics Review
1975-2016N
ational Cancer Institute
a SEER 9 areas (San Francisco Connecticut Detroit Hawaii Iowa New Mexico Seattle Utah Atlanta)Based on follow-up of patients into 2016 Expected survival rates are derived from the US Annual Life Tables
b SEER 18 areas (San Francisco Connecticut Detroit Hawaii Iowa New Mexico Seattle Utah Atlanta San Jose-MontereyLos Angeles Alaska Native Registry Rural Georgia California excluding SFSJMLA Kentucky Louisiana New Jersey andGeorgia excluding ATLRG) Expected survival rates are derived from life tables by socio-economic status geography and racedeveloped by the SEER programBased on follow-up of patients into 2016
c Period survival provides a 2015 estimate of survival by piecing together the most recent conditional survival estimatesfrom several cohorts It is computed here using three year calendar blocks (2010-2012 0-1 year survival)(2009-2011 1-2 year survival) (2008-2010 2-3 year survival) (2007-2009 3-4 year survival) (2006-2008 4-5 years survival)
d The difference between 1975-1977 and 2009-2015 is statistically significant (plt05)e The standard error is between 5 and 10 percentage pointsf The standard error is greater than 10 percentage points- Statistic could not be calculated due to fewer than 25 cases during the time period
All Races Whites Blacks Total Males Females Total Males Females Total Males Females
Acute Myeloid Leukemia5-Year Relative Survival (Percent)Year of Diagnosis1975-1977a 62 55 70 58 54 62 101 82 1171987-1989a 115 92 141 113 97 132 92 44 157e1990-1992a 138 126 152 135 122 150 135 129 1391993-1995a 161 149 174 153 141 167 215 206e 2201996-1998a 170 159 183 156 145 171 221 252 1821999-2001a 192 188 197 187 176 199 193 248 1422002-2004a 234 209 264 232 208 260 253 265 2402005-2008a 249 235 265 242 228 257 239 193 2772009-2015a 294d 291d 298d 290d 284d 299d 292d 280d 301d
5-Year Period Survival (Percent)bc2015 286 278 294 282 276 289 283 262 301
5-Year Relative Survival (Percent) 2009-2015bAge at DiagnosisAges lt45 604 585 624 621 599 645 511 482 538Ages 45-54 441 439 444 456 450 463 337 342 336Ages 55-64 300 281 325 308 285 338 231 234 224Ages 65-74 139 137 141 145 144 146 103 78 131Ages 75+ 34 40 27 34 41 27 24 - 20Ages lt65 466 444 491 474 449 504 393 371 414Ages 65+ 79 85 72 82 89 73 64 58 71
Chronic Myeloid Leukemia5-Year Relative Survival (Percent)Year of Diagnosis1975-1977a 218 193 251 205 184 234 277e 216e 355e1987-1989a 303 306 298 301 310 290 333e 281e 413e1990-1992a 307 296 322 303 300 306 349e 255e 449e1993-1995a 355 353 358 352 351 352 356e 328e 402e1996-1998a 371 377 363 380 376 385 310 304e 314e1999-2001a 473 459 492 459 441 483 490e 496e 481e2002-2004a 543 530 561 526 514 541 630e 621e 640e2005-2008a 631 632 629 617 615 621 643 664e 608e2009-2015a 697d 681d 718d 690d 677d 707d 736d 711d 763d
5-Year Period Survival (Percent)bc2015 695 683 712 681 666 702 723 714 735
5-Year Relative Survival (Percent) 2009-2015bAge at DiagnosisAges lt45 899 889 913 916 905 934 797 786 812Ages 45-54 874 860 891 871 858 888 871 842 900Ages 55-64 776 748 816 781 750 826 698 676e 719eAges 65-74 611 579 656 609 578 654 584e 526e 637eAges 75+ 326 305 346 321 302 336 362e 362f 362eAges lt65 851 836 873 856 839 883 790 773 808Ages 65+ 462 444 484 456 441 475 495 471e 515e
Table 1316Myeloid Leukemia
5-Year Relative and Period Survival (Percent) by Race Sex Diagnosis Year and Age
SEE
R C
ancer Statistics Review
1975-2016N
ational Cancer Institute
a Based on the SEER 9 areas (San Francisco Connecticut Detroit Hawaii Iowa New Mexico Seattle Utah and Atlanta)Expected survival rates are derived from the US Annual Life Tables
1975- 1980- 1985- 1990-1979 1984 1989 1994 1995 1996 1997 1998 1999 2000 2001 2002 2003 2004 2005 2006 2007 2008 2009 2010 2011 2012 2013 2014 2015
Survival Time
1-year 608 626 648 669 681 682 679 667 659 669 706 722 732 751 742 765 769 766 774 783 794 791 790 791 8062-year 501 525 553 575 589 599 598 580 583 590 630 649 662 677 684 705 706 702 709 725 732 725 732 7343-year 437 465 496 528 543 554 549 541 547 551 590 619 624 643 647 673 676 665 684 692 703 692 6984-year 388 417 455 491 507 519 509 503 516 520 567 596 595 619 627 647 653 639 658 676 683 6735-year 346 376 423 461 481 487 483 482 484 499 543 578 575 596 610 626 637 619 635 659 6656-year 314 351 399 435 457 465 458 461 462 485 524 560 556 572 593 607 622 604 613 6477-year 291 325 371 409 442 451 438 446 444 473 510 544 537 560 579 591 614 587 6018-year 270 304 350 388 417 438 432 431 430 457 496 535 519 546 561 573 603 5769-year 250 285 330 373 406 420 418 421 421 449 483 519 507 530 546 561 59310-year 237 269 316 360 390 406 406 410 406 438 471 504 489 515 532 54511-year 224 257 299 347 378 398 387 397 392 426 459 492 473 499 52712-year 212 246 288 336 371 387 377 390 383 419 449 483 460 49213-year 204 236 280 327 367 382 370 380 372 404 442 466 45414-year 198 229 272 318 356 371 368 370 367 392 434 45615-year 192 223 267 313 353 361 362 358 359 383 42316-year 185 214 261 306 350 359 361 350 353 37417-year 181 207 256 300 340 355 352 346 34718-year 177 201 253 294 330 351 346 34319-year 171 195 248 291 326 343 34420-year 166 191 244 286 319 338
Table 1317Leukemia
SEERa Relative Survival (Percent)By Year of Diagnosis
All Races Males and Females
Year of Diagnosis
SEE
R C
ancer Statistics Review
1975-2016N
ational Cancer Institute
a Based on the SEER 9 areas (San Francisco Connecticut Detroit Hawaii Iowa New Mexico Seattle Utah and Atlanta)Expected survival rates are derived from the US Annual Life Tables
1975- 1980- 1985- 1990-1979 1984 1989 1994 1995 1996 1997 1998 1999 2000 2001 2002 2003 2004 2005 2006 2007 2008 2009 2010 2011 2012 2013 2014 2015
Survival Time
1-year 604 628 655 679 692 697 688 667 668 688 729 731 742 767 761 770 780 775 791 793 806 797 803 812 8172-year 494 524 561 583 604 616 611 585 590 608 648 652 669 687 701 706 719 716 727 740 746 733 749 7513-year 427 460 499 532 556 573 552 546 552 573 608 624 627 653 664 674 689 679 699 712 719 698 7144-year 377 411 459 494 516 535 505 505 520 539 581 598 601 627 650 648 667 650 677 690 697 6775-year 334 371 429 462 482 495 479 484 480 523 553 573 578 602 630 626 653 632 656 673 6846-year 303 343 404 435 452 471 459 461 461 508 529 554 557 575 609 602 635 615 631 6617-year 277 318 373 409 439 458 438 444 439 498 514 531 535 564 594 588 625 595 6168-year 254 294 354 385 417 446 430 430 423 478 500 520 514 549 572 563 616 5839-year 232 275 332 371 404 423 421 419 415 464 486 507 501 526 553 548 60510-year 219 260 317 358 382 407 413 410 401 454 473 490 479 511 539 52611-year 205 249 302 346 377 398 391 393 383 444 461 474 464 496 53312-year 193 242 290 334 371 390 380 384 375 437 452 467 455 49113-year 186 234 283 325 367 389 373 369 363 420 442 455 44714-year 179 227 277 315 357 379 370 358 357 410 433 44715-year 175 221 269 309 352 371 365 349 351 399 42216-year 168 212 263 303 347 369 360 341 346 38717-year 164 204 260 296 339 366 348 335 34318-year 159 199 257 290 324 364 345 33119-year 154 192 253 288 322 355 34120-year 146 187 249 283 316 347
Table 1318Leukemia
SEERa Relative Survival (Percent)By Year of Diagnosis
All Races Males
Year of Diagnosis
SEE
R C
ancer Statistics Review
1975-2016N
ational Cancer Institute
a Based on the SEER 9 areas (San Francisco Connecticut Detroit Hawaii Iowa New Mexico Seattle Utah and Atlanta)Expected survival rates are derived from the US Annual Life Tables
1975- 1980- 1985- 1990-1979 1984 1989 1994 1995 1996 1997 1998 1999 2000 2001 2002 2003 2004 2005 2006 2007 2008 2009 2010 2011 2012 2013 2014 2015
Survival Time
1-year 613 623 638 655 665 664 666 667 646 643 675 710 719 729 715 759 755 754 751 769 778 782 772 761 7912-year 509 527 542 564 569 578 580 574 573 564 606 645 653 664 660 705 689 684 684 705 714 716 709 7093-year 450 471 492 523 525 529 544 534 539 522 564 612 619 628 624 673 657 647 663 666 681 685 6774-year 402 424 449 485 495 498 514 500 511 494 548 594 587 608 595 646 633 624 633 658 664 6685-year 361 384 414 459 480 475 489 479 489 466 530 584 570 588 582 627 615 601 607 641 6396-year 328 360 392 435 464 457 456 461 463 455 516 567 556 569 572 613 602 589 588 6297-year 309 334 367 410 447 443 438 448 450 438 504 561 539 556 558 594 598 575 5798-year 290 316 344 391 416 428 433 433 438 428 490 556 526 542 546 585 582 5639-year 273 299 326 376 409 416 413 424 429 428 477 535 515 534 535 576 57610-year 259 281 315 364 399 405 396 409 414 416 468 522 502 521 521 56811-year 247 269 295 347 378 398 383 403 403 401 456 515 486 503 51812-year 235 250 285 338 372 382 373 397 393 395 445 505 468 49313-year 228 239 276 329 365 373 366 392 385 383 442 481 46314-year 220 232 267 323 355 361 363 385 380 367 434 46815-year 214 225 264 318 353 348 359 369 368 363 42416-year 206 217 258 310 353 344 359 361 363 35817-year 201 210 252 305 342 340 357 358 35018-year 198 205 248 301 336 334 347 35819-year 193 198 241 296 330 326 34620-year 190 195 238 290 321 323
Table 1319Leukemia
SEERa Relative Survival (Percent)By Year of Diagnosis
All Races Females
Year of Diagnosis
SEE
R C
ancer Statistics Review
1975-2016N
ational Cancer Institute
Devcan 677 April 2019 National Cancer Institute (httpssurveillancecancergovdevcan)Source Incidence data are from the SEER 21 areas (San Francisco Connecticut Detroit Hawaii Iowa New Mexico Seattle Utah Atlanta
San Jose-Monterey Los Angeles Alaska Native Registry Rural Georgia California excluding SFSJMLA Kentucky Louisiana New JerseyGeorgia excluding ATLRG Idaho New York and Massachusetts) Mortality data are from the NCHS public use data file for the total US
a Underlying incidence and mortality data for American IndianAlaska Native are based on the PRCDA(PurchasedReferred Care DeliveryAreas) counties
b Hispanic is not mutually exclusive from whites blacks AsianPacific Islanders and American IndiansAlaska NativesUnderlying incidence data for Hispanics are based on NHIA and exclude cases from the Alaska Native Registry
- Statistic could not be calculatedA percent of 000 represents a value that is below 0005
Risk of Being Risk of Being
Race Current Diagnosed with Cancer Risk of Dying Race Current Diagnosed with Cancer Risk of Dying
Ethnicity Age +10 yrs +20 yrs +30 yrs Ever from Cancer Ethnicity Age +10 yrs +20 yrs +30 yrs Ever from Cancer
All Races 0 006 009 012 156 082 Asian 0 005 008 011 099 058
10 003 006 010 152 082 Pacific 10 003 006 009 095 058
20 003 007 014 149 082 Islander 20 003 006 010 092 058
30 004 011 026 147 082 30 003 008 016 090 057
40 007 022 051 145 082 40 004 012 026 087 057
50 015 045 089 141 082 50 008 022 047 083 056
60 031 079 121 134 082 60 014 040 066 078 054
70 053 101 - 115 080 70 028 055 - 067 051
80 062 - - 082 068 80 032 - - 047 040
White 0 006 010 013 164 085 American 0 005 007 009 085 040
10 003 007 011 159 086 Indian 10 002 004 008 081 040
20 003 007 014 156 085 Alaska 20 002 006 010 079 039
30 004 011 027 155 085 Nativea 30 004 008 019 078 039
40 007 023 053 153 085 40 004 015 030 076 040
50 016 047 095 149 086 50 012 027 051 075 040
60 033 083 127 141 086 60 017 042 061 068 040
70 057 106 - 121 084 70 029 051 - 058 038
80 066 - - 086 071 80 029 - - 038 025
Black 0 003 006 008 107 058 Hispanicb 0 007 011 015 124 066
10 002 005 009 105 059 10 005 008 012 118 066
20 003 006 013 104 059 20 004 008 014 114 065
30 004 011 022 102 058 30 004 010 021 111 064
40 007 019 041 100 058 40 006 017 037 108 064
50 013 035 066 097 058 50 011 031 063 104 063
60 025 058 083 091 058 60 021 054 085 097 062
70 039 069 - 079 057 70 037 070 - 083 058
80 042 - - 056 048 80 042 - - 058 049
Table 1320
Leukemia
Risk of Being Diagnosed With Cancer in 10 20 and 30 Years
Lifetime Risk of Being Diagnosed with Cancer Given Alive and Cancer-Free at Current Age and
Lifetime Risk of Dying from Cancer Given Alive at Current Age
Both Sexes 2014-2016 By RaceEthnicity
SEE
R C
ancer Statistics Review
1975-2016N
ational Cancer Institute
Devcan 677 April 2019 National Cancer Institute (httpssurveillancecancergovdevcan)Source Incidence data are from the SEER 21 areas (San Francisco Connecticut Detroit Hawaii Iowa New Mexico Seattle Utah Atlanta
San Jose-Monterey Los Angeles Alaska Native Registry Rural Georgia California excluding SFSJMLA Kentucky Louisiana New JerseyGeorgia excluding ATLRG Idaho New York and Massachusetts) Mortality data are from the NCHS public use data file for the total US
a Underlying incidence and mortality data for American IndianAlaska Native are based on the PRCDA(PurchasedReferred Care DeliveryAreas) counties
b Hispanic is not mutually exclusive from whites blacks AsianPacific Islanders and American IndiansAlaska NativesUnderlying incidence data for Hispanics are based on NHIA and exclude cases from the Alaska Native Registry
- Statistic could not be calculatedA percent of 000 represents a value that is below 0005
Risk of Being Risk of Being
Race Current Diagnosed with Cancer Risk of Dying Race Current Diagnosed with Cancer Risk of Dying
Ethnicity Age +10 yrs +20 yrs +30 yrs Ever from Cancer Ethnicity Age +10 yrs +20 yrs +30 yrs Ever from Cancer
All Races 0 006 010 013 186 096 Asian 0 005 009 011 119 072
10 004 007 012 182 097 Pacific 10 004 007 010 115 072
20 003 008 016 179 097 Islander 20 003 007 012 111 071
30 005 013 030 177 097 30 004 009 019 109 071
40 008 026 062 176 098 40 005 015 033 106 070
50 018 056 112 173 099 50 010 028 062 102 069
60 040 101 152 166 101 60 019 054 084 096 068
70 071 129 - 146 101 70 038 071 - 084 065
80 082 - - 105 088 80 040 - - 056 052
White 0 007 011 014 195 101 American 0 006 009 011 110 048
10 004 008 012 190 102 Indian 10 003 005 010 105 048
20 004 008 016 187 101 Alaska 20 002 007 011 103 048
30 005 013 031 186 101 Nativea 30 005 009 021 103 048
40 009 027 065 184 102 40 005 017 041 102 049
50 019 058 118 181 103 50 013 039 075 102 051
60 042 107 160 174 106 60 028 067 087 097 051
70 075 136 - 153 105 70 046 070 - 081 049
80 087 - - 110 091 80 034 - - 049 030
Black 0 003 006 008 122 065 Hispanicb 0 007 013 017 141 080
10 003 006 009 122 066 10 005 010 015 135 080
20 003 006 014 120 065 20 005 009 016 130 079
30 004 011 025 119 066 30 005 011 023 127 078
40 008 022 048 118 066 40 007 018 040 124 078
50 015 042 079 115 067 50 012 034 072 120 078
60 031 071 102 112 068 60 024 064 100 114 078
70 051 089 - 101 068 70 046 086 - 102 077
80 058 - - 077 061 80 053 - - 074 070
Table 1321
Leukemia
Risk of Being Diagnosed With Cancer in 10 20 and 30 Years
Lifetime Risk of Being Diagnosed with Cancer Given Alive and Cancer-Free at Current Age and
Lifetime Risk of Dying from Cancer Given Alive at Current Age
Males 2014-2016 By RaceEthnicity
SEE
R C
ancer Statistics Review
1975-2016N
ational Cancer Institute
Devcan 677 April 2019 National Cancer Institute (httpssurveillancecancergovdevcan)Source Incidence data are from the SEER 21 areas (San Francisco Connecticut Detroit Hawaii Iowa New Mexico Seattle Utah Atlanta
San Jose-Monterey Los Angeles Alaska Native Registry Rural Georgia California excluding SFSJMLA Kentucky Louisiana New JerseyGeorgia excluding ATLRG Idaho New York and Massachusetts) Mortality data are from the NCHS public use data file for the total US
a Underlying incidence and mortality data for American IndianAlaska Native are based on the PRCDA(PurchasedReferred Care DeliveryAreas) counties
b Hispanic is not mutually exclusive from whites blacks AsianPacific Islanders and American IndiansAlaska NativesUnderlying incidence data for Hispanics are based on NHIA and exclude cases from the Alaska Native Registry
- Statistic could not be calculatedA percent of 000 represents a value that is below 0005
Risk of Being Risk of Being
Race Current Diagnosed with Cancer Risk of Dying Race Current Diagnosed with Cancer Risk of Dying
Ethnicity Age +10 yrs +20 yrs +30 yrs Ever from Cancer Ethnicity Age +10 yrs +20 yrs +30 yrs Ever from Cancer
All Races 0 006 008 011 129 068 Asian 0 005 008 010 083 048
10 003 005 009 125 069 Pacific 10 003 005 008 078 047
20 003 006 012 122 068 Islander 20 002 005 009 075 047
30 003 009 021 120 068 30 003 006 013 073 046
40 006 018 039 118 068 40 004 010 021 071 046
50 012 034 068 114 067 50 007 017 035 068 045
60 023 059 093 106 067 60 011 029 051 063 044
70 039 077 - 091 064 70 019 042 - 054 040
80 048 - - 066 055 80 026 - - 040 033
White 0 006 009 011 135 071 American 0 003 005 007 061 031
10 003 005 009 131 071 Indian 10 002 003 007 058 031
20 003 006 012 128 071 Alaska 20 002 005 008 056 031
30 003 010 022 126 071 Nativea 30 004 007 017 055 031
40 006 019 042 124 070 40 003 014 020 053 031
50 013 036 072 120 070 50 011 017 030 051 031
60 024 062 099 112 069 60 007 021 038 042 030
70 042 081 - 096 067 70 015 035 - 039 029
80 051 - - 069 057 80 025 - - 030 022
Black 0 004 006 008 095 053 Hispanicb 0 006 010 013 110 056
10 002 004 008 093 054 10 004 007 010 105 056
20 002 006 012 091 053 20 003 006 012 101 055
30 004 010 020 089 053 30 003 009 019 099 054
40 006 016 035 087 053 40 006 016 034 096 054
50 011 029 054 083 052 50 010 028 055 091 052
60 020 047 069 077 051 60 019 046 073 084 050
70 030 055 - 065 049 70 030 059 - 070 046
80 033 - - 046 042 80 035 - - 048 037
Table 1322
Leukemia
Risk of Being Diagnosed With Cancer in 10 20 and 30 Years
Lifetime Risk of Being Diagnosed with Cancer Given Alive and Cancer-Free at Current Age and
Lifetime Risk of Dying from Cancer Given Alive at Current Age
Females 2014-2016 By RaceEthnicity
SEER Cancer Statistics Review 1975-2016 National Cancer Institute
The AAPC is the Average Annual Percent Change over the time interval The AAPCs are calculated bythe Joinpoint Regression Program Version 47 February 2019 National Cancer Institute
- Statistic not shown Rate based on less than 16 cases for the time intervalTrend based on less than 10 cases for at least one year within the time interval
a Rates are age-adjusted to the 2000 US Std Population (19 age groups - Census P25-1130) Trendsare based on rates age-adjusted to the 2000 US Std Population (19 age groups - Census P25-1130)
b The SEER 9 areas are San Francisco Connecticut Detroit Hawaii Iowa New Mexico SeattleUtah and AtlantaThe SEER 21 areas comprise the SEER 9 areas plus San Jose-Monterey Los Angeles the AlaskaNative Registry Rural Georgia California excluding SFSJMLA Kentucky Louisiana New JerseyGeorgia excluding ATLRG Idaho New York and Massachusetts
c The 2007-2016 AAPC estimates are based on a Joinpoint analysis with up to 3 Joinpoints overdiagnosis years 2000-2016
d The 2007-2016 AAPC estimates are based on a Joinpoint analysis with up to 5 Joinpoints overdiagnosis years 1975-2016
e Hispanic and Non-Hispanic are not mutually exclusive from whites blacks AsianPacificIslanders and American IndiansAlaska Natives Incidence data for Hispanics and Non-Hispanicsare based on NHIA and exclude cases from the Alaska Native Registry
f Incidence data for American IndianAlaska Native are based on the PurchasedReferred CareDelivery Area (PRCDA) counties
g US Mortality Files National Center for Health Statistics CDCh The 2007-2016 mortality AAPCs are based on a Joinpoint analysis using years of death 2000-2016 The APC is significantly different from zero (plt05)
SEER Incidence SEER 21 Areasb SEER 21 Areasb SEER 9 Areasb
Rate 2012-2016 Trend 2007-2016c Trend 2007-2016d
Rate per 100000 persons AAPC () AAPC ()
Total Males Females Total Males Females Total Males Females RaceEthnicity
All Races 141 181 109 -04 -02 -06 -03 02 03
White 149 191 115 -05 -05 -07 04 03 05White Hispanice 112 134 94 01 -02 03 - - -White Non-Hispanice 153 197 116 -05 -05 -08 - - -
Black 109 139 89 06 02 07 01 01 02
AsianPacific Islander 78 97 63 01 00 02 - - -
Amer IndAlaska Natf 86 110 66 08 21 -01 - - -
Hispanice 108 130 91 02 00 03 - - -
US Mortalityg Rate 2012-2016 Trend 2007-2016h
Rate per 100000 persons AAPC ()
Total Males Females Total Males FemalesRaceEthnicity
All Races 65 88 49 -16 -17 -13
White 68 91 51 -14 -16 -12White Hispanice 50 63 41 -07 -08 -06White Non-Hispanice 69 93 51 -14 -15 -12
Black 55 72 44 -15 -17 -15
AsianPacific Islander 36 47 28 -18 -07 -23
Amer IndAlaska NatTotal US 31 42 23 -22 -09 -36PRCDA Counties 41 54 30 -16 -05 -28Non-PRCDA Counties 20 28 15 -31 -13 -50
Hispanice 47 60 38 -08 -09 -07
Table 1323Leukemia
SEER Incidence and US MortalityAge-Adjusted Rates and Trendsa
By RaceEthnicity and Sex
SEE
R C
ancer Statistics Review
1975-2016N
ational Cancer Institute
a Rates are per 100000 and are age-adjusted to the 2000 US Std Population (19 age groups - Census P25-1130)b The SEER 9 areas are San Francisco Connecticut Detroit Hawaii Iowa New Mexico Seattle Utah and Atlanta
The SEER 13 areas comprise the SEER 9 areas plus San Jose-Monterey Los Angeles the Alaska Native Registry and Rural GeorgiaThe SEER 18 areas comprise the SEER 13 areas plus California excluding SFSJMLA Kentucky Louisiana New Jersey and Georgiaexcluding ATLRGThe SEER 21 areas comprise the SEER 18 areas plus Idaho New York and Massachusetts
- Statistic not shown Rate based on less than 16 cases for the time interval
All Races Whites Blacks Total Males Females Total Males Females Total Males Females
SEER Incidence Ratesa 2012-2016
California 1239 1590 949 1337 1715 1020 1039 1334 813Greater Bay Area 1231 1619 915 1400 1844 1028 1098 1406 859San Francisco-Oakland 1212 1596 906 1389 1823 1034 1077 1336 881San Jose-Monterey 1259 1651 925 1410 1869 1011 1239 1787 -
Los Angeles 1173 1469 933 1291 1622 1016 1050 1294 884Greater California 1271 1633 968 1334 1709 1017 1007 1338 729
Connecticut 1406 1768 1117 1431 1790 1142 976 1126 867Detroit 1584 2050 1230 1707 2222 1300 1204 1485 1018Georgia 1430 1841 1120 1537 1970 1189 1139 1487 935Atlanta 1382 1819 1064 1563 2017 1207 1138 1557 884Rural Georgia 1411 1586 1206 1510 1773 1196 1248 - 1236Greater Georgia 1455 1863 1144 1531 1965 1182 1140 1450 968
Hawaii 1073 1339 843 1388 1612 1139 - - -Idaho 1588 1950 1263 1604 1973 1272 - - -Iowa 1627 2127 1222 1630 2133 1221 1416 1743 1076Kentucky 1566 1983 1234 1577 1995 1241 1159 1446 922Louisiana 1405 1789 1104 1518 1918 1197 1103 1393 890Massachusetts 1108 1429 854 1118 1448 856 787 1050 620New Jersey 1524 1962 1188 1541 1982 1199 1136 1469 928New Mexico 1299 1550 1086 1310 1556 1101 1045 - -New York 1623 2119 1244 1752 2281 1335 1068 1360 887Seattle-Puget Sound 1568 2020 1188 1634 2084 1249 1486 1929 1077Utah 1375 1793 1009 1401 1825 1029 - - -
SEER 9 Areasb 1419 1823 1094 1521 1945 1171 1154 1460 941SEER 13 Areasb 1357 1737 1049 1473 1882 1134 1126 1419 922SEER 18 Areasb 1376 1761 1066 1461 1867 1127 1114 1414 907SEER 21 Areasb 1407 1807 1088 1491 1912 1147 1089 1386 889
Table 1324Leukemia
Age-Adjusted SEER Incidence Ratesa
By Registry Race and Sex
SEE
R C
ancer Statistics Review
1975-2016N
ational Cancer Institute
a US Mortality Files National Center for Health Statistics Centers for Disease Control and PreventionRates are per 100000 and are age-adjusted to the 2000 US Std Population (19 age groups - Census P25-1130)
b The SEER 9 areas are San Francisco Connecticut Detroit Hawaii Iowa New Mexico Seattle Utah and AtlantaThe SEER 13 areas comprise the SEER 9 areas plus San Jose-Monterey Los Angeles the Alaska Native Registry and Rural GeorgiaThe SEER 18 areas comprise the SEER 13 areas plus California excluding SFSJMLA Kentucky Louisiana New Jersey and Georgiaexcluding ATLRGThe SEER 21 areas comprise the SEER 18 areas plus Idaho New York and Massachusetts
- Statistic not shown Rate based on less than 16 cases for the time interval
All Races Whites Blacks Total Males Females Total Males Females Total Males Females
SEER Death Ratesa 2012-2016
California 617 811 470 671 885 507 560 711 461Greater Bay Area 563 759 419 640 869 470 551 742 424San Francisco-Oakland 551 753 405 631 871 455 544 726 421San Jose-Monterey 584 768 446 653 863 495 604 - -
Los Angeles 608 797 468 675 894 513 571 717 483Greater California 639 835 489 677 886 515 553 687 458
Connecticut 622 837 465 639 862 474 536 665 449Detroit 662 915 485 691 967 494 573 723 475Georgia 614 817 467 642 855 478 538 706 438Atlanta 568 757 437 615 802 483 487 658 374Rural Georgia 581 628 538 579 635 - - - -Greater Georgia 639 851 482 654 879 477 576 745 483
Hawaii 463 593 362 543 632 440 - - -Idaho 655 846 497 661 865 492 - - -Iowa 693 961 498 700 963 508 - - -Kentucky 742 949 592 750 953 603 633 894 455Louisiana 677 906 514 705 953 520 603 776 498Massachusetts 622 830 478 647 869 490 463 524 444New Jersey 615 810 478 657 871 504 474 549 429New Mexico 560 759 400 589 794 421 - - -New York 621 842 466 675 910 506 450 602 356Seattle-Puget Sound 618 795 481 637 807 503 708 975 499Utah 679 865 526 693 876 542 - - -
SEER 9 Areasb 610 818 457 651 869 487 540 711 427SEER 13 Areasb 609 810 460 658 874 494 544 708 437SEER 18 Areasb 630 832 480 671 887 508 552 705 455SEER 21 Areasb 628 834 477 670 889 506 520 670 426
Total US 654 876 489 681 912 506 550 721 439
Table 1325Leukemia
Age-Adjusted SEER Death Ratesa
By Registry Race and Sex
SEER Cancer Statistics Review 1975-2016 National Cancer Institute
a US Mortality Files National Center for Health Statistics Centers for Disease Control andPrevention Rates are per 100000 and are age-adjusted to the 2000 US Std Population (19age groups - Census P25-1130)
b Difference between state rate and total US rate is statistically significant (plt=0002)c Absolute percent difference between state rate and total US rate is 15 or mored Rank of state level death rate and the 95 confidence intervals (low high) for the rankSE Standard error of the ratePD Percent difference between state rate and total US rate- Statistic not shown Rate based on less than 16 cases for the time interval
State Rate SE Rank(CI)d PD TOTAL US 654 002
High Five StatesOklahoma 790 019 01(0108) 2083c
West Virginia 749 025 02(0123) 1449South Dakota 747 040 03(0133) 1415Kentucky 742 018 04(0116) 1352Kansas 742 022 05(0122) 1350
Low Five StatesColorado 609 016 47(2649) -692Alaska 596 050 48(0451) -885New Mexico 560 022 49(3650) -1430DC 504 041 50(3251) -2293c
Hawaii 463 024 51(4951) -2913c
State Rate SE Rank(CI)d PD State Rate SE Rank(CI)d PD
Alabama 689 016 17(0532) 533 Montana 613 032 45(0950) -634Alaska 596 050 48(0451) -885 Nebraska 718 026 10(0131) 983Arizona 632 013 36(2248) -329 Nevada 644 021 28(1148) -157Arkansas 719 021 09(0127) 993 New Hampshire 638 029 31(0749) -238California 617 006 42(3248) -572 New Jersey 615 011 43(2849) -592Colorado 609 016 47(2649) -692 New Mexico 560 022 49(3650) -1430Connecticut 622 017 40(2249) -490 New York 621 007 41(2948) -499Delaware 664 035 24(0249) 152 North Carolina 634 011 34(2347) -310DC 504 041 50(3251) -2293c North Dakota 656 040 26(0249) 029Florida 630 007 38(2645) -370 Ohio 694 010 13(0626) 608Georgia 614 012 44(2849) -604 Oklahoma 790 019 01(0108) 2083c
Hawaii 463 024 51(4951) -2913c Oregon 632 017 37(1948) -331Idaho 655 028 27(0548) 012 Pennsylvania 680 009 21(1029) 396Illinois 684 010 19(0928) 463 Rhode Island 656 033 25(0349) 037Indiana 719 014 08(0222) 994 South Carolina 682 016 20(0634) 435Iowa 693 019 14(0334) 604 South Dakota 747 040 03(0133) 1415Kansas 742 022 05(0122) 1350 Tennessee 702 014 12(0327) 729Kentucky 742 018 04(0116) 1352 Texas 640 007 30(2342) -215Louisiana 677 017 23(0637) 356 Utah 679 024 22(0346) 387Maine 638 027 32(0949) -240 Vermont 636 041 33(0350) -277Maryland 633 014 35(2148) -323 Virginia 611 012 46(2849) -661Massachusetts 622 013 39(2548) -482 Washington 640 013 29(2047) -209Michigan 685 011 18(0829) 476 West Virginia 749 025 02(0123) 1449Minnesota 691 015 16(0430) 564 Wisconsin 727 015 06(0219) 1110Mississippi 692 021 15(0337) 580 Wyoming 721 049 07(0148) 1028Missouri 711 014 11(0324) 874
Table 1326Leukemia
Age-Adjusted Cancer Deatha Rates By State All Races 2012-2016
Males and Females
SEER Cancer Statistics Review 1975-2016 National Cancer Institute
a US Mortality Files National Center for Health Statistics Centers for Disease Control andPrevention Rates are per 100000 and are age-adjusted to the 2000 US Std Population (19age groups - Census P25-1130)
b Difference between state rate and total US rate is statistically significant (plt=0002)c Absolute percent difference between state rate and total US rate is 15 or mored Rank of state level death rate and the 95 confidence intervals (low high) for the rankSE Standard error of the ratePD Percent difference between state rate and total US rate- Statistic not shown Rate based on less than 16 cases for the time interval
State Rate SE Rank(CI)d PD TOTAL US 876 003
High Five StatesOklahoma 1022 034 01(0120) 1669c
Kansas 1018 039 02(0123) 1625c
Arkansas 991 037 03(0127) 1309South Dakota 985 068 04(0147) 1249Delaware 984 065 05(0144) 1236
Low Five StatesMontana 795 053 47(1150) -921New Mexico 759 039 48(2650) -1336Alaska 711 081 49(0851) -1887c
DC 704 078 50(1051) -1959c
Hawaii 593 040 51(4951) -3228c
State Rate SE Rank(CI)d PD State Rate SE Rank(CI)d PD
Alabama 939 029 17(0233) 725 Montana 795 053 47(1150) -921Alaska 711 081 49(0851) -1887c Nebraska 958 046 12(0141) 935Arizona 827 022 41(2449) -555 Nevada 858 037 33(0849) -210Arkansas 991 037 03(0127) 1309 New Hampshire 884 051 25(0149) 088California 811 010 43(3348) -738 New Jersey 810 020 44(2749) -747Colorado 834 028 39(2049) -484 New Mexico 759 039 48(2650) -1336Connecticut 837 031 37(1549) -441 New York 842 013 35(2546) -387Delaware 984 065 05(0144) 1236 North Carolina 863 020 31(1945) -149DC 704 078 50(1051) -1959c North Dakota 873 070 27(0150) -030Florida 839 012 36(2645) -422 Ohio 931 018 19(0529) 627Georgia 817 021 42(2649) -677 Oklahoma 1022 034 01(0120) 1669c
Hawaii 593 040 51(4951) -3228c Oregon 866 029 29(1147) -112Idaho 846 047 34(0550) -339 Pennsylvania 912 016 21(0931) 416Illinois 928 018 20(0529) 594 Rhode Island 911 059 22(0149) 400Indiana 960 025 11(0127) 959 South Carolina 951 029 13(0131) 853Iowa 961 035 08(0131) 969 South Dakota 985 068 04(0147) 1249Kansas 1018 039 02(0123) 1625c Tennessee 960 025 10(0127) 959Kentucky 949 031 15(0133) 832 Texas 870 013 28(2139) -069Louisiana 906 030 23(0442) 342 Utah 865 041 30(0549) -122Maine 803 046 46(1450) -836 Vermont 874 074 26(0150) -026Maryland 861 026 32(1447) -176 Virginia 809 021 45(2650) -770Massachusetts 830 023 40(2349) -529 Washington 835 023 38(2248) -463Michigan 937 020 18(0428) 702 West Virginia 972 044 06(0135) 1095Minnesota 948 027 16(0229) 826 Wisconsin 960 026 09(0127) 961Mississippi 970 039 07(0132) 1077 Wyoming 885 081 24(0150) 102Missouri 951 025 14(0228) 852
Table 1327Leukemia
Age-Adjusted Cancer Deatha Rates By State All Races 2012-2016
Males
SEER Cancer Statistics Review 1975-2016 National Cancer Institute
a US Mortality Files National Center for Health Statistics Centers for Disease Control andPrevention Rates are per 100000 and are age-adjusted to the 2000 US Std Population (19age groups - Census P25-1130)
b Difference between state rate and total US rate is statistically significant (plt=0002)c Absolute percent difference between state rate and total US rate is 15 or mored Rank of state level death rate and the 95 confidence intervals (low high) for the rankSE Standard error of the ratePD Percent difference between state rate and total US rate- Statistic not shown Rate based on less than 16 cases for the time interval
State Rate SE Rank(CI)d PD TOTAL US 489 002
High Five StatesOklahoma 615 023 01(0108) 2584c
Wyoming 596 060 02(0147) 2194c
Kentucky 592 021 03(0111) 2126c
West Virginia 576 030 04(0126) 1792c
South Dakota 564 047 05(0145) 1551c
Low Five StatesColorado 441 018 47(2250) -972Delaware 428 037 48(0751) -1247New Mexico 400 025 49(3151) -1803c
DC 381 046 50(1251) -2203c
Hawaii 362 029 51(4151) -2598c
State Rate SE Rank(CI)d PD State Rate SE Rank(CI)d PD
Alabama 512 019 18(0440) 483 Montana 452 037 43(0551) -745Alaska 485 062 27(0151) -073 Nebraska 531 030 10(0144) 864Arizona 473 015 31(1347) -308 Nevada 455 025 42(1150) -695Arkansas 516 024 15(0344) 554 New Hampshire 449 033 45(0651) -807California 470 007 34(2345) -383 New Jersey 478 013 30(1346) -223Colorado 441 018 47(2250) -972 New Mexico 400 025 49(3151) -1803c
Connecticut 465 020 40(1249) -487 New York 466 009 38(2246) -456Delaware 428 037 48(0751) -1247 North Carolina 471 012 32(1747) -350DC 381 046 50(1251) -2203c North Dakota 479 046 28(0151) -189Florida 460 008 41(2647) -582 Ohio 520 012 12(0529) 653Georgia 467 013 37(1747) -433 Oklahoma 615 023 01(0108) 2584c
Hawaii 362 029 51(4151) -2598c Oregon 449 019 44(1850) -799Idaho 497 033 22(0249) 174 Pennsylvania 516 011 14(0629) 556Illinois 514 011 16(0631) 526 Rhode Island 471 037 33(0351) -363Indiana 540 017 07(0226) 1052 South Carolina 495 018 23(0645) 133Iowa 498 022 20(0547) 200 South Dakota 564 047 05(0145) 1551c
Kansas 539 025 08(0137) 1032 Tennessee 517 016 13(0435) 590Kentucky 592 021 03(0111) 2126c Texas 467 008 36(2246) -431Louisiana 514 020 17(0442) 520 Utah 526 029 11(0146) 778Maine 508 032 19(0248) 403 Vermont 444 045 46(0351) -906Maryland 470 016 35(1448) -389 Virginia 465 014 39(1848) -474Massachusetts 478 015 29(1247) -220 Washington 487 016 25(0946) -022Michigan 498 013 21(0939) 192 West Virginia 576 030 04(0126) 1792c
Minnesota 494 017 24(0745) 121 Wisconsin 545 017 06(0225) 1162Mississippi 485 023 26(0548) -067 Wyoming 596 060 02(0147) 2194c
Missouri 535 017 09(0327) 953
Table 1328Leukemia
Age-Adjusted Cancer Deatha Rates By State All Races 2012-2016
Females
SEE
R C
ancer Statistics Review
1975-2016N
ational Cancer Institute
a US 2016 cancer prevalence counts are based on 2016 cancer prevalence proportions from the SEER 13 Areas (excluding the AlaskaNative Registry) and 112016 US population estimates based on the average of 2015 and 2016 population estimates from theUS Bureau of the CensusPrevalence was calculated using the first invasive tumor for each cancer site diagnosed during the previous 24 years
b Maximum limited-duration prevalence is 24 years for 1992-2016 datac Percentages are age-adjusted to the 2000 US Standard Population (19 age groups - Census P25-1130) by 5-year age groupsd Cases diagnosed more than 24 years ago were estimated using the completeness index method (Capocaccia et al 1997
Merrill et al 2000)e Complete prevalence is obtained by summing 0 to lt24 and gt=24- Statistic not shown Statistic based on fewer than 5 cases estimated alive in SEER for the time interval+ Not available
Years Since Diagnosis 0 to lt5 5 to lt10 10 to lt15 15 to lt20 20 to lt24 0 to lt24b gt=24d Completee
Race Sex All Races Both Sexes 153253 100309 63581 38012 21353 376508 38265 414773
Males 90192 57683 36029 21220 12020 217145 18411 235556Females 63061 42625 27552 16792 9333 159363 19854 179217
White Both Sexes 132173 87961 56051 33596 19035 328814 32999 370135Males 78368 50894 32033 18770 10845 190910 15102 210930Females 53805 37067 24018 14826 8190 137905 17897 159205
Black Both Sexes 12734 6564 4233 2487 1259 27277 4070 31347Males 6847 3556 2204 1334 637 14578 1776 16354Females 5887 3008 2029 1153 622 12699 2294 14992
Asian Both Sexes 3926 2561 1778 1164 690 10120 + +Pacific Males 2235 1462 936 646 351 5630 + +Islander Females 1691 1100 842 519 339 4490 + +
Hispanic Both Sexes 14464 9581 6796 4462 2630 37933 + +Males 8166 5374 3794 2408 1538 21280 + +Females 6298 4207 3002 2055 1092 16654 + +
Age Specific (Crude) Age-Adjustedc Age at Prevalence All Ages 0-9 10-19 20-29 30-39 40-49 50-59 60-69 70-79 80+ All Ages
Race Sex All Races Both Sexes 01168 00328 00640 00628 00377 00561 01053 02263 04023 05111 01054
Males 01369 00339 00706 00685 00419 00657 01287 02888 05282 07048 01306Females 00974 00317 00572 00570 00333 00466 00829 01696 02974 03919 00844
White Both Sexes 01304 00369 00715 00712 00410 00584 01106 02389 04249 05386 01127Males 01528 00379 00789 00771 00457 00682 01349 03042 05558 07387 01389Females 01084 00359 00637 00650 00362 00484 00869 01784 03135 04133 00904
Black Both Sexes 00605 00145 00322 00320 00267 00463 00752 01455 02470 03076 00660Males 00674 00142 00357 00338 00281 00530 00919 01737 03249 04580 00816Females 00541 00148 00286 00301 00255 00402 00605 01230 01927 02334 00552
Asian Both Sexes 00497 00264 00531 00426 00230 00390 00553 00882 01245 01389 00513Pacific Males 00577 00298 00555 00507 00249 00461 00665 01122 01552 01904 00613Islander Females 00423 00228 00507 00345 00212 00327 00456 00688 00999 01057 00430
Hispanic Both Sexes 00664 00375 00737 00728 00395 00485 00723 01191 01987 02074 00746Males 00737 00397 00827 00807 00471 00576 00831 01350 02221 02551 00854Females 00589 00352 00642 00641 00312 00391 00617 01050 01809 01780 00647
Table 1329Leukemia
Estimated United States Cancer Prevalence Countsa on January 1 2016By RaceEthnicity Sex and Years Since Diagnosis
Estimated prevalence percenta on January 1 2016 of the SEER population diagnosed in the previous 24 yearsBy Age at Prevalence RaceEthnicity and Sex
SEE
R C
ancer Statistics Review
1975-2016N
ational Cancer Institute
a US 2016 cancer prevalence counts are based on 2016 cancer prevalence proportions from the SEER 13 Areas (excluding the AlaskaNative Registry) and 112016 US population estimates based on the average of 2015 and 2016 population estimates from theUS Bureau of the CensusPrevalence was calculated using the first invasive tumor for each cancer site diagnosed during the previous 24 years
b Maximum limited-duration prevalence is 24 years for 1992-2016 datac Percentages are age-adjusted to the 2000 US Standard Population (19 age groups - Census P25-1130) by 5-year age groupsd Cases diagnosed more than 24 years ago were estimated using the completeness index method (Capocaccia et al 1997
Merrill et al 2000)e Complete prevalence is obtained by summing 0 to lt24 and gt=24- Statistic not shown Statistic based on fewer than 5 cases estimated alive in SEER for the time interval+ Not available
Years Since Diagnosis 0 to lt5 5 to lt10 10 to lt15 15 to lt20 20 to lt24 0 to lt24b gt=24d Completee
Race Sex All Races Both Sexes 20277 16033 13721 12074 8203 70308 25456 95764
Males 11203 9049 7751 6542 4634 39179 12997 52176Females 9074 6984 5971 5531 3568 31129 12460 43589
White Both Sexes 17123 13855 11870 10663 7154 60665 21823 83282Males 9549 7741 6768 5696 4084 33839 11286 45559Females 7573 6114 5102 4967 3070 26826 10537 37723
Black Both Sexes 1590 1133 923 727 553 4926 1609 6535Males 809 734 473 411 290 2716 592 3308Females 781 399 450 317 263 2210 1017 3227
Asian Both Sexes 998 720 669 486 361 3234 + +Pacific Males 527 406 369 313 178 1793 + +Islander Females 472 314 300 173 183 1441 + +
Hispanic Both Sexes 5905 4543 3352 2717 1749 18266 + +Males 3302 2686 1899 1465 1058 10409 + +Females 2603 1857 1454 1252 692 7857 + +
Age Specific (Crude) Age-Adjustedc Age at Prevalence All Ages 0-9 10-19 20-29 30-39 40-49 50-59 60-69 70-79 80+ All Ages
Race Sex All Races Both Sexes 00218 00276 00541 00467 00139 00078 00059 00065 00053 00033 00228
Males 00247 00286 00591 00520 00163 00095 00066 00069 00056 00035 00251Females 00190 00266 00488 00410 00115 00062 00053 00062 00050 00032 00204
White Both Sexes 00241 00315 00612 00542 00161 00086 00063 00070 00056 00033 00259Males 00271 00323 00670 00598 00186 00107 00069 00074 00060 00032 00284Females 00211 00306 00551 00482 00135 00064 00057 00066 00053 00033 00232
Black Both Sexes 00109 00107 00250 00197 00067 00042 00039 00029 00012 00027 00102Males 00126 00112 00281 00224 00079 00035 00052 00026 00012 00027 00112Females 00094 00102 00219 00171 00056 00047 00028 00032 00013 00027 00092
Asian Both Sexes 00159 00208 00418 00289 00071 00064 00045 00050 00054 00036 00163Pacific Males 00184 00226 00427 00360 00086 00069 00055 00054 00033 00055 00180Islander Females 00136 00190 00408 00219 00058 00059 00036 00047 00071 00023 00146
Hispanic Both Sexes 00320 00328 00637 00574 00165 00107 00093 00100 00084 00012 00279Males 00361 00342 00710 00648 00205 00131 00110 00063 00072 - 00309Females 00278 00312 00562 00494 00122 00082 00077 00133 00093 00020 00246
Table 1330Acute Lymphocytic Leukemia
Estimated United States Cancer Prevalence Countsa on January 1 2016By RaceEthnicity Sex and Years Since Diagnosis
Estimated prevalence percenta on January 1 2016 of the SEER population diagnosed in the previous 24 yearsBy Age at Prevalence RaceEthnicity and Sex
0
5
10
15
20
25
1975 1985 1995 2005 20160
5
10
15
20
25
1975 1985 1995 2005 20160
3
6
9
12
15
1975 1985 1995 2005 20160
3
6
9
12
15
1975 1985 1995 2005 2016
Delay-Adj IncidenceDelay-Adj Incidence
Observed IncidenceObserved Incidence
MortalityMortality
SEER Observed Incidence SEER Delay Adjusted Incidence and US Death RatesLeukemia by Race and Sex
a
Figure 131
Source SEER 9 areas and US Mortality Files (National Center for Health Statistics CDC)Rates are age-adjusted to the 2000 US Std Population (19 age groups - Census P25-1103)Regression lines and APCs are calculated using the Joinpoint Regression Program Version 47 February 2019 National Cancer InstituteThe APC is the Annual Percent Change for the regression line segments The APC shown on the graph is for the most recent trendThe APC is significantly different from zero (p lt 005)
a
White Male Black Male White Female Black FemaleRate per 100000 Rate per 100000 Rate per 100000 Rate per 100000
Year of DiagnosisDeath Year of DiagnosisDeath Year of DiagnosisDeath Year of DiagnosisDeath
SEER Incidence APCsDelay Adj 1998-16 = 08Observed 1975-16 = 03
US Mortality APC2013-16 = -30
SEER Incidence APCsDelay Adj 1975-16 = 02Observed 1975-16 = 01
US Mortality APC1993-16 = -15
SEER Incidence APCsDelay Adj 1975-16 = 06Observed 1975-16 = 05
US Mortality APC2000-16 = -12
SEER Incidence APCsDelay Adj 1975-16 = 03Observed 1975-16 = 02
US Mortality APC1993-16 = -13
SEE
R C
ancer Statistics Review
1975-2016N
ational Cancer Institute
0
1
2
3
4
5
6
7
8
1975 1985 1995 2005 20160
1
2
3
4
5
6
7
8
1975 1985 1995 2005 20160
1
2
3
4
5
6
7
8
1975 1985 1995 2005 20160
1
2
3
4
5
6
7
8
1975 1985 1995 2005 2016
Chronic
Acute
SEER Observed Incidence RatesLymphocytic and Myeloid Leukemia (Acute and Chronic) by Sex
a
Figure 132
Source SEER 9 areas Rates are age-adjusted to the 2000 US Std Population (19 age groups - Census P25-1103)Regression lines and APCs are calculated using the Joinpoint Regression Program Version 47 February 2019 National Cancer Institute
a
Male Female Male FemaleLymphocytic Leukemia Myeloid Leukemia
Rate per 100000 Rate per 100000 Rate per 100000 Rate per 100000
Year of Diagnosis Year of Diagnosis Year of Diagnosis Year of Diagnosis
SEE
R C
ancer Statistics Review
1975-2016N
ational Cancer Institute
Joinpoint Analyses for Whites and Blacks from 1975-2016and for AsianPacific Islanders American IndiansAlaska Natives and Hispanics from 2000-2016
0
5
10
15
20
1975 1985 1995 2005 20160
5
10
15
20
1975 1985 1995 2005 2016
White
Black
API
AIAN
Hispanic
SEER Incidence and US Death RatesLeukemia Both Sexes
Figure 133
Source Incidence data for whites and blacks are from the SEER 9 areas (San Francisco Connecticut Detroit Hawaii Iowa New Mexico Seattle Utah Atlanta)Incidence data for AsianPacific Islanders American IndiansAlaska Natives and Hispanics are from the SEER 21 areas (SEER 9 areas San Jose-MontereyLos Angeles Alaska Native Registry Rural Georgia California excluding SFSJMLA Kentucky Louisiana New Jersey Georgia excluding ATLRG Idaho New York andMassachusetts)Mortality data are from US Mortality Files National Center for Health Statistics CDCRates are age-adjusted to the 2000 US Std Population (19 age groups - Census P25-1103)Regression lines are calculated using the Joinpoint Regression Program Version 47 February 2019 National Cancer Institute Joinpoint analyses for Whites andBlacks during the 1975-2016 period allow a maximum of 5 joinpoints Analyses for other ethnic groups during the period 2000-2016 allow a maximum of 3 joinpointsAPI = AsianPacific IslanderAIAN = American IndianAlaska Native Rates for American IndianAlaska Native are based on the PurchasedReferred Care Delivery Area (PRCDA) countiesHispanic is not mutually exclusive from whites blacks AsianPacific Islanders and American IndiansAlaska Natives Incidence data for Hispanics are based onNHIA and exclude cases from the Alaska Native Registry
Incidence MortalityRate per 100000 Rate per 100000
Year of Diagnosis Year of Death
a
d
a
b
c
c
b
d
SEE
R C
ancer Statistics Review
1975-2016N
ational Cancer Institute
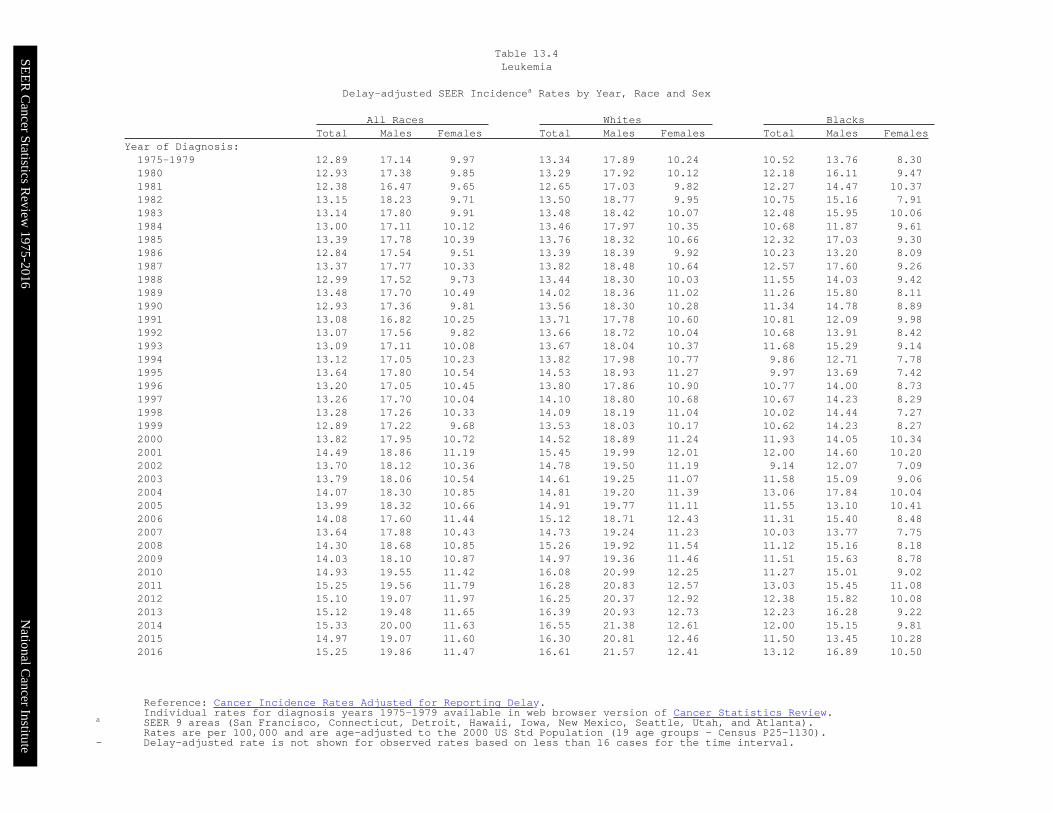
SEE
R C
ancer Statistics Review
1975-2016N
ational Cancer Institute
Individual rates for diagnosis years 1975-1979 available in web browser version of Cancer Statistics Reviewa SEER 9 areas (San Francisco Connecticut Detroit Hawaii Iowa New Mexico Seattle Utah and Atlanta)
Rates are per 100000 and are age-adjusted to the 2000 US Std Population (19 age groups - Census P25-1130)- Statistic not shown Rate based on less than 16 cases for the time interval
All Races Whites Blacks Total Males Females Total Males Females Total Males Females
Year of Diagnosis1975-2016 139 159 120 147 168 126 086 098 0761975-1979 103 122 086 108 129 090 054 059 0491980 112 140 088 116 147 090 073 - -1981 124 131 118 130 139 123 095 - -1982 123 150 099 130 156 105 - - -1983 129 152 108 139 164 118 080 - -1984 132 148 120 134 149 124 092 - -1985 130 155 109 135 162 112 - - -1986 130 167 096 138 182 096 077 - -1987 132 148 119 136 154 121 089 - 1151988 140 179 107 144 184 112 098 - -1989 162 182 143 169 190 149 103 - -1990 142 176 116 152 185 129 057 - -1991 138 172 105 151 194 109 086 - -1992 135 159 114 140 173 109 091 - -1993 126 141 109 138 157 115 082 - -1994 119 148 093 128 159 101 068 - -1995 150 180 121 161 187 136 098 132 -1996 139 156 121 146 165 126 085 - -1997 133 151 116 144 160 128 079 098 -1998 146 161 131 157 169 144 093 116 -1999 131 149 114 140 156 124 068 - -2000 140 151 129 152 161 145 087 - -2001 146 166 126 158 182 134 070 - -2002 150 179 120 165 200 129 062 - -2003 143 166 122 147 170 127 078 097 -2004 155 171 139 167 196 138 112 - 1432005 158 188 129 166 194 138 097 118 -2006 145 163 128 151 164 139 097 142 -2007 152 167 138 160 171 150 095 106 -2008 150 186 115 168 203 132 091 132 -2009 147 161 135 157 174 142 096 108 0852010 146 155 136 158 164 151 097 110 0852011 178 189 167 194 200 189 133 164 1012012 148 153 143 160 163 158 112 145 0892013 162 179 145 175 192 158 097 132 -2014 159 174 144 168 191 146 085 - 1062015 149 172 126 158 181 134 079 096 -2016 169 188 149 171 200 141 104 118 092
Table 136Acute Lymphocytic Leukemia
Age-adjusted SEER Incidencea Rates by Year Race and Sex
SEE
R C
ancer Statistics Review
1975-2016N
ational Cancer Institute
Individual rates for diagnosis years 1975-1979 available in web browser version of Cancer Statistics Reviewa SEER 9 areas (San Francisco Connecticut Detroit Hawaii Iowa New Mexico Seattle Utah and Atlanta)
Rates are per 100000 and are age-adjusted to the 2000 US Std Population (19 age groups - Census P25-1130)- Statistic not shown Rate based on less than 16 cases for the time interval
All Races Whites Blacks Total Males Females Total Males Females Total Males Females
Year of Diagnosis1975-2016 489 678 348 532 739 379 383 541 2741975-1979 432 600 317 454 635 332 381 535 2781980 452 631 333 470 655 346 451 706 2891981 427 630 290 447 663 306 382 541 2471982 430 614 301 450 639 318 377 665 -1983 445 640 313 467 678 325 421 611 3031984 443 630 312 472 682 329 345 446 2651985 449 621 331 480 663 354 411 615 2871986 450 633 324 487 685 354 279 418 -1987 466 681 307 495 726 328 403 614 2451988 455 646 315 477 688 327 443 532 3531989 470 644 347 501 691 368 391 515 3041990 461 631 342 492 678 363 451 613 3431991 460 620 343 500 681 364 340 375 3151992 462 674 317 506 743 343 321 496 2081993 446 615 317 474 656 336 452 679 2891994 462 614 347 506 672 384 319 413 2321995 456 644 320 499 702 352 339 534 2061996 474 637 356 518 690 394 352 536 2261997 451 610 331 493 665 363 357 518 2521998 427 599 301 471 658 335 285 373 2291999 418 607 277 453 655 301 387 600 2602000 470 660 325 520 734 354 344 450 2722001 534 741 379 590 817 420 395 489 3282002 514 724 356 574 807 399 319 453 2202003 539 747 383 596 830 418 439 621 3122004 560 768 402 611 819 450 501 816 2892005 545 777 367 607 876 395 402 485 3462006 585 770 447 648 845 500 460 676 3172007 542 754 380 612 842 432 314 480 2252008 557 749 409 621 824 463 386 583 2412009 545 752 382 606 834 421 406 593 2902010 562 781 395 626 858 444 365 528 2642011 556 749 401 611 822 439 452 551 3792012 531 711 387 593 783 437 372 493 2932013 524 724 363 586 803 410 436 650 2772014 531 748 355 595 827 404 379 606 2202015 507 684 360 572 764 407 345 461 2642016 476 656 327 537 736 368 381 509 289
Table 137Chronic Lymphocytic Leukemia
Age-adjusted SEER Incidencea Rates by Year Race and Sex
SEE
R C
ancer Statistics Review
1975-2016N
ational Cancer Institute
Individual rates for diagnosis years 1975-1979 available in web browser version of Cancer Statistics Reviewa SEER 9 areas (San Francisco Connecticut Detroit Hawaii Iowa New Mexico Seattle Utah and Atlanta)
Rates are per 100000 and are age-adjusted to the 2000 US Std Population (19 age groups - Census P25-1130)- Statistic not shown Rate based on less than 16 cases for the time interval
All Races Whites Blacks Total Males Females Total Males Females Total Males Females
Year of Diagnosis1975-2016 366 455 304 373 464 309 324 386 2841975-1979 343 425 288 351 438 293 261 297 2341980 314 410 243 317 411 249 288 328 2531981 317 399 265 321 411 268 315 322 3021982 342 479 260 347 490 263 250 322 2091983 321 422 253 317 428 241 293 302 2921984 330 406 273 335 417 277 235 210 2441985 333 415 287 325 402 284 378 506 2991986 300 391 240 295 385 238 321 404 2681987 302 397 247 303 400 247 305 473 2121988 303 379 252 308 387 257 279 314 2491989 320 401 262 330 404 279 222 379 -1990 304 391 243 312 407 246 249 289 2191991 333 393 288 338 390 298 334 453 2591992 322 385 276 328 403 275 305 299 3051993 345 431 286 352 445 286 248 262 2551994 346 414 302 348 424 297 294 324 2771995 366 417 331 381 432 345 262 262 2731996 347 433 291 346 429 294 321 405 2731997 353 461 277 366 482 285 302 383 2551998 393 494 321 406 506 332 305 464 2111999 373 451 318 385 463 330 303 345 2762000 405 495 341 404 495 339 441 488 4012001 406 495 339 420 500 361 345 408 3002002 363 458 298 378 478 311 291 331 2672003 360 449 296 367 460 302 333 352 2962004 342 415 293 351 423 300 339 431 3012005 359 426 317 365 438 319 349 347 3582006 355 411 315 367 422 327 284 334 2572007 355 438 298 366 448 309 338 445 2722008 382 469 318 386 485 308 307 378 2742009 364 442 308 376 464 310 313 398 2552010 424 539 341 444 568 350 336 454 2622011 421 514 347 425 518 349 422 452 3992012 458 561 377 468 572 387 385 449 3422013 448 542 380 466 555 402 416 508 3472014 439 531 371 460 548 395 378 453 3182015 426 518 358 442 539 367 372 415 3512016 431 542 347 447 556 361 408 489 358
Table 138Acute Myeloid Leukemia
Age-adjusted SEER Incidencea Rates by Year Race and Sex
SEE
R C
ancer Statistics Review
1975-2016N
ational Cancer Institute
Individual rates for diagnosis years 1975-1979 available in web browser version of Cancer Statistics Reviewa SEER 9 areas (San Francisco Connecticut Detroit Hawaii Iowa New Mexico Seattle Utah and Atlanta)
Rates are per 100000 and are age-adjusted to the 2000 US Std Population (19 age groups - Census P25-1130)- Statistic not shown Rate based on less than 16 cases for the time interval
All Races Whites Blacks Total Males Females Total Males Females Total Males Females
Year of Diagnosis1975-2016 181 238 138 184 242 141 183 237 1441975-1979 183 244 141 184 247 141 180 239 1361980 170 206 146 173 210 151 148 - -1981 164 197 141 159 190 139 238 300 1811982 168 216 135 165 219 131 175 - 1791983 169 223 133 164 215 132 251 344 1851984 168 240 118 163 241 110 258 261 2591985 197 276 143 200 280 147 206 289 -1986 168 219 129 171 225 131 154 - -1987 188 233 158 191 239 158 214 288 -1988 191 254 150 192 259 149 208 288 -1989 170 222 135 168 218 135 221 312 -1990 176 247 124 175 250 120 263 366 1951991 188 244 147 191 255 146 156 - 1751992 176 216 147 180 222 149 149 173 -1993 192 253 148 195 252 155 228 356 -1994 187 249 142 190 249 150 170 257 -1995 190 256 138 196 269 139 159 209 -1996 181 245 135 180 251 128 206 254 1831997 187 268 130 194 274 137 167 253 -1998 166 195 143 173 198 154 161 231 1201999 180 249 128 177 244 128 172 230 1262000 179 234 135 180 233 140 159 180 1332001 180 236 138 185 237 146 197 283 1362002 164 209 130 167 212 134 113 - -2003 166 224 120 176 237 127 147 218 -2004 181 256 122 187 266 125 151 206 1112005 169 226 125 177 235 131 178 244 1342006 184 240 141 194 251 151 158 217 1112007 171 232 123 180 249 123 143 183 1192008 185 239 143 186 232 151 189 267 1212009 180 238 134 179 231 139 190 289 1282010 188 251 140 188 254 136 191 212 1832011 195 255 147 206 271 151 166 195 1392012 193 233 161 197 238 165 212 281 1622013 193 260 139 198 267 140 172 226 1422014 197 259 146 195 252 146 205 196 2132015 185 230 146 194 241 152 169 185 1562016 204 265 156 216 272 171 198 288 140
Table 139Chronic Myeloid Leukemia
Age-adjusted SEER Incidencea Rates by Year Race and Sex
SEE
R C
ancer Statistics Review
1975-2016N
ational Cancer Institute
Individual rates for years of death 1975-1979 available in web browser version of Cancer Statistics Reviewa US Mortality Files National Center for Health Statistics Centers for Disease Control and Prevention
Rates are per 100000 and are age-adjusted to the 2000 US Std Population (19 age groups - Census P25-1130)- Statistic not shown Rate based on less than 16 cases for the time interval
All Races Whites Blacks Total Males Females Total Males Females Total Males Females
Year of Death1975-2016 752 1008 575 773 1038 589 656 865 5201975-1979 812 1092 624 829 1120 634 678 880 5361980 836 1121 646 854 1151 656 705 909 5671981 810 1089 624 824 1116 631 711 892 5861982 819 1104 631 833 1129 639 714 936 5671983 811 1093 626 824 1119 632 722 921 5901984 808 1068 637 823 1091 647 708 916 5691985 807 1077 631 823 1097 644 708 962 5421986 796 1071 616 810 1097 623 725 926 5911987 780 1031 614 791 1050 620 724 941 5851988 783 1060 600 795 1079 608 724 983 5581989 795 1062 615 807 1075 626 736 1034 5451990 798 1071 618 810 1090 626 744 996 5831991 799 1050 632 812 1064 644 745 1005 5801992 796 1071 613 811 1094 624 716 941 5681993 793 1066 609 804 1084 616 736 976 5771994 785 1057 603 800 1078 613 712 959 5541995 790 1080 598 804 1103 605 717 975 5531996 784 1053 605 797 1071 613 746 1009 5901997 771 1042 589 789 1068 601 683 923 5291998 758 1011 582 772 1031 591 704 937 5551999 768 1022 596 787 1047 609 674 878 5432000 769 1028 591 789 1054 605 671 907 5272001 764 1019 588 783 1046 602 674 880 5412002 754 1018 573 775 1046 585 673 891 5382003 745 1002 563 768 1037 576 654 847 5302004 729 981 552 747 1004 564 677 894 5392005 726 982 546 750 1014 563 607 811 4782006 723 970 546 748 997 566 627 884 4702007 708 954 533 730 986 546 619 807 5052008 709 954 533 732 983 549 627 865 4782009 706 953 525 731 986 541 605 814 4712010 691 925 520 716 958 537 575 746 4592011 695 928 524 718 960 539 599 774 4852012 683 921 507 708 957 522 577 756 4622013 675 909 503 703 943 523 568 770 4372014 662 882 496 691 921 515 547 717 4372015 628 846 464 655 882 482 520 684 4152016 627 828 475 653 864 491 543 687 449
Table 1310Leukemia
Age-adjusted US Deatha Rates by Year Race and Sex
SEE
R C
ancer Statistics Review
1975-2016N
ational Cancer Institute
a SEER 21 areas Rates are per 100000 and are age-adjusted to the 2000 US Std Population (19 age groups - Census P25-1130)unless noted
b US Mortality Files National Center for Health Statistics Centers for Disease Control and PreventionRates are per 100000 and are age-adjusted to the 2000 US Std Population (19 age groups - Census P25-1130) unless noted
c Rates are per 100000 and are age-adjusted to the world (WHO 2000-2025) standard million- Statistic not shown Rate based on less than 16 cases for the time interval
All Races Whites Blacks Total Males Females Total Males Females Total Males Females
SEER IncidenceAge at DiagnosisAge-Adjusted Rates 2012-2016All ages 141 181 109 149 191 115 109 139 89Under 65 71 83 58 74 87 61 58 66 5165 and over 625 855 457 668 909 487 460 641 349
All ages (WHO world std)c 109 137 86 116 145 90 85 105 71
Age-Specific Rates 2012-2016lt1 45 43 48 45 44 47 34 - 441-4 89 91 87 97 101 94 46 43 495-9 43 47 38 47 53 41 22 20 2410-14 33 38 28 34 38 30 26 31 2015-19 31 38 24 33 41 25 20 25 1520-24 29 32 25 30 35 25 24 22 2625-29 30 34 26 30 34 26 26 28 2430-34 37 42 32 37 43 32 33 33 3335-39 45 51 39 46 52 39 45 48 4240-44 61 71 51 63 73 53 58 69 4945-49 84 97 71 86 99 73 85 96 7450-54 127 156 99 133 164 103 104 123 8755-59 182 223 143 192 234 151 150 183 12260-64 271 346 202 285 365 210 230 279 19065-69 404 533 290 429 564 306 330 428 25670-74 549 735 394 584 777 419 416 563 31275-79 706 954 513 757 1015 552 535 755 39380-84 843 1180 611 902 1256 653 585 869 42885+ 880 1262 683 941 1356 725 567 810 466
US MortalityAge at DeathAge-Adjusted Rates 2012-2016All ages 65 88 49 68 91 51 55 72 44Under 65 18 22 15 18 22 15 20 23 1765 and over 392 544 283 411 570 296 299 410 232
All ages (WHO world std)c 37 48 28 38 49 29 33 43 27
Age-Specific Rates 2012-2016lt1 05 04 06 05 05 05 06 - -1-4 07 07 07 07 07 07 07 07 075-9 05 05 04 05 06 04 04 04 0310-14 06 06 05 06 06 05 05 06 0515-19 07 09 06 08 09 06 05 06 0420-24 09 11 06 09 11 07 09 10 0725-29 09 11 07 09 11 08 08 10 0730-34 10 12 08 10 12 08 11 13 1035-39 12 14 10 12 14 10 14 15 1240-44 16 17 14 16 17 15 18 18 1745-49 22 25 20 23 25 21 26 30 2250-54 34 40 28 34 41 28 39 44 3555-59 56 68 43 56 69 44 62 77 5060-64 93 118 70 95 121 70 101 130 7765-69 160 215 111 166 223 114 150 203 11070-74 272 364 194 285 380 202 231 302 18175-79 428 589 300 450 618 314 333 460 25180-84 615 863 441 647 903 462 457 633 35885+ 827 1192 638 875 1259 672 525 746 433
Table 1311Leukemia
SEER Incidencea and US Deathb Rates Age-Adjusted and Age-Specific Rates by Race and Sex
SEE
R C
ancer Statistics Review
1975-2016N
ational Cancer Institute
a SEER 21 areas Rates are per 100000 and are age-adjusted to the 2000 US Std Population (19 age groups - Census P25-1130)unless noted
b Rates are per 100000 and are age-adjusted to the world (WHO 2000-2025) standard million- Statistic not shown Rate based on less than 16 cases for the time interval
All Races Whites Blacks Total Males Females Total Males Females Total Males Females
Acute Lymphocytic LeukemiaAge at DiagnosisAge-Adjusted Rates 2012-2016All ages 17 19 15 19 21 16 10 11 09Under 65 17 20 15 19 22 16 10 11 0965 and over 16 18 13 17 20 14 10 12 09
All ages (WHO world std)b 19 21 16 20 23 18 10 11 09
Age-Specific Rates 2012-2016lt1 19 16 22 19 16 23 14 - -1-4 76 77 74 84 87 81 33 30 375-9 36 40 33 41 46 36 18 15 2010-14 23 26 19 24 27 21 14 19 0915-19 18 24 12 20 27 13 07 12 -20-24 10 14 07 12 16 07 05 06 0525-29 08 10 06 08 11 06 05 - -30-34 07 09 06 08 09 06 04 - -35-39 08 10 06 08 10 07 06 07 -40-44 08 09 06 08 10 06 06 07 -45-49 09 09 09 09 09 10 04 - -50-54 09 10 08 09 10 09 07 09 -55-59 11 12 11 12 13 11 11 12 1060-64 13 15 11 13 15 11 11 13 0965-69 14 14 13 15 16 14 07 - -70-74 16 19 13 17 20 14 - - -75-79 17 20 15 18 21 16 13 - -80-84 17 23 13 17 24 13 - - -85+ 15 19 13 16 20 14 - - -
Chronic Lymphocytic LeukemiaAge at DiagnosisAge-Adjusted Rates 2012-2016All ages 49 68 35 54 73 38 34 49 24Under 65 17 22 12 18 24 13 12 16 0865 and over 275 383 195 298 411 212 185 273 129
All ages (WHO world std)b 35 47 24 38 51 27 24 34 17
Age-Specific Rates 2012-2016lt1 - - - - - - - - -1-4 - - - - - - - - -5-9 - - - - - - - - -10-14 - - - - - - - - -15-19 - - - - - - - - -20-24 - - - - - - - - -25-29 01 01 - 01 - - - - -30-34 01 02 - 01 02 - - - -35-39 04 04 03 04 05 04 04 - -40-44 10 12 08 10 13 08 08 12 -45-49 22 28 17 24 30 19 18 24 1250-54 48 65 32 53 70 36 32 46 2055-59 80 103 58 88 113 64 51 66 3760-64 125 170 84 134 180 90 94 129 6665-69 189 258 129 204 274 140 135 188 9570-74 245 338 167 265 361 182 176 263 11675-79 306 423 216 333 455 236 213 321 14580-84 354 502 252 385 541 275 222 360 14685+ 379 543 294 413 594 318 218 302 183
Table 1312Lymphocytic Leukemia
SEER Incidencea Rates Age-Adjusted and Age-Specific Rates by Race and Sex
SEE
R C
ancer Statistics Review
1975-2016N
ational Cancer Institute
a SEER 21 areas Rates are per 100000 and are age-adjusted to the 2000 US Std Population (19 age groups - Census P25-1130)unless noted
b Rates are per 100000 and are age-adjusted to the world (WHO 2000-2025) standard million- Statistic not shown Rate based on less than 16 cases for the time interval
All Races Whites Blacks Total Males Females Total Males Females Total Males Females
Acute Myeloid LeukemiaAge at DiagnosisAge-Adjusted Rates 2012-2016All ages 43 52 35 44 54 36 37 44 33Under 65 20 21 19 20 21 19 20 20 2065 and over 201 269 152 213 284 160 155 210 123
All ages (WHO world std)b 32 38 28 33 40 28 29 33 27
Age-Specific Rates 2012-2016lt1 16 16 16 15 15 15 - - -1-4 10 10 10 09 09 09 11 10 115-9 04 04 04 04 04 04 03 - -10-14 07 08 06 07 08 06 09 09 0815-19 09 09 09 09 10 09 08 07 0820-24 11 10 12 11 10 12 12 11 1325-29 12 11 12 11 11 12 11 10 1230-34 14 15 14 14 15 14 17 15 1935-39 16 16 16 15 16 15 18 16 2040-44 21 22 21 22 22 22 22 21 2245-49 25 25 25 25 25 25 28 27 2950-54 35 38 32 36 40 33 33 32 3355-59 49 56 43 49 56 43 49 57 4360-64 78 91 67 82 97 68 70 75 6665-69 121 152 94 129 163 98 100 118 8670-74 183 236 139 192 247 145 151 189 12575-79 233 310 174 248 326 186 185 256 14080-84 286 393 212 302 413 223 207 314 14885+ 263 380 203 277 403 212 174 254 141
Chronic Myeloid LeukemiaAge at DiagnosisAge-Adjusted Rates 2012-2016All ages 19 24 14 19 25 15 18 22 15Under 65 11 13 09 11 12 09 11 13 1065 and over 76 106 55 80 111 57 62 82 49
All ages (WHO world std)b 15 19 11 15 19 12 14 17 12
Age-Specific Rates 2012-2016lt1 05 05 - 04 - - - - -1-4 01 - - 01 - - - - -5-9 01 - 01 01 - - - - -10-14 01 02 01 01 01 01 - - -15-19 03 03 02 02 03 02 03 - -20-24 05 06 04 05 06 04 04 - -25-29 07 09 06 07 08 06 07 10 -30-34 10 12 08 11 12 09 08 09 0835-39 11 13 09 11 13 10 12 13 1040-44 14 18 11 14 18 11 16 22 1045-49 18 21 15 17 20 14 25 28 2350-54 22 26 17 21 26 17 23 25 2055-59 25 29 22 26 29 23 25 28 2260-64 35 43 27 35 44 27 34 41 2965-69 49 67 34 50 68 33 55 68 4570-74 65 85 48 68 89 51 49 66 3675-79 91 124 65 97 132 69 69 98 5080-84 105 147 75 112 156 80 76 92 6785+ 102 155 75 107 164 76 75 109 60
Table 1313Myeloid Leukemia
SEER Incidencea Rates Age-Adjusted and Age-Specific Rates by Race and Sex
SEE
R C
ancer Statistics Review
1975-2016N
ational Cancer Institute
a Based on End Results data from a series of hospital registries and one population-based registryb SEER 9 areas (San Francisco Connecticut Detroit Hawaii Iowa New Mexico Seattle Utah Atlanta)
Based on follow-up of patients into 2016 Expected survival rates are derived from the US Annual Life Tablesc SEER 18 areas (San Francisco Connecticut Detroit Hawaii Iowa New Mexico Seattle Utah Atlanta San Jose-Monterey
Los Angeles Alaska Native Registry Rural Georgia California excluding SFSJMLA Kentucky Louisiana New Jersey andGeorgia excluding ATLRG) Expected survival rates are derived from life tables by socio-economic status geography and racedeveloped by the SEER programBased on follow-up of patients into 2016
d Period survival provides a 2015 estimate of survival by piecing together the most recent conditional survival estimatesfrom several cohorts It is computed here using three year calendar blocks (2010-2012 0-1 year survival)(2009-2011 1-2 year survival) (2008-2010 2-3 year survival) (2007-2009 3-4 year survival) (2006-2008 4-5 years survival)
e The difference between 1975-1977 and 2009-2015 is statistically significant (plt05)f The standard error is between 5 and 10 percentage pointsg The standard error is greater than 10 percentage points- Statistic could not be calculated due to fewer than 25 cases during the time period
All Races Whites Blacks Total Males Females Total Males Females Total Males Females
5-Year Relative Survival (Percent)Year of Diagnosis1960-1963a - - - 14 - - - - -1970-1973a - - - 22 - - - - -1975-1977b 341 330 356 345 336 358 334 304 3671978-1980b 360 350 373 367 358 380 282 273 2931981-1983b 373 369 378 381 378 385 339 334 3431984-1986b 405 401 411 416 413 420 327 315 3411987-1989b 429 440 413 439 455 418 350 327 3781990-1992b 452 446 461 465 463 468 357 305 4131993-1995b 476 484 464 487 495 475 413 416 4091996-1998b 484 486 481 498 497 498 386 390 3801999-2001b 510 520 495 520 530 507 437 451 4212002-2004b 583 584 581 591 594 588 540 543 5342005-2008b 623 635 607 633 643 620 560 599 5112009-2015b 658e 673e 637e 668e 682e 649e 596e 609e 582e
5-Year Period Survival (Percent)cd
2015 632 643 619 634 640 624 582 617 544
5-Year Relative Survival (Percent) 2009-2015c
Age at DiagnosisAges lt45 762 758 768 773 764 786 677 677 677Ages 45-54 722 737 698 735 746 716 628 662 586Ages 55-64 693 699 683 704 707 698 589 605 566Ages 65-74 610 610 611 614 610 620 541 553 523Ages 75+ 421 424 417 427 428 425 337 357 316Ages lt65 729 731 725 739 738 741 637 650 621Ages 65+ 508 517 496 511 518 502 446 474 415
Table 1314Leukemia
5-Year Relative and Period Survival (Percent) by Race Sex Diagnosis Year and Age
SEE
R C
ancer Statistics Review
1975-2016N
ational Cancer Institute
a SEER 9 areas (San Francisco Connecticut Detroit Hawaii Iowa New Mexico Seattle Utah Atlanta)Based on follow-up of patients into 2016 Expected survival rates are derived from the US Annual Life Tables
b SEER 18 areas (San Francisco Connecticut Detroit Hawaii Iowa New Mexico Seattle Utah Atlanta San Jose-MontereyLos Angeles Alaska Native Registry Rural Georgia California excluding SFSJMLA Kentucky Louisiana New Jersey andGeorgia excluding ATLRG) Expected survival rates are derived from life tables by socio-economic status geography and racedeveloped by the SEER programBased on follow-up of patients into 2016
c Period survival provides a 2015 estimate of survival by piecing together the most recent conditional survival estimatesfrom several cohorts It is computed here using three year calendar blocks (2010-2012 0-1 year survival)(2009-2011 1-2 year survival) (2008-2010 2-3 year survival) (2007-2009 3-4 year survival) (2006-2008 4-5 years survival)
d The difference between 1975-1977 and 2009-2015 is statistically significant (plt05)e The standard error is between 5 and 10 percentage pointsf The standard error is greater than 10 percentage points- Statistic could not be calculated due to fewer than 25 cases during the time period
All Races Whites Blacks Total Males Females Total Males Females Total Males Females
Acute Lymphocytic Leukemia5-Year Relative Survival (Percent)Year of Diagnosis1975-1977a 406 369 456 408 374 457 335e - -1987-1989a 544 537 552 550 547 553 447e 420e 471e1990-1992a 580 545 631 577 549 620 571e 504e 633e1993-1995a 602 578 636 598 578 627 532e 459e 638e1996-1998a 655 644 669 664 643 690 556e 591e 502e1999-2001a 635 634 635 648 652 642 566e 503e 630e2002-2004a 673 661 689 676 666 691 645e 594e 697e2005-2008a 701 693 713 700 686 720 652 700 551e2009-2015a 717d 723d 710d 726d 737d 713d 625d 607 647e
5-Year Period Survival (Percent)bc2015 691 684 698 685 674 700 650 650 648
5-Year Relative Survival (Percent) 2009-2015bAge at DiagnosisAges lt45 806 795 821 807 791 828 763 757 770Ages 45-54 381 365 403 379 373 389 257e - -Ages 55-64 280 275 284 294 288 298 173e 228e -Ages 65-74 239 188 291 214 170 259 - - -Ages 75+ 91 97 83 100 96 100 00 - -Ages lt65 733 725 743 735 724 749 668 668 668Ages 65+ 174 151 196 166 141 191 154e - 189e
Chronic Lymphocytic Leukemia5-Year Relative Survival (Percent)Year of Diagnosis1975-1977a 671 647 703 679 654 711 569e 551e 590e1987-1989a 727 727 729 739 740 737 581 555e 615e1990-1992a 741 718 773 753 731 784 522 434e 609e1993-1995a 772 771 773 783 781 786 633 640e 621e1996-1998a 756 739 778 767 752 787 581 515e 660e1999-2001a 786 782 792 794 788 803 666 655e 666e2002-2004a 840 832 852 845 837 856 770 742e 807e2005-2008a 862 861 863 864 863 864 841 857 8122009-2015a 882d 887d 875d 886d 889d 883d 785d 801d 763
5-Year Period Survival (Percent)bc2015 856 855 858 853 848 860 772 818 710
5-Year Relative Survival (Percent) 2009-2015bAge at DiagnosisAges lt45 940 927 960 942 932 954 905e 879e -Ages 45-54 939 934 948 945 935 964 840 889 761eAges 55-64 922 916 933 924 916 938 836 831 843Ages 65-74 874 856 905 876 853 913 773 784 756Ages 75+ 731 727 736 729 724 734 584 586e 564eAges lt65 928 922 939 931 923 947 843 854 824Ages 65+ 801 796 807 799 792 807 691 713 662
Table 1315Lymphocytic Leukemia
5-Year Relative and Period Survival (Percent) by Race Sex Diagnosis Year and Age
SEE
R C
ancer Statistics Review
1975-2016N
ational Cancer Institute
a SEER 9 areas (San Francisco Connecticut Detroit Hawaii Iowa New Mexico Seattle Utah Atlanta)Based on follow-up of patients into 2016 Expected survival rates are derived from the US Annual Life Tables
b SEER 18 areas (San Francisco Connecticut Detroit Hawaii Iowa New Mexico Seattle Utah Atlanta San Jose-MontereyLos Angeles Alaska Native Registry Rural Georgia California excluding SFSJMLA Kentucky Louisiana New Jersey andGeorgia excluding ATLRG) Expected survival rates are derived from life tables by socio-economic status geography and racedeveloped by the SEER programBased on follow-up of patients into 2016
c Period survival provides a 2015 estimate of survival by piecing together the most recent conditional survival estimatesfrom several cohorts It is computed here using three year calendar blocks (2010-2012 0-1 year survival)(2009-2011 1-2 year survival) (2008-2010 2-3 year survival) (2007-2009 3-4 year survival) (2006-2008 4-5 years survival)
d The difference between 1975-1977 and 2009-2015 is statistically significant (plt05)e The standard error is between 5 and 10 percentage pointsf The standard error is greater than 10 percentage points- Statistic could not be calculated due to fewer than 25 cases during the time period
All Races Whites Blacks Total Males Females Total Males Females Total Males Females
Acute Myeloid Leukemia5-Year Relative Survival (Percent)Year of Diagnosis1975-1977a 62 55 70 58 54 62 101 82 1171987-1989a 115 92 141 113 97 132 92 44 157e1990-1992a 138 126 152 135 122 150 135 129 1391993-1995a 161 149 174 153 141 167 215 206e 2201996-1998a 170 159 183 156 145 171 221 252 1821999-2001a 192 188 197 187 176 199 193 248 1422002-2004a 234 209 264 232 208 260 253 265 2402005-2008a 249 235 265 242 228 257 239 193 2772009-2015a 294d 291d 298d 290d 284d 299d 292d 280d 301d
5-Year Period Survival (Percent)bc2015 286 278 294 282 276 289 283 262 301
5-Year Relative Survival (Percent) 2009-2015bAge at DiagnosisAges lt45 604 585 624 621 599 645 511 482 538Ages 45-54 441 439 444 456 450 463 337 342 336Ages 55-64 300 281 325 308 285 338 231 234 224Ages 65-74 139 137 141 145 144 146 103 78 131Ages 75+ 34 40 27 34 41 27 24 - 20Ages lt65 466 444 491 474 449 504 393 371 414Ages 65+ 79 85 72 82 89 73 64 58 71
Chronic Myeloid Leukemia5-Year Relative Survival (Percent)Year of Diagnosis1975-1977a 218 193 251 205 184 234 277e 216e 355e1987-1989a 303 306 298 301 310 290 333e 281e 413e1990-1992a 307 296 322 303 300 306 349e 255e 449e1993-1995a 355 353 358 352 351 352 356e 328e 402e1996-1998a 371 377 363 380 376 385 310 304e 314e1999-2001a 473 459 492 459 441 483 490e 496e 481e2002-2004a 543 530 561 526 514 541 630e 621e 640e2005-2008a 631 632 629 617 615 621 643 664e 608e2009-2015a 697d 681d 718d 690d 677d 707d 736d 711d 763d
5-Year Period Survival (Percent)bc2015 695 683 712 681 666 702 723 714 735
5-Year Relative Survival (Percent) 2009-2015bAge at DiagnosisAges lt45 899 889 913 916 905 934 797 786 812Ages 45-54 874 860 891 871 858 888 871 842 900Ages 55-64 776 748 816 781 750 826 698 676e 719eAges 65-74 611 579 656 609 578 654 584e 526e 637eAges 75+ 326 305 346 321 302 336 362e 362f 362eAges lt65 851 836 873 856 839 883 790 773 808Ages 65+ 462 444 484 456 441 475 495 471e 515e
Table 1316Myeloid Leukemia
5-Year Relative and Period Survival (Percent) by Race Sex Diagnosis Year and Age
SEE
R C
ancer Statistics Review
1975-2016N
ational Cancer Institute
a Based on the SEER 9 areas (San Francisco Connecticut Detroit Hawaii Iowa New Mexico Seattle Utah and Atlanta)Expected survival rates are derived from the US Annual Life Tables
1975- 1980- 1985- 1990-1979 1984 1989 1994 1995 1996 1997 1998 1999 2000 2001 2002 2003 2004 2005 2006 2007 2008 2009 2010 2011 2012 2013 2014 2015
Survival Time
1-year 608 626 648 669 681 682 679 667 659 669 706 722 732 751 742 765 769 766 774 783 794 791 790 791 8062-year 501 525 553 575 589 599 598 580 583 590 630 649 662 677 684 705 706 702 709 725 732 725 732 7343-year 437 465 496 528 543 554 549 541 547 551 590 619 624 643 647 673 676 665 684 692 703 692 6984-year 388 417 455 491 507 519 509 503 516 520 567 596 595 619 627 647 653 639 658 676 683 6735-year 346 376 423 461 481 487 483 482 484 499 543 578 575 596 610 626 637 619 635 659 6656-year 314 351 399 435 457 465 458 461 462 485 524 560 556 572 593 607 622 604 613 6477-year 291 325 371 409 442 451 438 446 444 473 510 544 537 560 579 591 614 587 6018-year 270 304 350 388 417 438 432 431 430 457 496 535 519 546 561 573 603 5769-year 250 285 330 373 406 420 418 421 421 449 483 519 507 530 546 561 59310-year 237 269 316 360 390 406 406 410 406 438 471 504 489 515 532 54511-year 224 257 299 347 378 398 387 397 392 426 459 492 473 499 52712-year 212 246 288 336 371 387 377 390 383 419 449 483 460 49213-year 204 236 280 327 367 382 370 380 372 404 442 466 45414-year 198 229 272 318 356 371 368 370 367 392 434 45615-year 192 223 267 313 353 361 362 358 359 383 42316-year 185 214 261 306 350 359 361 350 353 37417-year 181 207 256 300 340 355 352 346 34718-year 177 201 253 294 330 351 346 34319-year 171 195 248 291 326 343 34420-year 166 191 244 286 319 338
Table 1317Leukemia
SEERa Relative Survival (Percent)By Year of Diagnosis
All Races Males and Females
Year of Diagnosis
SEE
R C
ancer Statistics Review
1975-2016N
ational Cancer Institute
a Based on the SEER 9 areas (San Francisco Connecticut Detroit Hawaii Iowa New Mexico Seattle Utah and Atlanta)Expected survival rates are derived from the US Annual Life Tables
1975- 1980- 1985- 1990-1979 1984 1989 1994 1995 1996 1997 1998 1999 2000 2001 2002 2003 2004 2005 2006 2007 2008 2009 2010 2011 2012 2013 2014 2015
Survival Time
1-year 604 628 655 679 692 697 688 667 668 688 729 731 742 767 761 770 780 775 791 793 806 797 803 812 8172-year 494 524 561 583 604 616 611 585 590 608 648 652 669 687 701 706 719 716 727 740 746 733 749 7513-year 427 460 499 532 556 573 552 546 552 573 608 624 627 653 664 674 689 679 699 712 719 698 7144-year 377 411 459 494 516 535 505 505 520 539 581 598 601 627 650 648 667 650 677 690 697 6775-year 334 371 429 462 482 495 479 484 480 523 553 573 578 602 630 626 653 632 656 673 6846-year 303 343 404 435 452 471 459 461 461 508 529 554 557 575 609 602 635 615 631 6617-year 277 318 373 409 439 458 438 444 439 498 514 531 535 564 594 588 625 595 6168-year 254 294 354 385 417 446 430 430 423 478 500 520 514 549 572 563 616 5839-year 232 275 332 371 404 423 421 419 415 464 486 507 501 526 553 548 60510-year 219 260 317 358 382 407 413 410 401 454 473 490 479 511 539 52611-year 205 249 302 346 377 398 391 393 383 444 461 474 464 496 53312-year 193 242 290 334 371 390 380 384 375 437 452 467 455 49113-year 186 234 283 325 367 389 373 369 363 420 442 455 44714-year 179 227 277 315 357 379 370 358 357 410 433 44715-year 175 221 269 309 352 371 365 349 351 399 42216-year 168 212 263 303 347 369 360 341 346 38717-year 164 204 260 296 339 366 348 335 34318-year 159 199 257 290 324 364 345 33119-year 154 192 253 288 322 355 34120-year 146 187 249 283 316 347
Table 1318Leukemia
SEERa Relative Survival (Percent)By Year of Diagnosis
All Races Males
Year of Diagnosis
SEE
R C
ancer Statistics Review
1975-2016N
ational Cancer Institute
a Based on the SEER 9 areas (San Francisco Connecticut Detroit Hawaii Iowa New Mexico Seattle Utah and Atlanta)Expected survival rates are derived from the US Annual Life Tables
1975- 1980- 1985- 1990-1979 1984 1989 1994 1995 1996 1997 1998 1999 2000 2001 2002 2003 2004 2005 2006 2007 2008 2009 2010 2011 2012 2013 2014 2015
Survival Time
1-year 613 623 638 655 665 664 666 667 646 643 675 710 719 729 715 759 755 754 751 769 778 782 772 761 7912-year 509 527 542 564 569 578 580 574 573 564 606 645 653 664 660 705 689 684 684 705 714 716 709 7093-year 450 471 492 523 525 529 544 534 539 522 564 612 619 628 624 673 657 647 663 666 681 685 6774-year 402 424 449 485 495 498 514 500 511 494 548 594 587 608 595 646 633 624 633 658 664 6685-year 361 384 414 459 480 475 489 479 489 466 530 584 570 588 582 627 615 601 607 641 6396-year 328 360 392 435 464 457 456 461 463 455 516 567 556 569 572 613 602 589 588 6297-year 309 334 367 410 447 443 438 448 450 438 504 561 539 556 558 594 598 575 5798-year 290 316 344 391 416 428 433 433 438 428 490 556 526 542 546 585 582 5639-year 273 299 326 376 409 416 413 424 429 428 477 535 515 534 535 576 57610-year 259 281 315 364 399 405 396 409 414 416 468 522 502 521 521 56811-year 247 269 295 347 378 398 383 403 403 401 456 515 486 503 51812-year 235 250 285 338 372 382 373 397 393 395 445 505 468 49313-year 228 239 276 329 365 373 366 392 385 383 442 481 46314-year 220 232 267 323 355 361 363 385 380 367 434 46815-year 214 225 264 318 353 348 359 369 368 363 42416-year 206 217 258 310 353 344 359 361 363 35817-year 201 210 252 305 342 340 357 358 35018-year 198 205 248 301 336 334 347 35819-year 193 198 241 296 330 326 34620-year 190 195 238 290 321 323
Table 1319Leukemia
SEERa Relative Survival (Percent)By Year of Diagnosis
All Races Females
Year of Diagnosis
SEE
R C
ancer Statistics Review
1975-2016N
ational Cancer Institute
Devcan 677 April 2019 National Cancer Institute (httpssurveillancecancergovdevcan)Source Incidence data are from the SEER 21 areas (San Francisco Connecticut Detroit Hawaii Iowa New Mexico Seattle Utah Atlanta
San Jose-Monterey Los Angeles Alaska Native Registry Rural Georgia California excluding SFSJMLA Kentucky Louisiana New JerseyGeorgia excluding ATLRG Idaho New York and Massachusetts) Mortality data are from the NCHS public use data file for the total US
a Underlying incidence and mortality data for American IndianAlaska Native are based on the PRCDA(PurchasedReferred Care DeliveryAreas) counties
b Hispanic is not mutually exclusive from whites blacks AsianPacific Islanders and American IndiansAlaska NativesUnderlying incidence data for Hispanics are based on NHIA and exclude cases from the Alaska Native Registry
- Statistic could not be calculatedA percent of 000 represents a value that is below 0005
Risk of Being Risk of Being
Race Current Diagnosed with Cancer Risk of Dying Race Current Diagnosed with Cancer Risk of Dying
Ethnicity Age +10 yrs +20 yrs +30 yrs Ever from Cancer Ethnicity Age +10 yrs +20 yrs +30 yrs Ever from Cancer
All Races 0 006 009 012 156 082 Asian 0 005 008 011 099 058
10 003 006 010 152 082 Pacific 10 003 006 009 095 058
20 003 007 014 149 082 Islander 20 003 006 010 092 058
30 004 011 026 147 082 30 003 008 016 090 057
40 007 022 051 145 082 40 004 012 026 087 057
50 015 045 089 141 082 50 008 022 047 083 056
60 031 079 121 134 082 60 014 040 066 078 054
70 053 101 - 115 080 70 028 055 - 067 051
80 062 - - 082 068 80 032 - - 047 040
White 0 006 010 013 164 085 American 0 005 007 009 085 040
10 003 007 011 159 086 Indian 10 002 004 008 081 040
20 003 007 014 156 085 Alaska 20 002 006 010 079 039
30 004 011 027 155 085 Nativea 30 004 008 019 078 039
40 007 023 053 153 085 40 004 015 030 076 040
50 016 047 095 149 086 50 012 027 051 075 040
60 033 083 127 141 086 60 017 042 061 068 040
70 057 106 - 121 084 70 029 051 - 058 038
80 066 - - 086 071 80 029 - - 038 025
Black 0 003 006 008 107 058 Hispanicb 0 007 011 015 124 066
10 002 005 009 105 059 10 005 008 012 118 066
20 003 006 013 104 059 20 004 008 014 114 065
30 004 011 022 102 058 30 004 010 021 111 064
40 007 019 041 100 058 40 006 017 037 108 064
50 013 035 066 097 058 50 011 031 063 104 063
60 025 058 083 091 058 60 021 054 085 097 062
70 039 069 - 079 057 70 037 070 - 083 058
80 042 - - 056 048 80 042 - - 058 049
Table 1320
Leukemia
Risk of Being Diagnosed With Cancer in 10 20 and 30 Years
Lifetime Risk of Being Diagnosed with Cancer Given Alive and Cancer-Free at Current Age and
Lifetime Risk of Dying from Cancer Given Alive at Current Age
Both Sexes 2014-2016 By RaceEthnicity
SEE
R C
ancer Statistics Review
1975-2016N
ational Cancer Institute
Devcan 677 April 2019 National Cancer Institute (httpssurveillancecancergovdevcan)Source Incidence data are from the SEER 21 areas (San Francisco Connecticut Detroit Hawaii Iowa New Mexico Seattle Utah Atlanta
San Jose-Monterey Los Angeles Alaska Native Registry Rural Georgia California excluding SFSJMLA Kentucky Louisiana New JerseyGeorgia excluding ATLRG Idaho New York and Massachusetts) Mortality data are from the NCHS public use data file for the total US
a Underlying incidence and mortality data for American IndianAlaska Native are based on the PRCDA(PurchasedReferred Care DeliveryAreas) counties
b Hispanic is not mutually exclusive from whites blacks AsianPacific Islanders and American IndiansAlaska NativesUnderlying incidence data for Hispanics are based on NHIA and exclude cases from the Alaska Native Registry
- Statistic could not be calculatedA percent of 000 represents a value that is below 0005
Risk of Being Risk of Being
Race Current Diagnosed with Cancer Risk of Dying Race Current Diagnosed with Cancer Risk of Dying
Ethnicity Age +10 yrs +20 yrs +30 yrs Ever from Cancer Ethnicity Age +10 yrs +20 yrs +30 yrs Ever from Cancer
All Races 0 006 010 013 186 096 Asian 0 005 009 011 119 072
10 004 007 012 182 097 Pacific 10 004 007 010 115 072
20 003 008 016 179 097 Islander 20 003 007 012 111 071
30 005 013 030 177 097 30 004 009 019 109 071
40 008 026 062 176 098 40 005 015 033 106 070
50 018 056 112 173 099 50 010 028 062 102 069
60 040 101 152 166 101 60 019 054 084 096 068
70 071 129 - 146 101 70 038 071 - 084 065
80 082 - - 105 088 80 040 - - 056 052
White 0 007 011 014 195 101 American 0 006 009 011 110 048
10 004 008 012 190 102 Indian 10 003 005 010 105 048
20 004 008 016 187 101 Alaska 20 002 007 011 103 048
30 005 013 031 186 101 Nativea 30 005 009 021 103 048
40 009 027 065 184 102 40 005 017 041 102 049
50 019 058 118 181 103 50 013 039 075 102 051
60 042 107 160 174 106 60 028 067 087 097 051
70 075 136 - 153 105 70 046 070 - 081 049
80 087 - - 110 091 80 034 - - 049 030
Black 0 003 006 008 122 065 Hispanicb 0 007 013 017 141 080
10 003 006 009 122 066 10 005 010 015 135 080
20 003 006 014 120 065 20 005 009 016 130 079
30 004 011 025 119 066 30 005 011 023 127 078
40 008 022 048 118 066 40 007 018 040 124 078
50 015 042 079 115 067 50 012 034 072 120 078
60 031 071 102 112 068 60 024 064 100 114 078
70 051 089 - 101 068 70 046 086 - 102 077
80 058 - - 077 061 80 053 - - 074 070
Table 1321
Leukemia
Risk of Being Diagnosed With Cancer in 10 20 and 30 Years
Lifetime Risk of Being Diagnosed with Cancer Given Alive and Cancer-Free at Current Age and
Lifetime Risk of Dying from Cancer Given Alive at Current Age
Males 2014-2016 By RaceEthnicity
SEE
R C
ancer Statistics Review
1975-2016N
ational Cancer Institute
Devcan 677 April 2019 National Cancer Institute (httpssurveillancecancergovdevcan)Source Incidence data are from the SEER 21 areas (San Francisco Connecticut Detroit Hawaii Iowa New Mexico Seattle Utah Atlanta
San Jose-Monterey Los Angeles Alaska Native Registry Rural Georgia California excluding SFSJMLA Kentucky Louisiana New JerseyGeorgia excluding ATLRG Idaho New York and Massachusetts) Mortality data are from the NCHS public use data file for the total US
a Underlying incidence and mortality data for American IndianAlaska Native are based on the PRCDA(PurchasedReferred Care DeliveryAreas) counties
b Hispanic is not mutually exclusive from whites blacks AsianPacific Islanders and American IndiansAlaska NativesUnderlying incidence data for Hispanics are based on NHIA and exclude cases from the Alaska Native Registry
- Statistic could not be calculatedA percent of 000 represents a value that is below 0005
Risk of Being Risk of Being
Race Current Diagnosed with Cancer Risk of Dying Race Current Diagnosed with Cancer Risk of Dying
Ethnicity Age +10 yrs +20 yrs +30 yrs Ever from Cancer Ethnicity Age +10 yrs +20 yrs +30 yrs Ever from Cancer
All Races 0 006 008 011 129 068 Asian 0 005 008 010 083 048
10 003 005 009 125 069 Pacific 10 003 005 008 078 047
20 003 006 012 122 068 Islander 20 002 005 009 075 047
30 003 009 021 120 068 30 003 006 013 073 046
40 006 018 039 118 068 40 004 010 021 071 046
50 012 034 068 114 067 50 007 017 035 068 045
60 023 059 093 106 067 60 011 029 051 063 044
70 039 077 - 091 064 70 019 042 - 054 040
80 048 - - 066 055 80 026 - - 040 033
White 0 006 009 011 135 071 American 0 003 005 007 061 031
10 003 005 009 131 071 Indian 10 002 003 007 058 031
20 003 006 012 128 071 Alaska 20 002 005 008 056 031
30 003 010 022 126 071 Nativea 30 004 007 017 055 031
40 006 019 042 124 070 40 003 014 020 053 031
50 013 036 072 120 070 50 011 017 030 051 031
60 024 062 099 112 069 60 007 021 038 042 030
70 042 081 - 096 067 70 015 035 - 039 029
80 051 - - 069 057 80 025 - - 030 022
Black 0 004 006 008 095 053 Hispanicb 0 006 010 013 110 056
10 002 004 008 093 054 10 004 007 010 105 056
20 002 006 012 091 053 20 003 006 012 101 055
30 004 010 020 089 053 30 003 009 019 099 054
40 006 016 035 087 053 40 006 016 034 096 054
50 011 029 054 083 052 50 010 028 055 091 052
60 020 047 069 077 051 60 019 046 073 084 050
70 030 055 - 065 049 70 030 059 - 070 046
80 033 - - 046 042 80 035 - - 048 037
Table 1322
Leukemia
Risk of Being Diagnosed With Cancer in 10 20 and 30 Years
Lifetime Risk of Being Diagnosed with Cancer Given Alive and Cancer-Free at Current Age and
Lifetime Risk of Dying from Cancer Given Alive at Current Age
Females 2014-2016 By RaceEthnicity
SEER Cancer Statistics Review 1975-2016 National Cancer Institute
The AAPC is the Average Annual Percent Change over the time interval The AAPCs are calculated bythe Joinpoint Regression Program Version 47 February 2019 National Cancer Institute
- Statistic not shown Rate based on less than 16 cases for the time intervalTrend based on less than 10 cases for at least one year within the time interval
a Rates are age-adjusted to the 2000 US Std Population (19 age groups - Census P25-1130) Trendsare based on rates age-adjusted to the 2000 US Std Population (19 age groups - Census P25-1130)
b The SEER 9 areas are San Francisco Connecticut Detroit Hawaii Iowa New Mexico SeattleUtah and AtlantaThe SEER 21 areas comprise the SEER 9 areas plus San Jose-Monterey Los Angeles the AlaskaNative Registry Rural Georgia California excluding SFSJMLA Kentucky Louisiana New JerseyGeorgia excluding ATLRG Idaho New York and Massachusetts
c The 2007-2016 AAPC estimates are based on a Joinpoint analysis with up to 3 Joinpoints overdiagnosis years 2000-2016
d The 2007-2016 AAPC estimates are based on a Joinpoint analysis with up to 5 Joinpoints overdiagnosis years 1975-2016
e Hispanic and Non-Hispanic are not mutually exclusive from whites blacks AsianPacificIslanders and American IndiansAlaska Natives Incidence data for Hispanics and Non-Hispanicsare based on NHIA and exclude cases from the Alaska Native Registry
f Incidence data for American IndianAlaska Native are based on the PurchasedReferred CareDelivery Area (PRCDA) counties
g US Mortality Files National Center for Health Statistics CDCh The 2007-2016 mortality AAPCs are based on a Joinpoint analysis using years of death 2000-2016 The APC is significantly different from zero (plt05)
SEER Incidence SEER 21 Areasb SEER 21 Areasb SEER 9 Areasb
Rate 2012-2016 Trend 2007-2016c Trend 2007-2016d
Rate per 100000 persons AAPC () AAPC ()
Total Males Females Total Males Females Total Males Females RaceEthnicity
All Races 141 181 109 -04 -02 -06 -03 02 03
White 149 191 115 -05 -05 -07 04 03 05White Hispanice 112 134 94 01 -02 03 - - -White Non-Hispanice 153 197 116 -05 -05 -08 - - -
Black 109 139 89 06 02 07 01 01 02
AsianPacific Islander 78 97 63 01 00 02 - - -
Amer IndAlaska Natf 86 110 66 08 21 -01 - - -
Hispanice 108 130 91 02 00 03 - - -
US Mortalityg Rate 2012-2016 Trend 2007-2016h
Rate per 100000 persons AAPC ()
Total Males Females Total Males FemalesRaceEthnicity
All Races 65 88 49 -16 -17 -13
White 68 91 51 -14 -16 -12White Hispanice 50 63 41 -07 -08 -06White Non-Hispanice 69 93 51 -14 -15 -12
Black 55 72 44 -15 -17 -15
AsianPacific Islander 36 47 28 -18 -07 -23
Amer IndAlaska NatTotal US 31 42 23 -22 -09 -36PRCDA Counties 41 54 30 -16 -05 -28Non-PRCDA Counties 20 28 15 -31 -13 -50
Hispanice 47 60 38 -08 -09 -07
Table 1323Leukemia
SEER Incidence and US MortalityAge-Adjusted Rates and Trendsa
By RaceEthnicity and Sex
SEE
R C
ancer Statistics Review
1975-2016N
ational Cancer Institute
a Rates are per 100000 and are age-adjusted to the 2000 US Std Population (19 age groups - Census P25-1130)b The SEER 9 areas are San Francisco Connecticut Detroit Hawaii Iowa New Mexico Seattle Utah and Atlanta
The SEER 13 areas comprise the SEER 9 areas plus San Jose-Monterey Los Angeles the Alaska Native Registry and Rural GeorgiaThe SEER 18 areas comprise the SEER 13 areas plus California excluding SFSJMLA Kentucky Louisiana New Jersey and Georgiaexcluding ATLRGThe SEER 21 areas comprise the SEER 18 areas plus Idaho New York and Massachusetts
- Statistic not shown Rate based on less than 16 cases for the time interval
All Races Whites Blacks Total Males Females Total Males Females Total Males Females
SEER Incidence Ratesa 2012-2016
California 1239 1590 949 1337 1715 1020 1039 1334 813Greater Bay Area 1231 1619 915 1400 1844 1028 1098 1406 859San Francisco-Oakland 1212 1596 906 1389 1823 1034 1077 1336 881San Jose-Monterey 1259 1651 925 1410 1869 1011 1239 1787 -
Los Angeles 1173 1469 933 1291 1622 1016 1050 1294 884Greater California 1271 1633 968 1334 1709 1017 1007 1338 729
Connecticut 1406 1768 1117 1431 1790 1142 976 1126 867Detroit 1584 2050 1230 1707 2222 1300 1204 1485 1018Georgia 1430 1841 1120 1537 1970 1189 1139 1487 935Atlanta 1382 1819 1064 1563 2017 1207 1138 1557 884Rural Georgia 1411 1586 1206 1510 1773 1196 1248 - 1236Greater Georgia 1455 1863 1144 1531 1965 1182 1140 1450 968
Hawaii 1073 1339 843 1388 1612 1139 - - -Idaho 1588 1950 1263 1604 1973 1272 - - -Iowa 1627 2127 1222 1630 2133 1221 1416 1743 1076Kentucky 1566 1983 1234 1577 1995 1241 1159 1446 922Louisiana 1405 1789 1104 1518 1918 1197 1103 1393 890Massachusetts 1108 1429 854 1118 1448 856 787 1050 620New Jersey 1524 1962 1188 1541 1982 1199 1136 1469 928New Mexico 1299 1550 1086 1310 1556 1101 1045 - -New York 1623 2119 1244 1752 2281 1335 1068 1360 887Seattle-Puget Sound 1568 2020 1188 1634 2084 1249 1486 1929 1077Utah 1375 1793 1009 1401 1825 1029 - - -
SEER 9 Areasb 1419 1823 1094 1521 1945 1171 1154 1460 941SEER 13 Areasb 1357 1737 1049 1473 1882 1134 1126 1419 922SEER 18 Areasb 1376 1761 1066 1461 1867 1127 1114 1414 907SEER 21 Areasb 1407 1807 1088 1491 1912 1147 1089 1386 889
Table 1324Leukemia
Age-Adjusted SEER Incidence Ratesa
By Registry Race and Sex
SEE
R C
ancer Statistics Review
1975-2016N
ational Cancer Institute
a US Mortality Files National Center for Health Statistics Centers for Disease Control and PreventionRates are per 100000 and are age-adjusted to the 2000 US Std Population (19 age groups - Census P25-1130)
b The SEER 9 areas are San Francisco Connecticut Detroit Hawaii Iowa New Mexico Seattle Utah and AtlantaThe SEER 13 areas comprise the SEER 9 areas plus San Jose-Monterey Los Angeles the Alaska Native Registry and Rural GeorgiaThe SEER 18 areas comprise the SEER 13 areas plus California excluding SFSJMLA Kentucky Louisiana New Jersey and Georgiaexcluding ATLRGThe SEER 21 areas comprise the SEER 18 areas plus Idaho New York and Massachusetts
- Statistic not shown Rate based on less than 16 cases for the time interval
All Races Whites Blacks Total Males Females Total Males Females Total Males Females
SEER Death Ratesa 2012-2016
California 617 811 470 671 885 507 560 711 461Greater Bay Area 563 759 419 640 869 470 551 742 424San Francisco-Oakland 551 753 405 631 871 455 544 726 421San Jose-Monterey 584 768 446 653 863 495 604 - -
Los Angeles 608 797 468 675 894 513 571 717 483Greater California 639 835 489 677 886 515 553 687 458
Connecticut 622 837 465 639 862 474 536 665 449Detroit 662 915 485 691 967 494 573 723 475Georgia 614 817 467 642 855 478 538 706 438Atlanta 568 757 437 615 802 483 487 658 374Rural Georgia 581 628 538 579 635 - - - -Greater Georgia 639 851 482 654 879 477 576 745 483
Hawaii 463 593 362 543 632 440 - - -Idaho 655 846 497 661 865 492 - - -Iowa 693 961 498 700 963 508 - - -Kentucky 742 949 592 750 953 603 633 894 455Louisiana 677 906 514 705 953 520 603 776 498Massachusetts 622 830 478 647 869 490 463 524 444New Jersey 615 810 478 657 871 504 474 549 429New Mexico 560 759 400 589 794 421 - - -New York 621 842 466 675 910 506 450 602 356Seattle-Puget Sound 618 795 481 637 807 503 708 975 499Utah 679 865 526 693 876 542 - - -
SEER 9 Areasb 610 818 457 651 869 487 540 711 427SEER 13 Areasb 609 810 460 658 874 494 544 708 437SEER 18 Areasb 630 832 480 671 887 508 552 705 455SEER 21 Areasb 628 834 477 670 889 506 520 670 426
Total US 654 876 489 681 912 506 550 721 439
Table 1325Leukemia
Age-Adjusted SEER Death Ratesa
By Registry Race and Sex
SEER Cancer Statistics Review 1975-2016 National Cancer Institute
a US Mortality Files National Center for Health Statistics Centers for Disease Control andPrevention Rates are per 100000 and are age-adjusted to the 2000 US Std Population (19age groups - Census P25-1130)
b Difference between state rate and total US rate is statistically significant (plt=0002)c Absolute percent difference between state rate and total US rate is 15 or mored Rank of state level death rate and the 95 confidence intervals (low high) for the rankSE Standard error of the ratePD Percent difference between state rate and total US rate- Statistic not shown Rate based on less than 16 cases for the time interval
State Rate SE Rank(CI)d PD TOTAL US 654 002
High Five StatesOklahoma 790 019 01(0108) 2083c
West Virginia 749 025 02(0123) 1449South Dakota 747 040 03(0133) 1415Kentucky 742 018 04(0116) 1352Kansas 742 022 05(0122) 1350
Low Five StatesColorado 609 016 47(2649) -692Alaska 596 050 48(0451) -885New Mexico 560 022 49(3650) -1430DC 504 041 50(3251) -2293c
Hawaii 463 024 51(4951) -2913c
State Rate SE Rank(CI)d PD State Rate SE Rank(CI)d PD
Alabama 689 016 17(0532) 533 Montana 613 032 45(0950) -634Alaska 596 050 48(0451) -885 Nebraska 718 026 10(0131) 983Arizona 632 013 36(2248) -329 Nevada 644 021 28(1148) -157Arkansas 719 021 09(0127) 993 New Hampshire 638 029 31(0749) -238California 617 006 42(3248) -572 New Jersey 615 011 43(2849) -592Colorado 609 016 47(2649) -692 New Mexico 560 022 49(3650) -1430Connecticut 622 017 40(2249) -490 New York 621 007 41(2948) -499Delaware 664 035 24(0249) 152 North Carolina 634 011 34(2347) -310DC 504 041 50(3251) -2293c North Dakota 656 040 26(0249) 029Florida 630 007 38(2645) -370 Ohio 694 010 13(0626) 608Georgia 614 012 44(2849) -604 Oklahoma 790 019 01(0108) 2083c
Hawaii 463 024 51(4951) -2913c Oregon 632 017 37(1948) -331Idaho 655 028 27(0548) 012 Pennsylvania 680 009 21(1029) 396Illinois 684 010 19(0928) 463 Rhode Island 656 033 25(0349) 037Indiana 719 014 08(0222) 994 South Carolina 682 016 20(0634) 435Iowa 693 019 14(0334) 604 South Dakota 747 040 03(0133) 1415Kansas 742 022 05(0122) 1350 Tennessee 702 014 12(0327) 729Kentucky 742 018 04(0116) 1352 Texas 640 007 30(2342) -215Louisiana 677 017 23(0637) 356 Utah 679 024 22(0346) 387Maine 638 027 32(0949) -240 Vermont 636 041 33(0350) -277Maryland 633 014 35(2148) -323 Virginia 611 012 46(2849) -661Massachusetts 622 013 39(2548) -482 Washington 640 013 29(2047) -209Michigan 685 011 18(0829) 476 West Virginia 749 025 02(0123) 1449Minnesota 691 015 16(0430) 564 Wisconsin 727 015 06(0219) 1110Mississippi 692 021 15(0337) 580 Wyoming 721 049 07(0148) 1028Missouri 711 014 11(0324) 874
Table 1326Leukemia
Age-Adjusted Cancer Deatha Rates By State All Races 2012-2016
Males and Females
SEER Cancer Statistics Review 1975-2016 National Cancer Institute
a US Mortality Files National Center for Health Statistics Centers for Disease Control andPrevention Rates are per 100000 and are age-adjusted to the 2000 US Std Population (19age groups - Census P25-1130)
b Difference between state rate and total US rate is statistically significant (plt=0002)c Absolute percent difference between state rate and total US rate is 15 or mored Rank of state level death rate and the 95 confidence intervals (low high) for the rankSE Standard error of the ratePD Percent difference between state rate and total US rate- Statistic not shown Rate based on less than 16 cases for the time interval
State Rate SE Rank(CI)d PD TOTAL US 876 003
High Five StatesOklahoma 1022 034 01(0120) 1669c
Kansas 1018 039 02(0123) 1625c
Arkansas 991 037 03(0127) 1309South Dakota 985 068 04(0147) 1249Delaware 984 065 05(0144) 1236
Low Five StatesMontana 795 053 47(1150) -921New Mexico 759 039 48(2650) -1336Alaska 711 081 49(0851) -1887c
DC 704 078 50(1051) -1959c
Hawaii 593 040 51(4951) -3228c
State Rate SE Rank(CI)d PD State Rate SE Rank(CI)d PD
Alabama 939 029 17(0233) 725 Montana 795 053 47(1150) -921Alaska 711 081 49(0851) -1887c Nebraska 958 046 12(0141) 935Arizona 827 022 41(2449) -555 Nevada 858 037 33(0849) -210Arkansas 991 037 03(0127) 1309 New Hampshire 884 051 25(0149) 088California 811 010 43(3348) -738 New Jersey 810 020 44(2749) -747Colorado 834 028 39(2049) -484 New Mexico 759 039 48(2650) -1336Connecticut 837 031 37(1549) -441 New York 842 013 35(2546) -387Delaware 984 065 05(0144) 1236 North Carolina 863 020 31(1945) -149DC 704 078 50(1051) -1959c North Dakota 873 070 27(0150) -030Florida 839 012 36(2645) -422 Ohio 931 018 19(0529) 627Georgia 817 021 42(2649) -677 Oklahoma 1022 034 01(0120) 1669c
Hawaii 593 040 51(4951) -3228c Oregon 866 029 29(1147) -112Idaho 846 047 34(0550) -339 Pennsylvania 912 016 21(0931) 416Illinois 928 018 20(0529) 594 Rhode Island 911 059 22(0149) 400Indiana 960 025 11(0127) 959 South Carolina 951 029 13(0131) 853Iowa 961 035 08(0131) 969 South Dakota 985 068 04(0147) 1249Kansas 1018 039 02(0123) 1625c Tennessee 960 025 10(0127) 959Kentucky 949 031 15(0133) 832 Texas 870 013 28(2139) -069Louisiana 906 030 23(0442) 342 Utah 865 041 30(0549) -122Maine 803 046 46(1450) -836 Vermont 874 074 26(0150) -026Maryland 861 026 32(1447) -176 Virginia 809 021 45(2650) -770Massachusetts 830 023 40(2349) -529 Washington 835 023 38(2248) -463Michigan 937 020 18(0428) 702 West Virginia 972 044 06(0135) 1095Minnesota 948 027 16(0229) 826 Wisconsin 960 026 09(0127) 961Mississippi 970 039 07(0132) 1077 Wyoming 885 081 24(0150) 102Missouri 951 025 14(0228) 852
Table 1327Leukemia
Age-Adjusted Cancer Deatha Rates By State All Races 2012-2016
Males
SEER Cancer Statistics Review 1975-2016 National Cancer Institute
a US Mortality Files National Center for Health Statistics Centers for Disease Control andPrevention Rates are per 100000 and are age-adjusted to the 2000 US Std Population (19age groups - Census P25-1130)
b Difference between state rate and total US rate is statistically significant (plt=0002)c Absolute percent difference between state rate and total US rate is 15 or mored Rank of state level death rate and the 95 confidence intervals (low high) for the rankSE Standard error of the ratePD Percent difference between state rate and total US rate- Statistic not shown Rate based on less than 16 cases for the time interval
State Rate SE Rank(CI)d PD TOTAL US 489 002
High Five StatesOklahoma 615 023 01(0108) 2584c
Wyoming 596 060 02(0147) 2194c
Kentucky 592 021 03(0111) 2126c
West Virginia 576 030 04(0126) 1792c
South Dakota 564 047 05(0145) 1551c
Low Five StatesColorado 441 018 47(2250) -972Delaware 428 037 48(0751) -1247New Mexico 400 025 49(3151) -1803c
DC 381 046 50(1251) -2203c
Hawaii 362 029 51(4151) -2598c
State Rate SE Rank(CI)d PD State Rate SE Rank(CI)d PD
Alabama 512 019 18(0440) 483 Montana 452 037 43(0551) -745Alaska 485 062 27(0151) -073 Nebraska 531 030 10(0144) 864Arizona 473 015 31(1347) -308 Nevada 455 025 42(1150) -695Arkansas 516 024 15(0344) 554 New Hampshire 449 033 45(0651) -807California 470 007 34(2345) -383 New Jersey 478 013 30(1346) -223Colorado 441 018 47(2250) -972 New Mexico 400 025 49(3151) -1803c
Connecticut 465 020 40(1249) -487 New York 466 009 38(2246) -456Delaware 428 037 48(0751) -1247 North Carolina 471 012 32(1747) -350DC 381 046 50(1251) -2203c North Dakota 479 046 28(0151) -189Florida 460 008 41(2647) -582 Ohio 520 012 12(0529) 653Georgia 467 013 37(1747) -433 Oklahoma 615 023 01(0108) 2584c
Hawaii 362 029 51(4151) -2598c Oregon 449 019 44(1850) -799Idaho 497 033 22(0249) 174 Pennsylvania 516 011 14(0629) 556Illinois 514 011 16(0631) 526 Rhode Island 471 037 33(0351) -363Indiana 540 017 07(0226) 1052 South Carolina 495 018 23(0645) 133Iowa 498 022 20(0547) 200 South Dakota 564 047 05(0145) 1551c
Kansas 539 025 08(0137) 1032 Tennessee 517 016 13(0435) 590Kentucky 592 021 03(0111) 2126c Texas 467 008 36(2246) -431Louisiana 514 020 17(0442) 520 Utah 526 029 11(0146) 778Maine 508 032 19(0248) 403 Vermont 444 045 46(0351) -906Maryland 470 016 35(1448) -389 Virginia 465 014 39(1848) -474Massachusetts 478 015 29(1247) -220 Washington 487 016 25(0946) -022Michigan 498 013 21(0939) 192 West Virginia 576 030 04(0126) 1792c
Minnesota 494 017 24(0745) 121 Wisconsin 545 017 06(0225) 1162Mississippi 485 023 26(0548) -067 Wyoming 596 060 02(0147) 2194c
Missouri 535 017 09(0327) 953
Table 1328Leukemia
Age-Adjusted Cancer Deatha Rates By State All Races 2012-2016
Females
SEE
R C
ancer Statistics Review
1975-2016N
ational Cancer Institute
a US 2016 cancer prevalence counts are based on 2016 cancer prevalence proportions from the SEER 13 Areas (excluding the AlaskaNative Registry) and 112016 US population estimates based on the average of 2015 and 2016 population estimates from theUS Bureau of the CensusPrevalence was calculated using the first invasive tumor for each cancer site diagnosed during the previous 24 years
b Maximum limited-duration prevalence is 24 years for 1992-2016 datac Percentages are age-adjusted to the 2000 US Standard Population (19 age groups - Census P25-1130) by 5-year age groupsd Cases diagnosed more than 24 years ago were estimated using the completeness index method (Capocaccia et al 1997
Merrill et al 2000)e Complete prevalence is obtained by summing 0 to lt24 and gt=24- Statistic not shown Statistic based on fewer than 5 cases estimated alive in SEER for the time interval+ Not available
Years Since Diagnosis 0 to lt5 5 to lt10 10 to lt15 15 to lt20 20 to lt24 0 to lt24b gt=24d Completee
Race Sex All Races Both Sexes 153253 100309 63581 38012 21353 376508 38265 414773
Males 90192 57683 36029 21220 12020 217145 18411 235556Females 63061 42625 27552 16792 9333 159363 19854 179217
White Both Sexes 132173 87961 56051 33596 19035 328814 32999 370135Males 78368 50894 32033 18770 10845 190910 15102 210930Females 53805 37067 24018 14826 8190 137905 17897 159205
Black Both Sexes 12734 6564 4233 2487 1259 27277 4070 31347Males 6847 3556 2204 1334 637 14578 1776 16354Females 5887 3008 2029 1153 622 12699 2294 14992
Asian Both Sexes 3926 2561 1778 1164 690 10120 + +Pacific Males 2235 1462 936 646 351 5630 + +Islander Females 1691 1100 842 519 339 4490 + +
Hispanic Both Sexes 14464 9581 6796 4462 2630 37933 + +Males 8166 5374 3794 2408 1538 21280 + +Females 6298 4207 3002 2055 1092 16654 + +
Age Specific (Crude) Age-Adjustedc Age at Prevalence All Ages 0-9 10-19 20-29 30-39 40-49 50-59 60-69 70-79 80+ All Ages
Race Sex All Races Both Sexes 01168 00328 00640 00628 00377 00561 01053 02263 04023 05111 01054
Males 01369 00339 00706 00685 00419 00657 01287 02888 05282 07048 01306Females 00974 00317 00572 00570 00333 00466 00829 01696 02974 03919 00844
White Both Sexes 01304 00369 00715 00712 00410 00584 01106 02389 04249 05386 01127Males 01528 00379 00789 00771 00457 00682 01349 03042 05558 07387 01389Females 01084 00359 00637 00650 00362 00484 00869 01784 03135 04133 00904
Black Both Sexes 00605 00145 00322 00320 00267 00463 00752 01455 02470 03076 00660Males 00674 00142 00357 00338 00281 00530 00919 01737 03249 04580 00816Females 00541 00148 00286 00301 00255 00402 00605 01230 01927 02334 00552
Asian Both Sexes 00497 00264 00531 00426 00230 00390 00553 00882 01245 01389 00513Pacific Males 00577 00298 00555 00507 00249 00461 00665 01122 01552 01904 00613Islander Females 00423 00228 00507 00345 00212 00327 00456 00688 00999 01057 00430
Hispanic Both Sexes 00664 00375 00737 00728 00395 00485 00723 01191 01987 02074 00746Males 00737 00397 00827 00807 00471 00576 00831 01350 02221 02551 00854Females 00589 00352 00642 00641 00312 00391 00617 01050 01809 01780 00647
Table 1329Leukemia
Estimated United States Cancer Prevalence Countsa on January 1 2016By RaceEthnicity Sex and Years Since Diagnosis
Estimated prevalence percenta on January 1 2016 of the SEER population diagnosed in the previous 24 yearsBy Age at Prevalence RaceEthnicity and Sex
SEE
R C
ancer Statistics Review
1975-2016N
ational Cancer Institute
a US 2016 cancer prevalence counts are based on 2016 cancer prevalence proportions from the SEER 13 Areas (excluding the AlaskaNative Registry) and 112016 US population estimates based on the average of 2015 and 2016 population estimates from theUS Bureau of the CensusPrevalence was calculated using the first invasive tumor for each cancer site diagnosed during the previous 24 years
b Maximum limited-duration prevalence is 24 years for 1992-2016 datac Percentages are age-adjusted to the 2000 US Standard Population (19 age groups - Census P25-1130) by 5-year age groupsd Cases diagnosed more than 24 years ago were estimated using the completeness index method (Capocaccia et al 1997
Merrill et al 2000)e Complete prevalence is obtained by summing 0 to lt24 and gt=24- Statistic not shown Statistic based on fewer than 5 cases estimated alive in SEER for the time interval+ Not available
Years Since Diagnosis 0 to lt5 5 to lt10 10 to lt15 15 to lt20 20 to lt24 0 to lt24b gt=24d Completee
Race Sex All Races Both Sexes 20277 16033 13721 12074 8203 70308 25456 95764
Males 11203 9049 7751 6542 4634 39179 12997 52176Females 9074 6984 5971 5531 3568 31129 12460 43589
White Both Sexes 17123 13855 11870 10663 7154 60665 21823 83282Males 9549 7741 6768 5696 4084 33839 11286 45559Females 7573 6114 5102 4967 3070 26826 10537 37723
Black Both Sexes 1590 1133 923 727 553 4926 1609 6535Males 809 734 473 411 290 2716 592 3308Females 781 399 450 317 263 2210 1017 3227
Asian Both Sexes 998 720 669 486 361 3234 + +Pacific Males 527 406 369 313 178 1793 + +Islander Females 472 314 300 173 183 1441 + +
Hispanic Both Sexes 5905 4543 3352 2717 1749 18266 + +Males 3302 2686 1899 1465 1058 10409 + +Females 2603 1857 1454 1252 692 7857 + +
Age Specific (Crude) Age-Adjustedc Age at Prevalence All Ages 0-9 10-19 20-29 30-39 40-49 50-59 60-69 70-79 80+ All Ages
Race Sex All Races Both Sexes 00218 00276 00541 00467 00139 00078 00059 00065 00053 00033 00228
Males 00247 00286 00591 00520 00163 00095 00066 00069 00056 00035 00251Females 00190 00266 00488 00410 00115 00062 00053 00062 00050 00032 00204
White Both Sexes 00241 00315 00612 00542 00161 00086 00063 00070 00056 00033 00259Males 00271 00323 00670 00598 00186 00107 00069 00074 00060 00032 00284Females 00211 00306 00551 00482 00135 00064 00057 00066 00053 00033 00232
Black Both Sexes 00109 00107 00250 00197 00067 00042 00039 00029 00012 00027 00102Males 00126 00112 00281 00224 00079 00035 00052 00026 00012 00027 00112Females 00094 00102 00219 00171 00056 00047 00028 00032 00013 00027 00092
Asian Both Sexes 00159 00208 00418 00289 00071 00064 00045 00050 00054 00036 00163Pacific Males 00184 00226 00427 00360 00086 00069 00055 00054 00033 00055 00180Islander Females 00136 00190 00408 00219 00058 00059 00036 00047 00071 00023 00146
Hispanic Both Sexes 00320 00328 00637 00574 00165 00107 00093 00100 00084 00012 00279Males 00361 00342 00710 00648 00205 00131 00110 00063 00072 - 00309Females 00278 00312 00562 00494 00122 00082 00077 00133 00093 00020 00246
Table 1330Acute Lymphocytic Leukemia
Estimated United States Cancer Prevalence Countsa on January 1 2016By RaceEthnicity Sex and Years Since Diagnosis
Estimated prevalence percenta on January 1 2016 of the SEER population diagnosed in the previous 24 yearsBy Age at Prevalence RaceEthnicity and Sex
0
5
10
15
20
25
1975 1985 1995 2005 20160
5
10
15
20
25
1975 1985 1995 2005 20160
3
6
9
12
15
1975 1985 1995 2005 20160
3
6
9
12
15
1975 1985 1995 2005 2016
Delay-Adj IncidenceDelay-Adj Incidence
Observed IncidenceObserved Incidence
MortalityMortality
SEER Observed Incidence SEER Delay Adjusted Incidence and US Death RatesLeukemia by Race and Sex
a
Figure 131
Source SEER 9 areas and US Mortality Files (National Center for Health Statistics CDC)Rates are age-adjusted to the 2000 US Std Population (19 age groups - Census P25-1103)Regression lines and APCs are calculated using the Joinpoint Regression Program Version 47 February 2019 National Cancer InstituteThe APC is the Annual Percent Change for the regression line segments The APC shown on the graph is for the most recent trendThe APC is significantly different from zero (p lt 005)
a
White Male Black Male White Female Black FemaleRate per 100000 Rate per 100000 Rate per 100000 Rate per 100000
Year of DiagnosisDeath Year of DiagnosisDeath Year of DiagnosisDeath Year of DiagnosisDeath
SEER Incidence APCsDelay Adj 1998-16 = 08Observed 1975-16 = 03
US Mortality APC2013-16 = -30
SEER Incidence APCsDelay Adj 1975-16 = 02Observed 1975-16 = 01
US Mortality APC1993-16 = -15
SEER Incidence APCsDelay Adj 1975-16 = 06Observed 1975-16 = 05
US Mortality APC2000-16 = -12
SEER Incidence APCsDelay Adj 1975-16 = 03Observed 1975-16 = 02
US Mortality APC1993-16 = -13
SEE
R C
ancer Statistics Review
1975-2016N
ational Cancer Institute
0
1
2
3
4
5
6
7
8
1975 1985 1995 2005 20160
1
2
3
4
5
6
7
8
1975 1985 1995 2005 20160
1
2
3
4
5
6
7
8
1975 1985 1995 2005 20160
1
2
3
4
5
6
7
8
1975 1985 1995 2005 2016
Chronic
Acute
SEER Observed Incidence RatesLymphocytic and Myeloid Leukemia (Acute and Chronic) by Sex
a
Figure 132
Source SEER 9 areas Rates are age-adjusted to the 2000 US Std Population (19 age groups - Census P25-1103)Regression lines and APCs are calculated using the Joinpoint Regression Program Version 47 February 2019 National Cancer Institute
a
Male Female Male FemaleLymphocytic Leukemia Myeloid Leukemia
Rate per 100000 Rate per 100000 Rate per 100000 Rate per 100000
Year of Diagnosis Year of Diagnosis Year of Diagnosis Year of Diagnosis
SEE
R C
ancer Statistics Review
1975-2016N
ational Cancer Institute
Joinpoint Analyses for Whites and Blacks from 1975-2016and for AsianPacific Islanders American IndiansAlaska Natives and Hispanics from 2000-2016
0
5
10
15
20
1975 1985 1995 2005 20160
5
10
15
20
1975 1985 1995 2005 2016
White
Black
API
AIAN
Hispanic
SEER Incidence and US Death RatesLeukemia Both Sexes
Figure 133
Source Incidence data for whites and blacks are from the SEER 9 areas (San Francisco Connecticut Detroit Hawaii Iowa New Mexico Seattle Utah Atlanta)Incidence data for AsianPacific Islanders American IndiansAlaska Natives and Hispanics are from the SEER 21 areas (SEER 9 areas San Jose-MontereyLos Angeles Alaska Native Registry Rural Georgia California excluding SFSJMLA Kentucky Louisiana New Jersey Georgia excluding ATLRG Idaho New York andMassachusetts)Mortality data are from US Mortality Files National Center for Health Statistics CDCRates are age-adjusted to the 2000 US Std Population (19 age groups - Census P25-1103)Regression lines are calculated using the Joinpoint Regression Program Version 47 February 2019 National Cancer Institute Joinpoint analyses for Whites andBlacks during the 1975-2016 period allow a maximum of 5 joinpoints Analyses for other ethnic groups during the period 2000-2016 allow a maximum of 3 joinpointsAPI = AsianPacific IslanderAIAN = American IndianAlaska Native Rates for American IndianAlaska Native are based on the PurchasedReferred Care Delivery Area (PRCDA) countiesHispanic is not mutually exclusive from whites blacks AsianPacific Islanders and American IndiansAlaska Natives Incidence data for Hispanics are based onNHIA and exclude cases from the Alaska Native Registry
Incidence MortalityRate per 100000 Rate per 100000
Year of Diagnosis Year of Death
a
d
a
b
c
c
b
d
SEE
R C
ancer Statistics Review
1975-2016N
ational Cancer Institute
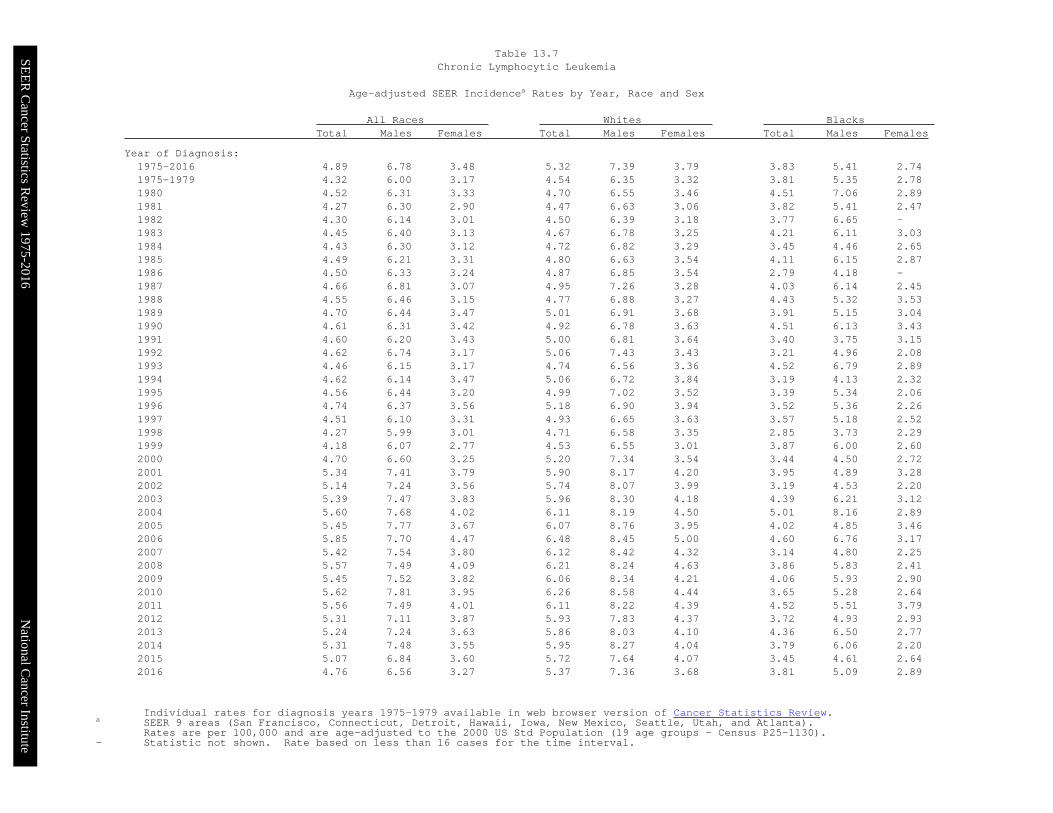
SEE
R C
ancer Statistics Review
1975-2016N
ational Cancer Institute
Individual rates for diagnosis years 1975-1979 available in web browser version of Cancer Statistics Reviewa SEER 9 areas (San Francisco Connecticut Detroit Hawaii Iowa New Mexico Seattle Utah and Atlanta)
Rates are per 100000 and are age-adjusted to the 2000 US Std Population (19 age groups - Census P25-1130)- Statistic not shown Rate based on less than 16 cases for the time interval
All Races Whites Blacks Total Males Females Total Males Females Total Males Females
Year of Diagnosis1975-2016 489 678 348 532 739 379 383 541 2741975-1979 432 600 317 454 635 332 381 535 2781980 452 631 333 470 655 346 451 706 2891981 427 630 290 447 663 306 382 541 2471982 430 614 301 450 639 318 377 665 -1983 445 640 313 467 678 325 421 611 3031984 443 630 312 472 682 329 345 446 2651985 449 621 331 480 663 354 411 615 2871986 450 633 324 487 685 354 279 418 -1987 466 681 307 495 726 328 403 614 2451988 455 646 315 477 688 327 443 532 3531989 470 644 347 501 691 368 391 515 3041990 461 631 342 492 678 363 451 613 3431991 460 620 343 500 681 364 340 375 3151992 462 674 317 506 743 343 321 496 2081993 446 615 317 474 656 336 452 679 2891994 462 614 347 506 672 384 319 413 2321995 456 644 320 499 702 352 339 534 2061996 474 637 356 518 690 394 352 536 2261997 451 610 331 493 665 363 357 518 2521998 427 599 301 471 658 335 285 373 2291999 418 607 277 453 655 301 387 600 2602000 470 660 325 520 734 354 344 450 2722001 534 741 379 590 817 420 395 489 3282002 514 724 356 574 807 399 319 453 2202003 539 747 383 596 830 418 439 621 3122004 560 768 402 611 819 450 501 816 2892005 545 777 367 607 876 395 402 485 3462006 585 770 447 648 845 500 460 676 3172007 542 754 380 612 842 432 314 480 2252008 557 749 409 621 824 463 386 583 2412009 545 752 382 606 834 421 406 593 2902010 562 781 395 626 858 444 365 528 2642011 556 749 401 611 822 439 452 551 3792012 531 711 387 593 783 437 372 493 2932013 524 724 363 586 803 410 436 650 2772014 531 748 355 595 827 404 379 606 2202015 507 684 360 572 764 407 345 461 2642016 476 656 327 537 736 368 381 509 289
Table 137Chronic Lymphocytic Leukemia
Age-adjusted SEER Incidencea Rates by Year Race and Sex
SEE
R C
ancer Statistics Review
1975-2016N
ational Cancer Institute
Individual rates for diagnosis years 1975-1979 available in web browser version of Cancer Statistics Reviewa SEER 9 areas (San Francisco Connecticut Detroit Hawaii Iowa New Mexico Seattle Utah and Atlanta)
Rates are per 100000 and are age-adjusted to the 2000 US Std Population (19 age groups - Census P25-1130)- Statistic not shown Rate based on less than 16 cases for the time interval
All Races Whites Blacks Total Males Females Total Males Females Total Males Females
Year of Diagnosis1975-2016 366 455 304 373 464 309 324 386 2841975-1979 343 425 288 351 438 293 261 297 2341980 314 410 243 317 411 249 288 328 2531981 317 399 265 321 411 268 315 322 3021982 342 479 260 347 490 263 250 322 2091983 321 422 253 317 428 241 293 302 2921984 330 406 273 335 417 277 235 210 2441985 333 415 287 325 402 284 378 506 2991986 300 391 240 295 385 238 321 404 2681987 302 397 247 303 400 247 305 473 2121988 303 379 252 308 387 257 279 314 2491989 320 401 262 330 404 279 222 379 -1990 304 391 243 312 407 246 249 289 2191991 333 393 288 338 390 298 334 453 2591992 322 385 276 328 403 275 305 299 3051993 345 431 286 352 445 286 248 262 2551994 346 414 302 348 424 297 294 324 2771995 366 417 331 381 432 345 262 262 2731996 347 433 291 346 429 294 321 405 2731997 353 461 277 366 482 285 302 383 2551998 393 494 321 406 506 332 305 464 2111999 373 451 318 385 463 330 303 345 2762000 405 495 341 404 495 339 441 488 4012001 406 495 339 420 500 361 345 408 3002002 363 458 298 378 478 311 291 331 2672003 360 449 296 367 460 302 333 352 2962004 342 415 293 351 423 300 339 431 3012005 359 426 317 365 438 319 349 347 3582006 355 411 315 367 422 327 284 334 2572007 355 438 298 366 448 309 338 445 2722008 382 469 318 386 485 308 307 378 2742009 364 442 308 376 464 310 313 398 2552010 424 539 341 444 568 350 336 454 2622011 421 514 347 425 518 349 422 452 3992012 458 561 377 468 572 387 385 449 3422013 448 542 380 466 555 402 416 508 3472014 439 531 371 460 548 395 378 453 3182015 426 518 358 442 539 367 372 415 3512016 431 542 347 447 556 361 408 489 358
Table 138Acute Myeloid Leukemia
Age-adjusted SEER Incidencea Rates by Year Race and Sex
SEE
R C
ancer Statistics Review
1975-2016N
ational Cancer Institute
Individual rates for diagnosis years 1975-1979 available in web browser version of Cancer Statistics Reviewa SEER 9 areas (San Francisco Connecticut Detroit Hawaii Iowa New Mexico Seattle Utah and Atlanta)
Rates are per 100000 and are age-adjusted to the 2000 US Std Population (19 age groups - Census P25-1130)- Statistic not shown Rate based on less than 16 cases for the time interval
All Races Whites Blacks Total Males Females Total Males Females Total Males Females
Year of Diagnosis1975-2016 181 238 138 184 242 141 183 237 1441975-1979 183 244 141 184 247 141 180 239 1361980 170 206 146 173 210 151 148 - -1981 164 197 141 159 190 139 238 300 1811982 168 216 135 165 219 131 175 - 1791983 169 223 133 164 215 132 251 344 1851984 168 240 118 163 241 110 258 261 2591985 197 276 143 200 280 147 206 289 -1986 168 219 129 171 225 131 154 - -1987 188 233 158 191 239 158 214 288 -1988 191 254 150 192 259 149 208 288 -1989 170 222 135 168 218 135 221 312 -1990 176 247 124 175 250 120 263 366 1951991 188 244 147 191 255 146 156 - 1751992 176 216 147 180 222 149 149 173 -1993 192 253 148 195 252 155 228 356 -1994 187 249 142 190 249 150 170 257 -1995 190 256 138 196 269 139 159 209 -1996 181 245 135 180 251 128 206 254 1831997 187 268 130 194 274 137 167 253 -1998 166 195 143 173 198 154 161 231 1201999 180 249 128 177 244 128 172 230 1262000 179 234 135 180 233 140 159 180 1332001 180 236 138 185 237 146 197 283 1362002 164 209 130 167 212 134 113 - -2003 166 224 120 176 237 127 147 218 -2004 181 256 122 187 266 125 151 206 1112005 169 226 125 177 235 131 178 244 1342006 184 240 141 194 251 151 158 217 1112007 171 232 123 180 249 123 143 183 1192008 185 239 143 186 232 151 189 267 1212009 180 238 134 179 231 139 190 289 1282010 188 251 140 188 254 136 191 212 1832011 195 255 147 206 271 151 166 195 1392012 193 233 161 197 238 165 212 281 1622013 193 260 139 198 267 140 172 226 1422014 197 259 146 195 252 146 205 196 2132015 185 230 146 194 241 152 169 185 1562016 204 265 156 216 272 171 198 288 140
Table 139Chronic Myeloid Leukemia
Age-adjusted SEER Incidencea Rates by Year Race and Sex
SEE
R C
ancer Statistics Review
1975-2016N
ational Cancer Institute
Individual rates for years of death 1975-1979 available in web browser version of Cancer Statistics Reviewa US Mortality Files National Center for Health Statistics Centers for Disease Control and Prevention
Rates are per 100000 and are age-adjusted to the 2000 US Std Population (19 age groups - Census P25-1130)- Statistic not shown Rate based on less than 16 cases for the time interval
All Races Whites Blacks Total Males Females Total Males Females Total Males Females
Year of Death1975-2016 752 1008 575 773 1038 589 656 865 5201975-1979 812 1092 624 829 1120 634 678 880 5361980 836 1121 646 854 1151 656 705 909 5671981 810 1089 624 824 1116 631 711 892 5861982 819 1104 631 833 1129 639 714 936 5671983 811 1093 626 824 1119 632 722 921 5901984 808 1068 637 823 1091 647 708 916 5691985 807 1077 631 823 1097 644 708 962 5421986 796 1071 616 810 1097 623 725 926 5911987 780 1031 614 791 1050 620 724 941 5851988 783 1060 600 795 1079 608 724 983 5581989 795 1062 615 807 1075 626 736 1034 5451990 798 1071 618 810 1090 626 744 996 5831991 799 1050 632 812 1064 644 745 1005 5801992 796 1071 613 811 1094 624 716 941 5681993 793 1066 609 804 1084 616 736 976 5771994 785 1057 603 800 1078 613 712 959 5541995 790 1080 598 804 1103 605 717 975 5531996 784 1053 605 797 1071 613 746 1009 5901997 771 1042 589 789 1068 601 683 923 5291998 758 1011 582 772 1031 591 704 937 5551999 768 1022 596 787 1047 609 674 878 5432000 769 1028 591 789 1054 605 671 907 5272001 764 1019 588 783 1046 602 674 880 5412002 754 1018 573 775 1046 585 673 891 5382003 745 1002 563 768 1037 576 654 847 5302004 729 981 552 747 1004 564 677 894 5392005 726 982 546 750 1014 563 607 811 4782006 723 970 546 748 997 566 627 884 4702007 708 954 533 730 986 546 619 807 5052008 709 954 533 732 983 549 627 865 4782009 706 953 525 731 986 541 605 814 4712010 691 925 520 716 958 537 575 746 4592011 695 928 524 718 960 539 599 774 4852012 683 921 507 708 957 522 577 756 4622013 675 909 503 703 943 523 568 770 4372014 662 882 496 691 921 515 547 717 4372015 628 846 464 655 882 482 520 684 4152016 627 828 475 653 864 491 543 687 449
Table 1310Leukemia
Age-adjusted US Deatha Rates by Year Race and Sex
SEE
R C
ancer Statistics Review
1975-2016N
ational Cancer Institute
a SEER 21 areas Rates are per 100000 and are age-adjusted to the 2000 US Std Population (19 age groups - Census P25-1130)unless noted
b US Mortality Files National Center for Health Statistics Centers for Disease Control and PreventionRates are per 100000 and are age-adjusted to the 2000 US Std Population (19 age groups - Census P25-1130) unless noted
c Rates are per 100000 and are age-adjusted to the world (WHO 2000-2025) standard million- Statistic not shown Rate based on less than 16 cases for the time interval
All Races Whites Blacks Total Males Females Total Males Females Total Males Females
SEER IncidenceAge at DiagnosisAge-Adjusted Rates 2012-2016All ages 141 181 109 149 191 115 109 139 89Under 65 71 83 58 74 87 61 58 66 5165 and over 625 855 457 668 909 487 460 641 349
All ages (WHO world std)c 109 137 86 116 145 90 85 105 71
Age-Specific Rates 2012-2016lt1 45 43 48 45 44 47 34 - 441-4 89 91 87 97 101 94 46 43 495-9 43 47 38 47 53 41 22 20 2410-14 33 38 28 34 38 30 26 31 2015-19 31 38 24 33 41 25 20 25 1520-24 29 32 25 30 35 25 24 22 2625-29 30 34 26 30 34 26 26 28 2430-34 37 42 32 37 43 32 33 33 3335-39 45 51 39 46 52 39 45 48 4240-44 61 71 51 63 73 53 58 69 4945-49 84 97 71 86 99 73 85 96 7450-54 127 156 99 133 164 103 104 123 8755-59 182 223 143 192 234 151 150 183 12260-64 271 346 202 285 365 210 230 279 19065-69 404 533 290 429 564 306 330 428 25670-74 549 735 394 584 777 419 416 563 31275-79 706 954 513 757 1015 552 535 755 39380-84 843 1180 611 902 1256 653 585 869 42885+ 880 1262 683 941 1356 725 567 810 466
US MortalityAge at DeathAge-Adjusted Rates 2012-2016All ages 65 88 49 68 91 51 55 72 44Under 65 18 22 15 18 22 15 20 23 1765 and over 392 544 283 411 570 296 299 410 232
All ages (WHO world std)c 37 48 28 38 49 29 33 43 27
Age-Specific Rates 2012-2016lt1 05 04 06 05 05 05 06 - -1-4 07 07 07 07 07 07 07 07 075-9 05 05 04 05 06 04 04 04 0310-14 06 06 05 06 06 05 05 06 0515-19 07 09 06 08 09 06 05 06 0420-24 09 11 06 09 11 07 09 10 0725-29 09 11 07 09 11 08 08 10 0730-34 10 12 08 10 12 08 11 13 1035-39 12 14 10 12 14 10 14 15 1240-44 16 17 14 16 17 15 18 18 1745-49 22 25 20 23 25 21 26 30 2250-54 34 40 28 34 41 28 39 44 3555-59 56 68 43 56 69 44 62 77 5060-64 93 118 70 95 121 70 101 130 7765-69 160 215 111 166 223 114 150 203 11070-74 272 364 194 285 380 202 231 302 18175-79 428 589 300 450 618 314 333 460 25180-84 615 863 441 647 903 462 457 633 35885+ 827 1192 638 875 1259 672 525 746 433
Table 1311Leukemia
SEER Incidencea and US Deathb Rates Age-Adjusted and Age-Specific Rates by Race and Sex
SEE
R C
ancer Statistics Review
1975-2016N
ational Cancer Institute
a SEER 21 areas Rates are per 100000 and are age-adjusted to the 2000 US Std Population (19 age groups - Census P25-1130)unless noted
b Rates are per 100000 and are age-adjusted to the world (WHO 2000-2025) standard million- Statistic not shown Rate based on less than 16 cases for the time interval
All Races Whites Blacks Total Males Females Total Males Females Total Males Females
Acute Lymphocytic LeukemiaAge at DiagnosisAge-Adjusted Rates 2012-2016All ages 17 19 15 19 21 16 10 11 09Under 65 17 20 15 19 22 16 10 11 0965 and over 16 18 13 17 20 14 10 12 09
All ages (WHO world std)b 19 21 16 20 23 18 10 11 09
Age-Specific Rates 2012-2016lt1 19 16 22 19 16 23 14 - -1-4 76 77 74 84 87 81 33 30 375-9 36 40 33 41 46 36 18 15 2010-14 23 26 19 24 27 21 14 19 0915-19 18 24 12 20 27 13 07 12 -20-24 10 14 07 12 16 07 05 06 0525-29 08 10 06 08 11 06 05 - -30-34 07 09 06 08 09 06 04 - -35-39 08 10 06 08 10 07 06 07 -40-44 08 09 06 08 10 06 06 07 -45-49 09 09 09 09 09 10 04 - -50-54 09 10 08 09 10 09 07 09 -55-59 11 12 11 12 13 11 11 12 1060-64 13 15 11 13 15 11 11 13 0965-69 14 14 13 15 16 14 07 - -70-74 16 19 13 17 20 14 - - -75-79 17 20 15 18 21 16 13 - -80-84 17 23 13 17 24 13 - - -85+ 15 19 13 16 20 14 - - -
Chronic Lymphocytic LeukemiaAge at DiagnosisAge-Adjusted Rates 2012-2016All ages 49 68 35 54 73 38 34 49 24Under 65 17 22 12 18 24 13 12 16 0865 and over 275 383 195 298 411 212 185 273 129
All ages (WHO world std)b 35 47 24 38 51 27 24 34 17
Age-Specific Rates 2012-2016lt1 - - - - - - - - -1-4 - - - - - - - - -5-9 - - - - - - - - -10-14 - - - - - - - - -15-19 - - - - - - - - -20-24 - - - - - - - - -25-29 01 01 - 01 - - - - -30-34 01 02 - 01 02 - - - -35-39 04 04 03 04 05 04 04 - -40-44 10 12 08 10 13 08 08 12 -45-49 22 28 17 24 30 19 18 24 1250-54 48 65 32 53 70 36 32 46 2055-59 80 103 58 88 113 64 51 66 3760-64 125 170 84 134 180 90 94 129 6665-69 189 258 129 204 274 140 135 188 9570-74 245 338 167 265 361 182 176 263 11675-79 306 423 216 333 455 236 213 321 14580-84 354 502 252 385 541 275 222 360 14685+ 379 543 294 413 594 318 218 302 183
Table 1312Lymphocytic Leukemia
SEER Incidencea Rates Age-Adjusted and Age-Specific Rates by Race and Sex
SEE
R C
ancer Statistics Review
1975-2016N
ational Cancer Institute
a SEER 21 areas Rates are per 100000 and are age-adjusted to the 2000 US Std Population (19 age groups - Census P25-1130)unless noted
b Rates are per 100000 and are age-adjusted to the world (WHO 2000-2025) standard million- Statistic not shown Rate based on less than 16 cases for the time interval
All Races Whites Blacks Total Males Females Total Males Females Total Males Females
Acute Myeloid LeukemiaAge at DiagnosisAge-Adjusted Rates 2012-2016All ages 43 52 35 44 54 36 37 44 33Under 65 20 21 19 20 21 19 20 20 2065 and over 201 269 152 213 284 160 155 210 123
All ages (WHO world std)b 32 38 28 33 40 28 29 33 27
Age-Specific Rates 2012-2016lt1 16 16 16 15 15 15 - - -1-4 10 10 10 09 09 09 11 10 115-9 04 04 04 04 04 04 03 - -10-14 07 08 06 07 08 06 09 09 0815-19 09 09 09 09 10 09 08 07 0820-24 11 10 12 11 10 12 12 11 1325-29 12 11 12 11 11 12 11 10 1230-34 14 15 14 14 15 14 17 15 1935-39 16 16 16 15 16 15 18 16 2040-44 21 22 21 22 22 22 22 21 2245-49 25 25 25 25 25 25 28 27 2950-54 35 38 32 36 40 33 33 32 3355-59 49 56 43 49 56 43 49 57 4360-64 78 91 67 82 97 68 70 75 6665-69 121 152 94 129 163 98 100 118 8670-74 183 236 139 192 247 145 151 189 12575-79 233 310 174 248 326 186 185 256 14080-84 286 393 212 302 413 223 207 314 14885+ 263 380 203 277 403 212 174 254 141
Chronic Myeloid LeukemiaAge at DiagnosisAge-Adjusted Rates 2012-2016All ages 19 24 14 19 25 15 18 22 15Under 65 11 13 09 11 12 09 11 13 1065 and over 76 106 55 80 111 57 62 82 49
All ages (WHO world std)b 15 19 11 15 19 12 14 17 12
Age-Specific Rates 2012-2016lt1 05 05 - 04 - - - - -1-4 01 - - 01 - - - - -5-9 01 - 01 01 - - - - -10-14 01 02 01 01 01 01 - - -15-19 03 03 02 02 03 02 03 - -20-24 05 06 04 05 06 04 04 - -25-29 07 09 06 07 08 06 07 10 -30-34 10 12 08 11 12 09 08 09 0835-39 11 13 09 11 13 10 12 13 1040-44 14 18 11 14 18 11 16 22 1045-49 18 21 15 17 20 14 25 28 2350-54 22 26 17 21 26 17 23 25 2055-59 25 29 22 26 29 23 25 28 2260-64 35 43 27 35 44 27 34 41 2965-69 49 67 34 50 68 33 55 68 4570-74 65 85 48 68 89 51 49 66 3675-79 91 124 65 97 132 69 69 98 5080-84 105 147 75 112 156 80 76 92 6785+ 102 155 75 107 164 76 75 109 60
Table 1313Myeloid Leukemia
SEER Incidencea Rates Age-Adjusted and Age-Specific Rates by Race and Sex
SEE
R C
ancer Statistics Review
1975-2016N
ational Cancer Institute
a Based on End Results data from a series of hospital registries and one population-based registryb SEER 9 areas (San Francisco Connecticut Detroit Hawaii Iowa New Mexico Seattle Utah Atlanta)
Based on follow-up of patients into 2016 Expected survival rates are derived from the US Annual Life Tablesc SEER 18 areas (San Francisco Connecticut Detroit Hawaii Iowa New Mexico Seattle Utah Atlanta San Jose-Monterey
Los Angeles Alaska Native Registry Rural Georgia California excluding SFSJMLA Kentucky Louisiana New Jersey andGeorgia excluding ATLRG) Expected survival rates are derived from life tables by socio-economic status geography and racedeveloped by the SEER programBased on follow-up of patients into 2016
d Period survival provides a 2015 estimate of survival by piecing together the most recent conditional survival estimatesfrom several cohorts It is computed here using three year calendar blocks (2010-2012 0-1 year survival)(2009-2011 1-2 year survival) (2008-2010 2-3 year survival) (2007-2009 3-4 year survival) (2006-2008 4-5 years survival)
e The difference between 1975-1977 and 2009-2015 is statistically significant (plt05)f The standard error is between 5 and 10 percentage pointsg The standard error is greater than 10 percentage points- Statistic could not be calculated due to fewer than 25 cases during the time period
All Races Whites Blacks Total Males Females Total Males Females Total Males Females
5-Year Relative Survival (Percent)Year of Diagnosis1960-1963a - - - 14 - - - - -1970-1973a - - - 22 - - - - -1975-1977b 341 330 356 345 336 358 334 304 3671978-1980b 360 350 373 367 358 380 282 273 2931981-1983b 373 369 378 381 378 385 339 334 3431984-1986b 405 401 411 416 413 420 327 315 3411987-1989b 429 440 413 439 455 418 350 327 3781990-1992b 452 446 461 465 463 468 357 305 4131993-1995b 476 484 464 487 495 475 413 416 4091996-1998b 484 486 481 498 497 498 386 390 3801999-2001b 510 520 495 520 530 507 437 451 4212002-2004b 583 584 581 591 594 588 540 543 5342005-2008b 623 635 607 633 643 620 560 599 5112009-2015b 658e 673e 637e 668e 682e 649e 596e 609e 582e
5-Year Period Survival (Percent)cd
2015 632 643 619 634 640 624 582 617 544
5-Year Relative Survival (Percent) 2009-2015c
Age at DiagnosisAges lt45 762 758 768 773 764 786 677 677 677Ages 45-54 722 737 698 735 746 716 628 662 586Ages 55-64 693 699 683 704 707 698 589 605 566Ages 65-74 610 610 611 614 610 620 541 553 523Ages 75+ 421 424 417 427 428 425 337 357 316Ages lt65 729 731 725 739 738 741 637 650 621Ages 65+ 508 517 496 511 518 502 446 474 415
Table 1314Leukemia
5-Year Relative and Period Survival (Percent) by Race Sex Diagnosis Year and Age
SEE
R C
ancer Statistics Review
1975-2016N
ational Cancer Institute
a SEER 9 areas (San Francisco Connecticut Detroit Hawaii Iowa New Mexico Seattle Utah Atlanta)Based on follow-up of patients into 2016 Expected survival rates are derived from the US Annual Life Tables
b SEER 18 areas (San Francisco Connecticut Detroit Hawaii Iowa New Mexico Seattle Utah Atlanta San Jose-MontereyLos Angeles Alaska Native Registry Rural Georgia California excluding SFSJMLA Kentucky Louisiana New Jersey andGeorgia excluding ATLRG) Expected survival rates are derived from life tables by socio-economic status geography and racedeveloped by the SEER programBased on follow-up of patients into 2016
c Period survival provides a 2015 estimate of survival by piecing together the most recent conditional survival estimatesfrom several cohorts It is computed here using three year calendar blocks (2010-2012 0-1 year survival)(2009-2011 1-2 year survival) (2008-2010 2-3 year survival) (2007-2009 3-4 year survival) (2006-2008 4-5 years survival)
d The difference between 1975-1977 and 2009-2015 is statistically significant (plt05)e The standard error is between 5 and 10 percentage pointsf The standard error is greater than 10 percentage points- Statistic could not be calculated due to fewer than 25 cases during the time period
All Races Whites Blacks Total Males Females Total Males Females Total Males Females
Acute Lymphocytic Leukemia5-Year Relative Survival (Percent)Year of Diagnosis1975-1977a 406 369 456 408 374 457 335e - -1987-1989a 544 537 552 550 547 553 447e 420e 471e1990-1992a 580 545 631 577 549 620 571e 504e 633e1993-1995a 602 578 636 598 578 627 532e 459e 638e1996-1998a 655 644 669 664 643 690 556e 591e 502e1999-2001a 635 634 635 648 652 642 566e 503e 630e2002-2004a 673 661 689 676 666 691 645e 594e 697e2005-2008a 701 693 713 700 686 720 652 700 551e2009-2015a 717d 723d 710d 726d 737d 713d 625d 607 647e
5-Year Period Survival (Percent)bc2015 691 684 698 685 674 700 650 650 648
5-Year Relative Survival (Percent) 2009-2015bAge at DiagnosisAges lt45 806 795 821 807 791 828 763 757 770Ages 45-54 381 365 403 379 373 389 257e - -Ages 55-64 280 275 284 294 288 298 173e 228e -Ages 65-74 239 188 291 214 170 259 - - -Ages 75+ 91 97 83 100 96 100 00 - -Ages lt65 733 725 743 735 724 749 668 668 668Ages 65+ 174 151 196 166 141 191 154e - 189e
Chronic Lymphocytic Leukemia5-Year Relative Survival (Percent)Year of Diagnosis1975-1977a 671 647 703 679 654 711 569e 551e 590e1987-1989a 727 727 729 739 740 737 581 555e 615e1990-1992a 741 718 773 753 731 784 522 434e 609e1993-1995a 772 771 773 783 781 786 633 640e 621e1996-1998a 756 739 778 767 752 787 581 515e 660e1999-2001a 786 782 792 794 788 803 666 655e 666e2002-2004a 840 832 852 845 837 856 770 742e 807e2005-2008a 862 861 863 864 863 864 841 857 8122009-2015a 882d 887d 875d 886d 889d 883d 785d 801d 763
5-Year Period Survival (Percent)bc2015 856 855 858 853 848 860 772 818 710
5-Year Relative Survival (Percent) 2009-2015bAge at DiagnosisAges lt45 940 927 960 942 932 954 905e 879e -Ages 45-54 939 934 948 945 935 964 840 889 761eAges 55-64 922 916 933 924 916 938 836 831 843Ages 65-74 874 856 905 876 853 913 773 784 756Ages 75+ 731 727 736 729 724 734 584 586e 564eAges lt65 928 922 939 931 923 947 843 854 824Ages 65+ 801 796 807 799 792 807 691 713 662
Table 1315Lymphocytic Leukemia
5-Year Relative and Period Survival (Percent) by Race Sex Diagnosis Year and Age
SEE
R C
ancer Statistics Review
1975-2016N
ational Cancer Institute
a SEER 9 areas (San Francisco Connecticut Detroit Hawaii Iowa New Mexico Seattle Utah Atlanta)Based on follow-up of patients into 2016 Expected survival rates are derived from the US Annual Life Tables
b SEER 18 areas (San Francisco Connecticut Detroit Hawaii Iowa New Mexico Seattle Utah Atlanta San Jose-MontereyLos Angeles Alaska Native Registry Rural Georgia California excluding SFSJMLA Kentucky Louisiana New Jersey andGeorgia excluding ATLRG) Expected survival rates are derived from life tables by socio-economic status geography and racedeveloped by the SEER programBased on follow-up of patients into 2016
c Period survival provides a 2015 estimate of survival by piecing together the most recent conditional survival estimatesfrom several cohorts It is computed here using three year calendar blocks (2010-2012 0-1 year survival)(2009-2011 1-2 year survival) (2008-2010 2-3 year survival) (2007-2009 3-4 year survival) (2006-2008 4-5 years survival)
d The difference between 1975-1977 and 2009-2015 is statistically significant (plt05)e The standard error is between 5 and 10 percentage pointsf The standard error is greater than 10 percentage points- Statistic could not be calculated due to fewer than 25 cases during the time period
All Races Whites Blacks Total Males Females Total Males Females Total Males Females
Acute Myeloid Leukemia5-Year Relative Survival (Percent)Year of Diagnosis1975-1977a 62 55 70 58 54 62 101 82 1171987-1989a 115 92 141 113 97 132 92 44 157e1990-1992a 138 126 152 135 122 150 135 129 1391993-1995a 161 149 174 153 141 167 215 206e 2201996-1998a 170 159 183 156 145 171 221 252 1821999-2001a 192 188 197 187 176 199 193 248 1422002-2004a 234 209 264 232 208 260 253 265 2402005-2008a 249 235 265 242 228 257 239 193 2772009-2015a 294d 291d 298d 290d 284d 299d 292d 280d 301d
5-Year Period Survival (Percent)bc2015 286 278 294 282 276 289 283 262 301
5-Year Relative Survival (Percent) 2009-2015bAge at DiagnosisAges lt45 604 585 624 621 599 645 511 482 538Ages 45-54 441 439 444 456 450 463 337 342 336Ages 55-64 300 281 325 308 285 338 231 234 224Ages 65-74 139 137 141 145 144 146 103 78 131Ages 75+ 34 40 27 34 41 27 24 - 20Ages lt65 466 444 491 474 449 504 393 371 414Ages 65+ 79 85 72 82 89 73 64 58 71
Chronic Myeloid Leukemia5-Year Relative Survival (Percent)Year of Diagnosis1975-1977a 218 193 251 205 184 234 277e 216e 355e1987-1989a 303 306 298 301 310 290 333e 281e 413e1990-1992a 307 296 322 303 300 306 349e 255e 449e1993-1995a 355 353 358 352 351 352 356e 328e 402e1996-1998a 371 377 363 380 376 385 310 304e 314e1999-2001a 473 459 492 459 441 483 490e 496e 481e2002-2004a 543 530 561 526 514 541 630e 621e 640e2005-2008a 631 632 629 617 615 621 643 664e 608e2009-2015a 697d 681d 718d 690d 677d 707d 736d 711d 763d
5-Year Period Survival (Percent)bc2015 695 683 712 681 666 702 723 714 735
5-Year Relative Survival (Percent) 2009-2015bAge at DiagnosisAges lt45 899 889 913 916 905 934 797 786 812Ages 45-54 874 860 891 871 858 888 871 842 900Ages 55-64 776 748 816 781 750 826 698 676e 719eAges 65-74 611 579 656 609 578 654 584e 526e 637eAges 75+ 326 305 346 321 302 336 362e 362f 362eAges lt65 851 836 873 856 839 883 790 773 808Ages 65+ 462 444 484 456 441 475 495 471e 515e
Table 1316Myeloid Leukemia
5-Year Relative and Period Survival (Percent) by Race Sex Diagnosis Year and Age
SEE
R C
ancer Statistics Review
1975-2016N
ational Cancer Institute
a Based on the SEER 9 areas (San Francisco Connecticut Detroit Hawaii Iowa New Mexico Seattle Utah and Atlanta)Expected survival rates are derived from the US Annual Life Tables
1975- 1980- 1985- 1990-1979 1984 1989 1994 1995 1996 1997 1998 1999 2000 2001 2002 2003 2004 2005 2006 2007 2008 2009 2010 2011 2012 2013 2014 2015
Survival Time
1-year 608 626 648 669 681 682 679 667 659 669 706 722 732 751 742 765 769 766 774 783 794 791 790 791 8062-year 501 525 553 575 589 599 598 580 583 590 630 649 662 677 684 705 706 702 709 725 732 725 732 7343-year 437 465 496 528 543 554 549 541 547 551 590 619 624 643 647 673 676 665 684 692 703 692 6984-year 388 417 455 491 507 519 509 503 516 520 567 596 595 619 627 647 653 639 658 676 683 6735-year 346 376 423 461 481 487 483 482 484 499 543 578 575 596 610 626 637 619 635 659 6656-year 314 351 399 435 457 465 458 461 462 485 524 560 556 572 593 607 622 604 613 6477-year 291 325 371 409 442 451 438 446 444 473 510 544 537 560 579 591 614 587 6018-year 270 304 350 388 417 438 432 431 430 457 496 535 519 546 561 573 603 5769-year 250 285 330 373 406 420 418 421 421 449 483 519 507 530 546 561 59310-year 237 269 316 360 390 406 406 410 406 438 471 504 489 515 532 54511-year 224 257 299 347 378 398 387 397 392 426 459 492 473 499 52712-year 212 246 288 336 371 387 377 390 383 419 449 483 460 49213-year 204 236 280 327 367 382 370 380 372 404 442 466 45414-year 198 229 272 318 356 371 368 370 367 392 434 45615-year 192 223 267 313 353 361 362 358 359 383 42316-year 185 214 261 306 350 359 361 350 353 37417-year 181 207 256 300 340 355 352 346 34718-year 177 201 253 294 330 351 346 34319-year 171 195 248 291 326 343 34420-year 166 191 244 286 319 338
Table 1317Leukemia
SEERa Relative Survival (Percent)By Year of Diagnosis
All Races Males and Females
Year of Diagnosis
SEE
R C
ancer Statistics Review
1975-2016N
ational Cancer Institute
a Based on the SEER 9 areas (San Francisco Connecticut Detroit Hawaii Iowa New Mexico Seattle Utah and Atlanta)Expected survival rates are derived from the US Annual Life Tables
1975- 1980- 1985- 1990-1979 1984 1989 1994 1995 1996 1997 1998 1999 2000 2001 2002 2003 2004 2005 2006 2007 2008 2009 2010 2011 2012 2013 2014 2015
Survival Time
1-year 604 628 655 679 692 697 688 667 668 688 729 731 742 767 761 770 780 775 791 793 806 797 803 812 8172-year 494 524 561 583 604 616 611 585 590 608 648 652 669 687 701 706 719 716 727 740 746 733 749 7513-year 427 460 499 532 556 573 552 546 552 573 608 624 627 653 664 674 689 679 699 712 719 698 7144-year 377 411 459 494 516 535 505 505 520 539 581 598 601 627 650 648 667 650 677 690 697 6775-year 334 371 429 462 482 495 479 484 480 523 553 573 578 602 630 626 653 632 656 673 6846-year 303 343 404 435 452 471 459 461 461 508 529 554 557 575 609 602 635 615 631 6617-year 277 318 373 409 439 458 438 444 439 498 514 531 535 564 594 588 625 595 6168-year 254 294 354 385 417 446 430 430 423 478 500 520 514 549 572 563 616 5839-year 232 275 332 371 404 423 421 419 415 464 486 507 501 526 553 548 60510-year 219 260 317 358 382 407 413 410 401 454 473 490 479 511 539 52611-year 205 249 302 346 377 398 391 393 383 444 461 474 464 496 53312-year 193 242 290 334 371 390 380 384 375 437 452 467 455 49113-year 186 234 283 325 367 389 373 369 363 420 442 455 44714-year 179 227 277 315 357 379 370 358 357 410 433 44715-year 175 221 269 309 352 371 365 349 351 399 42216-year 168 212 263 303 347 369 360 341 346 38717-year 164 204 260 296 339 366 348 335 34318-year 159 199 257 290 324 364 345 33119-year 154 192 253 288 322 355 34120-year 146 187 249 283 316 347
Table 1318Leukemia
SEERa Relative Survival (Percent)By Year of Diagnosis
All Races Males
Year of Diagnosis
SEE
R C
ancer Statistics Review
1975-2016N
ational Cancer Institute
a Based on the SEER 9 areas (San Francisco Connecticut Detroit Hawaii Iowa New Mexico Seattle Utah and Atlanta)Expected survival rates are derived from the US Annual Life Tables
1975- 1980- 1985- 1990-1979 1984 1989 1994 1995 1996 1997 1998 1999 2000 2001 2002 2003 2004 2005 2006 2007 2008 2009 2010 2011 2012 2013 2014 2015
Survival Time
1-year 613 623 638 655 665 664 666 667 646 643 675 710 719 729 715 759 755 754 751 769 778 782 772 761 7912-year 509 527 542 564 569 578 580 574 573 564 606 645 653 664 660 705 689 684 684 705 714 716 709 7093-year 450 471 492 523 525 529 544 534 539 522 564 612 619 628 624 673 657 647 663 666 681 685 6774-year 402 424 449 485 495 498 514 500 511 494 548 594 587 608 595 646 633 624 633 658 664 6685-year 361 384 414 459 480 475 489 479 489 466 530 584 570 588 582 627 615 601 607 641 6396-year 328 360 392 435 464 457 456 461 463 455 516 567 556 569 572 613 602 589 588 6297-year 309 334 367 410 447 443 438 448 450 438 504 561 539 556 558 594 598 575 5798-year 290 316 344 391 416 428 433 433 438 428 490 556 526 542 546 585 582 5639-year 273 299 326 376 409 416 413 424 429 428 477 535 515 534 535 576 57610-year 259 281 315 364 399 405 396 409 414 416 468 522 502 521 521 56811-year 247 269 295 347 378 398 383 403 403 401 456 515 486 503 51812-year 235 250 285 338 372 382 373 397 393 395 445 505 468 49313-year 228 239 276 329 365 373 366 392 385 383 442 481 46314-year 220 232 267 323 355 361 363 385 380 367 434 46815-year 214 225 264 318 353 348 359 369 368 363 42416-year 206 217 258 310 353 344 359 361 363 35817-year 201 210 252 305 342 340 357 358 35018-year 198 205 248 301 336 334 347 35819-year 193 198 241 296 330 326 34620-year 190 195 238 290 321 323
Table 1319Leukemia
SEERa Relative Survival (Percent)By Year of Diagnosis
All Races Females
Year of Diagnosis
SEE
R C
ancer Statistics Review
1975-2016N
ational Cancer Institute
Devcan 677 April 2019 National Cancer Institute (httpssurveillancecancergovdevcan)Source Incidence data are from the SEER 21 areas (San Francisco Connecticut Detroit Hawaii Iowa New Mexico Seattle Utah Atlanta
San Jose-Monterey Los Angeles Alaska Native Registry Rural Georgia California excluding SFSJMLA Kentucky Louisiana New JerseyGeorgia excluding ATLRG Idaho New York and Massachusetts) Mortality data are from the NCHS public use data file for the total US
a Underlying incidence and mortality data for American IndianAlaska Native are based on the PRCDA(PurchasedReferred Care DeliveryAreas) counties
b Hispanic is not mutually exclusive from whites blacks AsianPacific Islanders and American IndiansAlaska NativesUnderlying incidence data for Hispanics are based on NHIA and exclude cases from the Alaska Native Registry
- Statistic could not be calculatedA percent of 000 represents a value that is below 0005
Risk of Being Risk of Being
Race Current Diagnosed with Cancer Risk of Dying Race Current Diagnosed with Cancer Risk of Dying
Ethnicity Age +10 yrs +20 yrs +30 yrs Ever from Cancer Ethnicity Age +10 yrs +20 yrs +30 yrs Ever from Cancer
All Races 0 006 009 012 156 082 Asian 0 005 008 011 099 058
10 003 006 010 152 082 Pacific 10 003 006 009 095 058
20 003 007 014 149 082 Islander 20 003 006 010 092 058
30 004 011 026 147 082 30 003 008 016 090 057
40 007 022 051 145 082 40 004 012 026 087 057
50 015 045 089 141 082 50 008 022 047 083 056
60 031 079 121 134 082 60 014 040 066 078 054
70 053 101 - 115 080 70 028 055 - 067 051
80 062 - - 082 068 80 032 - - 047 040
White 0 006 010 013 164 085 American 0 005 007 009 085 040
10 003 007 011 159 086 Indian 10 002 004 008 081 040
20 003 007 014 156 085 Alaska 20 002 006 010 079 039
30 004 011 027 155 085 Nativea 30 004 008 019 078 039
40 007 023 053 153 085 40 004 015 030 076 040
50 016 047 095 149 086 50 012 027 051 075 040
60 033 083 127 141 086 60 017 042 061 068 040
70 057 106 - 121 084 70 029 051 - 058 038
80 066 - - 086 071 80 029 - - 038 025
Black 0 003 006 008 107 058 Hispanicb 0 007 011 015 124 066
10 002 005 009 105 059 10 005 008 012 118 066
20 003 006 013 104 059 20 004 008 014 114 065
30 004 011 022 102 058 30 004 010 021 111 064
40 007 019 041 100 058 40 006 017 037 108 064
50 013 035 066 097 058 50 011 031 063 104 063
60 025 058 083 091 058 60 021 054 085 097 062
70 039 069 - 079 057 70 037 070 - 083 058
80 042 - - 056 048 80 042 - - 058 049
Table 1320
Leukemia
Risk of Being Diagnosed With Cancer in 10 20 and 30 Years
Lifetime Risk of Being Diagnosed with Cancer Given Alive and Cancer-Free at Current Age and
Lifetime Risk of Dying from Cancer Given Alive at Current Age
Both Sexes 2014-2016 By RaceEthnicity
SEE
R C
ancer Statistics Review
1975-2016N
ational Cancer Institute
Devcan 677 April 2019 National Cancer Institute (httpssurveillancecancergovdevcan)Source Incidence data are from the SEER 21 areas (San Francisco Connecticut Detroit Hawaii Iowa New Mexico Seattle Utah Atlanta
San Jose-Monterey Los Angeles Alaska Native Registry Rural Georgia California excluding SFSJMLA Kentucky Louisiana New JerseyGeorgia excluding ATLRG Idaho New York and Massachusetts) Mortality data are from the NCHS public use data file for the total US
a Underlying incidence and mortality data for American IndianAlaska Native are based on the PRCDA(PurchasedReferred Care DeliveryAreas) counties
b Hispanic is not mutually exclusive from whites blacks AsianPacific Islanders and American IndiansAlaska NativesUnderlying incidence data for Hispanics are based on NHIA and exclude cases from the Alaska Native Registry
- Statistic could not be calculatedA percent of 000 represents a value that is below 0005
Risk of Being Risk of Being
Race Current Diagnosed with Cancer Risk of Dying Race Current Diagnosed with Cancer Risk of Dying
Ethnicity Age +10 yrs +20 yrs +30 yrs Ever from Cancer Ethnicity Age +10 yrs +20 yrs +30 yrs Ever from Cancer
All Races 0 006 010 013 186 096 Asian 0 005 009 011 119 072
10 004 007 012 182 097 Pacific 10 004 007 010 115 072
20 003 008 016 179 097 Islander 20 003 007 012 111 071
30 005 013 030 177 097 30 004 009 019 109 071
40 008 026 062 176 098 40 005 015 033 106 070
50 018 056 112 173 099 50 010 028 062 102 069
60 040 101 152 166 101 60 019 054 084 096 068
70 071 129 - 146 101 70 038 071 - 084 065
80 082 - - 105 088 80 040 - - 056 052
White 0 007 011 014 195 101 American 0 006 009 011 110 048
10 004 008 012 190 102 Indian 10 003 005 010 105 048
20 004 008 016 187 101 Alaska 20 002 007 011 103 048
30 005 013 031 186 101 Nativea 30 005 009 021 103 048
40 009 027 065 184 102 40 005 017 041 102 049
50 019 058 118 181 103 50 013 039 075 102 051
60 042 107 160 174 106 60 028 067 087 097 051
70 075 136 - 153 105 70 046 070 - 081 049
80 087 - - 110 091 80 034 - - 049 030
Black 0 003 006 008 122 065 Hispanicb 0 007 013 017 141 080
10 003 006 009 122 066 10 005 010 015 135 080
20 003 006 014 120 065 20 005 009 016 130 079
30 004 011 025 119 066 30 005 011 023 127 078
40 008 022 048 118 066 40 007 018 040 124 078
50 015 042 079 115 067 50 012 034 072 120 078
60 031 071 102 112 068 60 024 064 100 114 078
70 051 089 - 101 068 70 046 086 - 102 077
80 058 - - 077 061 80 053 - - 074 070
Table 1321
Leukemia
Risk of Being Diagnosed With Cancer in 10 20 and 30 Years
Lifetime Risk of Being Diagnosed with Cancer Given Alive and Cancer-Free at Current Age and
Lifetime Risk of Dying from Cancer Given Alive at Current Age
Males 2014-2016 By RaceEthnicity
SEE
R C
ancer Statistics Review
1975-2016N
ational Cancer Institute
Devcan 677 April 2019 National Cancer Institute (httpssurveillancecancergovdevcan)Source Incidence data are from the SEER 21 areas (San Francisco Connecticut Detroit Hawaii Iowa New Mexico Seattle Utah Atlanta
San Jose-Monterey Los Angeles Alaska Native Registry Rural Georgia California excluding SFSJMLA Kentucky Louisiana New JerseyGeorgia excluding ATLRG Idaho New York and Massachusetts) Mortality data are from the NCHS public use data file for the total US
a Underlying incidence and mortality data for American IndianAlaska Native are based on the PRCDA(PurchasedReferred Care DeliveryAreas) counties
b Hispanic is not mutually exclusive from whites blacks AsianPacific Islanders and American IndiansAlaska NativesUnderlying incidence data for Hispanics are based on NHIA and exclude cases from the Alaska Native Registry
- Statistic could not be calculatedA percent of 000 represents a value that is below 0005
Risk of Being Risk of Being
Race Current Diagnosed with Cancer Risk of Dying Race Current Diagnosed with Cancer Risk of Dying
Ethnicity Age +10 yrs +20 yrs +30 yrs Ever from Cancer Ethnicity Age +10 yrs +20 yrs +30 yrs Ever from Cancer
All Races 0 006 008 011 129 068 Asian 0 005 008 010 083 048
10 003 005 009 125 069 Pacific 10 003 005 008 078 047
20 003 006 012 122 068 Islander 20 002 005 009 075 047
30 003 009 021 120 068 30 003 006 013 073 046
40 006 018 039 118 068 40 004 010 021 071 046
50 012 034 068 114 067 50 007 017 035 068 045
60 023 059 093 106 067 60 011 029 051 063 044
70 039 077 - 091 064 70 019 042 - 054 040
80 048 - - 066 055 80 026 - - 040 033
White 0 006 009 011 135 071 American 0 003 005 007 061 031
10 003 005 009 131 071 Indian 10 002 003 007 058 031
20 003 006 012 128 071 Alaska 20 002 005 008 056 031
30 003 010 022 126 071 Nativea 30 004 007 017 055 031
40 006 019 042 124 070 40 003 014 020 053 031
50 013 036 072 120 070 50 011 017 030 051 031
60 024 062 099 112 069 60 007 021 038 042 030
70 042 081 - 096 067 70 015 035 - 039 029
80 051 - - 069 057 80 025 - - 030 022
Black 0 004 006 008 095 053 Hispanicb 0 006 010 013 110 056
10 002 004 008 093 054 10 004 007 010 105 056
20 002 006 012 091 053 20 003 006 012 101 055
30 004 010 020 089 053 30 003 009 019 099 054
40 006 016 035 087 053 40 006 016 034 096 054
50 011 029 054 083 052 50 010 028 055 091 052
60 020 047 069 077 051 60 019 046 073 084 050
70 030 055 - 065 049 70 030 059 - 070 046
80 033 - - 046 042 80 035 - - 048 037
Table 1322
Leukemia
Risk of Being Diagnosed With Cancer in 10 20 and 30 Years
Lifetime Risk of Being Diagnosed with Cancer Given Alive and Cancer-Free at Current Age and
Lifetime Risk of Dying from Cancer Given Alive at Current Age
Females 2014-2016 By RaceEthnicity
SEER Cancer Statistics Review 1975-2016 National Cancer Institute
The AAPC is the Average Annual Percent Change over the time interval The AAPCs are calculated bythe Joinpoint Regression Program Version 47 February 2019 National Cancer Institute
- Statistic not shown Rate based on less than 16 cases for the time intervalTrend based on less than 10 cases for at least one year within the time interval
a Rates are age-adjusted to the 2000 US Std Population (19 age groups - Census P25-1130) Trendsare based on rates age-adjusted to the 2000 US Std Population (19 age groups - Census P25-1130)
b The SEER 9 areas are San Francisco Connecticut Detroit Hawaii Iowa New Mexico SeattleUtah and AtlantaThe SEER 21 areas comprise the SEER 9 areas plus San Jose-Monterey Los Angeles the AlaskaNative Registry Rural Georgia California excluding SFSJMLA Kentucky Louisiana New JerseyGeorgia excluding ATLRG Idaho New York and Massachusetts
c The 2007-2016 AAPC estimates are based on a Joinpoint analysis with up to 3 Joinpoints overdiagnosis years 2000-2016
d The 2007-2016 AAPC estimates are based on a Joinpoint analysis with up to 5 Joinpoints overdiagnosis years 1975-2016
e Hispanic and Non-Hispanic are not mutually exclusive from whites blacks AsianPacificIslanders and American IndiansAlaska Natives Incidence data for Hispanics and Non-Hispanicsare based on NHIA and exclude cases from the Alaska Native Registry
f Incidence data for American IndianAlaska Native are based on the PurchasedReferred CareDelivery Area (PRCDA) counties
g US Mortality Files National Center for Health Statistics CDCh The 2007-2016 mortality AAPCs are based on a Joinpoint analysis using years of death 2000-2016 The APC is significantly different from zero (plt05)
SEER Incidence SEER 21 Areasb SEER 21 Areasb SEER 9 Areasb
Rate 2012-2016 Trend 2007-2016c Trend 2007-2016d
Rate per 100000 persons AAPC () AAPC ()
Total Males Females Total Males Females Total Males Females RaceEthnicity
All Races 141 181 109 -04 -02 -06 -03 02 03
White 149 191 115 -05 -05 -07 04 03 05White Hispanice 112 134 94 01 -02 03 - - -White Non-Hispanice 153 197 116 -05 -05 -08 - - -
Black 109 139 89 06 02 07 01 01 02
AsianPacific Islander 78 97 63 01 00 02 - - -
Amer IndAlaska Natf 86 110 66 08 21 -01 - - -
Hispanice 108 130 91 02 00 03 - - -
US Mortalityg Rate 2012-2016 Trend 2007-2016h
Rate per 100000 persons AAPC ()
Total Males Females Total Males FemalesRaceEthnicity
All Races 65 88 49 -16 -17 -13
White 68 91 51 -14 -16 -12White Hispanice 50 63 41 -07 -08 -06White Non-Hispanice 69 93 51 -14 -15 -12
Black 55 72 44 -15 -17 -15
AsianPacific Islander 36 47 28 -18 -07 -23
Amer IndAlaska NatTotal US 31 42 23 -22 -09 -36PRCDA Counties 41 54 30 -16 -05 -28Non-PRCDA Counties 20 28 15 -31 -13 -50
Hispanice 47 60 38 -08 -09 -07
Table 1323Leukemia
SEER Incidence and US MortalityAge-Adjusted Rates and Trendsa
By RaceEthnicity and Sex
SEE
R C
ancer Statistics Review
1975-2016N
ational Cancer Institute
a Rates are per 100000 and are age-adjusted to the 2000 US Std Population (19 age groups - Census P25-1130)b The SEER 9 areas are San Francisco Connecticut Detroit Hawaii Iowa New Mexico Seattle Utah and Atlanta
The SEER 13 areas comprise the SEER 9 areas plus San Jose-Monterey Los Angeles the Alaska Native Registry and Rural GeorgiaThe SEER 18 areas comprise the SEER 13 areas plus California excluding SFSJMLA Kentucky Louisiana New Jersey and Georgiaexcluding ATLRGThe SEER 21 areas comprise the SEER 18 areas plus Idaho New York and Massachusetts
- Statistic not shown Rate based on less than 16 cases for the time interval
All Races Whites Blacks Total Males Females Total Males Females Total Males Females
SEER Incidence Ratesa 2012-2016
California 1239 1590 949 1337 1715 1020 1039 1334 813Greater Bay Area 1231 1619 915 1400 1844 1028 1098 1406 859San Francisco-Oakland 1212 1596 906 1389 1823 1034 1077 1336 881San Jose-Monterey 1259 1651 925 1410 1869 1011 1239 1787 -
Los Angeles 1173 1469 933 1291 1622 1016 1050 1294 884Greater California 1271 1633 968 1334 1709 1017 1007 1338 729
Connecticut 1406 1768 1117 1431 1790 1142 976 1126 867Detroit 1584 2050 1230 1707 2222 1300 1204 1485 1018Georgia 1430 1841 1120 1537 1970 1189 1139 1487 935Atlanta 1382 1819 1064 1563 2017 1207 1138 1557 884Rural Georgia 1411 1586 1206 1510 1773 1196 1248 - 1236Greater Georgia 1455 1863 1144 1531 1965 1182 1140 1450 968
Hawaii 1073 1339 843 1388 1612 1139 - - -Idaho 1588 1950 1263 1604 1973 1272 - - -Iowa 1627 2127 1222 1630 2133 1221 1416 1743 1076Kentucky 1566 1983 1234 1577 1995 1241 1159 1446 922Louisiana 1405 1789 1104 1518 1918 1197 1103 1393 890Massachusetts 1108 1429 854 1118 1448 856 787 1050 620New Jersey 1524 1962 1188 1541 1982 1199 1136 1469 928New Mexico 1299 1550 1086 1310 1556 1101 1045 - -New York 1623 2119 1244 1752 2281 1335 1068 1360 887Seattle-Puget Sound 1568 2020 1188 1634 2084 1249 1486 1929 1077Utah 1375 1793 1009 1401 1825 1029 - - -
SEER 9 Areasb 1419 1823 1094 1521 1945 1171 1154 1460 941SEER 13 Areasb 1357 1737 1049 1473 1882 1134 1126 1419 922SEER 18 Areasb 1376 1761 1066 1461 1867 1127 1114 1414 907SEER 21 Areasb 1407 1807 1088 1491 1912 1147 1089 1386 889
Table 1324Leukemia
Age-Adjusted SEER Incidence Ratesa
By Registry Race and Sex
SEE
R C
ancer Statistics Review
1975-2016N
ational Cancer Institute
a US Mortality Files National Center for Health Statistics Centers for Disease Control and PreventionRates are per 100000 and are age-adjusted to the 2000 US Std Population (19 age groups - Census P25-1130)
b The SEER 9 areas are San Francisco Connecticut Detroit Hawaii Iowa New Mexico Seattle Utah and AtlantaThe SEER 13 areas comprise the SEER 9 areas plus San Jose-Monterey Los Angeles the Alaska Native Registry and Rural GeorgiaThe SEER 18 areas comprise the SEER 13 areas plus California excluding SFSJMLA Kentucky Louisiana New Jersey and Georgiaexcluding ATLRGThe SEER 21 areas comprise the SEER 18 areas plus Idaho New York and Massachusetts
- Statistic not shown Rate based on less than 16 cases for the time interval
All Races Whites Blacks Total Males Females Total Males Females Total Males Females
SEER Death Ratesa 2012-2016
California 617 811 470 671 885 507 560 711 461Greater Bay Area 563 759 419 640 869 470 551 742 424San Francisco-Oakland 551 753 405 631 871 455 544 726 421San Jose-Monterey 584 768 446 653 863 495 604 - -
Los Angeles 608 797 468 675 894 513 571 717 483Greater California 639 835 489 677 886 515 553 687 458
Connecticut 622 837 465 639 862 474 536 665 449Detroit 662 915 485 691 967 494 573 723 475Georgia 614 817 467 642 855 478 538 706 438Atlanta 568 757 437 615 802 483 487 658 374Rural Georgia 581 628 538 579 635 - - - -Greater Georgia 639 851 482 654 879 477 576 745 483
Hawaii 463 593 362 543 632 440 - - -Idaho 655 846 497 661 865 492 - - -Iowa 693 961 498 700 963 508 - - -Kentucky 742 949 592 750 953 603 633 894 455Louisiana 677 906 514 705 953 520 603 776 498Massachusetts 622 830 478 647 869 490 463 524 444New Jersey 615 810 478 657 871 504 474 549 429New Mexico 560 759 400 589 794 421 - - -New York 621 842 466 675 910 506 450 602 356Seattle-Puget Sound 618 795 481 637 807 503 708 975 499Utah 679 865 526 693 876 542 - - -
SEER 9 Areasb 610 818 457 651 869 487 540 711 427SEER 13 Areasb 609 810 460 658 874 494 544 708 437SEER 18 Areasb 630 832 480 671 887 508 552 705 455SEER 21 Areasb 628 834 477 670 889 506 520 670 426
Total US 654 876 489 681 912 506 550 721 439
Table 1325Leukemia
Age-Adjusted SEER Death Ratesa
By Registry Race and Sex
SEER Cancer Statistics Review 1975-2016 National Cancer Institute
a US Mortality Files National Center for Health Statistics Centers for Disease Control andPrevention Rates are per 100000 and are age-adjusted to the 2000 US Std Population (19age groups - Census P25-1130)
b Difference between state rate and total US rate is statistically significant (plt=0002)c Absolute percent difference between state rate and total US rate is 15 or mored Rank of state level death rate and the 95 confidence intervals (low high) for the rankSE Standard error of the ratePD Percent difference between state rate and total US rate- Statistic not shown Rate based on less than 16 cases for the time interval
State Rate SE Rank(CI)d PD TOTAL US 654 002
High Five StatesOklahoma 790 019 01(0108) 2083c
West Virginia 749 025 02(0123) 1449South Dakota 747 040 03(0133) 1415Kentucky 742 018 04(0116) 1352Kansas 742 022 05(0122) 1350
Low Five StatesColorado 609 016 47(2649) -692Alaska 596 050 48(0451) -885New Mexico 560 022 49(3650) -1430DC 504 041 50(3251) -2293c
Hawaii 463 024 51(4951) -2913c
State Rate SE Rank(CI)d PD State Rate SE Rank(CI)d PD
Alabama 689 016 17(0532) 533 Montana 613 032 45(0950) -634Alaska 596 050 48(0451) -885 Nebraska 718 026 10(0131) 983Arizona 632 013 36(2248) -329 Nevada 644 021 28(1148) -157Arkansas 719 021 09(0127) 993 New Hampshire 638 029 31(0749) -238California 617 006 42(3248) -572 New Jersey 615 011 43(2849) -592Colorado 609 016 47(2649) -692 New Mexico 560 022 49(3650) -1430Connecticut 622 017 40(2249) -490 New York 621 007 41(2948) -499Delaware 664 035 24(0249) 152 North Carolina 634 011 34(2347) -310DC 504 041 50(3251) -2293c North Dakota 656 040 26(0249) 029Florida 630 007 38(2645) -370 Ohio 694 010 13(0626) 608Georgia 614 012 44(2849) -604 Oklahoma 790 019 01(0108) 2083c
Hawaii 463 024 51(4951) -2913c Oregon 632 017 37(1948) -331Idaho 655 028 27(0548) 012 Pennsylvania 680 009 21(1029) 396Illinois 684 010 19(0928) 463 Rhode Island 656 033 25(0349) 037Indiana 719 014 08(0222) 994 South Carolina 682 016 20(0634) 435Iowa 693 019 14(0334) 604 South Dakota 747 040 03(0133) 1415Kansas 742 022 05(0122) 1350 Tennessee 702 014 12(0327) 729Kentucky 742 018 04(0116) 1352 Texas 640 007 30(2342) -215Louisiana 677 017 23(0637) 356 Utah 679 024 22(0346) 387Maine 638 027 32(0949) -240 Vermont 636 041 33(0350) -277Maryland 633 014 35(2148) -323 Virginia 611 012 46(2849) -661Massachusetts 622 013 39(2548) -482 Washington 640 013 29(2047) -209Michigan 685 011 18(0829) 476 West Virginia 749 025 02(0123) 1449Minnesota 691 015 16(0430) 564 Wisconsin 727 015 06(0219) 1110Mississippi 692 021 15(0337) 580 Wyoming 721 049 07(0148) 1028Missouri 711 014 11(0324) 874
Table 1326Leukemia
Age-Adjusted Cancer Deatha Rates By State All Races 2012-2016
Males and Females
SEER Cancer Statistics Review 1975-2016 National Cancer Institute
a US Mortality Files National Center for Health Statistics Centers for Disease Control andPrevention Rates are per 100000 and are age-adjusted to the 2000 US Std Population (19age groups - Census P25-1130)
b Difference between state rate and total US rate is statistically significant (plt=0002)c Absolute percent difference between state rate and total US rate is 15 or mored Rank of state level death rate and the 95 confidence intervals (low high) for the rankSE Standard error of the ratePD Percent difference between state rate and total US rate- Statistic not shown Rate based on less than 16 cases for the time interval
State Rate SE Rank(CI)d PD TOTAL US 876 003
High Five StatesOklahoma 1022 034 01(0120) 1669c
Kansas 1018 039 02(0123) 1625c
Arkansas 991 037 03(0127) 1309South Dakota 985 068 04(0147) 1249Delaware 984 065 05(0144) 1236
Low Five StatesMontana 795 053 47(1150) -921New Mexico 759 039 48(2650) -1336Alaska 711 081 49(0851) -1887c
DC 704 078 50(1051) -1959c
Hawaii 593 040 51(4951) -3228c
State Rate SE Rank(CI)d PD State Rate SE Rank(CI)d PD
Alabama 939 029 17(0233) 725 Montana 795 053 47(1150) -921Alaska 711 081 49(0851) -1887c Nebraska 958 046 12(0141) 935Arizona 827 022 41(2449) -555 Nevada 858 037 33(0849) -210Arkansas 991 037 03(0127) 1309 New Hampshire 884 051 25(0149) 088California 811 010 43(3348) -738 New Jersey 810 020 44(2749) -747Colorado 834 028 39(2049) -484 New Mexico 759 039 48(2650) -1336Connecticut 837 031 37(1549) -441 New York 842 013 35(2546) -387Delaware 984 065 05(0144) 1236 North Carolina 863 020 31(1945) -149DC 704 078 50(1051) -1959c North Dakota 873 070 27(0150) -030Florida 839 012 36(2645) -422 Ohio 931 018 19(0529) 627Georgia 817 021 42(2649) -677 Oklahoma 1022 034 01(0120) 1669c
Hawaii 593 040 51(4951) -3228c Oregon 866 029 29(1147) -112Idaho 846 047 34(0550) -339 Pennsylvania 912 016 21(0931) 416Illinois 928 018 20(0529) 594 Rhode Island 911 059 22(0149) 400Indiana 960 025 11(0127) 959 South Carolina 951 029 13(0131) 853Iowa 961 035 08(0131) 969 South Dakota 985 068 04(0147) 1249Kansas 1018 039 02(0123) 1625c Tennessee 960 025 10(0127) 959Kentucky 949 031 15(0133) 832 Texas 870 013 28(2139) -069Louisiana 906 030 23(0442) 342 Utah 865 041 30(0549) -122Maine 803 046 46(1450) -836 Vermont 874 074 26(0150) -026Maryland 861 026 32(1447) -176 Virginia 809 021 45(2650) -770Massachusetts 830 023 40(2349) -529 Washington 835 023 38(2248) -463Michigan 937 020 18(0428) 702 West Virginia 972 044 06(0135) 1095Minnesota 948 027 16(0229) 826 Wisconsin 960 026 09(0127) 961Mississippi 970 039 07(0132) 1077 Wyoming 885 081 24(0150) 102Missouri 951 025 14(0228) 852
Table 1327Leukemia
Age-Adjusted Cancer Deatha Rates By State All Races 2012-2016
Males
SEER Cancer Statistics Review 1975-2016 National Cancer Institute
a US Mortality Files National Center for Health Statistics Centers for Disease Control andPrevention Rates are per 100000 and are age-adjusted to the 2000 US Std Population (19age groups - Census P25-1130)
b Difference between state rate and total US rate is statistically significant (plt=0002)c Absolute percent difference between state rate and total US rate is 15 or mored Rank of state level death rate and the 95 confidence intervals (low high) for the rankSE Standard error of the ratePD Percent difference between state rate and total US rate- Statistic not shown Rate based on less than 16 cases for the time interval
State Rate SE Rank(CI)d PD TOTAL US 489 002
High Five StatesOklahoma 615 023 01(0108) 2584c
Wyoming 596 060 02(0147) 2194c
Kentucky 592 021 03(0111) 2126c
West Virginia 576 030 04(0126) 1792c
South Dakota 564 047 05(0145) 1551c
Low Five StatesColorado 441 018 47(2250) -972Delaware 428 037 48(0751) -1247New Mexico 400 025 49(3151) -1803c
DC 381 046 50(1251) -2203c
Hawaii 362 029 51(4151) -2598c
State Rate SE Rank(CI)d PD State Rate SE Rank(CI)d PD
Alabama 512 019 18(0440) 483 Montana 452 037 43(0551) -745Alaska 485 062 27(0151) -073 Nebraska 531 030 10(0144) 864Arizona 473 015 31(1347) -308 Nevada 455 025 42(1150) -695Arkansas 516 024 15(0344) 554 New Hampshire 449 033 45(0651) -807California 470 007 34(2345) -383 New Jersey 478 013 30(1346) -223Colorado 441 018 47(2250) -972 New Mexico 400 025 49(3151) -1803c
Connecticut 465 020 40(1249) -487 New York 466 009 38(2246) -456Delaware 428 037 48(0751) -1247 North Carolina 471 012 32(1747) -350DC 381 046 50(1251) -2203c North Dakota 479 046 28(0151) -189Florida 460 008 41(2647) -582 Ohio 520 012 12(0529) 653Georgia 467 013 37(1747) -433 Oklahoma 615 023 01(0108) 2584c
Hawaii 362 029 51(4151) -2598c Oregon 449 019 44(1850) -799Idaho 497 033 22(0249) 174 Pennsylvania 516 011 14(0629) 556Illinois 514 011 16(0631) 526 Rhode Island 471 037 33(0351) -363Indiana 540 017 07(0226) 1052 South Carolina 495 018 23(0645) 133Iowa 498 022 20(0547) 200 South Dakota 564 047 05(0145) 1551c
Kansas 539 025 08(0137) 1032 Tennessee 517 016 13(0435) 590Kentucky 592 021 03(0111) 2126c Texas 467 008 36(2246) -431Louisiana 514 020 17(0442) 520 Utah 526 029 11(0146) 778Maine 508 032 19(0248) 403 Vermont 444 045 46(0351) -906Maryland 470 016 35(1448) -389 Virginia 465 014 39(1848) -474Massachusetts 478 015 29(1247) -220 Washington 487 016 25(0946) -022Michigan 498 013 21(0939) 192 West Virginia 576 030 04(0126) 1792c
Minnesota 494 017 24(0745) 121 Wisconsin 545 017 06(0225) 1162Mississippi 485 023 26(0548) -067 Wyoming 596 060 02(0147) 2194c
Missouri 535 017 09(0327) 953
Table 1328Leukemia
Age-Adjusted Cancer Deatha Rates By State All Races 2012-2016
Females
SEE
R C
ancer Statistics Review
1975-2016N
ational Cancer Institute
a US 2016 cancer prevalence counts are based on 2016 cancer prevalence proportions from the SEER 13 Areas (excluding the AlaskaNative Registry) and 112016 US population estimates based on the average of 2015 and 2016 population estimates from theUS Bureau of the CensusPrevalence was calculated using the first invasive tumor for each cancer site diagnosed during the previous 24 years
b Maximum limited-duration prevalence is 24 years for 1992-2016 datac Percentages are age-adjusted to the 2000 US Standard Population (19 age groups - Census P25-1130) by 5-year age groupsd Cases diagnosed more than 24 years ago were estimated using the completeness index method (Capocaccia et al 1997
Merrill et al 2000)e Complete prevalence is obtained by summing 0 to lt24 and gt=24- Statistic not shown Statistic based on fewer than 5 cases estimated alive in SEER for the time interval+ Not available
Years Since Diagnosis 0 to lt5 5 to lt10 10 to lt15 15 to lt20 20 to lt24 0 to lt24b gt=24d Completee
Race Sex All Races Both Sexes 153253 100309 63581 38012 21353 376508 38265 414773
Males 90192 57683 36029 21220 12020 217145 18411 235556Females 63061 42625 27552 16792 9333 159363 19854 179217
White Both Sexes 132173 87961 56051 33596 19035 328814 32999 370135Males 78368 50894 32033 18770 10845 190910 15102 210930Females 53805 37067 24018 14826 8190 137905 17897 159205
Black Both Sexes 12734 6564 4233 2487 1259 27277 4070 31347Males 6847 3556 2204 1334 637 14578 1776 16354Females 5887 3008 2029 1153 622 12699 2294 14992
Asian Both Sexes 3926 2561 1778 1164 690 10120 + +Pacific Males 2235 1462 936 646 351 5630 + +Islander Females 1691 1100 842 519 339 4490 + +
Hispanic Both Sexes 14464 9581 6796 4462 2630 37933 + +Males 8166 5374 3794 2408 1538 21280 + +Females 6298 4207 3002 2055 1092 16654 + +
Age Specific (Crude) Age-Adjustedc Age at Prevalence All Ages 0-9 10-19 20-29 30-39 40-49 50-59 60-69 70-79 80+ All Ages
Race Sex All Races Both Sexes 01168 00328 00640 00628 00377 00561 01053 02263 04023 05111 01054
Males 01369 00339 00706 00685 00419 00657 01287 02888 05282 07048 01306Females 00974 00317 00572 00570 00333 00466 00829 01696 02974 03919 00844
White Both Sexes 01304 00369 00715 00712 00410 00584 01106 02389 04249 05386 01127Males 01528 00379 00789 00771 00457 00682 01349 03042 05558 07387 01389Females 01084 00359 00637 00650 00362 00484 00869 01784 03135 04133 00904
Black Both Sexes 00605 00145 00322 00320 00267 00463 00752 01455 02470 03076 00660Males 00674 00142 00357 00338 00281 00530 00919 01737 03249 04580 00816Females 00541 00148 00286 00301 00255 00402 00605 01230 01927 02334 00552
Asian Both Sexes 00497 00264 00531 00426 00230 00390 00553 00882 01245 01389 00513Pacific Males 00577 00298 00555 00507 00249 00461 00665 01122 01552 01904 00613Islander Females 00423 00228 00507 00345 00212 00327 00456 00688 00999 01057 00430
Hispanic Both Sexes 00664 00375 00737 00728 00395 00485 00723 01191 01987 02074 00746Males 00737 00397 00827 00807 00471 00576 00831 01350 02221 02551 00854Females 00589 00352 00642 00641 00312 00391 00617 01050 01809 01780 00647
Table 1329Leukemia
Estimated United States Cancer Prevalence Countsa on January 1 2016By RaceEthnicity Sex and Years Since Diagnosis
Estimated prevalence percenta on January 1 2016 of the SEER population diagnosed in the previous 24 yearsBy Age at Prevalence RaceEthnicity and Sex
SEE
R C
ancer Statistics Review
1975-2016N
ational Cancer Institute
a US 2016 cancer prevalence counts are based on 2016 cancer prevalence proportions from the SEER 13 Areas (excluding the AlaskaNative Registry) and 112016 US population estimates based on the average of 2015 and 2016 population estimates from theUS Bureau of the CensusPrevalence was calculated using the first invasive tumor for each cancer site diagnosed during the previous 24 years
b Maximum limited-duration prevalence is 24 years for 1992-2016 datac Percentages are age-adjusted to the 2000 US Standard Population (19 age groups - Census P25-1130) by 5-year age groupsd Cases diagnosed more than 24 years ago were estimated using the completeness index method (Capocaccia et al 1997
Merrill et al 2000)e Complete prevalence is obtained by summing 0 to lt24 and gt=24- Statistic not shown Statistic based on fewer than 5 cases estimated alive in SEER for the time interval+ Not available
Years Since Diagnosis 0 to lt5 5 to lt10 10 to lt15 15 to lt20 20 to lt24 0 to lt24b gt=24d Completee
Race Sex All Races Both Sexes 20277 16033 13721 12074 8203 70308 25456 95764
Males 11203 9049 7751 6542 4634 39179 12997 52176Females 9074 6984 5971 5531 3568 31129 12460 43589
White Both Sexes 17123 13855 11870 10663 7154 60665 21823 83282Males 9549 7741 6768 5696 4084 33839 11286 45559Females 7573 6114 5102 4967 3070 26826 10537 37723
Black Both Sexes 1590 1133 923 727 553 4926 1609 6535Males 809 734 473 411 290 2716 592 3308Females 781 399 450 317 263 2210 1017 3227
Asian Both Sexes 998 720 669 486 361 3234 + +Pacific Males 527 406 369 313 178 1793 + +Islander Females 472 314 300 173 183 1441 + +
Hispanic Both Sexes 5905 4543 3352 2717 1749 18266 + +Males 3302 2686 1899 1465 1058 10409 + +Females 2603 1857 1454 1252 692 7857 + +
Age Specific (Crude) Age-Adjustedc Age at Prevalence All Ages 0-9 10-19 20-29 30-39 40-49 50-59 60-69 70-79 80+ All Ages
Race Sex All Races Both Sexes 00218 00276 00541 00467 00139 00078 00059 00065 00053 00033 00228
Males 00247 00286 00591 00520 00163 00095 00066 00069 00056 00035 00251Females 00190 00266 00488 00410 00115 00062 00053 00062 00050 00032 00204
White Both Sexes 00241 00315 00612 00542 00161 00086 00063 00070 00056 00033 00259Males 00271 00323 00670 00598 00186 00107 00069 00074 00060 00032 00284Females 00211 00306 00551 00482 00135 00064 00057 00066 00053 00033 00232
Black Both Sexes 00109 00107 00250 00197 00067 00042 00039 00029 00012 00027 00102Males 00126 00112 00281 00224 00079 00035 00052 00026 00012 00027 00112Females 00094 00102 00219 00171 00056 00047 00028 00032 00013 00027 00092
Asian Both Sexes 00159 00208 00418 00289 00071 00064 00045 00050 00054 00036 00163Pacific Males 00184 00226 00427 00360 00086 00069 00055 00054 00033 00055 00180Islander Females 00136 00190 00408 00219 00058 00059 00036 00047 00071 00023 00146
Hispanic Both Sexes 00320 00328 00637 00574 00165 00107 00093 00100 00084 00012 00279Males 00361 00342 00710 00648 00205 00131 00110 00063 00072 - 00309Females 00278 00312 00562 00494 00122 00082 00077 00133 00093 00020 00246
Table 1330Acute Lymphocytic Leukemia
Estimated United States Cancer Prevalence Countsa on January 1 2016By RaceEthnicity Sex and Years Since Diagnosis
Estimated prevalence percenta on January 1 2016 of the SEER population diagnosed in the previous 24 yearsBy Age at Prevalence RaceEthnicity and Sex
0
5
10
15
20
25
1975 1985 1995 2005 20160
5
10
15
20
25
1975 1985 1995 2005 20160
3
6
9
12
15
1975 1985 1995 2005 20160
3
6
9
12
15
1975 1985 1995 2005 2016
Delay-Adj IncidenceDelay-Adj Incidence
Observed IncidenceObserved Incidence
MortalityMortality
SEER Observed Incidence SEER Delay Adjusted Incidence and US Death RatesLeukemia by Race and Sex
a
Figure 131
Source SEER 9 areas and US Mortality Files (National Center for Health Statistics CDC)Rates are age-adjusted to the 2000 US Std Population (19 age groups - Census P25-1103)Regression lines and APCs are calculated using the Joinpoint Regression Program Version 47 February 2019 National Cancer InstituteThe APC is the Annual Percent Change for the regression line segments The APC shown on the graph is for the most recent trendThe APC is significantly different from zero (p lt 005)
a
White Male Black Male White Female Black FemaleRate per 100000 Rate per 100000 Rate per 100000 Rate per 100000
Year of DiagnosisDeath Year of DiagnosisDeath Year of DiagnosisDeath Year of DiagnosisDeath
SEER Incidence APCsDelay Adj 1998-16 = 08Observed 1975-16 = 03
US Mortality APC2013-16 = -30
SEER Incidence APCsDelay Adj 1975-16 = 02Observed 1975-16 = 01
US Mortality APC1993-16 = -15
SEER Incidence APCsDelay Adj 1975-16 = 06Observed 1975-16 = 05
US Mortality APC2000-16 = -12
SEER Incidence APCsDelay Adj 1975-16 = 03Observed 1975-16 = 02
US Mortality APC1993-16 = -13
SEE
R C
ancer Statistics Review
1975-2016N
ational Cancer Institute
0
1
2
3
4
5
6
7
8
1975 1985 1995 2005 20160
1
2
3
4
5
6
7
8
1975 1985 1995 2005 20160
1
2
3
4
5
6
7
8
1975 1985 1995 2005 20160
1
2
3
4
5
6
7
8
1975 1985 1995 2005 2016
Chronic
Acute
SEER Observed Incidence RatesLymphocytic and Myeloid Leukemia (Acute and Chronic) by Sex
a
Figure 132
Source SEER 9 areas Rates are age-adjusted to the 2000 US Std Population (19 age groups - Census P25-1103)Regression lines and APCs are calculated using the Joinpoint Regression Program Version 47 February 2019 National Cancer Institute
a
Male Female Male FemaleLymphocytic Leukemia Myeloid Leukemia
Rate per 100000 Rate per 100000 Rate per 100000 Rate per 100000
Year of Diagnosis Year of Diagnosis Year of Diagnosis Year of Diagnosis
SEE
R C
ancer Statistics Review
1975-2016N
ational Cancer Institute
Joinpoint Analyses for Whites and Blacks from 1975-2016and for AsianPacific Islanders American IndiansAlaska Natives and Hispanics from 2000-2016
0
5
10
15
20
1975 1985 1995 2005 20160
5
10
15
20
1975 1985 1995 2005 2016
White
Black
API
AIAN
Hispanic
SEER Incidence and US Death RatesLeukemia Both Sexes
Figure 133
Source Incidence data for whites and blacks are from the SEER 9 areas (San Francisco Connecticut Detroit Hawaii Iowa New Mexico Seattle Utah Atlanta)Incidence data for AsianPacific Islanders American IndiansAlaska Natives and Hispanics are from the SEER 21 areas (SEER 9 areas San Jose-MontereyLos Angeles Alaska Native Registry Rural Georgia California excluding SFSJMLA Kentucky Louisiana New Jersey Georgia excluding ATLRG Idaho New York andMassachusetts)Mortality data are from US Mortality Files National Center for Health Statistics CDCRates are age-adjusted to the 2000 US Std Population (19 age groups - Census P25-1103)Regression lines are calculated using the Joinpoint Regression Program Version 47 February 2019 National Cancer Institute Joinpoint analyses for Whites andBlacks during the 1975-2016 period allow a maximum of 5 joinpoints Analyses for other ethnic groups during the period 2000-2016 allow a maximum of 3 joinpointsAPI = AsianPacific IslanderAIAN = American IndianAlaska Native Rates for American IndianAlaska Native are based on the PurchasedReferred Care Delivery Area (PRCDA) countiesHispanic is not mutually exclusive from whites blacks AsianPacific Islanders and American IndiansAlaska Natives Incidence data for Hispanics are based onNHIA and exclude cases from the Alaska Native Registry
Incidence MortalityRate per 100000 Rate per 100000
Year of Diagnosis Year of Death
a
d
a
b
c
c
b
d
SEE
R C
ancer Statistics Review
1975-2016N
ational Cancer Institute
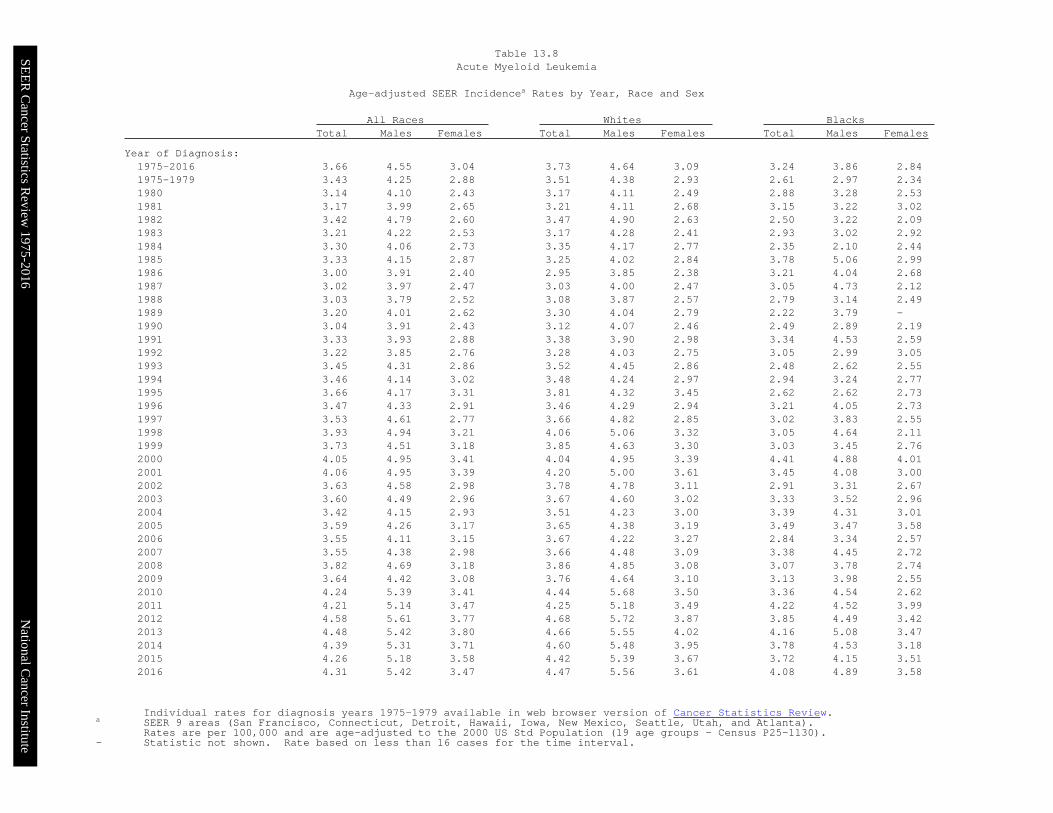
SEE
R C
ancer Statistics Review
1975-2016N
ational Cancer Institute
Individual rates for diagnosis years 1975-1979 available in web browser version of Cancer Statistics Reviewa SEER 9 areas (San Francisco Connecticut Detroit Hawaii Iowa New Mexico Seattle Utah and Atlanta)
Rates are per 100000 and are age-adjusted to the 2000 US Std Population (19 age groups - Census P25-1130)- Statistic not shown Rate based on less than 16 cases for the time interval
All Races Whites Blacks Total Males Females Total Males Females Total Males Females
Year of Diagnosis1975-2016 181 238 138 184 242 141 183 237 1441975-1979 183 244 141 184 247 141 180 239 1361980 170 206 146 173 210 151 148 - -1981 164 197 141 159 190 139 238 300 1811982 168 216 135 165 219 131 175 - 1791983 169 223 133 164 215 132 251 344 1851984 168 240 118 163 241 110 258 261 2591985 197 276 143 200 280 147 206 289 -1986 168 219 129 171 225 131 154 - -1987 188 233 158 191 239 158 214 288 -1988 191 254 150 192 259 149 208 288 -1989 170 222 135 168 218 135 221 312 -1990 176 247 124 175 250 120 263 366 1951991 188 244 147 191 255 146 156 - 1751992 176 216 147 180 222 149 149 173 -1993 192 253 148 195 252 155 228 356 -1994 187 249 142 190 249 150 170 257 -1995 190 256 138 196 269 139 159 209 -1996 181 245 135 180 251 128 206 254 1831997 187 268 130 194 274 137 167 253 -1998 166 195 143 173 198 154 161 231 1201999 180 249 128 177 244 128 172 230 1262000 179 234 135 180 233 140 159 180 1332001 180 236 138 185 237 146 197 283 1362002 164 209 130 167 212 134 113 - -2003 166 224 120 176 237 127 147 218 -2004 181 256 122 187 266 125 151 206 1112005 169 226 125 177 235 131 178 244 1342006 184 240 141 194 251 151 158 217 1112007 171 232 123 180 249 123 143 183 1192008 185 239 143 186 232 151 189 267 1212009 180 238 134 179 231 139 190 289 1282010 188 251 140 188 254 136 191 212 1832011 195 255 147 206 271 151 166 195 1392012 193 233 161 197 238 165 212 281 1622013 193 260 139 198 267 140 172 226 1422014 197 259 146 195 252 146 205 196 2132015 185 230 146 194 241 152 169 185 1562016 204 265 156 216 272 171 198 288 140
Table 139Chronic Myeloid Leukemia
Age-adjusted SEER Incidencea Rates by Year Race and Sex
SEE
R C
ancer Statistics Review
1975-2016N
ational Cancer Institute
Individual rates for years of death 1975-1979 available in web browser version of Cancer Statistics Reviewa US Mortality Files National Center for Health Statistics Centers for Disease Control and Prevention
Rates are per 100000 and are age-adjusted to the 2000 US Std Population (19 age groups - Census P25-1130)- Statistic not shown Rate based on less than 16 cases for the time interval
All Races Whites Blacks Total Males Females Total Males Females Total Males Females
Year of Death1975-2016 752 1008 575 773 1038 589 656 865 5201975-1979 812 1092 624 829 1120 634 678 880 5361980 836 1121 646 854 1151 656 705 909 5671981 810 1089 624 824 1116 631 711 892 5861982 819 1104 631 833 1129 639 714 936 5671983 811 1093 626 824 1119 632 722 921 5901984 808 1068 637 823 1091 647 708 916 5691985 807 1077 631 823 1097 644 708 962 5421986 796 1071 616 810 1097 623 725 926 5911987 780 1031 614 791 1050 620 724 941 5851988 783 1060 600 795 1079 608 724 983 5581989 795 1062 615 807 1075 626 736 1034 5451990 798 1071 618 810 1090 626 744 996 5831991 799 1050 632 812 1064 644 745 1005 5801992 796 1071 613 811 1094 624 716 941 5681993 793 1066 609 804 1084 616 736 976 5771994 785 1057 603 800 1078 613 712 959 5541995 790 1080 598 804 1103 605 717 975 5531996 784 1053 605 797 1071 613 746 1009 5901997 771 1042 589 789 1068 601 683 923 5291998 758 1011 582 772 1031 591 704 937 5551999 768 1022 596 787 1047 609 674 878 5432000 769 1028 591 789 1054 605 671 907 5272001 764 1019 588 783 1046 602 674 880 5412002 754 1018 573 775 1046 585 673 891 5382003 745 1002 563 768 1037 576 654 847 5302004 729 981 552 747 1004 564 677 894 5392005 726 982 546 750 1014 563 607 811 4782006 723 970 546 748 997 566 627 884 4702007 708 954 533 730 986 546 619 807 5052008 709 954 533 732 983 549 627 865 4782009 706 953 525 731 986 541 605 814 4712010 691 925 520 716 958 537 575 746 4592011 695 928 524 718 960 539 599 774 4852012 683 921 507 708 957 522 577 756 4622013 675 909 503 703 943 523 568 770 4372014 662 882 496 691 921 515 547 717 4372015 628 846 464 655 882 482 520 684 4152016 627 828 475 653 864 491 543 687 449
Table 1310Leukemia
Age-adjusted US Deatha Rates by Year Race and Sex
SEE
R C
ancer Statistics Review
1975-2016N
ational Cancer Institute
a SEER 21 areas Rates are per 100000 and are age-adjusted to the 2000 US Std Population (19 age groups - Census P25-1130)unless noted
b US Mortality Files National Center for Health Statistics Centers for Disease Control and PreventionRates are per 100000 and are age-adjusted to the 2000 US Std Population (19 age groups - Census P25-1130) unless noted
c Rates are per 100000 and are age-adjusted to the world (WHO 2000-2025) standard million- Statistic not shown Rate based on less than 16 cases for the time interval
All Races Whites Blacks Total Males Females Total Males Females Total Males Females
SEER IncidenceAge at DiagnosisAge-Adjusted Rates 2012-2016All ages 141 181 109 149 191 115 109 139 89Under 65 71 83 58 74 87 61 58 66 5165 and over 625 855 457 668 909 487 460 641 349
All ages (WHO world std)c 109 137 86 116 145 90 85 105 71
Age-Specific Rates 2012-2016lt1 45 43 48 45 44 47 34 - 441-4 89 91 87 97 101 94 46 43 495-9 43 47 38 47 53 41 22 20 2410-14 33 38 28 34 38 30 26 31 2015-19 31 38 24 33 41 25 20 25 1520-24 29 32 25 30 35 25 24 22 2625-29 30 34 26 30 34 26 26 28 2430-34 37 42 32 37 43 32 33 33 3335-39 45 51 39 46 52 39 45 48 4240-44 61 71 51 63 73 53 58 69 4945-49 84 97 71 86 99 73 85 96 7450-54 127 156 99 133 164 103 104 123 8755-59 182 223 143 192 234 151 150 183 12260-64 271 346 202 285 365 210 230 279 19065-69 404 533 290 429 564 306 330 428 25670-74 549 735 394 584 777 419 416 563 31275-79 706 954 513 757 1015 552 535 755 39380-84 843 1180 611 902 1256 653 585 869 42885+ 880 1262 683 941 1356 725 567 810 466
US MortalityAge at DeathAge-Adjusted Rates 2012-2016All ages 65 88 49 68 91 51 55 72 44Under 65 18 22 15 18 22 15 20 23 1765 and over 392 544 283 411 570 296 299 410 232
All ages (WHO world std)c 37 48 28 38 49 29 33 43 27
Age-Specific Rates 2012-2016lt1 05 04 06 05 05 05 06 - -1-4 07 07 07 07 07 07 07 07 075-9 05 05 04 05 06 04 04 04 0310-14 06 06 05 06 06 05 05 06 0515-19 07 09 06 08 09 06 05 06 0420-24 09 11 06 09 11 07 09 10 0725-29 09 11 07 09 11 08 08 10 0730-34 10 12 08 10 12 08 11 13 1035-39 12 14 10 12 14 10 14 15 1240-44 16 17 14 16 17 15 18 18 1745-49 22 25 20 23 25 21 26 30 2250-54 34 40 28 34 41 28 39 44 3555-59 56 68 43 56 69 44 62 77 5060-64 93 118 70 95 121 70 101 130 7765-69 160 215 111 166 223 114 150 203 11070-74 272 364 194 285 380 202 231 302 18175-79 428 589 300 450 618 314 333 460 25180-84 615 863 441 647 903 462 457 633 35885+ 827 1192 638 875 1259 672 525 746 433
Table 1311Leukemia
SEER Incidencea and US Deathb Rates Age-Adjusted and Age-Specific Rates by Race and Sex
SEE
R C
ancer Statistics Review
1975-2016N
ational Cancer Institute
a SEER 21 areas Rates are per 100000 and are age-adjusted to the 2000 US Std Population (19 age groups - Census P25-1130)unless noted
b Rates are per 100000 and are age-adjusted to the world (WHO 2000-2025) standard million- Statistic not shown Rate based on less than 16 cases for the time interval
All Races Whites Blacks Total Males Females Total Males Females Total Males Females
Acute Lymphocytic LeukemiaAge at DiagnosisAge-Adjusted Rates 2012-2016All ages 17 19 15 19 21 16 10 11 09Under 65 17 20 15 19 22 16 10 11 0965 and over 16 18 13 17 20 14 10 12 09
All ages (WHO world std)b 19 21 16 20 23 18 10 11 09
Age-Specific Rates 2012-2016lt1 19 16 22 19 16 23 14 - -1-4 76 77 74 84 87 81 33 30 375-9 36 40 33 41 46 36 18 15 2010-14 23 26 19 24 27 21 14 19 0915-19 18 24 12 20 27 13 07 12 -20-24 10 14 07 12 16 07 05 06 0525-29 08 10 06 08 11 06 05 - -30-34 07 09 06 08 09 06 04 - -35-39 08 10 06 08 10 07 06 07 -40-44 08 09 06 08 10 06 06 07 -45-49 09 09 09 09 09 10 04 - -50-54 09 10 08 09 10 09 07 09 -55-59 11 12 11 12 13 11 11 12 1060-64 13 15 11 13 15 11 11 13 0965-69 14 14 13 15 16 14 07 - -70-74 16 19 13 17 20 14 - - -75-79 17 20 15 18 21 16 13 - -80-84 17 23 13 17 24 13 - - -85+ 15 19 13 16 20 14 - - -
Chronic Lymphocytic LeukemiaAge at DiagnosisAge-Adjusted Rates 2012-2016All ages 49 68 35 54 73 38 34 49 24Under 65 17 22 12 18 24 13 12 16 0865 and over 275 383 195 298 411 212 185 273 129
All ages (WHO world std)b 35 47 24 38 51 27 24 34 17
Age-Specific Rates 2012-2016lt1 - - - - - - - - -1-4 - - - - - - - - -5-9 - - - - - - - - -10-14 - - - - - - - - -15-19 - - - - - - - - -20-24 - - - - - - - - -25-29 01 01 - 01 - - - - -30-34 01 02 - 01 02 - - - -35-39 04 04 03 04 05 04 04 - -40-44 10 12 08 10 13 08 08 12 -45-49 22 28 17 24 30 19 18 24 1250-54 48 65 32 53 70 36 32 46 2055-59 80 103 58 88 113 64 51 66 3760-64 125 170 84 134 180 90 94 129 6665-69 189 258 129 204 274 140 135 188 9570-74 245 338 167 265 361 182 176 263 11675-79 306 423 216 333 455 236 213 321 14580-84 354 502 252 385 541 275 222 360 14685+ 379 543 294 413 594 318 218 302 183
Table 1312Lymphocytic Leukemia
SEER Incidencea Rates Age-Adjusted and Age-Specific Rates by Race and Sex
SEE
R C
ancer Statistics Review
1975-2016N
ational Cancer Institute
a SEER 21 areas Rates are per 100000 and are age-adjusted to the 2000 US Std Population (19 age groups - Census P25-1130)unless noted
b Rates are per 100000 and are age-adjusted to the world (WHO 2000-2025) standard million- Statistic not shown Rate based on less than 16 cases for the time interval
All Races Whites Blacks Total Males Females Total Males Females Total Males Females
Acute Myeloid LeukemiaAge at DiagnosisAge-Adjusted Rates 2012-2016All ages 43 52 35 44 54 36 37 44 33Under 65 20 21 19 20 21 19 20 20 2065 and over 201 269 152 213 284 160 155 210 123
All ages (WHO world std)b 32 38 28 33 40 28 29 33 27
Age-Specific Rates 2012-2016lt1 16 16 16 15 15 15 - - -1-4 10 10 10 09 09 09 11 10 115-9 04 04 04 04 04 04 03 - -10-14 07 08 06 07 08 06 09 09 0815-19 09 09 09 09 10 09 08 07 0820-24 11 10 12 11 10 12 12 11 1325-29 12 11 12 11 11 12 11 10 1230-34 14 15 14 14 15 14 17 15 1935-39 16 16 16 15 16 15 18 16 2040-44 21 22 21 22 22 22 22 21 2245-49 25 25 25 25 25 25 28 27 2950-54 35 38 32 36 40 33 33 32 3355-59 49 56 43 49 56 43 49 57 4360-64 78 91 67 82 97 68 70 75 6665-69 121 152 94 129 163 98 100 118 8670-74 183 236 139 192 247 145 151 189 12575-79 233 310 174 248 326 186 185 256 14080-84 286 393 212 302 413 223 207 314 14885+ 263 380 203 277 403 212 174 254 141
Chronic Myeloid LeukemiaAge at DiagnosisAge-Adjusted Rates 2012-2016All ages 19 24 14 19 25 15 18 22 15Under 65 11 13 09 11 12 09 11 13 1065 and over 76 106 55 80 111 57 62 82 49
All ages (WHO world std)b 15 19 11 15 19 12 14 17 12
Age-Specific Rates 2012-2016lt1 05 05 - 04 - - - - -1-4 01 - - 01 - - - - -5-9 01 - 01 01 - - - - -10-14 01 02 01 01 01 01 - - -15-19 03 03 02 02 03 02 03 - -20-24 05 06 04 05 06 04 04 - -25-29 07 09 06 07 08 06 07 10 -30-34 10 12 08 11 12 09 08 09 0835-39 11 13 09 11 13 10 12 13 1040-44 14 18 11 14 18 11 16 22 1045-49 18 21 15 17 20 14 25 28 2350-54 22 26 17 21 26 17 23 25 2055-59 25 29 22 26 29 23 25 28 2260-64 35 43 27 35 44 27 34 41 2965-69 49 67 34 50 68 33 55 68 4570-74 65 85 48 68 89 51 49 66 3675-79 91 124 65 97 132 69 69 98 5080-84 105 147 75 112 156 80 76 92 6785+ 102 155 75 107 164 76 75 109 60
Table 1313Myeloid Leukemia
SEER Incidencea Rates Age-Adjusted and Age-Specific Rates by Race and Sex
SEE
R C
ancer Statistics Review
1975-2016N
ational Cancer Institute
a Based on End Results data from a series of hospital registries and one population-based registryb SEER 9 areas (San Francisco Connecticut Detroit Hawaii Iowa New Mexico Seattle Utah Atlanta)
Based on follow-up of patients into 2016 Expected survival rates are derived from the US Annual Life Tablesc SEER 18 areas (San Francisco Connecticut Detroit Hawaii Iowa New Mexico Seattle Utah Atlanta San Jose-Monterey
Los Angeles Alaska Native Registry Rural Georgia California excluding SFSJMLA Kentucky Louisiana New Jersey andGeorgia excluding ATLRG) Expected survival rates are derived from life tables by socio-economic status geography and racedeveloped by the SEER programBased on follow-up of patients into 2016
d Period survival provides a 2015 estimate of survival by piecing together the most recent conditional survival estimatesfrom several cohorts It is computed here using three year calendar blocks (2010-2012 0-1 year survival)(2009-2011 1-2 year survival) (2008-2010 2-3 year survival) (2007-2009 3-4 year survival) (2006-2008 4-5 years survival)
e The difference between 1975-1977 and 2009-2015 is statistically significant (plt05)f The standard error is between 5 and 10 percentage pointsg The standard error is greater than 10 percentage points- Statistic could not be calculated due to fewer than 25 cases during the time period
All Races Whites Blacks Total Males Females Total Males Females Total Males Females
5-Year Relative Survival (Percent)Year of Diagnosis1960-1963a - - - 14 - - - - -1970-1973a - - - 22 - - - - -1975-1977b 341 330 356 345 336 358 334 304 3671978-1980b 360 350 373 367 358 380 282 273 2931981-1983b 373 369 378 381 378 385 339 334 3431984-1986b 405 401 411 416 413 420 327 315 3411987-1989b 429 440 413 439 455 418 350 327 3781990-1992b 452 446 461 465 463 468 357 305 4131993-1995b 476 484 464 487 495 475 413 416 4091996-1998b 484 486 481 498 497 498 386 390 3801999-2001b 510 520 495 520 530 507 437 451 4212002-2004b 583 584 581 591 594 588 540 543 5342005-2008b 623 635 607 633 643 620 560 599 5112009-2015b 658e 673e 637e 668e 682e 649e 596e 609e 582e
5-Year Period Survival (Percent)cd
2015 632 643 619 634 640 624 582 617 544
5-Year Relative Survival (Percent) 2009-2015c
Age at DiagnosisAges lt45 762 758 768 773 764 786 677 677 677Ages 45-54 722 737 698 735 746 716 628 662 586Ages 55-64 693 699 683 704 707 698 589 605 566Ages 65-74 610 610 611 614 610 620 541 553 523Ages 75+ 421 424 417 427 428 425 337 357 316Ages lt65 729 731 725 739 738 741 637 650 621Ages 65+ 508 517 496 511 518 502 446 474 415
Table 1314Leukemia
5-Year Relative and Period Survival (Percent) by Race Sex Diagnosis Year and Age
SEE
R C
ancer Statistics Review
1975-2016N
ational Cancer Institute
a SEER 9 areas (San Francisco Connecticut Detroit Hawaii Iowa New Mexico Seattle Utah Atlanta)Based on follow-up of patients into 2016 Expected survival rates are derived from the US Annual Life Tables
b SEER 18 areas (San Francisco Connecticut Detroit Hawaii Iowa New Mexico Seattle Utah Atlanta San Jose-MontereyLos Angeles Alaska Native Registry Rural Georgia California excluding SFSJMLA Kentucky Louisiana New Jersey andGeorgia excluding ATLRG) Expected survival rates are derived from life tables by socio-economic status geography and racedeveloped by the SEER programBased on follow-up of patients into 2016
c Period survival provides a 2015 estimate of survival by piecing together the most recent conditional survival estimatesfrom several cohorts It is computed here using three year calendar blocks (2010-2012 0-1 year survival)(2009-2011 1-2 year survival) (2008-2010 2-3 year survival) (2007-2009 3-4 year survival) (2006-2008 4-5 years survival)
d The difference between 1975-1977 and 2009-2015 is statistically significant (plt05)e The standard error is between 5 and 10 percentage pointsf The standard error is greater than 10 percentage points- Statistic could not be calculated due to fewer than 25 cases during the time period
All Races Whites Blacks Total Males Females Total Males Females Total Males Females
Acute Lymphocytic Leukemia5-Year Relative Survival (Percent)Year of Diagnosis1975-1977a 406 369 456 408 374 457 335e - -1987-1989a 544 537 552 550 547 553 447e 420e 471e1990-1992a 580 545 631 577 549 620 571e 504e 633e1993-1995a 602 578 636 598 578 627 532e 459e 638e1996-1998a 655 644 669 664 643 690 556e 591e 502e1999-2001a 635 634 635 648 652 642 566e 503e 630e2002-2004a 673 661 689 676 666 691 645e 594e 697e2005-2008a 701 693 713 700 686 720 652 700 551e2009-2015a 717d 723d 710d 726d 737d 713d 625d 607 647e
5-Year Period Survival (Percent)bc2015 691 684 698 685 674 700 650 650 648
5-Year Relative Survival (Percent) 2009-2015bAge at DiagnosisAges lt45 806 795 821 807 791 828 763 757 770Ages 45-54 381 365 403 379 373 389 257e - -Ages 55-64 280 275 284 294 288 298 173e 228e -Ages 65-74 239 188 291 214 170 259 - - -Ages 75+ 91 97 83 100 96 100 00 - -Ages lt65 733 725 743 735 724 749 668 668 668Ages 65+ 174 151 196 166 141 191 154e - 189e
Chronic Lymphocytic Leukemia5-Year Relative Survival (Percent)Year of Diagnosis1975-1977a 671 647 703 679 654 711 569e 551e 590e1987-1989a 727 727 729 739 740 737 581 555e 615e1990-1992a 741 718 773 753 731 784 522 434e 609e1993-1995a 772 771 773 783 781 786 633 640e 621e1996-1998a 756 739 778 767 752 787 581 515e 660e1999-2001a 786 782 792 794 788 803 666 655e 666e2002-2004a 840 832 852 845 837 856 770 742e 807e2005-2008a 862 861 863 864 863 864 841 857 8122009-2015a 882d 887d 875d 886d 889d 883d 785d 801d 763
5-Year Period Survival (Percent)bc2015 856 855 858 853 848 860 772 818 710
5-Year Relative Survival (Percent) 2009-2015bAge at DiagnosisAges lt45 940 927 960 942 932 954 905e 879e -Ages 45-54 939 934 948 945 935 964 840 889 761eAges 55-64 922 916 933 924 916 938 836 831 843Ages 65-74 874 856 905 876 853 913 773 784 756Ages 75+ 731 727 736 729 724 734 584 586e 564eAges lt65 928 922 939 931 923 947 843 854 824Ages 65+ 801 796 807 799 792 807 691 713 662
Table 1315Lymphocytic Leukemia
5-Year Relative and Period Survival (Percent) by Race Sex Diagnosis Year and Age
SEE
R C
ancer Statistics Review
1975-2016N
ational Cancer Institute
a SEER 9 areas (San Francisco Connecticut Detroit Hawaii Iowa New Mexico Seattle Utah Atlanta)Based on follow-up of patients into 2016 Expected survival rates are derived from the US Annual Life Tables
b SEER 18 areas (San Francisco Connecticut Detroit Hawaii Iowa New Mexico Seattle Utah Atlanta San Jose-MontereyLos Angeles Alaska Native Registry Rural Georgia California excluding SFSJMLA Kentucky Louisiana New Jersey andGeorgia excluding ATLRG) Expected survival rates are derived from life tables by socio-economic status geography and racedeveloped by the SEER programBased on follow-up of patients into 2016
c Period survival provides a 2015 estimate of survival by piecing together the most recent conditional survival estimatesfrom several cohorts It is computed here using three year calendar blocks (2010-2012 0-1 year survival)(2009-2011 1-2 year survival) (2008-2010 2-3 year survival) (2007-2009 3-4 year survival) (2006-2008 4-5 years survival)
d The difference between 1975-1977 and 2009-2015 is statistically significant (plt05)e The standard error is between 5 and 10 percentage pointsf The standard error is greater than 10 percentage points- Statistic could not be calculated due to fewer than 25 cases during the time period
All Races Whites Blacks Total Males Females Total Males Females Total Males Females
Acute Myeloid Leukemia5-Year Relative Survival (Percent)Year of Diagnosis1975-1977a 62 55 70 58 54 62 101 82 1171987-1989a 115 92 141 113 97 132 92 44 157e1990-1992a 138 126 152 135 122 150 135 129 1391993-1995a 161 149 174 153 141 167 215 206e 2201996-1998a 170 159 183 156 145 171 221 252 1821999-2001a 192 188 197 187 176 199 193 248 1422002-2004a 234 209 264 232 208 260 253 265 2402005-2008a 249 235 265 242 228 257 239 193 2772009-2015a 294d 291d 298d 290d 284d 299d 292d 280d 301d
5-Year Period Survival (Percent)bc2015 286 278 294 282 276 289 283 262 301
5-Year Relative Survival (Percent) 2009-2015bAge at DiagnosisAges lt45 604 585 624 621 599 645 511 482 538Ages 45-54 441 439 444 456 450 463 337 342 336Ages 55-64 300 281 325 308 285 338 231 234 224Ages 65-74 139 137 141 145 144 146 103 78 131Ages 75+ 34 40 27 34 41 27 24 - 20Ages lt65 466 444 491 474 449 504 393 371 414Ages 65+ 79 85 72 82 89 73 64 58 71
Chronic Myeloid Leukemia5-Year Relative Survival (Percent)Year of Diagnosis1975-1977a 218 193 251 205 184 234 277e 216e 355e1987-1989a 303 306 298 301 310 290 333e 281e 413e1990-1992a 307 296 322 303 300 306 349e 255e 449e1993-1995a 355 353 358 352 351 352 356e 328e 402e1996-1998a 371 377 363 380 376 385 310 304e 314e1999-2001a 473 459 492 459 441 483 490e 496e 481e2002-2004a 543 530 561 526 514 541 630e 621e 640e2005-2008a 631 632 629 617 615 621 643 664e 608e2009-2015a 697d 681d 718d 690d 677d 707d 736d 711d 763d
5-Year Period Survival (Percent)bc2015 695 683 712 681 666 702 723 714 735
5-Year Relative Survival (Percent) 2009-2015bAge at DiagnosisAges lt45 899 889 913 916 905 934 797 786 812Ages 45-54 874 860 891 871 858 888 871 842 900Ages 55-64 776 748 816 781 750 826 698 676e 719eAges 65-74 611 579 656 609 578 654 584e 526e 637eAges 75+ 326 305 346 321 302 336 362e 362f 362eAges lt65 851 836 873 856 839 883 790 773 808Ages 65+ 462 444 484 456 441 475 495 471e 515e
Table 1316Myeloid Leukemia
5-Year Relative and Period Survival (Percent) by Race Sex Diagnosis Year and Age
SEE
R C
ancer Statistics Review
1975-2016N
ational Cancer Institute
a Based on the SEER 9 areas (San Francisco Connecticut Detroit Hawaii Iowa New Mexico Seattle Utah and Atlanta)Expected survival rates are derived from the US Annual Life Tables
1975- 1980- 1985- 1990-1979 1984 1989 1994 1995 1996 1997 1998 1999 2000 2001 2002 2003 2004 2005 2006 2007 2008 2009 2010 2011 2012 2013 2014 2015
Survival Time
1-year 608 626 648 669 681 682 679 667 659 669 706 722 732 751 742 765 769 766 774 783 794 791 790 791 8062-year 501 525 553 575 589 599 598 580 583 590 630 649 662 677 684 705 706 702 709 725 732 725 732 7343-year 437 465 496 528 543 554 549 541 547 551 590 619 624 643 647 673 676 665 684 692 703 692 6984-year 388 417 455 491 507 519 509 503 516 520 567 596 595 619 627 647 653 639 658 676 683 6735-year 346 376 423 461 481 487 483 482 484 499 543 578 575 596 610 626 637 619 635 659 6656-year 314 351 399 435 457 465 458 461 462 485 524 560 556 572 593 607 622 604 613 6477-year 291 325 371 409 442 451 438 446 444 473 510 544 537 560 579 591 614 587 6018-year 270 304 350 388 417 438 432 431 430 457 496 535 519 546 561 573 603 5769-year 250 285 330 373 406 420 418 421 421 449 483 519 507 530 546 561 59310-year 237 269 316 360 390 406 406 410 406 438 471 504 489 515 532 54511-year 224 257 299 347 378 398 387 397 392 426 459 492 473 499 52712-year 212 246 288 336 371 387 377 390 383 419 449 483 460 49213-year 204 236 280 327 367 382 370 380 372 404 442 466 45414-year 198 229 272 318 356 371 368 370 367 392 434 45615-year 192 223 267 313 353 361 362 358 359 383 42316-year 185 214 261 306 350 359 361 350 353 37417-year 181 207 256 300 340 355 352 346 34718-year 177 201 253 294 330 351 346 34319-year 171 195 248 291 326 343 34420-year 166 191 244 286 319 338
Table 1317Leukemia
SEERa Relative Survival (Percent)By Year of Diagnosis
All Races Males and Females
Year of Diagnosis
SEE
R C
ancer Statistics Review
1975-2016N
ational Cancer Institute
a Based on the SEER 9 areas (San Francisco Connecticut Detroit Hawaii Iowa New Mexico Seattle Utah and Atlanta)Expected survival rates are derived from the US Annual Life Tables
1975- 1980- 1985- 1990-1979 1984 1989 1994 1995 1996 1997 1998 1999 2000 2001 2002 2003 2004 2005 2006 2007 2008 2009 2010 2011 2012 2013 2014 2015
Survival Time
1-year 604 628 655 679 692 697 688 667 668 688 729 731 742 767 761 770 780 775 791 793 806 797 803 812 8172-year 494 524 561 583 604 616 611 585 590 608 648 652 669 687 701 706 719 716 727 740 746 733 749 7513-year 427 460 499 532 556 573 552 546 552 573 608 624 627 653 664 674 689 679 699 712 719 698 7144-year 377 411 459 494 516 535 505 505 520 539 581 598 601 627 650 648 667 650 677 690 697 6775-year 334 371 429 462 482 495 479 484 480 523 553 573 578 602 630 626 653 632 656 673 6846-year 303 343 404 435 452 471 459 461 461 508 529 554 557 575 609 602 635 615 631 6617-year 277 318 373 409 439 458 438 444 439 498 514 531 535 564 594 588 625 595 6168-year 254 294 354 385 417 446 430 430 423 478 500 520 514 549 572 563 616 5839-year 232 275 332 371 404 423 421 419 415 464 486 507 501 526 553 548 60510-year 219 260 317 358 382 407 413 410 401 454 473 490 479 511 539 52611-year 205 249 302 346 377 398 391 393 383 444 461 474 464 496 53312-year 193 242 290 334 371 390 380 384 375 437 452 467 455 49113-year 186 234 283 325 367 389 373 369 363 420 442 455 44714-year 179 227 277 315 357 379 370 358 357 410 433 44715-year 175 221 269 309 352 371 365 349 351 399 42216-year 168 212 263 303 347 369 360 341 346 38717-year 164 204 260 296 339 366 348 335 34318-year 159 199 257 290 324 364 345 33119-year 154 192 253 288 322 355 34120-year 146 187 249 283 316 347
Table 1318Leukemia
SEERa Relative Survival (Percent)By Year of Diagnosis
All Races Males
Year of Diagnosis
SEE
R C
ancer Statistics Review
1975-2016N
ational Cancer Institute
a Based on the SEER 9 areas (San Francisco Connecticut Detroit Hawaii Iowa New Mexico Seattle Utah and Atlanta)Expected survival rates are derived from the US Annual Life Tables
1975- 1980- 1985- 1990-1979 1984 1989 1994 1995 1996 1997 1998 1999 2000 2001 2002 2003 2004 2005 2006 2007 2008 2009 2010 2011 2012 2013 2014 2015
Survival Time
1-year 613 623 638 655 665 664 666 667 646 643 675 710 719 729 715 759 755 754 751 769 778 782 772 761 7912-year 509 527 542 564 569 578 580 574 573 564 606 645 653 664 660 705 689 684 684 705 714 716 709 7093-year 450 471 492 523 525 529 544 534 539 522 564 612 619 628 624 673 657 647 663 666 681 685 6774-year 402 424 449 485 495 498 514 500 511 494 548 594 587 608 595 646 633 624 633 658 664 6685-year 361 384 414 459 480 475 489 479 489 466 530 584 570 588 582 627 615 601 607 641 6396-year 328 360 392 435 464 457 456 461 463 455 516 567 556 569 572 613 602 589 588 6297-year 309 334 367 410 447 443 438 448 450 438 504 561 539 556 558 594 598 575 5798-year 290 316 344 391 416 428 433 433 438 428 490 556 526 542 546 585 582 5639-year 273 299 326 376 409 416 413 424 429 428 477 535 515 534 535 576 57610-year 259 281 315 364 399 405 396 409 414 416 468 522 502 521 521 56811-year 247 269 295 347 378 398 383 403 403 401 456 515 486 503 51812-year 235 250 285 338 372 382 373 397 393 395 445 505 468 49313-year 228 239 276 329 365 373 366 392 385 383 442 481 46314-year 220 232 267 323 355 361 363 385 380 367 434 46815-year 214 225 264 318 353 348 359 369 368 363 42416-year 206 217 258 310 353 344 359 361 363 35817-year 201 210 252 305 342 340 357 358 35018-year 198 205 248 301 336 334 347 35819-year 193 198 241 296 330 326 34620-year 190 195 238 290 321 323
Table 1319Leukemia
SEERa Relative Survival (Percent)By Year of Diagnosis
All Races Females
Year of Diagnosis
SEE
R C
ancer Statistics Review
1975-2016N
ational Cancer Institute
Devcan 677 April 2019 National Cancer Institute (httpssurveillancecancergovdevcan)Source Incidence data are from the SEER 21 areas (San Francisco Connecticut Detroit Hawaii Iowa New Mexico Seattle Utah Atlanta
San Jose-Monterey Los Angeles Alaska Native Registry Rural Georgia California excluding SFSJMLA Kentucky Louisiana New JerseyGeorgia excluding ATLRG Idaho New York and Massachusetts) Mortality data are from the NCHS public use data file for the total US
a Underlying incidence and mortality data for American IndianAlaska Native are based on the PRCDA(PurchasedReferred Care DeliveryAreas) counties
b Hispanic is not mutually exclusive from whites blacks AsianPacific Islanders and American IndiansAlaska NativesUnderlying incidence data for Hispanics are based on NHIA and exclude cases from the Alaska Native Registry
- Statistic could not be calculatedA percent of 000 represents a value that is below 0005
Risk of Being Risk of Being
Race Current Diagnosed with Cancer Risk of Dying Race Current Diagnosed with Cancer Risk of Dying
Ethnicity Age +10 yrs +20 yrs +30 yrs Ever from Cancer Ethnicity Age +10 yrs +20 yrs +30 yrs Ever from Cancer
All Races 0 006 009 012 156 082 Asian 0 005 008 011 099 058
10 003 006 010 152 082 Pacific 10 003 006 009 095 058
20 003 007 014 149 082 Islander 20 003 006 010 092 058
30 004 011 026 147 082 30 003 008 016 090 057
40 007 022 051 145 082 40 004 012 026 087 057
50 015 045 089 141 082 50 008 022 047 083 056
60 031 079 121 134 082 60 014 040 066 078 054
70 053 101 - 115 080 70 028 055 - 067 051
80 062 - - 082 068 80 032 - - 047 040
White 0 006 010 013 164 085 American 0 005 007 009 085 040
10 003 007 011 159 086 Indian 10 002 004 008 081 040
20 003 007 014 156 085 Alaska 20 002 006 010 079 039
30 004 011 027 155 085 Nativea 30 004 008 019 078 039
40 007 023 053 153 085 40 004 015 030 076 040
50 016 047 095 149 086 50 012 027 051 075 040
60 033 083 127 141 086 60 017 042 061 068 040
70 057 106 - 121 084 70 029 051 - 058 038
80 066 - - 086 071 80 029 - - 038 025
Black 0 003 006 008 107 058 Hispanicb 0 007 011 015 124 066
10 002 005 009 105 059 10 005 008 012 118 066
20 003 006 013 104 059 20 004 008 014 114 065
30 004 011 022 102 058 30 004 010 021 111 064
40 007 019 041 100 058 40 006 017 037 108 064
50 013 035 066 097 058 50 011 031 063 104 063
60 025 058 083 091 058 60 021 054 085 097 062
70 039 069 - 079 057 70 037 070 - 083 058
80 042 - - 056 048 80 042 - - 058 049
Table 1320
Leukemia
Risk of Being Diagnosed With Cancer in 10 20 and 30 Years
Lifetime Risk of Being Diagnosed with Cancer Given Alive and Cancer-Free at Current Age and
Lifetime Risk of Dying from Cancer Given Alive at Current Age
Both Sexes 2014-2016 By RaceEthnicity
SEE
R C
ancer Statistics Review
1975-2016N
ational Cancer Institute
Devcan 677 April 2019 National Cancer Institute (httpssurveillancecancergovdevcan)Source Incidence data are from the SEER 21 areas (San Francisco Connecticut Detroit Hawaii Iowa New Mexico Seattle Utah Atlanta
San Jose-Monterey Los Angeles Alaska Native Registry Rural Georgia California excluding SFSJMLA Kentucky Louisiana New JerseyGeorgia excluding ATLRG Idaho New York and Massachusetts) Mortality data are from the NCHS public use data file for the total US
a Underlying incidence and mortality data for American IndianAlaska Native are based on the PRCDA(PurchasedReferred Care DeliveryAreas) counties
b Hispanic is not mutually exclusive from whites blacks AsianPacific Islanders and American IndiansAlaska NativesUnderlying incidence data for Hispanics are based on NHIA and exclude cases from the Alaska Native Registry
- Statistic could not be calculatedA percent of 000 represents a value that is below 0005
Risk of Being Risk of Being
Race Current Diagnosed with Cancer Risk of Dying Race Current Diagnosed with Cancer Risk of Dying
Ethnicity Age +10 yrs +20 yrs +30 yrs Ever from Cancer Ethnicity Age +10 yrs +20 yrs +30 yrs Ever from Cancer
All Races 0 006 010 013 186 096 Asian 0 005 009 011 119 072
10 004 007 012 182 097 Pacific 10 004 007 010 115 072
20 003 008 016 179 097 Islander 20 003 007 012 111 071
30 005 013 030 177 097 30 004 009 019 109 071
40 008 026 062 176 098 40 005 015 033 106 070
50 018 056 112 173 099 50 010 028 062 102 069
60 040 101 152 166 101 60 019 054 084 096 068
70 071 129 - 146 101 70 038 071 - 084 065
80 082 - - 105 088 80 040 - - 056 052
White 0 007 011 014 195 101 American 0 006 009 011 110 048
10 004 008 012 190 102 Indian 10 003 005 010 105 048
20 004 008 016 187 101 Alaska 20 002 007 011 103 048
30 005 013 031 186 101 Nativea 30 005 009 021 103 048
40 009 027 065 184 102 40 005 017 041 102 049
50 019 058 118 181 103 50 013 039 075 102 051
60 042 107 160 174 106 60 028 067 087 097 051
70 075 136 - 153 105 70 046 070 - 081 049
80 087 - - 110 091 80 034 - - 049 030
Black 0 003 006 008 122 065 Hispanicb 0 007 013 017 141 080
10 003 006 009 122 066 10 005 010 015 135 080
20 003 006 014 120 065 20 005 009 016 130 079
30 004 011 025 119 066 30 005 011 023 127 078
40 008 022 048 118 066 40 007 018 040 124 078
50 015 042 079 115 067 50 012 034 072 120 078
60 031 071 102 112 068 60 024 064 100 114 078
70 051 089 - 101 068 70 046 086 - 102 077
80 058 - - 077 061 80 053 - - 074 070
Table 1321
Leukemia
Risk of Being Diagnosed With Cancer in 10 20 and 30 Years
Lifetime Risk of Being Diagnosed with Cancer Given Alive and Cancer-Free at Current Age and
Lifetime Risk of Dying from Cancer Given Alive at Current Age
Males 2014-2016 By RaceEthnicity
SEE
R C
ancer Statistics Review
1975-2016N
ational Cancer Institute
Devcan 677 April 2019 National Cancer Institute (httpssurveillancecancergovdevcan)Source Incidence data are from the SEER 21 areas (San Francisco Connecticut Detroit Hawaii Iowa New Mexico Seattle Utah Atlanta
San Jose-Monterey Los Angeles Alaska Native Registry Rural Georgia California excluding SFSJMLA Kentucky Louisiana New JerseyGeorgia excluding ATLRG Idaho New York and Massachusetts) Mortality data are from the NCHS public use data file for the total US
a Underlying incidence and mortality data for American IndianAlaska Native are based on the PRCDA(PurchasedReferred Care DeliveryAreas) counties
b Hispanic is not mutually exclusive from whites blacks AsianPacific Islanders and American IndiansAlaska NativesUnderlying incidence data for Hispanics are based on NHIA and exclude cases from the Alaska Native Registry
- Statistic could not be calculatedA percent of 000 represents a value that is below 0005
Risk of Being Risk of Being
Race Current Diagnosed with Cancer Risk of Dying Race Current Diagnosed with Cancer Risk of Dying
Ethnicity Age +10 yrs +20 yrs +30 yrs Ever from Cancer Ethnicity Age +10 yrs +20 yrs +30 yrs Ever from Cancer
All Races 0 006 008 011 129 068 Asian 0 005 008 010 083 048
10 003 005 009 125 069 Pacific 10 003 005 008 078 047
20 003 006 012 122 068 Islander 20 002 005 009 075 047
30 003 009 021 120 068 30 003 006 013 073 046
40 006 018 039 118 068 40 004 010 021 071 046
50 012 034 068 114 067 50 007 017 035 068 045
60 023 059 093 106 067 60 011 029 051 063 044
70 039 077 - 091 064 70 019 042 - 054 040
80 048 - - 066 055 80 026 - - 040 033
White 0 006 009 011 135 071 American 0 003 005 007 061 031
10 003 005 009 131 071 Indian 10 002 003 007 058 031
20 003 006 012 128 071 Alaska 20 002 005 008 056 031
30 003 010 022 126 071 Nativea 30 004 007 017 055 031
40 006 019 042 124 070 40 003 014 020 053 031
50 013 036 072 120 070 50 011 017 030 051 031
60 024 062 099 112 069 60 007 021 038 042 030
70 042 081 - 096 067 70 015 035 - 039 029
80 051 - - 069 057 80 025 - - 030 022
Black 0 004 006 008 095 053 Hispanicb 0 006 010 013 110 056
10 002 004 008 093 054 10 004 007 010 105 056
20 002 006 012 091 053 20 003 006 012 101 055
30 004 010 020 089 053 30 003 009 019 099 054
40 006 016 035 087 053 40 006 016 034 096 054
50 011 029 054 083 052 50 010 028 055 091 052
60 020 047 069 077 051 60 019 046 073 084 050
70 030 055 - 065 049 70 030 059 - 070 046
80 033 - - 046 042 80 035 - - 048 037
Table 1322
Leukemia
Risk of Being Diagnosed With Cancer in 10 20 and 30 Years
Lifetime Risk of Being Diagnosed with Cancer Given Alive and Cancer-Free at Current Age and
Lifetime Risk of Dying from Cancer Given Alive at Current Age
Females 2014-2016 By RaceEthnicity
SEER Cancer Statistics Review 1975-2016 National Cancer Institute
The AAPC is the Average Annual Percent Change over the time interval The AAPCs are calculated bythe Joinpoint Regression Program Version 47 February 2019 National Cancer Institute
- Statistic not shown Rate based on less than 16 cases for the time intervalTrend based on less than 10 cases for at least one year within the time interval
a Rates are age-adjusted to the 2000 US Std Population (19 age groups - Census P25-1130) Trendsare based on rates age-adjusted to the 2000 US Std Population (19 age groups - Census P25-1130)
b The SEER 9 areas are San Francisco Connecticut Detroit Hawaii Iowa New Mexico SeattleUtah and AtlantaThe SEER 21 areas comprise the SEER 9 areas plus San Jose-Monterey Los Angeles the AlaskaNative Registry Rural Georgia California excluding SFSJMLA Kentucky Louisiana New JerseyGeorgia excluding ATLRG Idaho New York and Massachusetts
c The 2007-2016 AAPC estimates are based on a Joinpoint analysis with up to 3 Joinpoints overdiagnosis years 2000-2016
d The 2007-2016 AAPC estimates are based on a Joinpoint analysis with up to 5 Joinpoints overdiagnosis years 1975-2016
e Hispanic and Non-Hispanic are not mutually exclusive from whites blacks AsianPacificIslanders and American IndiansAlaska Natives Incidence data for Hispanics and Non-Hispanicsare based on NHIA and exclude cases from the Alaska Native Registry
f Incidence data for American IndianAlaska Native are based on the PurchasedReferred CareDelivery Area (PRCDA) counties
g US Mortality Files National Center for Health Statistics CDCh The 2007-2016 mortality AAPCs are based on a Joinpoint analysis using years of death 2000-2016 The APC is significantly different from zero (plt05)
SEER Incidence SEER 21 Areasb SEER 21 Areasb SEER 9 Areasb
Rate 2012-2016 Trend 2007-2016c Trend 2007-2016d
Rate per 100000 persons AAPC () AAPC ()
Total Males Females Total Males Females Total Males Females RaceEthnicity
All Races 141 181 109 -04 -02 -06 -03 02 03
White 149 191 115 -05 -05 -07 04 03 05White Hispanice 112 134 94 01 -02 03 - - -White Non-Hispanice 153 197 116 -05 -05 -08 - - -
Black 109 139 89 06 02 07 01 01 02
AsianPacific Islander 78 97 63 01 00 02 - - -
Amer IndAlaska Natf 86 110 66 08 21 -01 - - -
Hispanice 108 130 91 02 00 03 - - -
US Mortalityg Rate 2012-2016 Trend 2007-2016h
Rate per 100000 persons AAPC ()
Total Males Females Total Males FemalesRaceEthnicity
All Races 65 88 49 -16 -17 -13
White 68 91 51 -14 -16 -12White Hispanice 50 63 41 -07 -08 -06White Non-Hispanice 69 93 51 -14 -15 -12
Black 55 72 44 -15 -17 -15
AsianPacific Islander 36 47 28 -18 -07 -23
Amer IndAlaska NatTotal US 31 42 23 -22 -09 -36PRCDA Counties 41 54 30 -16 -05 -28Non-PRCDA Counties 20 28 15 -31 -13 -50
Hispanice 47 60 38 -08 -09 -07
Table 1323Leukemia
SEER Incidence and US MortalityAge-Adjusted Rates and Trendsa
By RaceEthnicity and Sex
SEE
R C
ancer Statistics Review
1975-2016N
ational Cancer Institute
a Rates are per 100000 and are age-adjusted to the 2000 US Std Population (19 age groups - Census P25-1130)b The SEER 9 areas are San Francisco Connecticut Detroit Hawaii Iowa New Mexico Seattle Utah and Atlanta
The SEER 13 areas comprise the SEER 9 areas plus San Jose-Monterey Los Angeles the Alaska Native Registry and Rural GeorgiaThe SEER 18 areas comprise the SEER 13 areas plus California excluding SFSJMLA Kentucky Louisiana New Jersey and Georgiaexcluding ATLRGThe SEER 21 areas comprise the SEER 18 areas plus Idaho New York and Massachusetts
- Statistic not shown Rate based on less than 16 cases for the time interval
All Races Whites Blacks Total Males Females Total Males Females Total Males Females
SEER Incidence Ratesa 2012-2016
California 1239 1590 949 1337 1715 1020 1039 1334 813Greater Bay Area 1231 1619 915 1400 1844 1028 1098 1406 859San Francisco-Oakland 1212 1596 906 1389 1823 1034 1077 1336 881San Jose-Monterey 1259 1651 925 1410 1869 1011 1239 1787 -
Los Angeles 1173 1469 933 1291 1622 1016 1050 1294 884Greater California 1271 1633 968 1334 1709 1017 1007 1338 729
Connecticut 1406 1768 1117 1431 1790 1142 976 1126 867Detroit 1584 2050 1230 1707 2222 1300 1204 1485 1018Georgia 1430 1841 1120 1537 1970 1189 1139 1487 935Atlanta 1382 1819 1064 1563 2017 1207 1138 1557 884Rural Georgia 1411 1586 1206 1510 1773 1196 1248 - 1236Greater Georgia 1455 1863 1144 1531 1965 1182 1140 1450 968
Hawaii 1073 1339 843 1388 1612 1139 - - -Idaho 1588 1950 1263 1604 1973 1272 - - -Iowa 1627 2127 1222 1630 2133 1221 1416 1743 1076Kentucky 1566 1983 1234 1577 1995 1241 1159 1446 922Louisiana 1405 1789 1104 1518 1918 1197 1103 1393 890Massachusetts 1108 1429 854 1118 1448 856 787 1050 620New Jersey 1524 1962 1188 1541 1982 1199 1136 1469 928New Mexico 1299 1550 1086 1310 1556 1101 1045 - -New York 1623 2119 1244 1752 2281 1335 1068 1360 887Seattle-Puget Sound 1568 2020 1188 1634 2084 1249 1486 1929 1077Utah 1375 1793 1009 1401 1825 1029 - - -
SEER 9 Areasb 1419 1823 1094 1521 1945 1171 1154 1460 941SEER 13 Areasb 1357 1737 1049 1473 1882 1134 1126 1419 922SEER 18 Areasb 1376 1761 1066 1461 1867 1127 1114 1414 907SEER 21 Areasb 1407 1807 1088 1491 1912 1147 1089 1386 889
Table 1324Leukemia
Age-Adjusted SEER Incidence Ratesa
By Registry Race and Sex
SEE
R C
ancer Statistics Review
1975-2016N
ational Cancer Institute
a US Mortality Files National Center for Health Statistics Centers for Disease Control and PreventionRates are per 100000 and are age-adjusted to the 2000 US Std Population (19 age groups - Census P25-1130)
b The SEER 9 areas are San Francisco Connecticut Detroit Hawaii Iowa New Mexico Seattle Utah and AtlantaThe SEER 13 areas comprise the SEER 9 areas plus San Jose-Monterey Los Angeles the Alaska Native Registry and Rural GeorgiaThe SEER 18 areas comprise the SEER 13 areas plus California excluding SFSJMLA Kentucky Louisiana New Jersey and Georgiaexcluding ATLRGThe SEER 21 areas comprise the SEER 18 areas plus Idaho New York and Massachusetts
- Statistic not shown Rate based on less than 16 cases for the time interval
All Races Whites Blacks Total Males Females Total Males Females Total Males Females
SEER Death Ratesa 2012-2016
California 617 811 470 671 885 507 560 711 461Greater Bay Area 563 759 419 640 869 470 551 742 424San Francisco-Oakland 551 753 405 631 871 455 544 726 421San Jose-Monterey 584 768 446 653 863 495 604 - -
Los Angeles 608 797 468 675 894 513 571 717 483Greater California 639 835 489 677 886 515 553 687 458
Connecticut 622 837 465 639 862 474 536 665 449Detroit 662 915 485 691 967 494 573 723 475Georgia 614 817 467 642 855 478 538 706 438Atlanta 568 757 437 615 802 483 487 658 374Rural Georgia 581 628 538 579 635 - - - -Greater Georgia 639 851 482 654 879 477 576 745 483
Hawaii 463 593 362 543 632 440 - - -Idaho 655 846 497 661 865 492 - - -Iowa 693 961 498 700 963 508 - - -Kentucky 742 949 592 750 953 603 633 894 455Louisiana 677 906 514 705 953 520 603 776 498Massachusetts 622 830 478 647 869 490 463 524 444New Jersey 615 810 478 657 871 504 474 549 429New Mexico 560 759 400 589 794 421 - - -New York 621 842 466 675 910 506 450 602 356Seattle-Puget Sound 618 795 481 637 807 503 708 975 499Utah 679 865 526 693 876 542 - - -
SEER 9 Areasb 610 818 457 651 869 487 540 711 427SEER 13 Areasb 609 810 460 658 874 494 544 708 437SEER 18 Areasb 630 832 480 671 887 508 552 705 455SEER 21 Areasb 628 834 477 670 889 506 520 670 426
Total US 654 876 489 681 912 506 550 721 439
Table 1325Leukemia
Age-Adjusted SEER Death Ratesa
By Registry Race and Sex
SEER Cancer Statistics Review 1975-2016 National Cancer Institute
a US Mortality Files National Center for Health Statistics Centers for Disease Control andPrevention Rates are per 100000 and are age-adjusted to the 2000 US Std Population (19age groups - Census P25-1130)
b Difference between state rate and total US rate is statistically significant (plt=0002)c Absolute percent difference between state rate and total US rate is 15 or mored Rank of state level death rate and the 95 confidence intervals (low high) for the rankSE Standard error of the ratePD Percent difference between state rate and total US rate- Statistic not shown Rate based on less than 16 cases for the time interval
State Rate SE Rank(CI)d PD TOTAL US 654 002
High Five StatesOklahoma 790 019 01(0108) 2083c
West Virginia 749 025 02(0123) 1449South Dakota 747 040 03(0133) 1415Kentucky 742 018 04(0116) 1352Kansas 742 022 05(0122) 1350
Low Five StatesColorado 609 016 47(2649) -692Alaska 596 050 48(0451) -885New Mexico 560 022 49(3650) -1430DC 504 041 50(3251) -2293c
Hawaii 463 024 51(4951) -2913c
State Rate SE Rank(CI)d PD State Rate SE Rank(CI)d PD
Alabama 689 016 17(0532) 533 Montana 613 032 45(0950) -634Alaska 596 050 48(0451) -885 Nebraska 718 026 10(0131) 983Arizona 632 013 36(2248) -329 Nevada 644 021 28(1148) -157Arkansas 719 021 09(0127) 993 New Hampshire 638 029 31(0749) -238California 617 006 42(3248) -572 New Jersey 615 011 43(2849) -592Colorado 609 016 47(2649) -692 New Mexico 560 022 49(3650) -1430Connecticut 622 017 40(2249) -490 New York 621 007 41(2948) -499Delaware 664 035 24(0249) 152 North Carolina 634 011 34(2347) -310DC 504 041 50(3251) -2293c North Dakota 656 040 26(0249) 029Florida 630 007 38(2645) -370 Ohio 694 010 13(0626) 608Georgia 614 012 44(2849) -604 Oklahoma 790 019 01(0108) 2083c
Hawaii 463 024 51(4951) -2913c Oregon 632 017 37(1948) -331Idaho 655 028 27(0548) 012 Pennsylvania 680 009 21(1029) 396Illinois 684 010 19(0928) 463 Rhode Island 656 033 25(0349) 037Indiana 719 014 08(0222) 994 South Carolina 682 016 20(0634) 435Iowa 693 019 14(0334) 604 South Dakota 747 040 03(0133) 1415Kansas 742 022 05(0122) 1350 Tennessee 702 014 12(0327) 729Kentucky 742 018 04(0116) 1352 Texas 640 007 30(2342) -215Louisiana 677 017 23(0637) 356 Utah 679 024 22(0346) 387Maine 638 027 32(0949) -240 Vermont 636 041 33(0350) -277Maryland 633 014 35(2148) -323 Virginia 611 012 46(2849) -661Massachusetts 622 013 39(2548) -482 Washington 640 013 29(2047) -209Michigan 685 011 18(0829) 476 West Virginia 749 025 02(0123) 1449Minnesota 691 015 16(0430) 564 Wisconsin 727 015 06(0219) 1110Mississippi 692 021 15(0337) 580 Wyoming 721 049 07(0148) 1028Missouri 711 014 11(0324) 874
Table 1326Leukemia
Age-Adjusted Cancer Deatha Rates By State All Races 2012-2016
Males and Females
SEER Cancer Statistics Review 1975-2016 National Cancer Institute
a US Mortality Files National Center for Health Statistics Centers for Disease Control andPrevention Rates are per 100000 and are age-adjusted to the 2000 US Std Population (19age groups - Census P25-1130)
b Difference between state rate and total US rate is statistically significant (plt=0002)c Absolute percent difference between state rate and total US rate is 15 or mored Rank of state level death rate and the 95 confidence intervals (low high) for the rankSE Standard error of the ratePD Percent difference between state rate and total US rate- Statistic not shown Rate based on less than 16 cases for the time interval
State Rate SE Rank(CI)d PD TOTAL US 876 003
High Five StatesOklahoma 1022 034 01(0120) 1669c
Kansas 1018 039 02(0123) 1625c
Arkansas 991 037 03(0127) 1309South Dakota 985 068 04(0147) 1249Delaware 984 065 05(0144) 1236
Low Five StatesMontana 795 053 47(1150) -921New Mexico 759 039 48(2650) -1336Alaska 711 081 49(0851) -1887c
DC 704 078 50(1051) -1959c
Hawaii 593 040 51(4951) -3228c
State Rate SE Rank(CI)d PD State Rate SE Rank(CI)d PD
Alabama 939 029 17(0233) 725 Montana 795 053 47(1150) -921Alaska 711 081 49(0851) -1887c Nebraska 958 046 12(0141) 935Arizona 827 022 41(2449) -555 Nevada 858 037 33(0849) -210Arkansas 991 037 03(0127) 1309 New Hampshire 884 051 25(0149) 088California 811 010 43(3348) -738 New Jersey 810 020 44(2749) -747Colorado 834 028 39(2049) -484 New Mexico 759 039 48(2650) -1336Connecticut 837 031 37(1549) -441 New York 842 013 35(2546) -387Delaware 984 065 05(0144) 1236 North Carolina 863 020 31(1945) -149DC 704 078 50(1051) -1959c North Dakota 873 070 27(0150) -030Florida 839 012 36(2645) -422 Ohio 931 018 19(0529) 627Georgia 817 021 42(2649) -677 Oklahoma 1022 034 01(0120) 1669c
Hawaii 593 040 51(4951) -3228c Oregon 866 029 29(1147) -112Idaho 846 047 34(0550) -339 Pennsylvania 912 016 21(0931) 416Illinois 928 018 20(0529) 594 Rhode Island 911 059 22(0149) 400Indiana 960 025 11(0127) 959 South Carolina 951 029 13(0131) 853Iowa 961 035 08(0131) 969 South Dakota 985 068 04(0147) 1249Kansas 1018 039 02(0123) 1625c Tennessee 960 025 10(0127) 959Kentucky 949 031 15(0133) 832 Texas 870 013 28(2139) -069Louisiana 906 030 23(0442) 342 Utah 865 041 30(0549) -122Maine 803 046 46(1450) -836 Vermont 874 074 26(0150) -026Maryland 861 026 32(1447) -176 Virginia 809 021 45(2650) -770Massachusetts 830 023 40(2349) -529 Washington 835 023 38(2248) -463Michigan 937 020 18(0428) 702 West Virginia 972 044 06(0135) 1095Minnesota 948 027 16(0229) 826 Wisconsin 960 026 09(0127) 961Mississippi 970 039 07(0132) 1077 Wyoming 885 081 24(0150) 102Missouri 951 025 14(0228) 852
Table 1327Leukemia
Age-Adjusted Cancer Deatha Rates By State All Races 2012-2016
Males
SEER Cancer Statistics Review 1975-2016 National Cancer Institute
a US Mortality Files National Center for Health Statistics Centers for Disease Control andPrevention Rates are per 100000 and are age-adjusted to the 2000 US Std Population (19age groups - Census P25-1130)
b Difference between state rate and total US rate is statistically significant (plt=0002)c Absolute percent difference between state rate and total US rate is 15 or mored Rank of state level death rate and the 95 confidence intervals (low high) for the rankSE Standard error of the ratePD Percent difference between state rate and total US rate- Statistic not shown Rate based on less than 16 cases for the time interval
State Rate SE Rank(CI)d PD TOTAL US 489 002
High Five StatesOklahoma 615 023 01(0108) 2584c
Wyoming 596 060 02(0147) 2194c
Kentucky 592 021 03(0111) 2126c
West Virginia 576 030 04(0126) 1792c
South Dakota 564 047 05(0145) 1551c
Low Five StatesColorado 441 018 47(2250) -972Delaware 428 037 48(0751) -1247New Mexico 400 025 49(3151) -1803c
DC 381 046 50(1251) -2203c
Hawaii 362 029 51(4151) -2598c
State Rate SE Rank(CI)d PD State Rate SE Rank(CI)d PD
Alabama 512 019 18(0440) 483 Montana 452 037 43(0551) -745Alaska 485 062 27(0151) -073 Nebraska 531 030 10(0144) 864Arizona 473 015 31(1347) -308 Nevada 455 025 42(1150) -695Arkansas 516 024 15(0344) 554 New Hampshire 449 033 45(0651) -807California 470 007 34(2345) -383 New Jersey 478 013 30(1346) -223Colorado 441 018 47(2250) -972 New Mexico 400 025 49(3151) -1803c
Connecticut 465 020 40(1249) -487 New York 466 009 38(2246) -456Delaware 428 037 48(0751) -1247 North Carolina 471 012 32(1747) -350DC 381 046 50(1251) -2203c North Dakota 479 046 28(0151) -189Florida 460 008 41(2647) -582 Ohio 520 012 12(0529) 653Georgia 467 013 37(1747) -433 Oklahoma 615 023 01(0108) 2584c
Hawaii 362 029 51(4151) -2598c Oregon 449 019 44(1850) -799Idaho 497 033 22(0249) 174 Pennsylvania 516 011 14(0629) 556Illinois 514 011 16(0631) 526 Rhode Island 471 037 33(0351) -363Indiana 540 017 07(0226) 1052 South Carolina 495 018 23(0645) 133Iowa 498 022 20(0547) 200 South Dakota 564 047 05(0145) 1551c
Kansas 539 025 08(0137) 1032 Tennessee 517 016 13(0435) 590Kentucky 592 021 03(0111) 2126c Texas 467 008 36(2246) -431Louisiana 514 020 17(0442) 520 Utah 526 029 11(0146) 778Maine 508 032 19(0248) 403 Vermont 444 045 46(0351) -906Maryland 470 016 35(1448) -389 Virginia 465 014 39(1848) -474Massachusetts 478 015 29(1247) -220 Washington 487 016 25(0946) -022Michigan 498 013 21(0939) 192 West Virginia 576 030 04(0126) 1792c
Minnesota 494 017 24(0745) 121 Wisconsin 545 017 06(0225) 1162Mississippi 485 023 26(0548) -067 Wyoming 596 060 02(0147) 2194c
Missouri 535 017 09(0327) 953
Table 1328Leukemia
Age-Adjusted Cancer Deatha Rates By State All Races 2012-2016
Females
SEE
R C
ancer Statistics Review
1975-2016N
ational Cancer Institute
a US 2016 cancer prevalence counts are based on 2016 cancer prevalence proportions from the SEER 13 Areas (excluding the AlaskaNative Registry) and 112016 US population estimates based on the average of 2015 and 2016 population estimates from theUS Bureau of the CensusPrevalence was calculated using the first invasive tumor for each cancer site diagnosed during the previous 24 years
b Maximum limited-duration prevalence is 24 years for 1992-2016 datac Percentages are age-adjusted to the 2000 US Standard Population (19 age groups - Census P25-1130) by 5-year age groupsd Cases diagnosed more than 24 years ago were estimated using the completeness index method (Capocaccia et al 1997
Merrill et al 2000)e Complete prevalence is obtained by summing 0 to lt24 and gt=24- Statistic not shown Statistic based on fewer than 5 cases estimated alive in SEER for the time interval+ Not available
Years Since Diagnosis 0 to lt5 5 to lt10 10 to lt15 15 to lt20 20 to lt24 0 to lt24b gt=24d Completee
Race Sex All Races Both Sexes 153253 100309 63581 38012 21353 376508 38265 414773
Males 90192 57683 36029 21220 12020 217145 18411 235556Females 63061 42625 27552 16792 9333 159363 19854 179217
White Both Sexes 132173 87961 56051 33596 19035 328814 32999 370135Males 78368 50894 32033 18770 10845 190910 15102 210930Females 53805 37067 24018 14826 8190 137905 17897 159205
Black Both Sexes 12734 6564 4233 2487 1259 27277 4070 31347Males 6847 3556 2204 1334 637 14578 1776 16354Females 5887 3008 2029 1153 622 12699 2294 14992
Asian Both Sexes 3926 2561 1778 1164 690 10120 + +Pacific Males 2235 1462 936 646 351 5630 + +Islander Females 1691 1100 842 519 339 4490 + +
Hispanic Both Sexes 14464 9581 6796 4462 2630 37933 + +Males 8166 5374 3794 2408 1538 21280 + +Females 6298 4207 3002 2055 1092 16654 + +
Age Specific (Crude) Age-Adjustedc Age at Prevalence All Ages 0-9 10-19 20-29 30-39 40-49 50-59 60-69 70-79 80+ All Ages
Race Sex All Races Both Sexes 01168 00328 00640 00628 00377 00561 01053 02263 04023 05111 01054
Males 01369 00339 00706 00685 00419 00657 01287 02888 05282 07048 01306Females 00974 00317 00572 00570 00333 00466 00829 01696 02974 03919 00844
White Both Sexes 01304 00369 00715 00712 00410 00584 01106 02389 04249 05386 01127Males 01528 00379 00789 00771 00457 00682 01349 03042 05558 07387 01389Females 01084 00359 00637 00650 00362 00484 00869 01784 03135 04133 00904
Black Both Sexes 00605 00145 00322 00320 00267 00463 00752 01455 02470 03076 00660Males 00674 00142 00357 00338 00281 00530 00919 01737 03249 04580 00816Females 00541 00148 00286 00301 00255 00402 00605 01230 01927 02334 00552
Asian Both Sexes 00497 00264 00531 00426 00230 00390 00553 00882 01245 01389 00513Pacific Males 00577 00298 00555 00507 00249 00461 00665 01122 01552 01904 00613Islander Females 00423 00228 00507 00345 00212 00327 00456 00688 00999 01057 00430
Hispanic Both Sexes 00664 00375 00737 00728 00395 00485 00723 01191 01987 02074 00746Males 00737 00397 00827 00807 00471 00576 00831 01350 02221 02551 00854Females 00589 00352 00642 00641 00312 00391 00617 01050 01809 01780 00647
Table 1329Leukemia
Estimated United States Cancer Prevalence Countsa on January 1 2016By RaceEthnicity Sex and Years Since Diagnosis
Estimated prevalence percenta on January 1 2016 of the SEER population diagnosed in the previous 24 yearsBy Age at Prevalence RaceEthnicity and Sex
SEE
R C
ancer Statistics Review
1975-2016N
ational Cancer Institute
a US 2016 cancer prevalence counts are based on 2016 cancer prevalence proportions from the SEER 13 Areas (excluding the AlaskaNative Registry) and 112016 US population estimates based on the average of 2015 and 2016 population estimates from theUS Bureau of the CensusPrevalence was calculated using the first invasive tumor for each cancer site diagnosed during the previous 24 years
b Maximum limited-duration prevalence is 24 years for 1992-2016 datac Percentages are age-adjusted to the 2000 US Standard Population (19 age groups - Census P25-1130) by 5-year age groupsd Cases diagnosed more than 24 years ago were estimated using the completeness index method (Capocaccia et al 1997
Merrill et al 2000)e Complete prevalence is obtained by summing 0 to lt24 and gt=24- Statistic not shown Statistic based on fewer than 5 cases estimated alive in SEER for the time interval+ Not available
Years Since Diagnosis 0 to lt5 5 to lt10 10 to lt15 15 to lt20 20 to lt24 0 to lt24b gt=24d Completee
Race Sex All Races Both Sexes 20277 16033 13721 12074 8203 70308 25456 95764
Males 11203 9049 7751 6542 4634 39179 12997 52176Females 9074 6984 5971 5531 3568 31129 12460 43589
White Both Sexes 17123 13855 11870 10663 7154 60665 21823 83282Males 9549 7741 6768 5696 4084 33839 11286 45559Females 7573 6114 5102 4967 3070 26826 10537 37723
Black Both Sexes 1590 1133 923 727 553 4926 1609 6535Males 809 734 473 411 290 2716 592 3308Females 781 399 450 317 263 2210 1017 3227
Asian Both Sexes 998 720 669 486 361 3234 + +Pacific Males 527 406 369 313 178 1793 + +Islander Females 472 314 300 173 183 1441 + +
Hispanic Both Sexes 5905 4543 3352 2717 1749 18266 + +Males 3302 2686 1899 1465 1058 10409 + +Females 2603 1857 1454 1252 692 7857 + +
Age Specific (Crude) Age-Adjustedc Age at Prevalence All Ages 0-9 10-19 20-29 30-39 40-49 50-59 60-69 70-79 80+ All Ages
Race Sex All Races Both Sexes 00218 00276 00541 00467 00139 00078 00059 00065 00053 00033 00228
Males 00247 00286 00591 00520 00163 00095 00066 00069 00056 00035 00251Females 00190 00266 00488 00410 00115 00062 00053 00062 00050 00032 00204
White Both Sexes 00241 00315 00612 00542 00161 00086 00063 00070 00056 00033 00259Males 00271 00323 00670 00598 00186 00107 00069 00074 00060 00032 00284Females 00211 00306 00551 00482 00135 00064 00057 00066 00053 00033 00232
Black Both Sexes 00109 00107 00250 00197 00067 00042 00039 00029 00012 00027 00102Males 00126 00112 00281 00224 00079 00035 00052 00026 00012 00027 00112Females 00094 00102 00219 00171 00056 00047 00028 00032 00013 00027 00092
Asian Both Sexes 00159 00208 00418 00289 00071 00064 00045 00050 00054 00036 00163Pacific Males 00184 00226 00427 00360 00086 00069 00055 00054 00033 00055 00180Islander Females 00136 00190 00408 00219 00058 00059 00036 00047 00071 00023 00146
Hispanic Both Sexes 00320 00328 00637 00574 00165 00107 00093 00100 00084 00012 00279Males 00361 00342 00710 00648 00205 00131 00110 00063 00072 - 00309Females 00278 00312 00562 00494 00122 00082 00077 00133 00093 00020 00246
Table 1330Acute Lymphocytic Leukemia
Estimated United States Cancer Prevalence Countsa on January 1 2016By RaceEthnicity Sex and Years Since Diagnosis
Estimated prevalence percenta on January 1 2016 of the SEER population diagnosed in the previous 24 yearsBy Age at Prevalence RaceEthnicity and Sex
0
5
10
15
20
25
1975 1985 1995 2005 20160
5
10
15
20
25
1975 1985 1995 2005 20160
3
6
9
12
15
1975 1985 1995 2005 20160
3
6
9
12
15
1975 1985 1995 2005 2016
Delay-Adj IncidenceDelay-Adj Incidence
Observed IncidenceObserved Incidence
MortalityMortality
SEER Observed Incidence SEER Delay Adjusted Incidence and US Death RatesLeukemia by Race and Sex
a
Figure 131
Source SEER 9 areas and US Mortality Files (National Center for Health Statistics CDC)Rates are age-adjusted to the 2000 US Std Population (19 age groups - Census P25-1103)Regression lines and APCs are calculated using the Joinpoint Regression Program Version 47 February 2019 National Cancer InstituteThe APC is the Annual Percent Change for the regression line segments The APC shown on the graph is for the most recent trendThe APC is significantly different from zero (p lt 005)
a
White Male Black Male White Female Black FemaleRate per 100000 Rate per 100000 Rate per 100000 Rate per 100000
Year of DiagnosisDeath Year of DiagnosisDeath Year of DiagnosisDeath Year of DiagnosisDeath
SEER Incidence APCsDelay Adj 1998-16 = 08Observed 1975-16 = 03
US Mortality APC2013-16 = -30
SEER Incidence APCsDelay Adj 1975-16 = 02Observed 1975-16 = 01
US Mortality APC1993-16 = -15
SEER Incidence APCsDelay Adj 1975-16 = 06Observed 1975-16 = 05
US Mortality APC2000-16 = -12
SEER Incidence APCsDelay Adj 1975-16 = 03Observed 1975-16 = 02
US Mortality APC1993-16 = -13
SEE
R C
ancer Statistics Review
1975-2016N
ational Cancer Institute
0
1
2
3
4
5
6
7
8
1975 1985 1995 2005 20160
1
2
3
4
5
6
7
8
1975 1985 1995 2005 20160
1
2
3
4
5
6
7
8
1975 1985 1995 2005 20160
1
2
3
4
5
6
7
8
1975 1985 1995 2005 2016
Chronic
Acute
SEER Observed Incidence RatesLymphocytic and Myeloid Leukemia (Acute and Chronic) by Sex
a
Figure 132
Source SEER 9 areas Rates are age-adjusted to the 2000 US Std Population (19 age groups - Census P25-1103)Regression lines and APCs are calculated using the Joinpoint Regression Program Version 47 February 2019 National Cancer Institute
a
Male Female Male FemaleLymphocytic Leukemia Myeloid Leukemia
Rate per 100000 Rate per 100000 Rate per 100000 Rate per 100000
Year of Diagnosis Year of Diagnosis Year of Diagnosis Year of Diagnosis
SEE
R C
ancer Statistics Review
1975-2016N
ational Cancer Institute
Joinpoint Analyses for Whites and Blacks from 1975-2016and for AsianPacific Islanders American IndiansAlaska Natives and Hispanics from 2000-2016
0
5
10
15
20
1975 1985 1995 2005 20160
5
10
15
20
1975 1985 1995 2005 2016
White
Black
API
AIAN
Hispanic
SEER Incidence and US Death RatesLeukemia Both Sexes
Figure 133
Source Incidence data for whites and blacks are from the SEER 9 areas (San Francisco Connecticut Detroit Hawaii Iowa New Mexico Seattle Utah Atlanta)Incidence data for AsianPacific Islanders American IndiansAlaska Natives and Hispanics are from the SEER 21 areas (SEER 9 areas San Jose-MontereyLos Angeles Alaska Native Registry Rural Georgia California excluding SFSJMLA Kentucky Louisiana New Jersey Georgia excluding ATLRG Idaho New York andMassachusetts)Mortality data are from US Mortality Files National Center for Health Statistics CDCRates are age-adjusted to the 2000 US Std Population (19 age groups - Census P25-1103)Regression lines are calculated using the Joinpoint Regression Program Version 47 February 2019 National Cancer Institute Joinpoint analyses for Whites andBlacks during the 1975-2016 period allow a maximum of 5 joinpoints Analyses for other ethnic groups during the period 2000-2016 allow a maximum of 3 joinpointsAPI = AsianPacific IslanderAIAN = American IndianAlaska Native Rates for American IndianAlaska Native are based on the PurchasedReferred Care Delivery Area (PRCDA) countiesHispanic is not mutually exclusive from whites blacks AsianPacific Islanders and American IndiansAlaska Natives Incidence data for Hispanics are based onNHIA and exclude cases from the Alaska Native Registry
Incidence MortalityRate per 100000 Rate per 100000
Year of Diagnosis Year of Death
a
d
a
b
c
c
b
d
SEE
R C
ancer Statistics Review
1975-2016N
ational Cancer Institute
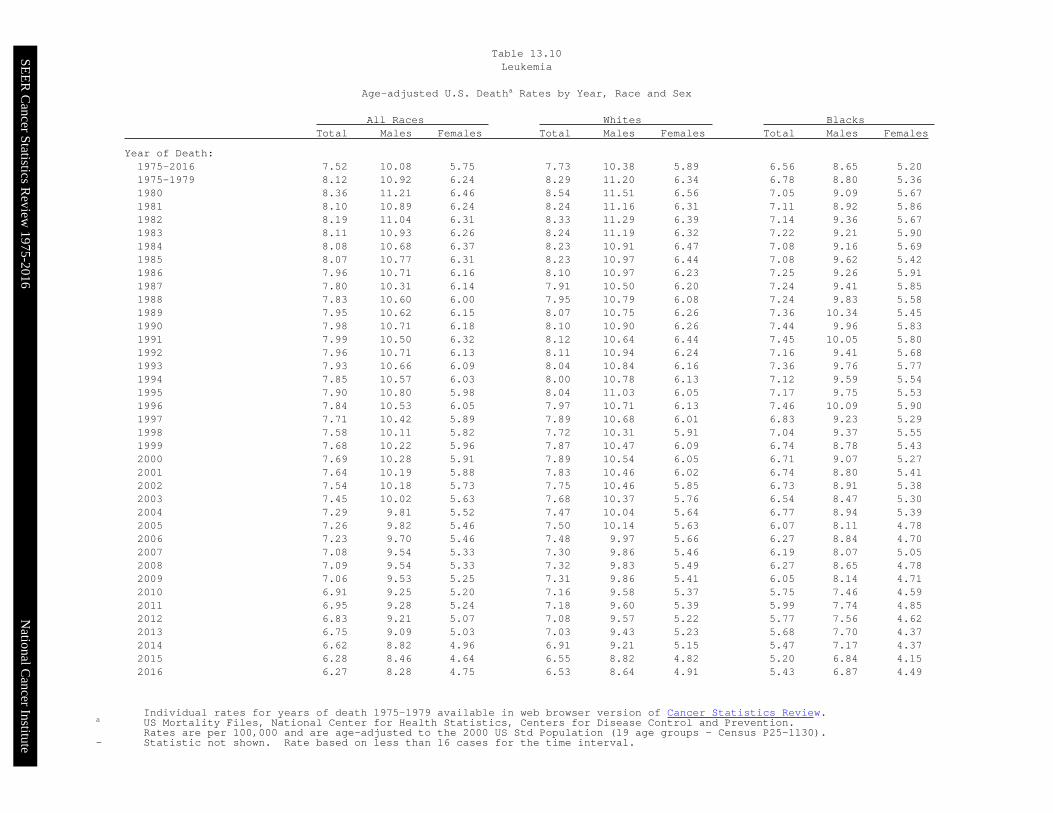
SEE
R C
ancer Statistics Review
1975-2016N
ational Cancer Institute
Individual rates for years of death 1975-1979 available in web browser version of Cancer Statistics Reviewa US Mortality Files National Center for Health Statistics Centers for Disease Control and Prevention
Rates are per 100000 and are age-adjusted to the 2000 US Std Population (19 age groups - Census P25-1130)- Statistic not shown Rate based on less than 16 cases for the time interval
All Races Whites Blacks Total Males Females Total Males Females Total Males Females
Year of Death1975-2016 752 1008 575 773 1038 589 656 865 5201975-1979 812 1092 624 829 1120 634 678 880 5361980 836 1121 646 854 1151 656 705 909 5671981 810 1089 624 824 1116 631 711 892 5861982 819 1104 631 833 1129 639 714 936 5671983 811 1093 626 824 1119 632 722 921 5901984 808 1068 637 823 1091 647 708 916 5691985 807 1077 631 823 1097 644 708 962 5421986 796 1071 616 810 1097 623 725 926 5911987 780 1031 614 791 1050 620 724 941 5851988 783 1060 600 795 1079 608 724 983 5581989 795 1062 615 807 1075 626 736 1034 5451990 798 1071 618 810 1090 626 744 996 5831991 799 1050 632 812 1064 644 745 1005 5801992 796 1071 613 811 1094 624 716 941 5681993 793 1066 609 804 1084 616 736 976 5771994 785 1057 603 800 1078 613 712 959 5541995 790 1080 598 804 1103 605 717 975 5531996 784 1053 605 797 1071 613 746 1009 5901997 771 1042 589 789 1068 601 683 923 5291998 758 1011 582 772 1031 591 704 937 5551999 768 1022 596 787 1047 609 674 878 5432000 769 1028 591 789 1054 605 671 907 5272001 764 1019 588 783 1046 602 674 880 5412002 754 1018 573 775 1046 585 673 891 5382003 745 1002 563 768 1037 576 654 847 5302004 729 981 552 747 1004 564 677 894 5392005 726 982 546 750 1014 563 607 811 4782006 723 970 546 748 997 566 627 884 4702007 708 954 533 730 986 546 619 807 5052008 709 954 533 732 983 549 627 865 4782009 706 953 525 731 986 541 605 814 4712010 691 925 520 716 958 537 575 746 4592011 695 928 524 718 960 539 599 774 4852012 683 921 507 708 957 522 577 756 4622013 675 909 503 703 943 523 568 770 4372014 662 882 496 691 921 515 547 717 4372015 628 846 464 655 882 482 520 684 4152016 627 828 475 653 864 491 543 687 449
Table 1310Leukemia
Age-adjusted US Deatha Rates by Year Race and Sex
SEE
R C
ancer Statistics Review
1975-2016N
ational Cancer Institute
a SEER 21 areas Rates are per 100000 and are age-adjusted to the 2000 US Std Population (19 age groups - Census P25-1130)unless noted
b US Mortality Files National Center for Health Statistics Centers for Disease Control and PreventionRates are per 100000 and are age-adjusted to the 2000 US Std Population (19 age groups - Census P25-1130) unless noted
c Rates are per 100000 and are age-adjusted to the world (WHO 2000-2025) standard million- Statistic not shown Rate based on less than 16 cases for the time interval
All Races Whites Blacks Total Males Females Total Males Females Total Males Females
SEER IncidenceAge at DiagnosisAge-Adjusted Rates 2012-2016All ages 141 181 109 149 191 115 109 139 89Under 65 71 83 58 74 87 61 58 66 5165 and over 625 855 457 668 909 487 460 641 349
All ages (WHO world std)c 109 137 86 116 145 90 85 105 71
Age-Specific Rates 2012-2016lt1 45 43 48 45 44 47 34 - 441-4 89 91 87 97 101 94 46 43 495-9 43 47 38 47 53 41 22 20 2410-14 33 38 28 34 38 30 26 31 2015-19 31 38 24 33 41 25 20 25 1520-24 29 32 25 30 35 25 24 22 2625-29 30 34 26 30 34 26 26 28 2430-34 37 42 32 37 43 32 33 33 3335-39 45 51 39 46 52 39 45 48 4240-44 61 71 51 63 73 53 58 69 4945-49 84 97 71 86 99 73 85 96 7450-54 127 156 99 133 164 103 104 123 8755-59 182 223 143 192 234 151 150 183 12260-64 271 346 202 285 365 210 230 279 19065-69 404 533 290 429 564 306 330 428 25670-74 549 735 394 584 777 419 416 563 31275-79 706 954 513 757 1015 552 535 755 39380-84 843 1180 611 902 1256 653 585 869 42885+ 880 1262 683 941 1356 725 567 810 466
US MortalityAge at DeathAge-Adjusted Rates 2012-2016All ages 65 88 49 68 91 51 55 72 44Under 65 18 22 15 18 22 15 20 23 1765 and over 392 544 283 411 570 296 299 410 232
All ages (WHO world std)c 37 48 28 38 49 29 33 43 27
Age-Specific Rates 2012-2016lt1 05 04 06 05 05 05 06 - -1-4 07 07 07 07 07 07 07 07 075-9 05 05 04 05 06 04 04 04 0310-14 06 06 05 06 06 05 05 06 0515-19 07 09 06 08 09 06 05 06 0420-24 09 11 06 09 11 07 09 10 0725-29 09 11 07 09 11 08 08 10 0730-34 10 12 08 10 12 08 11 13 1035-39 12 14 10 12 14 10 14 15 1240-44 16 17 14 16 17 15 18 18 1745-49 22 25 20 23 25 21 26 30 2250-54 34 40 28 34 41 28 39 44 3555-59 56 68 43 56 69 44 62 77 5060-64 93 118 70 95 121 70 101 130 7765-69 160 215 111 166 223 114 150 203 11070-74 272 364 194 285 380 202 231 302 18175-79 428 589 300 450 618 314 333 460 25180-84 615 863 441 647 903 462 457 633 35885+ 827 1192 638 875 1259 672 525 746 433
Table 1311Leukemia
SEER Incidencea and US Deathb Rates Age-Adjusted and Age-Specific Rates by Race and Sex
SEE
R C
ancer Statistics Review
1975-2016N
ational Cancer Institute
a SEER 21 areas Rates are per 100000 and are age-adjusted to the 2000 US Std Population (19 age groups - Census P25-1130)unless noted
b Rates are per 100000 and are age-adjusted to the world (WHO 2000-2025) standard million- Statistic not shown Rate based on less than 16 cases for the time interval
All Races Whites Blacks Total Males Females Total Males Females Total Males Females
Acute Lymphocytic LeukemiaAge at DiagnosisAge-Adjusted Rates 2012-2016All ages 17 19 15 19 21 16 10 11 09Under 65 17 20 15 19 22 16 10 11 0965 and over 16 18 13 17 20 14 10 12 09
All ages (WHO world std)b 19 21 16 20 23 18 10 11 09
Age-Specific Rates 2012-2016lt1 19 16 22 19 16 23 14 - -1-4 76 77 74 84 87 81 33 30 375-9 36 40 33 41 46 36 18 15 2010-14 23 26 19 24 27 21 14 19 0915-19 18 24 12 20 27 13 07 12 -20-24 10 14 07 12 16 07 05 06 0525-29 08 10 06 08 11 06 05 - -30-34 07 09 06 08 09 06 04 - -35-39 08 10 06 08 10 07 06 07 -40-44 08 09 06 08 10 06 06 07 -45-49 09 09 09 09 09 10 04 - -50-54 09 10 08 09 10 09 07 09 -55-59 11 12 11 12 13 11 11 12 1060-64 13 15 11 13 15 11 11 13 0965-69 14 14 13 15 16 14 07 - -70-74 16 19 13 17 20 14 - - -75-79 17 20 15 18 21 16 13 - -80-84 17 23 13 17 24 13 - - -85+ 15 19 13 16 20 14 - - -
Chronic Lymphocytic LeukemiaAge at DiagnosisAge-Adjusted Rates 2012-2016All ages 49 68 35 54 73 38 34 49 24Under 65 17 22 12 18 24 13 12 16 0865 and over 275 383 195 298 411 212 185 273 129
All ages (WHO world std)b 35 47 24 38 51 27 24 34 17
Age-Specific Rates 2012-2016lt1 - - - - - - - - -1-4 - - - - - - - - -5-9 - - - - - - - - -10-14 - - - - - - - - -15-19 - - - - - - - - -20-24 - - - - - - - - -25-29 01 01 - 01 - - - - -30-34 01 02 - 01 02 - - - -35-39 04 04 03 04 05 04 04 - -40-44 10 12 08 10 13 08 08 12 -45-49 22 28 17 24 30 19 18 24 1250-54 48 65 32 53 70 36 32 46 2055-59 80 103 58 88 113 64 51 66 3760-64 125 170 84 134 180 90 94 129 6665-69 189 258 129 204 274 140 135 188 9570-74 245 338 167 265 361 182 176 263 11675-79 306 423 216 333 455 236 213 321 14580-84 354 502 252 385 541 275 222 360 14685+ 379 543 294 413 594 318 218 302 183
Table 1312Lymphocytic Leukemia
SEER Incidencea Rates Age-Adjusted and Age-Specific Rates by Race and Sex
SEE
R C
ancer Statistics Review
1975-2016N
ational Cancer Institute
a SEER 21 areas Rates are per 100000 and are age-adjusted to the 2000 US Std Population (19 age groups - Census P25-1130)unless noted
b Rates are per 100000 and are age-adjusted to the world (WHO 2000-2025) standard million- Statistic not shown Rate based on less than 16 cases for the time interval
All Races Whites Blacks Total Males Females Total Males Females Total Males Females
Acute Myeloid LeukemiaAge at DiagnosisAge-Adjusted Rates 2012-2016All ages 43 52 35 44 54 36 37 44 33Under 65 20 21 19 20 21 19 20 20 2065 and over 201 269 152 213 284 160 155 210 123
All ages (WHO world std)b 32 38 28 33 40 28 29 33 27
Age-Specific Rates 2012-2016lt1 16 16 16 15 15 15 - - -1-4 10 10 10 09 09 09 11 10 115-9 04 04 04 04 04 04 03 - -10-14 07 08 06 07 08 06 09 09 0815-19 09 09 09 09 10 09 08 07 0820-24 11 10 12 11 10 12 12 11 1325-29 12 11 12 11 11 12 11 10 1230-34 14 15 14 14 15 14 17 15 1935-39 16 16 16 15 16 15 18 16 2040-44 21 22 21 22 22 22 22 21 2245-49 25 25 25 25 25 25 28 27 2950-54 35 38 32 36 40 33 33 32 3355-59 49 56 43 49 56 43 49 57 4360-64 78 91 67 82 97 68 70 75 6665-69 121 152 94 129 163 98 100 118 8670-74 183 236 139 192 247 145 151 189 12575-79 233 310 174 248 326 186 185 256 14080-84 286 393 212 302 413 223 207 314 14885+ 263 380 203 277 403 212 174 254 141
Chronic Myeloid LeukemiaAge at DiagnosisAge-Adjusted Rates 2012-2016All ages 19 24 14 19 25 15 18 22 15Under 65 11 13 09 11 12 09 11 13 1065 and over 76 106 55 80 111 57 62 82 49
All ages (WHO world std)b 15 19 11 15 19 12 14 17 12
Age-Specific Rates 2012-2016lt1 05 05 - 04 - - - - -1-4 01 - - 01 - - - - -5-9 01 - 01 01 - - - - -10-14 01 02 01 01 01 01 - - -15-19 03 03 02 02 03 02 03 - -20-24 05 06 04 05 06 04 04 - -25-29 07 09 06 07 08 06 07 10 -30-34 10 12 08 11 12 09 08 09 0835-39 11 13 09 11 13 10 12 13 1040-44 14 18 11 14 18 11 16 22 1045-49 18 21 15 17 20 14 25 28 2350-54 22 26 17 21 26 17 23 25 2055-59 25 29 22 26 29 23 25 28 2260-64 35 43 27 35 44 27 34 41 2965-69 49 67 34 50 68 33 55 68 4570-74 65 85 48 68 89 51 49 66 3675-79 91 124 65 97 132 69 69 98 5080-84 105 147 75 112 156 80 76 92 6785+ 102 155 75 107 164 76 75 109 60
Table 1313Myeloid Leukemia
SEER Incidencea Rates Age-Adjusted and Age-Specific Rates by Race and Sex
SEE
R C
ancer Statistics Review
1975-2016N
ational Cancer Institute
a Based on End Results data from a series of hospital registries and one population-based registryb SEER 9 areas (San Francisco Connecticut Detroit Hawaii Iowa New Mexico Seattle Utah Atlanta)
Based on follow-up of patients into 2016 Expected survival rates are derived from the US Annual Life Tablesc SEER 18 areas (San Francisco Connecticut Detroit Hawaii Iowa New Mexico Seattle Utah Atlanta San Jose-Monterey
Los Angeles Alaska Native Registry Rural Georgia California excluding SFSJMLA Kentucky Louisiana New Jersey andGeorgia excluding ATLRG) Expected survival rates are derived from life tables by socio-economic status geography and racedeveloped by the SEER programBased on follow-up of patients into 2016
d Period survival provides a 2015 estimate of survival by piecing together the most recent conditional survival estimatesfrom several cohorts It is computed here using three year calendar blocks (2010-2012 0-1 year survival)(2009-2011 1-2 year survival) (2008-2010 2-3 year survival) (2007-2009 3-4 year survival) (2006-2008 4-5 years survival)
e The difference between 1975-1977 and 2009-2015 is statistically significant (plt05)f The standard error is between 5 and 10 percentage pointsg The standard error is greater than 10 percentage points- Statistic could not be calculated due to fewer than 25 cases during the time period
All Races Whites Blacks Total Males Females Total Males Females Total Males Females
5-Year Relative Survival (Percent)Year of Diagnosis1960-1963a - - - 14 - - - - -1970-1973a - - - 22 - - - - -1975-1977b 341 330 356 345 336 358 334 304 3671978-1980b 360 350 373 367 358 380 282 273 2931981-1983b 373 369 378 381 378 385 339 334 3431984-1986b 405 401 411 416 413 420 327 315 3411987-1989b 429 440 413 439 455 418 350 327 3781990-1992b 452 446 461 465 463 468 357 305 4131993-1995b 476 484 464 487 495 475 413 416 4091996-1998b 484 486 481 498 497 498 386 390 3801999-2001b 510 520 495 520 530 507 437 451 4212002-2004b 583 584 581 591 594 588 540 543 5342005-2008b 623 635 607 633 643 620 560 599 5112009-2015b 658e 673e 637e 668e 682e 649e 596e 609e 582e
5-Year Period Survival (Percent)cd
2015 632 643 619 634 640 624 582 617 544
5-Year Relative Survival (Percent) 2009-2015c
Age at DiagnosisAges lt45 762 758 768 773 764 786 677 677 677Ages 45-54 722 737 698 735 746 716 628 662 586Ages 55-64 693 699 683 704 707 698 589 605 566Ages 65-74 610 610 611 614 610 620 541 553 523Ages 75+ 421 424 417 427 428 425 337 357 316Ages lt65 729 731 725 739 738 741 637 650 621Ages 65+ 508 517 496 511 518 502 446 474 415
Table 1314Leukemia
5-Year Relative and Period Survival (Percent) by Race Sex Diagnosis Year and Age
SEE
R C
ancer Statistics Review
1975-2016N
ational Cancer Institute
a SEER 9 areas (San Francisco Connecticut Detroit Hawaii Iowa New Mexico Seattle Utah Atlanta)Based on follow-up of patients into 2016 Expected survival rates are derived from the US Annual Life Tables
b SEER 18 areas (San Francisco Connecticut Detroit Hawaii Iowa New Mexico Seattle Utah Atlanta San Jose-MontereyLos Angeles Alaska Native Registry Rural Georgia California excluding SFSJMLA Kentucky Louisiana New Jersey andGeorgia excluding ATLRG) Expected survival rates are derived from life tables by socio-economic status geography and racedeveloped by the SEER programBased on follow-up of patients into 2016
c Period survival provides a 2015 estimate of survival by piecing together the most recent conditional survival estimatesfrom several cohorts It is computed here using three year calendar blocks (2010-2012 0-1 year survival)(2009-2011 1-2 year survival) (2008-2010 2-3 year survival) (2007-2009 3-4 year survival) (2006-2008 4-5 years survival)
d The difference between 1975-1977 and 2009-2015 is statistically significant (plt05)e The standard error is between 5 and 10 percentage pointsf The standard error is greater than 10 percentage points- Statistic could not be calculated due to fewer than 25 cases during the time period
All Races Whites Blacks Total Males Females Total Males Females Total Males Females
Acute Lymphocytic Leukemia5-Year Relative Survival (Percent)Year of Diagnosis1975-1977a 406 369 456 408 374 457 335e - -1987-1989a 544 537 552 550 547 553 447e 420e 471e1990-1992a 580 545 631 577 549 620 571e 504e 633e1993-1995a 602 578 636 598 578 627 532e 459e 638e1996-1998a 655 644 669 664 643 690 556e 591e 502e1999-2001a 635 634 635 648 652 642 566e 503e 630e2002-2004a 673 661 689 676 666 691 645e 594e 697e2005-2008a 701 693 713 700 686 720 652 700 551e2009-2015a 717d 723d 710d 726d 737d 713d 625d 607 647e
5-Year Period Survival (Percent)bc2015 691 684 698 685 674 700 650 650 648
5-Year Relative Survival (Percent) 2009-2015bAge at DiagnosisAges lt45 806 795 821 807 791 828 763 757 770Ages 45-54 381 365 403 379 373 389 257e - -Ages 55-64 280 275 284 294 288 298 173e 228e -Ages 65-74 239 188 291 214 170 259 - - -Ages 75+ 91 97 83 100 96 100 00 - -Ages lt65 733 725 743 735 724 749 668 668 668Ages 65+ 174 151 196 166 141 191 154e - 189e
Chronic Lymphocytic Leukemia5-Year Relative Survival (Percent)Year of Diagnosis1975-1977a 671 647 703 679 654 711 569e 551e 590e1987-1989a 727 727 729 739 740 737 581 555e 615e1990-1992a 741 718 773 753 731 784 522 434e 609e1993-1995a 772 771 773 783 781 786 633 640e 621e1996-1998a 756 739 778 767 752 787 581 515e 660e1999-2001a 786 782 792 794 788 803 666 655e 666e2002-2004a 840 832 852 845 837 856 770 742e 807e2005-2008a 862 861 863 864 863 864 841 857 8122009-2015a 882d 887d 875d 886d 889d 883d 785d 801d 763
5-Year Period Survival (Percent)bc2015 856 855 858 853 848 860 772 818 710
5-Year Relative Survival (Percent) 2009-2015bAge at DiagnosisAges lt45 940 927 960 942 932 954 905e 879e -Ages 45-54 939 934 948 945 935 964 840 889 761eAges 55-64 922 916 933 924 916 938 836 831 843Ages 65-74 874 856 905 876 853 913 773 784 756Ages 75+ 731 727 736 729 724 734 584 586e 564eAges lt65 928 922 939 931 923 947 843 854 824Ages 65+ 801 796 807 799 792 807 691 713 662
Table 1315Lymphocytic Leukemia
5-Year Relative and Period Survival (Percent) by Race Sex Diagnosis Year and Age
SEE
R C
ancer Statistics Review
1975-2016N
ational Cancer Institute
a SEER 9 areas (San Francisco Connecticut Detroit Hawaii Iowa New Mexico Seattle Utah Atlanta)Based on follow-up of patients into 2016 Expected survival rates are derived from the US Annual Life Tables
b SEER 18 areas (San Francisco Connecticut Detroit Hawaii Iowa New Mexico Seattle Utah Atlanta San Jose-MontereyLos Angeles Alaska Native Registry Rural Georgia California excluding SFSJMLA Kentucky Louisiana New Jersey andGeorgia excluding ATLRG) Expected survival rates are derived from life tables by socio-economic status geography and racedeveloped by the SEER programBased on follow-up of patients into 2016
c Period survival provides a 2015 estimate of survival by piecing together the most recent conditional survival estimatesfrom several cohorts It is computed here using three year calendar blocks (2010-2012 0-1 year survival)(2009-2011 1-2 year survival) (2008-2010 2-3 year survival) (2007-2009 3-4 year survival) (2006-2008 4-5 years survival)
d The difference between 1975-1977 and 2009-2015 is statistically significant (plt05)e The standard error is between 5 and 10 percentage pointsf The standard error is greater than 10 percentage points- Statistic could not be calculated due to fewer than 25 cases during the time period
All Races Whites Blacks Total Males Females Total Males Females Total Males Females
Acute Myeloid Leukemia5-Year Relative Survival (Percent)Year of Diagnosis1975-1977a 62 55 70 58 54 62 101 82 1171987-1989a 115 92 141 113 97 132 92 44 157e1990-1992a 138 126 152 135 122 150 135 129 1391993-1995a 161 149 174 153 141 167 215 206e 2201996-1998a 170 159 183 156 145 171 221 252 1821999-2001a 192 188 197 187 176 199 193 248 1422002-2004a 234 209 264 232 208 260 253 265 2402005-2008a 249 235 265 242 228 257 239 193 2772009-2015a 294d 291d 298d 290d 284d 299d 292d 280d 301d
5-Year Period Survival (Percent)bc2015 286 278 294 282 276 289 283 262 301
5-Year Relative Survival (Percent) 2009-2015bAge at DiagnosisAges lt45 604 585 624 621 599 645 511 482 538Ages 45-54 441 439 444 456 450 463 337 342 336Ages 55-64 300 281 325 308 285 338 231 234 224Ages 65-74 139 137 141 145 144 146 103 78 131Ages 75+ 34 40 27 34 41 27 24 - 20Ages lt65 466 444 491 474 449 504 393 371 414Ages 65+ 79 85 72 82 89 73 64 58 71
Chronic Myeloid Leukemia5-Year Relative Survival (Percent)Year of Diagnosis1975-1977a 218 193 251 205 184 234 277e 216e 355e1987-1989a 303 306 298 301 310 290 333e 281e 413e1990-1992a 307 296 322 303 300 306 349e 255e 449e1993-1995a 355 353 358 352 351 352 356e 328e 402e1996-1998a 371 377 363 380 376 385 310 304e 314e1999-2001a 473 459 492 459 441 483 490e 496e 481e2002-2004a 543 530 561 526 514 541 630e 621e 640e2005-2008a 631 632 629 617 615 621 643 664e 608e2009-2015a 697d 681d 718d 690d 677d 707d 736d 711d 763d
5-Year Period Survival (Percent)bc2015 695 683 712 681 666 702 723 714 735
5-Year Relative Survival (Percent) 2009-2015bAge at DiagnosisAges lt45 899 889 913 916 905 934 797 786 812Ages 45-54 874 860 891 871 858 888 871 842 900Ages 55-64 776 748 816 781 750 826 698 676e 719eAges 65-74 611 579 656 609 578 654 584e 526e 637eAges 75+ 326 305 346 321 302 336 362e 362f 362eAges lt65 851 836 873 856 839 883 790 773 808Ages 65+ 462 444 484 456 441 475 495 471e 515e
Table 1316Myeloid Leukemia
5-Year Relative and Period Survival (Percent) by Race Sex Diagnosis Year and Age
SEE
R C
ancer Statistics Review
1975-2016N
ational Cancer Institute
a Based on the SEER 9 areas (San Francisco Connecticut Detroit Hawaii Iowa New Mexico Seattle Utah and Atlanta)Expected survival rates are derived from the US Annual Life Tables
1975- 1980- 1985- 1990-1979 1984 1989 1994 1995 1996 1997 1998 1999 2000 2001 2002 2003 2004 2005 2006 2007 2008 2009 2010 2011 2012 2013 2014 2015
Survival Time
1-year 608 626 648 669 681 682 679 667 659 669 706 722 732 751 742 765 769 766 774 783 794 791 790 791 8062-year 501 525 553 575 589 599 598 580 583 590 630 649 662 677 684 705 706 702 709 725 732 725 732 7343-year 437 465 496 528 543 554 549 541 547 551 590 619 624 643 647 673 676 665 684 692 703 692 6984-year 388 417 455 491 507 519 509 503 516 520 567 596 595 619 627 647 653 639 658 676 683 6735-year 346 376 423 461 481 487 483 482 484 499 543 578 575 596 610 626 637 619 635 659 6656-year 314 351 399 435 457 465 458 461 462 485 524 560 556 572 593 607 622 604 613 6477-year 291 325 371 409 442 451 438 446 444 473 510 544 537 560 579 591 614 587 6018-year 270 304 350 388 417 438 432 431 430 457 496 535 519 546 561 573 603 5769-year 250 285 330 373 406 420 418 421 421 449 483 519 507 530 546 561 59310-year 237 269 316 360 390 406 406 410 406 438 471 504 489 515 532 54511-year 224 257 299 347 378 398 387 397 392 426 459 492 473 499 52712-year 212 246 288 336 371 387 377 390 383 419 449 483 460 49213-year 204 236 280 327 367 382 370 380 372 404 442 466 45414-year 198 229 272 318 356 371 368 370 367 392 434 45615-year 192 223 267 313 353 361 362 358 359 383 42316-year 185 214 261 306 350 359 361 350 353 37417-year 181 207 256 300 340 355 352 346 34718-year 177 201 253 294 330 351 346 34319-year 171 195 248 291 326 343 34420-year 166 191 244 286 319 338
Table 1317Leukemia
SEERa Relative Survival (Percent)By Year of Diagnosis
All Races Males and Females
Year of Diagnosis
SEE
R C
ancer Statistics Review
1975-2016N
ational Cancer Institute
a Based on the SEER 9 areas (San Francisco Connecticut Detroit Hawaii Iowa New Mexico Seattle Utah and Atlanta)Expected survival rates are derived from the US Annual Life Tables
1975- 1980- 1985- 1990-1979 1984 1989 1994 1995 1996 1997 1998 1999 2000 2001 2002 2003 2004 2005 2006 2007 2008 2009 2010 2011 2012 2013 2014 2015
Survival Time
1-year 604 628 655 679 692 697 688 667 668 688 729 731 742 767 761 770 780 775 791 793 806 797 803 812 8172-year 494 524 561 583 604 616 611 585 590 608 648 652 669 687 701 706 719 716 727 740 746 733 749 7513-year 427 460 499 532 556 573 552 546 552 573 608 624 627 653 664 674 689 679 699 712 719 698 7144-year 377 411 459 494 516 535 505 505 520 539 581 598 601 627 650 648 667 650 677 690 697 6775-year 334 371 429 462 482 495 479 484 480 523 553 573 578 602 630 626 653 632 656 673 6846-year 303 343 404 435 452 471 459 461 461 508 529 554 557 575 609 602 635 615 631 6617-year 277 318 373 409 439 458 438 444 439 498 514 531 535 564 594 588 625 595 6168-year 254 294 354 385 417 446 430 430 423 478 500 520 514 549 572 563 616 5839-year 232 275 332 371 404 423 421 419 415 464 486 507 501 526 553 548 60510-year 219 260 317 358 382 407 413 410 401 454 473 490 479 511 539 52611-year 205 249 302 346 377 398 391 393 383 444 461 474 464 496 53312-year 193 242 290 334 371 390 380 384 375 437 452 467 455 49113-year 186 234 283 325 367 389 373 369 363 420 442 455 44714-year 179 227 277 315 357 379 370 358 357 410 433 44715-year 175 221 269 309 352 371 365 349 351 399 42216-year 168 212 263 303 347 369 360 341 346 38717-year 164 204 260 296 339 366 348 335 34318-year 159 199 257 290 324 364 345 33119-year 154 192 253 288 322 355 34120-year 146 187 249 283 316 347
Table 1318Leukemia
SEERa Relative Survival (Percent)By Year of Diagnosis
All Races Males
Year of Diagnosis
SEE
R C
ancer Statistics Review
1975-2016N
ational Cancer Institute
a Based on the SEER 9 areas (San Francisco Connecticut Detroit Hawaii Iowa New Mexico Seattle Utah and Atlanta)Expected survival rates are derived from the US Annual Life Tables
1975- 1980- 1985- 1990-1979 1984 1989 1994 1995 1996 1997 1998 1999 2000 2001 2002 2003 2004 2005 2006 2007 2008 2009 2010 2011 2012 2013 2014 2015
Survival Time
1-year 613 623 638 655 665 664 666 667 646 643 675 710 719 729 715 759 755 754 751 769 778 782 772 761 7912-year 509 527 542 564 569 578 580 574 573 564 606 645 653 664 660 705 689 684 684 705 714 716 709 7093-year 450 471 492 523 525 529 544 534 539 522 564 612 619 628 624 673 657 647 663 666 681 685 6774-year 402 424 449 485 495 498 514 500 511 494 548 594 587 608 595 646 633 624 633 658 664 6685-year 361 384 414 459 480 475 489 479 489 466 530 584 570 588 582 627 615 601 607 641 6396-year 328 360 392 435 464 457 456 461 463 455 516 567 556 569 572 613 602 589 588 6297-year 309 334 367 410 447 443 438 448 450 438 504 561 539 556 558 594 598 575 5798-year 290 316 344 391 416 428 433 433 438 428 490 556 526 542 546 585 582 5639-year 273 299 326 376 409 416 413 424 429 428 477 535 515 534 535 576 57610-year 259 281 315 364 399 405 396 409 414 416 468 522 502 521 521 56811-year 247 269 295 347 378 398 383 403 403 401 456 515 486 503 51812-year 235 250 285 338 372 382 373 397 393 395 445 505 468 49313-year 228 239 276 329 365 373 366 392 385 383 442 481 46314-year 220 232 267 323 355 361 363 385 380 367 434 46815-year 214 225 264 318 353 348 359 369 368 363 42416-year 206 217 258 310 353 344 359 361 363 35817-year 201 210 252 305 342 340 357 358 35018-year 198 205 248 301 336 334 347 35819-year 193 198 241 296 330 326 34620-year 190 195 238 290 321 323
Table 1319Leukemia
SEERa Relative Survival (Percent)By Year of Diagnosis
All Races Females
Year of Diagnosis
SEE
R C
ancer Statistics Review
1975-2016N
ational Cancer Institute
Devcan 677 April 2019 National Cancer Institute (httpssurveillancecancergovdevcan)Source Incidence data are from the SEER 21 areas (San Francisco Connecticut Detroit Hawaii Iowa New Mexico Seattle Utah Atlanta
San Jose-Monterey Los Angeles Alaska Native Registry Rural Georgia California excluding SFSJMLA Kentucky Louisiana New JerseyGeorgia excluding ATLRG Idaho New York and Massachusetts) Mortality data are from the NCHS public use data file for the total US
a Underlying incidence and mortality data for American IndianAlaska Native are based on the PRCDA(PurchasedReferred Care DeliveryAreas) counties
b Hispanic is not mutually exclusive from whites blacks AsianPacific Islanders and American IndiansAlaska NativesUnderlying incidence data for Hispanics are based on NHIA and exclude cases from the Alaska Native Registry
- Statistic could not be calculatedA percent of 000 represents a value that is below 0005
Risk of Being Risk of Being
Race Current Diagnosed with Cancer Risk of Dying Race Current Diagnosed with Cancer Risk of Dying
Ethnicity Age +10 yrs +20 yrs +30 yrs Ever from Cancer Ethnicity Age +10 yrs +20 yrs +30 yrs Ever from Cancer
All Races 0 006 009 012 156 082 Asian 0 005 008 011 099 058
10 003 006 010 152 082 Pacific 10 003 006 009 095 058
20 003 007 014 149 082 Islander 20 003 006 010 092 058
30 004 011 026 147 082 30 003 008 016 090 057
40 007 022 051 145 082 40 004 012 026 087 057
50 015 045 089 141 082 50 008 022 047 083 056
60 031 079 121 134 082 60 014 040 066 078 054
70 053 101 - 115 080 70 028 055 - 067 051
80 062 - - 082 068 80 032 - - 047 040
White 0 006 010 013 164 085 American 0 005 007 009 085 040
10 003 007 011 159 086 Indian 10 002 004 008 081 040
20 003 007 014 156 085 Alaska 20 002 006 010 079 039
30 004 011 027 155 085 Nativea 30 004 008 019 078 039
40 007 023 053 153 085 40 004 015 030 076 040
50 016 047 095 149 086 50 012 027 051 075 040
60 033 083 127 141 086 60 017 042 061 068 040
70 057 106 - 121 084 70 029 051 - 058 038
80 066 - - 086 071 80 029 - - 038 025
Black 0 003 006 008 107 058 Hispanicb 0 007 011 015 124 066
10 002 005 009 105 059 10 005 008 012 118 066
20 003 006 013 104 059 20 004 008 014 114 065
30 004 011 022 102 058 30 004 010 021 111 064
40 007 019 041 100 058 40 006 017 037 108 064
50 013 035 066 097 058 50 011 031 063 104 063
60 025 058 083 091 058 60 021 054 085 097 062
70 039 069 - 079 057 70 037 070 - 083 058
80 042 - - 056 048 80 042 - - 058 049
Table 1320
Leukemia
Risk of Being Diagnosed With Cancer in 10 20 and 30 Years
Lifetime Risk of Being Diagnosed with Cancer Given Alive and Cancer-Free at Current Age and
Lifetime Risk of Dying from Cancer Given Alive at Current Age
Both Sexes 2014-2016 By RaceEthnicity
SEE
R C
ancer Statistics Review
1975-2016N
ational Cancer Institute
Devcan 677 April 2019 National Cancer Institute (httpssurveillancecancergovdevcan)Source Incidence data are from the SEER 21 areas (San Francisco Connecticut Detroit Hawaii Iowa New Mexico Seattle Utah Atlanta
San Jose-Monterey Los Angeles Alaska Native Registry Rural Georgia California excluding SFSJMLA Kentucky Louisiana New JerseyGeorgia excluding ATLRG Idaho New York and Massachusetts) Mortality data are from the NCHS public use data file for the total US
a Underlying incidence and mortality data for American IndianAlaska Native are based on the PRCDA(PurchasedReferred Care DeliveryAreas) counties
b Hispanic is not mutually exclusive from whites blacks AsianPacific Islanders and American IndiansAlaska NativesUnderlying incidence data for Hispanics are based on NHIA and exclude cases from the Alaska Native Registry
- Statistic could not be calculatedA percent of 000 represents a value that is below 0005
Risk of Being Risk of Being
Race Current Diagnosed with Cancer Risk of Dying Race Current Diagnosed with Cancer Risk of Dying
Ethnicity Age +10 yrs +20 yrs +30 yrs Ever from Cancer Ethnicity Age +10 yrs +20 yrs +30 yrs Ever from Cancer
All Races 0 006 010 013 186 096 Asian 0 005 009 011 119 072
10 004 007 012 182 097 Pacific 10 004 007 010 115 072
20 003 008 016 179 097 Islander 20 003 007 012 111 071
30 005 013 030 177 097 30 004 009 019 109 071
40 008 026 062 176 098 40 005 015 033 106 070
50 018 056 112 173 099 50 010 028 062 102 069
60 040 101 152 166 101 60 019 054 084 096 068
70 071 129 - 146 101 70 038 071 - 084 065
80 082 - - 105 088 80 040 - - 056 052
White 0 007 011 014 195 101 American 0 006 009 011 110 048
10 004 008 012 190 102 Indian 10 003 005 010 105 048
20 004 008 016 187 101 Alaska 20 002 007 011 103 048
30 005 013 031 186 101 Nativea 30 005 009 021 103 048
40 009 027 065 184 102 40 005 017 041 102 049
50 019 058 118 181 103 50 013 039 075 102 051
60 042 107 160 174 106 60 028 067 087 097 051
70 075 136 - 153 105 70 046 070 - 081 049
80 087 - - 110 091 80 034 - - 049 030
Black 0 003 006 008 122 065 Hispanicb 0 007 013 017 141 080
10 003 006 009 122 066 10 005 010 015 135 080
20 003 006 014 120 065 20 005 009 016 130 079
30 004 011 025 119 066 30 005 011 023 127 078
40 008 022 048 118 066 40 007 018 040 124 078
50 015 042 079 115 067 50 012 034 072 120 078
60 031 071 102 112 068 60 024 064 100 114 078
70 051 089 - 101 068 70 046 086 - 102 077
80 058 - - 077 061 80 053 - - 074 070
Table 1321
Leukemia
Risk of Being Diagnosed With Cancer in 10 20 and 30 Years
Lifetime Risk of Being Diagnosed with Cancer Given Alive and Cancer-Free at Current Age and
Lifetime Risk of Dying from Cancer Given Alive at Current Age
Males 2014-2016 By RaceEthnicity
SEE
R C
ancer Statistics Review
1975-2016N
ational Cancer Institute
Devcan 677 April 2019 National Cancer Institute (httpssurveillancecancergovdevcan)Source Incidence data are from the SEER 21 areas (San Francisco Connecticut Detroit Hawaii Iowa New Mexico Seattle Utah Atlanta
San Jose-Monterey Los Angeles Alaska Native Registry Rural Georgia California excluding SFSJMLA Kentucky Louisiana New JerseyGeorgia excluding ATLRG Idaho New York and Massachusetts) Mortality data are from the NCHS public use data file for the total US
a Underlying incidence and mortality data for American IndianAlaska Native are based on the PRCDA(PurchasedReferred Care DeliveryAreas) counties
b Hispanic is not mutually exclusive from whites blacks AsianPacific Islanders and American IndiansAlaska NativesUnderlying incidence data for Hispanics are based on NHIA and exclude cases from the Alaska Native Registry
- Statistic could not be calculatedA percent of 000 represents a value that is below 0005
Risk of Being Risk of Being
Race Current Diagnosed with Cancer Risk of Dying Race Current Diagnosed with Cancer Risk of Dying
Ethnicity Age +10 yrs +20 yrs +30 yrs Ever from Cancer Ethnicity Age +10 yrs +20 yrs +30 yrs Ever from Cancer
All Races 0 006 008 011 129 068 Asian 0 005 008 010 083 048
10 003 005 009 125 069 Pacific 10 003 005 008 078 047
20 003 006 012 122 068 Islander 20 002 005 009 075 047
30 003 009 021 120 068 30 003 006 013 073 046
40 006 018 039 118 068 40 004 010 021 071 046
50 012 034 068 114 067 50 007 017 035 068 045
60 023 059 093 106 067 60 011 029 051 063 044
70 039 077 - 091 064 70 019 042 - 054 040
80 048 - - 066 055 80 026 - - 040 033
White 0 006 009 011 135 071 American 0 003 005 007 061 031
10 003 005 009 131 071 Indian 10 002 003 007 058 031
20 003 006 012 128 071 Alaska 20 002 005 008 056 031
30 003 010 022 126 071 Nativea 30 004 007 017 055 031
40 006 019 042 124 070 40 003 014 020 053 031
50 013 036 072 120 070 50 011 017 030 051 031
60 024 062 099 112 069 60 007 021 038 042 030
70 042 081 - 096 067 70 015 035 - 039 029
80 051 - - 069 057 80 025 - - 030 022
Black 0 004 006 008 095 053 Hispanicb 0 006 010 013 110 056
10 002 004 008 093 054 10 004 007 010 105 056
20 002 006 012 091 053 20 003 006 012 101 055
30 004 010 020 089 053 30 003 009 019 099 054
40 006 016 035 087 053 40 006 016 034 096 054
50 011 029 054 083 052 50 010 028 055 091 052
60 020 047 069 077 051 60 019 046 073 084 050
70 030 055 - 065 049 70 030 059 - 070 046
80 033 - - 046 042 80 035 - - 048 037
Table 1322
Leukemia
Risk of Being Diagnosed With Cancer in 10 20 and 30 Years
Lifetime Risk of Being Diagnosed with Cancer Given Alive and Cancer-Free at Current Age and
Lifetime Risk of Dying from Cancer Given Alive at Current Age
Females 2014-2016 By RaceEthnicity
SEER Cancer Statistics Review 1975-2016 National Cancer Institute
The AAPC is the Average Annual Percent Change over the time interval The AAPCs are calculated bythe Joinpoint Regression Program Version 47 February 2019 National Cancer Institute
- Statistic not shown Rate based on less than 16 cases for the time intervalTrend based on less than 10 cases for at least one year within the time interval
a Rates are age-adjusted to the 2000 US Std Population (19 age groups - Census P25-1130) Trendsare based on rates age-adjusted to the 2000 US Std Population (19 age groups - Census P25-1130)
b The SEER 9 areas are San Francisco Connecticut Detroit Hawaii Iowa New Mexico SeattleUtah and AtlantaThe SEER 21 areas comprise the SEER 9 areas plus San Jose-Monterey Los Angeles the AlaskaNative Registry Rural Georgia California excluding SFSJMLA Kentucky Louisiana New JerseyGeorgia excluding ATLRG Idaho New York and Massachusetts
c The 2007-2016 AAPC estimates are based on a Joinpoint analysis with up to 3 Joinpoints overdiagnosis years 2000-2016
d The 2007-2016 AAPC estimates are based on a Joinpoint analysis with up to 5 Joinpoints overdiagnosis years 1975-2016
e Hispanic and Non-Hispanic are not mutually exclusive from whites blacks AsianPacificIslanders and American IndiansAlaska Natives Incidence data for Hispanics and Non-Hispanicsare based on NHIA and exclude cases from the Alaska Native Registry
f Incidence data for American IndianAlaska Native are based on the PurchasedReferred CareDelivery Area (PRCDA) counties
g US Mortality Files National Center for Health Statistics CDCh The 2007-2016 mortality AAPCs are based on a Joinpoint analysis using years of death 2000-2016 The APC is significantly different from zero (plt05)
SEER Incidence SEER 21 Areasb SEER 21 Areasb SEER 9 Areasb
Rate 2012-2016 Trend 2007-2016c Trend 2007-2016d
Rate per 100000 persons AAPC () AAPC ()
Total Males Females Total Males Females Total Males Females RaceEthnicity
All Races 141 181 109 -04 -02 -06 -03 02 03
White 149 191 115 -05 -05 -07 04 03 05White Hispanice 112 134 94 01 -02 03 - - -White Non-Hispanice 153 197 116 -05 -05 -08 - - -
Black 109 139 89 06 02 07 01 01 02
AsianPacific Islander 78 97 63 01 00 02 - - -
Amer IndAlaska Natf 86 110 66 08 21 -01 - - -
Hispanice 108 130 91 02 00 03 - - -
US Mortalityg Rate 2012-2016 Trend 2007-2016h
Rate per 100000 persons AAPC ()
Total Males Females Total Males FemalesRaceEthnicity
All Races 65 88 49 -16 -17 -13
White 68 91 51 -14 -16 -12White Hispanice 50 63 41 -07 -08 -06White Non-Hispanice 69 93 51 -14 -15 -12
Black 55 72 44 -15 -17 -15
AsianPacific Islander 36 47 28 -18 -07 -23
Amer IndAlaska NatTotal US 31 42 23 -22 -09 -36PRCDA Counties 41 54 30 -16 -05 -28Non-PRCDA Counties 20 28 15 -31 -13 -50
Hispanice 47 60 38 -08 -09 -07
Table 1323Leukemia
SEER Incidence and US MortalityAge-Adjusted Rates and Trendsa
By RaceEthnicity and Sex
SEE
R C
ancer Statistics Review
1975-2016N
ational Cancer Institute
a Rates are per 100000 and are age-adjusted to the 2000 US Std Population (19 age groups - Census P25-1130)b The SEER 9 areas are San Francisco Connecticut Detroit Hawaii Iowa New Mexico Seattle Utah and Atlanta
The SEER 13 areas comprise the SEER 9 areas plus San Jose-Monterey Los Angeles the Alaska Native Registry and Rural GeorgiaThe SEER 18 areas comprise the SEER 13 areas plus California excluding SFSJMLA Kentucky Louisiana New Jersey and Georgiaexcluding ATLRGThe SEER 21 areas comprise the SEER 18 areas plus Idaho New York and Massachusetts
- Statistic not shown Rate based on less than 16 cases for the time interval
All Races Whites Blacks Total Males Females Total Males Females Total Males Females
SEER Incidence Ratesa 2012-2016
California 1239 1590 949 1337 1715 1020 1039 1334 813Greater Bay Area 1231 1619 915 1400 1844 1028 1098 1406 859San Francisco-Oakland 1212 1596 906 1389 1823 1034 1077 1336 881San Jose-Monterey 1259 1651 925 1410 1869 1011 1239 1787 -
Los Angeles 1173 1469 933 1291 1622 1016 1050 1294 884Greater California 1271 1633 968 1334 1709 1017 1007 1338 729
Connecticut 1406 1768 1117 1431 1790 1142 976 1126 867Detroit 1584 2050 1230 1707 2222 1300 1204 1485 1018Georgia 1430 1841 1120 1537 1970 1189 1139 1487 935Atlanta 1382 1819 1064 1563 2017 1207 1138 1557 884Rural Georgia 1411 1586 1206 1510 1773 1196 1248 - 1236Greater Georgia 1455 1863 1144 1531 1965 1182 1140 1450 968
Hawaii 1073 1339 843 1388 1612 1139 - - -Idaho 1588 1950 1263 1604 1973 1272 - - -Iowa 1627 2127 1222 1630 2133 1221 1416 1743 1076Kentucky 1566 1983 1234 1577 1995 1241 1159 1446 922Louisiana 1405 1789 1104 1518 1918 1197 1103 1393 890Massachusetts 1108 1429 854 1118 1448 856 787 1050 620New Jersey 1524 1962 1188 1541 1982 1199 1136 1469 928New Mexico 1299 1550 1086 1310 1556 1101 1045 - -New York 1623 2119 1244 1752 2281 1335 1068 1360 887Seattle-Puget Sound 1568 2020 1188 1634 2084 1249 1486 1929 1077Utah 1375 1793 1009 1401 1825 1029 - - -
SEER 9 Areasb 1419 1823 1094 1521 1945 1171 1154 1460 941SEER 13 Areasb 1357 1737 1049 1473 1882 1134 1126 1419 922SEER 18 Areasb 1376 1761 1066 1461 1867 1127 1114 1414 907SEER 21 Areasb 1407 1807 1088 1491 1912 1147 1089 1386 889
Table 1324Leukemia
Age-Adjusted SEER Incidence Ratesa
By Registry Race and Sex
SEE
R C
ancer Statistics Review
1975-2016N
ational Cancer Institute
a US Mortality Files National Center for Health Statistics Centers for Disease Control and PreventionRates are per 100000 and are age-adjusted to the 2000 US Std Population (19 age groups - Census P25-1130)
b The SEER 9 areas are San Francisco Connecticut Detroit Hawaii Iowa New Mexico Seattle Utah and AtlantaThe SEER 13 areas comprise the SEER 9 areas plus San Jose-Monterey Los Angeles the Alaska Native Registry and Rural GeorgiaThe SEER 18 areas comprise the SEER 13 areas plus California excluding SFSJMLA Kentucky Louisiana New Jersey and Georgiaexcluding ATLRGThe SEER 21 areas comprise the SEER 18 areas plus Idaho New York and Massachusetts
- Statistic not shown Rate based on less than 16 cases for the time interval
All Races Whites Blacks Total Males Females Total Males Females Total Males Females
SEER Death Ratesa 2012-2016
California 617 811 470 671 885 507 560 711 461Greater Bay Area 563 759 419 640 869 470 551 742 424San Francisco-Oakland 551 753 405 631 871 455 544 726 421San Jose-Monterey 584 768 446 653 863 495 604 - -
Los Angeles 608 797 468 675 894 513 571 717 483Greater California 639 835 489 677 886 515 553 687 458
Connecticut 622 837 465 639 862 474 536 665 449Detroit 662 915 485 691 967 494 573 723 475Georgia 614 817 467 642 855 478 538 706 438Atlanta 568 757 437 615 802 483 487 658 374Rural Georgia 581 628 538 579 635 - - - -Greater Georgia 639 851 482 654 879 477 576 745 483
Hawaii 463 593 362 543 632 440 - - -Idaho 655 846 497 661 865 492 - - -Iowa 693 961 498 700 963 508 - - -Kentucky 742 949 592 750 953 603 633 894 455Louisiana 677 906 514 705 953 520 603 776 498Massachusetts 622 830 478 647 869 490 463 524 444New Jersey 615 810 478 657 871 504 474 549 429New Mexico 560 759 400 589 794 421 - - -New York 621 842 466 675 910 506 450 602 356Seattle-Puget Sound 618 795 481 637 807 503 708 975 499Utah 679 865 526 693 876 542 - - -
SEER 9 Areasb 610 818 457 651 869 487 540 711 427SEER 13 Areasb 609 810 460 658 874 494 544 708 437SEER 18 Areasb 630 832 480 671 887 508 552 705 455SEER 21 Areasb 628 834 477 670 889 506 520 670 426
Total US 654 876 489 681 912 506 550 721 439
Table 1325Leukemia
Age-Adjusted SEER Death Ratesa
By Registry Race and Sex
SEER Cancer Statistics Review 1975-2016 National Cancer Institute
a US Mortality Files National Center for Health Statistics Centers for Disease Control andPrevention Rates are per 100000 and are age-adjusted to the 2000 US Std Population (19age groups - Census P25-1130)
b Difference between state rate and total US rate is statistically significant (plt=0002)c Absolute percent difference between state rate and total US rate is 15 or mored Rank of state level death rate and the 95 confidence intervals (low high) for the rankSE Standard error of the ratePD Percent difference between state rate and total US rate- Statistic not shown Rate based on less than 16 cases for the time interval
State Rate SE Rank(CI)d PD TOTAL US 654 002
High Five StatesOklahoma 790 019 01(0108) 2083c
West Virginia 749 025 02(0123) 1449South Dakota 747 040 03(0133) 1415Kentucky 742 018 04(0116) 1352Kansas 742 022 05(0122) 1350
Low Five StatesColorado 609 016 47(2649) -692Alaska 596 050 48(0451) -885New Mexico 560 022 49(3650) -1430DC 504 041 50(3251) -2293c
Hawaii 463 024 51(4951) -2913c
State Rate SE Rank(CI)d PD State Rate SE Rank(CI)d PD
Alabama 689 016 17(0532) 533 Montana 613 032 45(0950) -634Alaska 596 050 48(0451) -885 Nebraska 718 026 10(0131) 983Arizona 632 013 36(2248) -329 Nevada 644 021 28(1148) -157Arkansas 719 021 09(0127) 993 New Hampshire 638 029 31(0749) -238California 617 006 42(3248) -572 New Jersey 615 011 43(2849) -592Colorado 609 016 47(2649) -692 New Mexico 560 022 49(3650) -1430Connecticut 622 017 40(2249) -490 New York 621 007 41(2948) -499Delaware 664 035 24(0249) 152 North Carolina 634 011 34(2347) -310DC 504 041 50(3251) -2293c North Dakota 656 040 26(0249) 029Florida 630 007 38(2645) -370 Ohio 694 010 13(0626) 608Georgia 614 012 44(2849) -604 Oklahoma 790 019 01(0108) 2083c
Hawaii 463 024 51(4951) -2913c Oregon 632 017 37(1948) -331Idaho 655 028 27(0548) 012 Pennsylvania 680 009 21(1029) 396Illinois 684 010 19(0928) 463 Rhode Island 656 033 25(0349) 037Indiana 719 014 08(0222) 994 South Carolina 682 016 20(0634) 435Iowa 693 019 14(0334) 604 South Dakota 747 040 03(0133) 1415Kansas 742 022 05(0122) 1350 Tennessee 702 014 12(0327) 729Kentucky 742 018 04(0116) 1352 Texas 640 007 30(2342) -215Louisiana 677 017 23(0637) 356 Utah 679 024 22(0346) 387Maine 638 027 32(0949) -240 Vermont 636 041 33(0350) -277Maryland 633 014 35(2148) -323 Virginia 611 012 46(2849) -661Massachusetts 622 013 39(2548) -482 Washington 640 013 29(2047) -209Michigan 685 011 18(0829) 476 West Virginia 749 025 02(0123) 1449Minnesota 691 015 16(0430) 564 Wisconsin 727 015 06(0219) 1110Mississippi 692 021 15(0337) 580 Wyoming 721 049 07(0148) 1028Missouri 711 014 11(0324) 874
Table 1326Leukemia
Age-Adjusted Cancer Deatha Rates By State All Races 2012-2016
Males and Females
SEER Cancer Statistics Review 1975-2016 National Cancer Institute
a US Mortality Files National Center for Health Statistics Centers for Disease Control andPrevention Rates are per 100000 and are age-adjusted to the 2000 US Std Population (19age groups - Census P25-1130)
b Difference between state rate and total US rate is statistically significant (plt=0002)c Absolute percent difference between state rate and total US rate is 15 or mored Rank of state level death rate and the 95 confidence intervals (low high) for the rankSE Standard error of the ratePD Percent difference between state rate and total US rate- Statistic not shown Rate based on less than 16 cases for the time interval
State Rate SE Rank(CI)d PD TOTAL US 876 003
High Five StatesOklahoma 1022 034 01(0120) 1669c
Kansas 1018 039 02(0123) 1625c
Arkansas 991 037 03(0127) 1309South Dakota 985 068 04(0147) 1249Delaware 984 065 05(0144) 1236
Low Five StatesMontana 795 053 47(1150) -921New Mexico 759 039 48(2650) -1336Alaska 711 081 49(0851) -1887c
DC 704 078 50(1051) -1959c
Hawaii 593 040 51(4951) -3228c
State Rate SE Rank(CI)d PD State Rate SE Rank(CI)d PD
Alabama 939 029 17(0233) 725 Montana 795 053 47(1150) -921Alaska 711 081 49(0851) -1887c Nebraska 958 046 12(0141) 935Arizona 827 022 41(2449) -555 Nevada 858 037 33(0849) -210Arkansas 991 037 03(0127) 1309 New Hampshire 884 051 25(0149) 088California 811 010 43(3348) -738 New Jersey 810 020 44(2749) -747Colorado 834 028 39(2049) -484 New Mexico 759 039 48(2650) -1336Connecticut 837 031 37(1549) -441 New York 842 013 35(2546) -387Delaware 984 065 05(0144) 1236 North Carolina 863 020 31(1945) -149DC 704 078 50(1051) -1959c North Dakota 873 070 27(0150) -030Florida 839 012 36(2645) -422 Ohio 931 018 19(0529) 627Georgia 817 021 42(2649) -677 Oklahoma 1022 034 01(0120) 1669c
Hawaii 593 040 51(4951) -3228c Oregon 866 029 29(1147) -112Idaho 846 047 34(0550) -339 Pennsylvania 912 016 21(0931) 416Illinois 928 018 20(0529) 594 Rhode Island 911 059 22(0149) 400Indiana 960 025 11(0127) 959 South Carolina 951 029 13(0131) 853Iowa 961 035 08(0131) 969 South Dakota 985 068 04(0147) 1249Kansas 1018 039 02(0123) 1625c Tennessee 960 025 10(0127) 959Kentucky 949 031 15(0133) 832 Texas 870 013 28(2139) -069Louisiana 906 030 23(0442) 342 Utah 865 041 30(0549) -122Maine 803 046 46(1450) -836 Vermont 874 074 26(0150) -026Maryland 861 026 32(1447) -176 Virginia 809 021 45(2650) -770Massachusetts 830 023 40(2349) -529 Washington 835 023 38(2248) -463Michigan 937 020 18(0428) 702 West Virginia 972 044 06(0135) 1095Minnesota 948 027 16(0229) 826 Wisconsin 960 026 09(0127) 961Mississippi 970 039 07(0132) 1077 Wyoming 885 081 24(0150) 102Missouri 951 025 14(0228) 852
Table 1327Leukemia
Age-Adjusted Cancer Deatha Rates By State All Races 2012-2016
Males
SEER Cancer Statistics Review 1975-2016 National Cancer Institute
a US Mortality Files National Center for Health Statistics Centers for Disease Control andPrevention Rates are per 100000 and are age-adjusted to the 2000 US Std Population (19age groups - Census P25-1130)
b Difference between state rate and total US rate is statistically significant (plt=0002)c Absolute percent difference between state rate and total US rate is 15 or mored Rank of state level death rate and the 95 confidence intervals (low high) for the rankSE Standard error of the ratePD Percent difference between state rate and total US rate- Statistic not shown Rate based on less than 16 cases for the time interval
State Rate SE Rank(CI)d PD TOTAL US 489 002
High Five StatesOklahoma 615 023 01(0108) 2584c
Wyoming 596 060 02(0147) 2194c
Kentucky 592 021 03(0111) 2126c
West Virginia 576 030 04(0126) 1792c
South Dakota 564 047 05(0145) 1551c
Low Five StatesColorado 441 018 47(2250) -972Delaware 428 037 48(0751) -1247New Mexico 400 025 49(3151) -1803c
DC 381 046 50(1251) -2203c
Hawaii 362 029 51(4151) -2598c
State Rate SE Rank(CI)d PD State Rate SE Rank(CI)d PD
Alabama 512 019 18(0440) 483 Montana 452 037 43(0551) -745Alaska 485 062 27(0151) -073 Nebraska 531 030 10(0144) 864Arizona 473 015 31(1347) -308 Nevada 455 025 42(1150) -695Arkansas 516 024 15(0344) 554 New Hampshire 449 033 45(0651) -807California 470 007 34(2345) -383 New Jersey 478 013 30(1346) -223Colorado 441 018 47(2250) -972 New Mexico 400 025 49(3151) -1803c
Connecticut 465 020 40(1249) -487 New York 466 009 38(2246) -456Delaware 428 037 48(0751) -1247 North Carolina 471 012 32(1747) -350DC 381 046 50(1251) -2203c North Dakota 479 046 28(0151) -189Florida 460 008 41(2647) -582 Ohio 520 012 12(0529) 653Georgia 467 013 37(1747) -433 Oklahoma 615 023 01(0108) 2584c
Hawaii 362 029 51(4151) -2598c Oregon 449 019 44(1850) -799Idaho 497 033 22(0249) 174 Pennsylvania 516 011 14(0629) 556Illinois 514 011 16(0631) 526 Rhode Island 471 037 33(0351) -363Indiana 540 017 07(0226) 1052 South Carolina 495 018 23(0645) 133Iowa 498 022 20(0547) 200 South Dakota 564 047 05(0145) 1551c
Kansas 539 025 08(0137) 1032 Tennessee 517 016 13(0435) 590Kentucky 592 021 03(0111) 2126c Texas 467 008 36(2246) -431Louisiana 514 020 17(0442) 520 Utah 526 029 11(0146) 778Maine 508 032 19(0248) 403 Vermont 444 045 46(0351) -906Maryland 470 016 35(1448) -389 Virginia 465 014 39(1848) -474Massachusetts 478 015 29(1247) -220 Washington 487 016 25(0946) -022Michigan 498 013 21(0939) 192 West Virginia 576 030 04(0126) 1792c
Minnesota 494 017 24(0745) 121 Wisconsin 545 017 06(0225) 1162Mississippi 485 023 26(0548) -067 Wyoming 596 060 02(0147) 2194c
Missouri 535 017 09(0327) 953
Table 1328Leukemia
Age-Adjusted Cancer Deatha Rates By State All Races 2012-2016
Females
SEE
R C
ancer Statistics Review
1975-2016N
ational Cancer Institute
a US 2016 cancer prevalence counts are based on 2016 cancer prevalence proportions from the SEER 13 Areas (excluding the AlaskaNative Registry) and 112016 US population estimates based on the average of 2015 and 2016 population estimates from theUS Bureau of the CensusPrevalence was calculated using the first invasive tumor for each cancer site diagnosed during the previous 24 years
b Maximum limited-duration prevalence is 24 years for 1992-2016 datac Percentages are age-adjusted to the 2000 US Standard Population (19 age groups - Census P25-1130) by 5-year age groupsd Cases diagnosed more than 24 years ago were estimated using the completeness index method (Capocaccia et al 1997
Merrill et al 2000)e Complete prevalence is obtained by summing 0 to lt24 and gt=24- Statistic not shown Statistic based on fewer than 5 cases estimated alive in SEER for the time interval+ Not available
Years Since Diagnosis 0 to lt5 5 to lt10 10 to lt15 15 to lt20 20 to lt24 0 to lt24b gt=24d Completee
Race Sex All Races Both Sexes 153253 100309 63581 38012 21353 376508 38265 414773
Males 90192 57683 36029 21220 12020 217145 18411 235556Females 63061 42625 27552 16792 9333 159363 19854 179217
White Both Sexes 132173 87961 56051 33596 19035 328814 32999 370135Males 78368 50894 32033 18770 10845 190910 15102 210930Females 53805 37067 24018 14826 8190 137905 17897 159205
Black Both Sexes 12734 6564 4233 2487 1259 27277 4070 31347Males 6847 3556 2204 1334 637 14578 1776 16354Females 5887 3008 2029 1153 622 12699 2294 14992
Asian Both Sexes 3926 2561 1778 1164 690 10120 + +Pacific Males 2235 1462 936 646 351 5630 + +Islander Females 1691 1100 842 519 339 4490 + +
Hispanic Both Sexes 14464 9581 6796 4462 2630 37933 + +Males 8166 5374 3794 2408 1538 21280 + +Females 6298 4207 3002 2055 1092 16654 + +
Age Specific (Crude) Age-Adjustedc Age at Prevalence All Ages 0-9 10-19 20-29 30-39 40-49 50-59 60-69 70-79 80+ All Ages
Race Sex All Races Both Sexes 01168 00328 00640 00628 00377 00561 01053 02263 04023 05111 01054
Males 01369 00339 00706 00685 00419 00657 01287 02888 05282 07048 01306Females 00974 00317 00572 00570 00333 00466 00829 01696 02974 03919 00844
White Both Sexes 01304 00369 00715 00712 00410 00584 01106 02389 04249 05386 01127Males 01528 00379 00789 00771 00457 00682 01349 03042 05558 07387 01389Females 01084 00359 00637 00650 00362 00484 00869 01784 03135 04133 00904
Black Both Sexes 00605 00145 00322 00320 00267 00463 00752 01455 02470 03076 00660Males 00674 00142 00357 00338 00281 00530 00919 01737 03249 04580 00816Females 00541 00148 00286 00301 00255 00402 00605 01230 01927 02334 00552
Asian Both Sexes 00497 00264 00531 00426 00230 00390 00553 00882 01245 01389 00513Pacific Males 00577 00298 00555 00507 00249 00461 00665 01122 01552 01904 00613Islander Females 00423 00228 00507 00345 00212 00327 00456 00688 00999 01057 00430
Hispanic Both Sexes 00664 00375 00737 00728 00395 00485 00723 01191 01987 02074 00746Males 00737 00397 00827 00807 00471 00576 00831 01350 02221 02551 00854Females 00589 00352 00642 00641 00312 00391 00617 01050 01809 01780 00647
Table 1329Leukemia
Estimated United States Cancer Prevalence Countsa on January 1 2016By RaceEthnicity Sex and Years Since Diagnosis
Estimated prevalence percenta on January 1 2016 of the SEER population diagnosed in the previous 24 yearsBy Age at Prevalence RaceEthnicity and Sex
SEE
R C
ancer Statistics Review
1975-2016N
ational Cancer Institute
a US 2016 cancer prevalence counts are based on 2016 cancer prevalence proportions from the SEER 13 Areas (excluding the AlaskaNative Registry) and 112016 US population estimates based on the average of 2015 and 2016 population estimates from theUS Bureau of the CensusPrevalence was calculated using the first invasive tumor for each cancer site diagnosed during the previous 24 years
b Maximum limited-duration prevalence is 24 years for 1992-2016 datac Percentages are age-adjusted to the 2000 US Standard Population (19 age groups - Census P25-1130) by 5-year age groupsd Cases diagnosed more than 24 years ago were estimated using the completeness index method (Capocaccia et al 1997
Merrill et al 2000)e Complete prevalence is obtained by summing 0 to lt24 and gt=24- Statistic not shown Statistic based on fewer than 5 cases estimated alive in SEER for the time interval+ Not available
Years Since Diagnosis 0 to lt5 5 to lt10 10 to lt15 15 to lt20 20 to lt24 0 to lt24b gt=24d Completee
Race Sex All Races Both Sexes 20277 16033 13721 12074 8203 70308 25456 95764
Males 11203 9049 7751 6542 4634 39179 12997 52176Females 9074 6984 5971 5531 3568 31129 12460 43589
White Both Sexes 17123 13855 11870 10663 7154 60665 21823 83282Males 9549 7741 6768 5696 4084 33839 11286 45559Females 7573 6114 5102 4967 3070 26826 10537 37723
Black Both Sexes 1590 1133 923 727 553 4926 1609 6535Males 809 734 473 411 290 2716 592 3308Females 781 399 450 317 263 2210 1017 3227
Asian Both Sexes 998 720 669 486 361 3234 + +Pacific Males 527 406 369 313 178 1793 + +Islander Females 472 314 300 173 183 1441 + +
Hispanic Both Sexes 5905 4543 3352 2717 1749 18266 + +Males 3302 2686 1899 1465 1058 10409 + +Females 2603 1857 1454 1252 692 7857 + +
Age Specific (Crude) Age-Adjustedc Age at Prevalence All Ages 0-9 10-19 20-29 30-39 40-49 50-59 60-69 70-79 80+ All Ages
Race Sex All Races Both Sexes 00218 00276 00541 00467 00139 00078 00059 00065 00053 00033 00228
Males 00247 00286 00591 00520 00163 00095 00066 00069 00056 00035 00251Females 00190 00266 00488 00410 00115 00062 00053 00062 00050 00032 00204
White Both Sexes 00241 00315 00612 00542 00161 00086 00063 00070 00056 00033 00259Males 00271 00323 00670 00598 00186 00107 00069 00074 00060 00032 00284Females 00211 00306 00551 00482 00135 00064 00057 00066 00053 00033 00232
Black Both Sexes 00109 00107 00250 00197 00067 00042 00039 00029 00012 00027 00102Males 00126 00112 00281 00224 00079 00035 00052 00026 00012 00027 00112Females 00094 00102 00219 00171 00056 00047 00028 00032 00013 00027 00092
Asian Both Sexes 00159 00208 00418 00289 00071 00064 00045 00050 00054 00036 00163Pacific Males 00184 00226 00427 00360 00086 00069 00055 00054 00033 00055 00180Islander Females 00136 00190 00408 00219 00058 00059 00036 00047 00071 00023 00146
Hispanic Both Sexes 00320 00328 00637 00574 00165 00107 00093 00100 00084 00012 00279Males 00361 00342 00710 00648 00205 00131 00110 00063 00072 - 00309Females 00278 00312 00562 00494 00122 00082 00077 00133 00093 00020 00246
Table 1330Acute Lymphocytic Leukemia
Estimated United States Cancer Prevalence Countsa on January 1 2016By RaceEthnicity Sex and Years Since Diagnosis
Estimated prevalence percenta on January 1 2016 of the SEER population diagnosed in the previous 24 yearsBy Age at Prevalence RaceEthnicity and Sex
0
5
10
15
20
25
1975 1985 1995 2005 20160
5
10
15
20
25
1975 1985 1995 2005 20160
3
6
9
12
15
1975 1985 1995 2005 20160
3
6
9
12
15
1975 1985 1995 2005 2016
Delay-Adj IncidenceDelay-Adj Incidence
Observed IncidenceObserved Incidence
MortalityMortality
SEER Observed Incidence SEER Delay Adjusted Incidence and US Death RatesLeukemia by Race and Sex
a
Figure 131
Source SEER 9 areas and US Mortality Files (National Center for Health Statistics CDC)Rates are age-adjusted to the 2000 US Std Population (19 age groups - Census P25-1103)Regression lines and APCs are calculated using the Joinpoint Regression Program Version 47 February 2019 National Cancer InstituteThe APC is the Annual Percent Change for the regression line segments The APC shown on the graph is for the most recent trendThe APC is significantly different from zero (p lt 005)
a
White Male Black Male White Female Black FemaleRate per 100000 Rate per 100000 Rate per 100000 Rate per 100000
Year of DiagnosisDeath Year of DiagnosisDeath Year of DiagnosisDeath Year of DiagnosisDeath
SEER Incidence APCsDelay Adj 1998-16 = 08Observed 1975-16 = 03
US Mortality APC2013-16 = -30
SEER Incidence APCsDelay Adj 1975-16 = 02Observed 1975-16 = 01
US Mortality APC1993-16 = -15
SEER Incidence APCsDelay Adj 1975-16 = 06Observed 1975-16 = 05
US Mortality APC2000-16 = -12
SEER Incidence APCsDelay Adj 1975-16 = 03Observed 1975-16 = 02
US Mortality APC1993-16 = -13
SEE
R C
ancer Statistics Review
1975-2016N
ational Cancer Institute
0
1
2
3
4
5
6
7
8
1975 1985 1995 2005 20160
1
2
3
4
5
6
7
8
1975 1985 1995 2005 20160
1
2
3
4
5
6
7
8
1975 1985 1995 2005 20160
1
2
3
4
5
6
7
8
1975 1985 1995 2005 2016
Chronic
Acute
SEER Observed Incidence RatesLymphocytic and Myeloid Leukemia (Acute and Chronic) by Sex
a
Figure 132
Source SEER 9 areas Rates are age-adjusted to the 2000 US Std Population (19 age groups - Census P25-1103)Regression lines and APCs are calculated using the Joinpoint Regression Program Version 47 February 2019 National Cancer Institute
a
Male Female Male FemaleLymphocytic Leukemia Myeloid Leukemia
Rate per 100000 Rate per 100000 Rate per 100000 Rate per 100000
Year of Diagnosis Year of Diagnosis Year of Diagnosis Year of Diagnosis
SEE
R C
ancer Statistics Review
1975-2016N
ational Cancer Institute
Joinpoint Analyses for Whites and Blacks from 1975-2016and for AsianPacific Islanders American IndiansAlaska Natives and Hispanics from 2000-2016
0
5
10
15
20
1975 1985 1995 2005 20160
5
10
15
20
1975 1985 1995 2005 2016
White
Black
API
AIAN
Hispanic
SEER Incidence and US Death RatesLeukemia Both Sexes
Figure 133
Source Incidence data for whites and blacks are from the SEER 9 areas (San Francisco Connecticut Detroit Hawaii Iowa New Mexico Seattle Utah Atlanta)Incidence data for AsianPacific Islanders American IndiansAlaska Natives and Hispanics are from the SEER 21 areas (SEER 9 areas San Jose-MontereyLos Angeles Alaska Native Registry Rural Georgia California excluding SFSJMLA Kentucky Louisiana New Jersey Georgia excluding ATLRG Idaho New York andMassachusetts)Mortality data are from US Mortality Files National Center for Health Statistics CDCRates are age-adjusted to the 2000 US Std Population (19 age groups - Census P25-1103)Regression lines are calculated using the Joinpoint Regression Program Version 47 February 2019 National Cancer Institute Joinpoint analyses for Whites andBlacks during the 1975-2016 period allow a maximum of 5 joinpoints Analyses for other ethnic groups during the period 2000-2016 allow a maximum of 3 joinpointsAPI = AsianPacific IslanderAIAN = American IndianAlaska Native Rates for American IndianAlaska Native are based on the PurchasedReferred Care Delivery Area (PRCDA) countiesHispanic is not mutually exclusive from whites blacks AsianPacific Islanders and American IndiansAlaska Natives Incidence data for Hispanics are based onNHIA and exclude cases from the Alaska Native Registry
Incidence MortalityRate per 100000 Rate per 100000
Year of Diagnosis Year of Death
a
d
a
b
c
c
b
d
SEE
R C
ancer Statistics Review
1975-2016N
ational Cancer Institute
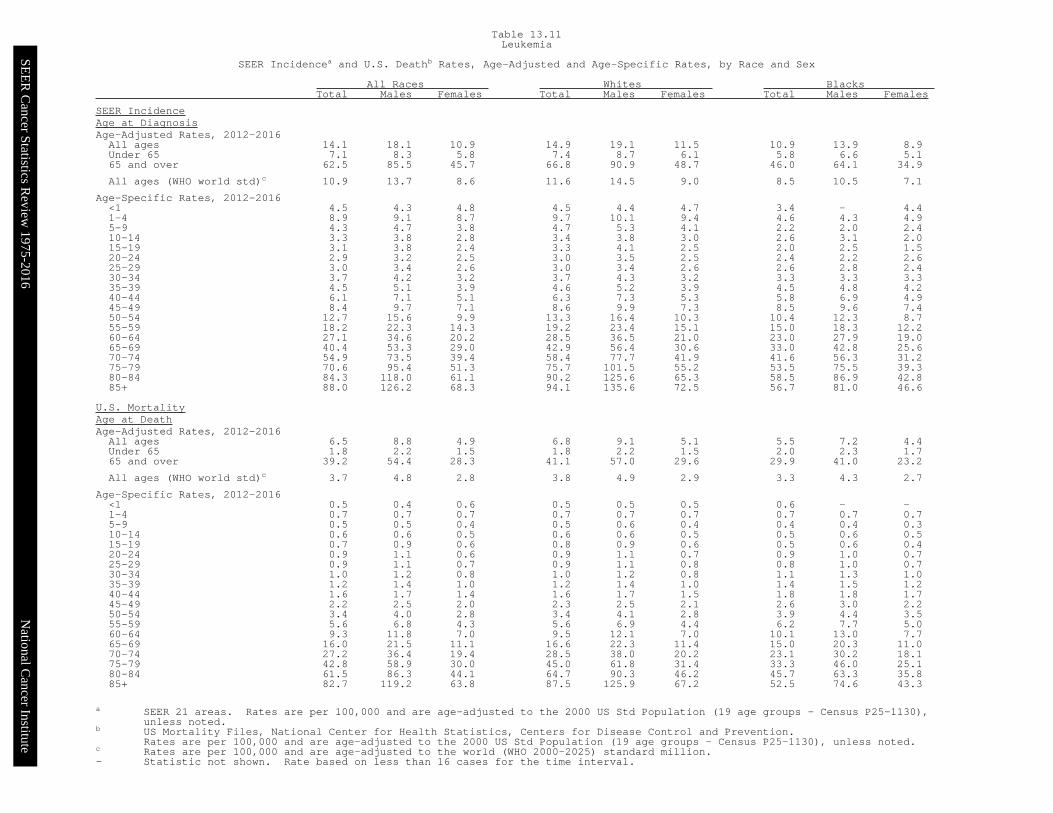
SEE
R C
ancer Statistics Review
1975-2016N
ational Cancer Institute
a SEER 21 areas Rates are per 100000 and are age-adjusted to the 2000 US Std Population (19 age groups - Census P25-1130)unless noted
b US Mortality Files National Center for Health Statistics Centers for Disease Control and PreventionRates are per 100000 and are age-adjusted to the 2000 US Std Population (19 age groups - Census P25-1130) unless noted
c Rates are per 100000 and are age-adjusted to the world (WHO 2000-2025) standard million- Statistic not shown Rate based on less than 16 cases for the time interval
All Races Whites Blacks Total Males Females Total Males Females Total Males Females
SEER IncidenceAge at DiagnosisAge-Adjusted Rates 2012-2016All ages 141 181 109 149 191 115 109 139 89Under 65 71 83 58 74 87 61 58 66 5165 and over 625 855 457 668 909 487 460 641 349
All ages (WHO world std)c 109 137 86 116 145 90 85 105 71
Age-Specific Rates 2012-2016lt1 45 43 48 45 44 47 34 - 441-4 89 91 87 97 101 94 46 43 495-9 43 47 38 47 53 41 22 20 2410-14 33 38 28 34 38 30 26 31 2015-19 31 38 24 33 41 25 20 25 1520-24 29 32 25 30 35 25 24 22 2625-29 30 34 26 30 34 26 26 28 2430-34 37 42 32 37 43 32 33 33 3335-39 45 51 39 46 52 39 45 48 4240-44 61 71 51 63 73 53 58 69 4945-49 84 97 71 86 99 73 85 96 7450-54 127 156 99 133 164 103 104 123 8755-59 182 223 143 192 234 151 150 183 12260-64 271 346 202 285 365 210 230 279 19065-69 404 533 290 429 564 306 330 428 25670-74 549 735 394 584 777 419 416 563 31275-79 706 954 513 757 1015 552 535 755 39380-84 843 1180 611 902 1256 653 585 869 42885+ 880 1262 683 941 1356 725 567 810 466
US MortalityAge at DeathAge-Adjusted Rates 2012-2016All ages 65 88 49 68 91 51 55 72 44Under 65 18 22 15 18 22 15 20 23 1765 and over 392 544 283 411 570 296 299 410 232
All ages (WHO world std)c 37 48 28 38 49 29 33 43 27
Age-Specific Rates 2012-2016lt1 05 04 06 05 05 05 06 - -1-4 07 07 07 07 07 07 07 07 075-9 05 05 04 05 06 04 04 04 0310-14 06 06 05 06 06 05 05 06 0515-19 07 09 06 08 09 06 05 06 0420-24 09 11 06 09 11 07 09 10 0725-29 09 11 07 09 11 08 08 10 0730-34 10 12 08 10 12 08 11 13 1035-39 12 14 10 12 14 10 14 15 1240-44 16 17 14 16 17 15 18 18 1745-49 22 25 20 23 25 21 26 30 2250-54 34 40 28 34 41 28 39 44 3555-59 56 68 43 56 69 44 62 77 5060-64 93 118 70 95 121 70 101 130 7765-69 160 215 111 166 223 114 150 203 11070-74 272 364 194 285 380 202 231 302 18175-79 428 589 300 450 618 314 333 460 25180-84 615 863 441 647 903 462 457 633 35885+ 827 1192 638 875 1259 672 525 746 433
Table 1311Leukemia
SEER Incidencea and US Deathb Rates Age-Adjusted and Age-Specific Rates by Race and Sex
SEE
R C
ancer Statistics Review
1975-2016N
ational Cancer Institute
a SEER 21 areas Rates are per 100000 and are age-adjusted to the 2000 US Std Population (19 age groups - Census P25-1130)unless noted
b Rates are per 100000 and are age-adjusted to the world (WHO 2000-2025) standard million- Statistic not shown Rate based on less than 16 cases for the time interval
All Races Whites Blacks Total Males Females Total Males Females Total Males Females
Acute Lymphocytic LeukemiaAge at DiagnosisAge-Adjusted Rates 2012-2016All ages 17 19 15 19 21 16 10 11 09Under 65 17 20 15 19 22 16 10 11 0965 and over 16 18 13 17 20 14 10 12 09
All ages (WHO world std)b 19 21 16 20 23 18 10 11 09
Age-Specific Rates 2012-2016lt1 19 16 22 19 16 23 14 - -1-4 76 77 74 84 87 81 33 30 375-9 36 40 33 41 46 36 18 15 2010-14 23 26 19 24 27 21 14 19 0915-19 18 24 12 20 27 13 07 12 -20-24 10 14 07 12 16 07 05 06 0525-29 08 10 06 08 11 06 05 - -30-34 07 09 06 08 09 06 04 - -35-39 08 10 06 08 10 07 06 07 -40-44 08 09 06 08 10 06 06 07 -45-49 09 09 09 09 09 10 04 - -50-54 09 10 08 09 10 09 07 09 -55-59 11 12 11 12 13 11 11 12 1060-64 13 15 11 13 15 11 11 13 0965-69 14 14 13 15 16 14 07 - -70-74 16 19 13 17 20 14 - - -75-79 17 20 15 18 21 16 13 - -80-84 17 23 13 17 24 13 - - -85+ 15 19 13 16 20 14 - - -
Chronic Lymphocytic LeukemiaAge at DiagnosisAge-Adjusted Rates 2012-2016All ages 49 68 35 54 73 38 34 49 24Under 65 17 22 12 18 24 13 12 16 0865 and over 275 383 195 298 411 212 185 273 129
All ages (WHO world std)b 35 47 24 38 51 27 24 34 17
Age-Specific Rates 2012-2016lt1 - - - - - - - - -1-4 - - - - - - - - -5-9 - - - - - - - - -10-14 - - - - - - - - -15-19 - - - - - - - - -20-24 - - - - - - - - -25-29 01 01 - 01 - - - - -30-34 01 02 - 01 02 - - - -35-39 04 04 03 04 05 04 04 - -40-44 10 12 08 10 13 08 08 12 -45-49 22 28 17 24 30 19 18 24 1250-54 48 65 32 53 70 36 32 46 2055-59 80 103 58 88 113 64 51 66 3760-64 125 170 84 134 180 90 94 129 6665-69 189 258 129 204 274 140 135 188 9570-74 245 338 167 265 361 182 176 263 11675-79 306 423 216 333 455 236 213 321 14580-84 354 502 252 385 541 275 222 360 14685+ 379 543 294 413 594 318 218 302 183
Table 1312Lymphocytic Leukemia
SEER Incidencea Rates Age-Adjusted and Age-Specific Rates by Race and Sex
SEE
R C
ancer Statistics Review
1975-2016N
ational Cancer Institute
a SEER 21 areas Rates are per 100000 and are age-adjusted to the 2000 US Std Population (19 age groups - Census P25-1130)unless noted
b Rates are per 100000 and are age-adjusted to the world (WHO 2000-2025) standard million- Statistic not shown Rate based on less than 16 cases for the time interval
All Races Whites Blacks Total Males Females Total Males Females Total Males Females
Acute Myeloid LeukemiaAge at DiagnosisAge-Adjusted Rates 2012-2016All ages 43 52 35 44 54 36 37 44 33Under 65 20 21 19 20 21 19 20 20 2065 and over 201 269 152 213 284 160 155 210 123
All ages (WHO world std)b 32 38 28 33 40 28 29 33 27
Age-Specific Rates 2012-2016lt1 16 16 16 15 15 15 - - -1-4 10 10 10 09 09 09 11 10 115-9 04 04 04 04 04 04 03 - -10-14 07 08 06 07 08 06 09 09 0815-19 09 09 09 09 10 09 08 07 0820-24 11 10 12 11 10 12 12 11 1325-29 12 11 12 11 11 12 11 10 1230-34 14 15 14 14 15 14 17 15 1935-39 16 16 16 15 16 15 18 16 2040-44 21 22 21 22 22 22 22 21 2245-49 25 25 25 25 25 25 28 27 2950-54 35 38 32 36 40 33 33 32 3355-59 49 56 43 49 56 43 49 57 4360-64 78 91 67 82 97 68 70 75 6665-69 121 152 94 129 163 98 100 118 8670-74 183 236 139 192 247 145 151 189 12575-79 233 310 174 248 326 186 185 256 14080-84 286 393 212 302 413 223 207 314 14885+ 263 380 203 277 403 212 174 254 141
Chronic Myeloid LeukemiaAge at DiagnosisAge-Adjusted Rates 2012-2016All ages 19 24 14 19 25 15 18 22 15Under 65 11 13 09 11 12 09 11 13 1065 and over 76 106 55 80 111 57 62 82 49
All ages (WHO world std)b 15 19 11 15 19 12 14 17 12
Age-Specific Rates 2012-2016lt1 05 05 - 04 - - - - -1-4 01 - - 01 - - - - -5-9 01 - 01 01 - - - - -10-14 01 02 01 01 01 01 - - -15-19 03 03 02 02 03 02 03 - -20-24 05 06 04 05 06 04 04 - -25-29 07 09 06 07 08 06 07 10 -30-34 10 12 08 11 12 09 08 09 0835-39 11 13 09 11 13 10 12 13 1040-44 14 18 11 14 18 11 16 22 1045-49 18 21 15 17 20 14 25 28 2350-54 22 26 17 21 26 17 23 25 2055-59 25 29 22 26 29 23 25 28 2260-64 35 43 27 35 44 27 34 41 2965-69 49 67 34 50 68 33 55 68 4570-74 65 85 48 68 89 51 49 66 3675-79 91 124 65 97 132 69 69 98 5080-84 105 147 75 112 156 80 76 92 6785+ 102 155 75 107 164 76 75 109 60
Table 1313Myeloid Leukemia
SEER Incidencea Rates Age-Adjusted and Age-Specific Rates by Race and Sex
SEE
R C
ancer Statistics Review
1975-2016N
ational Cancer Institute
a Based on End Results data from a series of hospital registries and one population-based registryb SEER 9 areas (San Francisco Connecticut Detroit Hawaii Iowa New Mexico Seattle Utah Atlanta)
Based on follow-up of patients into 2016 Expected survival rates are derived from the US Annual Life Tablesc SEER 18 areas (San Francisco Connecticut Detroit Hawaii Iowa New Mexico Seattle Utah Atlanta San Jose-Monterey
Los Angeles Alaska Native Registry Rural Georgia California excluding SFSJMLA Kentucky Louisiana New Jersey andGeorgia excluding ATLRG) Expected survival rates are derived from life tables by socio-economic status geography and racedeveloped by the SEER programBased on follow-up of patients into 2016
d Period survival provides a 2015 estimate of survival by piecing together the most recent conditional survival estimatesfrom several cohorts It is computed here using three year calendar blocks (2010-2012 0-1 year survival)(2009-2011 1-2 year survival) (2008-2010 2-3 year survival) (2007-2009 3-4 year survival) (2006-2008 4-5 years survival)
e The difference between 1975-1977 and 2009-2015 is statistically significant (plt05)f The standard error is between 5 and 10 percentage pointsg The standard error is greater than 10 percentage points- Statistic could not be calculated due to fewer than 25 cases during the time period
All Races Whites Blacks Total Males Females Total Males Females Total Males Females
5-Year Relative Survival (Percent)Year of Diagnosis1960-1963a - - - 14 - - - - -1970-1973a - - - 22 - - - - -1975-1977b 341 330 356 345 336 358 334 304 3671978-1980b 360 350 373 367 358 380 282 273 2931981-1983b 373 369 378 381 378 385 339 334 3431984-1986b 405 401 411 416 413 420 327 315 3411987-1989b 429 440 413 439 455 418 350 327 3781990-1992b 452 446 461 465 463 468 357 305 4131993-1995b 476 484 464 487 495 475 413 416 4091996-1998b 484 486 481 498 497 498 386 390 3801999-2001b 510 520 495 520 530 507 437 451 4212002-2004b 583 584 581 591 594 588 540 543 5342005-2008b 623 635 607 633 643 620 560 599 5112009-2015b 658e 673e 637e 668e 682e 649e 596e 609e 582e
5-Year Period Survival (Percent)cd
2015 632 643 619 634 640 624 582 617 544
5-Year Relative Survival (Percent) 2009-2015c
Age at DiagnosisAges lt45 762 758 768 773 764 786 677 677 677Ages 45-54 722 737 698 735 746 716 628 662 586Ages 55-64 693 699 683 704 707 698 589 605 566Ages 65-74 610 610 611 614 610 620 541 553 523Ages 75+ 421 424 417 427 428 425 337 357 316Ages lt65 729 731 725 739 738 741 637 650 621Ages 65+ 508 517 496 511 518 502 446 474 415
Table 1314Leukemia
5-Year Relative and Period Survival (Percent) by Race Sex Diagnosis Year and Age
SEE
R C
ancer Statistics Review
1975-2016N
ational Cancer Institute
a SEER 9 areas (San Francisco Connecticut Detroit Hawaii Iowa New Mexico Seattle Utah Atlanta)Based on follow-up of patients into 2016 Expected survival rates are derived from the US Annual Life Tables
b SEER 18 areas (San Francisco Connecticut Detroit Hawaii Iowa New Mexico Seattle Utah Atlanta San Jose-MontereyLos Angeles Alaska Native Registry Rural Georgia California excluding SFSJMLA Kentucky Louisiana New Jersey andGeorgia excluding ATLRG) Expected survival rates are derived from life tables by socio-economic status geography and racedeveloped by the SEER programBased on follow-up of patients into 2016
c Period survival provides a 2015 estimate of survival by piecing together the most recent conditional survival estimatesfrom several cohorts It is computed here using three year calendar blocks (2010-2012 0-1 year survival)(2009-2011 1-2 year survival) (2008-2010 2-3 year survival) (2007-2009 3-4 year survival) (2006-2008 4-5 years survival)
d The difference between 1975-1977 and 2009-2015 is statistically significant (plt05)e The standard error is between 5 and 10 percentage pointsf The standard error is greater than 10 percentage points- Statistic could not be calculated due to fewer than 25 cases during the time period
All Races Whites Blacks Total Males Females Total Males Females Total Males Females
Acute Lymphocytic Leukemia5-Year Relative Survival (Percent)Year of Diagnosis1975-1977a 406 369 456 408 374 457 335e - -1987-1989a 544 537 552 550 547 553 447e 420e 471e1990-1992a 580 545 631 577 549 620 571e 504e 633e1993-1995a 602 578 636 598 578 627 532e 459e 638e1996-1998a 655 644 669 664 643 690 556e 591e 502e1999-2001a 635 634 635 648 652 642 566e 503e 630e2002-2004a 673 661 689 676 666 691 645e 594e 697e2005-2008a 701 693 713 700 686 720 652 700 551e2009-2015a 717d 723d 710d 726d 737d 713d 625d 607 647e
5-Year Period Survival (Percent)bc2015 691 684 698 685 674 700 650 650 648
5-Year Relative Survival (Percent) 2009-2015bAge at DiagnosisAges lt45 806 795 821 807 791 828 763 757 770Ages 45-54 381 365 403 379 373 389 257e - -Ages 55-64 280 275 284 294 288 298 173e 228e -Ages 65-74 239 188 291 214 170 259 - - -Ages 75+ 91 97 83 100 96 100 00 - -Ages lt65 733 725 743 735 724 749 668 668 668Ages 65+ 174 151 196 166 141 191 154e - 189e
Chronic Lymphocytic Leukemia5-Year Relative Survival (Percent)Year of Diagnosis1975-1977a 671 647 703 679 654 711 569e 551e 590e1987-1989a 727 727 729 739 740 737 581 555e 615e1990-1992a 741 718 773 753 731 784 522 434e 609e1993-1995a 772 771 773 783 781 786 633 640e 621e1996-1998a 756 739 778 767 752 787 581 515e 660e1999-2001a 786 782 792 794 788 803 666 655e 666e2002-2004a 840 832 852 845 837 856 770 742e 807e2005-2008a 862 861 863 864 863 864 841 857 8122009-2015a 882d 887d 875d 886d 889d 883d 785d 801d 763
5-Year Period Survival (Percent)bc2015 856 855 858 853 848 860 772 818 710
5-Year Relative Survival (Percent) 2009-2015bAge at DiagnosisAges lt45 940 927 960 942 932 954 905e 879e -Ages 45-54 939 934 948 945 935 964 840 889 761eAges 55-64 922 916 933 924 916 938 836 831 843Ages 65-74 874 856 905 876 853 913 773 784 756Ages 75+ 731 727 736 729 724 734 584 586e 564eAges lt65 928 922 939 931 923 947 843 854 824Ages 65+ 801 796 807 799 792 807 691 713 662
Table 1315Lymphocytic Leukemia
5-Year Relative and Period Survival (Percent) by Race Sex Diagnosis Year and Age
SEE
R C
ancer Statistics Review
1975-2016N
ational Cancer Institute
a SEER 9 areas (San Francisco Connecticut Detroit Hawaii Iowa New Mexico Seattle Utah Atlanta)Based on follow-up of patients into 2016 Expected survival rates are derived from the US Annual Life Tables
b SEER 18 areas (San Francisco Connecticut Detroit Hawaii Iowa New Mexico Seattle Utah Atlanta San Jose-MontereyLos Angeles Alaska Native Registry Rural Georgia California excluding SFSJMLA Kentucky Louisiana New Jersey andGeorgia excluding ATLRG) Expected survival rates are derived from life tables by socio-economic status geography and racedeveloped by the SEER programBased on follow-up of patients into 2016
c Period survival provides a 2015 estimate of survival by piecing together the most recent conditional survival estimatesfrom several cohorts It is computed here using three year calendar blocks (2010-2012 0-1 year survival)(2009-2011 1-2 year survival) (2008-2010 2-3 year survival) (2007-2009 3-4 year survival) (2006-2008 4-5 years survival)
d The difference between 1975-1977 and 2009-2015 is statistically significant (plt05)e The standard error is between 5 and 10 percentage pointsf The standard error is greater than 10 percentage points- Statistic could not be calculated due to fewer than 25 cases during the time period
All Races Whites Blacks Total Males Females Total Males Females Total Males Females
Acute Myeloid Leukemia5-Year Relative Survival (Percent)Year of Diagnosis1975-1977a 62 55 70 58 54 62 101 82 1171987-1989a 115 92 141 113 97 132 92 44 157e1990-1992a 138 126 152 135 122 150 135 129 1391993-1995a 161 149 174 153 141 167 215 206e 2201996-1998a 170 159 183 156 145 171 221 252 1821999-2001a 192 188 197 187 176 199 193 248 1422002-2004a 234 209 264 232 208 260 253 265 2402005-2008a 249 235 265 242 228 257 239 193 2772009-2015a 294d 291d 298d 290d 284d 299d 292d 280d 301d
5-Year Period Survival (Percent)bc2015 286 278 294 282 276 289 283 262 301
5-Year Relative Survival (Percent) 2009-2015bAge at DiagnosisAges lt45 604 585 624 621 599 645 511 482 538Ages 45-54 441 439 444 456 450 463 337 342 336Ages 55-64 300 281 325 308 285 338 231 234 224Ages 65-74 139 137 141 145 144 146 103 78 131Ages 75+ 34 40 27 34 41 27 24 - 20Ages lt65 466 444 491 474 449 504 393 371 414Ages 65+ 79 85 72 82 89 73 64 58 71
Chronic Myeloid Leukemia5-Year Relative Survival (Percent)Year of Diagnosis1975-1977a 218 193 251 205 184 234 277e 216e 355e1987-1989a 303 306 298 301 310 290 333e 281e 413e1990-1992a 307 296 322 303 300 306 349e 255e 449e1993-1995a 355 353 358 352 351 352 356e 328e 402e1996-1998a 371 377 363 380 376 385 310 304e 314e1999-2001a 473 459 492 459 441 483 490e 496e 481e2002-2004a 543 530 561 526 514 541 630e 621e 640e2005-2008a 631 632 629 617 615 621 643 664e 608e2009-2015a 697d 681d 718d 690d 677d 707d 736d 711d 763d
5-Year Period Survival (Percent)bc2015 695 683 712 681 666 702 723 714 735
5-Year Relative Survival (Percent) 2009-2015bAge at DiagnosisAges lt45 899 889 913 916 905 934 797 786 812Ages 45-54 874 860 891 871 858 888 871 842 900Ages 55-64 776 748 816 781 750 826 698 676e 719eAges 65-74 611 579 656 609 578 654 584e 526e 637eAges 75+ 326 305 346 321 302 336 362e 362f 362eAges lt65 851 836 873 856 839 883 790 773 808Ages 65+ 462 444 484 456 441 475 495 471e 515e
Table 1316Myeloid Leukemia
5-Year Relative and Period Survival (Percent) by Race Sex Diagnosis Year and Age
SEE
R C
ancer Statistics Review
1975-2016N
ational Cancer Institute
a Based on the SEER 9 areas (San Francisco Connecticut Detroit Hawaii Iowa New Mexico Seattle Utah and Atlanta)Expected survival rates are derived from the US Annual Life Tables
1975- 1980- 1985- 1990-1979 1984 1989 1994 1995 1996 1997 1998 1999 2000 2001 2002 2003 2004 2005 2006 2007 2008 2009 2010 2011 2012 2013 2014 2015
Survival Time
1-year 608 626 648 669 681 682 679 667 659 669 706 722 732 751 742 765 769 766 774 783 794 791 790 791 8062-year 501 525 553 575 589 599 598 580 583 590 630 649 662 677 684 705 706 702 709 725 732 725 732 7343-year 437 465 496 528 543 554 549 541 547 551 590 619 624 643 647 673 676 665 684 692 703 692 6984-year 388 417 455 491 507 519 509 503 516 520 567 596 595 619 627 647 653 639 658 676 683 6735-year 346 376 423 461 481 487 483 482 484 499 543 578 575 596 610 626 637 619 635 659 6656-year 314 351 399 435 457 465 458 461 462 485 524 560 556 572 593 607 622 604 613 6477-year 291 325 371 409 442 451 438 446 444 473 510 544 537 560 579 591 614 587 6018-year 270 304 350 388 417 438 432 431 430 457 496 535 519 546 561 573 603 5769-year 250 285 330 373 406 420 418 421 421 449 483 519 507 530 546 561 59310-year 237 269 316 360 390 406 406 410 406 438 471 504 489 515 532 54511-year 224 257 299 347 378 398 387 397 392 426 459 492 473 499 52712-year 212 246 288 336 371 387 377 390 383 419 449 483 460 49213-year 204 236 280 327 367 382 370 380 372 404 442 466 45414-year 198 229 272 318 356 371 368 370 367 392 434 45615-year 192 223 267 313 353 361 362 358 359 383 42316-year 185 214 261 306 350 359 361 350 353 37417-year 181 207 256 300 340 355 352 346 34718-year 177 201 253 294 330 351 346 34319-year 171 195 248 291 326 343 34420-year 166 191 244 286 319 338
Table 1317Leukemia
SEERa Relative Survival (Percent)By Year of Diagnosis
All Races Males and Females
Year of Diagnosis
SEE
R C
ancer Statistics Review
1975-2016N
ational Cancer Institute
a Based on the SEER 9 areas (San Francisco Connecticut Detroit Hawaii Iowa New Mexico Seattle Utah and Atlanta)Expected survival rates are derived from the US Annual Life Tables
1975- 1980- 1985- 1990-1979 1984 1989 1994 1995 1996 1997 1998 1999 2000 2001 2002 2003 2004 2005 2006 2007 2008 2009 2010 2011 2012 2013 2014 2015
Survival Time
1-year 604 628 655 679 692 697 688 667 668 688 729 731 742 767 761 770 780 775 791 793 806 797 803 812 8172-year 494 524 561 583 604 616 611 585 590 608 648 652 669 687 701 706 719 716 727 740 746 733 749 7513-year 427 460 499 532 556 573 552 546 552 573 608 624 627 653 664 674 689 679 699 712 719 698 7144-year 377 411 459 494 516 535 505 505 520 539 581 598 601 627 650 648 667 650 677 690 697 6775-year 334 371 429 462 482 495 479 484 480 523 553 573 578 602 630 626 653 632 656 673 6846-year 303 343 404 435 452 471 459 461 461 508 529 554 557 575 609 602 635 615 631 6617-year 277 318 373 409 439 458 438 444 439 498 514 531 535 564 594 588 625 595 6168-year 254 294 354 385 417 446 430 430 423 478 500 520 514 549 572 563 616 5839-year 232 275 332 371 404 423 421 419 415 464 486 507 501 526 553 548 60510-year 219 260 317 358 382 407 413 410 401 454 473 490 479 511 539 52611-year 205 249 302 346 377 398 391 393 383 444 461 474 464 496 53312-year 193 242 290 334 371 390 380 384 375 437 452 467 455 49113-year 186 234 283 325 367 389 373 369 363 420 442 455 44714-year 179 227 277 315 357 379 370 358 357 410 433 44715-year 175 221 269 309 352 371 365 349 351 399 42216-year 168 212 263 303 347 369 360 341 346 38717-year 164 204 260 296 339 366 348 335 34318-year 159 199 257 290 324 364 345 33119-year 154 192 253 288 322 355 34120-year 146 187 249 283 316 347
Table 1318Leukemia
SEERa Relative Survival (Percent)By Year of Diagnosis
All Races Males
Year of Diagnosis
SEE
R C
ancer Statistics Review
1975-2016N
ational Cancer Institute
a Based on the SEER 9 areas (San Francisco Connecticut Detroit Hawaii Iowa New Mexico Seattle Utah and Atlanta)Expected survival rates are derived from the US Annual Life Tables
1975- 1980- 1985- 1990-1979 1984 1989 1994 1995 1996 1997 1998 1999 2000 2001 2002 2003 2004 2005 2006 2007 2008 2009 2010 2011 2012 2013 2014 2015
Survival Time
1-year 613 623 638 655 665 664 666 667 646 643 675 710 719 729 715 759 755 754 751 769 778 782 772 761 7912-year 509 527 542 564 569 578 580 574 573 564 606 645 653 664 660 705 689 684 684 705 714 716 709 7093-year 450 471 492 523 525 529 544 534 539 522 564 612 619 628 624 673 657 647 663 666 681 685 6774-year 402 424 449 485 495 498 514 500 511 494 548 594 587 608 595 646 633 624 633 658 664 6685-year 361 384 414 459 480 475 489 479 489 466 530 584 570 588 582 627 615 601 607 641 6396-year 328 360 392 435 464 457 456 461 463 455 516 567 556 569 572 613 602 589 588 6297-year 309 334 367 410 447 443 438 448 450 438 504 561 539 556 558 594 598 575 5798-year 290 316 344 391 416 428 433 433 438 428 490 556 526 542 546 585 582 5639-year 273 299 326 376 409 416 413 424 429 428 477 535 515 534 535 576 57610-year 259 281 315 364 399 405 396 409 414 416 468 522 502 521 521 56811-year 247 269 295 347 378 398 383 403 403 401 456 515 486 503 51812-year 235 250 285 338 372 382 373 397 393 395 445 505 468 49313-year 228 239 276 329 365 373 366 392 385 383 442 481 46314-year 220 232 267 323 355 361 363 385 380 367 434 46815-year 214 225 264 318 353 348 359 369 368 363 42416-year 206 217 258 310 353 344 359 361 363 35817-year 201 210 252 305 342 340 357 358 35018-year 198 205 248 301 336 334 347 35819-year 193 198 241 296 330 326 34620-year 190 195 238 290 321 323
Table 1319Leukemia
SEERa Relative Survival (Percent)By Year of Diagnosis
All Races Females
Year of Diagnosis
SEE
R C
ancer Statistics Review
1975-2016N
ational Cancer Institute
Devcan 677 April 2019 National Cancer Institute (httpssurveillancecancergovdevcan)Source Incidence data are from the SEER 21 areas (San Francisco Connecticut Detroit Hawaii Iowa New Mexico Seattle Utah Atlanta
San Jose-Monterey Los Angeles Alaska Native Registry Rural Georgia California excluding SFSJMLA Kentucky Louisiana New JerseyGeorgia excluding ATLRG Idaho New York and Massachusetts) Mortality data are from the NCHS public use data file for the total US
a Underlying incidence and mortality data for American IndianAlaska Native are based on the PRCDA(PurchasedReferred Care DeliveryAreas) counties
b Hispanic is not mutually exclusive from whites blacks AsianPacific Islanders and American IndiansAlaska NativesUnderlying incidence data for Hispanics are based on NHIA and exclude cases from the Alaska Native Registry
- Statistic could not be calculatedA percent of 000 represents a value that is below 0005
Risk of Being Risk of Being
Race Current Diagnosed with Cancer Risk of Dying Race Current Diagnosed with Cancer Risk of Dying
Ethnicity Age +10 yrs +20 yrs +30 yrs Ever from Cancer Ethnicity Age +10 yrs +20 yrs +30 yrs Ever from Cancer
All Races 0 006 009 012 156 082 Asian 0 005 008 011 099 058
10 003 006 010 152 082 Pacific 10 003 006 009 095 058
20 003 007 014 149 082 Islander 20 003 006 010 092 058
30 004 011 026 147 082 30 003 008 016 090 057
40 007 022 051 145 082 40 004 012 026 087 057
50 015 045 089 141 082 50 008 022 047 083 056
60 031 079 121 134 082 60 014 040 066 078 054
70 053 101 - 115 080 70 028 055 - 067 051
80 062 - - 082 068 80 032 - - 047 040
White 0 006 010 013 164 085 American 0 005 007 009 085 040
10 003 007 011 159 086 Indian 10 002 004 008 081 040
20 003 007 014 156 085 Alaska 20 002 006 010 079 039
30 004 011 027 155 085 Nativea 30 004 008 019 078 039
40 007 023 053 153 085 40 004 015 030 076 040
50 016 047 095 149 086 50 012 027 051 075 040
60 033 083 127 141 086 60 017 042 061 068 040
70 057 106 - 121 084 70 029 051 - 058 038
80 066 - - 086 071 80 029 - - 038 025
Black 0 003 006 008 107 058 Hispanicb 0 007 011 015 124 066
10 002 005 009 105 059 10 005 008 012 118 066
20 003 006 013 104 059 20 004 008 014 114 065
30 004 011 022 102 058 30 004 010 021 111 064
40 007 019 041 100 058 40 006 017 037 108 064
50 013 035 066 097 058 50 011 031 063 104 063
60 025 058 083 091 058 60 021 054 085 097 062
70 039 069 - 079 057 70 037 070 - 083 058
80 042 - - 056 048 80 042 - - 058 049
Table 1320
Leukemia
Risk of Being Diagnosed With Cancer in 10 20 and 30 Years
Lifetime Risk of Being Diagnosed with Cancer Given Alive and Cancer-Free at Current Age and
Lifetime Risk of Dying from Cancer Given Alive at Current Age
Both Sexes 2014-2016 By RaceEthnicity
SEE
R C
ancer Statistics Review
1975-2016N
ational Cancer Institute
Devcan 677 April 2019 National Cancer Institute (httpssurveillancecancergovdevcan)Source Incidence data are from the SEER 21 areas (San Francisco Connecticut Detroit Hawaii Iowa New Mexico Seattle Utah Atlanta
San Jose-Monterey Los Angeles Alaska Native Registry Rural Georgia California excluding SFSJMLA Kentucky Louisiana New JerseyGeorgia excluding ATLRG Idaho New York and Massachusetts) Mortality data are from the NCHS public use data file for the total US
a Underlying incidence and mortality data for American IndianAlaska Native are based on the PRCDA(PurchasedReferred Care DeliveryAreas) counties
b Hispanic is not mutually exclusive from whites blacks AsianPacific Islanders and American IndiansAlaska NativesUnderlying incidence data for Hispanics are based on NHIA and exclude cases from the Alaska Native Registry
- Statistic could not be calculatedA percent of 000 represents a value that is below 0005
Risk of Being Risk of Being
Race Current Diagnosed with Cancer Risk of Dying Race Current Diagnosed with Cancer Risk of Dying
Ethnicity Age +10 yrs +20 yrs +30 yrs Ever from Cancer Ethnicity Age +10 yrs +20 yrs +30 yrs Ever from Cancer
All Races 0 006 010 013 186 096 Asian 0 005 009 011 119 072
10 004 007 012 182 097 Pacific 10 004 007 010 115 072
20 003 008 016 179 097 Islander 20 003 007 012 111 071
30 005 013 030 177 097 30 004 009 019 109 071
40 008 026 062 176 098 40 005 015 033 106 070
50 018 056 112 173 099 50 010 028 062 102 069
60 040 101 152 166 101 60 019 054 084 096 068
70 071 129 - 146 101 70 038 071 - 084 065
80 082 - - 105 088 80 040 - - 056 052
White 0 007 011 014 195 101 American 0 006 009 011 110 048
10 004 008 012 190 102 Indian 10 003 005 010 105 048
20 004 008 016 187 101 Alaska 20 002 007 011 103 048
30 005 013 031 186 101 Nativea 30 005 009 021 103 048
40 009 027 065 184 102 40 005 017 041 102 049
50 019 058 118 181 103 50 013 039 075 102 051
60 042 107 160 174 106 60 028 067 087 097 051
70 075 136 - 153 105 70 046 070 - 081 049
80 087 - - 110 091 80 034 - - 049 030
Black 0 003 006 008 122 065 Hispanicb 0 007 013 017 141 080
10 003 006 009 122 066 10 005 010 015 135 080
20 003 006 014 120 065 20 005 009 016 130 079
30 004 011 025 119 066 30 005 011 023 127 078
40 008 022 048 118 066 40 007 018 040 124 078
50 015 042 079 115 067 50 012 034 072 120 078
60 031 071 102 112 068 60 024 064 100 114 078
70 051 089 - 101 068 70 046 086 - 102 077
80 058 - - 077 061 80 053 - - 074 070
Table 1321
Leukemia
Risk of Being Diagnosed With Cancer in 10 20 and 30 Years
Lifetime Risk of Being Diagnosed with Cancer Given Alive and Cancer-Free at Current Age and
Lifetime Risk of Dying from Cancer Given Alive at Current Age
Males 2014-2016 By RaceEthnicity
SEE
R C
ancer Statistics Review
1975-2016N
ational Cancer Institute
Devcan 677 April 2019 National Cancer Institute (httpssurveillancecancergovdevcan)Source Incidence data are from the SEER 21 areas (San Francisco Connecticut Detroit Hawaii Iowa New Mexico Seattle Utah Atlanta
San Jose-Monterey Los Angeles Alaska Native Registry Rural Georgia California excluding SFSJMLA Kentucky Louisiana New JerseyGeorgia excluding ATLRG Idaho New York and Massachusetts) Mortality data are from the NCHS public use data file for the total US
a Underlying incidence and mortality data for American IndianAlaska Native are based on the PRCDA(PurchasedReferred Care DeliveryAreas) counties
b Hispanic is not mutually exclusive from whites blacks AsianPacific Islanders and American IndiansAlaska NativesUnderlying incidence data for Hispanics are based on NHIA and exclude cases from the Alaska Native Registry
- Statistic could not be calculatedA percent of 000 represents a value that is below 0005
Risk of Being Risk of Being
Race Current Diagnosed with Cancer Risk of Dying Race Current Diagnosed with Cancer Risk of Dying
Ethnicity Age +10 yrs +20 yrs +30 yrs Ever from Cancer Ethnicity Age +10 yrs +20 yrs +30 yrs Ever from Cancer
All Races 0 006 008 011 129 068 Asian 0 005 008 010 083 048
10 003 005 009 125 069 Pacific 10 003 005 008 078 047
20 003 006 012 122 068 Islander 20 002 005 009 075 047
30 003 009 021 120 068 30 003 006 013 073 046
40 006 018 039 118 068 40 004 010 021 071 046
50 012 034 068 114 067 50 007 017 035 068 045
60 023 059 093 106 067 60 011 029 051 063 044
70 039 077 - 091 064 70 019 042 - 054 040
80 048 - - 066 055 80 026 - - 040 033
White 0 006 009 011 135 071 American 0 003 005 007 061 031
10 003 005 009 131 071 Indian 10 002 003 007 058 031
20 003 006 012 128 071 Alaska 20 002 005 008 056 031
30 003 010 022 126 071 Nativea 30 004 007 017 055 031
40 006 019 042 124 070 40 003 014 020 053 031
50 013 036 072 120 070 50 011 017 030 051 031
60 024 062 099 112 069 60 007 021 038 042 030
70 042 081 - 096 067 70 015 035 - 039 029
80 051 - - 069 057 80 025 - - 030 022
Black 0 004 006 008 095 053 Hispanicb 0 006 010 013 110 056
10 002 004 008 093 054 10 004 007 010 105 056
20 002 006 012 091 053 20 003 006 012 101 055
30 004 010 020 089 053 30 003 009 019 099 054
40 006 016 035 087 053 40 006 016 034 096 054
50 011 029 054 083 052 50 010 028 055 091 052
60 020 047 069 077 051 60 019 046 073 084 050
70 030 055 - 065 049 70 030 059 - 070 046
80 033 - - 046 042 80 035 - - 048 037
Table 1322
Leukemia
Risk of Being Diagnosed With Cancer in 10 20 and 30 Years
Lifetime Risk of Being Diagnosed with Cancer Given Alive and Cancer-Free at Current Age and
Lifetime Risk of Dying from Cancer Given Alive at Current Age
Females 2014-2016 By RaceEthnicity
SEER Cancer Statistics Review 1975-2016 National Cancer Institute
The AAPC is the Average Annual Percent Change over the time interval The AAPCs are calculated bythe Joinpoint Regression Program Version 47 February 2019 National Cancer Institute
- Statistic not shown Rate based on less than 16 cases for the time intervalTrend based on less than 10 cases for at least one year within the time interval
a Rates are age-adjusted to the 2000 US Std Population (19 age groups - Census P25-1130) Trendsare based on rates age-adjusted to the 2000 US Std Population (19 age groups - Census P25-1130)
b The SEER 9 areas are San Francisco Connecticut Detroit Hawaii Iowa New Mexico SeattleUtah and AtlantaThe SEER 21 areas comprise the SEER 9 areas plus San Jose-Monterey Los Angeles the AlaskaNative Registry Rural Georgia California excluding SFSJMLA Kentucky Louisiana New JerseyGeorgia excluding ATLRG Idaho New York and Massachusetts
c The 2007-2016 AAPC estimates are based on a Joinpoint analysis with up to 3 Joinpoints overdiagnosis years 2000-2016
d The 2007-2016 AAPC estimates are based on a Joinpoint analysis with up to 5 Joinpoints overdiagnosis years 1975-2016
e Hispanic and Non-Hispanic are not mutually exclusive from whites blacks AsianPacificIslanders and American IndiansAlaska Natives Incidence data for Hispanics and Non-Hispanicsare based on NHIA and exclude cases from the Alaska Native Registry
f Incidence data for American IndianAlaska Native are based on the PurchasedReferred CareDelivery Area (PRCDA) counties
g US Mortality Files National Center for Health Statistics CDCh The 2007-2016 mortality AAPCs are based on a Joinpoint analysis using years of death 2000-2016 The APC is significantly different from zero (plt05)
SEER Incidence SEER 21 Areasb SEER 21 Areasb SEER 9 Areasb
Rate 2012-2016 Trend 2007-2016c Trend 2007-2016d
Rate per 100000 persons AAPC () AAPC ()
Total Males Females Total Males Females Total Males Females RaceEthnicity
All Races 141 181 109 -04 -02 -06 -03 02 03
White 149 191 115 -05 -05 -07 04 03 05White Hispanice 112 134 94 01 -02 03 - - -White Non-Hispanice 153 197 116 -05 -05 -08 - - -
Black 109 139 89 06 02 07 01 01 02
AsianPacific Islander 78 97 63 01 00 02 - - -
Amer IndAlaska Natf 86 110 66 08 21 -01 - - -
Hispanice 108 130 91 02 00 03 - - -
US Mortalityg Rate 2012-2016 Trend 2007-2016h
Rate per 100000 persons AAPC ()
Total Males Females Total Males FemalesRaceEthnicity
All Races 65 88 49 -16 -17 -13
White 68 91 51 -14 -16 -12White Hispanice 50 63 41 -07 -08 -06White Non-Hispanice 69 93 51 -14 -15 -12
Black 55 72 44 -15 -17 -15
AsianPacific Islander 36 47 28 -18 -07 -23
Amer IndAlaska NatTotal US 31 42 23 -22 -09 -36PRCDA Counties 41 54 30 -16 -05 -28Non-PRCDA Counties 20 28 15 -31 -13 -50
Hispanice 47 60 38 -08 -09 -07
Table 1323Leukemia
SEER Incidence and US MortalityAge-Adjusted Rates and Trendsa
By RaceEthnicity and Sex
SEE
R C
ancer Statistics Review
1975-2016N
ational Cancer Institute
a Rates are per 100000 and are age-adjusted to the 2000 US Std Population (19 age groups - Census P25-1130)b The SEER 9 areas are San Francisco Connecticut Detroit Hawaii Iowa New Mexico Seattle Utah and Atlanta
The SEER 13 areas comprise the SEER 9 areas plus San Jose-Monterey Los Angeles the Alaska Native Registry and Rural GeorgiaThe SEER 18 areas comprise the SEER 13 areas plus California excluding SFSJMLA Kentucky Louisiana New Jersey and Georgiaexcluding ATLRGThe SEER 21 areas comprise the SEER 18 areas plus Idaho New York and Massachusetts
- Statistic not shown Rate based on less than 16 cases for the time interval
All Races Whites Blacks Total Males Females Total Males Females Total Males Females
SEER Incidence Ratesa 2012-2016
California 1239 1590 949 1337 1715 1020 1039 1334 813Greater Bay Area 1231 1619 915 1400 1844 1028 1098 1406 859San Francisco-Oakland 1212 1596 906 1389 1823 1034 1077 1336 881San Jose-Monterey 1259 1651 925 1410 1869 1011 1239 1787 -
Los Angeles 1173 1469 933 1291 1622 1016 1050 1294 884Greater California 1271 1633 968 1334 1709 1017 1007 1338 729
Connecticut 1406 1768 1117 1431 1790 1142 976 1126 867Detroit 1584 2050 1230 1707 2222 1300 1204 1485 1018Georgia 1430 1841 1120 1537 1970 1189 1139 1487 935Atlanta 1382 1819 1064 1563 2017 1207 1138 1557 884Rural Georgia 1411 1586 1206 1510 1773 1196 1248 - 1236Greater Georgia 1455 1863 1144 1531 1965 1182 1140 1450 968
Hawaii 1073 1339 843 1388 1612 1139 - - -Idaho 1588 1950 1263 1604 1973 1272 - - -Iowa 1627 2127 1222 1630 2133 1221 1416 1743 1076Kentucky 1566 1983 1234 1577 1995 1241 1159 1446 922Louisiana 1405 1789 1104 1518 1918 1197 1103 1393 890Massachusetts 1108 1429 854 1118 1448 856 787 1050 620New Jersey 1524 1962 1188 1541 1982 1199 1136 1469 928New Mexico 1299 1550 1086 1310 1556 1101 1045 - -New York 1623 2119 1244 1752 2281 1335 1068 1360 887Seattle-Puget Sound 1568 2020 1188 1634 2084 1249 1486 1929 1077Utah 1375 1793 1009 1401 1825 1029 - - -
SEER 9 Areasb 1419 1823 1094 1521 1945 1171 1154 1460 941SEER 13 Areasb 1357 1737 1049 1473 1882 1134 1126 1419 922SEER 18 Areasb 1376 1761 1066 1461 1867 1127 1114 1414 907SEER 21 Areasb 1407 1807 1088 1491 1912 1147 1089 1386 889
Table 1324Leukemia
Age-Adjusted SEER Incidence Ratesa
By Registry Race and Sex
SEE
R C
ancer Statistics Review
1975-2016N
ational Cancer Institute
a US Mortality Files National Center for Health Statistics Centers for Disease Control and PreventionRates are per 100000 and are age-adjusted to the 2000 US Std Population (19 age groups - Census P25-1130)
b The SEER 9 areas are San Francisco Connecticut Detroit Hawaii Iowa New Mexico Seattle Utah and AtlantaThe SEER 13 areas comprise the SEER 9 areas plus San Jose-Monterey Los Angeles the Alaska Native Registry and Rural GeorgiaThe SEER 18 areas comprise the SEER 13 areas plus California excluding SFSJMLA Kentucky Louisiana New Jersey and Georgiaexcluding ATLRGThe SEER 21 areas comprise the SEER 18 areas plus Idaho New York and Massachusetts
- Statistic not shown Rate based on less than 16 cases for the time interval
All Races Whites Blacks Total Males Females Total Males Females Total Males Females
SEER Death Ratesa 2012-2016
California 617 811 470 671 885 507 560 711 461Greater Bay Area 563 759 419 640 869 470 551 742 424San Francisco-Oakland 551 753 405 631 871 455 544 726 421San Jose-Monterey 584 768 446 653 863 495 604 - -
Los Angeles 608 797 468 675 894 513 571 717 483Greater California 639 835 489 677 886 515 553 687 458
Connecticut 622 837 465 639 862 474 536 665 449Detroit 662 915 485 691 967 494 573 723 475Georgia 614 817 467 642 855 478 538 706 438Atlanta 568 757 437 615 802 483 487 658 374Rural Georgia 581 628 538 579 635 - - - -Greater Georgia 639 851 482 654 879 477 576 745 483
Hawaii 463 593 362 543 632 440 - - -Idaho 655 846 497 661 865 492 - - -Iowa 693 961 498 700 963 508 - - -Kentucky 742 949 592 750 953 603 633 894 455Louisiana 677 906 514 705 953 520 603 776 498Massachusetts 622 830 478 647 869 490 463 524 444New Jersey 615 810 478 657 871 504 474 549 429New Mexico 560 759 400 589 794 421 - - -New York 621 842 466 675 910 506 450 602 356Seattle-Puget Sound 618 795 481 637 807 503 708 975 499Utah 679 865 526 693 876 542 - - -
SEER 9 Areasb 610 818 457 651 869 487 540 711 427SEER 13 Areasb 609 810 460 658 874 494 544 708 437SEER 18 Areasb 630 832 480 671 887 508 552 705 455SEER 21 Areasb 628 834 477 670 889 506 520 670 426
Total US 654 876 489 681 912 506 550 721 439
Table 1325Leukemia
Age-Adjusted SEER Death Ratesa
By Registry Race and Sex
SEER Cancer Statistics Review 1975-2016 National Cancer Institute
a US Mortality Files National Center for Health Statistics Centers for Disease Control andPrevention Rates are per 100000 and are age-adjusted to the 2000 US Std Population (19age groups - Census P25-1130)
b Difference between state rate and total US rate is statistically significant (plt=0002)c Absolute percent difference between state rate and total US rate is 15 or mored Rank of state level death rate and the 95 confidence intervals (low high) for the rankSE Standard error of the ratePD Percent difference between state rate and total US rate- Statistic not shown Rate based on less than 16 cases for the time interval
State Rate SE Rank(CI)d PD TOTAL US 654 002
High Five StatesOklahoma 790 019 01(0108) 2083c
West Virginia 749 025 02(0123) 1449South Dakota 747 040 03(0133) 1415Kentucky 742 018 04(0116) 1352Kansas 742 022 05(0122) 1350
Low Five StatesColorado 609 016 47(2649) -692Alaska 596 050 48(0451) -885New Mexico 560 022 49(3650) -1430DC 504 041 50(3251) -2293c
Hawaii 463 024 51(4951) -2913c
State Rate SE Rank(CI)d PD State Rate SE Rank(CI)d PD
Alabama 689 016 17(0532) 533 Montana 613 032 45(0950) -634Alaska 596 050 48(0451) -885 Nebraska 718 026 10(0131) 983Arizona 632 013 36(2248) -329 Nevada 644 021 28(1148) -157Arkansas 719 021 09(0127) 993 New Hampshire 638 029 31(0749) -238California 617 006 42(3248) -572 New Jersey 615 011 43(2849) -592Colorado 609 016 47(2649) -692 New Mexico 560 022 49(3650) -1430Connecticut 622 017 40(2249) -490 New York 621 007 41(2948) -499Delaware 664 035 24(0249) 152 North Carolina 634 011 34(2347) -310DC 504 041 50(3251) -2293c North Dakota 656 040 26(0249) 029Florida 630 007 38(2645) -370 Ohio 694 010 13(0626) 608Georgia 614 012 44(2849) -604 Oklahoma 790 019 01(0108) 2083c
Hawaii 463 024 51(4951) -2913c Oregon 632 017 37(1948) -331Idaho 655 028 27(0548) 012 Pennsylvania 680 009 21(1029) 396Illinois 684 010 19(0928) 463 Rhode Island 656 033 25(0349) 037Indiana 719 014 08(0222) 994 South Carolina 682 016 20(0634) 435Iowa 693 019 14(0334) 604 South Dakota 747 040 03(0133) 1415Kansas 742 022 05(0122) 1350 Tennessee 702 014 12(0327) 729Kentucky 742 018 04(0116) 1352 Texas 640 007 30(2342) -215Louisiana 677 017 23(0637) 356 Utah 679 024 22(0346) 387Maine 638 027 32(0949) -240 Vermont 636 041 33(0350) -277Maryland 633 014 35(2148) -323 Virginia 611 012 46(2849) -661Massachusetts 622 013 39(2548) -482 Washington 640 013 29(2047) -209Michigan 685 011 18(0829) 476 West Virginia 749 025 02(0123) 1449Minnesota 691 015 16(0430) 564 Wisconsin 727 015 06(0219) 1110Mississippi 692 021 15(0337) 580 Wyoming 721 049 07(0148) 1028Missouri 711 014 11(0324) 874
Table 1326Leukemia
Age-Adjusted Cancer Deatha Rates By State All Races 2012-2016
Males and Females
SEER Cancer Statistics Review 1975-2016 National Cancer Institute
a US Mortality Files National Center for Health Statistics Centers for Disease Control andPrevention Rates are per 100000 and are age-adjusted to the 2000 US Std Population (19age groups - Census P25-1130)
b Difference between state rate and total US rate is statistically significant (plt=0002)c Absolute percent difference between state rate and total US rate is 15 or mored Rank of state level death rate and the 95 confidence intervals (low high) for the rankSE Standard error of the ratePD Percent difference between state rate and total US rate- Statistic not shown Rate based on less than 16 cases for the time interval
State Rate SE Rank(CI)d PD TOTAL US 876 003
High Five StatesOklahoma 1022 034 01(0120) 1669c
Kansas 1018 039 02(0123) 1625c
Arkansas 991 037 03(0127) 1309South Dakota 985 068 04(0147) 1249Delaware 984 065 05(0144) 1236
Low Five StatesMontana 795 053 47(1150) -921New Mexico 759 039 48(2650) -1336Alaska 711 081 49(0851) -1887c
DC 704 078 50(1051) -1959c
Hawaii 593 040 51(4951) -3228c
State Rate SE Rank(CI)d PD State Rate SE Rank(CI)d PD
Alabama 939 029 17(0233) 725 Montana 795 053 47(1150) -921Alaska 711 081 49(0851) -1887c Nebraska 958 046 12(0141) 935Arizona 827 022 41(2449) -555 Nevada 858 037 33(0849) -210Arkansas 991 037 03(0127) 1309 New Hampshire 884 051 25(0149) 088California 811 010 43(3348) -738 New Jersey 810 020 44(2749) -747Colorado 834 028 39(2049) -484 New Mexico 759 039 48(2650) -1336Connecticut 837 031 37(1549) -441 New York 842 013 35(2546) -387Delaware 984 065 05(0144) 1236 North Carolina 863 020 31(1945) -149DC 704 078 50(1051) -1959c North Dakota 873 070 27(0150) -030Florida 839 012 36(2645) -422 Ohio 931 018 19(0529) 627Georgia 817 021 42(2649) -677 Oklahoma 1022 034 01(0120) 1669c
Hawaii 593 040 51(4951) -3228c Oregon 866 029 29(1147) -112Idaho 846 047 34(0550) -339 Pennsylvania 912 016 21(0931) 416Illinois 928 018 20(0529) 594 Rhode Island 911 059 22(0149) 400Indiana 960 025 11(0127) 959 South Carolina 951 029 13(0131) 853Iowa 961 035 08(0131) 969 South Dakota 985 068 04(0147) 1249Kansas 1018 039 02(0123) 1625c Tennessee 960 025 10(0127) 959Kentucky 949 031 15(0133) 832 Texas 870 013 28(2139) -069Louisiana 906 030 23(0442) 342 Utah 865 041 30(0549) -122Maine 803 046 46(1450) -836 Vermont 874 074 26(0150) -026Maryland 861 026 32(1447) -176 Virginia 809 021 45(2650) -770Massachusetts 830 023 40(2349) -529 Washington 835 023 38(2248) -463Michigan 937 020 18(0428) 702 West Virginia 972 044 06(0135) 1095Minnesota 948 027 16(0229) 826 Wisconsin 960 026 09(0127) 961Mississippi 970 039 07(0132) 1077 Wyoming 885 081 24(0150) 102Missouri 951 025 14(0228) 852
Table 1327Leukemia
Age-Adjusted Cancer Deatha Rates By State All Races 2012-2016
Males
SEER Cancer Statistics Review 1975-2016 National Cancer Institute
a US Mortality Files National Center for Health Statistics Centers for Disease Control andPrevention Rates are per 100000 and are age-adjusted to the 2000 US Std Population (19age groups - Census P25-1130)
b Difference between state rate and total US rate is statistically significant (plt=0002)c Absolute percent difference between state rate and total US rate is 15 or mored Rank of state level death rate and the 95 confidence intervals (low high) for the rankSE Standard error of the ratePD Percent difference between state rate and total US rate- Statistic not shown Rate based on less than 16 cases for the time interval
State Rate SE Rank(CI)d PD TOTAL US 489 002
High Five StatesOklahoma 615 023 01(0108) 2584c
Wyoming 596 060 02(0147) 2194c
Kentucky 592 021 03(0111) 2126c
West Virginia 576 030 04(0126) 1792c
South Dakota 564 047 05(0145) 1551c
Low Five StatesColorado 441 018 47(2250) -972Delaware 428 037 48(0751) -1247New Mexico 400 025 49(3151) -1803c
DC 381 046 50(1251) -2203c
Hawaii 362 029 51(4151) -2598c
State Rate SE Rank(CI)d PD State Rate SE Rank(CI)d PD
Alabama 512 019 18(0440) 483 Montana 452 037 43(0551) -745Alaska 485 062 27(0151) -073 Nebraska 531 030 10(0144) 864Arizona 473 015 31(1347) -308 Nevada 455 025 42(1150) -695Arkansas 516 024 15(0344) 554 New Hampshire 449 033 45(0651) -807California 470 007 34(2345) -383 New Jersey 478 013 30(1346) -223Colorado 441 018 47(2250) -972 New Mexico 400 025 49(3151) -1803c
Connecticut 465 020 40(1249) -487 New York 466 009 38(2246) -456Delaware 428 037 48(0751) -1247 North Carolina 471 012 32(1747) -350DC 381 046 50(1251) -2203c North Dakota 479 046 28(0151) -189Florida 460 008 41(2647) -582 Ohio 520 012 12(0529) 653Georgia 467 013 37(1747) -433 Oklahoma 615 023 01(0108) 2584c
Hawaii 362 029 51(4151) -2598c Oregon 449 019 44(1850) -799Idaho 497 033 22(0249) 174 Pennsylvania 516 011 14(0629) 556Illinois 514 011 16(0631) 526 Rhode Island 471 037 33(0351) -363Indiana 540 017 07(0226) 1052 South Carolina 495 018 23(0645) 133Iowa 498 022 20(0547) 200 South Dakota 564 047 05(0145) 1551c
Kansas 539 025 08(0137) 1032 Tennessee 517 016 13(0435) 590Kentucky 592 021 03(0111) 2126c Texas 467 008 36(2246) -431Louisiana 514 020 17(0442) 520 Utah 526 029 11(0146) 778Maine 508 032 19(0248) 403 Vermont 444 045 46(0351) -906Maryland 470 016 35(1448) -389 Virginia 465 014 39(1848) -474Massachusetts 478 015 29(1247) -220 Washington 487 016 25(0946) -022Michigan 498 013 21(0939) 192 West Virginia 576 030 04(0126) 1792c
Minnesota 494 017 24(0745) 121 Wisconsin 545 017 06(0225) 1162Mississippi 485 023 26(0548) -067 Wyoming 596 060 02(0147) 2194c
Missouri 535 017 09(0327) 953
Table 1328Leukemia
Age-Adjusted Cancer Deatha Rates By State All Races 2012-2016
Females
SEE
R C
ancer Statistics Review
1975-2016N
ational Cancer Institute
a US 2016 cancer prevalence counts are based on 2016 cancer prevalence proportions from the SEER 13 Areas (excluding the AlaskaNative Registry) and 112016 US population estimates based on the average of 2015 and 2016 population estimates from theUS Bureau of the CensusPrevalence was calculated using the first invasive tumor for each cancer site diagnosed during the previous 24 years
b Maximum limited-duration prevalence is 24 years for 1992-2016 datac Percentages are age-adjusted to the 2000 US Standard Population (19 age groups - Census P25-1130) by 5-year age groupsd Cases diagnosed more than 24 years ago were estimated using the completeness index method (Capocaccia et al 1997
Merrill et al 2000)e Complete prevalence is obtained by summing 0 to lt24 and gt=24- Statistic not shown Statistic based on fewer than 5 cases estimated alive in SEER for the time interval+ Not available
Years Since Diagnosis 0 to lt5 5 to lt10 10 to lt15 15 to lt20 20 to lt24 0 to lt24b gt=24d Completee
Race Sex All Races Both Sexes 153253 100309 63581 38012 21353 376508 38265 414773
Males 90192 57683 36029 21220 12020 217145 18411 235556Females 63061 42625 27552 16792 9333 159363 19854 179217
White Both Sexes 132173 87961 56051 33596 19035 328814 32999 370135Males 78368 50894 32033 18770 10845 190910 15102 210930Females 53805 37067 24018 14826 8190 137905 17897 159205
Black Both Sexes 12734 6564 4233 2487 1259 27277 4070 31347Males 6847 3556 2204 1334 637 14578 1776 16354Females 5887 3008 2029 1153 622 12699 2294 14992
Asian Both Sexes 3926 2561 1778 1164 690 10120 + +Pacific Males 2235 1462 936 646 351 5630 + +Islander Females 1691 1100 842 519 339 4490 + +
Hispanic Both Sexes 14464 9581 6796 4462 2630 37933 + +Males 8166 5374 3794 2408 1538 21280 + +Females 6298 4207 3002 2055 1092 16654 + +
Age Specific (Crude) Age-Adjustedc Age at Prevalence All Ages 0-9 10-19 20-29 30-39 40-49 50-59 60-69 70-79 80+ All Ages
Race Sex All Races Both Sexes 01168 00328 00640 00628 00377 00561 01053 02263 04023 05111 01054
Males 01369 00339 00706 00685 00419 00657 01287 02888 05282 07048 01306Females 00974 00317 00572 00570 00333 00466 00829 01696 02974 03919 00844
White Both Sexes 01304 00369 00715 00712 00410 00584 01106 02389 04249 05386 01127Males 01528 00379 00789 00771 00457 00682 01349 03042 05558 07387 01389Females 01084 00359 00637 00650 00362 00484 00869 01784 03135 04133 00904
Black Both Sexes 00605 00145 00322 00320 00267 00463 00752 01455 02470 03076 00660Males 00674 00142 00357 00338 00281 00530 00919 01737 03249 04580 00816Females 00541 00148 00286 00301 00255 00402 00605 01230 01927 02334 00552
Asian Both Sexes 00497 00264 00531 00426 00230 00390 00553 00882 01245 01389 00513Pacific Males 00577 00298 00555 00507 00249 00461 00665 01122 01552 01904 00613Islander Females 00423 00228 00507 00345 00212 00327 00456 00688 00999 01057 00430
Hispanic Both Sexes 00664 00375 00737 00728 00395 00485 00723 01191 01987 02074 00746Males 00737 00397 00827 00807 00471 00576 00831 01350 02221 02551 00854Females 00589 00352 00642 00641 00312 00391 00617 01050 01809 01780 00647
Table 1329Leukemia
Estimated United States Cancer Prevalence Countsa on January 1 2016By RaceEthnicity Sex and Years Since Diagnosis
Estimated prevalence percenta on January 1 2016 of the SEER population diagnosed in the previous 24 yearsBy Age at Prevalence RaceEthnicity and Sex
SEE
R C
ancer Statistics Review
1975-2016N
ational Cancer Institute
a US 2016 cancer prevalence counts are based on 2016 cancer prevalence proportions from the SEER 13 Areas (excluding the AlaskaNative Registry) and 112016 US population estimates based on the average of 2015 and 2016 population estimates from theUS Bureau of the CensusPrevalence was calculated using the first invasive tumor for each cancer site diagnosed during the previous 24 years
b Maximum limited-duration prevalence is 24 years for 1992-2016 datac Percentages are age-adjusted to the 2000 US Standard Population (19 age groups - Census P25-1130) by 5-year age groupsd Cases diagnosed more than 24 years ago were estimated using the completeness index method (Capocaccia et al 1997
Merrill et al 2000)e Complete prevalence is obtained by summing 0 to lt24 and gt=24- Statistic not shown Statistic based on fewer than 5 cases estimated alive in SEER for the time interval+ Not available
Years Since Diagnosis 0 to lt5 5 to lt10 10 to lt15 15 to lt20 20 to lt24 0 to lt24b gt=24d Completee
Race Sex All Races Both Sexes 20277 16033 13721 12074 8203 70308 25456 95764
Males 11203 9049 7751 6542 4634 39179 12997 52176Females 9074 6984 5971 5531 3568 31129 12460 43589
White Both Sexes 17123 13855 11870 10663 7154 60665 21823 83282Males 9549 7741 6768 5696 4084 33839 11286 45559Females 7573 6114 5102 4967 3070 26826 10537 37723
Black Both Sexes 1590 1133 923 727 553 4926 1609 6535Males 809 734 473 411 290 2716 592 3308Females 781 399 450 317 263 2210 1017 3227
Asian Both Sexes 998 720 669 486 361 3234 + +Pacific Males 527 406 369 313 178 1793 + +Islander Females 472 314 300 173 183 1441 + +
Hispanic Both Sexes 5905 4543 3352 2717 1749 18266 + +Males 3302 2686 1899 1465 1058 10409 + +Females 2603 1857 1454 1252 692 7857 + +
Age Specific (Crude) Age-Adjustedc Age at Prevalence All Ages 0-9 10-19 20-29 30-39 40-49 50-59 60-69 70-79 80+ All Ages
Race Sex All Races Both Sexes 00218 00276 00541 00467 00139 00078 00059 00065 00053 00033 00228
Males 00247 00286 00591 00520 00163 00095 00066 00069 00056 00035 00251Females 00190 00266 00488 00410 00115 00062 00053 00062 00050 00032 00204
White Both Sexes 00241 00315 00612 00542 00161 00086 00063 00070 00056 00033 00259Males 00271 00323 00670 00598 00186 00107 00069 00074 00060 00032 00284Females 00211 00306 00551 00482 00135 00064 00057 00066 00053 00033 00232
Black Both Sexes 00109 00107 00250 00197 00067 00042 00039 00029 00012 00027 00102Males 00126 00112 00281 00224 00079 00035 00052 00026 00012 00027 00112Females 00094 00102 00219 00171 00056 00047 00028 00032 00013 00027 00092
Asian Both Sexes 00159 00208 00418 00289 00071 00064 00045 00050 00054 00036 00163Pacific Males 00184 00226 00427 00360 00086 00069 00055 00054 00033 00055 00180Islander Females 00136 00190 00408 00219 00058 00059 00036 00047 00071 00023 00146
Hispanic Both Sexes 00320 00328 00637 00574 00165 00107 00093 00100 00084 00012 00279Males 00361 00342 00710 00648 00205 00131 00110 00063 00072 - 00309Females 00278 00312 00562 00494 00122 00082 00077 00133 00093 00020 00246
Table 1330Acute Lymphocytic Leukemia
Estimated United States Cancer Prevalence Countsa on January 1 2016By RaceEthnicity Sex and Years Since Diagnosis
Estimated prevalence percenta on January 1 2016 of the SEER population diagnosed in the previous 24 yearsBy Age at Prevalence RaceEthnicity and Sex
0
5
10
15
20
25
1975 1985 1995 2005 20160
5
10
15
20
25
1975 1985 1995 2005 20160
3
6
9
12
15
1975 1985 1995 2005 20160
3
6
9
12
15
1975 1985 1995 2005 2016
Delay-Adj IncidenceDelay-Adj Incidence
Observed IncidenceObserved Incidence
MortalityMortality
SEER Observed Incidence SEER Delay Adjusted Incidence and US Death RatesLeukemia by Race and Sex
a
Figure 131
Source SEER 9 areas and US Mortality Files (National Center for Health Statistics CDC)Rates are age-adjusted to the 2000 US Std Population (19 age groups - Census P25-1103)Regression lines and APCs are calculated using the Joinpoint Regression Program Version 47 February 2019 National Cancer InstituteThe APC is the Annual Percent Change for the regression line segments The APC shown on the graph is for the most recent trendThe APC is significantly different from zero (p lt 005)
a
White Male Black Male White Female Black FemaleRate per 100000 Rate per 100000 Rate per 100000 Rate per 100000
Year of DiagnosisDeath Year of DiagnosisDeath Year of DiagnosisDeath Year of DiagnosisDeath
SEER Incidence APCsDelay Adj 1998-16 = 08Observed 1975-16 = 03
US Mortality APC2013-16 = -30
SEER Incidence APCsDelay Adj 1975-16 = 02Observed 1975-16 = 01
US Mortality APC1993-16 = -15
SEER Incidence APCsDelay Adj 1975-16 = 06Observed 1975-16 = 05
US Mortality APC2000-16 = -12
SEER Incidence APCsDelay Adj 1975-16 = 03Observed 1975-16 = 02
US Mortality APC1993-16 = -13
SEE
R C
ancer Statistics Review
1975-2016N
ational Cancer Institute
0
1
2
3
4
5
6
7
8
1975 1985 1995 2005 20160
1
2
3
4
5
6
7
8
1975 1985 1995 2005 20160
1
2
3
4
5
6
7
8
1975 1985 1995 2005 20160
1
2
3
4
5
6
7
8
1975 1985 1995 2005 2016
Chronic
Acute
SEER Observed Incidence RatesLymphocytic and Myeloid Leukemia (Acute and Chronic) by Sex
a
Figure 132
Source SEER 9 areas Rates are age-adjusted to the 2000 US Std Population (19 age groups - Census P25-1103)Regression lines and APCs are calculated using the Joinpoint Regression Program Version 47 February 2019 National Cancer Institute
a
Male Female Male FemaleLymphocytic Leukemia Myeloid Leukemia
Rate per 100000 Rate per 100000 Rate per 100000 Rate per 100000
Year of Diagnosis Year of Diagnosis Year of Diagnosis Year of Diagnosis
SEE
R C
ancer Statistics Review
1975-2016N
ational Cancer Institute
Joinpoint Analyses for Whites and Blacks from 1975-2016and for AsianPacific Islanders American IndiansAlaska Natives and Hispanics from 2000-2016
0
5
10
15
20
1975 1985 1995 2005 20160
5
10
15
20
1975 1985 1995 2005 2016
White
Black
API
AIAN
Hispanic
SEER Incidence and US Death RatesLeukemia Both Sexes
Figure 133
Source Incidence data for whites and blacks are from the SEER 9 areas (San Francisco Connecticut Detroit Hawaii Iowa New Mexico Seattle Utah Atlanta)Incidence data for AsianPacific Islanders American IndiansAlaska Natives and Hispanics are from the SEER 21 areas (SEER 9 areas San Jose-MontereyLos Angeles Alaska Native Registry Rural Georgia California excluding SFSJMLA Kentucky Louisiana New Jersey Georgia excluding ATLRG Idaho New York andMassachusetts)Mortality data are from US Mortality Files National Center for Health Statistics CDCRates are age-adjusted to the 2000 US Std Population (19 age groups - Census P25-1103)Regression lines are calculated using the Joinpoint Regression Program Version 47 February 2019 National Cancer Institute Joinpoint analyses for Whites andBlacks during the 1975-2016 period allow a maximum of 5 joinpoints Analyses for other ethnic groups during the period 2000-2016 allow a maximum of 3 joinpointsAPI = AsianPacific IslanderAIAN = American IndianAlaska Native Rates for American IndianAlaska Native are based on the PurchasedReferred Care Delivery Area (PRCDA) countiesHispanic is not mutually exclusive from whites blacks AsianPacific Islanders and American IndiansAlaska Natives Incidence data for Hispanics are based onNHIA and exclude cases from the Alaska Native Registry
Incidence MortalityRate per 100000 Rate per 100000
Year of Diagnosis Year of Death
a
d
a
b
c
c
b
d
SEE
R C
ancer Statistics Review
1975-2016N
ational Cancer Institute
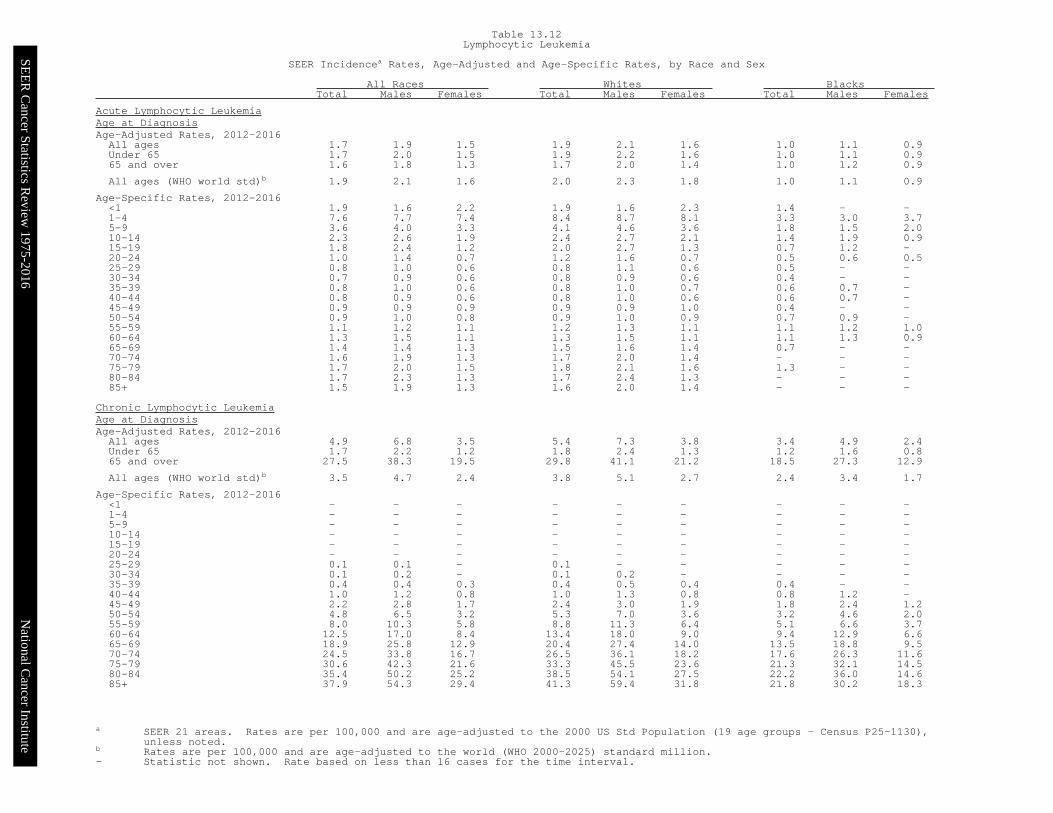
SEE
R C
ancer Statistics Review
1975-2016N
ational Cancer Institute
a SEER 21 areas Rates are per 100000 and are age-adjusted to the 2000 US Std Population (19 age groups - Census P25-1130)unless noted
b Rates are per 100000 and are age-adjusted to the world (WHO 2000-2025) standard million- Statistic not shown Rate based on less than 16 cases for the time interval
All Races Whites Blacks Total Males Females Total Males Females Total Males Females
Acute Lymphocytic LeukemiaAge at DiagnosisAge-Adjusted Rates 2012-2016All ages 17 19 15 19 21 16 10 11 09Under 65 17 20 15 19 22 16 10 11 0965 and over 16 18 13 17 20 14 10 12 09
All ages (WHO world std)b 19 21 16 20 23 18 10 11 09
Age-Specific Rates 2012-2016lt1 19 16 22 19 16 23 14 - -1-4 76 77 74 84 87 81 33 30 375-9 36 40 33 41 46 36 18 15 2010-14 23 26 19 24 27 21 14 19 0915-19 18 24 12 20 27 13 07 12 -20-24 10 14 07 12 16 07 05 06 0525-29 08 10 06 08 11 06 05 - -30-34 07 09 06 08 09 06 04 - -35-39 08 10 06 08 10 07 06 07 -40-44 08 09 06 08 10 06 06 07 -45-49 09 09 09 09 09 10 04 - -50-54 09 10 08 09 10 09 07 09 -55-59 11 12 11 12 13 11 11 12 1060-64 13 15 11 13 15 11 11 13 0965-69 14 14 13 15 16 14 07 - -70-74 16 19 13 17 20 14 - - -75-79 17 20 15 18 21 16 13 - -80-84 17 23 13 17 24 13 - - -85+ 15 19 13 16 20 14 - - -
Chronic Lymphocytic LeukemiaAge at DiagnosisAge-Adjusted Rates 2012-2016All ages 49 68 35 54 73 38 34 49 24Under 65 17 22 12 18 24 13 12 16 0865 and over 275 383 195 298 411 212 185 273 129
All ages (WHO world std)b 35 47 24 38 51 27 24 34 17
Age-Specific Rates 2012-2016lt1 - - - - - - - - -1-4 - - - - - - - - -5-9 - - - - - - - - -10-14 - - - - - - - - -15-19 - - - - - - - - -20-24 - - - - - - - - -25-29 01 01 - 01 - - - - -30-34 01 02 - 01 02 - - - -35-39 04 04 03 04 05 04 04 - -40-44 10 12 08 10 13 08 08 12 -45-49 22 28 17 24 30 19 18 24 1250-54 48 65 32 53 70 36 32 46 2055-59 80 103 58 88 113 64 51 66 3760-64 125 170 84 134 180 90 94 129 6665-69 189 258 129 204 274 140 135 188 9570-74 245 338 167 265 361 182 176 263 11675-79 306 423 216 333 455 236 213 321 14580-84 354 502 252 385 541 275 222 360 14685+ 379 543 294 413 594 318 218 302 183
Table 1312Lymphocytic Leukemia
SEER Incidencea Rates Age-Adjusted and Age-Specific Rates by Race and Sex
SEE
R C
ancer Statistics Review
1975-2016N
ational Cancer Institute
a SEER 21 areas Rates are per 100000 and are age-adjusted to the 2000 US Std Population (19 age groups - Census P25-1130)unless noted
b Rates are per 100000 and are age-adjusted to the world (WHO 2000-2025) standard million- Statistic not shown Rate based on less than 16 cases for the time interval
All Races Whites Blacks Total Males Females Total Males Females Total Males Females
Acute Myeloid LeukemiaAge at DiagnosisAge-Adjusted Rates 2012-2016All ages 43 52 35 44 54 36 37 44 33Under 65 20 21 19 20 21 19 20 20 2065 and over 201 269 152 213 284 160 155 210 123
All ages (WHO world std)b 32 38 28 33 40 28 29 33 27
Age-Specific Rates 2012-2016lt1 16 16 16 15 15 15 - - -1-4 10 10 10 09 09 09 11 10 115-9 04 04 04 04 04 04 03 - -10-14 07 08 06 07 08 06 09 09 0815-19 09 09 09 09 10 09 08 07 0820-24 11 10 12 11 10 12 12 11 1325-29 12 11 12 11 11 12 11 10 1230-34 14 15 14 14 15 14 17 15 1935-39 16 16 16 15 16 15 18 16 2040-44 21 22 21 22 22 22 22 21 2245-49 25 25 25 25 25 25 28 27 2950-54 35 38 32 36 40 33 33 32 3355-59 49 56 43 49 56 43 49 57 4360-64 78 91 67 82 97 68 70 75 6665-69 121 152 94 129 163 98 100 118 8670-74 183 236 139 192 247 145 151 189 12575-79 233 310 174 248 326 186 185 256 14080-84 286 393 212 302 413 223 207 314 14885+ 263 380 203 277 403 212 174 254 141
Chronic Myeloid LeukemiaAge at DiagnosisAge-Adjusted Rates 2012-2016All ages 19 24 14 19 25 15 18 22 15Under 65 11 13 09 11 12 09 11 13 1065 and over 76 106 55 80 111 57 62 82 49
All ages (WHO world std)b 15 19 11 15 19 12 14 17 12
Age-Specific Rates 2012-2016lt1 05 05 - 04 - - - - -1-4 01 - - 01 - - - - -5-9 01 - 01 01 - - - - -10-14 01 02 01 01 01 01 - - -15-19 03 03 02 02 03 02 03 - -20-24 05 06 04 05 06 04 04 - -25-29 07 09 06 07 08 06 07 10 -30-34 10 12 08 11 12 09 08 09 0835-39 11 13 09 11 13 10 12 13 1040-44 14 18 11 14 18 11 16 22 1045-49 18 21 15 17 20 14 25 28 2350-54 22 26 17 21 26 17 23 25 2055-59 25 29 22 26 29 23 25 28 2260-64 35 43 27 35 44 27 34 41 2965-69 49 67 34 50 68 33 55 68 4570-74 65 85 48 68 89 51 49 66 3675-79 91 124 65 97 132 69 69 98 5080-84 105 147 75 112 156 80 76 92 6785+ 102 155 75 107 164 76 75 109 60
Table 1313Myeloid Leukemia
SEER Incidencea Rates Age-Adjusted and Age-Specific Rates by Race and Sex
SEE
R C
ancer Statistics Review
1975-2016N
ational Cancer Institute
a Based on End Results data from a series of hospital registries and one population-based registryb SEER 9 areas (San Francisco Connecticut Detroit Hawaii Iowa New Mexico Seattle Utah Atlanta)
Based on follow-up of patients into 2016 Expected survival rates are derived from the US Annual Life Tablesc SEER 18 areas (San Francisco Connecticut Detroit Hawaii Iowa New Mexico Seattle Utah Atlanta San Jose-Monterey
Los Angeles Alaska Native Registry Rural Georgia California excluding SFSJMLA Kentucky Louisiana New Jersey andGeorgia excluding ATLRG) Expected survival rates are derived from life tables by socio-economic status geography and racedeveloped by the SEER programBased on follow-up of patients into 2016
d Period survival provides a 2015 estimate of survival by piecing together the most recent conditional survival estimatesfrom several cohorts It is computed here using three year calendar blocks (2010-2012 0-1 year survival)(2009-2011 1-2 year survival) (2008-2010 2-3 year survival) (2007-2009 3-4 year survival) (2006-2008 4-5 years survival)
e The difference between 1975-1977 and 2009-2015 is statistically significant (plt05)f The standard error is between 5 and 10 percentage pointsg The standard error is greater than 10 percentage points- Statistic could not be calculated due to fewer than 25 cases during the time period
All Races Whites Blacks Total Males Females Total Males Females Total Males Females
5-Year Relative Survival (Percent)Year of Diagnosis1960-1963a - - - 14 - - - - -1970-1973a - - - 22 - - - - -1975-1977b 341 330 356 345 336 358 334 304 3671978-1980b 360 350 373 367 358 380 282 273 2931981-1983b 373 369 378 381 378 385 339 334 3431984-1986b 405 401 411 416 413 420 327 315 3411987-1989b 429 440 413 439 455 418 350 327 3781990-1992b 452 446 461 465 463 468 357 305 4131993-1995b 476 484 464 487 495 475 413 416 4091996-1998b 484 486 481 498 497 498 386 390 3801999-2001b 510 520 495 520 530 507 437 451 4212002-2004b 583 584 581 591 594 588 540 543 5342005-2008b 623 635 607 633 643 620 560 599 5112009-2015b 658e 673e 637e 668e 682e 649e 596e 609e 582e
5-Year Period Survival (Percent)cd
2015 632 643 619 634 640 624 582 617 544
5-Year Relative Survival (Percent) 2009-2015c
Age at DiagnosisAges lt45 762 758 768 773 764 786 677 677 677Ages 45-54 722 737 698 735 746 716 628 662 586Ages 55-64 693 699 683 704 707 698 589 605 566Ages 65-74 610 610 611 614 610 620 541 553 523Ages 75+ 421 424 417 427 428 425 337 357 316Ages lt65 729 731 725 739 738 741 637 650 621Ages 65+ 508 517 496 511 518 502 446 474 415
Table 1314Leukemia
5-Year Relative and Period Survival (Percent) by Race Sex Diagnosis Year and Age
SEE
R C
ancer Statistics Review
1975-2016N
ational Cancer Institute
a SEER 9 areas (San Francisco Connecticut Detroit Hawaii Iowa New Mexico Seattle Utah Atlanta)Based on follow-up of patients into 2016 Expected survival rates are derived from the US Annual Life Tables
b SEER 18 areas (San Francisco Connecticut Detroit Hawaii Iowa New Mexico Seattle Utah Atlanta San Jose-MontereyLos Angeles Alaska Native Registry Rural Georgia California excluding SFSJMLA Kentucky Louisiana New Jersey andGeorgia excluding ATLRG) Expected survival rates are derived from life tables by socio-economic status geography and racedeveloped by the SEER programBased on follow-up of patients into 2016
c Period survival provides a 2015 estimate of survival by piecing together the most recent conditional survival estimatesfrom several cohorts It is computed here using three year calendar blocks (2010-2012 0-1 year survival)(2009-2011 1-2 year survival) (2008-2010 2-3 year survival) (2007-2009 3-4 year survival) (2006-2008 4-5 years survival)
d The difference between 1975-1977 and 2009-2015 is statistically significant (plt05)e The standard error is between 5 and 10 percentage pointsf The standard error is greater than 10 percentage points- Statistic could not be calculated due to fewer than 25 cases during the time period
All Races Whites Blacks Total Males Females Total Males Females Total Males Females
Acute Lymphocytic Leukemia5-Year Relative Survival (Percent)Year of Diagnosis1975-1977a 406 369 456 408 374 457 335e - -1987-1989a 544 537 552 550 547 553 447e 420e 471e1990-1992a 580 545 631 577 549 620 571e 504e 633e1993-1995a 602 578 636 598 578 627 532e 459e 638e1996-1998a 655 644 669 664 643 690 556e 591e 502e1999-2001a 635 634 635 648 652 642 566e 503e 630e2002-2004a 673 661 689 676 666 691 645e 594e 697e2005-2008a 701 693 713 700 686 720 652 700 551e2009-2015a 717d 723d 710d 726d 737d 713d 625d 607 647e
5-Year Period Survival (Percent)bc2015 691 684 698 685 674 700 650 650 648
5-Year Relative Survival (Percent) 2009-2015bAge at DiagnosisAges lt45 806 795 821 807 791 828 763 757 770Ages 45-54 381 365 403 379 373 389 257e - -Ages 55-64 280 275 284 294 288 298 173e 228e -Ages 65-74 239 188 291 214 170 259 - - -Ages 75+ 91 97 83 100 96 100 00 - -Ages lt65 733 725 743 735 724 749 668 668 668Ages 65+ 174 151 196 166 141 191 154e - 189e
Chronic Lymphocytic Leukemia5-Year Relative Survival (Percent)Year of Diagnosis1975-1977a 671 647 703 679 654 711 569e 551e 590e1987-1989a 727 727 729 739 740 737 581 555e 615e1990-1992a 741 718 773 753 731 784 522 434e 609e1993-1995a 772 771 773 783 781 786 633 640e 621e1996-1998a 756 739 778 767 752 787 581 515e 660e1999-2001a 786 782 792 794 788 803 666 655e 666e2002-2004a 840 832 852 845 837 856 770 742e 807e2005-2008a 862 861 863 864 863 864 841 857 8122009-2015a 882d 887d 875d 886d 889d 883d 785d 801d 763
5-Year Period Survival (Percent)bc2015 856 855 858 853 848 860 772 818 710
5-Year Relative Survival (Percent) 2009-2015bAge at DiagnosisAges lt45 940 927 960 942 932 954 905e 879e -Ages 45-54 939 934 948 945 935 964 840 889 761eAges 55-64 922 916 933 924 916 938 836 831 843Ages 65-74 874 856 905 876 853 913 773 784 756Ages 75+ 731 727 736 729 724 734 584 586e 564eAges lt65 928 922 939 931 923 947 843 854 824Ages 65+ 801 796 807 799 792 807 691 713 662
Table 1315Lymphocytic Leukemia
5-Year Relative and Period Survival (Percent) by Race Sex Diagnosis Year and Age
SEE
R C
ancer Statistics Review
1975-2016N
ational Cancer Institute
a SEER 9 areas (San Francisco Connecticut Detroit Hawaii Iowa New Mexico Seattle Utah Atlanta)Based on follow-up of patients into 2016 Expected survival rates are derived from the US Annual Life Tables
b SEER 18 areas (San Francisco Connecticut Detroit Hawaii Iowa New Mexico Seattle Utah Atlanta San Jose-MontereyLos Angeles Alaska Native Registry Rural Georgia California excluding SFSJMLA Kentucky Louisiana New Jersey andGeorgia excluding ATLRG) Expected survival rates are derived from life tables by socio-economic status geography and racedeveloped by the SEER programBased on follow-up of patients into 2016
c Period survival provides a 2015 estimate of survival by piecing together the most recent conditional survival estimatesfrom several cohorts It is computed here using three year calendar blocks (2010-2012 0-1 year survival)(2009-2011 1-2 year survival) (2008-2010 2-3 year survival) (2007-2009 3-4 year survival) (2006-2008 4-5 years survival)
d The difference between 1975-1977 and 2009-2015 is statistically significant (plt05)e The standard error is between 5 and 10 percentage pointsf The standard error is greater than 10 percentage points- Statistic could not be calculated due to fewer than 25 cases during the time period
All Races Whites Blacks Total Males Females Total Males Females Total Males Females
Acute Myeloid Leukemia5-Year Relative Survival (Percent)Year of Diagnosis1975-1977a 62 55 70 58 54 62 101 82 1171987-1989a 115 92 141 113 97 132 92 44 157e1990-1992a 138 126 152 135 122 150 135 129 1391993-1995a 161 149 174 153 141 167 215 206e 2201996-1998a 170 159 183 156 145 171 221 252 1821999-2001a 192 188 197 187 176 199 193 248 1422002-2004a 234 209 264 232 208 260 253 265 2402005-2008a 249 235 265 242 228 257 239 193 2772009-2015a 294d 291d 298d 290d 284d 299d 292d 280d 301d
5-Year Period Survival (Percent)bc2015 286 278 294 282 276 289 283 262 301
5-Year Relative Survival (Percent) 2009-2015bAge at DiagnosisAges lt45 604 585 624 621 599 645 511 482 538Ages 45-54 441 439 444 456 450 463 337 342 336Ages 55-64 300 281 325 308 285 338 231 234 224Ages 65-74 139 137 141 145 144 146 103 78 131Ages 75+ 34 40 27 34 41 27 24 - 20Ages lt65 466 444 491 474 449 504 393 371 414Ages 65+ 79 85 72 82 89 73 64 58 71
Chronic Myeloid Leukemia5-Year Relative Survival (Percent)Year of Diagnosis1975-1977a 218 193 251 205 184 234 277e 216e 355e1987-1989a 303 306 298 301 310 290 333e 281e 413e1990-1992a 307 296 322 303 300 306 349e 255e 449e1993-1995a 355 353 358 352 351 352 356e 328e 402e1996-1998a 371 377 363 380 376 385 310 304e 314e1999-2001a 473 459 492 459 441 483 490e 496e 481e2002-2004a 543 530 561 526 514 541 630e 621e 640e2005-2008a 631 632 629 617 615 621 643 664e 608e2009-2015a 697d 681d 718d 690d 677d 707d 736d 711d 763d
5-Year Period Survival (Percent)bc2015 695 683 712 681 666 702 723 714 735
5-Year Relative Survival (Percent) 2009-2015bAge at DiagnosisAges lt45 899 889 913 916 905 934 797 786 812Ages 45-54 874 860 891 871 858 888 871 842 900Ages 55-64 776 748 816 781 750 826 698 676e 719eAges 65-74 611 579 656 609 578 654 584e 526e 637eAges 75+ 326 305 346 321 302 336 362e 362f 362eAges lt65 851 836 873 856 839 883 790 773 808Ages 65+ 462 444 484 456 441 475 495 471e 515e
Table 1316Myeloid Leukemia
5-Year Relative and Period Survival (Percent) by Race Sex Diagnosis Year and Age
SEE
R C
ancer Statistics Review
1975-2016N
ational Cancer Institute
a Based on the SEER 9 areas (San Francisco Connecticut Detroit Hawaii Iowa New Mexico Seattle Utah and Atlanta)Expected survival rates are derived from the US Annual Life Tables
1975- 1980- 1985- 1990-1979 1984 1989 1994 1995 1996 1997 1998 1999 2000 2001 2002 2003 2004 2005 2006 2007 2008 2009 2010 2011 2012 2013 2014 2015
Survival Time
1-year 608 626 648 669 681 682 679 667 659 669 706 722 732 751 742 765 769 766 774 783 794 791 790 791 8062-year 501 525 553 575 589 599 598 580 583 590 630 649 662 677 684 705 706 702 709 725 732 725 732 7343-year 437 465 496 528 543 554 549 541 547 551 590 619 624 643 647 673 676 665 684 692 703 692 6984-year 388 417 455 491 507 519 509 503 516 520 567 596 595 619 627 647 653 639 658 676 683 6735-year 346 376 423 461 481 487 483 482 484 499 543 578 575 596 610 626 637 619 635 659 6656-year 314 351 399 435 457 465 458 461 462 485 524 560 556 572 593 607 622 604 613 6477-year 291 325 371 409 442 451 438 446 444 473 510 544 537 560 579 591 614 587 6018-year 270 304 350 388 417 438 432 431 430 457 496 535 519 546 561 573 603 5769-year 250 285 330 373 406 420 418 421 421 449 483 519 507 530 546 561 59310-year 237 269 316 360 390 406 406 410 406 438 471 504 489 515 532 54511-year 224 257 299 347 378 398 387 397 392 426 459 492 473 499 52712-year 212 246 288 336 371 387 377 390 383 419 449 483 460 49213-year 204 236 280 327 367 382 370 380 372 404 442 466 45414-year 198 229 272 318 356 371 368 370 367 392 434 45615-year 192 223 267 313 353 361 362 358 359 383 42316-year 185 214 261 306 350 359 361 350 353 37417-year 181 207 256 300 340 355 352 346 34718-year 177 201 253 294 330 351 346 34319-year 171 195 248 291 326 343 34420-year 166 191 244 286 319 338
Table 1317Leukemia
SEERa Relative Survival (Percent)By Year of Diagnosis
All Races Males and Females
Year of Diagnosis
SEE
R C
ancer Statistics Review
1975-2016N
ational Cancer Institute
a Based on the SEER 9 areas (San Francisco Connecticut Detroit Hawaii Iowa New Mexico Seattle Utah and Atlanta)Expected survival rates are derived from the US Annual Life Tables
1975- 1980- 1985- 1990-1979 1984 1989 1994 1995 1996 1997 1998 1999 2000 2001 2002 2003 2004 2005 2006 2007 2008 2009 2010 2011 2012 2013 2014 2015
Survival Time
1-year 604 628 655 679 692 697 688 667 668 688 729 731 742 767 761 770 780 775 791 793 806 797 803 812 8172-year 494 524 561 583 604 616 611 585 590 608 648 652 669 687 701 706 719 716 727 740 746 733 749 7513-year 427 460 499 532 556 573 552 546 552 573 608 624 627 653 664 674 689 679 699 712 719 698 7144-year 377 411 459 494 516 535 505 505 520 539 581 598 601 627 650 648 667 650 677 690 697 6775-year 334 371 429 462 482 495 479 484 480 523 553 573 578 602 630 626 653 632 656 673 6846-year 303 343 404 435 452 471 459 461 461 508 529 554 557 575 609 602 635 615 631 6617-year 277 318 373 409 439 458 438 444 439 498 514 531 535 564 594 588 625 595 6168-year 254 294 354 385 417 446 430 430 423 478 500 520 514 549 572 563 616 5839-year 232 275 332 371 404 423 421 419 415 464 486 507 501 526 553 548 60510-year 219 260 317 358 382 407 413 410 401 454 473 490 479 511 539 52611-year 205 249 302 346 377 398 391 393 383 444 461 474 464 496 53312-year 193 242 290 334 371 390 380 384 375 437 452 467 455 49113-year 186 234 283 325 367 389 373 369 363 420 442 455 44714-year 179 227 277 315 357 379 370 358 357 410 433 44715-year 175 221 269 309 352 371 365 349 351 399 42216-year 168 212 263 303 347 369 360 341 346 38717-year 164 204 260 296 339 366 348 335 34318-year 159 199 257 290 324 364 345 33119-year 154 192 253 288 322 355 34120-year 146 187 249 283 316 347
Table 1318Leukemia
SEERa Relative Survival (Percent)By Year of Diagnosis
All Races Males
Year of Diagnosis
SEE
R C
ancer Statistics Review
1975-2016N
ational Cancer Institute
a Based on the SEER 9 areas (San Francisco Connecticut Detroit Hawaii Iowa New Mexico Seattle Utah and Atlanta)Expected survival rates are derived from the US Annual Life Tables
1975- 1980- 1985- 1990-1979 1984 1989 1994 1995 1996 1997 1998 1999 2000 2001 2002 2003 2004 2005 2006 2007 2008 2009 2010 2011 2012 2013 2014 2015
Survival Time
1-year 613 623 638 655 665 664 666 667 646 643 675 710 719 729 715 759 755 754 751 769 778 782 772 761 7912-year 509 527 542 564 569 578 580 574 573 564 606 645 653 664 660 705 689 684 684 705 714 716 709 7093-year 450 471 492 523 525 529 544 534 539 522 564 612 619 628 624 673 657 647 663 666 681 685 6774-year 402 424 449 485 495 498 514 500 511 494 548 594 587 608 595 646 633 624 633 658 664 6685-year 361 384 414 459 480 475 489 479 489 466 530 584 570 588 582 627 615 601 607 641 6396-year 328 360 392 435 464 457 456 461 463 455 516 567 556 569 572 613 602 589 588 6297-year 309 334 367 410 447 443 438 448 450 438 504 561 539 556 558 594 598 575 5798-year 290 316 344 391 416 428 433 433 438 428 490 556 526 542 546 585 582 5639-year 273 299 326 376 409 416 413 424 429 428 477 535 515 534 535 576 57610-year 259 281 315 364 399 405 396 409 414 416 468 522 502 521 521 56811-year 247 269 295 347 378 398 383 403 403 401 456 515 486 503 51812-year 235 250 285 338 372 382 373 397 393 395 445 505 468 49313-year 228 239 276 329 365 373 366 392 385 383 442 481 46314-year 220 232 267 323 355 361 363 385 380 367 434 46815-year 214 225 264 318 353 348 359 369 368 363 42416-year 206 217 258 310 353 344 359 361 363 35817-year 201 210 252 305 342 340 357 358 35018-year 198 205 248 301 336 334 347 35819-year 193 198 241 296 330 326 34620-year 190 195 238 290 321 323
Table 1319Leukemia
SEERa Relative Survival (Percent)By Year of Diagnosis
All Races Females
Year of Diagnosis
SEE
R C
ancer Statistics Review
1975-2016N
ational Cancer Institute
Devcan 677 April 2019 National Cancer Institute (httpssurveillancecancergovdevcan)Source Incidence data are from the SEER 21 areas (San Francisco Connecticut Detroit Hawaii Iowa New Mexico Seattle Utah Atlanta
San Jose-Monterey Los Angeles Alaska Native Registry Rural Georgia California excluding SFSJMLA Kentucky Louisiana New JerseyGeorgia excluding ATLRG Idaho New York and Massachusetts) Mortality data are from the NCHS public use data file for the total US
a Underlying incidence and mortality data for American IndianAlaska Native are based on the PRCDA(PurchasedReferred Care DeliveryAreas) counties
b Hispanic is not mutually exclusive from whites blacks AsianPacific Islanders and American IndiansAlaska NativesUnderlying incidence data for Hispanics are based on NHIA and exclude cases from the Alaska Native Registry
- Statistic could not be calculatedA percent of 000 represents a value that is below 0005
Risk of Being Risk of Being
Race Current Diagnosed with Cancer Risk of Dying Race Current Diagnosed with Cancer Risk of Dying
Ethnicity Age +10 yrs +20 yrs +30 yrs Ever from Cancer Ethnicity Age +10 yrs +20 yrs +30 yrs Ever from Cancer
All Races 0 006 009 012 156 082 Asian 0 005 008 011 099 058
10 003 006 010 152 082 Pacific 10 003 006 009 095 058
20 003 007 014 149 082 Islander 20 003 006 010 092 058
30 004 011 026 147 082 30 003 008 016 090 057
40 007 022 051 145 082 40 004 012 026 087 057
50 015 045 089 141 082 50 008 022 047 083 056
60 031 079 121 134 082 60 014 040 066 078 054
70 053 101 - 115 080 70 028 055 - 067 051
80 062 - - 082 068 80 032 - - 047 040
White 0 006 010 013 164 085 American 0 005 007 009 085 040
10 003 007 011 159 086 Indian 10 002 004 008 081 040
20 003 007 014 156 085 Alaska 20 002 006 010 079 039
30 004 011 027 155 085 Nativea 30 004 008 019 078 039
40 007 023 053 153 085 40 004 015 030 076 040
50 016 047 095 149 086 50 012 027 051 075 040
60 033 083 127 141 086 60 017 042 061 068 040
70 057 106 - 121 084 70 029 051 - 058 038
80 066 - - 086 071 80 029 - - 038 025
Black 0 003 006 008 107 058 Hispanicb 0 007 011 015 124 066
10 002 005 009 105 059 10 005 008 012 118 066
20 003 006 013 104 059 20 004 008 014 114 065
30 004 011 022 102 058 30 004 010 021 111 064
40 007 019 041 100 058 40 006 017 037 108 064
50 013 035 066 097 058 50 011 031 063 104 063
60 025 058 083 091 058 60 021 054 085 097 062
70 039 069 - 079 057 70 037 070 - 083 058
80 042 - - 056 048 80 042 - - 058 049
Table 1320
Leukemia
Risk of Being Diagnosed With Cancer in 10 20 and 30 Years
Lifetime Risk of Being Diagnosed with Cancer Given Alive and Cancer-Free at Current Age and
Lifetime Risk of Dying from Cancer Given Alive at Current Age
Both Sexes 2014-2016 By RaceEthnicity
SEE
R C
ancer Statistics Review
1975-2016N
ational Cancer Institute
Devcan 677 April 2019 National Cancer Institute (httpssurveillancecancergovdevcan)Source Incidence data are from the SEER 21 areas (San Francisco Connecticut Detroit Hawaii Iowa New Mexico Seattle Utah Atlanta
San Jose-Monterey Los Angeles Alaska Native Registry Rural Georgia California excluding SFSJMLA Kentucky Louisiana New JerseyGeorgia excluding ATLRG Idaho New York and Massachusetts) Mortality data are from the NCHS public use data file for the total US
a Underlying incidence and mortality data for American IndianAlaska Native are based on the PRCDA(PurchasedReferred Care DeliveryAreas) counties
b Hispanic is not mutually exclusive from whites blacks AsianPacific Islanders and American IndiansAlaska NativesUnderlying incidence data for Hispanics are based on NHIA and exclude cases from the Alaska Native Registry
- Statistic could not be calculatedA percent of 000 represents a value that is below 0005
Risk of Being Risk of Being
Race Current Diagnosed with Cancer Risk of Dying Race Current Diagnosed with Cancer Risk of Dying
Ethnicity Age +10 yrs +20 yrs +30 yrs Ever from Cancer Ethnicity Age +10 yrs +20 yrs +30 yrs Ever from Cancer
All Races 0 006 010 013 186 096 Asian 0 005 009 011 119 072
10 004 007 012 182 097 Pacific 10 004 007 010 115 072
20 003 008 016 179 097 Islander 20 003 007 012 111 071
30 005 013 030 177 097 30 004 009 019 109 071
40 008 026 062 176 098 40 005 015 033 106 070
50 018 056 112 173 099 50 010 028 062 102 069
60 040 101 152 166 101 60 019 054 084 096 068
70 071 129 - 146 101 70 038 071 - 084 065
80 082 - - 105 088 80 040 - - 056 052
White 0 007 011 014 195 101 American 0 006 009 011 110 048
10 004 008 012 190 102 Indian 10 003 005 010 105 048
20 004 008 016 187 101 Alaska 20 002 007 011 103 048
30 005 013 031 186 101 Nativea 30 005 009 021 103 048
40 009 027 065 184 102 40 005 017 041 102 049
50 019 058 118 181 103 50 013 039 075 102 051
60 042 107 160 174 106 60 028 067 087 097 051
70 075 136 - 153 105 70 046 070 - 081 049
80 087 - - 110 091 80 034 - - 049 030
Black 0 003 006 008 122 065 Hispanicb 0 007 013 017 141 080
10 003 006 009 122 066 10 005 010 015 135 080
20 003 006 014 120 065 20 005 009 016 130 079
30 004 011 025 119 066 30 005 011 023 127 078
40 008 022 048 118 066 40 007 018 040 124 078
50 015 042 079 115 067 50 012 034 072 120 078
60 031 071 102 112 068 60 024 064 100 114 078
70 051 089 - 101 068 70 046 086 - 102 077
80 058 - - 077 061 80 053 - - 074 070
Table 1321
Leukemia
Risk of Being Diagnosed With Cancer in 10 20 and 30 Years
Lifetime Risk of Being Diagnosed with Cancer Given Alive and Cancer-Free at Current Age and
Lifetime Risk of Dying from Cancer Given Alive at Current Age
Males 2014-2016 By RaceEthnicity
SEE
R C
ancer Statistics Review
1975-2016N
ational Cancer Institute
Devcan 677 April 2019 National Cancer Institute (httpssurveillancecancergovdevcan)Source Incidence data are from the SEER 21 areas (San Francisco Connecticut Detroit Hawaii Iowa New Mexico Seattle Utah Atlanta
San Jose-Monterey Los Angeles Alaska Native Registry Rural Georgia California excluding SFSJMLA Kentucky Louisiana New JerseyGeorgia excluding ATLRG Idaho New York and Massachusetts) Mortality data are from the NCHS public use data file for the total US
a Underlying incidence and mortality data for American IndianAlaska Native are based on the PRCDA(PurchasedReferred Care DeliveryAreas) counties
b Hispanic is not mutually exclusive from whites blacks AsianPacific Islanders and American IndiansAlaska NativesUnderlying incidence data for Hispanics are based on NHIA and exclude cases from the Alaska Native Registry
- Statistic could not be calculatedA percent of 000 represents a value that is below 0005
Risk of Being Risk of Being
Race Current Diagnosed with Cancer Risk of Dying Race Current Diagnosed with Cancer Risk of Dying
Ethnicity Age +10 yrs +20 yrs +30 yrs Ever from Cancer Ethnicity Age +10 yrs +20 yrs +30 yrs Ever from Cancer
All Races 0 006 008 011 129 068 Asian 0 005 008 010 083 048
10 003 005 009 125 069 Pacific 10 003 005 008 078 047
20 003 006 012 122 068 Islander 20 002 005 009 075 047
30 003 009 021 120 068 30 003 006 013 073 046
40 006 018 039 118 068 40 004 010 021 071 046
50 012 034 068 114 067 50 007 017 035 068 045
60 023 059 093 106 067 60 011 029 051 063 044
70 039 077 - 091 064 70 019 042 - 054 040
80 048 - - 066 055 80 026 - - 040 033
White 0 006 009 011 135 071 American 0 003 005 007 061 031
10 003 005 009 131 071 Indian 10 002 003 007 058 031
20 003 006 012 128 071 Alaska 20 002 005 008 056 031
30 003 010 022 126 071 Nativea 30 004 007 017 055 031
40 006 019 042 124 070 40 003 014 020 053 031
50 013 036 072 120 070 50 011 017 030 051 031
60 024 062 099 112 069 60 007 021 038 042 030
70 042 081 - 096 067 70 015 035 - 039 029
80 051 - - 069 057 80 025 - - 030 022
Black 0 004 006 008 095 053 Hispanicb 0 006 010 013 110 056
10 002 004 008 093 054 10 004 007 010 105 056
20 002 006 012 091 053 20 003 006 012 101 055
30 004 010 020 089 053 30 003 009 019 099 054
40 006 016 035 087 053 40 006 016 034 096 054
50 011 029 054 083 052 50 010 028 055 091 052
60 020 047 069 077 051 60 019 046 073 084 050
70 030 055 - 065 049 70 030 059 - 070 046
80 033 - - 046 042 80 035 - - 048 037
Table 1322
Leukemia
Risk of Being Diagnosed With Cancer in 10 20 and 30 Years
Lifetime Risk of Being Diagnosed with Cancer Given Alive and Cancer-Free at Current Age and
Lifetime Risk of Dying from Cancer Given Alive at Current Age
Females 2014-2016 By RaceEthnicity
SEER Cancer Statistics Review 1975-2016 National Cancer Institute
The AAPC is the Average Annual Percent Change over the time interval The AAPCs are calculated bythe Joinpoint Regression Program Version 47 February 2019 National Cancer Institute
- Statistic not shown Rate based on less than 16 cases for the time intervalTrend based on less than 10 cases for at least one year within the time interval
a Rates are age-adjusted to the 2000 US Std Population (19 age groups - Census P25-1130) Trendsare based on rates age-adjusted to the 2000 US Std Population (19 age groups - Census P25-1130)
b The SEER 9 areas are San Francisco Connecticut Detroit Hawaii Iowa New Mexico SeattleUtah and AtlantaThe SEER 21 areas comprise the SEER 9 areas plus San Jose-Monterey Los Angeles the AlaskaNative Registry Rural Georgia California excluding SFSJMLA Kentucky Louisiana New JerseyGeorgia excluding ATLRG Idaho New York and Massachusetts
c The 2007-2016 AAPC estimates are based on a Joinpoint analysis with up to 3 Joinpoints overdiagnosis years 2000-2016
d The 2007-2016 AAPC estimates are based on a Joinpoint analysis with up to 5 Joinpoints overdiagnosis years 1975-2016
e Hispanic and Non-Hispanic are not mutually exclusive from whites blacks AsianPacificIslanders and American IndiansAlaska Natives Incidence data for Hispanics and Non-Hispanicsare based on NHIA and exclude cases from the Alaska Native Registry
f Incidence data for American IndianAlaska Native are based on the PurchasedReferred CareDelivery Area (PRCDA) counties
g US Mortality Files National Center for Health Statistics CDCh The 2007-2016 mortality AAPCs are based on a Joinpoint analysis using years of death 2000-2016 The APC is significantly different from zero (plt05)
SEER Incidence SEER 21 Areasb SEER 21 Areasb SEER 9 Areasb
Rate 2012-2016 Trend 2007-2016c Trend 2007-2016d
Rate per 100000 persons AAPC () AAPC ()
Total Males Females Total Males Females Total Males Females RaceEthnicity
All Races 141 181 109 -04 -02 -06 -03 02 03
White 149 191 115 -05 -05 -07 04 03 05White Hispanice 112 134 94 01 -02 03 - - -White Non-Hispanice 153 197 116 -05 -05 -08 - - -
Black 109 139 89 06 02 07 01 01 02
AsianPacific Islander 78 97 63 01 00 02 - - -
Amer IndAlaska Natf 86 110 66 08 21 -01 - - -
Hispanice 108 130 91 02 00 03 - - -
US Mortalityg Rate 2012-2016 Trend 2007-2016h
Rate per 100000 persons AAPC ()
Total Males Females Total Males FemalesRaceEthnicity
All Races 65 88 49 -16 -17 -13
White 68 91 51 -14 -16 -12White Hispanice 50 63 41 -07 -08 -06White Non-Hispanice 69 93 51 -14 -15 -12
Black 55 72 44 -15 -17 -15
AsianPacific Islander 36 47 28 -18 -07 -23
Amer IndAlaska NatTotal US 31 42 23 -22 -09 -36PRCDA Counties 41 54 30 -16 -05 -28Non-PRCDA Counties 20 28 15 -31 -13 -50
Hispanice 47 60 38 -08 -09 -07
Table 1323Leukemia
SEER Incidence and US MortalityAge-Adjusted Rates and Trendsa
By RaceEthnicity and Sex
SEE
R C
ancer Statistics Review
1975-2016N
ational Cancer Institute
a Rates are per 100000 and are age-adjusted to the 2000 US Std Population (19 age groups - Census P25-1130)b The SEER 9 areas are San Francisco Connecticut Detroit Hawaii Iowa New Mexico Seattle Utah and Atlanta
The SEER 13 areas comprise the SEER 9 areas plus San Jose-Monterey Los Angeles the Alaska Native Registry and Rural GeorgiaThe SEER 18 areas comprise the SEER 13 areas plus California excluding SFSJMLA Kentucky Louisiana New Jersey and Georgiaexcluding ATLRGThe SEER 21 areas comprise the SEER 18 areas plus Idaho New York and Massachusetts
- Statistic not shown Rate based on less than 16 cases for the time interval
All Races Whites Blacks Total Males Females Total Males Females Total Males Females
SEER Incidence Ratesa 2012-2016
California 1239 1590 949 1337 1715 1020 1039 1334 813Greater Bay Area 1231 1619 915 1400 1844 1028 1098 1406 859San Francisco-Oakland 1212 1596 906 1389 1823 1034 1077 1336 881San Jose-Monterey 1259 1651 925 1410 1869 1011 1239 1787 -
Los Angeles 1173 1469 933 1291 1622 1016 1050 1294 884Greater California 1271 1633 968 1334 1709 1017 1007 1338 729
Connecticut 1406 1768 1117 1431 1790 1142 976 1126 867Detroit 1584 2050 1230 1707 2222 1300 1204 1485 1018Georgia 1430 1841 1120 1537 1970 1189 1139 1487 935Atlanta 1382 1819 1064 1563 2017 1207 1138 1557 884Rural Georgia 1411 1586 1206 1510 1773 1196 1248 - 1236Greater Georgia 1455 1863 1144 1531 1965 1182 1140 1450 968
Hawaii 1073 1339 843 1388 1612 1139 - - -Idaho 1588 1950 1263 1604 1973 1272 - - -Iowa 1627 2127 1222 1630 2133 1221 1416 1743 1076Kentucky 1566 1983 1234 1577 1995 1241 1159 1446 922Louisiana 1405 1789 1104 1518 1918 1197 1103 1393 890Massachusetts 1108 1429 854 1118 1448 856 787 1050 620New Jersey 1524 1962 1188 1541 1982 1199 1136 1469 928New Mexico 1299 1550 1086 1310 1556 1101 1045 - -New York 1623 2119 1244 1752 2281 1335 1068 1360 887Seattle-Puget Sound 1568 2020 1188 1634 2084 1249 1486 1929 1077Utah 1375 1793 1009 1401 1825 1029 - - -
SEER 9 Areasb 1419 1823 1094 1521 1945 1171 1154 1460 941SEER 13 Areasb 1357 1737 1049 1473 1882 1134 1126 1419 922SEER 18 Areasb 1376 1761 1066 1461 1867 1127 1114 1414 907SEER 21 Areasb 1407 1807 1088 1491 1912 1147 1089 1386 889
Table 1324Leukemia
Age-Adjusted SEER Incidence Ratesa
By Registry Race and Sex
SEE
R C
ancer Statistics Review
1975-2016N
ational Cancer Institute
a US Mortality Files National Center for Health Statistics Centers for Disease Control and PreventionRates are per 100000 and are age-adjusted to the 2000 US Std Population (19 age groups - Census P25-1130)
b The SEER 9 areas are San Francisco Connecticut Detroit Hawaii Iowa New Mexico Seattle Utah and AtlantaThe SEER 13 areas comprise the SEER 9 areas plus San Jose-Monterey Los Angeles the Alaska Native Registry and Rural GeorgiaThe SEER 18 areas comprise the SEER 13 areas plus California excluding SFSJMLA Kentucky Louisiana New Jersey and Georgiaexcluding ATLRGThe SEER 21 areas comprise the SEER 18 areas plus Idaho New York and Massachusetts
- Statistic not shown Rate based on less than 16 cases for the time interval
All Races Whites Blacks Total Males Females Total Males Females Total Males Females
SEER Death Ratesa 2012-2016
California 617 811 470 671 885 507 560 711 461Greater Bay Area 563 759 419 640 869 470 551 742 424San Francisco-Oakland 551 753 405 631 871 455 544 726 421San Jose-Monterey 584 768 446 653 863 495 604 - -
Los Angeles 608 797 468 675 894 513 571 717 483Greater California 639 835 489 677 886 515 553 687 458
Connecticut 622 837 465 639 862 474 536 665 449Detroit 662 915 485 691 967 494 573 723 475Georgia 614 817 467 642 855 478 538 706 438Atlanta 568 757 437 615 802 483 487 658 374Rural Georgia 581 628 538 579 635 - - - -Greater Georgia 639 851 482 654 879 477 576 745 483
Hawaii 463 593 362 543 632 440 - - -Idaho 655 846 497 661 865 492 - - -Iowa 693 961 498 700 963 508 - - -Kentucky 742 949 592 750 953 603 633 894 455Louisiana 677 906 514 705 953 520 603 776 498Massachusetts 622 830 478 647 869 490 463 524 444New Jersey 615 810 478 657 871 504 474 549 429New Mexico 560 759 400 589 794 421 - - -New York 621 842 466 675 910 506 450 602 356Seattle-Puget Sound 618 795 481 637 807 503 708 975 499Utah 679 865 526 693 876 542 - - -
SEER 9 Areasb 610 818 457 651 869 487 540 711 427SEER 13 Areasb 609 810 460 658 874 494 544 708 437SEER 18 Areasb 630 832 480 671 887 508 552 705 455SEER 21 Areasb 628 834 477 670 889 506 520 670 426
Total US 654 876 489 681 912 506 550 721 439
Table 1325Leukemia
Age-Adjusted SEER Death Ratesa
By Registry Race and Sex
SEER Cancer Statistics Review 1975-2016 National Cancer Institute
a US Mortality Files National Center for Health Statistics Centers for Disease Control andPrevention Rates are per 100000 and are age-adjusted to the 2000 US Std Population (19age groups - Census P25-1130)
b Difference between state rate and total US rate is statistically significant (plt=0002)c Absolute percent difference between state rate and total US rate is 15 or mored Rank of state level death rate and the 95 confidence intervals (low high) for the rankSE Standard error of the ratePD Percent difference between state rate and total US rate- Statistic not shown Rate based on less than 16 cases for the time interval
State Rate SE Rank(CI)d PD TOTAL US 654 002
High Five StatesOklahoma 790 019 01(0108) 2083c
West Virginia 749 025 02(0123) 1449South Dakota 747 040 03(0133) 1415Kentucky 742 018 04(0116) 1352Kansas 742 022 05(0122) 1350
Low Five StatesColorado 609 016 47(2649) -692Alaska 596 050 48(0451) -885New Mexico 560 022 49(3650) -1430DC 504 041 50(3251) -2293c
Hawaii 463 024 51(4951) -2913c
State Rate SE Rank(CI)d PD State Rate SE Rank(CI)d PD
Alabama 689 016 17(0532) 533 Montana 613 032 45(0950) -634Alaska 596 050 48(0451) -885 Nebraska 718 026 10(0131) 983Arizona 632 013 36(2248) -329 Nevada 644 021 28(1148) -157Arkansas 719 021 09(0127) 993 New Hampshire 638 029 31(0749) -238California 617 006 42(3248) -572 New Jersey 615 011 43(2849) -592Colorado 609 016 47(2649) -692 New Mexico 560 022 49(3650) -1430Connecticut 622 017 40(2249) -490 New York 621 007 41(2948) -499Delaware 664 035 24(0249) 152 North Carolina 634 011 34(2347) -310DC 504 041 50(3251) -2293c North Dakota 656 040 26(0249) 029Florida 630 007 38(2645) -370 Ohio 694 010 13(0626) 608Georgia 614 012 44(2849) -604 Oklahoma 790 019 01(0108) 2083c
Hawaii 463 024 51(4951) -2913c Oregon 632 017 37(1948) -331Idaho 655 028 27(0548) 012 Pennsylvania 680 009 21(1029) 396Illinois 684 010 19(0928) 463 Rhode Island 656 033 25(0349) 037Indiana 719 014 08(0222) 994 South Carolina 682 016 20(0634) 435Iowa 693 019 14(0334) 604 South Dakota 747 040 03(0133) 1415Kansas 742 022 05(0122) 1350 Tennessee 702 014 12(0327) 729Kentucky 742 018 04(0116) 1352 Texas 640 007 30(2342) -215Louisiana 677 017 23(0637) 356 Utah 679 024 22(0346) 387Maine 638 027 32(0949) -240 Vermont 636 041 33(0350) -277Maryland 633 014 35(2148) -323 Virginia 611 012 46(2849) -661Massachusetts 622 013 39(2548) -482 Washington 640 013 29(2047) -209Michigan 685 011 18(0829) 476 West Virginia 749 025 02(0123) 1449Minnesota 691 015 16(0430) 564 Wisconsin 727 015 06(0219) 1110Mississippi 692 021 15(0337) 580 Wyoming 721 049 07(0148) 1028Missouri 711 014 11(0324) 874
Table 1326Leukemia
Age-Adjusted Cancer Deatha Rates By State All Races 2012-2016
Males and Females
SEER Cancer Statistics Review 1975-2016 National Cancer Institute
a US Mortality Files National Center for Health Statistics Centers for Disease Control andPrevention Rates are per 100000 and are age-adjusted to the 2000 US Std Population (19age groups - Census P25-1130)
b Difference between state rate and total US rate is statistically significant (plt=0002)c Absolute percent difference between state rate and total US rate is 15 or mored Rank of state level death rate and the 95 confidence intervals (low high) for the rankSE Standard error of the ratePD Percent difference between state rate and total US rate- Statistic not shown Rate based on less than 16 cases for the time interval
State Rate SE Rank(CI)d PD TOTAL US 876 003
High Five StatesOklahoma 1022 034 01(0120) 1669c
Kansas 1018 039 02(0123) 1625c
Arkansas 991 037 03(0127) 1309South Dakota 985 068 04(0147) 1249Delaware 984 065 05(0144) 1236
Low Five StatesMontana 795 053 47(1150) -921New Mexico 759 039 48(2650) -1336Alaska 711 081 49(0851) -1887c
DC 704 078 50(1051) -1959c
Hawaii 593 040 51(4951) -3228c
State Rate SE Rank(CI)d PD State Rate SE Rank(CI)d PD
Alabama 939 029 17(0233) 725 Montana 795 053 47(1150) -921Alaska 711 081 49(0851) -1887c Nebraska 958 046 12(0141) 935Arizona 827 022 41(2449) -555 Nevada 858 037 33(0849) -210Arkansas 991 037 03(0127) 1309 New Hampshire 884 051 25(0149) 088California 811 010 43(3348) -738 New Jersey 810 020 44(2749) -747Colorado 834 028 39(2049) -484 New Mexico 759 039 48(2650) -1336Connecticut 837 031 37(1549) -441 New York 842 013 35(2546) -387Delaware 984 065 05(0144) 1236 North Carolina 863 020 31(1945) -149DC 704 078 50(1051) -1959c North Dakota 873 070 27(0150) -030Florida 839 012 36(2645) -422 Ohio 931 018 19(0529) 627Georgia 817 021 42(2649) -677 Oklahoma 1022 034 01(0120) 1669c
Hawaii 593 040 51(4951) -3228c Oregon 866 029 29(1147) -112Idaho 846 047 34(0550) -339 Pennsylvania 912 016 21(0931) 416Illinois 928 018 20(0529) 594 Rhode Island 911 059 22(0149) 400Indiana 960 025 11(0127) 959 South Carolina 951 029 13(0131) 853Iowa 961 035 08(0131) 969 South Dakota 985 068 04(0147) 1249Kansas 1018 039 02(0123) 1625c Tennessee 960 025 10(0127) 959Kentucky 949 031 15(0133) 832 Texas 870 013 28(2139) -069Louisiana 906 030 23(0442) 342 Utah 865 041 30(0549) -122Maine 803 046 46(1450) -836 Vermont 874 074 26(0150) -026Maryland 861 026 32(1447) -176 Virginia 809 021 45(2650) -770Massachusetts 830 023 40(2349) -529 Washington 835 023 38(2248) -463Michigan 937 020 18(0428) 702 West Virginia 972 044 06(0135) 1095Minnesota 948 027 16(0229) 826 Wisconsin 960 026 09(0127) 961Mississippi 970 039 07(0132) 1077 Wyoming 885 081 24(0150) 102Missouri 951 025 14(0228) 852
Table 1327Leukemia
Age-Adjusted Cancer Deatha Rates By State All Races 2012-2016
Males
SEER Cancer Statistics Review 1975-2016 National Cancer Institute
a US Mortality Files National Center for Health Statistics Centers for Disease Control andPrevention Rates are per 100000 and are age-adjusted to the 2000 US Std Population (19age groups - Census P25-1130)
b Difference between state rate and total US rate is statistically significant (plt=0002)c Absolute percent difference between state rate and total US rate is 15 or mored Rank of state level death rate and the 95 confidence intervals (low high) for the rankSE Standard error of the ratePD Percent difference between state rate and total US rate- Statistic not shown Rate based on less than 16 cases for the time interval
State Rate SE Rank(CI)d PD TOTAL US 489 002
High Five StatesOklahoma 615 023 01(0108) 2584c
Wyoming 596 060 02(0147) 2194c
Kentucky 592 021 03(0111) 2126c
West Virginia 576 030 04(0126) 1792c
South Dakota 564 047 05(0145) 1551c
Low Five StatesColorado 441 018 47(2250) -972Delaware 428 037 48(0751) -1247New Mexico 400 025 49(3151) -1803c
DC 381 046 50(1251) -2203c
Hawaii 362 029 51(4151) -2598c
State Rate SE Rank(CI)d PD State Rate SE Rank(CI)d PD
Alabama 512 019 18(0440) 483 Montana 452 037 43(0551) -745Alaska 485 062 27(0151) -073 Nebraska 531 030 10(0144) 864Arizona 473 015 31(1347) -308 Nevada 455 025 42(1150) -695Arkansas 516 024 15(0344) 554 New Hampshire 449 033 45(0651) -807California 470 007 34(2345) -383 New Jersey 478 013 30(1346) -223Colorado 441 018 47(2250) -972 New Mexico 400 025 49(3151) -1803c
Connecticut 465 020 40(1249) -487 New York 466 009 38(2246) -456Delaware 428 037 48(0751) -1247 North Carolina 471 012 32(1747) -350DC 381 046 50(1251) -2203c North Dakota 479 046 28(0151) -189Florida 460 008 41(2647) -582 Ohio 520 012 12(0529) 653Georgia 467 013 37(1747) -433 Oklahoma 615 023 01(0108) 2584c
Hawaii 362 029 51(4151) -2598c Oregon 449 019 44(1850) -799Idaho 497 033 22(0249) 174 Pennsylvania 516 011 14(0629) 556Illinois 514 011 16(0631) 526 Rhode Island 471 037 33(0351) -363Indiana 540 017 07(0226) 1052 South Carolina 495 018 23(0645) 133Iowa 498 022 20(0547) 200 South Dakota 564 047 05(0145) 1551c
Kansas 539 025 08(0137) 1032 Tennessee 517 016 13(0435) 590Kentucky 592 021 03(0111) 2126c Texas 467 008 36(2246) -431Louisiana 514 020 17(0442) 520 Utah 526 029 11(0146) 778Maine 508 032 19(0248) 403 Vermont 444 045 46(0351) -906Maryland 470 016 35(1448) -389 Virginia 465 014 39(1848) -474Massachusetts 478 015 29(1247) -220 Washington 487 016 25(0946) -022Michigan 498 013 21(0939) 192 West Virginia 576 030 04(0126) 1792c
Minnesota 494 017 24(0745) 121 Wisconsin 545 017 06(0225) 1162Mississippi 485 023 26(0548) -067 Wyoming 596 060 02(0147) 2194c
Missouri 535 017 09(0327) 953
Table 1328Leukemia
Age-Adjusted Cancer Deatha Rates By State All Races 2012-2016
Females
SEE
R C
ancer Statistics Review
1975-2016N
ational Cancer Institute
a US 2016 cancer prevalence counts are based on 2016 cancer prevalence proportions from the SEER 13 Areas (excluding the AlaskaNative Registry) and 112016 US population estimates based on the average of 2015 and 2016 population estimates from theUS Bureau of the CensusPrevalence was calculated using the first invasive tumor for each cancer site diagnosed during the previous 24 years
b Maximum limited-duration prevalence is 24 years for 1992-2016 datac Percentages are age-adjusted to the 2000 US Standard Population (19 age groups - Census P25-1130) by 5-year age groupsd Cases diagnosed more than 24 years ago were estimated using the completeness index method (Capocaccia et al 1997
Merrill et al 2000)e Complete prevalence is obtained by summing 0 to lt24 and gt=24- Statistic not shown Statistic based on fewer than 5 cases estimated alive in SEER for the time interval+ Not available
Years Since Diagnosis 0 to lt5 5 to lt10 10 to lt15 15 to lt20 20 to lt24 0 to lt24b gt=24d Completee
Race Sex All Races Both Sexes 153253 100309 63581 38012 21353 376508 38265 414773
Males 90192 57683 36029 21220 12020 217145 18411 235556Females 63061 42625 27552 16792 9333 159363 19854 179217
White Both Sexes 132173 87961 56051 33596 19035 328814 32999 370135Males 78368 50894 32033 18770 10845 190910 15102 210930Females 53805 37067 24018 14826 8190 137905 17897 159205
Black Both Sexes 12734 6564 4233 2487 1259 27277 4070 31347Males 6847 3556 2204 1334 637 14578 1776 16354Females 5887 3008 2029 1153 622 12699 2294 14992
Asian Both Sexes 3926 2561 1778 1164 690 10120 + +Pacific Males 2235 1462 936 646 351 5630 + +Islander Females 1691 1100 842 519 339 4490 + +
Hispanic Both Sexes 14464 9581 6796 4462 2630 37933 + +Males 8166 5374 3794 2408 1538 21280 + +Females 6298 4207 3002 2055 1092 16654 + +
Age Specific (Crude) Age-Adjustedc Age at Prevalence All Ages 0-9 10-19 20-29 30-39 40-49 50-59 60-69 70-79 80+ All Ages
Race Sex All Races Both Sexes 01168 00328 00640 00628 00377 00561 01053 02263 04023 05111 01054
Males 01369 00339 00706 00685 00419 00657 01287 02888 05282 07048 01306Females 00974 00317 00572 00570 00333 00466 00829 01696 02974 03919 00844
White Both Sexes 01304 00369 00715 00712 00410 00584 01106 02389 04249 05386 01127Males 01528 00379 00789 00771 00457 00682 01349 03042 05558 07387 01389Females 01084 00359 00637 00650 00362 00484 00869 01784 03135 04133 00904
Black Both Sexes 00605 00145 00322 00320 00267 00463 00752 01455 02470 03076 00660Males 00674 00142 00357 00338 00281 00530 00919 01737 03249 04580 00816Females 00541 00148 00286 00301 00255 00402 00605 01230 01927 02334 00552
Asian Both Sexes 00497 00264 00531 00426 00230 00390 00553 00882 01245 01389 00513Pacific Males 00577 00298 00555 00507 00249 00461 00665 01122 01552 01904 00613Islander Females 00423 00228 00507 00345 00212 00327 00456 00688 00999 01057 00430
Hispanic Both Sexes 00664 00375 00737 00728 00395 00485 00723 01191 01987 02074 00746Males 00737 00397 00827 00807 00471 00576 00831 01350 02221 02551 00854Females 00589 00352 00642 00641 00312 00391 00617 01050 01809 01780 00647
Table 1329Leukemia
Estimated United States Cancer Prevalence Countsa on January 1 2016By RaceEthnicity Sex and Years Since Diagnosis
Estimated prevalence percenta on January 1 2016 of the SEER population diagnosed in the previous 24 yearsBy Age at Prevalence RaceEthnicity and Sex
SEE
R C
ancer Statistics Review
1975-2016N
ational Cancer Institute
a US 2016 cancer prevalence counts are based on 2016 cancer prevalence proportions from the SEER 13 Areas (excluding the AlaskaNative Registry) and 112016 US population estimates based on the average of 2015 and 2016 population estimates from theUS Bureau of the CensusPrevalence was calculated using the first invasive tumor for each cancer site diagnosed during the previous 24 years
b Maximum limited-duration prevalence is 24 years for 1992-2016 datac Percentages are age-adjusted to the 2000 US Standard Population (19 age groups - Census P25-1130) by 5-year age groupsd Cases diagnosed more than 24 years ago were estimated using the completeness index method (Capocaccia et al 1997
Merrill et al 2000)e Complete prevalence is obtained by summing 0 to lt24 and gt=24- Statistic not shown Statistic based on fewer than 5 cases estimated alive in SEER for the time interval+ Not available
Years Since Diagnosis 0 to lt5 5 to lt10 10 to lt15 15 to lt20 20 to lt24 0 to lt24b gt=24d Completee
Race Sex All Races Both Sexes 20277 16033 13721 12074 8203 70308 25456 95764
Males 11203 9049 7751 6542 4634 39179 12997 52176Females 9074 6984 5971 5531 3568 31129 12460 43589
White Both Sexes 17123 13855 11870 10663 7154 60665 21823 83282Males 9549 7741 6768 5696 4084 33839 11286 45559Females 7573 6114 5102 4967 3070 26826 10537 37723
Black Both Sexes 1590 1133 923 727 553 4926 1609 6535Males 809 734 473 411 290 2716 592 3308Females 781 399 450 317 263 2210 1017 3227
Asian Both Sexes 998 720 669 486 361 3234 + +Pacific Males 527 406 369 313 178 1793 + +Islander Females 472 314 300 173 183 1441 + +
Hispanic Both Sexes 5905 4543 3352 2717 1749 18266 + +Males 3302 2686 1899 1465 1058 10409 + +Females 2603 1857 1454 1252 692 7857 + +
Age Specific (Crude) Age-Adjustedc Age at Prevalence All Ages 0-9 10-19 20-29 30-39 40-49 50-59 60-69 70-79 80+ All Ages
Race Sex All Races Both Sexes 00218 00276 00541 00467 00139 00078 00059 00065 00053 00033 00228
Males 00247 00286 00591 00520 00163 00095 00066 00069 00056 00035 00251Females 00190 00266 00488 00410 00115 00062 00053 00062 00050 00032 00204
White Both Sexes 00241 00315 00612 00542 00161 00086 00063 00070 00056 00033 00259Males 00271 00323 00670 00598 00186 00107 00069 00074 00060 00032 00284Females 00211 00306 00551 00482 00135 00064 00057 00066 00053 00033 00232
Black Both Sexes 00109 00107 00250 00197 00067 00042 00039 00029 00012 00027 00102Males 00126 00112 00281 00224 00079 00035 00052 00026 00012 00027 00112Females 00094 00102 00219 00171 00056 00047 00028 00032 00013 00027 00092
Asian Both Sexes 00159 00208 00418 00289 00071 00064 00045 00050 00054 00036 00163Pacific Males 00184 00226 00427 00360 00086 00069 00055 00054 00033 00055 00180Islander Females 00136 00190 00408 00219 00058 00059 00036 00047 00071 00023 00146
Hispanic Both Sexes 00320 00328 00637 00574 00165 00107 00093 00100 00084 00012 00279Males 00361 00342 00710 00648 00205 00131 00110 00063 00072 - 00309Females 00278 00312 00562 00494 00122 00082 00077 00133 00093 00020 00246
Table 1330Acute Lymphocytic Leukemia
Estimated United States Cancer Prevalence Countsa on January 1 2016By RaceEthnicity Sex and Years Since Diagnosis
Estimated prevalence percenta on January 1 2016 of the SEER population diagnosed in the previous 24 yearsBy Age at Prevalence RaceEthnicity and Sex
0
5
10
15
20
25
1975 1985 1995 2005 20160
5
10
15
20
25
1975 1985 1995 2005 20160
3
6
9
12
15
1975 1985 1995 2005 20160
3
6
9
12
15
1975 1985 1995 2005 2016
Delay-Adj IncidenceDelay-Adj Incidence
Observed IncidenceObserved Incidence
MortalityMortality
SEER Observed Incidence SEER Delay Adjusted Incidence and US Death RatesLeukemia by Race and Sex
a
Figure 131
Source SEER 9 areas and US Mortality Files (National Center for Health Statistics CDC)Rates are age-adjusted to the 2000 US Std Population (19 age groups - Census P25-1103)Regression lines and APCs are calculated using the Joinpoint Regression Program Version 47 February 2019 National Cancer InstituteThe APC is the Annual Percent Change for the regression line segments The APC shown on the graph is for the most recent trendThe APC is significantly different from zero (p lt 005)
a
White Male Black Male White Female Black FemaleRate per 100000 Rate per 100000 Rate per 100000 Rate per 100000
Year of DiagnosisDeath Year of DiagnosisDeath Year of DiagnosisDeath Year of DiagnosisDeath
SEER Incidence APCsDelay Adj 1998-16 = 08Observed 1975-16 = 03
US Mortality APC2013-16 = -30
SEER Incidence APCsDelay Adj 1975-16 = 02Observed 1975-16 = 01
US Mortality APC1993-16 = -15
SEER Incidence APCsDelay Adj 1975-16 = 06Observed 1975-16 = 05
US Mortality APC2000-16 = -12
SEER Incidence APCsDelay Adj 1975-16 = 03Observed 1975-16 = 02
US Mortality APC1993-16 = -13
SEE
R C
ancer Statistics Review
1975-2016N
ational Cancer Institute
0
1
2
3
4
5
6
7
8
1975 1985 1995 2005 20160
1
2
3
4
5
6
7
8
1975 1985 1995 2005 20160
1
2
3
4
5
6
7
8
1975 1985 1995 2005 20160
1
2
3
4
5
6
7
8
1975 1985 1995 2005 2016
Chronic
Acute
SEER Observed Incidence RatesLymphocytic and Myeloid Leukemia (Acute and Chronic) by Sex
a
Figure 132
Source SEER 9 areas Rates are age-adjusted to the 2000 US Std Population (19 age groups - Census P25-1103)Regression lines and APCs are calculated using the Joinpoint Regression Program Version 47 February 2019 National Cancer Institute
a
Male Female Male FemaleLymphocytic Leukemia Myeloid Leukemia
Rate per 100000 Rate per 100000 Rate per 100000 Rate per 100000
Year of Diagnosis Year of Diagnosis Year of Diagnosis Year of Diagnosis
SEE
R C
ancer Statistics Review
1975-2016N
ational Cancer Institute
Joinpoint Analyses for Whites and Blacks from 1975-2016and for AsianPacific Islanders American IndiansAlaska Natives and Hispanics from 2000-2016
0
5
10
15
20
1975 1985 1995 2005 20160
5
10
15
20
1975 1985 1995 2005 2016
White
Black
API
AIAN
Hispanic
SEER Incidence and US Death RatesLeukemia Both Sexes
Figure 133
Source Incidence data for whites and blacks are from the SEER 9 areas (San Francisco Connecticut Detroit Hawaii Iowa New Mexico Seattle Utah Atlanta)Incidence data for AsianPacific Islanders American IndiansAlaska Natives and Hispanics are from the SEER 21 areas (SEER 9 areas San Jose-MontereyLos Angeles Alaska Native Registry Rural Georgia California excluding SFSJMLA Kentucky Louisiana New Jersey Georgia excluding ATLRG Idaho New York andMassachusetts)Mortality data are from US Mortality Files National Center for Health Statistics CDCRates are age-adjusted to the 2000 US Std Population (19 age groups - Census P25-1103)Regression lines are calculated using the Joinpoint Regression Program Version 47 February 2019 National Cancer Institute Joinpoint analyses for Whites andBlacks during the 1975-2016 period allow a maximum of 5 joinpoints Analyses for other ethnic groups during the period 2000-2016 allow a maximum of 3 joinpointsAPI = AsianPacific IslanderAIAN = American IndianAlaska Native Rates for American IndianAlaska Native are based on the PurchasedReferred Care Delivery Area (PRCDA) countiesHispanic is not mutually exclusive from whites blacks AsianPacific Islanders and American IndiansAlaska Natives Incidence data for Hispanics are based onNHIA and exclude cases from the Alaska Native Registry
Incidence MortalityRate per 100000 Rate per 100000
Year of Diagnosis Year of Death
a
d
a
b
c
c
b
d
SEE
R C
ancer Statistics Review
1975-2016N
ational Cancer Institute
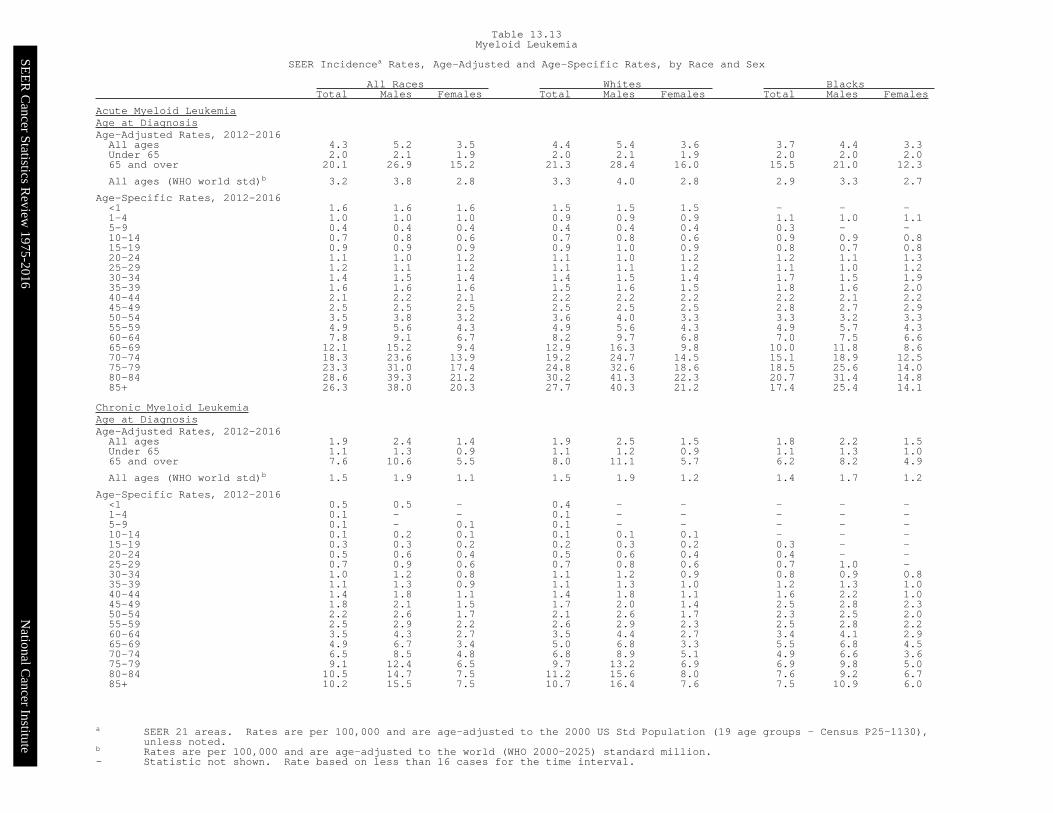
SEE
R C
ancer Statistics Review
1975-2016N
ational Cancer Institute
a SEER 21 areas Rates are per 100000 and are age-adjusted to the 2000 US Std Population (19 age groups - Census P25-1130)unless noted
b Rates are per 100000 and are age-adjusted to the world (WHO 2000-2025) standard million- Statistic not shown Rate based on less than 16 cases for the time interval
All Races Whites Blacks Total Males Females Total Males Females Total Males Females
Acute Myeloid LeukemiaAge at DiagnosisAge-Adjusted Rates 2012-2016All ages 43 52 35 44 54 36 37 44 33Under 65 20 21 19 20 21 19 20 20 2065 and over 201 269 152 213 284 160 155 210 123
All ages (WHO world std)b 32 38 28 33 40 28 29 33 27
Age-Specific Rates 2012-2016lt1 16 16 16 15 15 15 - - -1-4 10 10 10 09 09 09 11 10 115-9 04 04 04 04 04 04 03 - -10-14 07 08 06 07 08 06 09 09 0815-19 09 09 09 09 10 09 08 07 0820-24 11 10 12 11 10 12 12 11 1325-29 12 11 12 11 11 12 11 10 1230-34 14 15 14 14 15 14 17 15 1935-39 16 16 16 15 16 15 18 16 2040-44 21 22 21 22 22 22 22 21 2245-49 25 25 25 25 25 25 28 27 2950-54 35 38 32 36 40 33 33 32 3355-59 49 56 43 49 56 43 49 57 4360-64 78 91 67 82 97 68 70 75 6665-69 121 152 94 129 163 98 100 118 8670-74 183 236 139 192 247 145 151 189 12575-79 233 310 174 248 326 186 185 256 14080-84 286 393 212 302 413 223 207 314 14885+ 263 380 203 277 403 212 174 254 141
Chronic Myeloid LeukemiaAge at DiagnosisAge-Adjusted Rates 2012-2016All ages 19 24 14 19 25 15 18 22 15Under 65 11 13 09 11 12 09 11 13 1065 and over 76 106 55 80 111 57 62 82 49
All ages (WHO world std)b 15 19 11 15 19 12 14 17 12
Age-Specific Rates 2012-2016lt1 05 05 - 04 - - - - -1-4 01 - - 01 - - - - -5-9 01 - 01 01 - - - - -10-14 01 02 01 01 01 01 - - -15-19 03 03 02 02 03 02 03 - -20-24 05 06 04 05 06 04 04 - -25-29 07 09 06 07 08 06 07 10 -30-34 10 12 08 11 12 09 08 09 0835-39 11 13 09 11 13 10 12 13 1040-44 14 18 11 14 18 11 16 22 1045-49 18 21 15 17 20 14 25 28 2350-54 22 26 17 21 26 17 23 25 2055-59 25 29 22 26 29 23 25 28 2260-64 35 43 27 35 44 27 34 41 2965-69 49 67 34 50 68 33 55 68 4570-74 65 85 48 68 89 51 49 66 3675-79 91 124 65 97 132 69 69 98 5080-84 105 147 75 112 156 80 76 92 6785+ 102 155 75 107 164 76 75 109 60
Table 1313Myeloid Leukemia
SEER Incidencea Rates Age-Adjusted and Age-Specific Rates by Race and Sex
SEE
R C
ancer Statistics Review
1975-2016N
ational Cancer Institute
a Based on End Results data from a series of hospital registries and one population-based registryb SEER 9 areas (San Francisco Connecticut Detroit Hawaii Iowa New Mexico Seattle Utah Atlanta)
Based on follow-up of patients into 2016 Expected survival rates are derived from the US Annual Life Tablesc SEER 18 areas (San Francisco Connecticut Detroit Hawaii Iowa New Mexico Seattle Utah Atlanta San Jose-Monterey
Los Angeles Alaska Native Registry Rural Georgia California excluding SFSJMLA Kentucky Louisiana New Jersey andGeorgia excluding ATLRG) Expected survival rates are derived from life tables by socio-economic status geography and racedeveloped by the SEER programBased on follow-up of patients into 2016
d Period survival provides a 2015 estimate of survival by piecing together the most recent conditional survival estimatesfrom several cohorts It is computed here using three year calendar blocks (2010-2012 0-1 year survival)(2009-2011 1-2 year survival) (2008-2010 2-3 year survival) (2007-2009 3-4 year survival) (2006-2008 4-5 years survival)
e The difference between 1975-1977 and 2009-2015 is statistically significant (plt05)f The standard error is between 5 and 10 percentage pointsg The standard error is greater than 10 percentage points- Statistic could not be calculated due to fewer than 25 cases during the time period
All Races Whites Blacks Total Males Females Total Males Females Total Males Females
5-Year Relative Survival (Percent)Year of Diagnosis1960-1963a - - - 14 - - - - -1970-1973a - - - 22 - - - - -1975-1977b 341 330 356 345 336 358 334 304 3671978-1980b 360 350 373 367 358 380 282 273 2931981-1983b 373 369 378 381 378 385 339 334 3431984-1986b 405 401 411 416 413 420 327 315 3411987-1989b 429 440 413 439 455 418 350 327 3781990-1992b 452 446 461 465 463 468 357 305 4131993-1995b 476 484 464 487 495 475 413 416 4091996-1998b 484 486 481 498 497 498 386 390 3801999-2001b 510 520 495 520 530 507 437 451 4212002-2004b 583 584 581 591 594 588 540 543 5342005-2008b 623 635 607 633 643 620 560 599 5112009-2015b 658e 673e 637e 668e 682e 649e 596e 609e 582e
5-Year Period Survival (Percent)cd
2015 632 643 619 634 640 624 582 617 544
5-Year Relative Survival (Percent) 2009-2015c
Age at DiagnosisAges lt45 762 758 768 773 764 786 677 677 677Ages 45-54 722 737 698 735 746 716 628 662 586Ages 55-64 693 699 683 704 707 698 589 605 566Ages 65-74 610 610 611 614 610 620 541 553 523Ages 75+ 421 424 417 427 428 425 337 357 316Ages lt65 729 731 725 739 738 741 637 650 621Ages 65+ 508 517 496 511 518 502 446 474 415
Table 1314Leukemia
5-Year Relative and Period Survival (Percent) by Race Sex Diagnosis Year and Age
SEE
R C
ancer Statistics Review
1975-2016N
ational Cancer Institute
a SEER 9 areas (San Francisco Connecticut Detroit Hawaii Iowa New Mexico Seattle Utah Atlanta)Based on follow-up of patients into 2016 Expected survival rates are derived from the US Annual Life Tables
b SEER 18 areas (San Francisco Connecticut Detroit Hawaii Iowa New Mexico Seattle Utah Atlanta San Jose-MontereyLos Angeles Alaska Native Registry Rural Georgia California excluding SFSJMLA Kentucky Louisiana New Jersey andGeorgia excluding ATLRG) Expected survival rates are derived from life tables by socio-economic status geography and racedeveloped by the SEER programBased on follow-up of patients into 2016
c Period survival provides a 2015 estimate of survival by piecing together the most recent conditional survival estimatesfrom several cohorts It is computed here using three year calendar blocks (2010-2012 0-1 year survival)(2009-2011 1-2 year survival) (2008-2010 2-3 year survival) (2007-2009 3-4 year survival) (2006-2008 4-5 years survival)
d The difference between 1975-1977 and 2009-2015 is statistically significant (plt05)e The standard error is between 5 and 10 percentage pointsf The standard error is greater than 10 percentage points- Statistic could not be calculated due to fewer than 25 cases during the time period
All Races Whites Blacks Total Males Females Total Males Females Total Males Females
Acute Lymphocytic Leukemia5-Year Relative Survival (Percent)Year of Diagnosis1975-1977a 406 369 456 408 374 457 335e - -1987-1989a 544 537 552 550 547 553 447e 420e 471e1990-1992a 580 545 631 577 549 620 571e 504e 633e1993-1995a 602 578 636 598 578 627 532e 459e 638e1996-1998a 655 644 669 664 643 690 556e 591e 502e1999-2001a 635 634 635 648 652 642 566e 503e 630e2002-2004a 673 661 689 676 666 691 645e 594e 697e2005-2008a 701 693 713 700 686 720 652 700 551e2009-2015a 717d 723d 710d 726d 737d 713d 625d 607 647e
5-Year Period Survival (Percent)bc2015 691 684 698 685 674 700 650 650 648
5-Year Relative Survival (Percent) 2009-2015bAge at DiagnosisAges lt45 806 795 821 807 791 828 763 757 770Ages 45-54 381 365 403 379 373 389 257e - -Ages 55-64 280 275 284 294 288 298 173e 228e -Ages 65-74 239 188 291 214 170 259 - - -Ages 75+ 91 97 83 100 96 100 00 - -Ages lt65 733 725 743 735 724 749 668 668 668Ages 65+ 174 151 196 166 141 191 154e - 189e
Chronic Lymphocytic Leukemia5-Year Relative Survival (Percent)Year of Diagnosis1975-1977a 671 647 703 679 654 711 569e 551e 590e1987-1989a 727 727 729 739 740 737 581 555e 615e1990-1992a 741 718 773 753 731 784 522 434e 609e1993-1995a 772 771 773 783 781 786 633 640e 621e1996-1998a 756 739 778 767 752 787 581 515e 660e1999-2001a 786 782 792 794 788 803 666 655e 666e2002-2004a 840 832 852 845 837 856 770 742e 807e2005-2008a 862 861 863 864 863 864 841 857 8122009-2015a 882d 887d 875d 886d 889d 883d 785d 801d 763
5-Year Period Survival (Percent)bc2015 856 855 858 853 848 860 772 818 710
5-Year Relative Survival (Percent) 2009-2015bAge at DiagnosisAges lt45 940 927 960 942 932 954 905e 879e -Ages 45-54 939 934 948 945 935 964 840 889 761eAges 55-64 922 916 933 924 916 938 836 831 843Ages 65-74 874 856 905 876 853 913 773 784 756Ages 75+ 731 727 736 729 724 734 584 586e 564eAges lt65 928 922 939 931 923 947 843 854 824Ages 65+ 801 796 807 799 792 807 691 713 662
Table 1315Lymphocytic Leukemia
5-Year Relative and Period Survival (Percent) by Race Sex Diagnosis Year and Age
SEE
R C
ancer Statistics Review
1975-2016N
ational Cancer Institute
a SEER 9 areas (San Francisco Connecticut Detroit Hawaii Iowa New Mexico Seattle Utah Atlanta)Based on follow-up of patients into 2016 Expected survival rates are derived from the US Annual Life Tables
b SEER 18 areas (San Francisco Connecticut Detroit Hawaii Iowa New Mexico Seattle Utah Atlanta San Jose-MontereyLos Angeles Alaska Native Registry Rural Georgia California excluding SFSJMLA Kentucky Louisiana New Jersey andGeorgia excluding ATLRG) Expected survival rates are derived from life tables by socio-economic status geography and racedeveloped by the SEER programBased on follow-up of patients into 2016
c Period survival provides a 2015 estimate of survival by piecing together the most recent conditional survival estimatesfrom several cohorts It is computed here using three year calendar blocks (2010-2012 0-1 year survival)(2009-2011 1-2 year survival) (2008-2010 2-3 year survival) (2007-2009 3-4 year survival) (2006-2008 4-5 years survival)
d The difference between 1975-1977 and 2009-2015 is statistically significant (plt05)e The standard error is between 5 and 10 percentage pointsf The standard error is greater than 10 percentage points- Statistic could not be calculated due to fewer than 25 cases during the time period
All Races Whites Blacks Total Males Females Total Males Females Total Males Females
Acute Myeloid Leukemia5-Year Relative Survival (Percent)Year of Diagnosis1975-1977a 62 55 70 58 54 62 101 82 1171987-1989a 115 92 141 113 97 132 92 44 157e1990-1992a 138 126 152 135 122 150 135 129 1391993-1995a 161 149 174 153 141 167 215 206e 2201996-1998a 170 159 183 156 145 171 221 252 1821999-2001a 192 188 197 187 176 199 193 248 1422002-2004a 234 209 264 232 208 260 253 265 2402005-2008a 249 235 265 242 228 257 239 193 2772009-2015a 294d 291d 298d 290d 284d 299d 292d 280d 301d
5-Year Period Survival (Percent)bc2015 286 278 294 282 276 289 283 262 301
5-Year Relative Survival (Percent) 2009-2015bAge at DiagnosisAges lt45 604 585 624 621 599 645 511 482 538Ages 45-54 441 439 444 456 450 463 337 342 336Ages 55-64 300 281 325 308 285 338 231 234 224Ages 65-74 139 137 141 145 144 146 103 78 131Ages 75+ 34 40 27 34 41 27 24 - 20Ages lt65 466 444 491 474 449 504 393 371 414Ages 65+ 79 85 72 82 89 73 64 58 71
Chronic Myeloid Leukemia5-Year Relative Survival (Percent)Year of Diagnosis1975-1977a 218 193 251 205 184 234 277e 216e 355e1987-1989a 303 306 298 301 310 290 333e 281e 413e1990-1992a 307 296 322 303 300 306 349e 255e 449e1993-1995a 355 353 358 352 351 352 356e 328e 402e1996-1998a 371 377 363 380 376 385 310 304e 314e1999-2001a 473 459 492 459 441 483 490e 496e 481e2002-2004a 543 530 561 526 514 541 630e 621e 640e2005-2008a 631 632 629 617 615 621 643 664e 608e2009-2015a 697d 681d 718d 690d 677d 707d 736d 711d 763d
5-Year Period Survival (Percent)bc2015 695 683 712 681 666 702 723 714 735
5-Year Relative Survival (Percent) 2009-2015bAge at DiagnosisAges lt45 899 889 913 916 905 934 797 786 812Ages 45-54 874 860 891 871 858 888 871 842 900Ages 55-64 776 748 816 781 750 826 698 676e 719eAges 65-74 611 579 656 609 578 654 584e 526e 637eAges 75+ 326 305 346 321 302 336 362e 362f 362eAges lt65 851 836 873 856 839 883 790 773 808Ages 65+ 462 444 484 456 441 475 495 471e 515e
Table 1316Myeloid Leukemia
5-Year Relative and Period Survival (Percent) by Race Sex Diagnosis Year and Age
SEE
R C
ancer Statistics Review
1975-2016N
ational Cancer Institute
a Based on the SEER 9 areas (San Francisco Connecticut Detroit Hawaii Iowa New Mexico Seattle Utah and Atlanta)Expected survival rates are derived from the US Annual Life Tables
1975- 1980- 1985- 1990-1979 1984 1989 1994 1995 1996 1997 1998 1999 2000 2001 2002 2003 2004 2005 2006 2007 2008 2009 2010 2011 2012 2013 2014 2015
Survival Time
1-year 608 626 648 669 681 682 679 667 659 669 706 722 732 751 742 765 769 766 774 783 794 791 790 791 8062-year 501 525 553 575 589 599 598 580 583 590 630 649 662 677 684 705 706 702 709 725 732 725 732 7343-year 437 465 496 528 543 554 549 541 547 551 590 619 624 643 647 673 676 665 684 692 703 692 6984-year 388 417 455 491 507 519 509 503 516 520 567 596 595 619 627 647 653 639 658 676 683 6735-year 346 376 423 461 481 487 483 482 484 499 543 578 575 596 610 626 637 619 635 659 6656-year 314 351 399 435 457 465 458 461 462 485 524 560 556 572 593 607 622 604 613 6477-year 291 325 371 409 442 451 438 446 444 473 510 544 537 560 579 591 614 587 6018-year 270 304 350 388 417 438 432 431 430 457 496 535 519 546 561 573 603 5769-year 250 285 330 373 406 420 418 421 421 449 483 519 507 530 546 561 59310-year 237 269 316 360 390 406 406 410 406 438 471 504 489 515 532 54511-year 224 257 299 347 378 398 387 397 392 426 459 492 473 499 52712-year 212 246 288 336 371 387 377 390 383 419 449 483 460 49213-year 204 236 280 327 367 382 370 380 372 404 442 466 45414-year 198 229 272 318 356 371 368 370 367 392 434 45615-year 192 223 267 313 353 361 362 358 359 383 42316-year 185 214 261 306 350 359 361 350 353 37417-year 181 207 256 300 340 355 352 346 34718-year 177 201 253 294 330 351 346 34319-year 171 195 248 291 326 343 34420-year 166 191 244 286 319 338
Table 1317Leukemia
SEERa Relative Survival (Percent)By Year of Diagnosis
All Races Males and Females
Year of Diagnosis
SEE
R C
ancer Statistics Review
1975-2016N
ational Cancer Institute
a Based on the SEER 9 areas (San Francisco Connecticut Detroit Hawaii Iowa New Mexico Seattle Utah and Atlanta)Expected survival rates are derived from the US Annual Life Tables
1975- 1980- 1985- 1990-1979 1984 1989 1994 1995 1996 1997 1998 1999 2000 2001 2002 2003 2004 2005 2006 2007 2008 2009 2010 2011 2012 2013 2014 2015
Survival Time
1-year 604 628 655 679 692 697 688 667 668 688 729 731 742 767 761 770 780 775 791 793 806 797 803 812 8172-year 494 524 561 583 604 616 611 585 590 608 648 652 669 687 701 706 719 716 727 740 746 733 749 7513-year 427 460 499 532 556 573 552 546 552 573 608 624 627 653 664 674 689 679 699 712 719 698 7144-year 377 411 459 494 516 535 505 505 520 539 581 598 601 627 650 648 667 650 677 690 697 6775-year 334 371 429 462 482 495 479 484 480 523 553 573 578 602 630 626 653 632 656 673 6846-year 303 343 404 435 452 471 459 461 461 508 529 554 557 575 609 602 635 615 631 6617-year 277 318 373 409 439 458 438 444 439 498 514 531 535 564 594 588 625 595 6168-year 254 294 354 385 417 446 430 430 423 478 500 520 514 549 572 563 616 5839-year 232 275 332 371 404 423 421 419 415 464 486 507 501 526 553 548 60510-year 219 260 317 358 382 407 413 410 401 454 473 490 479 511 539 52611-year 205 249 302 346 377 398 391 393 383 444 461 474 464 496 53312-year 193 242 290 334 371 390 380 384 375 437 452 467 455 49113-year 186 234 283 325 367 389 373 369 363 420 442 455 44714-year 179 227 277 315 357 379 370 358 357 410 433 44715-year 175 221 269 309 352 371 365 349 351 399 42216-year 168 212 263 303 347 369 360 341 346 38717-year 164 204 260 296 339 366 348 335 34318-year 159 199 257 290 324 364 345 33119-year 154 192 253 288 322 355 34120-year 146 187 249 283 316 347
Table 1318Leukemia
SEERa Relative Survival (Percent)By Year of Diagnosis
All Races Males
Year of Diagnosis
SEE
R C
ancer Statistics Review
1975-2016N
ational Cancer Institute
a Based on the SEER 9 areas (San Francisco Connecticut Detroit Hawaii Iowa New Mexico Seattle Utah and Atlanta)Expected survival rates are derived from the US Annual Life Tables
1975- 1980- 1985- 1990-1979 1984 1989 1994 1995 1996 1997 1998 1999 2000 2001 2002 2003 2004 2005 2006 2007 2008 2009 2010 2011 2012 2013 2014 2015
Survival Time
1-year 613 623 638 655 665 664 666 667 646 643 675 710 719 729 715 759 755 754 751 769 778 782 772 761 7912-year 509 527 542 564 569 578 580 574 573 564 606 645 653 664 660 705 689 684 684 705 714 716 709 7093-year 450 471 492 523 525 529 544 534 539 522 564 612 619 628 624 673 657 647 663 666 681 685 6774-year 402 424 449 485 495 498 514 500 511 494 548 594 587 608 595 646 633 624 633 658 664 6685-year 361 384 414 459 480 475 489 479 489 466 530 584 570 588 582 627 615 601 607 641 6396-year 328 360 392 435 464 457 456 461 463 455 516 567 556 569 572 613 602 589 588 6297-year 309 334 367 410 447 443 438 448 450 438 504 561 539 556 558 594 598 575 5798-year 290 316 344 391 416 428 433 433 438 428 490 556 526 542 546 585 582 5639-year 273 299 326 376 409 416 413 424 429 428 477 535 515 534 535 576 57610-year 259 281 315 364 399 405 396 409 414 416 468 522 502 521 521 56811-year 247 269 295 347 378 398 383 403 403 401 456 515 486 503 51812-year 235 250 285 338 372 382 373 397 393 395 445 505 468 49313-year 228 239 276 329 365 373 366 392 385 383 442 481 46314-year 220 232 267 323 355 361 363 385 380 367 434 46815-year 214 225 264 318 353 348 359 369 368 363 42416-year 206 217 258 310 353 344 359 361 363 35817-year 201 210 252 305 342 340 357 358 35018-year 198 205 248 301 336 334 347 35819-year 193 198 241 296 330 326 34620-year 190 195 238 290 321 323
Table 1319Leukemia
SEERa Relative Survival (Percent)By Year of Diagnosis
All Races Females
Year of Diagnosis
SEE
R C
ancer Statistics Review
1975-2016N
ational Cancer Institute
Devcan 677 April 2019 National Cancer Institute (httpssurveillancecancergovdevcan)Source Incidence data are from the SEER 21 areas (San Francisco Connecticut Detroit Hawaii Iowa New Mexico Seattle Utah Atlanta
San Jose-Monterey Los Angeles Alaska Native Registry Rural Georgia California excluding SFSJMLA Kentucky Louisiana New JerseyGeorgia excluding ATLRG Idaho New York and Massachusetts) Mortality data are from the NCHS public use data file for the total US
a Underlying incidence and mortality data for American IndianAlaska Native are based on the PRCDA(PurchasedReferred Care DeliveryAreas) counties
b Hispanic is not mutually exclusive from whites blacks AsianPacific Islanders and American IndiansAlaska NativesUnderlying incidence data for Hispanics are based on NHIA and exclude cases from the Alaska Native Registry
- Statistic could not be calculatedA percent of 000 represents a value that is below 0005
Risk of Being Risk of Being
Race Current Diagnosed with Cancer Risk of Dying Race Current Diagnosed with Cancer Risk of Dying
Ethnicity Age +10 yrs +20 yrs +30 yrs Ever from Cancer Ethnicity Age +10 yrs +20 yrs +30 yrs Ever from Cancer
All Races 0 006 009 012 156 082 Asian 0 005 008 011 099 058
10 003 006 010 152 082 Pacific 10 003 006 009 095 058
20 003 007 014 149 082 Islander 20 003 006 010 092 058
30 004 011 026 147 082 30 003 008 016 090 057
40 007 022 051 145 082 40 004 012 026 087 057
50 015 045 089 141 082 50 008 022 047 083 056
60 031 079 121 134 082 60 014 040 066 078 054
70 053 101 - 115 080 70 028 055 - 067 051
80 062 - - 082 068 80 032 - - 047 040
White 0 006 010 013 164 085 American 0 005 007 009 085 040
10 003 007 011 159 086 Indian 10 002 004 008 081 040
20 003 007 014 156 085 Alaska 20 002 006 010 079 039
30 004 011 027 155 085 Nativea 30 004 008 019 078 039
40 007 023 053 153 085 40 004 015 030 076 040
50 016 047 095 149 086 50 012 027 051 075 040
60 033 083 127 141 086 60 017 042 061 068 040
70 057 106 - 121 084 70 029 051 - 058 038
80 066 - - 086 071 80 029 - - 038 025
Black 0 003 006 008 107 058 Hispanicb 0 007 011 015 124 066
10 002 005 009 105 059 10 005 008 012 118 066
20 003 006 013 104 059 20 004 008 014 114 065
30 004 011 022 102 058 30 004 010 021 111 064
40 007 019 041 100 058 40 006 017 037 108 064
50 013 035 066 097 058 50 011 031 063 104 063
60 025 058 083 091 058 60 021 054 085 097 062
70 039 069 - 079 057 70 037 070 - 083 058
80 042 - - 056 048 80 042 - - 058 049
Table 1320
Leukemia
Risk of Being Diagnosed With Cancer in 10 20 and 30 Years
Lifetime Risk of Being Diagnosed with Cancer Given Alive and Cancer-Free at Current Age and
Lifetime Risk of Dying from Cancer Given Alive at Current Age
Both Sexes 2014-2016 By RaceEthnicity
SEE
R C
ancer Statistics Review
1975-2016N
ational Cancer Institute
Devcan 677 April 2019 National Cancer Institute (httpssurveillancecancergovdevcan)Source Incidence data are from the SEER 21 areas (San Francisco Connecticut Detroit Hawaii Iowa New Mexico Seattle Utah Atlanta
San Jose-Monterey Los Angeles Alaska Native Registry Rural Georgia California excluding SFSJMLA Kentucky Louisiana New JerseyGeorgia excluding ATLRG Idaho New York and Massachusetts) Mortality data are from the NCHS public use data file for the total US
a Underlying incidence and mortality data for American IndianAlaska Native are based on the PRCDA(PurchasedReferred Care DeliveryAreas) counties
b Hispanic is not mutually exclusive from whites blacks AsianPacific Islanders and American IndiansAlaska NativesUnderlying incidence data for Hispanics are based on NHIA and exclude cases from the Alaska Native Registry
- Statistic could not be calculatedA percent of 000 represents a value that is below 0005
Risk of Being Risk of Being
Race Current Diagnosed with Cancer Risk of Dying Race Current Diagnosed with Cancer Risk of Dying
Ethnicity Age +10 yrs +20 yrs +30 yrs Ever from Cancer Ethnicity Age +10 yrs +20 yrs +30 yrs Ever from Cancer
All Races 0 006 010 013 186 096 Asian 0 005 009 011 119 072
10 004 007 012 182 097 Pacific 10 004 007 010 115 072
20 003 008 016 179 097 Islander 20 003 007 012 111 071
30 005 013 030 177 097 30 004 009 019 109 071
40 008 026 062 176 098 40 005 015 033 106 070
50 018 056 112 173 099 50 010 028 062 102 069
60 040 101 152 166 101 60 019 054 084 096 068
70 071 129 - 146 101 70 038 071 - 084 065
80 082 - - 105 088 80 040 - - 056 052
White 0 007 011 014 195 101 American 0 006 009 011 110 048
10 004 008 012 190 102 Indian 10 003 005 010 105 048
20 004 008 016 187 101 Alaska 20 002 007 011 103 048
30 005 013 031 186 101 Nativea 30 005 009 021 103 048
40 009 027 065 184 102 40 005 017 041 102 049
50 019 058 118 181 103 50 013 039 075 102 051
60 042 107 160 174 106 60 028 067 087 097 051
70 075 136 - 153 105 70 046 070 - 081 049
80 087 - - 110 091 80 034 - - 049 030
Black 0 003 006 008 122 065 Hispanicb 0 007 013 017 141 080
10 003 006 009 122 066 10 005 010 015 135 080
20 003 006 014 120 065 20 005 009 016 130 079
30 004 011 025 119 066 30 005 011 023 127 078
40 008 022 048 118 066 40 007 018 040 124 078
50 015 042 079 115 067 50 012 034 072 120 078
60 031 071 102 112 068 60 024 064 100 114 078
70 051 089 - 101 068 70 046 086 - 102 077
80 058 - - 077 061 80 053 - - 074 070
Table 1321
Leukemia
Risk of Being Diagnosed With Cancer in 10 20 and 30 Years
Lifetime Risk of Being Diagnosed with Cancer Given Alive and Cancer-Free at Current Age and
Lifetime Risk of Dying from Cancer Given Alive at Current Age
Males 2014-2016 By RaceEthnicity
SEE
R C
ancer Statistics Review
1975-2016N
ational Cancer Institute
Devcan 677 April 2019 National Cancer Institute (httpssurveillancecancergovdevcan)Source Incidence data are from the SEER 21 areas (San Francisco Connecticut Detroit Hawaii Iowa New Mexico Seattle Utah Atlanta
San Jose-Monterey Los Angeles Alaska Native Registry Rural Georgia California excluding SFSJMLA Kentucky Louisiana New JerseyGeorgia excluding ATLRG Idaho New York and Massachusetts) Mortality data are from the NCHS public use data file for the total US
a Underlying incidence and mortality data for American IndianAlaska Native are based on the PRCDA(PurchasedReferred Care DeliveryAreas) counties
b Hispanic is not mutually exclusive from whites blacks AsianPacific Islanders and American IndiansAlaska NativesUnderlying incidence data for Hispanics are based on NHIA and exclude cases from the Alaska Native Registry
- Statistic could not be calculatedA percent of 000 represents a value that is below 0005
Risk of Being Risk of Being
Race Current Diagnosed with Cancer Risk of Dying Race Current Diagnosed with Cancer Risk of Dying
Ethnicity Age +10 yrs +20 yrs +30 yrs Ever from Cancer Ethnicity Age +10 yrs +20 yrs +30 yrs Ever from Cancer
All Races 0 006 008 011 129 068 Asian 0 005 008 010 083 048
10 003 005 009 125 069 Pacific 10 003 005 008 078 047
20 003 006 012 122 068 Islander 20 002 005 009 075 047
30 003 009 021 120 068 30 003 006 013 073 046
40 006 018 039 118 068 40 004 010 021 071 046
50 012 034 068 114 067 50 007 017 035 068 045
60 023 059 093 106 067 60 011 029 051 063 044
70 039 077 - 091 064 70 019 042 - 054 040
80 048 - - 066 055 80 026 - - 040 033
White 0 006 009 011 135 071 American 0 003 005 007 061 031
10 003 005 009 131 071 Indian 10 002 003 007 058 031
20 003 006 012 128 071 Alaska 20 002 005 008 056 031
30 003 010 022 126 071 Nativea 30 004 007 017 055 031
40 006 019 042 124 070 40 003 014 020 053 031
50 013 036 072 120 070 50 011 017 030 051 031
60 024 062 099 112 069 60 007 021 038 042 030
70 042 081 - 096 067 70 015 035 - 039 029
80 051 - - 069 057 80 025 - - 030 022
Black 0 004 006 008 095 053 Hispanicb 0 006 010 013 110 056
10 002 004 008 093 054 10 004 007 010 105 056
20 002 006 012 091 053 20 003 006 012 101 055
30 004 010 020 089 053 30 003 009 019 099 054
40 006 016 035 087 053 40 006 016 034 096 054
50 011 029 054 083 052 50 010 028 055 091 052
60 020 047 069 077 051 60 019 046 073 084 050
70 030 055 - 065 049 70 030 059 - 070 046
80 033 - - 046 042 80 035 - - 048 037
Table 1322
Leukemia
Risk of Being Diagnosed With Cancer in 10 20 and 30 Years
Lifetime Risk of Being Diagnosed with Cancer Given Alive and Cancer-Free at Current Age and
Lifetime Risk of Dying from Cancer Given Alive at Current Age
Females 2014-2016 By RaceEthnicity
SEER Cancer Statistics Review 1975-2016 National Cancer Institute
The AAPC is the Average Annual Percent Change over the time interval The AAPCs are calculated bythe Joinpoint Regression Program Version 47 February 2019 National Cancer Institute
- Statistic not shown Rate based on less than 16 cases for the time intervalTrend based on less than 10 cases for at least one year within the time interval
a Rates are age-adjusted to the 2000 US Std Population (19 age groups - Census P25-1130) Trendsare based on rates age-adjusted to the 2000 US Std Population (19 age groups - Census P25-1130)
b The SEER 9 areas are San Francisco Connecticut Detroit Hawaii Iowa New Mexico SeattleUtah and AtlantaThe SEER 21 areas comprise the SEER 9 areas plus San Jose-Monterey Los Angeles the AlaskaNative Registry Rural Georgia California excluding SFSJMLA Kentucky Louisiana New JerseyGeorgia excluding ATLRG Idaho New York and Massachusetts
c The 2007-2016 AAPC estimates are based on a Joinpoint analysis with up to 3 Joinpoints overdiagnosis years 2000-2016
d The 2007-2016 AAPC estimates are based on a Joinpoint analysis with up to 5 Joinpoints overdiagnosis years 1975-2016
e Hispanic and Non-Hispanic are not mutually exclusive from whites blacks AsianPacificIslanders and American IndiansAlaska Natives Incidence data for Hispanics and Non-Hispanicsare based on NHIA and exclude cases from the Alaska Native Registry
f Incidence data for American IndianAlaska Native are based on the PurchasedReferred CareDelivery Area (PRCDA) counties
g US Mortality Files National Center for Health Statistics CDCh The 2007-2016 mortality AAPCs are based on a Joinpoint analysis using years of death 2000-2016 The APC is significantly different from zero (plt05)
SEER Incidence SEER 21 Areasb SEER 21 Areasb SEER 9 Areasb
Rate 2012-2016 Trend 2007-2016c Trend 2007-2016d
Rate per 100000 persons AAPC () AAPC ()
Total Males Females Total Males Females Total Males Females RaceEthnicity
All Races 141 181 109 -04 -02 -06 -03 02 03
White 149 191 115 -05 -05 -07 04 03 05White Hispanice 112 134 94 01 -02 03 - - -White Non-Hispanice 153 197 116 -05 -05 -08 - - -
Black 109 139 89 06 02 07 01 01 02
AsianPacific Islander 78 97 63 01 00 02 - - -
Amer IndAlaska Natf 86 110 66 08 21 -01 - - -
Hispanice 108 130 91 02 00 03 - - -
US Mortalityg Rate 2012-2016 Trend 2007-2016h
Rate per 100000 persons AAPC ()
Total Males Females Total Males FemalesRaceEthnicity
All Races 65 88 49 -16 -17 -13
White 68 91 51 -14 -16 -12White Hispanice 50 63 41 -07 -08 -06White Non-Hispanice 69 93 51 -14 -15 -12
Black 55 72 44 -15 -17 -15
AsianPacific Islander 36 47 28 -18 -07 -23
Amer IndAlaska NatTotal US 31 42 23 -22 -09 -36PRCDA Counties 41 54 30 -16 -05 -28Non-PRCDA Counties 20 28 15 -31 -13 -50
Hispanice 47 60 38 -08 -09 -07
Table 1323Leukemia
SEER Incidence and US MortalityAge-Adjusted Rates and Trendsa
By RaceEthnicity and Sex
SEE
R C
ancer Statistics Review
1975-2016N
ational Cancer Institute
a Rates are per 100000 and are age-adjusted to the 2000 US Std Population (19 age groups - Census P25-1130)b The SEER 9 areas are San Francisco Connecticut Detroit Hawaii Iowa New Mexico Seattle Utah and Atlanta
The SEER 13 areas comprise the SEER 9 areas plus San Jose-Monterey Los Angeles the Alaska Native Registry and Rural GeorgiaThe SEER 18 areas comprise the SEER 13 areas plus California excluding SFSJMLA Kentucky Louisiana New Jersey and Georgiaexcluding ATLRGThe SEER 21 areas comprise the SEER 18 areas plus Idaho New York and Massachusetts
- Statistic not shown Rate based on less than 16 cases for the time interval
All Races Whites Blacks Total Males Females Total Males Females Total Males Females
SEER Incidence Ratesa 2012-2016
California 1239 1590 949 1337 1715 1020 1039 1334 813Greater Bay Area 1231 1619 915 1400 1844 1028 1098 1406 859San Francisco-Oakland 1212 1596 906 1389 1823 1034 1077 1336 881San Jose-Monterey 1259 1651 925 1410 1869 1011 1239 1787 -
Los Angeles 1173 1469 933 1291 1622 1016 1050 1294 884Greater California 1271 1633 968 1334 1709 1017 1007 1338 729
Connecticut 1406 1768 1117 1431 1790 1142 976 1126 867Detroit 1584 2050 1230 1707 2222 1300 1204 1485 1018Georgia 1430 1841 1120 1537 1970 1189 1139 1487 935Atlanta 1382 1819 1064 1563 2017 1207 1138 1557 884Rural Georgia 1411 1586 1206 1510 1773 1196 1248 - 1236Greater Georgia 1455 1863 1144 1531 1965 1182 1140 1450 968
Hawaii 1073 1339 843 1388 1612 1139 - - -Idaho 1588 1950 1263 1604 1973 1272 - - -Iowa 1627 2127 1222 1630 2133 1221 1416 1743 1076Kentucky 1566 1983 1234 1577 1995 1241 1159 1446 922Louisiana 1405 1789 1104 1518 1918 1197 1103 1393 890Massachusetts 1108 1429 854 1118 1448 856 787 1050 620New Jersey 1524 1962 1188 1541 1982 1199 1136 1469 928New Mexico 1299 1550 1086 1310 1556 1101 1045 - -New York 1623 2119 1244 1752 2281 1335 1068 1360 887Seattle-Puget Sound 1568 2020 1188 1634 2084 1249 1486 1929 1077Utah 1375 1793 1009 1401 1825 1029 - - -
SEER 9 Areasb 1419 1823 1094 1521 1945 1171 1154 1460 941SEER 13 Areasb 1357 1737 1049 1473 1882 1134 1126 1419 922SEER 18 Areasb 1376 1761 1066 1461 1867 1127 1114 1414 907SEER 21 Areasb 1407 1807 1088 1491 1912 1147 1089 1386 889
Table 1324Leukemia
Age-Adjusted SEER Incidence Ratesa
By Registry Race and Sex
SEE
R C
ancer Statistics Review
1975-2016N
ational Cancer Institute
a US Mortality Files National Center for Health Statistics Centers for Disease Control and PreventionRates are per 100000 and are age-adjusted to the 2000 US Std Population (19 age groups - Census P25-1130)
b The SEER 9 areas are San Francisco Connecticut Detroit Hawaii Iowa New Mexico Seattle Utah and AtlantaThe SEER 13 areas comprise the SEER 9 areas plus San Jose-Monterey Los Angeles the Alaska Native Registry and Rural GeorgiaThe SEER 18 areas comprise the SEER 13 areas plus California excluding SFSJMLA Kentucky Louisiana New Jersey and Georgiaexcluding ATLRGThe SEER 21 areas comprise the SEER 18 areas plus Idaho New York and Massachusetts
- Statistic not shown Rate based on less than 16 cases for the time interval
All Races Whites Blacks Total Males Females Total Males Females Total Males Females
SEER Death Ratesa 2012-2016
California 617 811 470 671 885 507 560 711 461Greater Bay Area 563 759 419 640 869 470 551 742 424San Francisco-Oakland 551 753 405 631 871 455 544 726 421San Jose-Monterey 584 768 446 653 863 495 604 - -
Los Angeles 608 797 468 675 894 513 571 717 483Greater California 639 835 489 677 886 515 553 687 458
Connecticut 622 837 465 639 862 474 536 665 449Detroit 662 915 485 691 967 494 573 723 475Georgia 614 817 467 642 855 478 538 706 438Atlanta 568 757 437 615 802 483 487 658 374Rural Georgia 581 628 538 579 635 - - - -Greater Georgia 639 851 482 654 879 477 576 745 483
Hawaii 463 593 362 543 632 440 - - -Idaho 655 846 497 661 865 492 - - -Iowa 693 961 498 700 963 508 - - -Kentucky 742 949 592 750 953 603 633 894 455Louisiana 677 906 514 705 953 520 603 776 498Massachusetts 622 830 478 647 869 490 463 524 444New Jersey 615 810 478 657 871 504 474 549 429New Mexico 560 759 400 589 794 421 - - -New York 621 842 466 675 910 506 450 602 356Seattle-Puget Sound 618 795 481 637 807 503 708 975 499Utah 679 865 526 693 876 542 - - -
SEER 9 Areasb 610 818 457 651 869 487 540 711 427SEER 13 Areasb 609 810 460 658 874 494 544 708 437SEER 18 Areasb 630 832 480 671 887 508 552 705 455SEER 21 Areasb 628 834 477 670 889 506 520 670 426
Total US 654 876 489 681 912 506 550 721 439
Table 1325Leukemia
Age-Adjusted SEER Death Ratesa
By Registry Race and Sex
SEER Cancer Statistics Review 1975-2016 National Cancer Institute
a US Mortality Files National Center for Health Statistics Centers for Disease Control andPrevention Rates are per 100000 and are age-adjusted to the 2000 US Std Population (19age groups - Census P25-1130)
b Difference between state rate and total US rate is statistically significant (plt=0002)c Absolute percent difference between state rate and total US rate is 15 or mored Rank of state level death rate and the 95 confidence intervals (low high) for the rankSE Standard error of the ratePD Percent difference between state rate and total US rate- Statistic not shown Rate based on less than 16 cases for the time interval
State Rate SE Rank(CI)d PD TOTAL US 654 002
High Five StatesOklahoma 790 019 01(0108) 2083c
West Virginia 749 025 02(0123) 1449South Dakota 747 040 03(0133) 1415Kentucky 742 018 04(0116) 1352Kansas 742 022 05(0122) 1350
Low Five StatesColorado 609 016 47(2649) -692Alaska 596 050 48(0451) -885New Mexico 560 022 49(3650) -1430DC 504 041 50(3251) -2293c
Hawaii 463 024 51(4951) -2913c
State Rate SE Rank(CI)d PD State Rate SE Rank(CI)d PD
Alabama 689 016 17(0532) 533 Montana 613 032 45(0950) -634Alaska 596 050 48(0451) -885 Nebraska 718 026 10(0131) 983Arizona 632 013 36(2248) -329 Nevada 644 021 28(1148) -157Arkansas 719 021 09(0127) 993 New Hampshire 638 029 31(0749) -238California 617 006 42(3248) -572 New Jersey 615 011 43(2849) -592Colorado 609 016 47(2649) -692 New Mexico 560 022 49(3650) -1430Connecticut 622 017 40(2249) -490 New York 621 007 41(2948) -499Delaware 664 035 24(0249) 152 North Carolina 634 011 34(2347) -310DC 504 041 50(3251) -2293c North Dakota 656 040 26(0249) 029Florida 630 007 38(2645) -370 Ohio 694 010 13(0626) 608Georgia 614 012 44(2849) -604 Oklahoma 790 019 01(0108) 2083c
Hawaii 463 024 51(4951) -2913c Oregon 632 017 37(1948) -331Idaho 655 028 27(0548) 012 Pennsylvania 680 009 21(1029) 396Illinois 684 010 19(0928) 463 Rhode Island 656 033 25(0349) 037Indiana 719 014 08(0222) 994 South Carolina 682 016 20(0634) 435Iowa 693 019 14(0334) 604 South Dakota 747 040 03(0133) 1415Kansas 742 022 05(0122) 1350 Tennessee 702 014 12(0327) 729Kentucky 742 018 04(0116) 1352 Texas 640 007 30(2342) -215Louisiana 677 017 23(0637) 356 Utah 679 024 22(0346) 387Maine 638 027 32(0949) -240 Vermont 636 041 33(0350) -277Maryland 633 014 35(2148) -323 Virginia 611 012 46(2849) -661Massachusetts 622 013 39(2548) -482 Washington 640 013 29(2047) -209Michigan 685 011 18(0829) 476 West Virginia 749 025 02(0123) 1449Minnesota 691 015 16(0430) 564 Wisconsin 727 015 06(0219) 1110Mississippi 692 021 15(0337) 580 Wyoming 721 049 07(0148) 1028Missouri 711 014 11(0324) 874
Table 1326Leukemia
Age-Adjusted Cancer Deatha Rates By State All Races 2012-2016
Males and Females
SEER Cancer Statistics Review 1975-2016 National Cancer Institute
a US Mortality Files National Center for Health Statistics Centers for Disease Control andPrevention Rates are per 100000 and are age-adjusted to the 2000 US Std Population (19age groups - Census P25-1130)
b Difference between state rate and total US rate is statistically significant (plt=0002)c Absolute percent difference between state rate and total US rate is 15 or mored Rank of state level death rate and the 95 confidence intervals (low high) for the rankSE Standard error of the ratePD Percent difference between state rate and total US rate- Statistic not shown Rate based on less than 16 cases for the time interval
State Rate SE Rank(CI)d PD TOTAL US 876 003
High Five StatesOklahoma 1022 034 01(0120) 1669c
Kansas 1018 039 02(0123) 1625c
Arkansas 991 037 03(0127) 1309South Dakota 985 068 04(0147) 1249Delaware 984 065 05(0144) 1236
Low Five StatesMontana 795 053 47(1150) -921New Mexico 759 039 48(2650) -1336Alaska 711 081 49(0851) -1887c
DC 704 078 50(1051) -1959c
Hawaii 593 040 51(4951) -3228c
State Rate SE Rank(CI)d PD State Rate SE Rank(CI)d PD
Alabama 939 029 17(0233) 725 Montana 795 053 47(1150) -921Alaska 711 081 49(0851) -1887c Nebraska 958 046 12(0141) 935Arizona 827 022 41(2449) -555 Nevada 858 037 33(0849) -210Arkansas 991 037 03(0127) 1309 New Hampshire 884 051 25(0149) 088California 811 010 43(3348) -738 New Jersey 810 020 44(2749) -747Colorado 834 028 39(2049) -484 New Mexico 759 039 48(2650) -1336Connecticut 837 031 37(1549) -441 New York 842 013 35(2546) -387Delaware 984 065 05(0144) 1236 North Carolina 863 020 31(1945) -149DC 704 078 50(1051) -1959c North Dakota 873 070 27(0150) -030Florida 839 012 36(2645) -422 Ohio 931 018 19(0529) 627Georgia 817 021 42(2649) -677 Oklahoma 1022 034 01(0120) 1669c
Hawaii 593 040 51(4951) -3228c Oregon 866 029 29(1147) -112Idaho 846 047 34(0550) -339 Pennsylvania 912 016 21(0931) 416Illinois 928 018 20(0529) 594 Rhode Island 911 059 22(0149) 400Indiana 960 025 11(0127) 959 South Carolina 951 029 13(0131) 853Iowa 961 035 08(0131) 969 South Dakota 985 068 04(0147) 1249Kansas 1018 039 02(0123) 1625c Tennessee 960 025 10(0127) 959Kentucky 949 031 15(0133) 832 Texas 870 013 28(2139) -069Louisiana 906 030 23(0442) 342 Utah 865 041 30(0549) -122Maine 803 046 46(1450) -836 Vermont 874 074 26(0150) -026Maryland 861 026 32(1447) -176 Virginia 809 021 45(2650) -770Massachusetts 830 023 40(2349) -529 Washington 835 023 38(2248) -463Michigan 937 020 18(0428) 702 West Virginia 972 044 06(0135) 1095Minnesota 948 027 16(0229) 826 Wisconsin 960 026 09(0127) 961Mississippi 970 039 07(0132) 1077 Wyoming 885 081 24(0150) 102Missouri 951 025 14(0228) 852
Table 1327Leukemia
Age-Adjusted Cancer Deatha Rates By State All Races 2012-2016
Males
SEER Cancer Statistics Review 1975-2016 National Cancer Institute
a US Mortality Files National Center for Health Statistics Centers for Disease Control andPrevention Rates are per 100000 and are age-adjusted to the 2000 US Std Population (19age groups - Census P25-1130)
b Difference between state rate and total US rate is statistically significant (plt=0002)c Absolute percent difference between state rate and total US rate is 15 or mored Rank of state level death rate and the 95 confidence intervals (low high) for the rankSE Standard error of the ratePD Percent difference between state rate and total US rate- Statistic not shown Rate based on less than 16 cases for the time interval
State Rate SE Rank(CI)d PD TOTAL US 489 002
High Five StatesOklahoma 615 023 01(0108) 2584c
Wyoming 596 060 02(0147) 2194c
Kentucky 592 021 03(0111) 2126c
West Virginia 576 030 04(0126) 1792c
South Dakota 564 047 05(0145) 1551c
Low Five StatesColorado 441 018 47(2250) -972Delaware 428 037 48(0751) -1247New Mexico 400 025 49(3151) -1803c
DC 381 046 50(1251) -2203c
Hawaii 362 029 51(4151) -2598c
State Rate SE Rank(CI)d PD State Rate SE Rank(CI)d PD
Alabama 512 019 18(0440) 483 Montana 452 037 43(0551) -745Alaska 485 062 27(0151) -073 Nebraska 531 030 10(0144) 864Arizona 473 015 31(1347) -308 Nevada 455 025 42(1150) -695Arkansas 516 024 15(0344) 554 New Hampshire 449 033 45(0651) -807California 470 007 34(2345) -383 New Jersey 478 013 30(1346) -223Colorado 441 018 47(2250) -972 New Mexico 400 025 49(3151) -1803c
Connecticut 465 020 40(1249) -487 New York 466 009 38(2246) -456Delaware 428 037 48(0751) -1247 North Carolina 471 012 32(1747) -350DC 381 046 50(1251) -2203c North Dakota 479 046 28(0151) -189Florida 460 008 41(2647) -582 Ohio 520 012 12(0529) 653Georgia 467 013 37(1747) -433 Oklahoma 615 023 01(0108) 2584c
Hawaii 362 029 51(4151) -2598c Oregon 449 019 44(1850) -799Idaho 497 033 22(0249) 174 Pennsylvania 516 011 14(0629) 556Illinois 514 011 16(0631) 526 Rhode Island 471 037 33(0351) -363Indiana 540 017 07(0226) 1052 South Carolina 495 018 23(0645) 133Iowa 498 022 20(0547) 200 South Dakota 564 047 05(0145) 1551c
Kansas 539 025 08(0137) 1032 Tennessee 517 016 13(0435) 590Kentucky 592 021 03(0111) 2126c Texas 467 008 36(2246) -431Louisiana 514 020 17(0442) 520 Utah 526 029 11(0146) 778Maine 508 032 19(0248) 403 Vermont 444 045 46(0351) -906Maryland 470 016 35(1448) -389 Virginia 465 014 39(1848) -474Massachusetts 478 015 29(1247) -220 Washington 487 016 25(0946) -022Michigan 498 013 21(0939) 192 West Virginia 576 030 04(0126) 1792c
Minnesota 494 017 24(0745) 121 Wisconsin 545 017 06(0225) 1162Mississippi 485 023 26(0548) -067 Wyoming 596 060 02(0147) 2194c
Missouri 535 017 09(0327) 953
Table 1328Leukemia
Age-Adjusted Cancer Deatha Rates By State All Races 2012-2016
Females
SEE
R C
ancer Statistics Review
1975-2016N
ational Cancer Institute
a US 2016 cancer prevalence counts are based on 2016 cancer prevalence proportions from the SEER 13 Areas (excluding the AlaskaNative Registry) and 112016 US population estimates based on the average of 2015 and 2016 population estimates from theUS Bureau of the CensusPrevalence was calculated using the first invasive tumor for each cancer site diagnosed during the previous 24 years
b Maximum limited-duration prevalence is 24 years for 1992-2016 datac Percentages are age-adjusted to the 2000 US Standard Population (19 age groups - Census P25-1130) by 5-year age groupsd Cases diagnosed more than 24 years ago were estimated using the completeness index method (Capocaccia et al 1997
Merrill et al 2000)e Complete prevalence is obtained by summing 0 to lt24 and gt=24- Statistic not shown Statistic based on fewer than 5 cases estimated alive in SEER for the time interval+ Not available
Years Since Diagnosis 0 to lt5 5 to lt10 10 to lt15 15 to lt20 20 to lt24 0 to lt24b gt=24d Completee
Race Sex All Races Both Sexes 153253 100309 63581 38012 21353 376508 38265 414773
Males 90192 57683 36029 21220 12020 217145 18411 235556Females 63061 42625 27552 16792 9333 159363 19854 179217
White Both Sexes 132173 87961 56051 33596 19035 328814 32999 370135Males 78368 50894 32033 18770 10845 190910 15102 210930Females 53805 37067 24018 14826 8190 137905 17897 159205
Black Both Sexes 12734 6564 4233 2487 1259 27277 4070 31347Males 6847 3556 2204 1334 637 14578 1776 16354Females 5887 3008 2029 1153 622 12699 2294 14992
Asian Both Sexes 3926 2561 1778 1164 690 10120 + +Pacific Males 2235 1462 936 646 351 5630 + +Islander Females 1691 1100 842 519 339 4490 + +
Hispanic Both Sexes 14464 9581 6796 4462 2630 37933 + +Males 8166 5374 3794 2408 1538 21280 + +Females 6298 4207 3002 2055 1092 16654 + +
Age Specific (Crude) Age-Adjustedc Age at Prevalence All Ages 0-9 10-19 20-29 30-39 40-49 50-59 60-69 70-79 80+ All Ages
Race Sex All Races Both Sexes 01168 00328 00640 00628 00377 00561 01053 02263 04023 05111 01054
Males 01369 00339 00706 00685 00419 00657 01287 02888 05282 07048 01306Females 00974 00317 00572 00570 00333 00466 00829 01696 02974 03919 00844
White Both Sexes 01304 00369 00715 00712 00410 00584 01106 02389 04249 05386 01127Males 01528 00379 00789 00771 00457 00682 01349 03042 05558 07387 01389Females 01084 00359 00637 00650 00362 00484 00869 01784 03135 04133 00904
Black Both Sexes 00605 00145 00322 00320 00267 00463 00752 01455 02470 03076 00660Males 00674 00142 00357 00338 00281 00530 00919 01737 03249 04580 00816Females 00541 00148 00286 00301 00255 00402 00605 01230 01927 02334 00552
Asian Both Sexes 00497 00264 00531 00426 00230 00390 00553 00882 01245 01389 00513Pacific Males 00577 00298 00555 00507 00249 00461 00665 01122 01552 01904 00613Islander Females 00423 00228 00507 00345 00212 00327 00456 00688 00999 01057 00430
Hispanic Both Sexes 00664 00375 00737 00728 00395 00485 00723 01191 01987 02074 00746Males 00737 00397 00827 00807 00471 00576 00831 01350 02221 02551 00854Females 00589 00352 00642 00641 00312 00391 00617 01050 01809 01780 00647
Table 1329Leukemia
Estimated United States Cancer Prevalence Countsa on January 1 2016By RaceEthnicity Sex and Years Since Diagnosis
Estimated prevalence percenta on January 1 2016 of the SEER population diagnosed in the previous 24 yearsBy Age at Prevalence RaceEthnicity and Sex
SEE
R C
ancer Statistics Review
1975-2016N
ational Cancer Institute
a US 2016 cancer prevalence counts are based on 2016 cancer prevalence proportions from the SEER 13 Areas (excluding the AlaskaNative Registry) and 112016 US population estimates based on the average of 2015 and 2016 population estimates from theUS Bureau of the CensusPrevalence was calculated using the first invasive tumor for each cancer site diagnosed during the previous 24 years
b Maximum limited-duration prevalence is 24 years for 1992-2016 datac Percentages are age-adjusted to the 2000 US Standard Population (19 age groups - Census P25-1130) by 5-year age groupsd Cases diagnosed more than 24 years ago were estimated using the completeness index method (Capocaccia et al 1997
Merrill et al 2000)e Complete prevalence is obtained by summing 0 to lt24 and gt=24- Statistic not shown Statistic based on fewer than 5 cases estimated alive in SEER for the time interval+ Not available
Years Since Diagnosis 0 to lt5 5 to lt10 10 to lt15 15 to lt20 20 to lt24 0 to lt24b gt=24d Completee
Race Sex All Races Both Sexes 20277 16033 13721 12074 8203 70308 25456 95764
Males 11203 9049 7751 6542 4634 39179 12997 52176Females 9074 6984 5971 5531 3568 31129 12460 43589
White Both Sexes 17123 13855 11870 10663 7154 60665 21823 83282Males 9549 7741 6768 5696 4084 33839 11286 45559Females 7573 6114 5102 4967 3070 26826 10537 37723
Black Both Sexes 1590 1133 923 727 553 4926 1609 6535Males 809 734 473 411 290 2716 592 3308Females 781 399 450 317 263 2210 1017 3227
Asian Both Sexes 998 720 669 486 361 3234 + +Pacific Males 527 406 369 313 178 1793 + +Islander Females 472 314 300 173 183 1441 + +
Hispanic Both Sexes 5905 4543 3352 2717 1749 18266 + +Males 3302 2686 1899 1465 1058 10409 + +Females 2603 1857 1454 1252 692 7857 + +
Age Specific (Crude) Age-Adjustedc Age at Prevalence All Ages 0-9 10-19 20-29 30-39 40-49 50-59 60-69 70-79 80+ All Ages
Race Sex All Races Both Sexes 00218 00276 00541 00467 00139 00078 00059 00065 00053 00033 00228
Males 00247 00286 00591 00520 00163 00095 00066 00069 00056 00035 00251Females 00190 00266 00488 00410 00115 00062 00053 00062 00050 00032 00204
White Both Sexes 00241 00315 00612 00542 00161 00086 00063 00070 00056 00033 00259Males 00271 00323 00670 00598 00186 00107 00069 00074 00060 00032 00284Females 00211 00306 00551 00482 00135 00064 00057 00066 00053 00033 00232
Black Both Sexes 00109 00107 00250 00197 00067 00042 00039 00029 00012 00027 00102Males 00126 00112 00281 00224 00079 00035 00052 00026 00012 00027 00112Females 00094 00102 00219 00171 00056 00047 00028 00032 00013 00027 00092
Asian Both Sexes 00159 00208 00418 00289 00071 00064 00045 00050 00054 00036 00163Pacific Males 00184 00226 00427 00360 00086 00069 00055 00054 00033 00055 00180Islander Females 00136 00190 00408 00219 00058 00059 00036 00047 00071 00023 00146
Hispanic Both Sexes 00320 00328 00637 00574 00165 00107 00093 00100 00084 00012 00279Males 00361 00342 00710 00648 00205 00131 00110 00063 00072 - 00309Females 00278 00312 00562 00494 00122 00082 00077 00133 00093 00020 00246
Table 1330Acute Lymphocytic Leukemia
Estimated United States Cancer Prevalence Countsa on January 1 2016By RaceEthnicity Sex and Years Since Diagnosis
Estimated prevalence percenta on January 1 2016 of the SEER population diagnosed in the previous 24 yearsBy Age at Prevalence RaceEthnicity and Sex
0
5
10
15
20
25
1975 1985 1995 2005 20160
5
10
15
20
25
1975 1985 1995 2005 20160
3
6
9
12
15
1975 1985 1995 2005 20160
3
6
9
12
15
1975 1985 1995 2005 2016
Delay-Adj IncidenceDelay-Adj Incidence
Observed IncidenceObserved Incidence
MortalityMortality
SEER Observed Incidence SEER Delay Adjusted Incidence and US Death RatesLeukemia by Race and Sex
a
Figure 131
Source SEER 9 areas and US Mortality Files (National Center for Health Statistics CDC)Rates are age-adjusted to the 2000 US Std Population (19 age groups - Census P25-1103)Regression lines and APCs are calculated using the Joinpoint Regression Program Version 47 February 2019 National Cancer InstituteThe APC is the Annual Percent Change for the regression line segments The APC shown on the graph is for the most recent trendThe APC is significantly different from zero (p lt 005)
a
White Male Black Male White Female Black FemaleRate per 100000 Rate per 100000 Rate per 100000 Rate per 100000
Year of DiagnosisDeath Year of DiagnosisDeath Year of DiagnosisDeath Year of DiagnosisDeath
SEER Incidence APCsDelay Adj 1998-16 = 08Observed 1975-16 = 03
US Mortality APC2013-16 = -30
SEER Incidence APCsDelay Adj 1975-16 = 02Observed 1975-16 = 01
US Mortality APC1993-16 = -15
SEER Incidence APCsDelay Adj 1975-16 = 06Observed 1975-16 = 05
US Mortality APC2000-16 = -12
SEER Incidence APCsDelay Adj 1975-16 = 03Observed 1975-16 = 02
US Mortality APC1993-16 = -13
SEE
R C
ancer Statistics Review
1975-2016N
ational Cancer Institute
0
1
2
3
4
5
6
7
8
1975 1985 1995 2005 20160
1
2
3
4
5
6
7
8
1975 1985 1995 2005 20160
1
2
3
4
5
6
7
8
1975 1985 1995 2005 20160
1
2
3
4
5
6
7
8
1975 1985 1995 2005 2016
Chronic
Acute
SEER Observed Incidence RatesLymphocytic and Myeloid Leukemia (Acute and Chronic) by Sex
a
Figure 132
Source SEER 9 areas Rates are age-adjusted to the 2000 US Std Population (19 age groups - Census P25-1103)Regression lines and APCs are calculated using the Joinpoint Regression Program Version 47 February 2019 National Cancer Institute
a
Male Female Male FemaleLymphocytic Leukemia Myeloid Leukemia
Rate per 100000 Rate per 100000 Rate per 100000 Rate per 100000
Year of Diagnosis Year of Diagnosis Year of Diagnosis Year of Diagnosis
SEE
R C
ancer Statistics Review
1975-2016N
ational Cancer Institute
Joinpoint Analyses for Whites and Blacks from 1975-2016and for AsianPacific Islanders American IndiansAlaska Natives and Hispanics from 2000-2016
0
5
10
15
20
1975 1985 1995 2005 20160
5
10
15
20
1975 1985 1995 2005 2016
White
Black
API
AIAN
Hispanic
SEER Incidence and US Death RatesLeukemia Both Sexes
Figure 133
Source Incidence data for whites and blacks are from the SEER 9 areas (San Francisco Connecticut Detroit Hawaii Iowa New Mexico Seattle Utah Atlanta)Incidence data for AsianPacific Islanders American IndiansAlaska Natives and Hispanics are from the SEER 21 areas (SEER 9 areas San Jose-MontereyLos Angeles Alaska Native Registry Rural Georgia California excluding SFSJMLA Kentucky Louisiana New Jersey Georgia excluding ATLRG Idaho New York andMassachusetts)Mortality data are from US Mortality Files National Center for Health Statistics CDCRates are age-adjusted to the 2000 US Std Population (19 age groups - Census P25-1103)Regression lines are calculated using the Joinpoint Regression Program Version 47 February 2019 National Cancer Institute Joinpoint analyses for Whites andBlacks during the 1975-2016 period allow a maximum of 5 joinpoints Analyses for other ethnic groups during the period 2000-2016 allow a maximum of 3 joinpointsAPI = AsianPacific IslanderAIAN = American IndianAlaska Native Rates for American IndianAlaska Native are based on the PurchasedReferred Care Delivery Area (PRCDA) countiesHispanic is not mutually exclusive from whites blacks AsianPacific Islanders and American IndiansAlaska Natives Incidence data for Hispanics are based onNHIA and exclude cases from the Alaska Native Registry
Incidence MortalityRate per 100000 Rate per 100000
Year of Diagnosis Year of Death
a
d
a
b
c
c
b
d
SEE
R C
ancer Statistics Review
1975-2016N
ational Cancer Institute
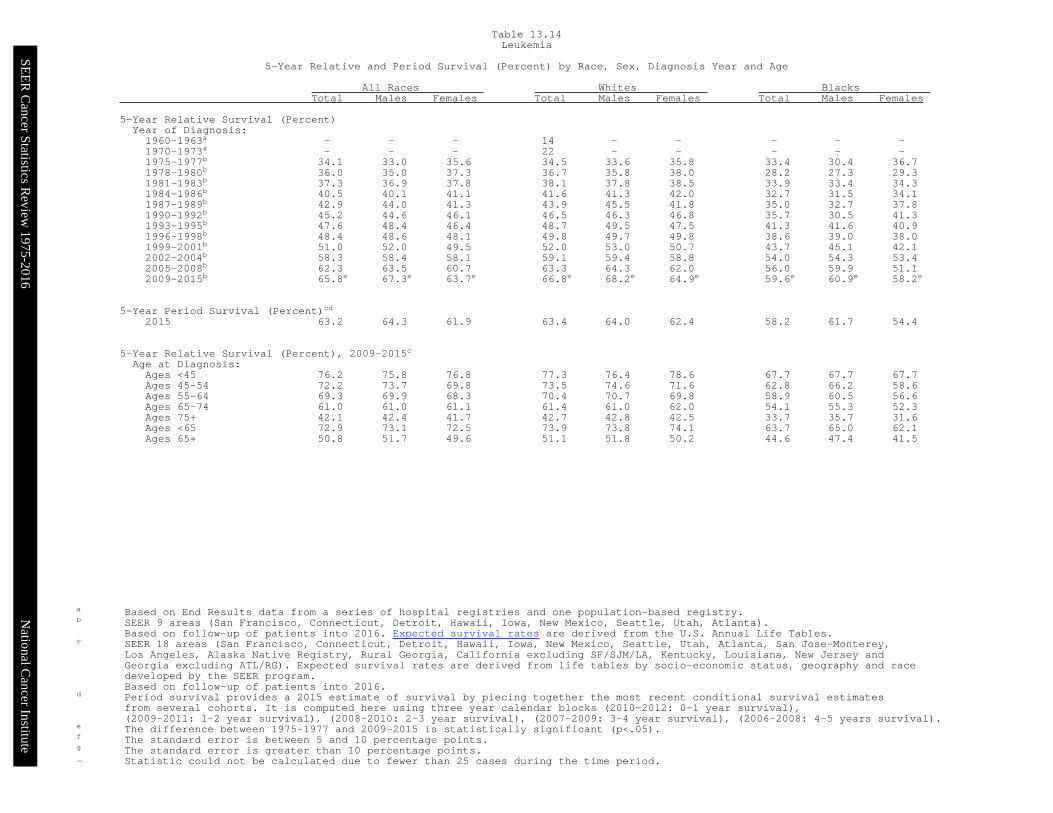
SEE
R C
ancer Statistics Review
1975-2016N
ational Cancer Institute
a Based on End Results data from a series of hospital registries and one population-based registryb SEER 9 areas (San Francisco Connecticut Detroit Hawaii Iowa New Mexico Seattle Utah Atlanta)
Based on follow-up of patients into 2016 Expected survival rates are derived from the US Annual Life Tablesc SEER 18 areas (San Francisco Connecticut Detroit Hawaii Iowa New Mexico Seattle Utah Atlanta San Jose-Monterey
Los Angeles Alaska Native Registry Rural Georgia California excluding SFSJMLA Kentucky Louisiana New Jersey andGeorgia excluding ATLRG) Expected survival rates are derived from life tables by socio-economic status geography and racedeveloped by the SEER programBased on follow-up of patients into 2016
d Period survival provides a 2015 estimate of survival by piecing together the most recent conditional survival estimatesfrom several cohorts It is computed here using three year calendar blocks (2010-2012 0-1 year survival)(2009-2011 1-2 year survival) (2008-2010 2-3 year survival) (2007-2009 3-4 year survival) (2006-2008 4-5 years survival)
e The difference between 1975-1977 and 2009-2015 is statistically significant (plt05)f The standard error is between 5 and 10 percentage pointsg The standard error is greater than 10 percentage points- Statistic could not be calculated due to fewer than 25 cases during the time period
All Races Whites Blacks Total Males Females Total Males Females Total Males Females
5-Year Relative Survival (Percent)Year of Diagnosis1960-1963a - - - 14 - - - - -1970-1973a - - - 22 - - - - -1975-1977b 341 330 356 345 336 358 334 304 3671978-1980b 360 350 373 367 358 380 282 273 2931981-1983b 373 369 378 381 378 385 339 334 3431984-1986b 405 401 411 416 413 420 327 315 3411987-1989b 429 440 413 439 455 418 350 327 3781990-1992b 452 446 461 465 463 468 357 305 4131993-1995b 476 484 464 487 495 475 413 416 4091996-1998b 484 486 481 498 497 498 386 390 3801999-2001b 510 520 495 520 530 507 437 451 4212002-2004b 583 584 581 591 594 588 540 543 5342005-2008b 623 635 607 633 643 620 560 599 5112009-2015b 658e 673e 637e 668e 682e 649e 596e 609e 582e
5-Year Period Survival (Percent)cd
2015 632 643 619 634 640 624 582 617 544
5-Year Relative Survival (Percent) 2009-2015c
Age at DiagnosisAges lt45 762 758 768 773 764 786 677 677 677Ages 45-54 722 737 698 735 746 716 628 662 586Ages 55-64 693 699 683 704 707 698 589 605 566Ages 65-74 610 610 611 614 610 620 541 553 523Ages 75+ 421 424 417 427 428 425 337 357 316Ages lt65 729 731 725 739 738 741 637 650 621Ages 65+ 508 517 496 511 518 502 446 474 415
Table 1314Leukemia
5-Year Relative and Period Survival (Percent) by Race Sex Diagnosis Year and Age
SEE
R C
ancer Statistics Review
1975-2016N
ational Cancer Institute
a SEER 9 areas (San Francisco Connecticut Detroit Hawaii Iowa New Mexico Seattle Utah Atlanta)Based on follow-up of patients into 2016 Expected survival rates are derived from the US Annual Life Tables
b SEER 18 areas (San Francisco Connecticut Detroit Hawaii Iowa New Mexico Seattle Utah Atlanta San Jose-MontereyLos Angeles Alaska Native Registry Rural Georgia California excluding SFSJMLA Kentucky Louisiana New Jersey andGeorgia excluding ATLRG) Expected survival rates are derived from life tables by socio-economic status geography and racedeveloped by the SEER programBased on follow-up of patients into 2016
c Period survival provides a 2015 estimate of survival by piecing together the most recent conditional survival estimatesfrom several cohorts It is computed here using three year calendar blocks (2010-2012 0-1 year survival)(2009-2011 1-2 year survival) (2008-2010 2-3 year survival) (2007-2009 3-4 year survival) (2006-2008 4-5 years survival)
d The difference between 1975-1977 and 2009-2015 is statistically significant (plt05)e The standard error is between 5 and 10 percentage pointsf The standard error is greater than 10 percentage points- Statistic could not be calculated due to fewer than 25 cases during the time period
All Races Whites Blacks Total Males Females Total Males Females Total Males Females
Acute Lymphocytic Leukemia5-Year Relative Survival (Percent)Year of Diagnosis1975-1977a 406 369 456 408 374 457 335e - -1987-1989a 544 537 552 550 547 553 447e 420e 471e1990-1992a 580 545 631 577 549 620 571e 504e 633e1993-1995a 602 578 636 598 578 627 532e 459e 638e1996-1998a 655 644 669 664 643 690 556e 591e 502e1999-2001a 635 634 635 648 652 642 566e 503e 630e2002-2004a 673 661 689 676 666 691 645e 594e 697e2005-2008a 701 693 713 700 686 720 652 700 551e2009-2015a 717d 723d 710d 726d 737d 713d 625d 607 647e
5-Year Period Survival (Percent)bc2015 691 684 698 685 674 700 650 650 648
5-Year Relative Survival (Percent) 2009-2015bAge at DiagnosisAges lt45 806 795 821 807 791 828 763 757 770Ages 45-54 381 365 403 379 373 389 257e - -Ages 55-64 280 275 284 294 288 298 173e 228e -Ages 65-74 239 188 291 214 170 259 - - -Ages 75+ 91 97 83 100 96 100 00 - -Ages lt65 733 725 743 735 724 749 668 668 668Ages 65+ 174 151 196 166 141 191 154e - 189e
Chronic Lymphocytic Leukemia5-Year Relative Survival (Percent)Year of Diagnosis1975-1977a 671 647 703 679 654 711 569e 551e 590e1987-1989a 727 727 729 739 740 737 581 555e 615e1990-1992a 741 718 773 753 731 784 522 434e 609e1993-1995a 772 771 773 783 781 786 633 640e 621e1996-1998a 756 739 778 767 752 787 581 515e 660e1999-2001a 786 782 792 794 788 803 666 655e 666e2002-2004a 840 832 852 845 837 856 770 742e 807e2005-2008a 862 861 863 864 863 864 841 857 8122009-2015a 882d 887d 875d 886d 889d 883d 785d 801d 763
5-Year Period Survival (Percent)bc2015 856 855 858 853 848 860 772 818 710
5-Year Relative Survival (Percent) 2009-2015bAge at DiagnosisAges lt45 940 927 960 942 932 954 905e 879e -Ages 45-54 939 934 948 945 935 964 840 889 761eAges 55-64 922 916 933 924 916 938 836 831 843Ages 65-74 874 856 905 876 853 913 773 784 756Ages 75+ 731 727 736 729 724 734 584 586e 564eAges lt65 928 922 939 931 923 947 843 854 824Ages 65+ 801 796 807 799 792 807 691 713 662
Table 1315Lymphocytic Leukemia
5-Year Relative and Period Survival (Percent) by Race Sex Diagnosis Year and Age
SEE
R C
ancer Statistics Review
1975-2016N
ational Cancer Institute
a SEER 9 areas (San Francisco Connecticut Detroit Hawaii Iowa New Mexico Seattle Utah Atlanta)Based on follow-up of patients into 2016 Expected survival rates are derived from the US Annual Life Tables
b SEER 18 areas (San Francisco Connecticut Detroit Hawaii Iowa New Mexico Seattle Utah Atlanta San Jose-MontereyLos Angeles Alaska Native Registry Rural Georgia California excluding SFSJMLA Kentucky Louisiana New Jersey andGeorgia excluding ATLRG) Expected survival rates are derived from life tables by socio-economic status geography and racedeveloped by the SEER programBased on follow-up of patients into 2016
c Period survival provides a 2015 estimate of survival by piecing together the most recent conditional survival estimatesfrom several cohorts It is computed here using three year calendar blocks (2010-2012 0-1 year survival)(2009-2011 1-2 year survival) (2008-2010 2-3 year survival) (2007-2009 3-4 year survival) (2006-2008 4-5 years survival)
d The difference between 1975-1977 and 2009-2015 is statistically significant (plt05)e The standard error is between 5 and 10 percentage pointsf The standard error is greater than 10 percentage points- Statistic could not be calculated due to fewer than 25 cases during the time period
All Races Whites Blacks Total Males Females Total Males Females Total Males Females
Acute Myeloid Leukemia5-Year Relative Survival (Percent)Year of Diagnosis1975-1977a 62 55 70 58 54 62 101 82 1171987-1989a 115 92 141 113 97 132 92 44 157e1990-1992a 138 126 152 135 122 150 135 129 1391993-1995a 161 149 174 153 141 167 215 206e 2201996-1998a 170 159 183 156 145 171 221 252 1821999-2001a 192 188 197 187 176 199 193 248 1422002-2004a 234 209 264 232 208 260 253 265 2402005-2008a 249 235 265 242 228 257 239 193 2772009-2015a 294d 291d 298d 290d 284d 299d 292d 280d 301d
5-Year Period Survival (Percent)bc2015 286 278 294 282 276 289 283 262 301
5-Year Relative Survival (Percent) 2009-2015bAge at DiagnosisAges lt45 604 585 624 621 599 645 511 482 538Ages 45-54 441 439 444 456 450 463 337 342 336Ages 55-64 300 281 325 308 285 338 231 234 224Ages 65-74 139 137 141 145 144 146 103 78 131Ages 75+ 34 40 27 34 41 27 24 - 20Ages lt65 466 444 491 474 449 504 393 371 414Ages 65+ 79 85 72 82 89 73 64 58 71
Chronic Myeloid Leukemia5-Year Relative Survival (Percent)Year of Diagnosis1975-1977a 218 193 251 205 184 234 277e 216e 355e1987-1989a 303 306 298 301 310 290 333e 281e 413e1990-1992a 307 296 322 303 300 306 349e 255e 449e1993-1995a 355 353 358 352 351 352 356e 328e 402e1996-1998a 371 377 363 380 376 385 310 304e 314e1999-2001a 473 459 492 459 441 483 490e 496e 481e2002-2004a 543 530 561 526 514 541 630e 621e 640e2005-2008a 631 632 629 617 615 621 643 664e 608e2009-2015a 697d 681d 718d 690d 677d 707d 736d 711d 763d
5-Year Period Survival (Percent)bc2015 695 683 712 681 666 702 723 714 735
5-Year Relative Survival (Percent) 2009-2015bAge at DiagnosisAges lt45 899 889 913 916 905 934 797 786 812Ages 45-54 874 860 891 871 858 888 871 842 900Ages 55-64 776 748 816 781 750 826 698 676e 719eAges 65-74 611 579 656 609 578 654 584e 526e 637eAges 75+ 326 305 346 321 302 336 362e 362f 362eAges lt65 851 836 873 856 839 883 790 773 808Ages 65+ 462 444 484 456 441 475 495 471e 515e
Table 1316Myeloid Leukemia
5-Year Relative and Period Survival (Percent) by Race Sex Diagnosis Year and Age
SEE
R C
ancer Statistics Review
1975-2016N
ational Cancer Institute
a Based on the SEER 9 areas (San Francisco Connecticut Detroit Hawaii Iowa New Mexico Seattle Utah and Atlanta)Expected survival rates are derived from the US Annual Life Tables
1975- 1980- 1985- 1990-1979 1984 1989 1994 1995 1996 1997 1998 1999 2000 2001 2002 2003 2004 2005 2006 2007 2008 2009 2010 2011 2012 2013 2014 2015
Survival Time
1-year 608 626 648 669 681 682 679 667 659 669 706 722 732 751 742 765 769 766 774 783 794 791 790 791 8062-year 501 525 553 575 589 599 598 580 583 590 630 649 662 677 684 705 706 702 709 725 732 725 732 7343-year 437 465 496 528 543 554 549 541 547 551 590 619 624 643 647 673 676 665 684 692 703 692 6984-year 388 417 455 491 507 519 509 503 516 520 567 596 595 619 627 647 653 639 658 676 683 6735-year 346 376 423 461 481 487 483 482 484 499 543 578 575 596 610 626 637 619 635 659 6656-year 314 351 399 435 457 465 458 461 462 485 524 560 556 572 593 607 622 604 613 6477-year 291 325 371 409 442 451 438 446 444 473 510 544 537 560 579 591 614 587 6018-year 270 304 350 388 417 438 432 431 430 457 496 535 519 546 561 573 603 5769-year 250 285 330 373 406 420 418 421 421 449 483 519 507 530 546 561 59310-year 237 269 316 360 390 406 406 410 406 438 471 504 489 515 532 54511-year 224 257 299 347 378 398 387 397 392 426 459 492 473 499 52712-year 212 246 288 336 371 387 377 390 383 419 449 483 460 49213-year 204 236 280 327 367 382 370 380 372 404 442 466 45414-year 198 229 272 318 356 371 368 370 367 392 434 45615-year 192 223 267 313 353 361 362 358 359 383 42316-year 185 214 261 306 350 359 361 350 353 37417-year 181 207 256 300 340 355 352 346 34718-year 177 201 253 294 330 351 346 34319-year 171 195 248 291 326 343 34420-year 166 191 244 286 319 338
Table 1317Leukemia
SEERa Relative Survival (Percent)By Year of Diagnosis
All Races Males and Females
Year of Diagnosis
SEE
R C
ancer Statistics Review
1975-2016N
ational Cancer Institute
a Based on the SEER 9 areas (San Francisco Connecticut Detroit Hawaii Iowa New Mexico Seattle Utah and Atlanta)Expected survival rates are derived from the US Annual Life Tables
1975- 1980- 1985- 1990-1979 1984 1989 1994 1995 1996 1997 1998 1999 2000 2001 2002 2003 2004 2005 2006 2007 2008 2009 2010 2011 2012 2013 2014 2015
Survival Time
1-year 604 628 655 679 692 697 688 667 668 688 729 731 742 767 761 770 780 775 791 793 806 797 803 812 8172-year 494 524 561 583 604 616 611 585 590 608 648 652 669 687 701 706 719 716 727 740 746 733 749 7513-year 427 460 499 532 556 573 552 546 552 573 608 624 627 653 664 674 689 679 699 712 719 698 7144-year 377 411 459 494 516 535 505 505 520 539 581 598 601 627 650 648 667 650 677 690 697 6775-year 334 371 429 462 482 495 479 484 480 523 553 573 578 602 630 626 653 632 656 673 6846-year 303 343 404 435 452 471 459 461 461 508 529 554 557 575 609 602 635 615 631 6617-year 277 318 373 409 439 458 438 444 439 498 514 531 535 564 594 588 625 595 6168-year 254 294 354 385 417 446 430 430 423 478 500 520 514 549 572 563 616 5839-year 232 275 332 371 404 423 421 419 415 464 486 507 501 526 553 548 60510-year 219 260 317 358 382 407 413 410 401 454 473 490 479 511 539 52611-year 205 249 302 346 377 398 391 393 383 444 461 474 464 496 53312-year 193 242 290 334 371 390 380 384 375 437 452 467 455 49113-year 186 234 283 325 367 389 373 369 363 420 442 455 44714-year 179 227 277 315 357 379 370 358 357 410 433 44715-year 175 221 269 309 352 371 365 349 351 399 42216-year 168 212 263 303 347 369 360 341 346 38717-year 164 204 260 296 339 366 348 335 34318-year 159 199 257 290 324 364 345 33119-year 154 192 253 288 322 355 34120-year 146 187 249 283 316 347
Table 1318Leukemia
SEERa Relative Survival (Percent)By Year of Diagnosis
All Races Males
Year of Diagnosis
SEE
R C
ancer Statistics Review
1975-2016N
ational Cancer Institute
a Based on the SEER 9 areas (San Francisco Connecticut Detroit Hawaii Iowa New Mexico Seattle Utah and Atlanta)Expected survival rates are derived from the US Annual Life Tables
1975- 1980- 1985- 1990-1979 1984 1989 1994 1995 1996 1997 1998 1999 2000 2001 2002 2003 2004 2005 2006 2007 2008 2009 2010 2011 2012 2013 2014 2015
Survival Time
1-year 613 623 638 655 665 664 666 667 646 643 675 710 719 729 715 759 755 754 751 769 778 782 772 761 7912-year 509 527 542 564 569 578 580 574 573 564 606 645 653 664 660 705 689 684 684 705 714 716 709 7093-year 450 471 492 523 525 529 544 534 539 522 564 612 619 628 624 673 657 647 663 666 681 685 6774-year 402 424 449 485 495 498 514 500 511 494 548 594 587 608 595 646 633 624 633 658 664 6685-year 361 384 414 459 480 475 489 479 489 466 530 584 570 588 582 627 615 601 607 641 6396-year 328 360 392 435 464 457 456 461 463 455 516 567 556 569 572 613 602 589 588 6297-year 309 334 367 410 447 443 438 448 450 438 504 561 539 556 558 594 598 575 5798-year 290 316 344 391 416 428 433 433 438 428 490 556 526 542 546 585 582 5639-year 273 299 326 376 409 416 413 424 429 428 477 535 515 534 535 576 57610-year 259 281 315 364 399 405 396 409 414 416 468 522 502 521 521 56811-year 247 269 295 347 378 398 383 403 403 401 456 515 486 503 51812-year 235 250 285 338 372 382 373 397 393 395 445 505 468 49313-year 228 239 276 329 365 373 366 392 385 383 442 481 46314-year 220 232 267 323 355 361 363 385 380 367 434 46815-year 214 225 264 318 353 348 359 369 368 363 42416-year 206 217 258 310 353 344 359 361 363 35817-year 201 210 252 305 342 340 357 358 35018-year 198 205 248 301 336 334 347 35819-year 193 198 241 296 330 326 34620-year 190 195 238 290 321 323
Table 1319Leukemia
SEERa Relative Survival (Percent)By Year of Diagnosis
All Races Females
Year of Diagnosis
SEE
R C
ancer Statistics Review
1975-2016N
ational Cancer Institute
Devcan 677 April 2019 National Cancer Institute (httpssurveillancecancergovdevcan)Source Incidence data are from the SEER 21 areas (San Francisco Connecticut Detroit Hawaii Iowa New Mexico Seattle Utah Atlanta
San Jose-Monterey Los Angeles Alaska Native Registry Rural Georgia California excluding SFSJMLA Kentucky Louisiana New JerseyGeorgia excluding ATLRG Idaho New York and Massachusetts) Mortality data are from the NCHS public use data file for the total US
a Underlying incidence and mortality data for American IndianAlaska Native are based on the PRCDA(PurchasedReferred Care DeliveryAreas) counties
b Hispanic is not mutually exclusive from whites blacks AsianPacific Islanders and American IndiansAlaska NativesUnderlying incidence data for Hispanics are based on NHIA and exclude cases from the Alaska Native Registry
- Statistic could not be calculatedA percent of 000 represents a value that is below 0005
Risk of Being Risk of Being
Race Current Diagnosed with Cancer Risk of Dying Race Current Diagnosed with Cancer Risk of Dying
Ethnicity Age +10 yrs +20 yrs +30 yrs Ever from Cancer Ethnicity Age +10 yrs +20 yrs +30 yrs Ever from Cancer
All Races 0 006 009 012 156 082 Asian 0 005 008 011 099 058
10 003 006 010 152 082 Pacific 10 003 006 009 095 058
20 003 007 014 149 082 Islander 20 003 006 010 092 058
30 004 011 026 147 082 30 003 008 016 090 057
40 007 022 051 145 082 40 004 012 026 087 057
50 015 045 089 141 082 50 008 022 047 083 056
60 031 079 121 134 082 60 014 040 066 078 054
70 053 101 - 115 080 70 028 055 - 067 051
80 062 - - 082 068 80 032 - - 047 040
White 0 006 010 013 164 085 American 0 005 007 009 085 040
10 003 007 011 159 086 Indian 10 002 004 008 081 040
20 003 007 014 156 085 Alaska 20 002 006 010 079 039
30 004 011 027 155 085 Nativea 30 004 008 019 078 039
40 007 023 053 153 085 40 004 015 030 076 040
50 016 047 095 149 086 50 012 027 051 075 040
60 033 083 127 141 086 60 017 042 061 068 040
70 057 106 - 121 084 70 029 051 - 058 038
80 066 - - 086 071 80 029 - - 038 025
Black 0 003 006 008 107 058 Hispanicb 0 007 011 015 124 066
10 002 005 009 105 059 10 005 008 012 118 066
20 003 006 013 104 059 20 004 008 014 114 065
30 004 011 022 102 058 30 004 010 021 111 064
40 007 019 041 100 058 40 006 017 037 108 064
50 013 035 066 097 058 50 011 031 063 104 063
60 025 058 083 091 058 60 021 054 085 097 062
70 039 069 - 079 057 70 037 070 - 083 058
80 042 - - 056 048 80 042 - - 058 049
Table 1320
Leukemia
Risk of Being Diagnosed With Cancer in 10 20 and 30 Years
Lifetime Risk of Being Diagnosed with Cancer Given Alive and Cancer-Free at Current Age and
Lifetime Risk of Dying from Cancer Given Alive at Current Age
Both Sexes 2014-2016 By RaceEthnicity
SEE
R C
ancer Statistics Review
1975-2016N
ational Cancer Institute
Devcan 677 April 2019 National Cancer Institute (httpssurveillancecancergovdevcan)Source Incidence data are from the SEER 21 areas (San Francisco Connecticut Detroit Hawaii Iowa New Mexico Seattle Utah Atlanta
San Jose-Monterey Los Angeles Alaska Native Registry Rural Georgia California excluding SFSJMLA Kentucky Louisiana New JerseyGeorgia excluding ATLRG Idaho New York and Massachusetts) Mortality data are from the NCHS public use data file for the total US
a Underlying incidence and mortality data for American IndianAlaska Native are based on the PRCDA(PurchasedReferred Care DeliveryAreas) counties
b Hispanic is not mutually exclusive from whites blacks AsianPacific Islanders and American IndiansAlaska NativesUnderlying incidence data for Hispanics are based on NHIA and exclude cases from the Alaska Native Registry
- Statistic could not be calculatedA percent of 000 represents a value that is below 0005
Risk of Being Risk of Being
Race Current Diagnosed with Cancer Risk of Dying Race Current Diagnosed with Cancer Risk of Dying
Ethnicity Age +10 yrs +20 yrs +30 yrs Ever from Cancer Ethnicity Age +10 yrs +20 yrs +30 yrs Ever from Cancer
All Races 0 006 010 013 186 096 Asian 0 005 009 011 119 072
10 004 007 012 182 097 Pacific 10 004 007 010 115 072
20 003 008 016 179 097 Islander 20 003 007 012 111 071
30 005 013 030 177 097 30 004 009 019 109 071
40 008 026 062 176 098 40 005 015 033 106 070
50 018 056 112 173 099 50 010 028 062 102 069
60 040 101 152 166 101 60 019 054 084 096 068
70 071 129 - 146 101 70 038 071 - 084 065
80 082 - - 105 088 80 040 - - 056 052
White 0 007 011 014 195 101 American 0 006 009 011 110 048
10 004 008 012 190 102 Indian 10 003 005 010 105 048
20 004 008 016 187 101 Alaska 20 002 007 011 103 048
30 005 013 031 186 101 Nativea 30 005 009 021 103 048
40 009 027 065 184 102 40 005 017 041 102 049
50 019 058 118 181 103 50 013 039 075 102 051
60 042 107 160 174 106 60 028 067 087 097 051
70 075 136 - 153 105 70 046 070 - 081 049
80 087 - - 110 091 80 034 - - 049 030
Black 0 003 006 008 122 065 Hispanicb 0 007 013 017 141 080
10 003 006 009 122 066 10 005 010 015 135 080
20 003 006 014 120 065 20 005 009 016 130 079
30 004 011 025 119 066 30 005 011 023 127 078
40 008 022 048 118 066 40 007 018 040 124 078
50 015 042 079 115 067 50 012 034 072 120 078
60 031 071 102 112 068 60 024 064 100 114 078
70 051 089 - 101 068 70 046 086 - 102 077
80 058 - - 077 061 80 053 - - 074 070
Table 1321
Leukemia
Risk of Being Diagnosed With Cancer in 10 20 and 30 Years
Lifetime Risk of Being Diagnosed with Cancer Given Alive and Cancer-Free at Current Age and
Lifetime Risk of Dying from Cancer Given Alive at Current Age
Males 2014-2016 By RaceEthnicity
SEE
R C
ancer Statistics Review
1975-2016N
ational Cancer Institute
Devcan 677 April 2019 National Cancer Institute (httpssurveillancecancergovdevcan)Source Incidence data are from the SEER 21 areas (San Francisco Connecticut Detroit Hawaii Iowa New Mexico Seattle Utah Atlanta
San Jose-Monterey Los Angeles Alaska Native Registry Rural Georgia California excluding SFSJMLA Kentucky Louisiana New JerseyGeorgia excluding ATLRG Idaho New York and Massachusetts) Mortality data are from the NCHS public use data file for the total US
a Underlying incidence and mortality data for American IndianAlaska Native are based on the PRCDA(PurchasedReferred Care DeliveryAreas) counties
b Hispanic is not mutually exclusive from whites blacks AsianPacific Islanders and American IndiansAlaska NativesUnderlying incidence data for Hispanics are based on NHIA and exclude cases from the Alaska Native Registry
- Statistic could not be calculatedA percent of 000 represents a value that is below 0005
Risk of Being Risk of Being
Race Current Diagnosed with Cancer Risk of Dying Race Current Diagnosed with Cancer Risk of Dying
Ethnicity Age +10 yrs +20 yrs +30 yrs Ever from Cancer Ethnicity Age +10 yrs +20 yrs +30 yrs Ever from Cancer
All Races 0 006 008 011 129 068 Asian 0 005 008 010 083 048
10 003 005 009 125 069 Pacific 10 003 005 008 078 047
20 003 006 012 122 068 Islander 20 002 005 009 075 047
30 003 009 021 120 068 30 003 006 013 073 046
40 006 018 039 118 068 40 004 010 021 071 046
50 012 034 068 114 067 50 007 017 035 068 045
60 023 059 093 106 067 60 011 029 051 063 044
70 039 077 - 091 064 70 019 042 - 054 040
80 048 - - 066 055 80 026 - - 040 033
White 0 006 009 011 135 071 American 0 003 005 007 061 031
10 003 005 009 131 071 Indian 10 002 003 007 058 031
20 003 006 012 128 071 Alaska 20 002 005 008 056 031
30 003 010 022 126 071 Nativea 30 004 007 017 055 031
40 006 019 042 124 070 40 003 014 020 053 031
50 013 036 072 120 070 50 011 017 030 051 031
60 024 062 099 112 069 60 007 021 038 042 030
70 042 081 - 096 067 70 015 035 - 039 029
80 051 - - 069 057 80 025 - - 030 022
Black 0 004 006 008 095 053 Hispanicb 0 006 010 013 110 056
10 002 004 008 093 054 10 004 007 010 105 056
20 002 006 012 091 053 20 003 006 012 101 055
30 004 010 020 089 053 30 003 009 019 099 054
40 006 016 035 087 053 40 006 016 034 096 054
50 011 029 054 083 052 50 010 028 055 091 052
60 020 047 069 077 051 60 019 046 073 084 050
70 030 055 - 065 049 70 030 059 - 070 046
80 033 - - 046 042 80 035 - - 048 037
Table 1322
Leukemia
Risk of Being Diagnosed With Cancer in 10 20 and 30 Years
Lifetime Risk of Being Diagnosed with Cancer Given Alive and Cancer-Free at Current Age and
Lifetime Risk of Dying from Cancer Given Alive at Current Age
Females 2014-2016 By RaceEthnicity
SEER Cancer Statistics Review 1975-2016 National Cancer Institute
The AAPC is the Average Annual Percent Change over the time interval The AAPCs are calculated bythe Joinpoint Regression Program Version 47 February 2019 National Cancer Institute
- Statistic not shown Rate based on less than 16 cases for the time intervalTrend based on less than 10 cases for at least one year within the time interval
a Rates are age-adjusted to the 2000 US Std Population (19 age groups - Census P25-1130) Trendsare based on rates age-adjusted to the 2000 US Std Population (19 age groups - Census P25-1130)
b The SEER 9 areas are San Francisco Connecticut Detroit Hawaii Iowa New Mexico SeattleUtah and AtlantaThe SEER 21 areas comprise the SEER 9 areas plus San Jose-Monterey Los Angeles the AlaskaNative Registry Rural Georgia California excluding SFSJMLA Kentucky Louisiana New JerseyGeorgia excluding ATLRG Idaho New York and Massachusetts
c The 2007-2016 AAPC estimates are based on a Joinpoint analysis with up to 3 Joinpoints overdiagnosis years 2000-2016
d The 2007-2016 AAPC estimates are based on a Joinpoint analysis with up to 5 Joinpoints overdiagnosis years 1975-2016
e Hispanic and Non-Hispanic are not mutually exclusive from whites blacks AsianPacificIslanders and American IndiansAlaska Natives Incidence data for Hispanics and Non-Hispanicsare based on NHIA and exclude cases from the Alaska Native Registry
f Incidence data for American IndianAlaska Native are based on the PurchasedReferred CareDelivery Area (PRCDA) counties
g US Mortality Files National Center for Health Statistics CDCh The 2007-2016 mortality AAPCs are based on a Joinpoint analysis using years of death 2000-2016 The APC is significantly different from zero (plt05)
SEER Incidence SEER 21 Areasb SEER 21 Areasb SEER 9 Areasb
Rate 2012-2016 Trend 2007-2016c Trend 2007-2016d
Rate per 100000 persons AAPC () AAPC ()
Total Males Females Total Males Females Total Males Females RaceEthnicity
All Races 141 181 109 -04 -02 -06 -03 02 03
White 149 191 115 -05 -05 -07 04 03 05White Hispanice 112 134 94 01 -02 03 - - -White Non-Hispanice 153 197 116 -05 -05 -08 - - -
Black 109 139 89 06 02 07 01 01 02
AsianPacific Islander 78 97 63 01 00 02 - - -
Amer IndAlaska Natf 86 110 66 08 21 -01 - - -
Hispanice 108 130 91 02 00 03 - - -
US Mortalityg Rate 2012-2016 Trend 2007-2016h
Rate per 100000 persons AAPC ()
Total Males Females Total Males FemalesRaceEthnicity
All Races 65 88 49 -16 -17 -13
White 68 91 51 -14 -16 -12White Hispanice 50 63 41 -07 -08 -06White Non-Hispanice 69 93 51 -14 -15 -12
Black 55 72 44 -15 -17 -15
AsianPacific Islander 36 47 28 -18 -07 -23
Amer IndAlaska NatTotal US 31 42 23 -22 -09 -36PRCDA Counties 41 54 30 -16 -05 -28Non-PRCDA Counties 20 28 15 -31 -13 -50
Hispanice 47 60 38 -08 -09 -07
Table 1323Leukemia
SEER Incidence and US MortalityAge-Adjusted Rates and Trendsa
By RaceEthnicity and Sex
SEE
R C
ancer Statistics Review
1975-2016N
ational Cancer Institute
a Rates are per 100000 and are age-adjusted to the 2000 US Std Population (19 age groups - Census P25-1130)b The SEER 9 areas are San Francisco Connecticut Detroit Hawaii Iowa New Mexico Seattle Utah and Atlanta
The SEER 13 areas comprise the SEER 9 areas plus San Jose-Monterey Los Angeles the Alaska Native Registry and Rural GeorgiaThe SEER 18 areas comprise the SEER 13 areas plus California excluding SFSJMLA Kentucky Louisiana New Jersey and Georgiaexcluding ATLRGThe SEER 21 areas comprise the SEER 18 areas plus Idaho New York and Massachusetts
- Statistic not shown Rate based on less than 16 cases for the time interval
All Races Whites Blacks Total Males Females Total Males Females Total Males Females
SEER Incidence Ratesa 2012-2016
California 1239 1590 949 1337 1715 1020 1039 1334 813Greater Bay Area 1231 1619 915 1400 1844 1028 1098 1406 859San Francisco-Oakland 1212 1596 906 1389 1823 1034 1077 1336 881San Jose-Monterey 1259 1651 925 1410 1869 1011 1239 1787 -
Los Angeles 1173 1469 933 1291 1622 1016 1050 1294 884Greater California 1271 1633 968 1334 1709 1017 1007 1338 729
Connecticut 1406 1768 1117 1431 1790 1142 976 1126 867Detroit 1584 2050 1230 1707 2222 1300 1204 1485 1018Georgia 1430 1841 1120 1537 1970 1189 1139 1487 935Atlanta 1382 1819 1064 1563 2017 1207 1138 1557 884Rural Georgia 1411 1586 1206 1510 1773 1196 1248 - 1236Greater Georgia 1455 1863 1144 1531 1965 1182 1140 1450 968
Hawaii 1073 1339 843 1388 1612 1139 - - -Idaho 1588 1950 1263 1604 1973 1272 - - -Iowa 1627 2127 1222 1630 2133 1221 1416 1743 1076Kentucky 1566 1983 1234 1577 1995 1241 1159 1446 922Louisiana 1405 1789 1104 1518 1918 1197 1103 1393 890Massachusetts 1108 1429 854 1118 1448 856 787 1050 620New Jersey 1524 1962 1188 1541 1982 1199 1136 1469 928New Mexico 1299 1550 1086 1310 1556 1101 1045 - -New York 1623 2119 1244 1752 2281 1335 1068 1360 887Seattle-Puget Sound 1568 2020 1188 1634 2084 1249 1486 1929 1077Utah 1375 1793 1009 1401 1825 1029 - - -
SEER 9 Areasb 1419 1823 1094 1521 1945 1171 1154 1460 941SEER 13 Areasb 1357 1737 1049 1473 1882 1134 1126 1419 922SEER 18 Areasb 1376 1761 1066 1461 1867 1127 1114 1414 907SEER 21 Areasb 1407 1807 1088 1491 1912 1147 1089 1386 889
Table 1324Leukemia
Age-Adjusted SEER Incidence Ratesa
By Registry Race and Sex
SEE
R C
ancer Statistics Review
1975-2016N
ational Cancer Institute
a US Mortality Files National Center for Health Statistics Centers for Disease Control and PreventionRates are per 100000 and are age-adjusted to the 2000 US Std Population (19 age groups - Census P25-1130)
b The SEER 9 areas are San Francisco Connecticut Detroit Hawaii Iowa New Mexico Seattle Utah and AtlantaThe SEER 13 areas comprise the SEER 9 areas plus San Jose-Monterey Los Angeles the Alaska Native Registry and Rural GeorgiaThe SEER 18 areas comprise the SEER 13 areas plus California excluding SFSJMLA Kentucky Louisiana New Jersey and Georgiaexcluding ATLRGThe SEER 21 areas comprise the SEER 18 areas plus Idaho New York and Massachusetts
- Statistic not shown Rate based on less than 16 cases for the time interval
All Races Whites Blacks Total Males Females Total Males Females Total Males Females
SEER Death Ratesa 2012-2016
California 617 811 470 671 885 507 560 711 461Greater Bay Area 563 759 419 640 869 470 551 742 424San Francisco-Oakland 551 753 405 631 871 455 544 726 421San Jose-Monterey 584 768 446 653 863 495 604 - -
Los Angeles 608 797 468 675 894 513 571 717 483Greater California 639 835 489 677 886 515 553 687 458
Connecticut 622 837 465 639 862 474 536 665 449Detroit 662 915 485 691 967 494 573 723 475Georgia 614 817 467 642 855 478 538 706 438Atlanta 568 757 437 615 802 483 487 658 374Rural Georgia 581 628 538 579 635 - - - -Greater Georgia 639 851 482 654 879 477 576 745 483
Hawaii 463 593 362 543 632 440 - - -Idaho 655 846 497 661 865 492 - - -Iowa 693 961 498 700 963 508 - - -Kentucky 742 949 592 750 953 603 633 894 455Louisiana 677 906 514 705 953 520 603 776 498Massachusetts 622 830 478 647 869 490 463 524 444New Jersey 615 810 478 657 871 504 474 549 429New Mexico 560 759 400 589 794 421 - - -New York 621 842 466 675 910 506 450 602 356Seattle-Puget Sound 618 795 481 637 807 503 708 975 499Utah 679 865 526 693 876 542 - - -
SEER 9 Areasb 610 818 457 651 869 487 540 711 427SEER 13 Areasb 609 810 460 658 874 494 544 708 437SEER 18 Areasb 630 832 480 671 887 508 552 705 455SEER 21 Areasb 628 834 477 670 889 506 520 670 426
Total US 654 876 489 681 912 506 550 721 439
Table 1325Leukemia
Age-Adjusted SEER Death Ratesa
By Registry Race and Sex
SEER Cancer Statistics Review 1975-2016 National Cancer Institute
a US Mortality Files National Center for Health Statistics Centers for Disease Control andPrevention Rates are per 100000 and are age-adjusted to the 2000 US Std Population (19age groups - Census P25-1130)
b Difference between state rate and total US rate is statistically significant (plt=0002)c Absolute percent difference between state rate and total US rate is 15 or mored Rank of state level death rate and the 95 confidence intervals (low high) for the rankSE Standard error of the ratePD Percent difference between state rate and total US rate- Statistic not shown Rate based on less than 16 cases for the time interval
State Rate SE Rank(CI)d PD TOTAL US 654 002
High Five StatesOklahoma 790 019 01(0108) 2083c
West Virginia 749 025 02(0123) 1449South Dakota 747 040 03(0133) 1415Kentucky 742 018 04(0116) 1352Kansas 742 022 05(0122) 1350
Low Five StatesColorado 609 016 47(2649) -692Alaska 596 050 48(0451) -885New Mexico 560 022 49(3650) -1430DC 504 041 50(3251) -2293c
Hawaii 463 024 51(4951) -2913c
State Rate SE Rank(CI)d PD State Rate SE Rank(CI)d PD
Alabama 689 016 17(0532) 533 Montana 613 032 45(0950) -634Alaska 596 050 48(0451) -885 Nebraska 718 026 10(0131) 983Arizona 632 013 36(2248) -329 Nevada 644 021 28(1148) -157Arkansas 719 021 09(0127) 993 New Hampshire 638 029 31(0749) -238California 617 006 42(3248) -572 New Jersey 615 011 43(2849) -592Colorado 609 016 47(2649) -692 New Mexico 560 022 49(3650) -1430Connecticut 622 017 40(2249) -490 New York 621 007 41(2948) -499Delaware 664 035 24(0249) 152 North Carolina 634 011 34(2347) -310DC 504 041 50(3251) -2293c North Dakota 656 040 26(0249) 029Florida 630 007 38(2645) -370 Ohio 694 010 13(0626) 608Georgia 614 012 44(2849) -604 Oklahoma 790 019 01(0108) 2083c
Hawaii 463 024 51(4951) -2913c Oregon 632 017 37(1948) -331Idaho 655 028 27(0548) 012 Pennsylvania 680 009 21(1029) 396Illinois 684 010 19(0928) 463 Rhode Island 656 033 25(0349) 037Indiana 719 014 08(0222) 994 South Carolina 682 016 20(0634) 435Iowa 693 019 14(0334) 604 South Dakota 747 040 03(0133) 1415Kansas 742 022 05(0122) 1350 Tennessee 702 014 12(0327) 729Kentucky 742 018 04(0116) 1352 Texas 640 007 30(2342) -215Louisiana 677 017 23(0637) 356 Utah 679 024 22(0346) 387Maine 638 027 32(0949) -240 Vermont 636 041 33(0350) -277Maryland 633 014 35(2148) -323 Virginia 611 012 46(2849) -661Massachusetts 622 013 39(2548) -482 Washington 640 013 29(2047) -209Michigan 685 011 18(0829) 476 West Virginia 749 025 02(0123) 1449Minnesota 691 015 16(0430) 564 Wisconsin 727 015 06(0219) 1110Mississippi 692 021 15(0337) 580 Wyoming 721 049 07(0148) 1028Missouri 711 014 11(0324) 874
Table 1326Leukemia
Age-Adjusted Cancer Deatha Rates By State All Races 2012-2016
Males and Females
SEER Cancer Statistics Review 1975-2016 National Cancer Institute
a US Mortality Files National Center for Health Statistics Centers for Disease Control andPrevention Rates are per 100000 and are age-adjusted to the 2000 US Std Population (19age groups - Census P25-1130)
b Difference between state rate and total US rate is statistically significant (plt=0002)c Absolute percent difference between state rate and total US rate is 15 or mored Rank of state level death rate and the 95 confidence intervals (low high) for the rankSE Standard error of the ratePD Percent difference between state rate and total US rate- Statistic not shown Rate based on less than 16 cases for the time interval
State Rate SE Rank(CI)d PD TOTAL US 876 003
High Five StatesOklahoma 1022 034 01(0120) 1669c
Kansas 1018 039 02(0123) 1625c
Arkansas 991 037 03(0127) 1309South Dakota 985 068 04(0147) 1249Delaware 984 065 05(0144) 1236
Low Five StatesMontana 795 053 47(1150) -921New Mexico 759 039 48(2650) -1336Alaska 711 081 49(0851) -1887c
DC 704 078 50(1051) -1959c
Hawaii 593 040 51(4951) -3228c
State Rate SE Rank(CI)d PD State Rate SE Rank(CI)d PD
Alabama 939 029 17(0233) 725 Montana 795 053 47(1150) -921Alaska 711 081 49(0851) -1887c Nebraska 958 046 12(0141) 935Arizona 827 022 41(2449) -555 Nevada 858 037 33(0849) -210Arkansas 991 037 03(0127) 1309 New Hampshire 884 051 25(0149) 088California 811 010 43(3348) -738 New Jersey 810 020 44(2749) -747Colorado 834 028 39(2049) -484 New Mexico 759 039 48(2650) -1336Connecticut 837 031 37(1549) -441 New York 842 013 35(2546) -387Delaware 984 065 05(0144) 1236 North Carolina 863 020 31(1945) -149DC 704 078 50(1051) -1959c North Dakota 873 070 27(0150) -030Florida 839 012 36(2645) -422 Ohio 931 018 19(0529) 627Georgia 817 021 42(2649) -677 Oklahoma 1022 034 01(0120) 1669c
Hawaii 593 040 51(4951) -3228c Oregon 866 029 29(1147) -112Idaho 846 047 34(0550) -339 Pennsylvania 912 016 21(0931) 416Illinois 928 018 20(0529) 594 Rhode Island 911 059 22(0149) 400Indiana 960 025 11(0127) 959 South Carolina 951 029 13(0131) 853Iowa 961 035 08(0131) 969 South Dakota 985 068 04(0147) 1249Kansas 1018 039 02(0123) 1625c Tennessee 960 025 10(0127) 959Kentucky 949 031 15(0133) 832 Texas 870 013 28(2139) -069Louisiana 906 030 23(0442) 342 Utah 865 041 30(0549) -122Maine 803 046 46(1450) -836 Vermont 874 074 26(0150) -026Maryland 861 026 32(1447) -176 Virginia 809 021 45(2650) -770Massachusetts 830 023 40(2349) -529 Washington 835 023 38(2248) -463Michigan 937 020 18(0428) 702 West Virginia 972 044 06(0135) 1095Minnesota 948 027 16(0229) 826 Wisconsin 960 026 09(0127) 961Mississippi 970 039 07(0132) 1077 Wyoming 885 081 24(0150) 102Missouri 951 025 14(0228) 852
Table 1327Leukemia
Age-Adjusted Cancer Deatha Rates By State All Races 2012-2016
Males
SEER Cancer Statistics Review 1975-2016 National Cancer Institute
a US Mortality Files National Center for Health Statistics Centers for Disease Control andPrevention Rates are per 100000 and are age-adjusted to the 2000 US Std Population (19age groups - Census P25-1130)
b Difference between state rate and total US rate is statistically significant (plt=0002)c Absolute percent difference between state rate and total US rate is 15 or mored Rank of state level death rate and the 95 confidence intervals (low high) for the rankSE Standard error of the ratePD Percent difference between state rate and total US rate- Statistic not shown Rate based on less than 16 cases for the time interval
State Rate SE Rank(CI)d PD TOTAL US 489 002
High Five StatesOklahoma 615 023 01(0108) 2584c
Wyoming 596 060 02(0147) 2194c
Kentucky 592 021 03(0111) 2126c
West Virginia 576 030 04(0126) 1792c
South Dakota 564 047 05(0145) 1551c
Low Five StatesColorado 441 018 47(2250) -972Delaware 428 037 48(0751) -1247New Mexico 400 025 49(3151) -1803c
DC 381 046 50(1251) -2203c
Hawaii 362 029 51(4151) -2598c
State Rate SE Rank(CI)d PD State Rate SE Rank(CI)d PD
Alabama 512 019 18(0440) 483 Montana 452 037 43(0551) -745Alaska 485 062 27(0151) -073 Nebraska 531 030 10(0144) 864Arizona 473 015 31(1347) -308 Nevada 455 025 42(1150) -695Arkansas 516 024 15(0344) 554 New Hampshire 449 033 45(0651) -807California 470 007 34(2345) -383 New Jersey 478 013 30(1346) -223Colorado 441 018 47(2250) -972 New Mexico 400 025 49(3151) -1803c
Connecticut 465 020 40(1249) -487 New York 466 009 38(2246) -456Delaware 428 037 48(0751) -1247 North Carolina 471 012 32(1747) -350DC 381 046 50(1251) -2203c North Dakota 479 046 28(0151) -189Florida 460 008 41(2647) -582 Ohio 520 012 12(0529) 653Georgia 467 013 37(1747) -433 Oklahoma 615 023 01(0108) 2584c
Hawaii 362 029 51(4151) -2598c Oregon 449 019 44(1850) -799Idaho 497 033 22(0249) 174 Pennsylvania 516 011 14(0629) 556Illinois 514 011 16(0631) 526 Rhode Island 471 037 33(0351) -363Indiana 540 017 07(0226) 1052 South Carolina 495 018 23(0645) 133Iowa 498 022 20(0547) 200 South Dakota 564 047 05(0145) 1551c
Kansas 539 025 08(0137) 1032 Tennessee 517 016 13(0435) 590Kentucky 592 021 03(0111) 2126c Texas 467 008 36(2246) -431Louisiana 514 020 17(0442) 520 Utah 526 029 11(0146) 778Maine 508 032 19(0248) 403 Vermont 444 045 46(0351) -906Maryland 470 016 35(1448) -389 Virginia 465 014 39(1848) -474Massachusetts 478 015 29(1247) -220 Washington 487 016 25(0946) -022Michigan 498 013 21(0939) 192 West Virginia 576 030 04(0126) 1792c
Minnesota 494 017 24(0745) 121 Wisconsin 545 017 06(0225) 1162Mississippi 485 023 26(0548) -067 Wyoming 596 060 02(0147) 2194c
Missouri 535 017 09(0327) 953
Table 1328Leukemia
Age-Adjusted Cancer Deatha Rates By State All Races 2012-2016
Females
SEE
R C
ancer Statistics Review
1975-2016N
ational Cancer Institute
a US 2016 cancer prevalence counts are based on 2016 cancer prevalence proportions from the SEER 13 Areas (excluding the AlaskaNative Registry) and 112016 US population estimates based on the average of 2015 and 2016 population estimates from theUS Bureau of the CensusPrevalence was calculated using the first invasive tumor for each cancer site diagnosed during the previous 24 years
b Maximum limited-duration prevalence is 24 years for 1992-2016 datac Percentages are age-adjusted to the 2000 US Standard Population (19 age groups - Census P25-1130) by 5-year age groupsd Cases diagnosed more than 24 years ago were estimated using the completeness index method (Capocaccia et al 1997
Merrill et al 2000)e Complete prevalence is obtained by summing 0 to lt24 and gt=24- Statistic not shown Statistic based on fewer than 5 cases estimated alive in SEER for the time interval+ Not available
Years Since Diagnosis 0 to lt5 5 to lt10 10 to lt15 15 to lt20 20 to lt24 0 to lt24b gt=24d Completee
Race Sex All Races Both Sexes 153253 100309 63581 38012 21353 376508 38265 414773
Males 90192 57683 36029 21220 12020 217145 18411 235556Females 63061 42625 27552 16792 9333 159363 19854 179217
White Both Sexes 132173 87961 56051 33596 19035 328814 32999 370135Males 78368 50894 32033 18770 10845 190910 15102 210930Females 53805 37067 24018 14826 8190 137905 17897 159205
Black Both Sexes 12734 6564 4233 2487 1259 27277 4070 31347Males 6847 3556 2204 1334 637 14578 1776 16354Females 5887 3008 2029 1153 622 12699 2294 14992
Asian Both Sexes 3926 2561 1778 1164 690 10120 + +Pacific Males 2235 1462 936 646 351 5630 + +Islander Females 1691 1100 842 519 339 4490 + +
Hispanic Both Sexes 14464 9581 6796 4462 2630 37933 + +Males 8166 5374 3794 2408 1538 21280 + +Females 6298 4207 3002 2055 1092 16654 + +
Age Specific (Crude) Age-Adjustedc Age at Prevalence All Ages 0-9 10-19 20-29 30-39 40-49 50-59 60-69 70-79 80+ All Ages
Race Sex All Races Both Sexes 01168 00328 00640 00628 00377 00561 01053 02263 04023 05111 01054
Males 01369 00339 00706 00685 00419 00657 01287 02888 05282 07048 01306Females 00974 00317 00572 00570 00333 00466 00829 01696 02974 03919 00844
White Both Sexes 01304 00369 00715 00712 00410 00584 01106 02389 04249 05386 01127Males 01528 00379 00789 00771 00457 00682 01349 03042 05558 07387 01389Females 01084 00359 00637 00650 00362 00484 00869 01784 03135 04133 00904
Black Both Sexes 00605 00145 00322 00320 00267 00463 00752 01455 02470 03076 00660Males 00674 00142 00357 00338 00281 00530 00919 01737 03249 04580 00816Females 00541 00148 00286 00301 00255 00402 00605 01230 01927 02334 00552
Asian Both Sexes 00497 00264 00531 00426 00230 00390 00553 00882 01245 01389 00513Pacific Males 00577 00298 00555 00507 00249 00461 00665 01122 01552 01904 00613Islander Females 00423 00228 00507 00345 00212 00327 00456 00688 00999 01057 00430
Hispanic Both Sexes 00664 00375 00737 00728 00395 00485 00723 01191 01987 02074 00746Males 00737 00397 00827 00807 00471 00576 00831 01350 02221 02551 00854Females 00589 00352 00642 00641 00312 00391 00617 01050 01809 01780 00647
Table 1329Leukemia
Estimated United States Cancer Prevalence Countsa on January 1 2016By RaceEthnicity Sex and Years Since Diagnosis
Estimated prevalence percenta on January 1 2016 of the SEER population diagnosed in the previous 24 yearsBy Age at Prevalence RaceEthnicity and Sex
SEE
R C
ancer Statistics Review
1975-2016N
ational Cancer Institute
a US 2016 cancer prevalence counts are based on 2016 cancer prevalence proportions from the SEER 13 Areas (excluding the AlaskaNative Registry) and 112016 US population estimates based on the average of 2015 and 2016 population estimates from theUS Bureau of the CensusPrevalence was calculated using the first invasive tumor for each cancer site diagnosed during the previous 24 years
b Maximum limited-duration prevalence is 24 years for 1992-2016 datac Percentages are age-adjusted to the 2000 US Standard Population (19 age groups - Census P25-1130) by 5-year age groupsd Cases diagnosed more than 24 years ago were estimated using the completeness index method (Capocaccia et al 1997
Merrill et al 2000)e Complete prevalence is obtained by summing 0 to lt24 and gt=24- Statistic not shown Statistic based on fewer than 5 cases estimated alive in SEER for the time interval+ Not available
Years Since Diagnosis 0 to lt5 5 to lt10 10 to lt15 15 to lt20 20 to lt24 0 to lt24b gt=24d Completee
Race Sex All Races Both Sexes 20277 16033 13721 12074 8203 70308 25456 95764
Males 11203 9049 7751 6542 4634 39179 12997 52176Females 9074 6984 5971 5531 3568 31129 12460 43589
White Both Sexes 17123 13855 11870 10663 7154 60665 21823 83282Males 9549 7741 6768 5696 4084 33839 11286 45559Females 7573 6114 5102 4967 3070 26826 10537 37723
Black Both Sexes 1590 1133 923 727 553 4926 1609 6535Males 809 734 473 411 290 2716 592 3308Females 781 399 450 317 263 2210 1017 3227
Asian Both Sexes 998 720 669 486 361 3234 + +Pacific Males 527 406 369 313 178 1793 + +Islander Females 472 314 300 173 183 1441 + +
Hispanic Both Sexes 5905 4543 3352 2717 1749 18266 + +Males 3302 2686 1899 1465 1058 10409 + +Females 2603 1857 1454 1252 692 7857 + +
Age Specific (Crude) Age-Adjustedc Age at Prevalence All Ages 0-9 10-19 20-29 30-39 40-49 50-59 60-69 70-79 80+ All Ages
Race Sex All Races Both Sexes 00218 00276 00541 00467 00139 00078 00059 00065 00053 00033 00228
Males 00247 00286 00591 00520 00163 00095 00066 00069 00056 00035 00251Females 00190 00266 00488 00410 00115 00062 00053 00062 00050 00032 00204
White Both Sexes 00241 00315 00612 00542 00161 00086 00063 00070 00056 00033 00259Males 00271 00323 00670 00598 00186 00107 00069 00074 00060 00032 00284Females 00211 00306 00551 00482 00135 00064 00057 00066 00053 00033 00232
Black Both Sexes 00109 00107 00250 00197 00067 00042 00039 00029 00012 00027 00102Males 00126 00112 00281 00224 00079 00035 00052 00026 00012 00027 00112Females 00094 00102 00219 00171 00056 00047 00028 00032 00013 00027 00092
Asian Both Sexes 00159 00208 00418 00289 00071 00064 00045 00050 00054 00036 00163Pacific Males 00184 00226 00427 00360 00086 00069 00055 00054 00033 00055 00180Islander Females 00136 00190 00408 00219 00058 00059 00036 00047 00071 00023 00146
Hispanic Both Sexes 00320 00328 00637 00574 00165 00107 00093 00100 00084 00012 00279Males 00361 00342 00710 00648 00205 00131 00110 00063 00072 - 00309Females 00278 00312 00562 00494 00122 00082 00077 00133 00093 00020 00246
Table 1330Acute Lymphocytic Leukemia
Estimated United States Cancer Prevalence Countsa on January 1 2016By RaceEthnicity Sex and Years Since Diagnosis
Estimated prevalence percenta on January 1 2016 of the SEER population diagnosed in the previous 24 yearsBy Age at Prevalence RaceEthnicity and Sex
0
5
10
15
20
25
1975 1985 1995 2005 20160
5
10
15
20
25
1975 1985 1995 2005 20160
3
6
9
12
15
1975 1985 1995 2005 20160
3
6
9
12
15
1975 1985 1995 2005 2016
Delay-Adj IncidenceDelay-Adj Incidence
Observed IncidenceObserved Incidence
MortalityMortality
SEER Observed Incidence SEER Delay Adjusted Incidence and US Death RatesLeukemia by Race and Sex
a
Figure 131
Source SEER 9 areas and US Mortality Files (National Center for Health Statistics CDC)Rates are age-adjusted to the 2000 US Std Population (19 age groups - Census P25-1103)Regression lines and APCs are calculated using the Joinpoint Regression Program Version 47 February 2019 National Cancer InstituteThe APC is the Annual Percent Change for the regression line segments The APC shown on the graph is for the most recent trendThe APC is significantly different from zero (p lt 005)
a
White Male Black Male White Female Black FemaleRate per 100000 Rate per 100000 Rate per 100000 Rate per 100000
Year of DiagnosisDeath Year of DiagnosisDeath Year of DiagnosisDeath Year of DiagnosisDeath
SEER Incidence APCsDelay Adj 1998-16 = 08Observed 1975-16 = 03
US Mortality APC2013-16 = -30
SEER Incidence APCsDelay Adj 1975-16 = 02Observed 1975-16 = 01
US Mortality APC1993-16 = -15
SEER Incidence APCsDelay Adj 1975-16 = 06Observed 1975-16 = 05
US Mortality APC2000-16 = -12
SEER Incidence APCsDelay Adj 1975-16 = 03Observed 1975-16 = 02
US Mortality APC1993-16 = -13
SEE
R C
ancer Statistics Review
1975-2016N
ational Cancer Institute
0
1
2
3
4
5
6
7
8
1975 1985 1995 2005 20160
1
2
3
4
5
6
7
8
1975 1985 1995 2005 20160
1
2
3
4
5
6
7
8
1975 1985 1995 2005 20160
1
2
3
4
5
6
7
8
1975 1985 1995 2005 2016
Chronic
Acute
SEER Observed Incidence RatesLymphocytic and Myeloid Leukemia (Acute and Chronic) by Sex
a
Figure 132
Source SEER 9 areas Rates are age-adjusted to the 2000 US Std Population (19 age groups - Census P25-1103)Regression lines and APCs are calculated using the Joinpoint Regression Program Version 47 February 2019 National Cancer Institute
a
Male Female Male FemaleLymphocytic Leukemia Myeloid Leukemia
Rate per 100000 Rate per 100000 Rate per 100000 Rate per 100000
Year of Diagnosis Year of Diagnosis Year of Diagnosis Year of Diagnosis
SEE
R C
ancer Statistics Review
1975-2016N
ational Cancer Institute
Joinpoint Analyses for Whites and Blacks from 1975-2016and for AsianPacific Islanders American IndiansAlaska Natives and Hispanics from 2000-2016
0
5
10
15
20
1975 1985 1995 2005 20160
5
10
15
20
1975 1985 1995 2005 2016
White
Black
API
AIAN
Hispanic
SEER Incidence and US Death RatesLeukemia Both Sexes
Figure 133
Source Incidence data for whites and blacks are from the SEER 9 areas (San Francisco Connecticut Detroit Hawaii Iowa New Mexico Seattle Utah Atlanta)Incidence data for AsianPacific Islanders American IndiansAlaska Natives and Hispanics are from the SEER 21 areas (SEER 9 areas San Jose-MontereyLos Angeles Alaska Native Registry Rural Georgia California excluding SFSJMLA Kentucky Louisiana New Jersey Georgia excluding ATLRG Idaho New York andMassachusetts)Mortality data are from US Mortality Files National Center for Health Statistics CDCRates are age-adjusted to the 2000 US Std Population (19 age groups - Census P25-1103)Regression lines are calculated using the Joinpoint Regression Program Version 47 February 2019 National Cancer Institute Joinpoint analyses for Whites andBlacks during the 1975-2016 period allow a maximum of 5 joinpoints Analyses for other ethnic groups during the period 2000-2016 allow a maximum of 3 joinpointsAPI = AsianPacific IslanderAIAN = American IndianAlaska Native Rates for American IndianAlaska Native are based on the PurchasedReferred Care Delivery Area (PRCDA) countiesHispanic is not mutually exclusive from whites blacks AsianPacific Islanders and American IndiansAlaska Natives Incidence data for Hispanics are based onNHIA and exclude cases from the Alaska Native Registry
Incidence MortalityRate per 100000 Rate per 100000
Year of Diagnosis Year of Death
a
d
a
b
c
c
b
d
SEE
R C
ancer Statistics Review
1975-2016N
ational Cancer Institute
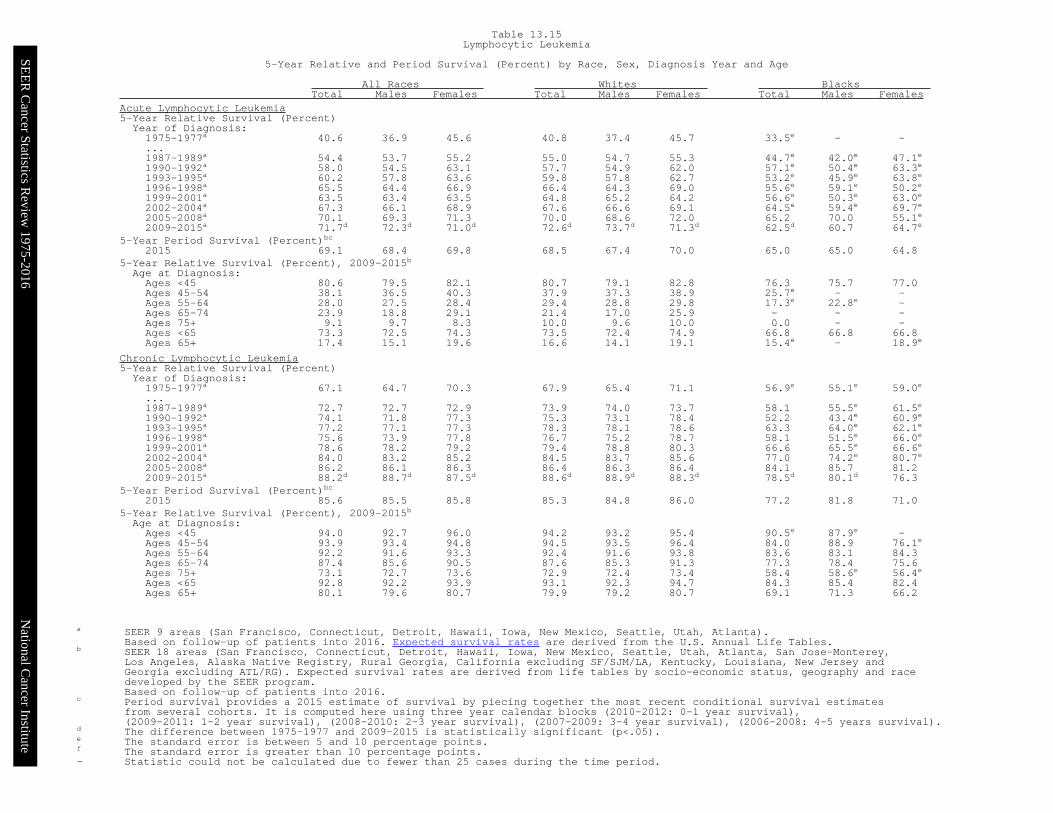
SEE
R C
ancer Statistics Review
1975-2016N
ational Cancer Institute
a SEER 9 areas (San Francisco Connecticut Detroit Hawaii Iowa New Mexico Seattle Utah Atlanta)Based on follow-up of patients into 2016 Expected survival rates are derived from the US Annual Life Tables
b SEER 18 areas (San Francisco Connecticut Detroit Hawaii Iowa New Mexico Seattle Utah Atlanta San Jose-MontereyLos Angeles Alaska Native Registry Rural Georgia California excluding SFSJMLA Kentucky Louisiana New Jersey andGeorgia excluding ATLRG) Expected survival rates are derived from life tables by socio-economic status geography and racedeveloped by the SEER programBased on follow-up of patients into 2016
c Period survival provides a 2015 estimate of survival by piecing together the most recent conditional survival estimatesfrom several cohorts It is computed here using three year calendar blocks (2010-2012 0-1 year survival)(2009-2011 1-2 year survival) (2008-2010 2-3 year survival) (2007-2009 3-4 year survival) (2006-2008 4-5 years survival)
d The difference between 1975-1977 and 2009-2015 is statistically significant (plt05)e The standard error is between 5 and 10 percentage pointsf The standard error is greater than 10 percentage points- Statistic could not be calculated due to fewer than 25 cases during the time period
All Races Whites Blacks Total Males Females Total Males Females Total Males Females
Acute Myeloid Leukemia5-Year Relative Survival (Percent)Year of Diagnosis1975-1977a 62 55 70 58 54 62 101 82 1171987-1989a 115 92 141 113 97 132 92 44 157e1990-1992a 138 126 152 135 122 150 135 129 1391993-1995a 161 149 174 153 141 167 215 206e 2201996-1998a 170 159 183 156 145 171 221 252 1821999-2001a 192 188 197 187 176 199 193 248 1422002-2004a 234 209 264 232 208 260 253 265 2402005-2008a 249 235 265 242 228 257 239 193 2772009-2015a 294d 291d 298d 290d 284d 299d 292d 280d 301d
5-Year Period Survival (Percent)bc2015 286 278 294 282 276 289 283 262 301
5-Year Relative Survival (Percent) 2009-2015bAge at DiagnosisAges lt45 604 585 624 621 599 645 511 482 538Ages 45-54 441 439 444 456 450 463 337 342 336Ages 55-64 300 281 325 308 285 338 231 234 224Ages 65-74 139 137 141 145 144 146 103 78 131Ages 75+ 34 40 27 34 41 27 24 - 20Ages lt65 466 444 491 474 449 504 393 371 414Ages 65+ 79 85 72 82 89 73 64 58 71
Chronic Myeloid Leukemia5-Year Relative Survival (Percent)Year of Diagnosis1975-1977a 218 193 251 205 184 234 277e 216e 355e1987-1989a 303 306 298 301 310 290 333e 281e 413e1990-1992a 307 296 322 303 300 306 349e 255e 449e1993-1995a 355 353 358 352 351 352 356e 328e 402e1996-1998a 371 377 363 380 376 385 310 304e 314e1999-2001a 473 459 492 459 441 483 490e 496e 481e2002-2004a 543 530 561 526 514 541 630e 621e 640e2005-2008a 631 632 629 617 615 621 643 664e 608e2009-2015a 697d 681d 718d 690d 677d 707d 736d 711d 763d
5-Year Period Survival (Percent)bc2015 695 683 712 681 666 702 723 714 735
5-Year Relative Survival (Percent) 2009-2015bAge at DiagnosisAges lt45 899 889 913 916 905 934 797 786 812Ages 45-54 874 860 891 871 858 888 871 842 900Ages 55-64 776 748 816 781 750 826 698 676e 719eAges 65-74 611 579 656 609 578 654 584e 526e 637eAges 75+ 326 305 346 321 302 336 362e 362f 362eAges lt65 851 836 873 856 839 883 790 773 808Ages 65+ 462 444 484 456 441 475 495 471e 515e
Table 1316Myeloid Leukemia
5-Year Relative and Period Survival (Percent) by Race Sex Diagnosis Year and Age
SEE
R C
ancer Statistics Review
1975-2016N
ational Cancer Institute
a Based on the SEER 9 areas (San Francisco Connecticut Detroit Hawaii Iowa New Mexico Seattle Utah and Atlanta)Expected survival rates are derived from the US Annual Life Tables
1975- 1980- 1985- 1990-1979 1984 1989 1994 1995 1996 1997 1998 1999 2000 2001 2002 2003 2004 2005 2006 2007 2008 2009 2010 2011 2012 2013 2014 2015
Survival Time
1-year 608 626 648 669 681 682 679 667 659 669 706 722 732 751 742 765 769 766 774 783 794 791 790 791 8062-year 501 525 553 575 589 599 598 580 583 590 630 649 662 677 684 705 706 702 709 725 732 725 732 7343-year 437 465 496 528 543 554 549 541 547 551 590 619 624 643 647 673 676 665 684 692 703 692 6984-year 388 417 455 491 507 519 509 503 516 520 567 596 595 619 627 647 653 639 658 676 683 6735-year 346 376 423 461 481 487 483 482 484 499 543 578 575 596 610 626 637 619 635 659 6656-year 314 351 399 435 457 465 458 461 462 485 524 560 556 572 593 607 622 604 613 6477-year 291 325 371 409 442 451 438 446 444 473 510 544 537 560 579 591 614 587 6018-year 270 304 350 388 417 438 432 431 430 457 496 535 519 546 561 573 603 5769-year 250 285 330 373 406 420 418 421 421 449 483 519 507 530 546 561 59310-year 237 269 316 360 390 406 406 410 406 438 471 504 489 515 532 54511-year 224 257 299 347 378 398 387 397 392 426 459 492 473 499 52712-year 212 246 288 336 371 387 377 390 383 419 449 483 460 49213-year 204 236 280 327 367 382 370 380 372 404 442 466 45414-year 198 229 272 318 356 371 368 370 367 392 434 45615-year 192 223 267 313 353 361 362 358 359 383 42316-year 185 214 261 306 350 359 361 350 353 37417-year 181 207 256 300 340 355 352 346 34718-year 177 201 253 294 330 351 346 34319-year 171 195 248 291 326 343 34420-year 166 191 244 286 319 338
Table 1317Leukemia
SEERa Relative Survival (Percent)By Year of Diagnosis
All Races Males and Females
Year of Diagnosis
SEE
R C
ancer Statistics Review
1975-2016N
ational Cancer Institute
a Based on the SEER 9 areas (San Francisco Connecticut Detroit Hawaii Iowa New Mexico Seattle Utah and Atlanta)Expected survival rates are derived from the US Annual Life Tables
1975- 1980- 1985- 1990-1979 1984 1989 1994 1995 1996 1997 1998 1999 2000 2001 2002 2003 2004 2005 2006 2007 2008 2009 2010 2011 2012 2013 2014 2015
Survival Time
1-year 604 628 655 679 692 697 688 667 668 688 729 731 742 767 761 770 780 775 791 793 806 797 803 812 8172-year 494 524 561 583 604 616 611 585 590 608 648 652 669 687 701 706 719 716 727 740 746 733 749 7513-year 427 460 499 532 556 573 552 546 552 573 608 624 627 653 664 674 689 679 699 712 719 698 7144-year 377 411 459 494 516 535 505 505 520 539 581 598 601 627 650 648 667 650 677 690 697 6775-year 334 371 429 462 482 495 479 484 480 523 553 573 578 602 630 626 653 632 656 673 6846-year 303 343 404 435 452 471 459 461 461 508 529 554 557 575 609 602 635 615 631 6617-year 277 318 373 409 439 458 438 444 439 498 514 531 535 564 594 588 625 595 6168-year 254 294 354 385 417 446 430 430 423 478 500 520 514 549 572 563 616 5839-year 232 275 332 371 404 423 421 419 415 464 486 507 501 526 553 548 60510-year 219 260 317 358 382 407 413 410 401 454 473 490 479 511 539 52611-year 205 249 302 346 377 398 391 393 383 444 461 474 464 496 53312-year 193 242 290 334 371 390 380 384 375 437 452 467 455 49113-year 186 234 283 325 367 389 373 369 363 420 442 455 44714-year 179 227 277 315 357 379 370 358 357 410 433 44715-year 175 221 269 309 352 371 365 349 351 399 42216-year 168 212 263 303 347 369 360 341 346 38717-year 164 204 260 296 339 366 348 335 34318-year 159 199 257 290 324 364 345 33119-year 154 192 253 288 322 355 34120-year 146 187 249 283 316 347
Table 1318Leukemia
SEERa Relative Survival (Percent)By Year of Diagnosis
All Races Males
Year of Diagnosis
SEE
R C
ancer Statistics Review
1975-2016N
ational Cancer Institute
a Based on the SEER 9 areas (San Francisco Connecticut Detroit Hawaii Iowa New Mexico Seattle Utah and Atlanta)Expected survival rates are derived from the US Annual Life Tables
1975- 1980- 1985- 1990-1979 1984 1989 1994 1995 1996 1997 1998 1999 2000 2001 2002 2003 2004 2005 2006 2007 2008 2009 2010 2011 2012 2013 2014 2015
Survival Time
1-year 613 623 638 655 665 664 666 667 646 643 675 710 719 729 715 759 755 754 751 769 778 782 772 761 7912-year 509 527 542 564 569 578 580 574 573 564 606 645 653 664 660 705 689 684 684 705 714 716 709 7093-year 450 471 492 523 525 529 544 534 539 522 564 612 619 628 624 673 657 647 663 666 681 685 6774-year 402 424 449 485 495 498 514 500 511 494 548 594 587 608 595 646 633 624 633 658 664 6685-year 361 384 414 459 480 475 489 479 489 466 530 584 570 588 582 627 615 601 607 641 6396-year 328 360 392 435 464 457 456 461 463 455 516 567 556 569 572 613 602 589 588 6297-year 309 334 367 410 447 443 438 448 450 438 504 561 539 556 558 594 598 575 5798-year 290 316 344 391 416 428 433 433 438 428 490 556 526 542 546 585 582 5639-year 273 299 326 376 409 416 413 424 429 428 477 535 515 534 535 576 57610-year 259 281 315 364 399 405 396 409 414 416 468 522 502 521 521 56811-year 247 269 295 347 378 398 383 403 403 401 456 515 486 503 51812-year 235 250 285 338 372 382 373 397 393 395 445 505 468 49313-year 228 239 276 329 365 373 366 392 385 383 442 481 46314-year 220 232 267 323 355 361 363 385 380 367 434 46815-year 214 225 264 318 353 348 359 369 368 363 42416-year 206 217 258 310 353 344 359 361 363 35817-year 201 210 252 305 342 340 357 358 35018-year 198 205 248 301 336 334 347 35819-year 193 198 241 296 330 326 34620-year 190 195 238 290 321 323
Table 1319Leukemia
SEERa Relative Survival (Percent)By Year of Diagnosis
All Races Females
Year of Diagnosis
SEE
R C
ancer Statistics Review
1975-2016N
ational Cancer Institute
Devcan 677 April 2019 National Cancer Institute (httpssurveillancecancergovdevcan)Source Incidence data are from the SEER 21 areas (San Francisco Connecticut Detroit Hawaii Iowa New Mexico Seattle Utah Atlanta
San Jose-Monterey Los Angeles Alaska Native Registry Rural Georgia California excluding SFSJMLA Kentucky Louisiana New JerseyGeorgia excluding ATLRG Idaho New York and Massachusetts) Mortality data are from the NCHS public use data file for the total US
a Underlying incidence and mortality data for American IndianAlaska Native are based on the PRCDA(PurchasedReferred Care DeliveryAreas) counties
b Hispanic is not mutually exclusive from whites blacks AsianPacific Islanders and American IndiansAlaska NativesUnderlying incidence data for Hispanics are based on NHIA and exclude cases from the Alaska Native Registry
- Statistic could not be calculatedA percent of 000 represents a value that is below 0005
Risk of Being Risk of Being
Race Current Diagnosed with Cancer Risk of Dying Race Current Diagnosed with Cancer Risk of Dying
Ethnicity Age +10 yrs +20 yrs +30 yrs Ever from Cancer Ethnicity Age +10 yrs +20 yrs +30 yrs Ever from Cancer
All Races 0 006 009 012 156 082 Asian 0 005 008 011 099 058
10 003 006 010 152 082 Pacific 10 003 006 009 095 058
20 003 007 014 149 082 Islander 20 003 006 010 092 058
30 004 011 026 147 082 30 003 008 016 090 057
40 007 022 051 145 082 40 004 012 026 087 057
50 015 045 089 141 082 50 008 022 047 083 056
60 031 079 121 134 082 60 014 040 066 078 054
70 053 101 - 115 080 70 028 055 - 067 051
80 062 - - 082 068 80 032 - - 047 040
White 0 006 010 013 164 085 American 0 005 007 009 085 040
10 003 007 011 159 086 Indian 10 002 004 008 081 040
20 003 007 014 156 085 Alaska 20 002 006 010 079 039
30 004 011 027 155 085 Nativea 30 004 008 019 078 039
40 007 023 053 153 085 40 004 015 030 076 040
50 016 047 095 149 086 50 012 027 051 075 040
60 033 083 127 141 086 60 017 042 061 068 040
70 057 106 - 121 084 70 029 051 - 058 038
80 066 - - 086 071 80 029 - - 038 025
Black 0 003 006 008 107 058 Hispanicb 0 007 011 015 124 066
10 002 005 009 105 059 10 005 008 012 118 066
20 003 006 013 104 059 20 004 008 014 114 065
30 004 011 022 102 058 30 004 010 021 111 064
40 007 019 041 100 058 40 006 017 037 108 064
50 013 035 066 097 058 50 011 031 063 104 063
60 025 058 083 091 058 60 021 054 085 097 062
70 039 069 - 079 057 70 037 070 - 083 058
80 042 - - 056 048 80 042 - - 058 049
Table 1320
Leukemia
Risk of Being Diagnosed With Cancer in 10 20 and 30 Years
Lifetime Risk of Being Diagnosed with Cancer Given Alive and Cancer-Free at Current Age and
Lifetime Risk of Dying from Cancer Given Alive at Current Age
Both Sexes 2014-2016 By RaceEthnicity
SEE
R C
ancer Statistics Review
1975-2016N
ational Cancer Institute
Devcan 677 April 2019 National Cancer Institute (httpssurveillancecancergovdevcan)Source Incidence data are from the SEER 21 areas (San Francisco Connecticut Detroit Hawaii Iowa New Mexico Seattle Utah Atlanta
San Jose-Monterey Los Angeles Alaska Native Registry Rural Georgia California excluding SFSJMLA Kentucky Louisiana New JerseyGeorgia excluding ATLRG Idaho New York and Massachusetts) Mortality data are from the NCHS public use data file for the total US
a Underlying incidence and mortality data for American IndianAlaska Native are based on the PRCDA(PurchasedReferred Care DeliveryAreas) counties
b Hispanic is not mutually exclusive from whites blacks AsianPacific Islanders and American IndiansAlaska NativesUnderlying incidence data for Hispanics are based on NHIA and exclude cases from the Alaska Native Registry
- Statistic could not be calculatedA percent of 000 represents a value that is below 0005
Risk of Being Risk of Being
Race Current Diagnosed with Cancer Risk of Dying Race Current Diagnosed with Cancer Risk of Dying
Ethnicity Age +10 yrs +20 yrs +30 yrs Ever from Cancer Ethnicity Age +10 yrs +20 yrs +30 yrs Ever from Cancer
All Races 0 006 010 013 186 096 Asian 0 005 009 011 119 072
10 004 007 012 182 097 Pacific 10 004 007 010 115 072
20 003 008 016 179 097 Islander 20 003 007 012 111 071
30 005 013 030 177 097 30 004 009 019 109 071
40 008 026 062 176 098 40 005 015 033 106 070
50 018 056 112 173 099 50 010 028 062 102 069
60 040 101 152 166 101 60 019 054 084 096 068
70 071 129 - 146 101 70 038 071 - 084 065
80 082 - - 105 088 80 040 - - 056 052
White 0 007 011 014 195 101 American 0 006 009 011 110 048
10 004 008 012 190 102 Indian 10 003 005 010 105 048
20 004 008 016 187 101 Alaska 20 002 007 011 103 048
30 005 013 031 186 101 Nativea 30 005 009 021 103 048
40 009 027 065 184 102 40 005 017 041 102 049
50 019 058 118 181 103 50 013 039 075 102 051
60 042 107 160 174 106 60 028 067 087 097 051
70 075 136 - 153 105 70 046 070 - 081 049
80 087 - - 110 091 80 034 - - 049 030
Black 0 003 006 008 122 065 Hispanicb 0 007 013 017 141 080
10 003 006 009 122 066 10 005 010 015 135 080
20 003 006 014 120 065 20 005 009 016 130 079
30 004 011 025 119 066 30 005 011 023 127 078
40 008 022 048 118 066 40 007 018 040 124 078
50 015 042 079 115 067 50 012 034 072 120 078
60 031 071 102 112 068 60 024 064 100 114 078
70 051 089 - 101 068 70 046 086 - 102 077
80 058 - - 077 061 80 053 - - 074 070
Table 1321
Leukemia
Risk of Being Diagnosed With Cancer in 10 20 and 30 Years
Lifetime Risk of Being Diagnosed with Cancer Given Alive and Cancer-Free at Current Age and
Lifetime Risk of Dying from Cancer Given Alive at Current Age
Males 2014-2016 By RaceEthnicity
SEE
R C
ancer Statistics Review
1975-2016N
ational Cancer Institute
Devcan 677 April 2019 National Cancer Institute (httpssurveillancecancergovdevcan)Source Incidence data are from the SEER 21 areas (San Francisco Connecticut Detroit Hawaii Iowa New Mexico Seattle Utah Atlanta
San Jose-Monterey Los Angeles Alaska Native Registry Rural Georgia California excluding SFSJMLA Kentucky Louisiana New JerseyGeorgia excluding ATLRG Idaho New York and Massachusetts) Mortality data are from the NCHS public use data file for the total US
a Underlying incidence and mortality data for American IndianAlaska Native are based on the PRCDA(PurchasedReferred Care DeliveryAreas) counties
b Hispanic is not mutually exclusive from whites blacks AsianPacific Islanders and American IndiansAlaska NativesUnderlying incidence data for Hispanics are based on NHIA and exclude cases from the Alaska Native Registry
- Statistic could not be calculatedA percent of 000 represents a value that is below 0005
Risk of Being Risk of Being
Race Current Diagnosed with Cancer Risk of Dying Race Current Diagnosed with Cancer Risk of Dying
Ethnicity Age +10 yrs +20 yrs +30 yrs Ever from Cancer Ethnicity Age +10 yrs +20 yrs +30 yrs Ever from Cancer
All Races 0 006 008 011 129 068 Asian 0 005 008 010 083 048
10 003 005 009 125 069 Pacific 10 003 005 008 078 047
20 003 006 012 122 068 Islander 20 002 005 009 075 047
30 003 009 021 120 068 30 003 006 013 073 046
40 006 018 039 118 068 40 004 010 021 071 046
50 012 034 068 114 067 50 007 017 035 068 045
60 023 059 093 106 067 60 011 029 051 063 044
70 039 077 - 091 064 70 019 042 - 054 040
80 048 - - 066 055 80 026 - - 040 033
White 0 006 009 011 135 071 American 0 003 005 007 061 031
10 003 005 009 131 071 Indian 10 002 003 007 058 031
20 003 006 012 128 071 Alaska 20 002 005 008 056 031
30 003 010 022 126 071 Nativea 30 004 007 017 055 031
40 006 019 042 124 070 40 003 014 020 053 031
50 013 036 072 120 070 50 011 017 030 051 031
60 024 062 099 112 069 60 007 021 038 042 030
70 042 081 - 096 067 70 015 035 - 039 029
80 051 - - 069 057 80 025 - - 030 022
Black 0 004 006 008 095 053 Hispanicb 0 006 010 013 110 056
10 002 004 008 093 054 10 004 007 010 105 056
20 002 006 012 091 053 20 003 006 012 101 055
30 004 010 020 089 053 30 003 009 019 099 054
40 006 016 035 087 053 40 006 016 034 096 054
50 011 029 054 083 052 50 010 028 055 091 052
60 020 047 069 077 051 60 019 046 073 084 050
70 030 055 - 065 049 70 030 059 - 070 046
80 033 - - 046 042 80 035 - - 048 037
Table 1322
Leukemia
Risk of Being Diagnosed With Cancer in 10 20 and 30 Years
Lifetime Risk of Being Diagnosed with Cancer Given Alive and Cancer-Free at Current Age and
Lifetime Risk of Dying from Cancer Given Alive at Current Age
Females 2014-2016 By RaceEthnicity
SEER Cancer Statistics Review 1975-2016 National Cancer Institute
The AAPC is the Average Annual Percent Change over the time interval The AAPCs are calculated bythe Joinpoint Regression Program Version 47 February 2019 National Cancer Institute
- Statistic not shown Rate based on less than 16 cases for the time intervalTrend based on less than 10 cases for at least one year within the time interval
a Rates are age-adjusted to the 2000 US Std Population (19 age groups - Census P25-1130) Trendsare based on rates age-adjusted to the 2000 US Std Population (19 age groups - Census P25-1130)
b The SEER 9 areas are San Francisco Connecticut Detroit Hawaii Iowa New Mexico SeattleUtah and AtlantaThe SEER 21 areas comprise the SEER 9 areas plus San Jose-Monterey Los Angeles the AlaskaNative Registry Rural Georgia California excluding SFSJMLA Kentucky Louisiana New JerseyGeorgia excluding ATLRG Idaho New York and Massachusetts
c The 2007-2016 AAPC estimates are based on a Joinpoint analysis with up to 3 Joinpoints overdiagnosis years 2000-2016
d The 2007-2016 AAPC estimates are based on a Joinpoint analysis with up to 5 Joinpoints overdiagnosis years 1975-2016
e Hispanic and Non-Hispanic are not mutually exclusive from whites blacks AsianPacificIslanders and American IndiansAlaska Natives Incidence data for Hispanics and Non-Hispanicsare based on NHIA and exclude cases from the Alaska Native Registry
f Incidence data for American IndianAlaska Native are based on the PurchasedReferred CareDelivery Area (PRCDA) counties
g US Mortality Files National Center for Health Statistics CDCh The 2007-2016 mortality AAPCs are based on a Joinpoint analysis using years of death 2000-2016 The APC is significantly different from zero (plt05)
SEER Incidence SEER 21 Areasb SEER 21 Areasb SEER 9 Areasb
Rate 2012-2016 Trend 2007-2016c Trend 2007-2016d
Rate per 100000 persons AAPC () AAPC ()
Total Males Females Total Males Females Total Males Females RaceEthnicity
All Races 141 181 109 -04 -02 -06 -03 02 03
White 149 191 115 -05 -05 -07 04 03 05White Hispanice 112 134 94 01 -02 03 - - -White Non-Hispanice 153 197 116 -05 -05 -08 - - -
Black 109 139 89 06 02 07 01 01 02
AsianPacific Islander 78 97 63 01 00 02 - - -
Amer IndAlaska Natf 86 110 66 08 21 -01 - - -
Hispanice 108 130 91 02 00 03 - - -
US Mortalityg Rate 2012-2016 Trend 2007-2016h
Rate per 100000 persons AAPC ()
Total Males Females Total Males FemalesRaceEthnicity
All Races 65 88 49 -16 -17 -13
White 68 91 51 -14 -16 -12White Hispanice 50 63 41 -07 -08 -06White Non-Hispanice 69 93 51 -14 -15 -12
Black 55 72 44 -15 -17 -15
AsianPacific Islander 36 47 28 -18 -07 -23
Amer IndAlaska NatTotal US 31 42 23 -22 -09 -36PRCDA Counties 41 54 30 -16 -05 -28Non-PRCDA Counties 20 28 15 -31 -13 -50
Hispanice 47 60 38 -08 -09 -07
Table 1323Leukemia
SEER Incidence and US MortalityAge-Adjusted Rates and Trendsa
By RaceEthnicity and Sex
SEE
R C
ancer Statistics Review
1975-2016N
ational Cancer Institute
a Rates are per 100000 and are age-adjusted to the 2000 US Std Population (19 age groups - Census P25-1130)b The SEER 9 areas are San Francisco Connecticut Detroit Hawaii Iowa New Mexico Seattle Utah and Atlanta
The SEER 13 areas comprise the SEER 9 areas plus San Jose-Monterey Los Angeles the Alaska Native Registry and Rural GeorgiaThe SEER 18 areas comprise the SEER 13 areas plus California excluding SFSJMLA Kentucky Louisiana New Jersey and Georgiaexcluding ATLRGThe SEER 21 areas comprise the SEER 18 areas plus Idaho New York and Massachusetts
- Statistic not shown Rate based on less than 16 cases for the time interval
All Races Whites Blacks Total Males Females Total Males Females Total Males Females
SEER Incidence Ratesa 2012-2016
California 1239 1590 949 1337 1715 1020 1039 1334 813Greater Bay Area 1231 1619 915 1400 1844 1028 1098 1406 859San Francisco-Oakland 1212 1596 906 1389 1823 1034 1077 1336 881San Jose-Monterey 1259 1651 925 1410 1869 1011 1239 1787 -
Los Angeles 1173 1469 933 1291 1622 1016 1050 1294 884Greater California 1271 1633 968 1334 1709 1017 1007 1338 729
Connecticut 1406 1768 1117 1431 1790 1142 976 1126 867Detroit 1584 2050 1230 1707 2222 1300 1204 1485 1018Georgia 1430 1841 1120 1537 1970 1189 1139 1487 935Atlanta 1382 1819 1064 1563 2017 1207 1138 1557 884Rural Georgia 1411 1586 1206 1510 1773 1196 1248 - 1236Greater Georgia 1455 1863 1144 1531 1965 1182 1140 1450 968
Hawaii 1073 1339 843 1388 1612 1139 - - -Idaho 1588 1950 1263 1604 1973 1272 - - -Iowa 1627 2127 1222 1630 2133 1221 1416 1743 1076Kentucky 1566 1983 1234 1577 1995 1241 1159 1446 922Louisiana 1405 1789 1104 1518 1918 1197 1103 1393 890Massachusetts 1108 1429 854 1118 1448 856 787 1050 620New Jersey 1524 1962 1188 1541 1982 1199 1136 1469 928New Mexico 1299 1550 1086 1310 1556 1101 1045 - -New York 1623 2119 1244 1752 2281 1335 1068 1360 887Seattle-Puget Sound 1568 2020 1188 1634 2084 1249 1486 1929 1077Utah 1375 1793 1009 1401 1825 1029 - - -
SEER 9 Areasb 1419 1823 1094 1521 1945 1171 1154 1460 941SEER 13 Areasb 1357 1737 1049 1473 1882 1134 1126 1419 922SEER 18 Areasb 1376 1761 1066 1461 1867 1127 1114 1414 907SEER 21 Areasb 1407 1807 1088 1491 1912 1147 1089 1386 889
Table 1324Leukemia
Age-Adjusted SEER Incidence Ratesa
By Registry Race and Sex
SEE
R C
ancer Statistics Review
1975-2016N
ational Cancer Institute
a US Mortality Files National Center for Health Statistics Centers for Disease Control and PreventionRates are per 100000 and are age-adjusted to the 2000 US Std Population (19 age groups - Census P25-1130)
b The SEER 9 areas are San Francisco Connecticut Detroit Hawaii Iowa New Mexico Seattle Utah and AtlantaThe SEER 13 areas comprise the SEER 9 areas plus San Jose-Monterey Los Angeles the Alaska Native Registry and Rural GeorgiaThe SEER 18 areas comprise the SEER 13 areas plus California excluding SFSJMLA Kentucky Louisiana New Jersey and Georgiaexcluding ATLRGThe SEER 21 areas comprise the SEER 18 areas plus Idaho New York and Massachusetts
- Statistic not shown Rate based on less than 16 cases for the time interval
All Races Whites Blacks Total Males Females Total Males Females Total Males Females
SEER Death Ratesa 2012-2016
California 617 811 470 671 885 507 560 711 461Greater Bay Area 563 759 419 640 869 470 551 742 424San Francisco-Oakland 551 753 405 631 871 455 544 726 421San Jose-Monterey 584 768 446 653 863 495 604 - -
Los Angeles 608 797 468 675 894 513 571 717 483Greater California 639 835 489 677 886 515 553 687 458
Connecticut 622 837 465 639 862 474 536 665 449Detroit 662 915 485 691 967 494 573 723 475Georgia 614 817 467 642 855 478 538 706 438Atlanta 568 757 437 615 802 483 487 658 374Rural Georgia 581 628 538 579 635 - - - -Greater Georgia 639 851 482 654 879 477 576 745 483
Hawaii 463 593 362 543 632 440 - - -Idaho 655 846 497 661 865 492 - - -Iowa 693 961 498 700 963 508 - - -Kentucky 742 949 592 750 953 603 633 894 455Louisiana 677 906 514 705 953 520 603 776 498Massachusetts 622 830 478 647 869 490 463 524 444New Jersey 615 810 478 657 871 504 474 549 429New Mexico 560 759 400 589 794 421 - - -New York 621 842 466 675 910 506 450 602 356Seattle-Puget Sound 618 795 481 637 807 503 708 975 499Utah 679 865 526 693 876 542 - - -
SEER 9 Areasb 610 818 457 651 869 487 540 711 427SEER 13 Areasb 609 810 460 658 874 494 544 708 437SEER 18 Areasb 630 832 480 671 887 508 552 705 455SEER 21 Areasb 628 834 477 670 889 506 520 670 426
Total US 654 876 489 681 912 506 550 721 439
Table 1325Leukemia
Age-Adjusted SEER Death Ratesa
By Registry Race and Sex
SEER Cancer Statistics Review 1975-2016 National Cancer Institute
a US Mortality Files National Center for Health Statistics Centers for Disease Control andPrevention Rates are per 100000 and are age-adjusted to the 2000 US Std Population (19age groups - Census P25-1130)
b Difference between state rate and total US rate is statistically significant (plt=0002)c Absolute percent difference between state rate and total US rate is 15 or mored Rank of state level death rate and the 95 confidence intervals (low high) for the rankSE Standard error of the ratePD Percent difference between state rate and total US rate- Statistic not shown Rate based on less than 16 cases for the time interval
State Rate SE Rank(CI)d PD TOTAL US 654 002
High Five StatesOklahoma 790 019 01(0108) 2083c
West Virginia 749 025 02(0123) 1449South Dakota 747 040 03(0133) 1415Kentucky 742 018 04(0116) 1352Kansas 742 022 05(0122) 1350
Low Five StatesColorado 609 016 47(2649) -692Alaska 596 050 48(0451) -885New Mexico 560 022 49(3650) -1430DC 504 041 50(3251) -2293c
Hawaii 463 024 51(4951) -2913c
State Rate SE Rank(CI)d PD State Rate SE Rank(CI)d PD
Alabama 689 016 17(0532) 533 Montana 613 032 45(0950) -634Alaska 596 050 48(0451) -885 Nebraska 718 026 10(0131) 983Arizona 632 013 36(2248) -329 Nevada 644 021 28(1148) -157Arkansas 719 021 09(0127) 993 New Hampshire 638 029 31(0749) -238California 617 006 42(3248) -572 New Jersey 615 011 43(2849) -592Colorado 609 016 47(2649) -692 New Mexico 560 022 49(3650) -1430Connecticut 622 017 40(2249) -490 New York 621 007 41(2948) -499Delaware 664 035 24(0249) 152 North Carolina 634 011 34(2347) -310DC 504 041 50(3251) -2293c North Dakota 656 040 26(0249) 029Florida 630 007 38(2645) -370 Ohio 694 010 13(0626) 608Georgia 614 012 44(2849) -604 Oklahoma 790 019 01(0108) 2083c
Hawaii 463 024 51(4951) -2913c Oregon 632 017 37(1948) -331Idaho 655 028 27(0548) 012 Pennsylvania 680 009 21(1029) 396Illinois 684 010 19(0928) 463 Rhode Island 656 033 25(0349) 037Indiana 719 014 08(0222) 994 South Carolina 682 016 20(0634) 435Iowa 693 019 14(0334) 604 South Dakota 747 040 03(0133) 1415Kansas 742 022 05(0122) 1350 Tennessee 702 014 12(0327) 729Kentucky 742 018 04(0116) 1352 Texas 640 007 30(2342) -215Louisiana 677 017 23(0637) 356 Utah 679 024 22(0346) 387Maine 638 027 32(0949) -240 Vermont 636 041 33(0350) -277Maryland 633 014 35(2148) -323 Virginia 611 012 46(2849) -661Massachusetts 622 013 39(2548) -482 Washington 640 013 29(2047) -209Michigan 685 011 18(0829) 476 West Virginia 749 025 02(0123) 1449Minnesota 691 015 16(0430) 564 Wisconsin 727 015 06(0219) 1110Mississippi 692 021 15(0337) 580 Wyoming 721 049 07(0148) 1028Missouri 711 014 11(0324) 874
Table 1326Leukemia
Age-Adjusted Cancer Deatha Rates By State All Races 2012-2016
Males and Females
SEER Cancer Statistics Review 1975-2016 National Cancer Institute
a US Mortality Files National Center for Health Statistics Centers for Disease Control andPrevention Rates are per 100000 and are age-adjusted to the 2000 US Std Population (19age groups - Census P25-1130)
b Difference between state rate and total US rate is statistically significant (plt=0002)c Absolute percent difference between state rate and total US rate is 15 or mored Rank of state level death rate and the 95 confidence intervals (low high) for the rankSE Standard error of the ratePD Percent difference between state rate and total US rate- Statistic not shown Rate based on less than 16 cases for the time interval
State Rate SE Rank(CI)d PD TOTAL US 876 003
High Five StatesOklahoma 1022 034 01(0120) 1669c
Kansas 1018 039 02(0123) 1625c
Arkansas 991 037 03(0127) 1309South Dakota 985 068 04(0147) 1249Delaware 984 065 05(0144) 1236
Low Five StatesMontana 795 053 47(1150) -921New Mexico 759 039 48(2650) -1336Alaska 711 081 49(0851) -1887c
DC 704 078 50(1051) -1959c
Hawaii 593 040 51(4951) -3228c
State Rate SE Rank(CI)d PD State Rate SE Rank(CI)d PD
Alabama 939 029 17(0233) 725 Montana 795 053 47(1150) -921Alaska 711 081 49(0851) -1887c Nebraska 958 046 12(0141) 935Arizona 827 022 41(2449) -555 Nevada 858 037 33(0849) -210Arkansas 991 037 03(0127) 1309 New Hampshire 884 051 25(0149) 088California 811 010 43(3348) -738 New Jersey 810 020 44(2749) -747Colorado 834 028 39(2049) -484 New Mexico 759 039 48(2650) -1336Connecticut 837 031 37(1549) -441 New York 842 013 35(2546) -387Delaware 984 065 05(0144) 1236 North Carolina 863 020 31(1945) -149DC 704 078 50(1051) -1959c North Dakota 873 070 27(0150) -030Florida 839 012 36(2645) -422 Ohio 931 018 19(0529) 627Georgia 817 021 42(2649) -677 Oklahoma 1022 034 01(0120) 1669c
Hawaii 593 040 51(4951) -3228c Oregon 866 029 29(1147) -112Idaho 846 047 34(0550) -339 Pennsylvania 912 016 21(0931) 416Illinois 928 018 20(0529) 594 Rhode Island 911 059 22(0149) 400Indiana 960 025 11(0127) 959 South Carolina 951 029 13(0131) 853Iowa 961 035 08(0131) 969 South Dakota 985 068 04(0147) 1249Kansas 1018 039 02(0123) 1625c Tennessee 960 025 10(0127) 959Kentucky 949 031 15(0133) 832 Texas 870 013 28(2139) -069Louisiana 906 030 23(0442) 342 Utah 865 041 30(0549) -122Maine 803 046 46(1450) -836 Vermont 874 074 26(0150) -026Maryland 861 026 32(1447) -176 Virginia 809 021 45(2650) -770Massachusetts 830 023 40(2349) -529 Washington 835 023 38(2248) -463Michigan 937 020 18(0428) 702 West Virginia 972 044 06(0135) 1095Minnesota 948 027 16(0229) 826 Wisconsin 960 026 09(0127) 961Mississippi 970 039 07(0132) 1077 Wyoming 885 081 24(0150) 102Missouri 951 025 14(0228) 852
Table 1327Leukemia
Age-Adjusted Cancer Deatha Rates By State All Races 2012-2016
Males
SEER Cancer Statistics Review 1975-2016 National Cancer Institute
a US Mortality Files National Center for Health Statistics Centers for Disease Control andPrevention Rates are per 100000 and are age-adjusted to the 2000 US Std Population (19age groups - Census P25-1130)
b Difference between state rate and total US rate is statistically significant (plt=0002)c Absolute percent difference between state rate and total US rate is 15 or mored Rank of state level death rate and the 95 confidence intervals (low high) for the rankSE Standard error of the ratePD Percent difference between state rate and total US rate- Statistic not shown Rate based on less than 16 cases for the time interval
State Rate SE Rank(CI)d PD TOTAL US 489 002
High Five StatesOklahoma 615 023 01(0108) 2584c
Wyoming 596 060 02(0147) 2194c
Kentucky 592 021 03(0111) 2126c
West Virginia 576 030 04(0126) 1792c
South Dakota 564 047 05(0145) 1551c
Low Five StatesColorado 441 018 47(2250) -972Delaware 428 037 48(0751) -1247New Mexico 400 025 49(3151) -1803c
DC 381 046 50(1251) -2203c
Hawaii 362 029 51(4151) -2598c
State Rate SE Rank(CI)d PD State Rate SE Rank(CI)d PD
Alabama 512 019 18(0440) 483 Montana 452 037 43(0551) -745Alaska 485 062 27(0151) -073 Nebraska 531 030 10(0144) 864Arizona 473 015 31(1347) -308 Nevada 455 025 42(1150) -695Arkansas 516 024 15(0344) 554 New Hampshire 449 033 45(0651) -807California 470 007 34(2345) -383 New Jersey 478 013 30(1346) -223Colorado 441 018 47(2250) -972 New Mexico 400 025 49(3151) -1803c
Connecticut 465 020 40(1249) -487 New York 466 009 38(2246) -456Delaware 428 037 48(0751) -1247 North Carolina 471 012 32(1747) -350DC 381 046 50(1251) -2203c North Dakota 479 046 28(0151) -189Florida 460 008 41(2647) -582 Ohio 520 012 12(0529) 653Georgia 467 013 37(1747) -433 Oklahoma 615 023 01(0108) 2584c
Hawaii 362 029 51(4151) -2598c Oregon 449 019 44(1850) -799Idaho 497 033 22(0249) 174 Pennsylvania 516 011 14(0629) 556Illinois 514 011 16(0631) 526 Rhode Island 471 037 33(0351) -363Indiana 540 017 07(0226) 1052 South Carolina 495 018 23(0645) 133Iowa 498 022 20(0547) 200 South Dakota 564 047 05(0145) 1551c
Kansas 539 025 08(0137) 1032 Tennessee 517 016 13(0435) 590Kentucky 592 021 03(0111) 2126c Texas 467 008 36(2246) -431Louisiana 514 020 17(0442) 520 Utah 526 029 11(0146) 778Maine 508 032 19(0248) 403 Vermont 444 045 46(0351) -906Maryland 470 016 35(1448) -389 Virginia 465 014 39(1848) -474Massachusetts 478 015 29(1247) -220 Washington 487 016 25(0946) -022Michigan 498 013 21(0939) 192 West Virginia 576 030 04(0126) 1792c
Minnesota 494 017 24(0745) 121 Wisconsin 545 017 06(0225) 1162Mississippi 485 023 26(0548) -067 Wyoming 596 060 02(0147) 2194c
Missouri 535 017 09(0327) 953
Table 1328Leukemia
Age-Adjusted Cancer Deatha Rates By State All Races 2012-2016
Females
SEE
R C
ancer Statistics Review
1975-2016N
ational Cancer Institute
a US 2016 cancer prevalence counts are based on 2016 cancer prevalence proportions from the SEER 13 Areas (excluding the AlaskaNative Registry) and 112016 US population estimates based on the average of 2015 and 2016 population estimates from theUS Bureau of the CensusPrevalence was calculated using the first invasive tumor for each cancer site diagnosed during the previous 24 years
b Maximum limited-duration prevalence is 24 years for 1992-2016 datac Percentages are age-adjusted to the 2000 US Standard Population (19 age groups - Census P25-1130) by 5-year age groupsd Cases diagnosed more than 24 years ago were estimated using the completeness index method (Capocaccia et al 1997
Merrill et al 2000)e Complete prevalence is obtained by summing 0 to lt24 and gt=24- Statistic not shown Statistic based on fewer than 5 cases estimated alive in SEER for the time interval+ Not available
Years Since Diagnosis 0 to lt5 5 to lt10 10 to lt15 15 to lt20 20 to lt24 0 to lt24b gt=24d Completee
Race Sex All Races Both Sexes 153253 100309 63581 38012 21353 376508 38265 414773
Males 90192 57683 36029 21220 12020 217145 18411 235556Females 63061 42625 27552 16792 9333 159363 19854 179217
White Both Sexes 132173 87961 56051 33596 19035 328814 32999 370135Males 78368 50894 32033 18770 10845 190910 15102 210930Females 53805 37067 24018 14826 8190 137905 17897 159205
Black Both Sexes 12734 6564 4233 2487 1259 27277 4070 31347Males 6847 3556 2204 1334 637 14578 1776 16354Females 5887 3008 2029 1153 622 12699 2294 14992
Asian Both Sexes 3926 2561 1778 1164 690 10120 + +Pacific Males 2235 1462 936 646 351 5630 + +Islander Females 1691 1100 842 519 339 4490 + +
Hispanic Both Sexes 14464 9581 6796 4462 2630 37933 + +Males 8166 5374 3794 2408 1538 21280 + +Females 6298 4207 3002 2055 1092 16654 + +
Age Specific (Crude) Age-Adjustedc Age at Prevalence All Ages 0-9 10-19 20-29 30-39 40-49 50-59 60-69 70-79 80+ All Ages
Race Sex All Races Both Sexes 01168 00328 00640 00628 00377 00561 01053 02263 04023 05111 01054
Males 01369 00339 00706 00685 00419 00657 01287 02888 05282 07048 01306Females 00974 00317 00572 00570 00333 00466 00829 01696 02974 03919 00844
White Both Sexes 01304 00369 00715 00712 00410 00584 01106 02389 04249 05386 01127Males 01528 00379 00789 00771 00457 00682 01349 03042 05558 07387 01389Females 01084 00359 00637 00650 00362 00484 00869 01784 03135 04133 00904
Black Both Sexes 00605 00145 00322 00320 00267 00463 00752 01455 02470 03076 00660Males 00674 00142 00357 00338 00281 00530 00919 01737 03249 04580 00816Females 00541 00148 00286 00301 00255 00402 00605 01230 01927 02334 00552
Asian Both Sexes 00497 00264 00531 00426 00230 00390 00553 00882 01245 01389 00513Pacific Males 00577 00298 00555 00507 00249 00461 00665 01122 01552 01904 00613Islander Females 00423 00228 00507 00345 00212 00327 00456 00688 00999 01057 00430
Hispanic Both Sexes 00664 00375 00737 00728 00395 00485 00723 01191 01987 02074 00746Males 00737 00397 00827 00807 00471 00576 00831 01350 02221 02551 00854Females 00589 00352 00642 00641 00312 00391 00617 01050 01809 01780 00647
Table 1329Leukemia
Estimated United States Cancer Prevalence Countsa on January 1 2016By RaceEthnicity Sex and Years Since Diagnosis
Estimated prevalence percenta on January 1 2016 of the SEER population diagnosed in the previous 24 yearsBy Age at Prevalence RaceEthnicity and Sex
SEE
R C
ancer Statistics Review
1975-2016N
ational Cancer Institute
a US 2016 cancer prevalence counts are based on 2016 cancer prevalence proportions from the SEER 13 Areas (excluding the AlaskaNative Registry) and 112016 US population estimates based on the average of 2015 and 2016 population estimates from theUS Bureau of the CensusPrevalence was calculated using the first invasive tumor for each cancer site diagnosed during the previous 24 years
b Maximum limited-duration prevalence is 24 years for 1992-2016 datac Percentages are age-adjusted to the 2000 US Standard Population (19 age groups - Census P25-1130) by 5-year age groupsd Cases diagnosed more than 24 years ago were estimated using the completeness index method (Capocaccia et al 1997
Merrill et al 2000)e Complete prevalence is obtained by summing 0 to lt24 and gt=24- Statistic not shown Statistic based on fewer than 5 cases estimated alive in SEER for the time interval+ Not available
Years Since Diagnosis 0 to lt5 5 to lt10 10 to lt15 15 to lt20 20 to lt24 0 to lt24b gt=24d Completee
Race Sex All Races Both Sexes 20277 16033 13721 12074 8203 70308 25456 95764
Males 11203 9049 7751 6542 4634 39179 12997 52176Females 9074 6984 5971 5531 3568 31129 12460 43589
White Both Sexes 17123 13855 11870 10663 7154 60665 21823 83282Males 9549 7741 6768 5696 4084 33839 11286 45559Females 7573 6114 5102 4967 3070 26826 10537 37723
Black Both Sexes 1590 1133 923 727 553 4926 1609 6535Males 809 734 473 411 290 2716 592 3308Females 781 399 450 317 263 2210 1017 3227
Asian Both Sexes 998 720 669 486 361 3234 + +Pacific Males 527 406 369 313 178 1793 + +Islander Females 472 314 300 173 183 1441 + +
Hispanic Both Sexes 5905 4543 3352 2717 1749 18266 + +Males 3302 2686 1899 1465 1058 10409 + +Females 2603 1857 1454 1252 692 7857 + +
Age Specific (Crude) Age-Adjustedc Age at Prevalence All Ages 0-9 10-19 20-29 30-39 40-49 50-59 60-69 70-79 80+ All Ages
Race Sex All Races Both Sexes 00218 00276 00541 00467 00139 00078 00059 00065 00053 00033 00228
Males 00247 00286 00591 00520 00163 00095 00066 00069 00056 00035 00251Females 00190 00266 00488 00410 00115 00062 00053 00062 00050 00032 00204
White Both Sexes 00241 00315 00612 00542 00161 00086 00063 00070 00056 00033 00259Males 00271 00323 00670 00598 00186 00107 00069 00074 00060 00032 00284Females 00211 00306 00551 00482 00135 00064 00057 00066 00053 00033 00232
Black Both Sexes 00109 00107 00250 00197 00067 00042 00039 00029 00012 00027 00102Males 00126 00112 00281 00224 00079 00035 00052 00026 00012 00027 00112Females 00094 00102 00219 00171 00056 00047 00028 00032 00013 00027 00092
Asian Both Sexes 00159 00208 00418 00289 00071 00064 00045 00050 00054 00036 00163Pacific Males 00184 00226 00427 00360 00086 00069 00055 00054 00033 00055 00180Islander Females 00136 00190 00408 00219 00058 00059 00036 00047 00071 00023 00146
Hispanic Both Sexes 00320 00328 00637 00574 00165 00107 00093 00100 00084 00012 00279Males 00361 00342 00710 00648 00205 00131 00110 00063 00072 - 00309Females 00278 00312 00562 00494 00122 00082 00077 00133 00093 00020 00246
Table 1330Acute Lymphocytic Leukemia
Estimated United States Cancer Prevalence Countsa on January 1 2016By RaceEthnicity Sex and Years Since Diagnosis
Estimated prevalence percenta on January 1 2016 of the SEER population diagnosed in the previous 24 yearsBy Age at Prevalence RaceEthnicity and Sex
0
5
10
15
20
25
1975 1985 1995 2005 20160
5
10
15
20
25
1975 1985 1995 2005 20160
3
6
9
12
15
1975 1985 1995 2005 20160
3
6
9
12
15
1975 1985 1995 2005 2016
Delay-Adj IncidenceDelay-Adj Incidence
Observed IncidenceObserved Incidence
MortalityMortality
SEER Observed Incidence SEER Delay Adjusted Incidence and US Death RatesLeukemia by Race and Sex
a
Figure 131
Source SEER 9 areas and US Mortality Files (National Center for Health Statistics CDC)Rates are age-adjusted to the 2000 US Std Population (19 age groups - Census P25-1103)Regression lines and APCs are calculated using the Joinpoint Regression Program Version 47 February 2019 National Cancer InstituteThe APC is the Annual Percent Change for the regression line segments The APC shown on the graph is for the most recent trendThe APC is significantly different from zero (p lt 005)
a
White Male Black Male White Female Black FemaleRate per 100000 Rate per 100000 Rate per 100000 Rate per 100000
Year of DiagnosisDeath Year of DiagnosisDeath Year of DiagnosisDeath Year of DiagnosisDeath
SEER Incidence APCsDelay Adj 1998-16 = 08Observed 1975-16 = 03
US Mortality APC2013-16 = -30
SEER Incidence APCsDelay Adj 1975-16 = 02Observed 1975-16 = 01
US Mortality APC1993-16 = -15
SEER Incidence APCsDelay Adj 1975-16 = 06Observed 1975-16 = 05
US Mortality APC2000-16 = -12
SEER Incidence APCsDelay Adj 1975-16 = 03Observed 1975-16 = 02
US Mortality APC1993-16 = -13
SEE
R C
ancer Statistics Review
1975-2016N
ational Cancer Institute
0
1
2
3
4
5
6
7
8
1975 1985 1995 2005 20160
1
2
3
4
5
6
7
8
1975 1985 1995 2005 20160
1
2
3
4
5
6
7
8
1975 1985 1995 2005 20160
1
2
3
4
5
6
7
8
1975 1985 1995 2005 2016
Chronic
Acute
SEER Observed Incidence RatesLymphocytic and Myeloid Leukemia (Acute and Chronic) by Sex
a
Figure 132
Source SEER 9 areas Rates are age-adjusted to the 2000 US Std Population (19 age groups - Census P25-1103)Regression lines and APCs are calculated using the Joinpoint Regression Program Version 47 February 2019 National Cancer Institute
a
Male Female Male FemaleLymphocytic Leukemia Myeloid Leukemia
Rate per 100000 Rate per 100000 Rate per 100000 Rate per 100000
Year of Diagnosis Year of Diagnosis Year of Diagnosis Year of Diagnosis
SEE
R C
ancer Statistics Review
1975-2016N
ational Cancer Institute
Joinpoint Analyses for Whites and Blacks from 1975-2016and for AsianPacific Islanders American IndiansAlaska Natives and Hispanics from 2000-2016
0
5
10
15
20
1975 1985 1995 2005 20160
5
10
15
20
1975 1985 1995 2005 2016
White
Black
API
AIAN
Hispanic
SEER Incidence and US Death RatesLeukemia Both Sexes
Figure 133
Source Incidence data for whites and blacks are from the SEER 9 areas (San Francisco Connecticut Detroit Hawaii Iowa New Mexico Seattle Utah Atlanta)Incidence data for AsianPacific Islanders American IndiansAlaska Natives and Hispanics are from the SEER 21 areas (SEER 9 areas San Jose-MontereyLos Angeles Alaska Native Registry Rural Georgia California excluding SFSJMLA Kentucky Louisiana New Jersey Georgia excluding ATLRG Idaho New York andMassachusetts)Mortality data are from US Mortality Files National Center for Health Statistics CDCRates are age-adjusted to the 2000 US Std Population (19 age groups - Census P25-1103)Regression lines are calculated using the Joinpoint Regression Program Version 47 February 2019 National Cancer Institute Joinpoint analyses for Whites andBlacks during the 1975-2016 period allow a maximum of 5 joinpoints Analyses for other ethnic groups during the period 2000-2016 allow a maximum of 3 joinpointsAPI = AsianPacific IslanderAIAN = American IndianAlaska Native Rates for American IndianAlaska Native are based on the PurchasedReferred Care Delivery Area (PRCDA) countiesHispanic is not mutually exclusive from whites blacks AsianPacific Islanders and American IndiansAlaska Natives Incidence data for Hispanics are based onNHIA and exclude cases from the Alaska Native Registry
Incidence MortalityRate per 100000 Rate per 100000
Year of Diagnosis Year of Death
a
d
a
b
c
c
b
d
SEE
R C
ancer Statistics Review
1975-2016N
ational Cancer Institute
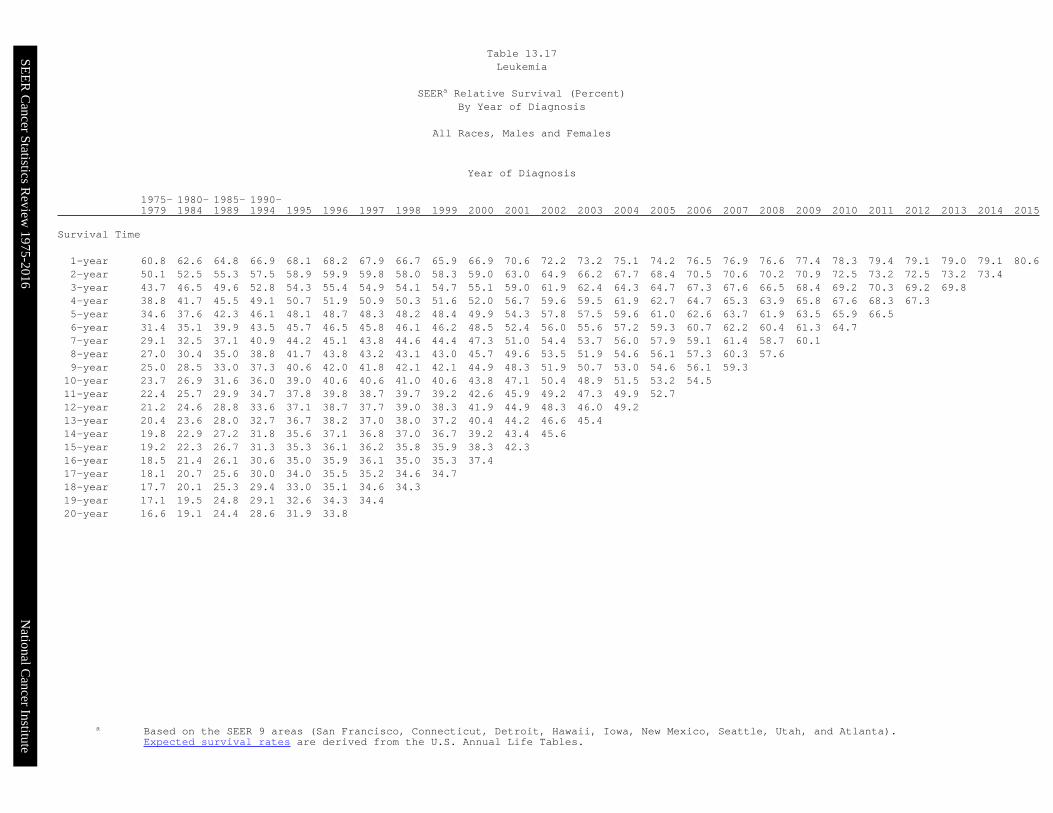
SEE
R C
ancer Statistics Review
1975-2016N
ational Cancer Institute
a Based on the SEER 9 areas (San Francisco Connecticut Detroit Hawaii Iowa New Mexico Seattle Utah and Atlanta)Expected survival rates are derived from the US Annual Life Tables
1975- 1980- 1985- 1990-1979 1984 1989 1994 1995 1996 1997 1998 1999 2000 2001 2002 2003 2004 2005 2006 2007 2008 2009 2010 2011 2012 2013 2014 2015
Survival Time
1-year 613 623 638 655 665 664 666 667 646 643 675 710 719 729 715 759 755 754 751 769 778 782 772 761 7912-year 509 527 542 564 569 578 580 574 573 564 606 645 653 664 660 705 689 684 684 705 714 716 709 7093-year 450 471 492 523 525 529 544 534 539 522 564 612 619 628 624 673 657 647 663 666 681 685 6774-year 402 424 449 485 495 498 514 500 511 494 548 594 587 608 595 646 633 624 633 658 664 6685-year 361 384 414 459 480 475 489 479 489 466 530 584 570 588 582 627 615 601 607 641 6396-year 328 360 392 435 464 457 456 461 463 455 516 567 556 569 572 613 602 589 588 6297-year 309 334 367 410 447 443 438 448 450 438 504 561 539 556 558 594 598 575 5798-year 290 316 344 391 416 428 433 433 438 428 490 556 526 542 546 585 582 5639-year 273 299 326 376 409 416 413 424 429 428 477 535 515 534 535 576 57610-year 259 281 315 364 399 405 396 409 414 416 468 522 502 521 521 56811-year 247 269 295 347 378 398 383 403 403 401 456 515 486 503 51812-year 235 250 285 338 372 382 373 397 393 395 445 505 468 49313-year 228 239 276 329 365 373 366 392 385 383 442 481 46314-year 220 232 267 323 355 361 363 385 380 367 434 46815-year 214 225 264 318 353 348 359 369 368 363 42416-year 206 217 258 310 353 344 359 361 363 35817-year 201 210 252 305 342 340 357 358 35018-year 198 205 248 301 336 334 347 35819-year 193 198 241 296 330 326 34620-year 190 195 238 290 321 323
Table 1319Leukemia
SEERa Relative Survival (Percent)By Year of Diagnosis
All Races Females
Year of Diagnosis
SEE
R C
ancer Statistics Review
1975-2016N
ational Cancer Institute
Devcan 677 April 2019 National Cancer Institute (httpssurveillancecancergovdevcan)Source Incidence data are from the SEER 21 areas (San Francisco Connecticut Detroit Hawaii Iowa New Mexico Seattle Utah Atlanta
San Jose-Monterey Los Angeles Alaska Native Registry Rural Georgia California excluding SFSJMLA Kentucky Louisiana New JerseyGeorgia excluding ATLRG Idaho New York and Massachusetts) Mortality data are from the NCHS public use data file for the total US
a Underlying incidence and mortality data for American IndianAlaska Native are based on the PRCDA(PurchasedReferred Care DeliveryAreas) counties
b Hispanic is not mutually exclusive from whites blacks AsianPacific Islanders and American IndiansAlaska NativesUnderlying incidence data for Hispanics are based on NHIA and exclude cases from the Alaska Native Registry
- Statistic could not be calculatedA percent of 000 represents a value that is below 0005
Risk of Being Risk of Being
Race Current Diagnosed with Cancer Risk of Dying Race Current Diagnosed with Cancer Risk of Dying
Ethnicity Age +10 yrs +20 yrs +30 yrs Ever from Cancer Ethnicity Age +10 yrs +20 yrs +30 yrs Ever from Cancer
All Races 0 006 009 012 156 082 Asian 0 005 008 011 099 058
10 003 006 010 152 082 Pacific 10 003 006 009 095 058
20 003 007 014 149 082 Islander 20 003 006 010 092 058
30 004 011 026 147 082 30 003 008 016 090 057
40 007 022 051 145 082 40 004 012 026 087 057
50 015 045 089 141 082 50 008 022 047 083 056
60 031 079 121 134 082 60 014 040 066 078 054
70 053 101 - 115 080 70 028 055 - 067 051
80 062 - - 082 068 80 032 - - 047 040
White 0 006 010 013 164 085 American 0 005 007 009 085 040
10 003 007 011 159 086 Indian 10 002 004 008 081 040
20 003 007 014 156 085 Alaska 20 002 006 010 079 039
30 004 011 027 155 085 Nativea 30 004 008 019 078 039
40 007 023 053 153 085 40 004 015 030 076 040
50 016 047 095 149 086 50 012 027 051 075 040
60 033 083 127 141 086 60 017 042 061 068 040
70 057 106 - 121 084 70 029 051 - 058 038
80 066 - - 086 071 80 029 - - 038 025
Black 0 003 006 008 107 058 Hispanicb 0 007 011 015 124 066
10 002 005 009 105 059 10 005 008 012 118 066
20 003 006 013 104 059 20 004 008 014 114 065
30 004 011 022 102 058 30 004 010 021 111 064
40 007 019 041 100 058 40 006 017 037 108 064
50 013 035 066 097 058 50 011 031 063 104 063
60 025 058 083 091 058 60 021 054 085 097 062
70 039 069 - 079 057 70 037 070 - 083 058
80 042 - - 056 048 80 042 - - 058 049
Table 1320
Leukemia
Risk of Being Diagnosed With Cancer in 10 20 and 30 Years
Lifetime Risk of Being Diagnosed with Cancer Given Alive and Cancer-Free at Current Age and
Lifetime Risk of Dying from Cancer Given Alive at Current Age
Both Sexes 2014-2016 By RaceEthnicity
SEE
R C
ancer Statistics Review
1975-2016N
ational Cancer Institute
Devcan 677 April 2019 National Cancer Institute (httpssurveillancecancergovdevcan)Source Incidence data are from the SEER 21 areas (San Francisco Connecticut Detroit Hawaii Iowa New Mexico Seattle Utah Atlanta
San Jose-Monterey Los Angeles Alaska Native Registry Rural Georgia California excluding SFSJMLA Kentucky Louisiana New JerseyGeorgia excluding ATLRG Idaho New York and Massachusetts) Mortality data are from the NCHS public use data file for the total US
a Underlying incidence and mortality data for American IndianAlaska Native are based on the PRCDA(PurchasedReferred Care DeliveryAreas) counties
b Hispanic is not mutually exclusive from whites blacks AsianPacific Islanders and American IndiansAlaska NativesUnderlying incidence data for Hispanics are based on NHIA and exclude cases from the Alaska Native Registry
- Statistic could not be calculatedA percent of 000 represents a value that is below 0005
Risk of Being Risk of Being
Race Current Diagnosed with Cancer Risk of Dying Race Current Diagnosed with Cancer Risk of Dying
Ethnicity Age +10 yrs +20 yrs +30 yrs Ever from Cancer Ethnicity Age +10 yrs +20 yrs +30 yrs Ever from Cancer
All Races 0 006 010 013 186 096 Asian 0 005 009 011 119 072
10 004 007 012 182 097 Pacific 10 004 007 010 115 072
20 003 008 016 179 097 Islander 20 003 007 012 111 071
30 005 013 030 177 097 30 004 009 019 109 071
40 008 026 062 176 098 40 005 015 033 106 070
50 018 056 112 173 099 50 010 028 062 102 069
60 040 101 152 166 101 60 019 054 084 096 068
70 071 129 - 146 101 70 038 071 - 084 065
80 082 - - 105 088 80 040 - - 056 052
White 0 007 011 014 195 101 American 0 006 009 011 110 048
10 004 008 012 190 102 Indian 10 003 005 010 105 048
20 004 008 016 187 101 Alaska 20 002 007 011 103 048
30 005 013 031 186 101 Nativea 30 005 009 021 103 048
40 009 027 065 184 102 40 005 017 041 102 049
50 019 058 118 181 103 50 013 039 075 102 051
60 042 107 160 174 106 60 028 067 087 097 051
70 075 136 - 153 105 70 046 070 - 081 049
80 087 - - 110 091 80 034 - - 049 030
Black 0 003 006 008 122 065 Hispanicb 0 007 013 017 141 080
10 003 006 009 122 066 10 005 010 015 135 080
20 003 006 014 120 065 20 005 009 016 130 079
30 004 011 025 119 066 30 005 011 023 127 078
40 008 022 048 118 066 40 007 018 040 124 078
50 015 042 079 115 067 50 012 034 072 120 078
60 031 071 102 112 068 60 024 064 100 114 078
70 051 089 - 101 068 70 046 086 - 102 077
80 058 - - 077 061 80 053 - - 074 070
Table 1321
Leukemia
Risk of Being Diagnosed With Cancer in 10 20 and 30 Years
Lifetime Risk of Being Diagnosed with Cancer Given Alive and Cancer-Free at Current Age and
Lifetime Risk of Dying from Cancer Given Alive at Current Age
Males 2014-2016 By RaceEthnicity
SEE
R C
ancer Statistics Review
1975-2016N
ational Cancer Institute
Devcan 677 April 2019 National Cancer Institute (httpssurveillancecancergovdevcan)Source Incidence data are from the SEER 21 areas (San Francisco Connecticut Detroit Hawaii Iowa New Mexico Seattle Utah Atlanta
San Jose-Monterey Los Angeles Alaska Native Registry Rural Georgia California excluding SFSJMLA Kentucky Louisiana New JerseyGeorgia excluding ATLRG Idaho New York and Massachusetts) Mortality data are from the NCHS public use data file for the total US
a Underlying incidence and mortality data for American IndianAlaska Native are based on the PRCDA(PurchasedReferred Care DeliveryAreas) counties
b Hispanic is not mutually exclusive from whites blacks AsianPacific Islanders and American IndiansAlaska NativesUnderlying incidence data for Hispanics are based on NHIA and exclude cases from the Alaska Native Registry
- Statistic could not be calculatedA percent of 000 represents a value that is below 0005
Risk of Being Risk of Being
Race Current Diagnosed with Cancer Risk of Dying Race Current Diagnosed with Cancer Risk of Dying
Ethnicity Age +10 yrs +20 yrs +30 yrs Ever from Cancer Ethnicity Age +10 yrs +20 yrs +30 yrs Ever from Cancer
All Races 0 006 008 011 129 068 Asian 0 005 008 010 083 048
10 003 005 009 125 069 Pacific 10 003 005 008 078 047
20 003 006 012 122 068 Islander 20 002 005 009 075 047
30 003 009 021 120 068 30 003 006 013 073 046
40 006 018 039 118 068 40 004 010 021 071 046
50 012 034 068 114 067 50 007 017 035 068 045
60 023 059 093 106 067 60 011 029 051 063 044
70 039 077 - 091 064 70 019 042 - 054 040
80 048 - - 066 055 80 026 - - 040 033
White 0 006 009 011 135 071 American 0 003 005 007 061 031
10 003 005 009 131 071 Indian 10 002 003 007 058 031
20 003 006 012 128 071 Alaska 20 002 005 008 056 031
30 003 010 022 126 071 Nativea 30 004 007 017 055 031
40 006 019 042 124 070 40 003 014 020 053 031
50 013 036 072 120 070 50 011 017 030 051 031
60 024 062 099 112 069 60 007 021 038 042 030
70 042 081 - 096 067 70 015 035 - 039 029
80 051 - - 069 057 80 025 - - 030 022
Black 0 004 006 008 095 053 Hispanicb 0 006 010 013 110 056
10 002 004 008 093 054 10 004 007 010 105 056
20 002 006 012 091 053 20 003 006 012 101 055
30 004 010 020 089 053 30 003 009 019 099 054
40 006 016 035 087 053 40 006 016 034 096 054
50 011 029 054 083 052 50 010 028 055 091 052
60 020 047 069 077 051 60 019 046 073 084 050
70 030 055 - 065 049 70 030 059 - 070 046
80 033 - - 046 042 80 035 - - 048 037
Table 1322
Leukemia
Risk of Being Diagnosed With Cancer in 10 20 and 30 Years
Lifetime Risk of Being Diagnosed with Cancer Given Alive and Cancer-Free at Current Age and
Lifetime Risk of Dying from Cancer Given Alive at Current Age
Females 2014-2016 By RaceEthnicity
SEER Cancer Statistics Review 1975-2016 National Cancer Institute
The AAPC is the Average Annual Percent Change over the time interval The AAPCs are calculated bythe Joinpoint Regression Program Version 47 February 2019 National Cancer Institute
- Statistic not shown Rate based on less than 16 cases for the time intervalTrend based on less than 10 cases for at least one year within the time interval
a Rates are age-adjusted to the 2000 US Std Population (19 age groups - Census P25-1130) Trendsare based on rates age-adjusted to the 2000 US Std Population (19 age groups - Census P25-1130)
b The SEER 9 areas are San Francisco Connecticut Detroit Hawaii Iowa New Mexico SeattleUtah and AtlantaThe SEER 21 areas comprise the SEER 9 areas plus San Jose-Monterey Los Angeles the AlaskaNative Registry Rural Georgia California excluding SFSJMLA Kentucky Louisiana New JerseyGeorgia excluding ATLRG Idaho New York and Massachusetts
c The 2007-2016 AAPC estimates are based on a Joinpoint analysis with up to 3 Joinpoints overdiagnosis years 2000-2016
d The 2007-2016 AAPC estimates are based on a Joinpoint analysis with up to 5 Joinpoints overdiagnosis years 1975-2016
e Hispanic and Non-Hispanic are not mutually exclusive from whites blacks AsianPacificIslanders and American IndiansAlaska Natives Incidence data for Hispanics and Non-Hispanicsare based on NHIA and exclude cases from the Alaska Native Registry
f Incidence data for American IndianAlaska Native are based on the PurchasedReferred CareDelivery Area (PRCDA) counties
g US Mortality Files National Center for Health Statistics CDCh The 2007-2016 mortality AAPCs are based on a Joinpoint analysis using years of death 2000-2016 The APC is significantly different from zero (plt05)
SEER Incidence SEER 21 Areasb SEER 21 Areasb SEER 9 Areasb
Rate 2012-2016 Trend 2007-2016c Trend 2007-2016d
Rate per 100000 persons AAPC () AAPC ()
Total Males Females Total Males Females Total Males Females RaceEthnicity
All Races 141 181 109 -04 -02 -06 -03 02 03
White 149 191 115 -05 -05 -07 04 03 05White Hispanice 112 134 94 01 -02 03 - - -White Non-Hispanice 153 197 116 -05 -05 -08 - - -
Black 109 139 89 06 02 07 01 01 02
AsianPacific Islander 78 97 63 01 00 02 - - -
Amer IndAlaska Natf 86 110 66 08 21 -01 - - -
Hispanice 108 130 91 02 00 03 - - -
US Mortalityg Rate 2012-2016 Trend 2007-2016h
Rate per 100000 persons AAPC ()
Total Males Females Total Males FemalesRaceEthnicity
All Races 65 88 49 -16 -17 -13
White 68 91 51 -14 -16 -12White Hispanice 50 63 41 -07 -08 -06White Non-Hispanice 69 93 51 -14 -15 -12
Black 55 72 44 -15 -17 -15
AsianPacific Islander 36 47 28 -18 -07 -23
Amer IndAlaska NatTotal US 31 42 23 -22 -09 -36PRCDA Counties 41 54 30 -16 -05 -28Non-PRCDA Counties 20 28 15 -31 -13 -50
Hispanice 47 60 38 -08 -09 -07
Table 1323Leukemia
SEER Incidence and US MortalityAge-Adjusted Rates and Trendsa
By RaceEthnicity and Sex
SEE
R C
ancer Statistics Review
1975-2016N
ational Cancer Institute
a Rates are per 100000 and are age-adjusted to the 2000 US Std Population (19 age groups - Census P25-1130)b The SEER 9 areas are San Francisco Connecticut Detroit Hawaii Iowa New Mexico Seattle Utah and Atlanta
The SEER 13 areas comprise the SEER 9 areas plus San Jose-Monterey Los Angeles the Alaska Native Registry and Rural GeorgiaThe SEER 18 areas comprise the SEER 13 areas plus California excluding SFSJMLA Kentucky Louisiana New Jersey and Georgiaexcluding ATLRGThe SEER 21 areas comprise the SEER 18 areas plus Idaho New York and Massachusetts
- Statistic not shown Rate based on less than 16 cases for the time interval
All Races Whites Blacks Total Males Females Total Males Females Total Males Females
SEER Incidence Ratesa 2012-2016
California 1239 1590 949 1337 1715 1020 1039 1334 813Greater Bay Area 1231 1619 915 1400 1844 1028 1098 1406 859San Francisco-Oakland 1212 1596 906 1389 1823 1034 1077 1336 881San Jose-Monterey 1259 1651 925 1410 1869 1011 1239 1787 -
Los Angeles 1173 1469 933 1291 1622 1016 1050 1294 884Greater California 1271 1633 968 1334 1709 1017 1007 1338 729
Connecticut 1406 1768 1117 1431 1790 1142 976 1126 867Detroit 1584 2050 1230 1707 2222 1300 1204 1485 1018Georgia 1430 1841 1120 1537 1970 1189 1139 1487 935Atlanta 1382 1819 1064 1563 2017 1207 1138 1557 884Rural Georgia 1411 1586 1206 1510 1773 1196 1248 - 1236Greater Georgia 1455 1863 1144 1531 1965 1182 1140 1450 968
Hawaii 1073 1339 843 1388 1612 1139 - - -Idaho 1588 1950 1263 1604 1973 1272 - - -Iowa 1627 2127 1222 1630 2133 1221 1416 1743 1076Kentucky 1566 1983 1234 1577 1995 1241 1159 1446 922Louisiana 1405 1789 1104 1518 1918 1197 1103 1393 890Massachusetts 1108 1429 854 1118 1448 856 787 1050 620New Jersey 1524 1962 1188 1541 1982 1199 1136 1469 928New Mexico 1299 1550 1086 1310 1556 1101 1045 - -New York 1623 2119 1244 1752 2281 1335 1068 1360 887Seattle-Puget Sound 1568 2020 1188 1634 2084 1249 1486 1929 1077Utah 1375 1793 1009 1401 1825 1029 - - -
SEER 9 Areasb 1419 1823 1094 1521 1945 1171 1154 1460 941SEER 13 Areasb 1357 1737 1049 1473 1882 1134 1126 1419 922SEER 18 Areasb 1376 1761 1066 1461 1867 1127 1114 1414 907SEER 21 Areasb 1407 1807 1088 1491 1912 1147 1089 1386 889
Table 1324Leukemia
Age-Adjusted SEER Incidence Ratesa
By Registry Race and Sex
SEE
R C
ancer Statistics Review
1975-2016N
ational Cancer Institute
a US Mortality Files National Center for Health Statistics Centers for Disease Control and PreventionRates are per 100000 and are age-adjusted to the 2000 US Std Population (19 age groups - Census P25-1130)
b The SEER 9 areas are San Francisco Connecticut Detroit Hawaii Iowa New Mexico Seattle Utah and AtlantaThe SEER 13 areas comprise the SEER 9 areas plus San Jose-Monterey Los Angeles the Alaska Native Registry and Rural GeorgiaThe SEER 18 areas comprise the SEER 13 areas plus California excluding SFSJMLA Kentucky Louisiana New Jersey and Georgiaexcluding ATLRGThe SEER 21 areas comprise the SEER 18 areas plus Idaho New York and Massachusetts
- Statistic not shown Rate based on less than 16 cases for the time interval
All Races Whites Blacks Total Males Females Total Males Females Total Males Females
SEER Death Ratesa 2012-2016
California 617 811 470 671 885 507 560 711 461Greater Bay Area 563 759 419 640 869 470 551 742 424San Francisco-Oakland 551 753 405 631 871 455 544 726 421San Jose-Monterey 584 768 446 653 863 495 604 - -
Los Angeles 608 797 468 675 894 513 571 717 483Greater California 639 835 489 677 886 515 553 687 458
Connecticut 622 837 465 639 862 474 536 665 449Detroit 662 915 485 691 967 494 573 723 475Georgia 614 817 467 642 855 478 538 706 438Atlanta 568 757 437 615 802 483 487 658 374Rural Georgia 581 628 538 579 635 - - - -Greater Georgia 639 851 482 654 879 477 576 745 483
Hawaii 463 593 362 543 632 440 - - -Idaho 655 846 497 661 865 492 - - -Iowa 693 961 498 700 963 508 - - -Kentucky 742 949 592 750 953 603 633 894 455Louisiana 677 906 514 705 953 520 603 776 498Massachusetts 622 830 478 647 869 490 463 524 444New Jersey 615 810 478 657 871 504 474 549 429New Mexico 560 759 400 589 794 421 - - -New York 621 842 466 675 910 506 450 602 356Seattle-Puget Sound 618 795 481 637 807 503 708 975 499Utah 679 865 526 693 876 542 - - -
SEER 9 Areasb 610 818 457 651 869 487 540 711 427SEER 13 Areasb 609 810 460 658 874 494 544 708 437SEER 18 Areasb 630 832 480 671 887 508 552 705 455SEER 21 Areasb 628 834 477 670 889 506 520 670 426
Total US 654 876 489 681 912 506 550 721 439
Table 1325Leukemia
Age-Adjusted SEER Death Ratesa
By Registry Race and Sex
SEER Cancer Statistics Review 1975-2016 National Cancer Institute
a US Mortality Files National Center for Health Statistics Centers for Disease Control andPrevention Rates are per 100000 and are age-adjusted to the 2000 US Std Population (19age groups - Census P25-1130)
b Difference between state rate and total US rate is statistically significant (plt=0002)c Absolute percent difference between state rate and total US rate is 15 or mored Rank of state level death rate and the 95 confidence intervals (low high) for the rankSE Standard error of the ratePD Percent difference between state rate and total US rate- Statistic not shown Rate based on less than 16 cases for the time interval
State Rate SE Rank(CI)d PD TOTAL US 654 002
High Five StatesOklahoma 790 019 01(0108) 2083c
West Virginia 749 025 02(0123) 1449South Dakota 747 040 03(0133) 1415Kentucky 742 018 04(0116) 1352Kansas 742 022 05(0122) 1350
Low Five StatesColorado 609 016 47(2649) -692Alaska 596 050 48(0451) -885New Mexico 560 022 49(3650) -1430DC 504 041 50(3251) -2293c
Hawaii 463 024 51(4951) -2913c
State Rate SE Rank(CI)d PD State Rate SE Rank(CI)d PD
Alabama 689 016 17(0532) 533 Montana 613 032 45(0950) -634Alaska 596 050 48(0451) -885 Nebraska 718 026 10(0131) 983Arizona 632 013 36(2248) -329 Nevada 644 021 28(1148) -157Arkansas 719 021 09(0127) 993 New Hampshire 638 029 31(0749) -238California 617 006 42(3248) -572 New Jersey 615 011 43(2849) -592Colorado 609 016 47(2649) -692 New Mexico 560 022 49(3650) -1430Connecticut 622 017 40(2249) -490 New York 621 007 41(2948) -499Delaware 664 035 24(0249) 152 North Carolina 634 011 34(2347) -310DC 504 041 50(3251) -2293c North Dakota 656 040 26(0249) 029Florida 630 007 38(2645) -370 Ohio 694 010 13(0626) 608Georgia 614 012 44(2849) -604 Oklahoma 790 019 01(0108) 2083c
Hawaii 463 024 51(4951) -2913c Oregon 632 017 37(1948) -331Idaho 655 028 27(0548) 012 Pennsylvania 680 009 21(1029) 396Illinois 684 010 19(0928) 463 Rhode Island 656 033 25(0349) 037Indiana 719 014 08(0222) 994 South Carolina 682 016 20(0634) 435Iowa 693 019 14(0334) 604 South Dakota 747 040 03(0133) 1415Kansas 742 022 05(0122) 1350 Tennessee 702 014 12(0327) 729Kentucky 742 018 04(0116) 1352 Texas 640 007 30(2342) -215Louisiana 677 017 23(0637) 356 Utah 679 024 22(0346) 387Maine 638 027 32(0949) -240 Vermont 636 041 33(0350) -277Maryland 633 014 35(2148) -323 Virginia 611 012 46(2849) -661Massachusetts 622 013 39(2548) -482 Washington 640 013 29(2047) -209Michigan 685 011 18(0829) 476 West Virginia 749 025 02(0123) 1449Minnesota 691 015 16(0430) 564 Wisconsin 727 015 06(0219) 1110Mississippi 692 021 15(0337) 580 Wyoming 721 049 07(0148) 1028Missouri 711 014 11(0324) 874
Table 1326Leukemia
Age-Adjusted Cancer Deatha Rates By State All Races 2012-2016
Males and Females
SEER Cancer Statistics Review 1975-2016 National Cancer Institute
a US Mortality Files National Center for Health Statistics Centers for Disease Control andPrevention Rates are per 100000 and are age-adjusted to the 2000 US Std Population (19age groups - Census P25-1130)
b Difference between state rate and total US rate is statistically significant (plt=0002)c Absolute percent difference between state rate and total US rate is 15 or mored Rank of state level death rate and the 95 confidence intervals (low high) for the rankSE Standard error of the ratePD Percent difference between state rate and total US rate- Statistic not shown Rate based on less than 16 cases for the time interval
State Rate SE Rank(CI)d PD TOTAL US 876 003
High Five StatesOklahoma 1022 034 01(0120) 1669c
Kansas 1018 039 02(0123) 1625c
Arkansas 991 037 03(0127) 1309South Dakota 985 068 04(0147) 1249Delaware 984 065 05(0144) 1236
Low Five StatesMontana 795 053 47(1150) -921New Mexico 759 039 48(2650) -1336Alaska 711 081 49(0851) -1887c
DC 704 078 50(1051) -1959c
Hawaii 593 040 51(4951) -3228c
State Rate SE Rank(CI)d PD State Rate SE Rank(CI)d PD
Alabama 939 029 17(0233) 725 Montana 795 053 47(1150) -921Alaska 711 081 49(0851) -1887c Nebraska 958 046 12(0141) 935Arizona 827 022 41(2449) -555 Nevada 858 037 33(0849) -210Arkansas 991 037 03(0127) 1309 New Hampshire 884 051 25(0149) 088California 811 010 43(3348) -738 New Jersey 810 020 44(2749) -747Colorado 834 028 39(2049) -484 New Mexico 759 039 48(2650) -1336Connecticut 837 031 37(1549) -441 New York 842 013 35(2546) -387Delaware 984 065 05(0144) 1236 North Carolina 863 020 31(1945) -149DC 704 078 50(1051) -1959c North Dakota 873 070 27(0150) -030Florida 839 012 36(2645) -422 Ohio 931 018 19(0529) 627Georgia 817 021 42(2649) -677 Oklahoma 1022 034 01(0120) 1669c
Hawaii 593 040 51(4951) -3228c Oregon 866 029 29(1147) -112Idaho 846 047 34(0550) -339 Pennsylvania 912 016 21(0931) 416Illinois 928 018 20(0529) 594 Rhode Island 911 059 22(0149) 400Indiana 960 025 11(0127) 959 South Carolina 951 029 13(0131) 853Iowa 961 035 08(0131) 969 South Dakota 985 068 04(0147) 1249Kansas 1018 039 02(0123) 1625c Tennessee 960 025 10(0127) 959Kentucky 949 031 15(0133) 832 Texas 870 013 28(2139) -069Louisiana 906 030 23(0442) 342 Utah 865 041 30(0549) -122Maine 803 046 46(1450) -836 Vermont 874 074 26(0150) -026Maryland 861 026 32(1447) -176 Virginia 809 021 45(2650) -770Massachusetts 830 023 40(2349) -529 Washington 835 023 38(2248) -463Michigan 937 020 18(0428) 702 West Virginia 972 044 06(0135) 1095Minnesota 948 027 16(0229) 826 Wisconsin 960 026 09(0127) 961Mississippi 970 039 07(0132) 1077 Wyoming 885 081 24(0150) 102Missouri 951 025 14(0228) 852
Table 1327Leukemia
Age-Adjusted Cancer Deatha Rates By State All Races 2012-2016
Males
SEER Cancer Statistics Review 1975-2016 National Cancer Institute
a US Mortality Files National Center for Health Statistics Centers for Disease Control andPrevention Rates are per 100000 and are age-adjusted to the 2000 US Std Population (19age groups - Census P25-1130)
b Difference between state rate and total US rate is statistically significant (plt=0002)c Absolute percent difference between state rate and total US rate is 15 or mored Rank of state level death rate and the 95 confidence intervals (low high) for the rankSE Standard error of the ratePD Percent difference between state rate and total US rate- Statistic not shown Rate based on less than 16 cases for the time interval
State Rate SE Rank(CI)d PD TOTAL US 489 002
High Five StatesOklahoma 615 023 01(0108) 2584c
Wyoming 596 060 02(0147) 2194c
Kentucky 592 021 03(0111) 2126c
West Virginia 576 030 04(0126) 1792c
South Dakota 564 047 05(0145) 1551c
Low Five StatesColorado 441 018 47(2250) -972Delaware 428 037 48(0751) -1247New Mexico 400 025 49(3151) -1803c
DC 381 046 50(1251) -2203c
Hawaii 362 029 51(4151) -2598c
State Rate SE Rank(CI)d PD State Rate SE Rank(CI)d PD
Alabama 512 019 18(0440) 483 Montana 452 037 43(0551) -745Alaska 485 062 27(0151) -073 Nebraska 531 030 10(0144) 864Arizona 473 015 31(1347) -308 Nevada 455 025 42(1150) -695Arkansas 516 024 15(0344) 554 New Hampshire 449 033 45(0651) -807California 470 007 34(2345) -383 New Jersey 478 013 30(1346) -223Colorado 441 018 47(2250) -972 New Mexico 400 025 49(3151) -1803c
Connecticut 465 020 40(1249) -487 New York 466 009 38(2246) -456Delaware 428 037 48(0751) -1247 North Carolina 471 012 32(1747) -350DC 381 046 50(1251) -2203c North Dakota 479 046 28(0151) -189Florida 460 008 41(2647) -582 Ohio 520 012 12(0529) 653Georgia 467 013 37(1747) -433 Oklahoma 615 023 01(0108) 2584c
Hawaii 362 029 51(4151) -2598c Oregon 449 019 44(1850) -799Idaho 497 033 22(0249) 174 Pennsylvania 516 011 14(0629) 556Illinois 514 011 16(0631) 526 Rhode Island 471 037 33(0351) -363Indiana 540 017 07(0226) 1052 South Carolina 495 018 23(0645) 133Iowa 498 022 20(0547) 200 South Dakota 564 047 05(0145) 1551c
Kansas 539 025 08(0137) 1032 Tennessee 517 016 13(0435) 590Kentucky 592 021 03(0111) 2126c Texas 467 008 36(2246) -431Louisiana 514 020 17(0442) 520 Utah 526 029 11(0146) 778Maine 508 032 19(0248) 403 Vermont 444 045 46(0351) -906Maryland 470 016 35(1448) -389 Virginia 465 014 39(1848) -474Massachusetts 478 015 29(1247) -220 Washington 487 016 25(0946) -022Michigan 498 013 21(0939) 192 West Virginia 576 030 04(0126) 1792c
Minnesota 494 017 24(0745) 121 Wisconsin 545 017 06(0225) 1162Mississippi 485 023 26(0548) -067 Wyoming 596 060 02(0147) 2194c
Missouri 535 017 09(0327) 953
Table 1328Leukemia
Age-Adjusted Cancer Deatha Rates By State All Races 2012-2016
Females
SEE
R C
ancer Statistics Review
1975-2016N
ational Cancer Institute
a US 2016 cancer prevalence counts are based on 2016 cancer prevalence proportions from the SEER 13 Areas (excluding the AlaskaNative Registry) and 112016 US population estimates based on the average of 2015 and 2016 population estimates from theUS Bureau of the CensusPrevalence was calculated using the first invasive tumor for each cancer site diagnosed during the previous 24 years
b Maximum limited-duration prevalence is 24 years for 1992-2016 datac Percentages are age-adjusted to the 2000 US Standard Population (19 age groups - Census P25-1130) by 5-year age groupsd Cases diagnosed more than 24 years ago were estimated using the completeness index method (Capocaccia et al 1997
Merrill et al 2000)e Complete prevalence is obtained by summing 0 to lt24 and gt=24- Statistic not shown Statistic based on fewer than 5 cases estimated alive in SEER for the time interval+ Not available
Years Since Diagnosis 0 to lt5 5 to lt10 10 to lt15 15 to lt20 20 to lt24 0 to lt24b gt=24d Completee
Race Sex All Races Both Sexes 153253 100309 63581 38012 21353 376508 38265 414773
Males 90192 57683 36029 21220 12020 217145 18411 235556Females 63061 42625 27552 16792 9333 159363 19854 179217
White Both Sexes 132173 87961 56051 33596 19035 328814 32999 370135Males 78368 50894 32033 18770 10845 190910 15102 210930Females 53805 37067 24018 14826 8190 137905 17897 159205
Black Both Sexes 12734 6564 4233 2487 1259 27277 4070 31347Males 6847 3556 2204 1334 637 14578 1776 16354Females 5887 3008 2029 1153 622 12699 2294 14992
Asian Both Sexes 3926 2561 1778 1164 690 10120 + +Pacific Males 2235 1462 936 646 351 5630 + +Islander Females 1691 1100 842 519 339 4490 + +
Hispanic Both Sexes 14464 9581 6796 4462 2630 37933 + +Males 8166 5374 3794 2408 1538 21280 + +Females 6298 4207 3002 2055 1092 16654 + +
Age Specific (Crude) Age-Adjustedc Age at Prevalence All Ages 0-9 10-19 20-29 30-39 40-49 50-59 60-69 70-79 80+ All Ages
Race Sex All Races Both Sexes 01168 00328 00640 00628 00377 00561 01053 02263 04023 05111 01054
Males 01369 00339 00706 00685 00419 00657 01287 02888 05282 07048 01306Females 00974 00317 00572 00570 00333 00466 00829 01696 02974 03919 00844
White Both Sexes 01304 00369 00715 00712 00410 00584 01106 02389 04249 05386 01127Males 01528 00379 00789 00771 00457 00682 01349 03042 05558 07387 01389Females 01084 00359 00637 00650 00362 00484 00869 01784 03135 04133 00904
Black Both Sexes 00605 00145 00322 00320 00267 00463 00752 01455 02470 03076 00660Males 00674 00142 00357 00338 00281 00530 00919 01737 03249 04580 00816Females 00541 00148 00286 00301 00255 00402 00605 01230 01927 02334 00552
Asian Both Sexes 00497 00264 00531 00426 00230 00390 00553 00882 01245 01389 00513Pacific Males 00577 00298 00555 00507 00249 00461 00665 01122 01552 01904 00613Islander Females 00423 00228 00507 00345 00212 00327 00456 00688 00999 01057 00430
Hispanic Both Sexes 00664 00375 00737 00728 00395 00485 00723 01191 01987 02074 00746Males 00737 00397 00827 00807 00471 00576 00831 01350 02221 02551 00854Females 00589 00352 00642 00641 00312 00391 00617 01050 01809 01780 00647
Table 1329Leukemia
Estimated United States Cancer Prevalence Countsa on January 1 2016By RaceEthnicity Sex and Years Since Diagnosis
Estimated prevalence percenta on January 1 2016 of the SEER population diagnosed in the previous 24 yearsBy Age at Prevalence RaceEthnicity and Sex
SEE
R C
ancer Statistics Review
1975-2016N
ational Cancer Institute
a US 2016 cancer prevalence counts are based on 2016 cancer prevalence proportions from the SEER 13 Areas (excluding the AlaskaNative Registry) and 112016 US population estimates based on the average of 2015 and 2016 population estimates from theUS Bureau of the CensusPrevalence was calculated using the first invasive tumor for each cancer site diagnosed during the previous 24 years
b Maximum limited-duration prevalence is 24 years for 1992-2016 datac Percentages are age-adjusted to the 2000 US Standard Population (19 age groups - Census P25-1130) by 5-year age groupsd Cases diagnosed more than 24 years ago were estimated using the completeness index method (Capocaccia et al 1997
Merrill et al 2000)e Complete prevalence is obtained by summing 0 to lt24 and gt=24- Statistic not shown Statistic based on fewer than 5 cases estimated alive in SEER for the time interval+ Not available
Years Since Diagnosis 0 to lt5 5 to lt10 10 to lt15 15 to lt20 20 to lt24 0 to lt24b gt=24d Completee
Race Sex All Races Both Sexes 20277 16033 13721 12074 8203 70308 25456 95764
Males 11203 9049 7751 6542 4634 39179 12997 52176Females 9074 6984 5971 5531 3568 31129 12460 43589
White Both Sexes 17123 13855 11870 10663 7154 60665 21823 83282Males 9549 7741 6768 5696 4084 33839 11286 45559Females 7573 6114 5102 4967 3070 26826 10537 37723
Black Both Sexes 1590 1133 923 727 553 4926 1609 6535Males 809 734 473 411 290 2716 592 3308Females 781 399 450 317 263 2210 1017 3227
Asian Both Sexes 998 720 669 486 361 3234 + +Pacific Males 527 406 369 313 178 1793 + +Islander Females 472 314 300 173 183 1441 + +
Hispanic Both Sexes 5905 4543 3352 2717 1749 18266 + +Males 3302 2686 1899 1465 1058 10409 + +Females 2603 1857 1454 1252 692 7857 + +
Age Specific (Crude) Age-Adjustedc Age at Prevalence All Ages 0-9 10-19 20-29 30-39 40-49 50-59 60-69 70-79 80+ All Ages
Race Sex All Races Both Sexes 00218 00276 00541 00467 00139 00078 00059 00065 00053 00033 00228
Males 00247 00286 00591 00520 00163 00095 00066 00069 00056 00035 00251Females 00190 00266 00488 00410 00115 00062 00053 00062 00050 00032 00204
White Both Sexes 00241 00315 00612 00542 00161 00086 00063 00070 00056 00033 00259Males 00271 00323 00670 00598 00186 00107 00069 00074 00060 00032 00284Females 00211 00306 00551 00482 00135 00064 00057 00066 00053 00033 00232
Black Both Sexes 00109 00107 00250 00197 00067 00042 00039 00029 00012 00027 00102Males 00126 00112 00281 00224 00079 00035 00052 00026 00012 00027 00112Females 00094 00102 00219 00171 00056 00047 00028 00032 00013 00027 00092
Asian Both Sexes 00159 00208 00418 00289 00071 00064 00045 00050 00054 00036 00163Pacific Males 00184 00226 00427 00360 00086 00069 00055 00054 00033 00055 00180Islander Females 00136 00190 00408 00219 00058 00059 00036 00047 00071 00023 00146
Hispanic Both Sexes 00320 00328 00637 00574 00165 00107 00093 00100 00084 00012 00279Males 00361 00342 00710 00648 00205 00131 00110 00063 00072 - 00309Females 00278 00312 00562 00494 00122 00082 00077 00133 00093 00020 00246
Table 1330Acute Lymphocytic Leukemia
Estimated United States Cancer Prevalence Countsa on January 1 2016By RaceEthnicity Sex and Years Since Diagnosis
Estimated prevalence percenta on January 1 2016 of the SEER population diagnosed in the previous 24 yearsBy Age at Prevalence RaceEthnicity and Sex
0
5
10
15
20
25
1975 1985 1995 2005 20160
5
10
15
20
25
1975 1985 1995 2005 20160
3
6
9
12
15
1975 1985 1995 2005 20160
3
6
9
12
15
1975 1985 1995 2005 2016
Delay-Adj IncidenceDelay-Adj Incidence
Observed IncidenceObserved Incidence
MortalityMortality
SEER Observed Incidence SEER Delay Adjusted Incidence and US Death RatesLeukemia by Race and Sex
a
Figure 131
Source SEER 9 areas and US Mortality Files (National Center for Health Statistics CDC)Rates are age-adjusted to the 2000 US Std Population (19 age groups - Census P25-1103)Regression lines and APCs are calculated using the Joinpoint Regression Program Version 47 February 2019 National Cancer InstituteThe APC is the Annual Percent Change for the regression line segments The APC shown on the graph is for the most recent trendThe APC is significantly different from zero (p lt 005)
a
White Male Black Male White Female Black FemaleRate per 100000 Rate per 100000 Rate per 100000 Rate per 100000
Year of DiagnosisDeath Year of DiagnosisDeath Year of DiagnosisDeath Year of DiagnosisDeath
SEER Incidence APCsDelay Adj 1998-16 = 08Observed 1975-16 = 03
US Mortality APC2013-16 = -30
SEER Incidence APCsDelay Adj 1975-16 = 02Observed 1975-16 = 01
US Mortality APC1993-16 = -15
SEER Incidence APCsDelay Adj 1975-16 = 06Observed 1975-16 = 05
US Mortality APC2000-16 = -12
SEER Incidence APCsDelay Adj 1975-16 = 03Observed 1975-16 = 02
US Mortality APC1993-16 = -13
SEE
R C
ancer Statistics Review
1975-2016N
ational Cancer Institute
0
1
2
3
4
5
6
7
8
1975 1985 1995 2005 20160
1
2
3
4
5
6
7
8
1975 1985 1995 2005 20160
1
2
3
4
5
6
7
8
1975 1985 1995 2005 20160
1
2
3
4
5
6
7
8
1975 1985 1995 2005 2016
Chronic
Acute
SEER Observed Incidence RatesLymphocytic and Myeloid Leukemia (Acute and Chronic) by Sex
a
Figure 132
Source SEER 9 areas Rates are age-adjusted to the 2000 US Std Population (19 age groups - Census P25-1103)Regression lines and APCs are calculated using the Joinpoint Regression Program Version 47 February 2019 National Cancer Institute
a
Male Female Male FemaleLymphocytic Leukemia Myeloid Leukemia
Rate per 100000 Rate per 100000 Rate per 100000 Rate per 100000
Year of Diagnosis Year of Diagnosis Year of Diagnosis Year of Diagnosis
SEE
R C
ancer Statistics Review
1975-2016N
ational Cancer Institute
Joinpoint Analyses for Whites and Blacks from 1975-2016and for AsianPacific Islanders American IndiansAlaska Natives and Hispanics from 2000-2016
0
5
10
15
20
1975 1985 1995 2005 20160
5
10
15
20
1975 1985 1995 2005 2016
White
Black
API
AIAN
Hispanic
SEER Incidence and US Death RatesLeukemia Both Sexes
Figure 133
Source Incidence data for whites and blacks are from the SEER 9 areas (San Francisco Connecticut Detroit Hawaii Iowa New Mexico Seattle Utah Atlanta)Incidence data for AsianPacific Islanders American IndiansAlaska Natives and Hispanics are from the SEER 21 areas (SEER 9 areas San Jose-MontereyLos Angeles Alaska Native Registry Rural Georgia California excluding SFSJMLA Kentucky Louisiana New Jersey Georgia excluding ATLRG Idaho New York andMassachusetts)Mortality data are from US Mortality Files National Center for Health Statistics CDCRates are age-adjusted to the 2000 US Std Population (19 age groups - Census P25-1103)Regression lines are calculated using the Joinpoint Regression Program Version 47 February 2019 National Cancer Institute Joinpoint analyses for Whites andBlacks during the 1975-2016 period allow a maximum of 5 joinpoints Analyses for other ethnic groups during the period 2000-2016 allow a maximum of 3 joinpointsAPI = AsianPacific IslanderAIAN = American IndianAlaska Native Rates for American IndianAlaska Native are based on the PurchasedReferred Care Delivery Area (PRCDA) countiesHispanic is not mutually exclusive from whites blacks AsianPacific Islanders and American IndiansAlaska Natives Incidence data for Hispanics are based onNHIA and exclude cases from the Alaska Native Registry
Incidence MortalityRate per 100000 Rate per 100000
Year of Diagnosis Year of Death
a
d
a
b
c
c
b
d
SEE
R C
ancer Statistics Review
1975-2016N
ational Cancer Institute

SEE
R C
ancer Statistics Review
1975-2016N
ational Cancer Institute
Devcan 677 April 2019 National Cancer Institute (httpssurveillancecancergovdevcan)Source Incidence data are from the SEER 21 areas (San Francisco Connecticut Detroit Hawaii Iowa New Mexico Seattle Utah Atlanta
San Jose-Monterey Los Angeles Alaska Native Registry Rural Georgia California excluding SFSJMLA Kentucky Louisiana New JerseyGeorgia excluding ATLRG Idaho New York and Massachusetts) Mortality data are from the NCHS public use data file for the total US
a Underlying incidence and mortality data for American IndianAlaska Native are based on the PRCDA(PurchasedReferred Care DeliveryAreas) counties
b Hispanic is not mutually exclusive from whites blacks AsianPacific Islanders and American IndiansAlaska NativesUnderlying incidence data for Hispanics are based on NHIA and exclude cases from the Alaska Native Registry
- Statistic could not be calculatedA percent of 000 represents a value that is below 0005
Risk of Being Risk of Being
Race Current Diagnosed with Cancer Risk of Dying Race Current Diagnosed with Cancer Risk of Dying
Ethnicity Age +10 yrs +20 yrs +30 yrs Ever from Cancer Ethnicity Age +10 yrs +20 yrs +30 yrs Ever from Cancer
All Races 0 006 009 012 156 082 Asian 0 005 008 011 099 058
10 003 006 010 152 082 Pacific 10 003 006 009 095 058
20 003 007 014 149 082 Islander 20 003 006 010 092 058
30 004 011 026 147 082 30 003 008 016 090 057
40 007 022 051 145 082 40 004 012 026 087 057
50 015 045 089 141 082 50 008 022 047 083 056
60 031 079 121 134 082 60 014 040 066 078 054
70 053 101 - 115 080 70 028 055 - 067 051
80 062 - - 082 068 80 032 - - 047 040
White 0 006 010 013 164 085 American 0 005 007 009 085 040
10 003 007 011 159 086 Indian 10 002 004 008 081 040
20 003 007 014 156 085 Alaska 20 002 006 010 079 039
30 004 011 027 155 085 Nativea 30 004 008 019 078 039
40 007 023 053 153 085 40 004 015 030 076 040
50 016 047 095 149 086 50 012 027 051 075 040
60 033 083 127 141 086 60 017 042 061 068 040
70 057 106 - 121 084 70 029 051 - 058 038
80 066 - - 086 071 80 029 - - 038 025
Black 0 003 006 008 107 058 Hispanicb 0 007 011 015 124 066
10 002 005 009 105 059 10 005 008 012 118 066
20 003 006 013 104 059 20 004 008 014 114 065
30 004 011 022 102 058 30 004 010 021 111 064
40 007 019 041 100 058 40 006 017 037 108 064
50 013 035 066 097 058 50 011 031 063 104 063
60 025 058 083 091 058 60 021 054 085 097 062
70 039 069 - 079 057 70 037 070 - 083 058
80 042 - - 056 048 80 042 - - 058 049
Table 1320
Leukemia
Risk of Being Diagnosed With Cancer in 10 20 and 30 Years
Lifetime Risk of Being Diagnosed with Cancer Given Alive and Cancer-Free at Current Age and
Lifetime Risk of Dying from Cancer Given Alive at Current Age
Both Sexes 2014-2016 By RaceEthnicity
SEE
R C
ancer Statistics Review
1975-2016N
ational Cancer Institute
Devcan 677 April 2019 National Cancer Institute (httpssurveillancecancergovdevcan)Source Incidence data are from the SEER 21 areas (San Francisco Connecticut Detroit Hawaii Iowa New Mexico Seattle Utah Atlanta
San Jose-Monterey Los Angeles Alaska Native Registry Rural Georgia California excluding SFSJMLA Kentucky Louisiana New JerseyGeorgia excluding ATLRG Idaho New York and Massachusetts) Mortality data are from the NCHS public use data file for the total US
a Underlying incidence and mortality data for American IndianAlaska Native are based on the PRCDA(PurchasedReferred Care DeliveryAreas) counties
b Hispanic is not mutually exclusive from whites blacks AsianPacific Islanders and American IndiansAlaska NativesUnderlying incidence data for Hispanics are based on NHIA and exclude cases from the Alaska Native Registry
- Statistic could not be calculatedA percent of 000 represents a value that is below 0005
Risk of Being Risk of Being
Race Current Diagnosed with Cancer Risk of Dying Race Current Diagnosed with Cancer Risk of Dying
Ethnicity Age +10 yrs +20 yrs +30 yrs Ever from Cancer Ethnicity Age +10 yrs +20 yrs +30 yrs Ever from Cancer
All Races 0 006 010 013 186 096 Asian 0 005 009 011 119 072
10 004 007 012 182 097 Pacific 10 004 007 010 115 072
20 003 008 016 179 097 Islander 20 003 007 012 111 071
30 005 013 030 177 097 30 004 009 019 109 071
40 008 026 062 176 098 40 005 015 033 106 070
50 018 056 112 173 099 50 010 028 062 102 069
60 040 101 152 166 101 60 019 054 084 096 068
70 071 129 - 146 101 70 038 071 - 084 065
80 082 - - 105 088 80 040 - - 056 052
White 0 007 011 014 195 101 American 0 006 009 011 110 048
10 004 008 012 190 102 Indian 10 003 005 010 105 048
20 004 008 016 187 101 Alaska 20 002 007 011 103 048
30 005 013 031 186 101 Nativea 30 005 009 021 103 048
40 009 027 065 184 102 40 005 017 041 102 049
50 019 058 118 181 103 50 013 039 075 102 051
60 042 107 160 174 106 60 028 067 087 097 051
70 075 136 - 153 105 70 046 070 - 081 049
80 087 - - 110 091 80 034 - - 049 030
Black 0 003 006 008 122 065 Hispanicb 0 007 013 017 141 080
10 003 006 009 122 066 10 005 010 015 135 080
20 003 006 014 120 065 20 005 009 016 130 079
30 004 011 025 119 066 30 005 011 023 127 078
40 008 022 048 118 066 40 007 018 040 124 078
50 015 042 079 115 067 50 012 034 072 120 078
60 031 071 102 112 068 60 024 064 100 114 078
70 051 089 - 101 068 70 046 086 - 102 077
80 058 - - 077 061 80 053 - - 074 070
Table 1321
Leukemia
Risk of Being Diagnosed With Cancer in 10 20 and 30 Years
Lifetime Risk of Being Diagnosed with Cancer Given Alive and Cancer-Free at Current Age and
Lifetime Risk of Dying from Cancer Given Alive at Current Age
Males 2014-2016 By RaceEthnicity
SEE
R C
ancer Statistics Review
1975-2016N
ational Cancer Institute
Devcan 677 April 2019 National Cancer Institute (httpssurveillancecancergovdevcan)Source Incidence data are from the SEER 21 areas (San Francisco Connecticut Detroit Hawaii Iowa New Mexico Seattle Utah Atlanta
San Jose-Monterey Los Angeles Alaska Native Registry Rural Georgia California excluding SFSJMLA Kentucky Louisiana New JerseyGeorgia excluding ATLRG Idaho New York and Massachusetts) Mortality data are from the NCHS public use data file for the total US
a Underlying incidence and mortality data for American IndianAlaska Native are based on the PRCDA(PurchasedReferred Care DeliveryAreas) counties
b Hispanic is not mutually exclusive from whites blacks AsianPacific Islanders and American IndiansAlaska NativesUnderlying incidence data for Hispanics are based on NHIA and exclude cases from the Alaska Native Registry
- Statistic could not be calculatedA percent of 000 represents a value that is below 0005
Risk of Being Risk of Being
Race Current Diagnosed with Cancer Risk of Dying Race Current Diagnosed with Cancer Risk of Dying
Ethnicity Age +10 yrs +20 yrs +30 yrs Ever from Cancer Ethnicity Age +10 yrs +20 yrs +30 yrs Ever from Cancer
All Races 0 006 008 011 129 068 Asian 0 005 008 010 083 048
10 003 005 009 125 069 Pacific 10 003 005 008 078 047
20 003 006 012 122 068 Islander 20 002 005 009 075 047
30 003 009 021 120 068 30 003 006 013 073 046
40 006 018 039 118 068 40 004 010 021 071 046
50 012 034 068 114 067 50 007 017 035 068 045
60 023 059 093 106 067 60 011 029 051 063 044
70 039 077 - 091 064 70 019 042 - 054 040
80 048 - - 066 055 80 026 - - 040 033
White 0 006 009 011 135 071 American 0 003 005 007 061 031
10 003 005 009 131 071 Indian 10 002 003 007 058 031
20 003 006 012 128 071 Alaska 20 002 005 008 056 031
30 003 010 022 126 071 Nativea 30 004 007 017 055 031
40 006 019 042 124 070 40 003 014 020 053 031
50 013 036 072 120 070 50 011 017 030 051 031
60 024 062 099 112 069 60 007 021 038 042 030
70 042 081 - 096 067 70 015 035 - 039 029
80 051 - - 069 057 80 025 - - 030 022
Black 0 004 006 008 095 053 Hispanicb 0 006 010 013 110 056
10 002 004 008 093 054 10 004 007 010 105 056
20 002 006 012 091 053 20 003 006 012 101 055
30 004 010 020 089 053 30 003 009 019 099 054
40 006 016 035 087 053 40 006 016 034 096 054
50 011 029 054 083 052 50 010 028 055 091 052
60 020 047 069 077 051 60 019 046 073 084 050
70 030 055 - 065 049 70 030 059 - 070 046
80 033 - - 046 042 80 035 - - 048 037
Table 1322
Leukemia
Risk of Being Diagnosed With Cancer in 10 20 and 30 Years
Lifetime Risk of Being Diagnosed with Cancer Given Alive and Cancer-Free at Current Age and
Lifetime Risk of Dying from Cancer Given Alive at Current Age
Females 2014-2016 By RaceEthnicity
SEER Cancer Statistics Review 1975-2016 National Cancer Institute
The AAPC is the Average Annual Percent Change over the time interval The AAPCs are calculated bythe Joinpoint Regression Program Version 47 February 2019 National Cancer Institute
- Statistic not shown Rate based on less than 16 cases for the time intervalTrend based on less than 10 cases for at least one year within the time interval
a Rates are age-adjusted to the 2000 US Std Population (19 age groups - Census P25-1130) Trendsare based on rates age-adjusted to the 2000 US Std Population (19 age groups - Census P25-1130)
b The SEER 9 areas are San Francisco Connecticut Detroit Hawaii Iowa New Mexico SeattleUtah and AtlantaThe SEER 21 areas comprise the SEER 9 areas plus San Jose-Monterey Los Angeles the AlaskaNative Registry Rural Georgia California excluding SFSJMLA Kentucky Louisiana New JerseyGeorgia excluding ATLRG Idaho New York and Massachusetts
c The 2007-2016 AAPC estimates are based on a Joinpoint analysis with up to 3 Joinpoints overdiagnosis years 2000-2016
d The 2007-2016 AAPC estimates are based on a Joinpoint analysis with up to 5 Joinpoints overdiagnosis years 1975-2016
e Hispanic and Non-Hispanic are not mutually exclusive from whites blacks AsianPacificIslanders and American IndiansAlaska Natives Incidence data for Hispanics and Non-Hispanicsare based on NHIA and exclude cases from the Alaska Native Registry
f Incidence data for American IndianAlaska Native are based on the PurchasedReferred CareDelivery Area (PRCDA) counties
g US Mortality Files National Center for Health Statistics CDCh The 2007-2016 mortality AAPCs are based on a Joinpoint analysis using years of death 2000-2016 The APC is significantly different from zero (plt05)
SEER Incidence SEER 21 Areasb SEER 21 Areasb SEER 9 Areasb
Rate 2012-2016 Trend 2007-2016c Trend 2007-2016d
Rate per 100000 persons AAPC () AAPC ()
Total Males Females Total Males Females Total Males Females RaceEthnicity
All Races 141 181 109 -04 -02 -06 -03 02 03
White 149 191 115 -05 -05 -07 04 03 05White Hispanice 112 134 94 01 -02 03 - - -White Non-Hispanice 153 197 116 -05 -05 -08 - - -
Black 109 139 89 06 02 07 01 01 02
AsianPacific Islander 78 97 63 01 00 02 - - -
Amer IndAlaska Natf 86 110 66 08 21 -01 - - -
Hispanice 108 130 91 02 00 03 - - -
US Mortalityg Rate 2012-2016 Trend 2007-2016h
Rate per 100000 persons AAPC ()
Total Males Females Total Males FemalesRaceEthnicity
All Races 65 88 49 -16 -17 -13
White 68 91 51 -14 -16 -12White Hispanice 50 63 41 -07 -08 -06White Non-Hispanice 69 93 51 -14 -15 -12
Black 55 72 44 -15 -17 -15
AsianPacific Islander 36 47 28 -18 -07 -23
Amer IndAlaska NatTotal US 31 42 23 -22 -09 -36PRCDA Counties 41 54 30 -16 -05 -28Non-PRCDA Counties 20 28 15 -31 -13 -50
Hispanice 47 60 38 -08 -09 -07
Table 1323Leukemia
SEER Incidence and US MortalityAge-Adjusted Rates and Trendsa
By RaceEthnicity and Sex
SEE
R C
ancer Statistics Review
1975-2016N
ational Cancer Institute
a Rates are per 100000 and are age-adjusted to the 2000 US Std Population (19 age groups - Census P25-1130)b The SEER 9 areas are San Francisco Connecticut Detroit Hawaii Iowa New Mexico Seattle Utah and Atlanta
The SEER 13 areas comprise the SEER 9 areas plus San Jose-Monterey Los Angeles the Alaska Native Registry and Rural GeorgiaThe SEER 18 areas comprise the SEER 13 areas plus California excluding SFSJMLA Kentucky Louisiana New Jersey and Georgiaexcluding ATLRGThe SEER 21 areas comprise the SEER 18 areas plus Idaho New York and Massachusetts
- Statistic not shown Rate based on less than 16 cases for the time interval
All Races Whites Blacks Total Males Females Total Males Females Total Males Females
SEER Incidence Ratesa 2012-2016
California 1239 1590 949 1337 1715 1020 1039 1334 813Greater Bay Area 1231 1619 915 1400 1844 1028 1098 1406 859San Francisco-Oakland 1212 1596 906 1389 1823 1034 1077 1336 881San Jose-Monterey 1259 1651 925 1410 1869 1011 1239 1787 -
Los Angeles 1173 1469 933 1291 1622 1016 1050 1294 884Greater California 1271 1633 968 1334 1709 1017 1007 1338 729
Connecticut 1406 1768 1117 1431 1790 1142 976 1126 867Detroit 1584 2050 1230 1707 2222 1300 1204 1485 1018Georgia 1430 1841 1120 1537 1970 1189 1139 1487 935Atlanta 1382 1819 1064 1563 2017 1207 1138 1557 884Rural Georgia 1411 1586 1206 1510 1773 1196 1248 - 1236Greater Georgia 1455 1863 1144 1531 1965 1182 1140 1450 968
Hawaii 1073 1339 843 1388 1612 1139 - - -Idaho 1588 1950 1263 1604 1973 1272 - - -Iowa 1627 2127 1222 1630 2133 1221 1416 1743 1076Kentucky 1566 1983 1234 1577 1995 1241 1159 1446 922Louisiana 1405 1789 1104 1518 1918 1197 1103 1393 890Massachusetts 1108 1429 854 1118 1448 856 787 1050 620New Jersey 1524 1962 1188 1541 1982 1199 1136 1469 928New Mexico 1299 1550 1086 1310 1556 1101 1045 - -New York 1623 2119 1244 1752 2281 1335 1068 1360 887Seattle-Puget Sound 1568 2020 1188 1634 2084 1249 1486 1929 1077Utah 1375 1793 1009 1401 1825 1029 - - -
SEER 9 Areasb 1419 1823 1094 1521 1945 1171 1154 1460 941SEER 13 Areasb 1357 1737 1049 1473 1882 1134 1126 1419 922SEER 18 Areasb 1376 1761 1066 1461 1867 1127 1114 1414 907SEER 21 Areasb 1407 1807 1088 1491 1912 1147 1089 1386 889
Table 1324Leukemia
Age-Adjusted SEER Incidence Ratesa
By Registry Race and Sex
SEE
R C
ancer Statistics Review
1975-2016N
ational Cancer Institute
a US Mortality Files National Center for Health Statistics Centers for Disease Control and PreventionRates are per 100000 and are age-adjusted to the 2000 US Std Population (19 age groups - Census P25-1130)
b The SEER 9 areas are San Francisco Connecticut Detroit Hawaii Iowa New Mexico Seattle Utah and AtlantaThe SEER 13 areas comprise the SEER 9 areas plus San Jose-Monterey Los Angeles the Alaska Native Registry and Rural GeorgiaThe SEER 18 areas comprise the SEER 13 areas plus California excluding SFSJMLA Kentucky Louisiana New Jersey and Georgiaexcluding ATLRGThe SEER 21 areas comprise the SEER 18 areas plus Idaho New York and Massachusetts
- Statistic not shown Rate based on less than 16 cases for the time interval
All Races Whites Blacks Total Males Females Total Males Females Total Males Females
SEER Death Ratesa 2012-2016
California 617 811 470 671 885 507 560 711 461Greater Bay Area 563 759 419 640 869 470 551 742 424San Francisco-Oakland 551 753 405 631 871 455 544 726 421San Jose-Monterey 584 768 446 653 863 495 604 - -
Los Angeles 608 797 468 675 894 513 571 717 483Greater California 639 835 489 677 886 515 553 687 458
Connecticut 622 837 465 639 862 474 536 665 449Detroit 662 915 485 691 967 494 573 723 475Georgia 614 817 467 642 855 478 538 706 438Atlanta 568 757 437 615 802 483 487 658 374Rural Georgia 581 628 538 579 635 - - - -Greater Georgia 639 851 482 654 879 477 576 745 483
Hawaii 463 593 362 543 632 440 - - -Idaho 655 846 497 661 865 492 - - -Iowa 693 961 498 700 963 508 - - -Kentucky 742 949 592 750 953 603 633 894 455Louisiana 677 906 514 705 953 520 603 776 498Massachusetts 622 830 478 647 869 490 463 524 444New Jersey 615 810 478 657 871 504 474 549 429New Mexico 560 759 400 589 794 421 - - -New York 621 842 466 675 910 506 450 602 356Seattle-Puget Sound 618 795 481 637 807 503 708 975 499Utah 679 865 526 693 876 542 - - -
SEER 9 Areasb 610 818 457 651 869 487 540 711 427SEER 13 Areasb 609 810 460 658 874 494 544 708 437SEER 18 Areasb 630 832 480 671 887 508 552 705 455SEER 21 Areasb 628 834 477 670 889 506 520 670 426
Total US 654 876 489 681 912 506 550 721 439
Table 1325Leukemia
Age-Adjusted SEER Death Ratesa
By Registry Race and Sex
SEER Cancer Statistics Review 1975-2016 National Cancer Institute
a US Mortality Files National Center for Health Statistics Centers for Disease Control andPrevention Rates are per 100000 and are age-adjusted to the 2000 US Std Population (19age groups - Census P25-1130)
b Difference between state rate and total US rate is statistically significant (plt=0002)c Absolute percent difference between state rate and total US rate is 15 or mored Rank of state level death rate and the 95 confidence intervals (low high) for the rankSE Standard error of the ratePD Percent difference between state rate and total US rate- Statistic not shown Rate based on less than 16 cases for the time interval
State Rate SE Rank(CI)d PD TOTAL US 654 002
High Five StatesOklahoma 790 019 01(0108) 2083c
West Virginia 749 025 02(0123) 1449South Dakota 747 040 03(0133) 1415Kentucky 742 018 04(0116) 1352Kansas 742 022 05(0122) 1350
Low Five StatesColorado 609 016 47(2649) -692Alaska 596 050 48(0451) -885New Mexico 560 022 49(3650) -1430DC 504 041 50(3251) -2293c
Hawaii 463 024 51(4951) -2913c
State Rate SE Rank(CI)d PD State Rate SE Rank(CI)d PD
Alabama 689 016 17(0532) 533 Montana 613 032 45(0950) -634Alaska 596 050 48(0451) -885 Nebraska 718 026 10(0131) 983Arizona 632 013 36(2248) -329 Nevada 644 021 28(1148) -157Arkansas 719 021 09(0127) 993 New Hampshire 638 029 31(0749) -238California 617 006 42(3248) -572 New Jersey 615 011 43(2849) -592Colorado 609 016 47(2649) -692 New Mexico 560 022 49(3650) -1430Connecticut 622 017 40(2249) -490 New York 621 007 41(2948) -499Delaware 664 035 24(0249) 152 North Carolina 634 011 34(2347) -310DC 504 041 50(3251) -2293c North Dakota 656 040 26(0249) 029Florida 630 007 38(2645) -370 Ohio 694 010 13(0626) 608Georgia 614 012 44(2849) -604 Oklahoma 790 019 01(0108) 2083c
Hawaii 463 024 51(4951) -2913c Oregon 632 017 37(1948) -331Idaho 655 028 27(0548) 012 Pennsylvania 680 009 21(1029) 396Illinois 684 010 19(0928) 463 Rhode Island 656 033 25(0349) 037Indiana 719 014 08(0222) 994 South Carolina 682 016 20(0634) 435Iowa 693 019 14(0334) 604 South Dakota 747 040 03(0133) 1415Kansas 742 022 05(0122) 1350 Tennessee 702 014 12(0327) 729Kentucky 742 018 04(0116) 1352 Texas 640 007 30(2342) -215Louisiana 677 017 23(0637) 356 Utah 679 024 22(0346) 387Maine 638 027 32(0949) -240 Vermont 636 041 33(0350) -277Maryland 633 014 35(2148) -323 Virginia 611 012 46(2849) -661Massachusetts 622 013 39(2548) -482 Washington 640 013 29(2047) -209Michigan 685 011 18(0829) 476 West Virginia 749 025 02(0123) 1449Minnesota 691 015 16(0430) 564 Wisconsin 727 015 06(0219) 1110Mississippi 692 021 15(0337) 580 Wyoming 721 049 07(0148) 1028Missouri 711 014 11(0324) 874
Table 1326Leukemia
Age-Adjusted Cancer Deatha Rates By State All Races 2012-2016
Males and Females
SEER Cancer Statistics Review 1975-2016 National Cancer Institute
a US Mortality Files National Center for Health Statistics Centers for Disease Control andPrevention Rates are per 100000 and are age-adjusted to the 2000 US Std Population (19age groups - Census P25-1130)
b Difference between state rate and total US rate is statistically significant (plt=0002)c Absolute percent difference between state rate and total US rate is 15 or mored Rank of state level death rate and the 95 confidence intervals (low high) for the rankSE Standard error of the ratePD Percent difference between state rate and total US rate- Statistic not shown Rate based on less than 16 cases for the time interval
State Rate SE Rank(CI)d PD TOTAL US 876 003
High Five StatesOklahoma 1022 034 01(0120) 1669c
Kansas 1018 039 02(0123) 1625c
Arkansas 991 037 03(0127) 1309South Dakota 985 068 04(0147) 1249Delaware 984 065 05(0144) 1236
Low Five StatesMontana 795 053 47(1150) -921New Mexico 759 039 48(2650) -1336Alaska 711 081 49(0851) -1887c
DC 704 078 50(1051) -1959c
Hawaii 593 040 51(4951) -3228c
State Rate SE Rank(CI)d PD State Rate SE Rank(CI)d PD
Alabama 939 029 17(0233) 725 Montana 795 053 47(1150) -921Alaska 711 081 49(0851) -1887c Nebraska 958 046 12(0141) 935Arizona 827 022 41(2449) -555 Nevada 858 037 33(0849) -210Arkansas 991 037 03(0127) 1309 New Hampshire 884 051 25(0149) 088California 811 010 43(3348) -738 New Jersey 810 020 44(2749) -747Colorado 834 028 39(2049) -484 New Mexico 759 039 48(2650) -1336Connecticut 837 031 37(1549) -441 New York 842 013 35(2546) -387Delaware 984 065 05(0144) 1236 North Carolina 863 020 31(1945) -149DC 704 078 50(1051) -1959c North Dakota 873 070 27(0150) -030Florida 839 012 36(2645) -422 Ohio 931 018 19(0529) 627Georgia 817 021 42(2649) -677 Oklahoma 1022 034 01(0120) 1669c
Hawaii 593 040 51(4951) -3228c Oregon 866 029 29(1147) -112Idaho 846 047 34(0550) -339 Pennsylvania 912 016 21(0931) 416Illinois 928 018 20(0529) 594 Rhode Island 911 059 22(0149) 400Indiana 960 025 11(0127) 959 South Carolina 951 029 13(0131) 853Iowa 961 035 08(0131) 969 South Dakota 985 068 04(0147) 1249Kansas 1018 039 02(0123) 1625c Tennessee 960 025 10(0127) 959Kentucky 949 031 15(0133) 832 Texas 870 013 28(2139) -069Louisiana 906 030 23(0442) 342 Utah 865 041 30(0549) -122Maine 803 046 46(1450) -836 Vermont 874 074 26(0150) -026Maryland 861 026 32(1447) -176 Virginia 809 021 45(2650) -770Massachusetts 830 023 40(2349) -529 Washington 835 023 38(2248) -463Michigan 937 020 18(0428) 702 West Virginia 972 044 06(0135) 1095Minnesota 948 027 16(0229) 826 Wisconsin 960 026 09(0127) 961Mississippi 970 039 07(0132) 1077 Wyoming 885 081 24(0150) 102Missouri 951 025 14(0228) 852
Table 1327Leukemia
Age-Adjusted Cancer Deatha Rates By State All Races 2012-2016
Males
SEER Cancer Statistics Review 1975-2016 National Cancer Institute
a US Mortality Files National Center for Health Statistics Centers for Disease Control andPrevention Rates are per 100000 and are age-adjusted to the 2000 US Std Population (19age groups - Census P25-1130)
b Difference between state rate and total US rate is statistically significant (plt=0002)c Absolute percent difference between state rate and total US rate is 15 or mored Rank of state level death rate and the 95 confidence intervals (low high) for the rankSE Standard error of the ratePD Percent difference between state rate and total US rate- Statistic not shown Rate based on less than 16 cases for the time interval
State Rate SE Rank(CI)d PD TOTAL US 489 002
High Five StatesOklahoma 615 023 01(0108) 2584c
Wyoming 596 060 02(0147) 2194c
Kentucky 592 021 03(0111) 2126c
West Virginia 576 030 04(0126) 1792c
South Dakota 564 047 05(0145) 1551c
Low Five StatesColorado 441 018 47(2250) -972Delaware 428 037 48(0751) -1247New Mexico 400 025 49(3151) -1803c
DC 381 046 50(1251) -2203c
Hawaii 362 029 51(4151) -2598c
State Rate SE Rank(CI)d PD State Rate SE Rank(CI)d PD
Alabama 512 019 18(0440) 483 Montana 452 037 43(0551) -745Alaska 485 062 27(0151) -073 Nebraska 531 030 10(0144) 864Arizona 473 015 31(1347) -308 Nevada 455 025 42(1150) -695Arkansas 516 024 15(0344) 554 New Hampshire 449 033 45(0651) -807California 470 007 34(2345) -383 New Jersey 478 013 30(1346) -223Colorado 441 018 47(2250) -972 New Mexico 400 025 49(3151) -1803c
Connecticut 465 020 40(1249) -487 New York 466 009 38(2246) -456Delaware 428 037 48(0751) -1247 North Carolina 471 012 32(1747) -350DC 381 046 50(1251) -2203c North Dakota 479 046 28(0151) -189Florida 460 008 41(2647) -582 Ohio 520 012 12(0529) 653Georgia 467 013 37(1747) -433 Oklahoma 615 023 01(0108) 2584c
Hawaii 362 029 51(4151) -2598c Oregon 449 019 44(1850) -799Idaho 497 033 22(0249) 174 Pennsylvania 516 011 14(0629) 556Illinois 514 011 16(0631) 526 Rhode Island 471 037 33(0351) -363Indiana 540 017 07(0226) 1052 South Carolina 495 018 23(0645) 133Iowa 498 022 20(0547) 200 South Dakota 564 047 05(0145) 1551c
Kansas 539 025 08(0137) 1032 Tennessee 517 016 13(0435) 590Kentucky 592 021 03(0111) 2126c Texas 467 008 36(2246) -431Louisiana 514 020 17(0442) 520 Utah 526 029 11(0146) 778Maine 508 032 19(0248) 403 Vermont 444 045 46(0351) -906Maryland 470 016 35(1448) -389 Virginia 465 014 39(1848) -474Massachusetts 478 015 29(1247) -220 Washington 487 016 25(0946) -022Michigan 498 013 21(0939) 192 West Virginia 576 030 04(0126) 1792c
Minnesota 494 017 24(0745) 121 Wisconsin 545 017 06(0225) 1162Mississippi 485 023 26(0548) -067 Wyoming 596 060 02(0147) 2194c
Missouri 535 017 09(0327) 953
Table 1328Leukemia
Age-Adjusted Cancer Deatha Rates By State All Races 2012-2016
Females
SEE
R C
ancer Statistics Review
1975-2016N
ational Cancer Institute
a US 2016 cancer prevalence counts are based on 2016 cancer prevalence proportions from the SEER 13 Areas (excluding the AlaskaNative Registry) and 112016 US population estimates based on the average of 2015 and 2016 population estimates from theUS Bureau of the CensusPrevalence was calculated using the first invasive tumor for each cancer site diagnosed during the previous 24 years
b Maximum limited-duration prevalence is 24 years for 1992-2016 datac Percentages are age-adjusted to the 2000 US Standard Population (19 age groups - Census P25-1130) by 5-year age groupsd Cases diagnosed more than 24 years ago were estimated using the completeness index method (Capocaccia et al 1997
Merrill et al 2000)e Complete prevalence is obtained by summing 0 to lt24 and gt=24- Statistic not shown Statistic based on fewer than 5 cases estimated alive in SEER for the time interval+ Not available
Years Since Diagnosis 0 to lt5 5 to lt10 10 to lt15 15 to lt20 20 to lt24 0 to lt24b gt=24d Completee
Race Sex All Races Both Sexes 153253 100309 63581 38012 21353 376508 38265 414773
Males 90192 57683 36029 21220 12020 217145 18411 235556Females 63061 42625 27552 16792 9333 159363 19854 179217
White Both Sexes 132173 87961 56051 33596 19035 328814 32999 370135Males 78368 50894 32033 18770 10845 190910 15102 210930Females 53805 37067 24018 14826 8190 137905 17897 159205
Black Both Sexes 12734 6564 4233 2487 1259 27277 4070 31347Males 6847 3556 2204 1334 637 14578 1776 16354Females 5887 3008 2029 1153 622 12699 2294 14992
Asian Both Sexes 3926 2561 1778 1164 690 10120 + +Pacific Males 2235 1462 936 646 351 5630 + +Islander Females 1691 1100 842 519 339 4490 + +
Hispanic Both Sexes 14464 9581 6796 4462 2630 37933 + +Males 8166 5374 3794 2408 1538 21280 + +Females 6298 4207 3002 2055 1092 16654 + +
Age Specific (Crude) Age-Adjustedc Age at Prevalence All Ages 0-9 10-19 20-29 30-39 40-49 50-59 60-69 70-79 80+ All Ages
Race Sex All Races Both Sexes 01168 00328 00640 00628 00377 00561 01053 02263 04023 05111 01054
Males 01369 00339 00706 00685 00419 00657 01287 02888 05282 07048 01306Females 00974 00317 00572 00570 00333 00466 00829 01696 02974 03919 00844
White Both Sexes 01304 00369 00715 00712 00410 00584 01106 02389 04249 05386 01127Males 01528 00379 00789 00771 00457 00682 01349 03042 05558 07387 01389Females 01084 00359 00637 00650 00362 00484 00869 01784 03135 04133 00904
Black Both Sexes 00605 00145 00322 00320 00267 00463 00752 01455 02470 03076 00660Males 00674 00142 00357 00338 00281 00530 00919 01737 03249 04580 00816Females 00541 00148 00286 00301 00255 00402 00605 01230 01927 02334 00552
Asian Both Sexes 00497 00264 00531 00426 00230 00390 00553 00882 01245 01389 00513Pacific Males 00577 00298 00555 00507 00249 00461 00665 01122 01552 01904 00613Islander Females 00423 00228 00507 00345 00212 00327 00456 00688 00999 01057 00430
Hispanic Both Sexes 00664 00375 00737 00728 00395 00485 00723 01191 01987 02074 00746Males 00737 00397 00827 00807 00471 00576 00831 01350 02221 02551 00854Females 00589 00352 00642 00641 00312 00391 00617 01050 01809 01780 00647
Table 1329Leukemia
Estimated United States Cancer Prevalence Countsa on January 1 2016By RaceEthnicity Sex and Years Since Diagnosis
Estimated prevalence percenta on January 1 2016 of the SEER population diagnosed in the previous 24 yearsBy Age at Prevalence RaceEthnicity and Sex
SEE
R C
ancer Statistics Review
1975-2016N
ational Cancer Institute
a US 2016 cancer prevalence counts are based on 2016 cancer prevalence proportions from the SEER 13 Areas (excluding the AlaskaNative Registry) and 112016 US population estimates based on the average of 2015 and 2016 population estimates from theUS Bureau of the CensusPrevalence was calculated using the first invasive tumor for each cancer site diagnosed during the previous 24 years
b Maximum limited-duration prevalence is 24 years for 1992-2016 datac Percentages are age-adjusted to the 2000 US Standard Population (19 age groups - Census P25-1130) by 5-year age groupsd Cases diagnosed more than 24 years ago were estimated using the completeness index method (Capocaccia et al 1997
Merrill et al 2000)e Complete prevalence is obtained by summing 0 to lt24 and gt=24- Statistic not shown Statistic based on fewer than 5 cases estimated alive in SEER for the time interval+ Not available
Years Since Diagnosis 0 to lt5 5 to lt10 10 to lt15 15 to lt20 20 to lt24 0 to lt24b gt=24d Completee
Race Sex All Races Both Sexes 20277 16033 13721 12074 8203 70308 25456 95764
Males 11203 9049 7751 6542 4634 39179 12997 52176Females 9074 6984 5971 5531 3568 31129 12460 43589
White Both Sexes 17123 13855 11870 10663 7154 60665 21823 83282Males 9549 7741 6768 5696 4084 33839 11286 45559Females 7573 6114 5102 4967 3070 26826 10537 37723
Black Both Sexes 1590 1133 923 727 553 4926 1609 6535Males 809 734 473 411 290 2716 592 3308Females 781 399 450 317 263 2210 1017 3227
Asian Both Sexes 998 720 669 486 361 3234 + +Pacific Males 527 406 369 313 178 1793 + +Islander Females 472 314 300 173 183 1441 + +
Hispanic Both Sexes 5905 4543 3352 2717 1749 18266 + +Males 3302 2686 1899 1465 1058 10409 + +Females 2603 1857 1454 1252 692 7857 + +
Age Specific (Crude) Age-Adjustedc Age at Prevalence All Ages 0-9 10-19 20-29 30-39 40-49 50-59 60-69 70-79 80+ All Ages
Race Sex All Races Both Sexes 00218 00276 00541 00467 00139 00078 00059 00065 00053 00033 00228
Males 00247 00286 00591 00520 00163 00095 00066 00069 00056 00035 00251Females 00190 00266 00488 00410 00115 00062 00053 00062 00050 00032 00204
White Both Sexes 00241 00315 00612 00542 00161 00086 00063 00070 00056 00033 00259Males 00271 00323 00670 00598 00186 00107 00069 00074 00060 00032 00284Females 00211 00306 00551 00482 00135 00064 00057 00066 00053 00033 00232
Black Both Sexes 00109 00107 00250 00197 00067 00042 00039 00029 00012 00027 00102Males 00126 00112 00281 00224 00079 00035 00052 00026 00012 00027 00112Females 00094 00102 00219 00171 00056 00047 00028 00032 00013 00027 00092
Asian Both Sexes 00159 00208 00418 00289 00071 00064 00045 00050 00054 00036 00163Pacific Males 00184 00226 00427 00360 00086 00069 00055 00054 00033 00055 00180Islander Females 00136 00190 00408 00219 00058 00059 00036 00047 00071 00023 00146
Hispanic Both Sexes 00320 00328 00637 00574 00165 00107 00093 00100 00084 00012 00279Males 00361 00342 00710 00648 00205 00131 00110 00063 00072 - 00309Females 00278 00312 00562 00494 00122 00082 00077 00133 00093 00020 00246
Table 1330Acute Lymphocytic Leukemia
Estimated United States Cancer Prevalence Countsa on January 1 2016By RaceEthnicity Sex and Years Since Diagnosis
Estimated prevalence percenta on January 1 2016 of the SEER population diagnosed in the previous 24 yearsBy Age at Prevalence RaceEthnicity and Sex
0
5
10
15
20
25
1975 1985 1995 2005 20160
5
10
15
20
25
1975 1985 1995 2005 20160
3
6
9
12
15
1975 1985 1995 2005 20160
3
6
9
12
15
1975 1985 1995 2005 2016
Delay-Adj IncidenceDelay-Adj Incidence
Observed IncidenceObserved Incidence
MortalityMortality
SEER Observed Incidence SEER Delay Adjusted Incidence and US Death RatesLeukemia by Race and Sex
a
Figure 131
Source SEER 9 areas and US Mortality Files (National Center for Health Statistics CDC)Rates are age-adjusted to the 2000 US Std Population (19 age groups - Census P25-1103)Regression lines and APCs are calculated using the Joinpoint Regression Program Version 47 February 2019 National Cancer InstituteThe APC is the Annual Percent Change for the regression line segments The APC shown on the graph is for the most recent trendThe APC is significantly different from zero (p lt 005)
a
White Male Black Male White Female Black FemaleRate per 100000 Rate per 100000 Rate per 100000 Rate per 100000
Year of DiagnosisDeath Year of DiagnosisDeath Year of DiagnosisDeath Year of DiagnosisDeath
SEER Incidence APCsDelay Adj 1998-16 = 08Observed 1975-16 = 03
US Mortality APC2013-16 = -30
SEER Incidence APCsDelay Adj 1975-16 = 02Observed 1975-16 = 01
US Mortality APC1993-16 = -15
SEER Incidence APCsDelay Adj 1975-16 = 06Observed 1975-16 = 05
US Mortality APC2000-16 = -12
SEER Incidence APCsDelay Adj 1975-16 = 03Observed 1975-16 = 02
US Mortality APC1993-16 = -13
SEE
R C
ancer Statistics Review
1975-2016N
ational Cancer Institute
0
1
2
3
4
5
6
7
8
1975 1985 1995 2005 20160
1
2
3
4
5
6
7
8
1975 1985 1995 2005 20160
1
2
3
4
5
6
7
8
1975 1985 1995 2005 20160
1
2
3
4
5
6
7
8
1975 1985 1995 2005 2016
Chronic
Acute
SEER Observed Incidence RatesLymphocytic and Myeloid Leukemia (Acute and Chronic) by Sex
a
Figure 132
Source SEER 9 areas Rates are age-adjusted to the 2000 US Std Population (19 age groups - Census P25-1103)Regression lines and APCs are calculated using the Joinpoint Regression Program Version 47 February 2019 National Cancer Institute
a
Male Female Male FemaleLymphocytic Leukemia Myeloid Leukemia
Rate per 100000 Rate per 100000 Rate per 100000 Rate per 100000
Year of Diagnosis Year of Diagnosis Year of Diagnosis Year of Diagnosis
SEE
R C
ancer Statistics Review
1975-2016N
ational Cancer Institute
Joinpoint Analyses for Whites and Blacks from 1975-2016and for AsianPacific Islanders American IndiansAlaska Natives and Hispanics from 2000-2016
0
5
10
15
20
1975 1985 1995 2005 20160
5
10
15
20
1975 1985 1995 2005 2016
White
Black
API
AIAN
Hispanic
SEER Incidence and US Death RatesLeukemia Both Sexes
Figure 133
Source Incidence data for whites and blacks are from the SEER 9 areas (San Francisco Connecticut Detroit Hawaii Iowa New Mexico Seattle Utah Atlanta)Incidence data for AsianPacific Islanders American IndiansAlaska Natives and Hispanics are from the SEER 21 areas (SEER 9 areas San Jose-MontereyLos Angeles Alaska Native Registry Rural Georgia California excluding SFSJMLA Kentucky Louisiana New Jersey Georgia excluding ATLRG Idaho New York andMassachusetts)Mortality data are from US Mortality Files National Center for Health Statistics CDCRates are age-adjusted to the 2000 US Std Population (19 age groups - Census P25-1103)Regression lines are calculated using the Joinpoint Regression Program Version 47 February 2019 National Cancer Institute Joinpoint analyses for Whites andBlacks during the 1975-2016 period allow a maximum of 5 joinpoints Analyses for other ethnic groups during the period 2000-2016 allow a maximum of 3 joinpointsAPI = AsianPacific IslanderAIAN = American IndianAlaska Native Rates for American IndianAlaska Native are based on the PurchasedReferred Care Delivery Area (PRCDA) countiesHispanic is not mutually exclusive from whites blacks AsianPacific Islanders and American IndiansAlaska Natives Incidence data for Hispanics are based onNHIA and exclude cases from the Alaska Native Registry
Incidence MortalityRate per 100000 Rate per 100000
Year of Diagnosis Year of Death
a
d
a
b
c
c
b
d
SEE
R C
ancer Statistics Review
1975-2016N
ational Cancer Institute
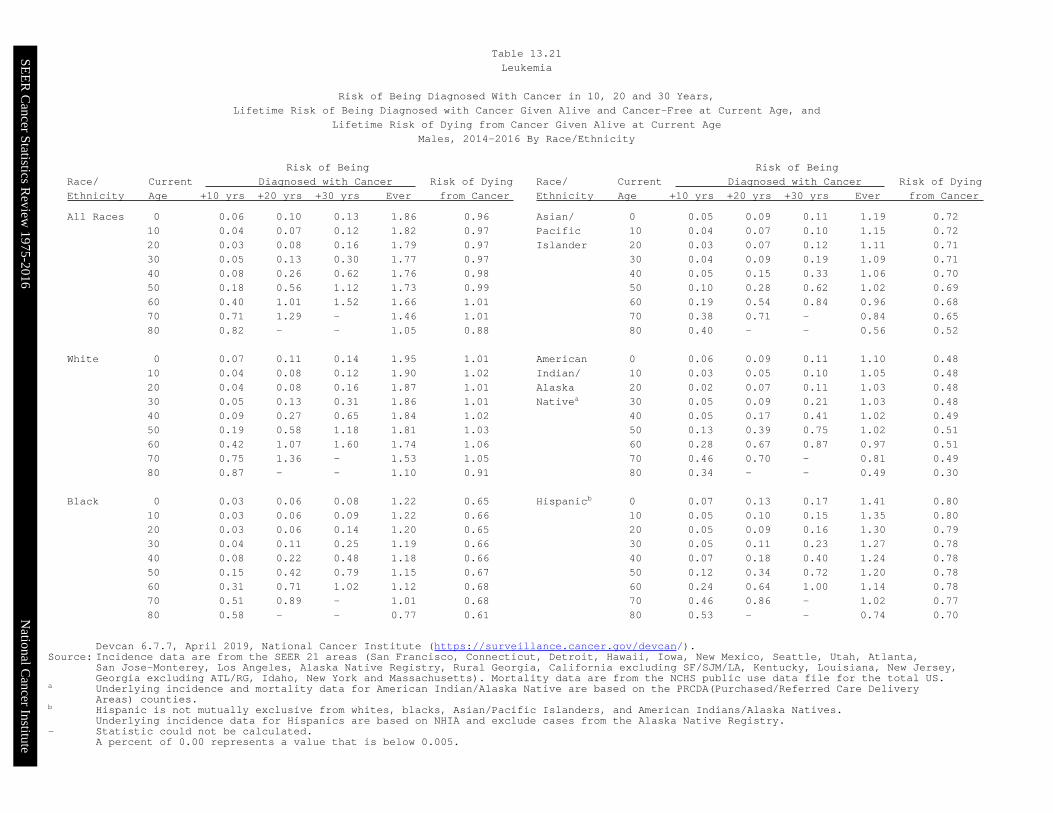
SEE
R C
ancer Statistics Review
1975-2016N
ational Cancer Institute
Devcan 677 April 2019 National Cancer Institute (httpssurveillancecancergovdevcan)Source Incidence data are from the SEER 21 areas (San Francisco Connecticut Detroit Hawaii Iowa New Mexico Seattle Utah Atlanta
San Jose-Monterey Los Angeles Alaska Native Registry Rural Georgia California excluding SFSJMLA Kentucky Louisiana New JerseyGeorgia excluding ATLRG Idaho New York and Massachusetts) Mortality data are from the NCHS public use data file for the total US
a Underlying incidence and mortality data for American IndianAlaska Native are based on the PRCDA(PurchasedReferred Care DeliveryAreas) counties
b Hispanic is not mutually exclusive from whites blacks AsianPacific Islanders and American IndiansAlaska NativesUnderlying incidence data for Hispanics are based on NHIA and exclude cases from the Alaska Native Registry
- Statistic could not be calculatedA percent of 000 represents a value that is below 0005
Risk of Being Risk of Being
Race Current Diagnosed with Cancer Risk of Dying Race Current Diagnosed with Cancer Risk of Dying
Ethnicity Age +10 yrs +20 yrs +30 yrs Ever from Cancer Ethnicity Age +10 yrs +20 yrs +30 yrs Ever from Cancer
All Races 0 006 010 013 186 096 Asian 0 005 009 011 119 072
10 004 007 012 182 097 Pacific 10 004 007 010 115 072
20 003 008 016 179 097 Islander 20 003 007 012 111 071
30 005 013 030 177 097 30 004 009 019 109 071
40 008 026 062 176 098 40 005 015 033 106 070
50 018 056 112 173 099 50 010 028 062 102 069
60 040 101 152 166 101 60 019 054 084 096 068
70 071 129 - 146 101 70 038 071 - 084 065
80 082 - - 105 088 80 040 - - 056 052
White 0 007 011 014 195 101 American 0 006 009 011 110 048
10 004 008 012 190 102 Indian 10 003 005 010 105 048
20 004 008 016 187 101 Alaska 20 002 007 011 103 048
30 005 013 031 186 101 Nativea 30 005 009 021 103 048
40 009 027 065 184 102 40 005 017 041 102 049
50 019 058 118 181 103 50 013 039 075 102 051
60 042 107 160 174 106 60 028 067 087 097 051
70 075 136 - 153 105 70 046 070 - 081 049
80 087 - - 110 091 80 034 - - 049 030
Black 0 003 006 008 122 065 Hispanicb 0 007 013 017 141 080
10 003 006 009 122 066 10 005 010 015 135 080
20 003 006 014 120 065 20 005 009 016 130 079
30 004 011 025 119 066 30 005 011 023 127 078
40 008 022 048 118 066 40 007 018 040 124 078
50 015 042 079 115 067 50 012 034 072 120 078
60 031 071 102 112 068 60 024 064 100 114 078
70 051 089 - 101 068 70 046 086 - 102 077
80 058 - - 077 061 80 053 - - 074 070
Table 1321
Leukemia
Risk of Being Diagnosed With Cancer in 10 20 and 30 Years
Lifetime Risk of Being Diagnosed with Cancer Given Alive and Cancer-Free at Current Age and
Lifetime Risk of Dying from Cancer Given Alive at Current Age
Males 2014-2016 By RaceEthnicity
SEE
R C
ancer Statistics Review
1975-2016N
ational Cancer Institute
Devcan 677 April 2019 National Cancer Institute (httpssurveillancecancergovdevcan)Source Incidence data are from the SEER 21 areas (San Francisco Connecticut Detroit Hawaii Iowa New Mexico Seattle Utah Atlanta
San Jose-Monterey Los Angeles Alaska Native Registry Rural Georgia California excluding SFSJMLA Kentucky Louisiana New JerseyGeorgia excluding ATLRG Idaho New York and Massachusetts) Mortality data are from the NCHS public use data file for the total US
a Underlying incidence and mortality data for American IndianAlaska Native are based on the PRCDA(PurchasedReferred Care DeliveryAreas) counties
b Hispanic is not mutually exclusive from whites blacks AsianPacific Islanders and American IndiansAlaska NativesUnderlying incidence data for Hispanics are based on NHIA and exclude cases from the Alaska Native Registry
- Statistic could not be calculatedA percent of 000 represents a value that is below 0005
Risk of Being Risk of Being
Race Current Diagnosed with Cancer Risk of Dying Race Current Diagnosed with Cancer Risk of Dying
Ethnicity Age +10 yrs +20 yrs +30 yrs Ever from Cancer Ethnicity Age +10 yrs +20 yrs +30 yrs Ever from Cancer
All Races 0 006 008 011 129 068 Asian 0 005 008 010 083 048
10 003 005 009 125 069 Pacific 10 003 005 008 078 047
20 003 006 012 122 068 Islander 20 002 005 009 075 047
30 003 009 021 120 068 30 003 006 013 073 046
40 006 018 039 118 068 40 004 010 021 071 046
50 012 034 068 114 067 50 007 017 035 068 045
60 023 059 093 106 067 60 011 029 051 063 044
70 039 077 - 091 064 70 019 042 - 054 040
80 048 - - 066 055 80 026 - - 040 033
White 0 006 009 011 135 071 American 0 003 005 007 061 031
10 003 005 009 131 071 Indian 10 002 003 007 058 031
20 003 006 012 128 071 Alaska 20 002 005 008 056 031
30 003 010 022 126 071 Nativea 30 004 007 017 055 031
40 006 019 042 124 070 40 003 014 020 053 031
50 013 036 072 120 070 50 011 017 030 051 031
60 024 062 099 112 069 60 007 021 038 042 030
70 042 081 - 096 067 70 015 035 - 039 029
80 051 - - 069 057 80 025 - - 030 022
Black 0 004 006 008 095 053 Hispanicb 0 006 010 013 110 056
10 002 004 008 093 054 10 004 007 010 105 056
20 002 006 012 091 053 20 003 006 012 101 055
30 004 010 020 089 053 30 003 009 019 099 054
40 006 016 035 087 053 40 006 016 034 096 054
50 011 029 054 083 052 50 010 028 055 091 052
60 020 047 069 077 051 60 019 046 073 084 050
70 030 055 - 065 049 70 030 059 - 070 046
80 033 - - 046 042 80 035 - - 048 037
Table 1322
Leukemia
Risk of Being Diagnosed With Cancer in 10 20 and 30 Years
Lifetime Risk of Being Diagnosed with Cancer Given Alive and Cancer-Free at Current Age and
Lifetime Risk of Dying from Cancer Given Alive at Current Age
Females 2014-2016 By RaceEthnicity
SEER Cancer Statistics Review 1975-2016 National Cancer Institute
The AAPC is the Average Annual Percent Change over the time interval The AAPCs are calculated bythe Joinpoint Regression Program Version 47 February 2019 National Cancer Institute
- Statistic not shown Rate based on less than 16 cases for the time intervalTrend based on less than 10 cases for at least one year within the time interval
a Rates are age-adjusted to the 2000 US Std Population (19 age groups - Census P25-1130) Trendsare based on rates age-adjusted to the 2000 US Std Population (19 age groups - Census P25-1130)
b The SEER 9 areas are San Francisco Connecticut Detroit Hawaii Iowa New Mexico SeattleUtah and AtlantaThe SEER 21 areas comprise the SEER 9 areas plus San Jose-Monterey Los Angeles the AlaskaNative Registry Rural Georgia California excluding SFSJMLA Kentucky Louisiana New JerseyGeorgia excluding ATLRG Idaho New York and Massachusetts
c The 2007-2016 AAPC estimates are based on a Joinpoint analysis with up to 3 Joinpoints overdiagnosis years 2000-2016
d The 2007-2016 AAPC estimates are based on a Joinpoint analysis with up to 5 Joinpoints overdiagnosis years 1975-2016
e Hispanic and Non-Hispanic are not mutually exclusive from whites blacks AsianPacificIslanders and American IndiansAlaska Natives Incidence data for Hispanics and Non-Hispanicsare based on NHIA and exclude cases from the Alaska Native Registry
f Incidence data for American IndianAlaska Native are based on the PurchasedReferred CareDelivery Area (PRCDA) counties
g US Mortality Files National Center for Health Statistics CDCh The 2007-2016 mortality AAPCs are based on a Joinpoint analysis using years of death 2000-2016 The APC is significantly different from zero (plt05)
SEER Incidence SEER 21 Areasb SEER 21 Areasb SEER 9 Areasb
Rate 2012-2016 Trend 2007-2016c Trend 2007-2016d
Rate per 100000 persons AAPC () AAPC ()
Total Males Females Total Males Females Total Males Females RaceEthnicity
All Races 141 181 109 -04 -02 -06 -03 02 03
White 149 191 115 -05 -05 -07 04 03 05White Hispanice 112 134 94 01 -02 03 - - -White Non-Hispanice 153 197 116 -05 -05 -08 - - -
Black 109 139 89 06 02 07 01 01 02
AsianPacific Islander 78 97 63 01 00 02 - - -
Amer IndAlaska Natf 86 110 66 08 21 -01 - - -
Hispanice 108 130 91 02 00 03 - - -
US Mortalityg Rate 2012-2016 Trend 2007-2016h
Rate per 100000 persons AAPC ()
Total Males Females Total Males FemalesRaceEthnicity
All Races 65 88 49 -16 -17 -13
White 68 91 51 -14 -16 -12White Hispanice 50 63 41 -07 -08 -06White Non-Hispanice 69 93 51 -14 -15 -12
Black 55 72 44 -15 -17 -15
AsianPacific Islander 36 47 28 -18 -07 -23
Amer IndAlaska NatTotal US 31 42 23 -22 -09 -36PRCDA Counties 41 54 30 -16 -05 -28Non-PRCDA Counties 20 28 15 -31 -13 -50
Hispanice 47 60 38 -08 -09 -07
Table 1323Leukemia
SEER Incidence and US MortalityAge-Adjusted Rates and Trendsa
By RaceEthnicity and Sex
SEE
R C
ancer Statistics Review
1975-2016N
ational Cancer Institute
a Rates are per 100000 and are age-adjusted to the 2000 US Std Population (19 age groups - Census P25-1130)b The SEER 9 areas are San Francisco Connecticut Detroit Hawaii Iowa New Mexico Seattle Utah and Atlanta
The SEER 13 areas comprise the SEER 9 areas plus San Jose-Monterey Los Angeles the Alaska Native Registry and Rural GeorgiaThe SEER 18 areas comprise the SEER 13 areas plus California excluding SFSJMLA Kentucky Louisiana New Jersey and Georgiaexcluding ATLRGThe SEER 21 areas comprise the SEER 18 areas plus Idaho New York and Massachusetts
- Statistic not shown Rate based on less than 16 cases for the time interval
All Races Whites Blacks Total Males Females Total Males Females Total Males Females
SEER Incidence Ratesa 2012-2016
California 1239 1590 949 1337 1715 1020 1039 1334 813Greater Bay Area 1231 1619 915 1400 1844 1028 1098 1406 859San Francisco-Oakland 1212 1596 906 1389 1823 1034 1077 1336 881San Jose-Monterey 1259 1651 925 1410 1869 1011 1239 1787 -
Los Angeles 1173 1469 933 1291 1622 1016 1050 1294 884Greater California 1271 1633 968 1334 1709 1017 1007 1338 729
Connecticut 1406 1768 1117 1431 1790 1142 976 1126 867Detroit 1584 2050 1230 1707 2222 1300 1204 1485 1018Georgia 1430 1841 1120 1537 1970 1189 1139 1487 935Atlanta 1382 1819 1064 1563 2017 1207 1138 1557 884Rural Georgia 1411 1586 1206 1510 1773 1196 1248 - 1236Greater Georgia 1455 1863 1144 1531 1965 1182 1140 1450 968
Hawaii 1073 1339 843 1388 1612 1139 - - -Idaho 1588 1950 1263 1604 1973 1272 - - -Iowa 1627 2127 1222 1630 2133 1221 1416 1743 1076Kentucky 1566 1983 1234 1577 1995 1241 1159 1446 922Louisiana 1405 1789 1104 1518 1918 1197 1103 1393 890Massachusetts 1108 1429 854 1118 1448 856 787 1050 620New Jersey 1524 1962 1188 1541 1982 1199 1136 1469 928New Mexico 1299 1550 1086 1310 1556 1101 1045 - -New York 1623 2119 1244 1752 2281 1335 1068 1360 887Seattle-Puget Sound 1568 2020 1188 1634 2084 1249 1486 1929 1077Utah 1375 1793 1009 1401 1825 1029 - - -
SEER 9 Areasb 1419 1823 1094 1521 1945 1171 1154 1460 941SEER 13 Areasb 1357 1737 1049 1473 1882 1134 1126 1419 922SEER 18 Areasb 1376 1761 1066 1461 1867 1127 1114 1414 907SEER 21 Areasb 1407 1807 1088 1491 1912 1147 1089 1386 889
Table 1324Leukemia
Age-Adjusted SEER Incidence Ratesa
By Registry Race and Sex
SEE
R C
ancer Statistics Review
1975-2016N
ational Cancer Institute
a US Mortality Files National Center for Health Statistics Centers for Disease Control and PreventionRates are per 100000 and are age-adjusted to the 2000 US Std Population (19 age groups - Census P25-1130)
b The SEER 9 areas are San Francisco Connecticut Detroit Hawaii Iowa New Mexico Seattle Utah and AtlantaThe SEER 13 areas comprise the SEER 9 areas plus San Jose-Monterey Los Angeles the Alaska Native Registry and Rural GeorgiaThe SEER 18 areas comprise the SEER 13 areas plus California excluding SFSJMLA Kentucky Louisiana New Jersey and Georgiaexcluding ATLRGThe SEER 21 areas comprise the SEER 18 areas plus Idaho New York and Massachusetts
- Statistic not shown Rate based on less than 16 cases for the time interval
All Races Whites Blacks Total Males Females Total Males Females Total Males Females
SEER Death Ratesa 2012-2016
California 617 811 470 671 885 507 560 711 461Greater Bay Area 563 759 419 640 869 470 551 742 424San Francisco-Oakland 551 753 405 631 871 455 544 726 421San Jose-Monterey 584 768 446 653 863 495 604 - -
Los Angeles 608 797 468 675 894 513 571 717 483Greater California 639 835 489 677 886 515 553 687 458
Connecticut 622 837 465 639 862 474 536 665 449Detroit 662 915 485 691 967 494 573 723 475Georgia 614 817 467 642 855 478 538 706 438Atlanta 568 757 437 615 802 483 487 658 374Rural Georgia 581 628 538 579 635 - - - -Greater Georgia 639 851 482 654 879 477 576 745 483
Hawaii 463 593 362 543 632 440 - - -Idaho 655 846 497 661 865 492 - - -Iowa 693 961 498 700 963 508 - - -Kentucky 742 949 592 750 953 603 633 894 455Louisiana 677 906 514 705 953 520 603 776 498Massachusetts 622 830 478 647 869 490 463 524 444New Jersey 615 810 478 657 871 504 474 549 429New Mexico 560 759 400 589 794 421 - - -New York 621 842 466 675 910 506 450 602 356Seattle-Puget Sound 618 795 481 637 807 503 708 975 499Utah 679 865 526 693 876 542 - - -
SEER 9 Areasb 610 818 457 651 869 487 540 711 427SEER 13 Areasb 609 810 460 658 874 494 544 708 437SEER 18 Areasb 630 832 480 671 887 508 552 705 455SEER 21 Areasb 628 834 477 670 889 506 520 670 426
Total US 654 876 489 681 912 506 550 721 439
Table 1325Leukemia
Age-Adjusted SEER Death Ratesa
By Registry Race and Sex
SEER Cancer Statistics Review 1975-2016 National Cancer Institute
a US Mortality Files National Center for Health Statistics Centers for Disease Control andPrevention Rates are per 100000 and are age-adjusted to the 2000 US Std Population (19age groups - Census P25-1130)
b Difference between state rate and total US rate is statistically significant (plt=0002)c Absolute percent difference between state rate and total US rate is 15 or mored Rank of state level death rate and the 95 confidence intervals (low high) for the rankSE Standard error of the ratePD Percent difference between state rate and total US rate- Statistic not shown Rate based on less than 16 cases for the time interval
State Rate SE Rank(CI)d PD TOTAL US 654 002
High Five StatesOklahoma 790 019 01(0108) 2083c
West Virginia 749 025 02(0123) 1449South Dakota 747 040 03(0133) 1415Kentucky 742 018 04(0116) 1352Kansas 742 022 05(0122) 1350
Low Five StatesColorado 609 016 47(2649) -692Alaska 596 050 48(0451) -885New Mexico 560 022 49(3650) -1430DC 504 041 50(3251) -2293c
Hawaii 463 024 51(4951) -2913c
State Rate SE Rank(CI)d PD State Rate SE Rank(CI)d PD
Alabama 689 016 17(0532) 533 Montana 613 032 45(0950) -634Alaska 596 050 48(0451) -885 Nebraska 718 026 10(0131) 983Arizona 632 013 36(2248) -329 Nevada 644 021 28(1148) -157Arkansas 719 021 09(0127) 993 New Hampshire 638 029 31(0749) -238California 617 006 42(3248) -572 New Jersey 615 011 43(2849) -592Colorado 609 016 47(2649) -692 New Mexico 560 022 49(3650) -1430Connecticut 622 017 40(2249) -490 New York 621 007 41(2948) -499Delaware 664 035 24(0249) 152 North Carolina 634 011 34(2347) -310DC 504 041 50(3251) -2293c North Dakota 656 040 26(0249) 029Florida 630 007 38(2645) -370 Ohio 694 010 13(0626) 608Georgia 614 012 44(2849) -604 Oklahoma 790 019 01(0108) 2083c
Hawaii 463 024 51(4951) -2913c Oregon 632 017 37(1948) -331Idaho 655 028 27(0548) 012 Pennsylvania 680 009 21(1029) 396Illinois 684 010 19(0928) 463 Rhode Island 656 033 25(0349) 037Indiana 719 014 08(0222) 994 South Carolina 682 016 20(0634) 435Iowa 693 019 14(0334) 604 South Dakota 747 040 03(0133) 1415Kansas 742 022 05(0122) 1350 Tennessee 702 014 12(0327) 729Kentucky 742 018 04(0116) 1352 Texas 640 007 30(2342) -215Louisiana 677 017 23(0637) 356 Utah 679 024 22(0346) 387Maine 638 027 32(0949) -240 Vermont 636 041 33(0350) -277Maryland 633 014 35(2148) -323 Virginia 611 012 46(2849) -661Massachusetts 622 013 39(2548) -482 Washington 640 013 29(2047) -209Michigan 685 011 18(0829) 476 West Virginia 749 025 02(0123) 1449Minnesota 691 015 16(0430) 564 Wisconsin 727 015 06(0219) 1110Mississippi 692 021 15(0337) 580 Wyoming 721 049 07(0148) 1028Missouri 711 014 11(0324) 874
Table 1326Leukemia
Age-Adjusted Cancer Deatha Rates By State All Races 2012-2016
Males and Females
SEER Cancer Statistics Review 1975-2016 National Cancer Institute
a US Mortality Files National Center for Health Statistics Centers for Disease Control andPrevention Rates are per 100000 and are age-adjusted to the 2000 US Std Population (19age groups - Census P25-1130)
b Difference between state rate and total US rate is statistically significant (plt=0002)c Absolute percent difference between state rate and total US rate is 15 or mored Rank of state level death rate and the 95 confidence intervals (low high) for the rankSE Standard error of the ratePD Percent difference between state rate and total US rate- Statistic not shown Rate based on less than 16 cases for the time interval
State Rate SE Rank(CI)d PD TOTAL US 876 003
High Five StatesOklahoma 1022 034 01(0120) 1669c
Kansas 1018 039 02(0123) 1625c
Arkansas 991 037 03(0127) 1309South Dakota 985 068 04(0147) 1249Delaware 984 065 05(0144) 1236
Low Five StatesMontana 795 053 47(1150) -921New Mexico 759 039 48(2650) -1336Alaska 711 081 49(0851) -1887c
DC 704 078 50(1051) -1959c
Hawaii 593 040 51(4951) -3228c
State Rate SE Rank(CI)d PD State Rate SE Rank(CI)d PD
Alabama 939 029 17(0233) 725 Montana 795 053 47(1150) -921Alaska 711 081 49(0851) -1887c Nebraska 958 046 12(0141) 935Arizona 827 022 41(2449) -555 Nevada 858 037 33(0849) -210Arkansas 991 037 03(0127) 1309 New Hampshire 884 051 25(0149) 088California 811 010 43(3348) -738 New Jersey 810 020 44(2749) -747Colorado 834 028 39(2049) -484 New Mexico 759 039 48(2650) -1336Connecticut 837 031 37(1549) -441 New York 842 013 35(2546) -387Delaware 984 065 05(0144) 1236 North Carolina 863 020 31(1945) -149DC 704 078 50(1051) -1959c North Dakota 873 070 27(0150) -030Florida 839 012 36(2645) -422 Ohio 931 018 19(0529) 627Georgia 817 021 42(2649) -677 Oklahoma 1022 034 01(0120) 1669c
Hawaii 593 040 51(4951) -3228c Oregon 866 029 29(1147) -112Idaho 846 047 34(0550) -339 Pennsylvania 912 016 21(0931) 416Illinois 928 018 20(0529) 594 Rhode Island 911 059 22(0149) 400Indiana 960 025 11(0127) 959 South Carolina 951 029 13(0131) 853Iowa 961 035 08(0131) 969 South Dakota 985 068 04(0147) 1249Kansas 1018 039 02(0123) 1625c Tennessee 960 025 10(0127) 959Kentucky 949 031 15(0133) 832 Texas 870 013 28(2139) -069Louisiana 906 030 23(0442) 342 Utah 865 041 30(0549) -122Maine 803 046 46(1450) -836 Vermont 874 074 26(0150) -026Maryland 861 026 32(1447) -176 Virginia 809 021 45(2650) -770Massachusetts 830 023 40(2349) -529 Washington 835 023 38(2248) -463Michigan 937 020 18(0428) 702 West Virginia 972 044 06(0135) 1095Minnesota 948 027 16(0229) 826 Wisconsin 960 026 09(0127) 961Mississippi 970 039 07(0132) 1077 Wyoming 885 081 24(0150) 102Missouri 951 025 14(0228) 852
Table 1327Leukemia
Age-Adjusted Cancer Deatha Rates By State All Races 2012-2016
Males
SEER Cancer Statistics Review 1975-2016 National Cancer Institute
a US Mortality Files National Center for Health Statistics Centers for Disease Control andPrevention Rates are per 100000 and are age-adjusted to the 2000 US Std Population (19age groups - Census P25-1130)
b Difference between state rate and total US rate is statistically significant (plt=0002)c Absolute percent difference between state rate and total US rate is 15 or mored Rank of state level death rate and the 95 confidence intervals (low high) for the rankSE Standard error of the ratePD Percent difference between state rate and total US rate- Statistic not shown Rate based on less than 16 cases for the time interval
State Rate SE Rank(CI)d PD TOTAL US 489 002
High Five StatesOklahoma 615 023 01(0108) 2584c
Wyoming 596 060 02(0147) 2194c
Kentucky 592 021 03(0111) 2126c
West Virginia 576 030 04(0126) 1792c
South Dakota 564 047 05(0145) 1551c
Low Five StatesColorado 441 018 47(2250) -972Delaware 428 037 48(0751) -1247New Mexico 400 025 49(3151) -1803c
DC 381 046 50(1251) -2203c
Hawaii 362 029 51(4151) -2598c
State Rate SE Rank(CI)d PD State Rate SE Rank(CI)d PD
Alabama 512 019 18(0440) 483 Montana 452 037 43(0551) -745Alaska 485 062 27(0151) -073 Nebraska 531 030 10(0144) 864Arizona 473 015 31(1347) -308 Nevada 455 025 42(1150) -695Arkansas 516 024 15(0344) 554 New Hampshire 449 033 45(0651) -807California 470 007 34(2345) -383 New Jersey 478 013 30(1346) -223Colorado 441 018 47(2250) -972 New Mexico 400 025 49(3151) -1803c
Connecticut 465 020 40(1249) -487 New York 466 009 38(2246) -456Delaware 428 037 48(0751) -1247 North Carolina 471 012 32(1747) -350DC 381 046 50(1251) -2203c North Dakota 479 046 28(0151) -189Florida 460 008 41(2647) -582 Ohio 520 012 12(0529) 653Georgia 467 013 37(1747) -433 Oklahoma 615 023 01(0108) 2584c
Hawaii 362 029 51(4151) -2598c Oregon 449 019 44(1850) -799Idaho 497 033 22(0249) 174 Pennsylvania 516 011 14(0629) 556Illinois 514 011 16(0631) 526 Rhode Island 471 037 33(0351) -363Indiana 540 017 07(0226) 1052 South Carolina 495 018 23(0645) 133Iowa 498 022 20(0547) 200 South Dakota 564 047 05(0145) 1551c
Kansas 539 025 08(0137) 1032 Tennessee 517 016 13(0435) 590Kentucky 592 021 03(0111) 2126c Texas 467 008 36(2246) -431Louisiana 514 020 17(0442) 520 Utah 526 029 11(0146) 778Maine 508 032 19(0248) 403 Vermont 444 045 46(0351) -906Maryland 470 016 35(1448) -389 Virginia 465 014 39(1848) -474Massachusetts 478 015 29(1247) -220 Washington 487 016 25(0946) -022Michigan 498 013 21(0939) 192 West Virginia 576 030 04(0126) 1792c
Minnesota 494 017 24(0745) 121 Wisconsin 545 017 06(0225) 1162Mississippi 485 023 26(0548) -067 Wyoming 596 060 02(0147) 2194c
Missouri 535 017 09(0327) 953
Table 1328Leukemia
Age-Adjusted Cancer Deatha Rates By State All Races 2012-2016
Females
SEE
R C
ancer Statistics Review
1975-2016N
ational Cancer Institute
a US 2016 cancer prevalence counts are based on 2016 cancer prevalence proportions from the SEER 13 Areas (excluding the AlaskaNative Registry) and 112016 US population estimates based on the average of 2015 and 2016 population estimates from theUS Bureau of the CensusPrevalence was calculated using the first invasive tumor for each cancer site diagnosed during the previous 24 years
b Maximum limited-duration prevalence is 24 years for 1992-2016 datac Percentages are age-adjusted to the 2000 US Standard Population (19 age groups - Census P25-1130) by 5-year age groupsd Cases diagnosed more than 24 years ago were estimated using the completeness index method (Capocaccia et al 1997
Merrill et al 2000)e Complete prevalence is obtained by summing 0 to lt24 and gt=24- Statistic not shown Statistic based on fewer than 5 cases estimated alive in SEER for the time interval+ Not available
Years Since Diagnosis 0 to lt5 5 to lt10 10 to lt15 15 to lt20 20 to lt24 0 to lt24b gt=24d Completee
Race Sex All Races Both Sexes 153253 100309 63581 38012 21353 376508 38265 414773
Males 90192 57683 36029 21220 12020 217145 18411 235556Females 63061 42625 27552 16792 9333 159363 19854 179217
White Both Sexes 132173 87961 56051 33596 19035 328814 32999 370135Males 78368 50894 32033 18770 10845 190910 15102 210930Females 53805 37067 24018 14826 8190 137905 17897 159205
Black Both Sexes 12734 6564 4233 2487 1259 27277 4070 31347Males 6847 3556 2204 1334 637 14578 1776 16354Females 5887 3008 2029 1153 622 12699 2294 14992
Asian Both Sexes 3926 2561 1778 1164 690 10120 + +Pacific Males 2235 1462 936 646 351 5630 + +Islander Females 1691 1100 842 519 339 4490 + +
Hispanic Both Sexes 14464 9581 6796 4462 2630 37933 + +Males 8166 5374 3794 2408 1538 21280 + +Females 6298 4207 3002 2055 1092 16654 + +
Age Specific (Crude) Age-Adjustedc Age at Prevalence All Ages 0-9 10-19 20-29 30-39 40-49 50-59 60-69 70-79 80+ All Ages
Race Sex All Races Both Sexes 01168 00328 00640 00628 00377 00561 01053 02263 04023 05111 01054
Males 01369 00339 00706 00685 00419 00657 01287 02888 05282 07048 01306Females 00974 00317 00572 00570 00333 00466 00829 01696 02974 03919 00844
White Both Sexes 01304 00369 00715 00712 00410 00584 01106 02389 04249 05386 01127Males 01528 00379 00789 00771 00457 00682 01349 03042 05558 07387 01389Females 01084 00359 00637 00650 00362 00484 00869 01784 03135 04133 00904
Black Both Sexes 00605 00145 00322 00320 00267 00463 00752 01455 02470 03076 00660Males 00674 00142 00357 00338 00281 00530 00919 01737 03249 04580 00816Females 00541 00148 00286 00301 00255 00402 00605 01230 01927 02334 00552
Asian Both Sexes 00497 00264 00531 00426 00230 00390 00553 00882 01245 01389 00513Pacific Males 00577 00298 00555 00507 00249 00461 00665 01122 01552 01904 00613Islander Females 00423 00228 00507 00345 00212 00327 00456 00688 00999 01057 00430
Hispanic Both Sexes 00664 00375 00737 00728 00395 00485 00723 01191 01987 02074 00746Males 00737 00397 00827 00807 00471 00576 00831 01350 02221 02551 00854Females 00589 00352 00642 00641 00312 00391 00617 01050 01809 01780 00647
Table 1329Leukemia
Estimated United States Cancer Prevalence Countsa on January 1 2016By RaceEthnicity Sex and Years Since Diagnosis
Estimated prevalence percenta on January 1 2016 of the SEER population diagnosed in the previous 24 yearsBy Age at Prevalence RaceEthnicity and Sex
SEE
R C
ancer Statistics Review
1975-2016N
ational Cancer Institute
a US 2016 cancer prevalence counts are based on 2016 cancer prevalence proportions from the SEER 13 Areas (excluding the AlaskaNative Registry) and 112016 US population estimates based on the average of 2015 and 2016 population estimates from theUS Bureau of the CensusPrevalence was calculated using the first invasive tumor for each cancer site diagnosed during the previous 24 years
b Maximum limited-duration prevalence is 24 years for 1992-2016 datac Percentages are age-adjusted to the 2000 US Standard Population (19 age groups - Census P25-1130) by 5-year age groupsd Cases diagnosed more than 24 years ago were estimated using the completeness index method (Capocaccia et al 1997
Merrill et al 2000)e Complete prevalence is obtained by summing 0 to lt24 and gt=24- Statistic not shown Statistic based on fewer than 5 cases estimated alive in SEER for the time interval+ Not available
Years Since Diagnosis 0 to lt5 5 to lt10 10 to lt15 15 to lt20 20 to lt24 0 to lt24b gt=24d Completee
Race Sex All Races Both Sexes 20277 16033 13721 12074 8203 70308 25456 95764
Males 11203 9049 7751 6542 4634 39179 12997 52176Females 9074 6984 5971 5531 3568 31129 12460 43589
White Both Sexes 17123 13855 11870 10663 7154 60665 21823 83282Males 9549 7741 6768 5696 4084 33839 11286 45559Females 7573 6114 5102 4967 3070 26826 10537 37723
Black Both Sexes 1590 1133 923 727 553 4926 1609 6535Males 809 734 473 411 290 2716 592 3308Females 781 399 450 317 263 2210 1017 3227
Asian Both Sexes 998 720 669 486 361 3234 + +Pacific Males 527 406 369 313 178 1793 + +Islander Females 472 314 300 173 183 1441 + +
Hispanic Both Sexes 5905 4543 3352 2717 1749 18266 + +Males 3302 2686 1899 1465 1058 10409 + +Females 2603 1857 1454 1252 692 7857 + +
Age Specific (Crude) Age-Adjustedc Age at Prevalence All Ages 0-9 10-19 20-29 30-39 40-49 50-59 60-69 70-79 80+ All Ages
Race Sex All Races Both Sexes 00218 00276 00541 00467 00139 00078 00059 00065 00053 00033 00228
Males 00247 00286 00591 00520 00163 00095 00066 00069 00056 00035 00251Females 00190 00266 00488 00410 00115 00062 00053 00062 00050 00032 00204
White Both Sexes 00241 00315 00612 00542 00161 00086 00063 00070 00056 00033 00259Males 00271 00323 00670 00598 00186 00107 00069 00074 00060 00032 00284Females 00211 00306 00551 00482 00135 00064 00057 00066 00053 00033 00232
Black Both Sexes 00109 00107 00250 00197 00067 00042 00039 00029 00012 00027 00102Males 00126 00112 00281 00224 00079 00035 00052 00026 00012 00027 00112Females 00094 00102 00219 00171 00056 00047 00028 00032 00013 00027 00092
Asian Both Sexes 00159 00208 00418 00289 00071 00064 00045 00050 00054 00036 00163Pacific Males 00184 00226 00427 00360 00086 00069 00055 00054 00033 00055 00180Islander Females 00136 00190 00408 00219 00058 00059 00036 00047 00071 00023 00146
Hispanic Both Sexes 00320 00328 00637 00574 00165 00107 00093 00100 00084 00012 00279Males 00361 00342 00710 00648 00205 00131 00110 00063 00072 - 00309Females 00278 00312 00562 00494 00122 00082 00077 00133 00093 00020 00246
Table 1330Acute Lymphocytic Leukemia
Estimated United States Cancer Prevalence Countsa on January 1 2016By RaceEthnicity Sex and Years Since Diagnosis
Estimated prevalence percenta on January 1 2016 of the SEER population diagnosed in the previous 24 yearsBy Age at Prevalence RaceEthnicity and Sex
0
5
10
15
20
25
1975 1985 1995 2005 20160
5
10
15
20
25
1975 1985 1995 2005 20160
3
6
9
12
15
1975 1985 1995 2005 20160
3
6
9
12
15
1975 1985 1995 2005 2016
Delay-Adj IncidenceDelay-Adj Incidence
Observed IncidenceObserved Incidence
MortalityMortality
SEER Observed Incidence SEER Delay Adjusted Incidence and US Death RatesLeukemia by Race and Sex
a
Figure 131
Source SEER 9 areas and US Mortality Files (National Center for Health Statistics CDC)Rates are age-adjusted to the 2000 US Std Population (19 age groups - Census P25-1103)Regression lines and APCs are calculated using the Joinpoint Regression Program Version 47 February 2019 National Cancer InstituteThe APC is the Annual Percent Change for the regression line segments The APC shown on the graph is for the most recent trendThe APC is significantly different from zero (p lt 005)
a
White Male Black Male White Female Black FemaleRate per 100000 Rate per 100000 Rate per 100000 Rate per 100000
Year of DiagnosisDeath Year of DiagnosisDeath Year of DiagnosisDeath Year of DiagnosisDeath
SEER Incidence APCsDelay Adj 1998-16 = 08Observed 1975-16 = 03
US Mortality APC2013-16 = -30
SEER Incidence APCsDelay Adj 1975-16 = 02Observed 1975-16 = 01
US Mortality APC1993-16 = -15
SEER Incidence APCsDelay Adj 1975-16 = 06Observed 1975-16 = 05
US Mortality APC2000-16 = -12
SEER Incidence APCsDelay Adj 1975-16 = 03Observed 1975-16 = 02
US Mortality APC1993-16 = -13
SEE
R C
ancer Statistics Review
1975-2016N
ational Cancer Institute
0
1
2
3
4
5
6
7
8
1975 1985 1995 2005 20160
1
2
3
4
5
6
7
8
1975 1985 1995 2005 20160
1
2
3
4
5
6
7
8
1975 1985 1995 2005 20160
1
2
3
4
5
6
7
8
1975 1985 1995 2005 2016
Chronic
Acute
SEER Observed Incidence RatesLymphocytic and Myeloid Leukemia (Acute and Chronic) by Sex
a
Figure 132
Source SEER 9 areas Rates are age-adjusted to the 2000 US Std Population (19 age groups - Census P25-1103)Regression lines and APCs are calculated using the Joinpoint Regression Program Version 47 February 2019 National Cancer Institute
a
Male Female Male FemaleLymphocytic Leukemia Myeloid Leukemia
Rate per 100000 Rate per 100000 Rate per 100000 Rate per 100000
Year of Diagnosis Year of Diagnosis Year of Diagnosis Year of Diagnosis
SEE
R C
ancer Statistics Review
1975-2016N
ational Cancer Institute
Joinpoint Analyses for Whites and Blacks from 1975-2016and for AsianPacific Islanders American IndiansAlaska Natives and Hispanics from 2000-2016
0
5
10
15
20
1975 1985 1995 2005 20160
5
10
15
20
1975 1985 1995 2005 2016
White
Black
API
AIAN
Hispanic
SEER Incidence and US Death RatesLeukemia Both Sexes
Figure 133
Source Incidence data for whites and blacks are from the SEER 9 areas (San Francisco Connecticut Detroit Hawaii Iowa New Mexico Seattle Utah Atlanta)Incidence data for AsianPacific Islanders American IndiansAlaska Natives and Hispanics are from the SEER 21 areas (SEER 9 areas San Jose-MontereyLos Angeles Alaska Native Registry Rural Georgia California excluding SFSJMLA Kentucky Louisiana New Jersey Georgia excluding ATLRG Idaho New York andMassachusetts)Mortality data are from US Mortality Files National Center for Health Statistics CDCRates are age-adjusted to the 2000 US Std Population (19 age groups - Census P25-1103)Regression lines are calculated using the Joinpoint Regression Program Version 47 February 2019 National Cancer Institute Joinpoint analyses for Whites andBlacks during the 1975-2016 period allow a maximum of 5 joinpoints Analyses for other ethnic groups during the period 2000-2016 allow a maximum of 3 joinpointsAPI = AsianPacific IslanderAIAN = American IndianAlaska Native Rates for American IndianAlaska Native are based on the PurchasedReferred Care Delivery Area (PRCDA) countiesHispanic is not mutually exclusive from whites blacks AsianPacific Islanders and American IndiansAlaska Natives Incidence data for Hispanics are based onNHIA and exclude cases from the Alaska Native Registry
Incidence MortalityRate per 100000 Rate per 100000
Year of Diagnosis Year of Death
a
d
a
b
c
c
b
d
SEE
R C
ancer Statistics Review
1975-2016N
ational Cancer Institute
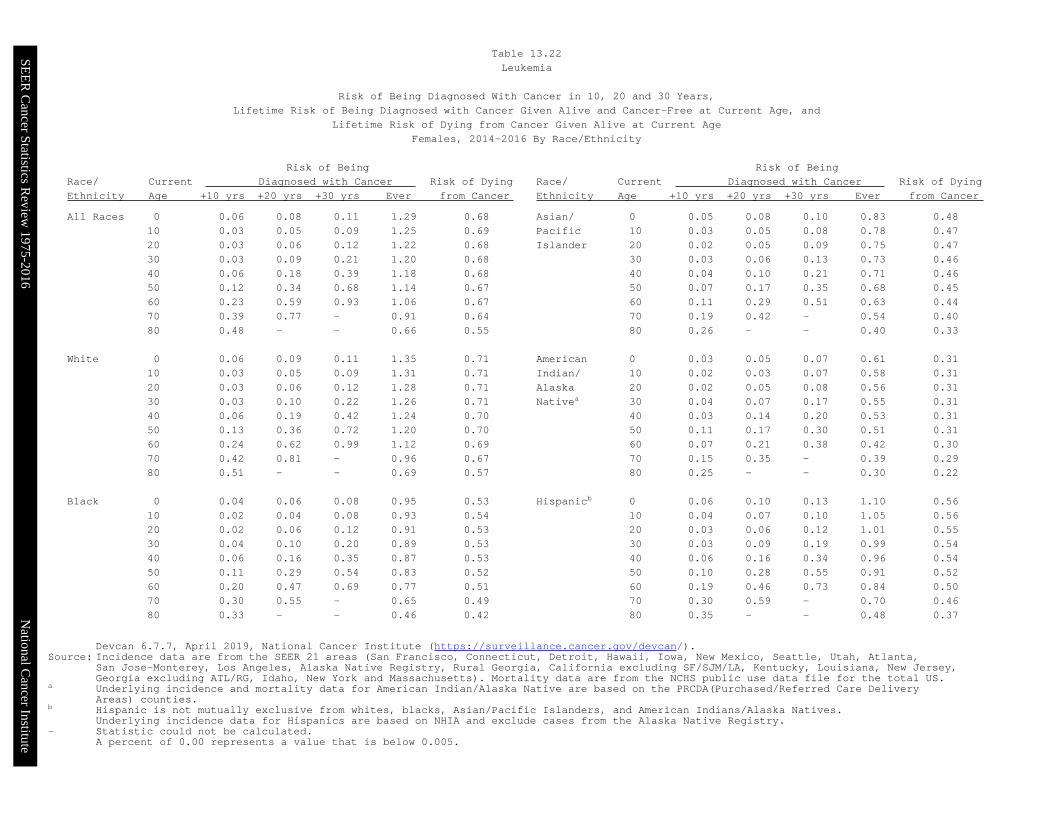
SEE
R C
ancer Statistics Review
1975-2016N
ational Cancer Institute
Devcan 677 April 2019 National Cancer Institute (httpssurveillancecancergovdevcan)Source Incidence data are from the SEER 21 areas (San Francisco Connecticut Detroit Hawaii Iowa New Mexico Seattle Utah Atlanta
San Jose-Monterey Los Angeles Alaska Native Registry Rural Georgia California excluding SFSJMLA Kentucky Louisiana New JerseyGeorgia excluding ATLRG Idaho New York and Massachusetts) Mortality data are from the NCHS public use data file for the total US
a Underlying incidence and mortality data for American IndianAlaska Native are based on the PRCDA(PurchasedReferred Care DeliveryAreas) counties
b Hispanic is not mutually exclusive from whites blacks AsianPacific Islanders and American IndiansAlaska NativesUnderlying incidence data for Hispanics are based on NHIA and exclude cases from the Alaska Native Registry
- Statistic could not be calculatedA percent of 000 represents a value that is below 0005
Risk of Being Risk of Being
Race Current Diagnosed with Cancer Risk of Dying Race Current Diagnosed with Cancer Risk of Dying
Ethnicity Age +10 yrs +20 yrs +30 yrs Ever from Cancer Ethnicity Age +10 yrs +20 yrs +30 yrs Ever from Cancer
All Races 0 006 008 011 129 068 Asian 0 005 008 010 083 048
10 003 005 009 125 069 Pacific 10 003 005 008 078 047
20 003 006 012 122 068 Islander 20 002 005 009 075 047
30 003 009 021 120 068 30 003 006 013 073 046
40 006 018 039 118 068 40 004 010 021 071 046
50 012 034 068 114 067 50 007 017 035 068 045
60 023 059 093 106 067 60 011 029 051 063 044
70 039 077 - 091 064 70 019 042 - 054 040
80 048 - - 066 055 80 026 - - 040 033
White 0 006 009 011 135 071 American 0 003 005 007 061 031
10 003 005 009 131 071 Indian 10 002 003 007 058 031
20 003 006 012 128 071 Alaska 20 002 005 008 056 031
30 003 010 022 126 071 Nativea 30 004 007 017 055 031
40 006 019 042 124 070 40 003 014 020 053 031
50 013 036 072 120 070 50 011 017 030 051 031
60 024 062 099 112 069 60 007 021 038 042 030
70 042 081 - 096 067 70 015 035 - 039 029
80 051 - - 069 057 80 025 - - 030 022
Black 0 004 006 008 095 053 Hispanicb 0 006 010 013 110 056
10 002 004 008 093 054 10 004 007 010 105 056
20 002 006 012 091 053 20 003 006 012 101 055
30 004 010 020 089 053 30 003 009 019 099 054
40 006 016 035 087 053 40 006 016 034 096 054
50 011 029 054 083 052 50 010 028 055 091 052
60 020 047 069 077 051 60 019 046 073 084 050
70 030 055 - 065 049 70 030 059 - 070 046
80 033 - - 046 042 80 035 - - 048 037
Table 1322
Leukemia
Risk of Being Diagnosed With Cancer in 10 20 and 30 Years
Lifetime Risk of Being Diagnosed with Cancer Given Alive and Cancer-Free at Current Age and
Lifetime Risk of Dying from Cancer Given Alive at Current Age
Females 2014-2016 By RaceEthnicity
SEER Cancer Statistics Review 1975-2016 National Cancer Institute
The AAPC is the Average Annual Percent Change over the time interval The AAPCs are calculated bythe Joinpoint Regression Program Version 47 February 2019 National Cancer Institute
- Statistic not shown Rate based on less than 16 cases for the time intervalTrend based on less than 10 cases for at least one year within the time interval
a Rates are age-adjusted to the 2000 US Std Population (19 age groups - Census P25-1130) Trendsare based on rates age-adjusted to the 2000 US Std Population (19 age groups - Census P25-1130)
b The SEER 9 areas are San Francisco Connecticut Detroit Hawaii Iowa New Mexico SeattleUtah and AtlantaThe SEER 21 areas comprise the SEER 9 areas plus San Jose-Monterey Los Angeles the AlaskaNative Registry Rural Georgia California excluding SFSJMLA Kentucky Louisiana New JerseyGeorgia excluding ATLRG Idaho New York and Massachusetts
c The 2007-2016 AAPC estimates are based on a Joinpoint analysis with up to 3 Joinpoints overdiagnosis years 2000-2016
d The 2007-2016 AAPC estimates are based on a Joinpoint analysis with up to 5 Joinpoints overdiagnosis years 1975-2016
e Hispanic and Non-Hispanic are not mutually exclusive from whites blacks AsianPacificIslanders and American IndiansAlaska Natives Incidence data for Hispanics and Non-Hispanicsare based on NHIA and exclude cases from the Alaska Native Registry
f Incidence data for American IndianAlaska Native are based on the PurchasedReferred CareDelivery Area (PRCDA) counties
g US Mortality Files National Center for Health Statistics CDCh The 2007-2016 mortality AAPCs are based on a Joinpoint analysis using years of death 2000-2016 The APC is significantly different from zero (plt05)
SEER Incidence SEER 21 Areasb SEER 21 Areasb SEER 9 Areasb
Rate 2012-2016 Trend 2007-2016c Trend 2007-2016d
Rate per 100000 persons AAPC () AAPC ()
Total Males Females Total Males Females Total Males Females RaceEthnicity
All Races 141 181 109 -04 -02 -06 -03 02 03
White 149 191 115 -05 -05 -07 04 03 05White Hispanice 112 134 94 01 -02 03 - - -White Non-Hispanice 153 197 116 -05 -05 -08 - - -
Black 109 139 89 06 02 07 01 01 02
AsianPacific Islander 78 97 63 01 00 02 - - -
Amer IndAlaska Natf 86 110 66 08 21 -01 - - -
Hispanice 108 130 91 02 00 03 - - -
US Mortalityg Rate 2012-2016 Trend 2007-2016h
Rate per 100000 persons AAPC ()
Total Males Females Total Males FemalesRaceEthnicity
All Races 65 88 49 -16 -17 -13
White 68 91 51 -14 -16 -12White Hispanice 50 63 41 -07 -08 -06White Non-Hispanice 69 93 51 -14 -15 -12
Black 55 72 44 -15 -17 -15
AsianPacific Islander 36 47 28 -18 -07 -23
Amer IndAlaska NatTotal US 31 42 23 -22 -09 -36PRCDA Counties 41 54 30 -16 -05 -28Non-PRCDA Counties 20 28 15 -31 -13 -50
Hispanice 47 60 38 -08 -09 -07
Table 1323Leukemia
SEER Incidence and US MortalityAge-Adjusted Rates and Trendsa
By RaceEthnicity and Sex
SEE
R C
ancer Statistics Review
1975-2016N
ational Cancer Institute
a Rates are per 100000 and are age-adjusted to the 2000 US Std Population (19 age groups - Census P25-1130)b The SEER 9 areas are San Francisco Connecticut Detroit Hawaii Iowa New Mexico Seattle Utah and Atlanta
The SEER 13 areas comprise the SEER 9 areas plus San Jose-Monterey Los Angeles the Alaska Native Registry and Rural GeorgiaThe SEER 18 areas comprise the SEER 13 areas plus California excluding SFSJMLA Kentucky Louisiana New Jersey and Georgiaexcluding ATLRGThe SEER 21 areas comprise the SEER 18 areas plus Idaho New York and Massachusetts
- Statistic not shown Rate based on less than 16 cases for the time interval
All Races Whites Blacks Total Males Females Total Males Females Total Males Females
SEER Incidence Ratesa 2012-2016
California 1239 1590 949 1337 1715 1020 1039 1334 813Greater Bay Area 1231 1619 915 1400 1844 1028 1098 1406 859San Francisco-Oakland 1212 1596 906 1389 1823 1034 1077 1336 881San Jose-Monterey 1259 1651 925 1410 1869 1011 1239 1787 -
Los Angeles 1173 1469 933 1291 1622 1016 1050 1294 884Greater California 1271 1633 968 1334 1709 1017 1007 1338 729
Connecticut 1406 1768 1117 1431 1790 1142 976 1126 867Detroit 1584 2050 1230 1707 2222 1300 1204 1485 1018Georgia 1430 1841 1120 1537 1970 1189 1139 1487 935Atlanta 1382 1819 1064 1563 2017 1207 1138 1557 884Rural Georgia 1411 1586 1206 1510 1773 1196 1248 - 1236Greater Georgia 1455 1863 1144 1531 1965 1182 1140 1450 968
Hawaii 1073 1339 843 1388 1612 1139 - - -Idaho 1588 1950 1263 1604 1973 1272 - - -Iowa 1627 2127 1222 1630 2133 1221 1416 1743 1076Kentucky 1566 1983 1234 1577 1995 1241 1159 1446 922Louisiana 1405 1789 1104 1518 1918 1197 1103 1393 890Massachusetts 1108 1429 854 1118 1448 856 787 1050 620New Jersey 1524 1962 1188 1541 1982 1199 1136 1469 928New Mexico 1299 1550 1086 1310 1556 1101 1045 - -New York 1623 2119 1244 1752 2281 1335 1068 1360 887Seattle-Puget Sound 1568 2020 1188 1634 2084 1249 1486 1929 1077Utah 1375 1793 1009 1401 1825 1029 - - -
SEER 9 Areasb 1419 1823 1094 1521 1945 1171 1154 1460 941SEER 13 Areasb 1357 1737 1049 1473 1882 1134 1126 1419 922SEER 18 Areasb 1376 1761 1066 1461 1867 1127 1114 1414 907SEER 21 Areasb 1407 1807 1088 1491 1912 1147 1089 1386 889
Table 1324Leukemia
Age-Adjusted SEER Incidence Ratesa
By Registry Race and Sex
SEE
R C
ancer Statistics Review
1975-2016N
ational Cancer Institute
a US Mortality Files National Center for Health Statistics Centers for Disease Control and PreventionRates are per 100000 and are age-adjusted to the 2000 US Std Population (19 age groups - Census P25-1130)
b The SEER 9 areas are San Francisco Connecticut Detroit Hawaii Iowa New Mexico Seattle Utah and AtlantaThe SEER 13 areas comprise the SEER 9 areas plus San Jose-Monterey Los Angeles the Alaska Native Registry and Rural GeorgiaThe SEER 18 areas comprise the SEER 13 areas plus California excluding SFSJMLA Kentucky Louisiana New Jersey and Georgiaexcluding ATLRGThe SEER 21 areas comprise the SEER 18 areas plus Idaho New York and Massachusetts
- Statistic not shown Rate based on less than 16 cases for the time interval
All Races Whites Blacks Total Males Females Total Males Females Total Males Females
SEER Death Ratesa 2012-2016
California 617 811 470 671 885 507 560 711 461Greater Bay Area 563 759 419 640 869 470 551 742 424San Francisco-Oakland 551 753 405 631 871 455 544 726 421San Jose-Monterey 584 768 446 653 863 495 604 - -
Los Angeles 608 797 468 675 894 513 571 717 483Greater California 639 835 489 677 886 515 553 687 458
Connecticut 622 837 465 639 862 474 536 665 449Detroit 662 915 485 691 967 494 573 723 475Georgia 614 817 467 642 855 478 538 706 438Atlanta 568 757 437 615 802 483 487 658 374Rural Georgia 581 628 538 579 635 - - - -Greater Georgia 639 851 482 654 879 477 576 745 483
Hawaii 463 593 362 543 632 440 - - -Idaho 655 846 497 661 865 492 - - -Iowa 693 961 498 700 963 508 - - -Kentucky 742 949 592 750 953 603 633 894 455Louisiana 677 906 514 705 953 520 603 776 498Massachusetts 622 830 478 647 869 490 463 524 444New Jersey 615 810 478 657 871 504 474 549 429New Mexico 560 759 400 589 794 421 - - -New York 621 842 466 675 910 506 450 602 356Seattle-Puget Sound 618 795 481 637 807 503 708 975 499Utah 679 865 526 693 876 542 - - -
SEER 9 Areasb 610 818 457 651 869 487 540 711 427SEER 13 Areasb 609 810 460 658 874 494 544 708 437SEER 18 Areasb 630 832 480 671 887 508 552 705 455SEER 21 Areasb 628 834 477 670 889 506 520 670 426
Total US 654 876 489 681 912 506 550 721 439
Table 1325Leukemia
Age-Adjusted SEER Death Ratesa
By Registry Race and Sex
SEER Cancer Statistics Review 1975-2016 National Cancer Institute
a US Mortality Files National Center for Health Statistics Centers for Disease Control andPrevention Rates are per 100000 and are age-adjusted to the 2000 US Std Population (19age groups - Census P25-1130)
b Difference between state rate and total US rate is statistically significant (plt=0002)c Absolute percent difference between state rate and total US rate is 15 or mored Rank of state level death rate and the 95 confidence intervals (low high) for the rankSE Standard error of the ratePD Percent difference between state rate and total US rate- Statistic not shown Rate based on less than 16 cases for the time interval
State Rate SE Rank(CI)d PD TOTAL US 654 002
High Five StatesOklahoma 790 019 01(0108) 2083c
West Virginia 749 025 02(0123) 1449South Dakota 747 040 03(0133) 1415Kentucky 742 018 04(0116) 1352Kansas 742 022 05(0122) 1350
Low Five StatesColorado 609 016 47(2649) -692Alaska 596 050 48(0451) -885New Mexico 560 022 49(3650) -1430DC 504 041 50(3251) -2293c
Hawaii 463 024 51(4951) -2913c
State Rate SE Rank(CI)d PD State Rate SE Rank(CI)d PD
Alabama 689 016 17(0532) 533 Montana 613 032 45(0950) -634Alaska 596 050 48(0451) -885 Nebraska 718 026 10(0131) 983Arizona 632 013 36(2248) -329 Nevada 644 021 28(1148) -157Arkansas 719 021 09(0127) 993 New Hampshire 638 029 31(0749) -238California 617 006 42(3248) -572 New Jersey 615 011 43(2849) -592Colorado 609 016 47(2649) -692 New Mexico 560 022 49(3650) -1430Connecticut 622 017 40(2249) -490 New York 621 007 41(2948) -499Delaware 664 035 24(0249) 152 North Carolina 634 011 34(2347) -310DC 504 041 50(3251) -2293c North Dakota 656 040 26(0249) 029Florida 630 007 38(2645) -370 Ohio 694 010 13(0626) 608Georgia 614 012 44(2849) -604 Oklahoma 790 019 01(0108) 2083c
Hawaii 463 024 51(4951) -2913c Oregon 632 017 37(1948) -331Idaho 655 028 27(0548) 012 Pennsylvania 680 009 21(1029) 396Illinois 684 010 19(0928) 463 Rhode Island 656 033 25(0349) 037Indiana 719 014 08(0222) 994 South Carolina 682 016 20(0634) 435Iowa 693 019 14(0334) 604 South Dakota 747 040 03(0133) 1415Kansas 742 022 05(0122) 1350 Tennessee 702 014 12(0327) 729Kentucky 742 018 04(0116) 1352 Texas 640 007 30(2342) -215Louisiana 677 017 23(0637) 356 Utah 679 024 22(0346) 387Maine 638 027 32(0949) -240 Vermont 636 041 33(0350) -277Maryland 633 014 35(2148) -323 Virginia 611 012 46(2849) -661Massachusetts 622 013 39(2548) -482 Washington 640 013 29(2047) -209Michigan 685 011 18(0829) 476 West Virginia 749 025 02(0123) 1449Minnesota 691 015 16(0430) 564 Wisconsin 727 015 06(0219) 1110Mississippi 692 021 15(0337) 580 Wyoming 721 049 07(0148) 1028Missouri 711 014 11(0324) 874
Table 1326Leukemia
Age-Adjusted Cancer Deatha Rates By State All Races 2012-2016
Males and Females
SEER Cancer Statistics Review 1975-2016 National Cancer Institute
a US Mortality Files National Center for Health Statistics Centers for Disease Control andPrevention Rates are per 100000 and are age-adjusted to the 2000 US Std Population (19age groups - Census P25-1130)
b Difference between state rate and total US rate is statistically significant (plt=0002)c Absolute percent difference between state rate and total US rate is 15 or mored Rank of state level death rate and the 95 confidence intervals (low high) for the rankSE Standard error of the ratePD Percent difference between state rate and total US rate- Statistic not shown Rate based on less than 16 cases for the time interval
State Rate SE Rank(CI)d PD TOTAL US 876 003
High Five StatesOklahoma 1022 034 01(0120) 1669c
Kansas 1018 039 02(0123) 1625c
Arkansas 991 037 03(0127) 1309South Dakota 985 068 04(0147) 1249Delaware 984 065 05(0144) 1236
Low Five StatesMontana 795 053 47(1150) -921New Mexico 759 039 48(2650) -1336Alaska 711 081 49(0851) -1887c
DC 704 078 50(1051) -1959c
Hawaii 593 040 51(4951) -3228c
State Rate SE Rank(CI)d PD State Rate SE Rank(CI)d PD
Alabama 939 029 17(0233) 725 Montana 795 053 47(1150) -921Alaska 711 081 49(0851) -1887c Nebraska 958 046 12(0141) 935Arizona 827 022 41(2449) -555 Nevada 858 037 33(0849) -210Arkansas 991 037 03(0127) 1309 New Hampshire 884 051 25(0149) 088California 811 010 43(3348) -738 New Jersey 810 020 44(2749) -747Colorado 834 028 39(2049) -484 New Mexico 759 039 48(2650) -1336Connecticut 837 031 37(1549) -441 New York 842 013 35(2546) -387Delaware 984 065 05(0144) 1236 North Carolina 863 020 31(1945) -149DC 704 078 50(1051) -1959c North Dakota 873 070 27(0150) -030Florida 839 012 36(2645) -422 Ohio 931 018 19(0529) 627Georgia 817 021 42(2649) -677 Oklahoma 1022 034 01(0120) 1669c
Hawaii 593 040 51(4951) -3228c Oregon 866 029 29(1147) -112Idaho 846 047 34(0550) -339 Pennsylvania 912 016 21(0931) 416Illinois 928 018 20(0529) 594 Rhode Island 911 059 22(0149) 400Indiana 960 025 11(0127) 959 South Carolina 951 029 13(0131) 853Iowa 961 035 08(0131) 969 South Dakota 985 068 04(0147) 1249Kansas 1018 039 02(0123) 1625c Tennessee 960 025 10(0127) 959Kentucky 949 031 15(0133) 832 Texas 870 013 28(2139) -069Louisiana 906 030 23(0442) 342 Utah 865 041 30(0549) -122Maine 803 046 46(1450) -836 Vermont 874 074 26(0150) -026Maryland 861 026 32(1447) -176 Virginia 809 021 45(2650) -770Massachusetts 830 023 40(2349) -529 Washington 835 023 38(2248) -463Michigan 937 020 18(0428) 702 West Virginia 972 044 06(0135) 1095Minnesota 948 027 16(0229) 826 Wisconsin 960 026 09(0127) 961Mississippi 970 039 07(0132) 1077 Wyoming 885 081 24(0150) 102Missouri 951 025 14(0228) 852
Table 1327Leukemia
Age-Adjusted Cancer Deatha Rates By State All Races 2012-2016
Males
SEER Cancer Statistics Review 1975-2016 National Cancer Institute
a US Mortality Files National Center for Health Statistics Centers for Disease Control andPrevention Rates are per 100000 and are age-adjusted to the 2000 US Std Population (19age groups - Census P25-1130)
b Difference between state rate and total US rate is statistically significant (plt=0002)c Absolute percent difference between state rate and total US rate is 15 or mored Rank of state level death rate and the 95 confidence intervals (low high) for the rankSE Standard error of the ratePD Percent difference between state rate and total US rate- Statistic not shown Rate based on less than 16 cases for the time interval
State Rate SE Rank(CI)d PD TOTAL US 489 002
High Five StatesOklahoma 615 023 01(0108) 2584c
Wyoming 596 060 02(0147) 2194c
Kentucky 592 021 03(0111) 2126c
West Virginia 576 030 04(0126) 1792c
South Dakota 564 047 05(0145) 1551c
Low Five StatesColorado 441 018 47(2250) -972Delaware 428 037 48(0751) -1247New Mexico 400 025 49(3151) -1803c
DC 381 046 50(1251) -2203c
Hawaii 362 029 51(4151) -2598c
State Rate SE Rank(CI)d PD State Rate SE Rank(CI)d PD
Alabama 512 019 18(0440) 483 Montana 452 037 43(0551) -745Alaska 485 062 27(0151) -073 Nebraska 531 030 10(0144) 864Arizona 473 015 31(1347) -308 Nevada 455 025 42(1150) -695Arkansas 516 024 15(0344) 554 New Hampshire 449 033 45(0651) -807California 470 007 34(2345) -383 New Jersey 478 013 30(1346) -223Colorado 441 018 47(2250) -972 New Mexico 400 025 49(3151) -1803c
Connecticut 465 020 40(1249) -487 New York 466 009 38(2246) -456Delaware 428 037 48(0751) -1247 North Carolina 471 012 32(1747) -350DC 381 046 50(1251) -2203c North Dakota 479 046 28(0151) -189Florida 460 008 41(2647) -582 Ohio 520 012 12(0529) 653Georgia 467 013 37(1747) -433 Oklahoma 615 023 01(0108) 2584c
Hawaii 362 029 51(4151) -2598c Oregon 449 019 44(1850) -799Idaho 497 033 22(0249) 174 Pennsylvania 516 011 14(0629) 556Illinois 514 011 16(0631) 526 Rhode Island 471 037 33(0351) -363Indiana 540 017 07(0226) 1052 South Carolina 495 018 23(0645) 133Iowa 498 022 20(0547) 200 South Dakota 564 047 05(0145) 1551c
Kansas 539 025 08(0137) 1032 Tennessee 517 016 13(0435) 590Kentucky 592 021 03(0111) 2126c Texas 467 008 36(2246) -431Louisiana 514 020 17(0442) 520 Utah 526 029 11(0146) 778Maine 508 032 19(0248) 403 Vermont 444 045 46(0351) -906Maryland 470 016 35(1448) -389 Virginia 465 014 39(1848) -474Massachusetts 478 015 29(1247) -220 Washington 487 016 25(0946) -022Michigan 498 013 21(0939) 192 West Virginia 576 030 04(0126) 1792c
Minnesota 494 017 24(0745) 121 Wisconsin 545 017 06(0225) 1162Mississippi 485 023 26(0548) -067 Wyoming 596 060 02(0147) 2194c
Missouri 535 017 09(0327) 953
Table 1328Leukemia
Age-Adjusted Cancer Deatha Rates By State All Races 2012-2016
Females
SEE
R C
ancer Statistics Review
1975-2016N
ational Cancer Institute
a US 2016 cancer prevalence counts are based on 2016 cancer prevalence proportions from the SEER 13 Areas (excluding the AlaskaNative Registry) and 112016 US population estimates based on the average of 2015 and 2016 population estimates from theUS Bureau of the CensusPrevalence was calculated using the first invasive tumor for each cancer site diagnosed during the previous 24 years
b Maximum limited-duration prevalence is 24 years for 1992-2016 datac Percentages are age-adjusted to the 2000 US Standard Population (19 age groups - Census P25-1130) by 5-year age groupsd Cases diagnosed more than 24 years ago were estimated using the completeness index method (Capocaccia et al 1997
Merrill et al 2000)e Complete prevalence is obtained by summing 0 to lt24 and gt=24- Statistic not shown Statistic based on fewer than 5 cases estimated alive in SEER for the time interval+ Not available
Years Since Diagnosis 0 to lt5 5 to lt10 10 to lt15 15 to lt20 20 to lt24 0 to lt24b gt=24d Completee
Race Sex All Races Both Sexes 153253 100309 63581 38012 21353 376508 38265 414773
Males 90192 57683 36029 21220 12020 217145 18411 235556Females 63061 42625 27552 16792 9333 159363 19854 179217
White Both Sexes 132173 87961 56051 33596 19035 328814 32999 370135Males 78368 50894 32033 18770 10845 190910 15102 210930Females 53805 37067 24018 14826 8190 137905 17897 159205
Black Both Sexes 12734 6564 4233 2487 1259 27277 4070 31347Males 6847 3556 2204 1334 637 14578 1776 16354Females 5887 3008 2029 1153 622 12699 2294 14992
Asian Both Sexes 3926 2561 1778 1164 690 10120 + +Pacific Males 2235 1462 936 646 351 5630 + +Islander Females 1691 1100 842 519 339 4490 + +
Hispanic Both Sexes 14464 9581 6796 4462 2630 37933 + +Males 8166 5374 3794 2408 1538 21280 + +Females 6298 4207 3002 2055 1092 16654 + +
Age Specific (Crude) Age-Adjustedc Age at Prevalence All Ages 0-9 10-19 20-29 30-39 40-49 50-59 60-69 70-79 80+ All Ages
Race Sex All Races Both Sexes 01168 00328 00640 00628 00377 00561 01053 02263 04023 05111 01054
Males 01369 00339 00706 00685 00419 00657 01287 02888 05282 07048 01306Females 00974 00317 00572 00570 00333 00466 00829 01696 02974 03919 00844
White Both Sexes 01304 00369 00715 00712 00410 00584 01106 02389 04249 05386 01127Males 01528 00379 00789 00771 00457 00682 01349 03042 05558 07387 01389Females 01084 00359 00637 00650 00362 00484 00869 01784 03135 04133 00904
Black Both Sexes 00605 00145 00322 00320 00267 00463 00752 01455 02470 03076 00660Males 00674 00142 00357 00338 00281 00530 00919 01737 03249 04580 00816Females 00541 00148 00286 00301 00255 00402 00605 01230 01927 02334 00552
Asian Both Sexes 00497 00264 00531 00426 00230 00390 00553 00882 01245 01389 00513Pacific Males 00577 00298 00555 00507 00249 00461 00665 01122 01552 01904 00613Islander Females 00423 00228 00507 00345 00212 00327 00456 00688 00999 01057 00430
Hispanic Both Sexes 00664 00375 00737 00728 00395 00485 00723 01191 01987 02074 00746Males 00737 00397 00827 00807 00471 00576 00831 01350 02221 02551 00854Females 00589 00352 00642 00641 00312 00391 00617 01050 01809 01780 00647
Table 1329Leukemia
Estimated United States Cancer Prevalence Countsa on January 1 2016By RaceEthnicity Sex and Years Since Diagnosis
Estimated prevalence percenta on January 1 2016 of the SEER population diagnosed in the previous 24 yearsBy Age at Prevalence RaceEthnicity and Sex
SEE
R C
ancer Statistics Review
1975-2016N
ational Cancer Institute
a US 2016 cancer prevalence counts are based on 2016 cancer prevalence proportions from the SEER 13 Areas (excluding the AlaskaNative Registry) and 112016 US population estimates based on the average of 2015 and 2016 population estimates from theUS Bureau of the CensusPrevalence was calculated using the first invasive tumor for each cancer site diagnosed during the previous 24 years
b Maximum limited-duration prevalence is 24 years for 1992-2016 datac Percentages are age-adjusted to the 2000 US Standard Population (19 age groups - Census P25-1130) by 5-year age groupsd Cases diagnosed more than 24 years ago were estimated using the completeness index method (Capocaccia et al 1997
Merrill et al 2000)e Complete prevalence is obtained by summing 0 to lt24 and gt=24- Statistic not shown Statistic based on fewer than 5 cases estimated alive in SEER for the time interval+ Not available
Years Since Diagnosis 0 to lt5 5 to lt10 10 to lt15 15 to lt20 20 to lt24 0 to lt24b gt=24d Completee
Race Sex All Races Both Sexes 20277 16033 13721 12074 8203 70308 25456 95764
Males 11203 9049 7751 6542 4634 39179 12997 52176Females 9074 6984 5971 5531 3568 31129 12460 43589
White Both Sexes 17123 13855 11870 10663 7154 60665 21823 83282Males 9549 7741 6768 5696 4084 33839 11286 45559Females 7573 6114 5102 4967 3070 26826 10537 37723
Black Both Sexes 1590 1133 923 727 553 4926 1609 6535Males 809 734 473 411 290 2716 592 3308Females 781 399 450 317 263 2210 1017 3227
Asian Both Sexes 998 720 669 486 361 3234 + +Pacific Males 527 406 369 313 178 1793 + +Islander Females 472 314 300 173 183 1441 + +
Hispanic Both Sexes 5905 4543 3352 2717 1749 18266 + +Males 3302 2686 1899 1465 1058 10409 + +Females 2603 1857 1454 1252 692 7857 + +
Age Specific (Crude) Age-Adjustedc Age at Prevalence All Ages 0-9 10-19 20-29 30-39 40-49 50-59 60-69 70-79 80+ All Ages
Race Sex All Races Both Sexes 00218 00276 00541 00467 00139 00078 00059 00065 00053 00033 00228
Males 00247 00286 00591 00520 00163 00095 00066 00069 00056 00035 00251Females 00190 00266 00488 00410 00115 00062 00053 00062 00050 00032 00204
White Both Sexes 00241 00315 00612 00542 00161 00086 00063 00070 00056 00033 00259Males 00271 00323 00670 00598 00186 00107 00069 00074 00060 00032 00284Females 00211 00306 00551 00482 00135 00064 00057 00066 00053 00033 00232
Black Both Sexes 00109 00107 00250 00197 00067 00042 00039 00029 00012 00027 00102Males 00126 00112 00281 00224 00079 00035 00052 00026 00012 00027 00112Females 00094 00102 00219 00171 00056 00047 00028 00032 00013 00027 00092
Asian Both Sexes 00159 00208 00418 00289 00071 00064 00045 00050 00054 00036 00163Pacific Males 00184 00226 00427 00360 00086 00069 00055 00054 00033 00055 00180Islander Females 00136 00190 00408 00219 00058 00059 00036 00047 00071 00023 00146
Hispanic Both Sexes 00320 00328 00637 00574 00165 00107 00093 00100 00084 00012 00279Males 00361 00342 00710 00648 00205 00131 00110 00063 00072 - 00309Females 00278 00312 00562 00494 00122 00082 00077 00133 00093 00020 00246
Table 1330Acute Lymphocytic Leukemia
Estimated United States Cancer Prevalence Countsa on January 1 2016By RaceEthnicity Sex and Years Since Diagnosis
Estimated prevalence percenta on January 1 2016 of the SEER population diagnosed in the previous 24 yearsBy Age at Prevalence RaceEthnicity and Sex
0
5
10
15
20
25
1975 1985 1995 2005 20160
5
10
15
20
25
1975 1985 1995 2005 20160
3
6
9
12
15
1975 1985 1995 2005 20160
3
6
9
12
15
1975 1985 1995 2005 2016
Delay-Adj IncidenceDelay-Adj Incidence
Observed IncidenceObserved Incidence
MortalityMortality
SEER Observed Incidence SEER Delay Adjusted Incidence and US Death RatesLeukemia by Race and Sex
a
Figure 131
Source SEER 9 areas and US Mortality Files (National Center for Health Statistics CDC)Rates are age-adjusted to the 2000 US Std Population (19 age groups - Census P25-1103)Regression lines and APCs are calculated using the Joinpoint Regression Program Version 47 February 2019 National Cancer InstituteThe APC is the Annual Percent Change for the regression line segments The APC shown on the graph is for the most recent trendThe APC is significantly different from zero (p lt 005)
a
White Male Black Male White Female Black FemaleRate per 100000 Rate per 100000 Rate per 100000 Rate per 100000
Year of DiagnosisDeath Year of DiagnosisDeath Year of DiagnosisDeath Year of DiagnosisDeath
SEER Incidence APCsDelay Adj 1998-16 = 08Observed 1975-16 = 03
US Mortality APC2013-16 = -30
SEER Incidence APCsDelay Adj 1975-16 = 02Observed 1975-16 = 01
US Mortality APC1993-16 = -15
SEER Incidence APCsDelay Adj 1975-16 = 06Observed 1975-16 = 05
US Mortality APC2000-16 = -12
SEER Incidence APCsDelay Adj 1975-16 = 03Observed 1975-16 = 02
US Mortality APC1993-16 = -13
SEE
R C
ancer Statistics Review
1975-2016N
ational Cancer Institute
0
1
2
3
4
5
6
7
8
1975 1985 1995 2005 20160
1
2
3
4
5
6
7
8
1975 1985 1995 2005 20160
1
2
3
4
5
6
7
8
1975 1985 1995 2005 20160
1
2
3
4
5
6
7
8
1975 1985 1995 2005 2016
Chronic
Acute
SEER Observed Incidence RatesLymphocytic and Myeloid Leukemia (Acute and Chronic) by Sex
a
Figure 132
Source SEER 9 areas Rates are age-adjusted to the 2000 US Std Population (19 age groups - Census P25-1103)Regression lines and APCs are calculated using the Joinpoint Regression Program Version 47 February 2019 National Cancer Institute
a
Male Female Male FemaleLymphocytic Leukemia Myeloid Leukemia
Rate per 100000 Rate per 100000 Rate per 100000 Rate per 100000
Year of Diagnosis Year of Diagnosis Year of Diagnosis Year of Diagnosis
SEE
R C
ancer Statistics Review
1975-2016N
ational Cancer Institute
Joinpoint Analyses for Whites and Blacks from 1975-2016and for AsianPacific Islanders American IndiansAlaska Natives and Hispanics from 2000-2016
0
5
10
15
20
1975 1985 1995 2005 20160
5
10
15
20
1975 1985 1995 2005 2016
White
Black
API
AIAN
Hispanic
SEER Incidence and US Death RatesLeukemia Both Sexes
Figure 133
Source Incidence data for whites and blacks are from the SEER 9 areas (San Francisco Connecticut Detroit Hawaii Iowa New Mexico Seattle Utah Atlanta)Incidence data for AsianPacific Islanders American IndiansAlaska Natives and Hispanics are from the SEER 21 areas (SEER 9 areas San Jose-MontereyLos Angeles Alaska Native Registry Rural Georgia California excluding SFSJMLA Kentucky Louisiana New Jersey Georgia excluding ATLRG Idaho New York andMassachusetts)Mortality data are from US Mortality Files National Center for Health Statistics CDCRates are age-adjusted to the 2000 US Std Population (19 age groups - Census P25-1103)Regression lines are calculated using the Joinpoint Regression Program Version 47 February 2019 National Cancer Institute Joinpoint analyses for Whites andBlacks during the 1975-2016 period allow a maximum of 5 joinpoints Analyses for other ethnic groups during the period 2000-2016 allow a maximum of 3 joinpointsAPI = AsianPacific IslanderAIAN = American IndianAlaska Native Rates for American IndianAlaska Native are based on the PurchasedReferred Care Delivery Area (PRCDA) countiesHispanic is not mutually exclusive from whites blacks AsianPacific Islanders and American IndiansAlaska Natives Incidence data for Hispanics are based onNHIA and exclude cases from the Alaska Native Registry
Incidence MortalityRate per 100000 Rate per 100000
Year of Diagnosis Year of Death
a
d
a
b
c
c
b
d
SEE
R C
ancer Statistics Review
1975-2016N
ational Cancer Institute
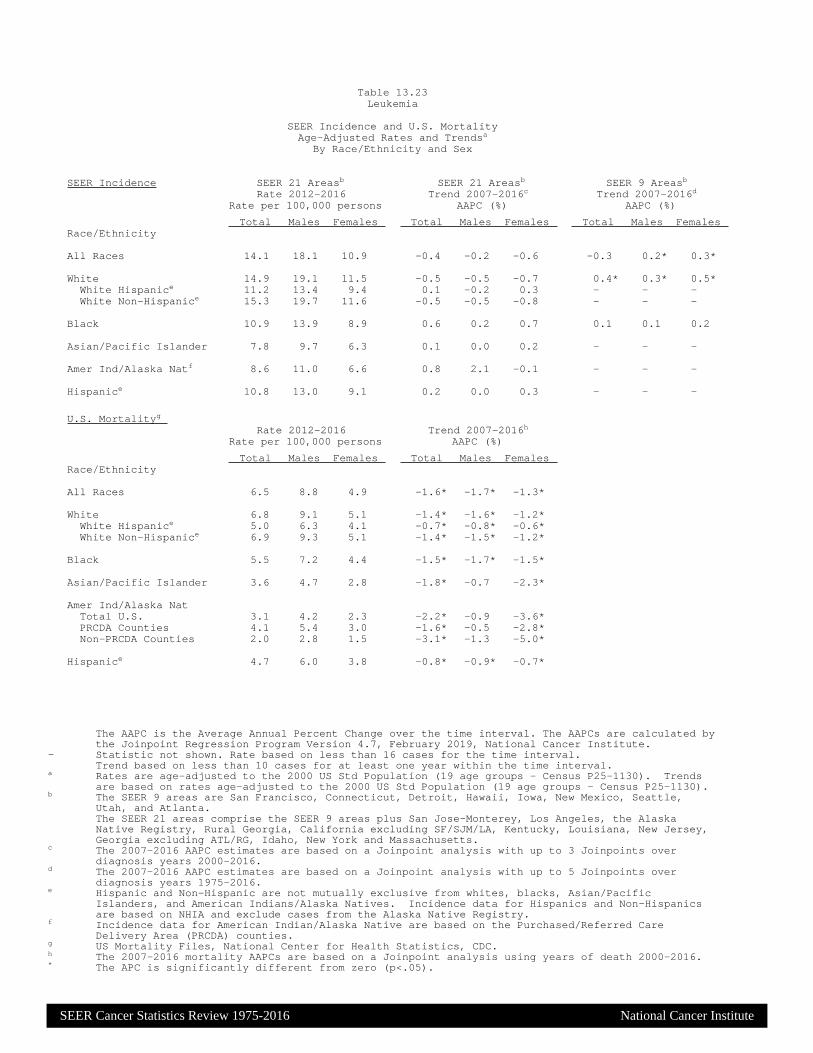
SEER Cancer Statistics Review 1975-2016 National Cancer Institute
The AAPC is the Average Annual Percent Change over the time interval The AAPCs are calculated bythe Joinpoint Regression Program Version 47 February 2019 National Cancer Institute
- Statistic not shown Rate based on less than 16 cases for the time intervalTrend based on less than 10 cases for at least one year within the time interval
a Rates are age-adjusted to the 2000 US Std Population (19 age groups - Census P25-1130) Trendsare based on rates age-adjusted to the 2000 US Std Population (19 age groups - Census P25-1130)
b The SEER 9 areas are San Francisco Connecticut Detroit Hawaii Iowa New Mexico SeattleUtah and AtlantaThe SEER 21 areas comprise the SEER 9 areas plus San Jose-Monterey Los Angeles the AlaskaNative Registry Rural Georgia California excluding SFSJMLA Kentucky Louisiana New JerseyGeorgia excluding ATLRG Idaho New York and Massachusetts
c The 2007-2016 AAPC estimates are based on a Joinpoint analysis with up to 3 Joinpoints overdiagnosis years 2000-2016
d The 2007-2016 AAPC estimates are based on a Joinpoint analysis with up to 5 Joinpoints overdiagnosis years 1975-2016
e Hispanic and Non-Hispanic are not mutually exclusive from whites blacks AsianPacificIslanders and American IndiansAlaska Natives Incidence data for Hispanics and Non-Hispanicsare based on NHIA and exclude cases from the Alaska Native Registry
f Incidence data for American IndianAlaska Native are based on the PurchasedReferred CareDelivery Area (PRCDA) counties
g US Mortality Files National Center for Health Statistics CDCh The 2007-2016 mortality AAPCs are based on a Joinpoint analysis using years of death 2000-2016 The APC is significantly different from zero (plt05)
SEER Incidence SEER 21 Areasb SEER 21 Areasb SEER 9 Areasb
Rate 2012-2016 Trend 2007-2016c Trend 2007-2016d
Rate per 100000 persons AAPC () AAPC ()
Total Males Females Total Males Females Total Males Females RaceEthnicity
All Races 141 181 109 -04 -02 -06 -03 02 03
White 149 191 115 -05 -05 -07 04 03 05White Hispanice 112 134 94 01 -02 03 - - -White Non-Hispanice 153 197 116 -05 -05 -08 - - -
Black 109 139 89 06 02 07 01 01 02
AsianPacific Islander 78 97 63 01 00 02 - - -
Amer IndAlaska Natf 86 110 66 08 21 -01 - - -
Hispanice 108 130 91 02 00 03 - - -
US Mortalityg Rate 2012-2016 Trend 2007-2016h
Rate per 100000 persons AAPC ()
Total Males Females Total Males FemalesRaceEthnicity
All Races 65 88 49 -16 -17 -13
White 68 91 51 -14 -16 -12White Hispanice 50 63 41 -07 -08 -06White Non-Hispanice 69 93 51 -14 -15 -12
Black 55 72 44 -15 -17 -15
AsianPacific Islander 36 47 28 -18 -07 -23
Amer IndAlaska NatTotal US 31 42 23 -22 -09 -36PRCDA Counties 41 54 30 -16 -05 -28Non-PRCDA Counties 20 28 15 -31 -13 -50
Hispanice 47 60 38 -08 -09 -07
Table 1323Leukemia
SEER Incidence and US MortalityAge-Adjusted Rates and Trendsa
By RaceEthnicity and Sex
SEE
R C
ancer Statistics Review
1975-2016N
ational Cancer Institute
a Rates are per 100000 and are age-adjusted to the 2000 US Std Population (19 age groups - Census P25-1130)b The SEER 9 areas are San Francisco Connecticut Detroit Hawaii Iowa New Mexico Seattle Utah and Atlanta
The SEER 13 areas comprise the SEER 9 areas plus San Jose-Monterey Los Angeles the Alaska Native Registry and Rural GeorgiaThe SEER 18 areas comprise the SEER 13 areas plus California excluding SFSJMLA Kentucky Louisiana New Jersey and Georgiaexcluding ATLRGThe SEER 21 areas comprise the SEER 18 areas plus Idaho New York and Massachusetts
- Statistic not shown Rate based on less than 16 cases for the time interval
All Races Whites Blacks Total Males Females Total Males Females Total Males Females
SEER Incidence Ratesa 2012-2016
California 1239 1590 949 1337 1715 1020 1039 1334 813Greater Bay Area 1231 1619 915 1400 1844 1028 1098 1406 859San Francisco-Oakland 1212 1596 906 1389 1823 1034 1077 1336 881San Jose-Monterey 1259 1651 925 1410 1869 1011 1239 1787 -
Los Angeles 1173 1469 933 1291 1622 1016 1050 1294 884Greater California 1271 1633 968 1334 1709 1017 1007 1338 729
Connecticut 1406 1768 1117 1431 1790 1142 976 1126 867Detroit 1584 2050 1230 1707 2222 1300 1204 1485 1018Georgia 1430 1841 1120 1537 1970 1189 1139 1487 935Atlanta 1382 1819 1064 1563 2017 1207 1138 1557 884Rural Georgia 1411 1586 1206 1510 1773 1196 1248 - 1236Greater Georgia 1455 1863 1144 1531 1965 1182 1140 1450 968
Hawaii 1073 1339 843 1388 1612 1139 - - -Idaho 1588 1950 1263 1604 1973 1272 - - -Iowa 1627 2127 1222 1630 2133 1221 1416 1743 1076Kentucky 1566 1983 1234 1577 1995 1241 1159 1446 922Louisiana 1405 1789 1104 1518 1918 1197 1103 1393 890Massachusetts 1108 1429 854 1118 1448 856 787 1050 620New Jersey 1524 1962 1188 1541 1982 1199 1136 1469 928New Mexico 1299 1550 1086 1310 1556 1101 1045 - -New York 1623 2119 1244 1752 2281 1335 1068 1360 887Seattle-Puget Sound 1568 2020 1188 1634 2084 1249 1486 1929 1077Utah 1375 1793 1009 1401 1825 1029 - - -
SEER 9 Areasb 1419 1823 1094 1521 1945 1171 1154 1460 941SEER 13 Areasb 1357 1737 1049 1473 1882 1134 1126 1419 922SEER 18 Areasb 1376 1761 1066 1461 1867 1127 1114 1414 907SEER 21 Areasb 1407 1807 1088 1491 1912 1147 1089 1386 889
Table 1324Leukemia
Age-Adjusted SEER Incidence Ratesa
By Registry Race and Sex
SEE
R C
ancer Statistics Review
1975-2016N
ational Cancer Institute
a US Mortality Files National Center for Health Statistics Centers for Disease Control and PreventionRates are per 100000 and are age-adjusted to the 2000 US Std Population (19 age groups - Census P25-1130)
b The SEER 9 areas are San Francisco Connecticut Detroit Hawaii Iowa New Mexico Seattle Utah and AtlantaThe SEER 13 areas comprise the SEER 9 areas plus San Jose-Monterey Los Angeles the Alaska Native Registry and Rural GeorgiaThe SEER 18 areas comprise the SEER 13 areas plus California excluding SFSJMLA Kentucky Louisiana New Jersey and Georgiaexcluding ATLRGThe SEER 21 areas comprise the SEER 18 areas plus Idaho New York and Massachusetts
- Statistic not shown Rate based on less than 16 cases for the time interval
All Races Whites Blacks Total Males Females Total Males Females Total Males Females
SEER Death Ratesa 2012-2016
California 617 811 470 671 885 507 560 711 461Greater Bay Area 563 759 419 640 869 470 551 742 424San Francisco-Oakland 551 753 405 631 871 455 544 726 421San Jose-Monterey 584 768 446 653 863 495 604 - -
Los Angeles 608 797 468 675 894 513 571 717 483Greater California 639 835 489 677 886 515 553 687 458
Connecticut 622 837 465 639 862 474 536 665 449Detroit 662 915 485 691 967 494 573 723 475Georgia 614 817 467 642 855 478 538 706 438Atlanta 568 757 437 615 802 483 487 658 374Rural Georgia 581 628 538 579 635 - - - -Greater Georgia 639 851 482 654 879 477 576 745 483
Hawaii 463 593 362 543 632 440 - - -Idaho 655 846 497 661 865 492 - - -Iowa 693 961 498 700 963 508 - - -Kentucky 742 949 592 750 953 603 633 894 455Louisiana 677 906 514 705 953 520 603 776 498Massachusetts 622 830 478 647 869 490 463 524 444New Jersey 615 810 478 657 871 504 474 549 429New Mexico 560 759 400 589 794 421 - - -New York 621 842 466 675 910 506 450 602 356Seattle-Puget Sound 618 795 481 637 807 503 708 975 499Utah 679 865 526 693 876 542 - - -
SEER 9 Areasb 610 818 457 651 869 487 540 711 427SEER 13 Areasb 609 810 460 658 874 494 544 708 437SEER 18 Areasb 630 832 480 671 887 508 552 705 455SEER 21 Areasb 628 834 477 670 889 506 520 670 426
Total US 654 876 489 681 912 506 550 721 439
Table 1325Leukemia
Age-Adjusted SEER Death Ratesa
By Registry Race and Sex
SEER Cancer Statistics Review 1975-2016 National Cancer Institute
a US Mortality Files National Center for Health Statistics Centers for Disease Control andPrevention Rates are per 100000 and are age-adjusted to the 2000 US Std Population (19age groups - Census P25-1130)
b Difference between state rate and total US rate is statistically significant (plt=0002)c Absolute percent difference between state rate and total US rate is 15 or mored Rank of state level death rate and the 95 confidence intervals (low high) for the rankSE Standard error of the ratePD Percent difference between state rate and total US rate- Statistic not shown Rate based on less than 16 cases for the time interval
State Rate SE Rank(CI)d PD TOTAL US 654 002
High Five StatesOklahoma 790 019 01(0108) 2083c
West Virginia 749 025 02(0123) 1449South Dakota 747 040 03(0133) 1415Kentucky 742 018 04(0116) 1352Kansas 742 022 05(0122) 1350
Low Five StatesColorado 609 016 47(2649) -692Alaska 596 050 48(0451) -885New Mexico 560 022 49(3650) -1430DC 504 041 50(3251) -2293c
Hawaii 463 024 51(4951) -2913c
State Rate SE Rank(CI)d PD State Rate SE Rank(CI)d PD
Alabama 689 016 17(0532) 533 Montana 613 032 45(0950) -634Alaska 596 050 48(0451) -885 Nebraska 718 026 10(0131) 983Arizona 632 013 36(2248) -329 Nevada 644 021 28(1148) -157Arkansas 719 021 09(0127) 993 New Hampshire 638 029 31(0749) -238California 617 006 42(3248) -572 New Jersey 615 011 43(2849) -592Colorado 609 016 47(2649) -692 New Mexico 560 022 49(3650) -1430Connecticut 622 017 40(2249) -490 New York 621 007 41(2948) -499Delaware 664 035 24(0249) 152 North Carolina 634 011 34(2347) -310DC 504 041 50(3251) -2293c North Dakota 656 040 26(0249) 029Florida 630 007 38(2645) -370 Ohio 694 010 13(0626) 608Georgia 614 012 44(2849) -604 Oklahoma 790 019 01(0108) 2083c
Hawaii 463 024 51(4951) -2913c Oregon 632 017 37(1948) -331Idaho 655 028 27(0548) 012 Pennsylvania 680 009 21(1029) 396Illinois 684 010 19(0928) 463 Rhode Island 656 033 25(0349) 037Indiana 719 014 08(0222) 994 South Carolina 682 016 20(0634) 435Iowa 693 019 14(0334) 604 South Dakota 747 040 03(0133) 1415Kansas 742 022 05(0122) 1350 Tennessee 702 014 12(0327) 729Kentucky 742 018 04(0116) 1352 Texas 640 007 30(2342) -215Louisiana 677 017 23(0637) 356 Utah 679 024 22(0346) 387Maine 638 027 32(0949) -240 Vermont 636 041 33(0350) -277Maryland 633 014 35(2148) -323 Virginia 611 012 46(2849) -661Massachusetts 622 013 39(2548) -482 Washington 640 013 29(2047) -209Michigan 685 011 18(0829) 476 West Virginia 749 025 02(0123) 1449Minnesota 691 015 16(0430) 564 Wisconsin 727 015 06(0219) 1110Mississippi 692 021 15(0337) 580 Wyoming 721 049 07(0148) 1028Missouri 711 014 11(0324) 874
Table 1326Leukemia
Age-Adjusted Cancer Deatha Rates By State All Races 2012-2016
Males and Females
SEER Cancer Statistics Review 1975-2016 National Cancer Institute
a US Mortality Files National Center for Health Statistics Centers for Disease Control andPrevention Rates are per 100000 and are age-adjusted to the 2000 US Std Population (19age groups - Census P25-1130)
b Difference between state rate and total US rate is statistically significant (plt=0002)c Absolute percent difference between state rate and total US rate is 15 or mored Rank of state level death rate and the 95 confidence intervals (low high) for the rankSE Standard error of the ratePD Percent difference between state rate and total US rate- Statistic not shown Rate based on less than 16 cases for the time interval
State Rate SE Rank(CI)d PD TOTAL US 876 003
High Five StatesOklahoma 1022 034 01(0120) 1669c
Kansas 1018 039 02(0123) 1625c
Arkansas 991 037 03(0127) 1309South Dakota 985 068 04(0147) 1249Delaware 984 065 05(0144) 1236
Low Five StatesMontana 795 053 47(1150) -921New Mexico 759 039 48(2650) -1336Alaska 711 081 49(0851) -1887c
DC 704 078 50(1051) -1959c
Hawaii 593 040 51(4951) -3228c
State Rate SE Rank(CI)d PD State Rate SE Rank(CI)d PD
Alabama 939 029 17(0233) 725 Montana 795 053 47(1150) -921Alaska 711 081 49(0851) -1887c Nebraska 958 046 12(0141) 935Arizona 827 022 41(2449) -555 Nevada 858 037 33(0849) -210Arkansas 991 037 03(0127) 1309 New Hampshire 884 051 25(0149) 088California 811 010 43(3348) -738 New Jersey 810 020 44(2749) -747Colorado 834 028 39(2049) -484 New Mexico 759 039 48(2650) -1336Connecticut 837 031 37(1549) -441 New York 842 013 35(2546) -387Delaware 984 065 05(0144) 1236 North Carolina 863 020 31(1945) -149DC 704 078 50(1051) -1959c North Dakota 873 070 27(0150) -030Florida 839 012 36(2645) -422 Ohio 931 018 19(0529) 627Georgia 817 021 42(2649) -677 Oklahoma 1022 034 01(0120) 1669c
Hawaii 593 040 51(4951) -3228c Oregon 866 029 29(1147) -112Idaho 846 047 34(0550) -339 Pennsylvania 912 016 21(0931) 416Illinois 928 018 20(0529) 594 Rhode Island 911 059 22(0149) 400Indiana 960 025 11(0127) 959 South Carolina 951 029 13(0131) 853Iowa 961 035 08(0131) 969 South Dakota 985 068 04(0147) 1249Kansas 1018 039 02(0123) 1625c Tennessee 960 025 10(0127) 959Kentucky 949 031 15(0133) 832 Texas 870 013 28(2139) -069Louisiana 906 030 23(0442) 342 Utah 865 041 30(0549) -122Maine 803 046 46(1450) -836 Vermont 874 074 26(0150) -026Maryland 861 026 32(1447) -176 Virginia 809 021 45(2650) -770Massachusetts 830 023 40(2349) -529 Washington 835 023 38(2248) -463Michigan 937 020 18(0428) 702 West Virginia 972 044 06(0135) 1095Minnesota 948 027 16(0229) 826 Wisconsin 960 026 09(0127) 961Mississippi 970 039 07(0132) 1077 Wyoming 885 081 24(0150) 102Missouri 951 025 14(0228) 852
Table 1327Leukemia
Age-Adjusted Cancer Deatha Rates By State All Races 2012-2016
Males
SEER Cancer Statistics Review 1975-2016 National Cancer Institute
a US Mortality Files National Center for Health Statistics Centers for Disease Control andPrevention Rates are per 100000 and are age-adjusted to the 2000 US Std Population (19age groups - Census P25-1130)
b Difference between state rate and total US rate is statistically significant (plt=0002)c Absolute percent difference between state rate and total US rate is 15 or mored Rank of state level death rate and the 95 confidence intervals (low high) for the rankSE Standard error of the ratePD Percent difference between state rate and total US rate- Statistic not shown Rate based on less than 16 cases for the time interval
State Rate SE Rank(CI)d PD TOTAL US 489 002
High Five StatesOklahoma 615 023 01(0108) 2584c
Wyoming 596 060 02(0147) 2194c
Kentucky 592 021 03(0111) 2126c
West Virginia 576 030 04(0126) 1792c
South Dakota 564 047 05(0145) 1551c
Low Five StatesColorado 441 018 47(2250) -972Delaware 428 037 48(0751) -1247New Mexico 400 025 49(3151) -1803c
DC 381 046 50(1251) -2203c
Hawaii 362 029 51(4151) -2598c
State Rate SE Rank(CI)d PD State Rate SE Rank(CI)d PD
Alabama 512 019 18(0440) 483 Montana 452 037 43(0551) -745Alaska 485 062 27(0151) -073 Nebraska 531 030 10(0144) 864Arizona 473 015 31(1347) -308 Nevada 455 025 42(1150) -695Arkansas 516 024 15(0344) 554 New Hampshire 449 033 45(0651) -807California 470 007 34(2345) -383 New Jersey 478 013 30(1346) -223Colorado 441 018 47(2250) -972 New Mexico 400 025 49(3151) -1803c
Connecticut 465 020 40(1249) -487 New York 466 009 38(2246) -456Delaware 428 037 48(0751) -1247 North Carolina 471 012 32(1747) -350DC 381 046 50(1251) -2203c North Dakota 479 046 28(0151) -189Florida 460 008 41(2647) -582 Ohio 520 012 12(0529) 653Georgia 467 013 37(1747) -433 Oklahoma 615 023 01(0108) 2584c
Hawaii 362 029 51(4151) -2598c Oregon 449 019 44(1850) -799Idaho 497 033 22(0249) 174 Pennsylvania 516 011 14(0629) 556Illinois 514 011 16(0631) 526 Rhode Island 471 037 33(0351) -363Indiana 540 017 07(0226) 1052 South Carolina 495 018 23(0645) 133Iowa 498 022 20(0547) 200 South Dakota 564 047 05(0145) 1551c
Kansas 539 025 08(0137) 1032 Tennessee 517 016 13(0435) 590Kentucky 592 021 03(0111) 2126c Texas 467 008 36(2246) -431Louisiana 514 020 17(0442) 520 Utah 526 029 11(0146) 778Maine 508 032 19(0248) 403 Vermont 444 045 46(0351) -906Maryland 470 016 35(1448) -389 Virginia 465 014 39(1848) -474Massachusetts 478 015 29(1247) -220 Washington 487 016 25(0946) -022Michigan 498 013 21(0939) 192 West Virginia 576 030 04(0126) 1792c
Minnesota 494 017 24(0745) 121 Wisconsin 545 017 06(0225) 1162Mississippi 485 023 26(0548) -067 Wyoming 596 060 02(0147) 2194c
Missouri 535 017 09(0327) 953
Table 1328Leukemia
Age-Adjusted Cancer Deatha Rates By State All Races 2012-2016
Females
SEE
R C
ancer Statistics Review
1975-2016N
ational Cancer Institute
a US 2016 cancer prevalence counts are based on 2016 cancer prevalence proportions from the SEER 13 Areas (excluding the AlaskaNative Registry) and 112016 US population estimates based on the average of 2015 and 2016 population estimates from theUS Bureau of the CensusPrevalence was calculated using the first invasive tumor for each cancer site diagnosed during the previous 24 years
b Maximum limited-duration prevalence is 24 years for 1992-2016 datac Percentages are age-adjusted to the 2000 US Standard Population (19 age groups - Census P25-1130) by 5-year age groupsd Cases diagnosed more than 24 years ago were estimated using the completeness index method (Capocaccia et al 1997
Merrill et al 2000)e Complete prevalence is obtained by summing 0 to lt24 and gt=24- Statistic not shown Statistic based on fewer than 5 cases estimated alive in SEER for the time interval+ Not available
Years Since Diagnosis 0 to lt5 5 to lt10 10 to lt15 15 to lt20 20 to lt24 0 to lt24b gt=24d Completee
Race Sex All Races Both Sexes 153253 100309 63581 38012 21353 376508 38265 414773
Males 90192 57683 36029 21220 12020 217145 18411 235556Females 63061 42625 27552 16792 9333 159363 19854 179217
White Both Sexes 132173 87961 56051 33596 19035 328814 32999 370135Males 78368 50894 32033 18770 10845 190910 15102 210930Females 53805 37067 24018 14826 8190 137905 17897 159205
Black Both Sexes 12734 6564 4233 2487 1259 27277 4070 31347Males 6847 3556 2204 1334 637 14578 1776 16354Females 5887 3008 2029 1153 622 12699 2294 14992
Asian Both Sexes 3926 2561 1778 1164 690 10120 + +Pacific Males 2235 1462 936 646 351 5630 + +Islander Females 1691 1100 842 519 339 4490 + +
Hispanic Both Sexes 14464 9581 6796 4462 2630 37933 + +Males 8166 5374 3794 2408 1538 21280 + +Females 6298 4207 3002 2055 1092 16654 + +
Age Specific (Crude) Age-Adjustedc Age at Prevalence All Ages 0-9 10-19 20-29 30-39 40-49 50-59 60-69 70-79 80+ All Ages
Race Sex All Races Both Sexes 01168 00328 00640 00628 00377 00561 01053 02263 04023 05111 01054
Males 01369 00339 00706 00685 00419 00657 01287 02888 05282 07048 01306Females 00974 00317 00572 00570 00333 00466 00829 01696 02974 03919 00844
White Both Sexes 01304 00369 00715 00712 00410 00584 01106 02389 04249 05386 01127Males 01528 00379 00789 00771 00457 00682 01349 03042 05558 07387 01389Females 01084 00359 00637 00650 00362 00484 00869 01784 03135 04133 00904
Black Both Sexes 00605 00145 00322 00320 00267 00463 00752 01455 02470 03076 00660Males 00674 00142 00357 00338 00281 00530 00919 01737 03249 04580 00816Females 00541 00148 00286 00301 00255 00402 00605 01230 01927 02334 00552
Asian Both Sexes 00497 00264 00531 00426 00230 00390 00553 00882 01245 01389 00513Pacific Males 00577 00298 00555 00507 00249 00461 00665 01122 01552 01904 00613Islander Females 00423 00228 00507 00345 00212 00327 00456 00688 00999 01057 00430
Hispanic Both Sexes 00664 00375 00737 00728 00395 00485 00723 01191 01987 02074 00746Males 00737 00397 00827 00807 00471 00576 00831 01350 02221 02551 00854Females 00589 00352 00642 00641 00312 00391 00617 01050 01809 01780 00647
Table 1329Leukemia
Estimated United States Cancer Prevalence Countsa on January 1 2016By RaceEthnicity Sex and Years Since Diagnosis
Estimated prevalence percenta on January 1 2016 of the SEER population diagnosed in the previous 24 yearsBy Age at Prevalence RaceEthnicity and Sex
SEE
R C
ancer Statistics Review
1975-2016N
ational Cancer Institute
a US 2016 cancer prevalence counts are based on 2016 cancer prevalence proportions from the SEER 13 Areas (excluding the AlaskaNative Registry) and 112016 US population estimates based on the average of 2015 and 2016 population estimates from theUS Bureau of the CensusPrevalence was calculated using the first invasive tumor for each cancer site diagnosed during the previous 24 years
b Maximum limited-duration prevalence is 24 years for 1992-2016 datac Percentages are age-adjusted to the 2000 US Standard Population (19 age groups - Census P25-1130) by 5-year age groupsd Cases diagnosed more than 24 years ago were estimated using the completeness index method (Capocaccia et al 1997
Merrill et al 2000)e Complete prevalence is obtained by summing 0 to lt24 and gt=24- Statistic not shown Statistic based on fewer than 5 cases estimated alive in SEER for the time interval+ Not available
Years Since Diagnosis 0 to lt5 5 to lt10 10 to lt15 15 to lt20 20 to lt24 0 to lt24b gt=24d Completee
Race Sex All Races Both Sexes 20277 16033 13721 12074 8203 70308 25456 95764
Males 11203 9049 7751 6542 4634 39179 12997 52176Females 9074 6984 5971 5531 3568 31129 12460 43589
White Both Sexes 17123 13855 11870 10663 7154 60665 21823 83282Males 9549 7741 6768 5696 4084 33839 11286 45559Females 7573 6114 5102 4967 3070 26826 10537 37723
Black Both Sexes 1590 1133 923 727 553 4926 1609 6535Males 809 734 473 411 290 2716 592 3308Females 781 399 450 317 263 2210 1017 3227
Asian Both Sexes 998 720 669 486 361 3234 + +Pacific Males 527 406 369 313 178 1793 + +Islander Females 472 314 300 173 183 1441 + +
Hispanic Both Sexes 5905 4543 3352 2717 1749 18266 + +Males 3302 2686 1899 1465 1058 10409 + +Females 2603 1857 1454 1252 692 7857 + +
Age Specific (Crude) Age-Adjustedc Age at Prevalence All Ages 0-9 10-19 20-29 30-39 40-49 50-59 60-69 70-79 80+ All Ages
Race Sex All Races Both Sexes 00218 00276 00541 00467 00139 00078 00059 00065 00053 00033 00228
Males 00247 00286 00591 00520 00163 00095 00066 00069 00056 00035 00251Females 00190 00266 00488 00410 00115 00062 00053 00062 00050 00032 00204
White Both Sexes 00241 00315 00612 00542 00161 00086 00063 00070 00056 00033 00259Males 00271 00323 00670 00598 00186 00107 00069 00074 00060 00032 00284Females 00211 00306 00551 00482 00135 00064 00057 00066 00053 00033 00232
Black Both Sexes 00109 00107 00250 00197 00067 00042 00039 00029 00012 00027 00102Males 00126 00112 00281 00224 00079 00035 00052 00026 00012 00027 00112Females 00094 00102 00219 00171 00056 00047 00028 00032 00013 00027 00092
Asian Both Sexes 00159 00208 00418 00289 00071 00064 00045 00050 00054 00036 00163Pacific Males 00184 00226 00427 00360 00086 00069 00055 00054 00033 00055 00180Islander Females 00136 00190 00408 00219 00058 00059 00036 00047 00071 00023 00146
Hispanic Both Sexes 00320 00328 00637 00574 00165 00107 00093 00100 00084 00012 00279Males 00361 00342 00710 00648 00205 00131 00110 00063 00072 - 00309Females 00278 00312 00562 00494 00122 00082 00077 00133 00093 00020 00246
Table 1330Acute Lymphocytic Leukemia
Estimated United States Cancer Prevalence Countsa on January 1 2016By RaceEthnicity Sex and Years Since Diagnosis
Estimated prevalence percenta on January 1 2016 of the SEER population diagnosed in the previous 24 yearsBy Age at Prevalence RaceEthnicity and Sex
0
5
10
15
20
25
1975 1985 1995 2005 20160
5
10
15
20
25
1975 1985 1995 2005 20160
3
6
9
12
15
1975 1985 1995 2005 20160
3
6
9
12
15
1975 1985 1995 2005 2016
Delay-Adj IncidenceDelay-Adj Incidence
Observed IncidenceObserved Incidence
MortalityMortality
SEER Observed Incidence SEER Delay Adjusted Incidence and US Death RatesLeukemia by Race and Sex
a
Figure 131
Source SEER 9 areas and US Mortality Files (National Center for Health Statistics CDC)Rates are age-adjusted to the 2000 US Std Population (19 age groups - Census P25-1103)Regression lines and APCs are calculated using the Joinpoint Regression Program Version 47 February 2019 National Cancer InstituteThe APC is the Annual Percent Change for the regression line segments The APC shown on the graph is for the most recent trendThe APC is significantly different from zero (p lt 005)
a
White Male Black Male White Female Black FemaleRate per 100000 Rate per 100000 Rate per 100000 Rate per 100000
Year of DiagnosisDeath Year of DiagnosisDeath Year of DiagnosisDeath Year of DiagnosisDeath
SEER Incidence APCsDelay Adj 1998-16 = 08Observed 1975-16 = 03
US Mortality APC2013-16 = -30
SEER Incidence APCsDelay Adj 1975-16 = 02Observed 1975-16 = 01
US Mortality APC1993-16 = -15
SEER Incidence APCsDelay Adj 1975-16 = 06Observed 1975-16 = 05
US Mortality APC2000-16 = -12
SEER Incidence APCsDelay Adj 1975-16 = 03Observed 1975-16 = 02
US Mortality APC1993-16 = -13
SEE
R C
ancer Statistics Review
1975-2016N
ational Cancer Institute
0
1
2
3
4
5
6
7
8
1975 1985 1995 2005 20160
1
2
3
4
5
6
7
8
1975 1985 1995 2005 20160
1
2
3
4
5
6
7
8
1975 1985 1995 2005 20160
1
2
3
4
5
6
7
8
1975 1985 1995 2005 2016
Chronic
Acute
SEER Observed Incidence RatesLymphocytic and Myeloid Leukemia (Acute and Chronic) by Sex
a
Figure 132
Source SEER 9 areas Rates are age-adjusted to the 2000 US Std Population (19 age groups - Census P25-1103)Regression lines and APCs are calculated using the Joinpoint Regression Program Version 47 February 2019 National Cancer Institute
a
Male Female Male FemaleLymphocytic Leukemia Myeloid Leukemia
Rate per 100000 Rate per 100000 Rate per 100000 Rate per 100000
Year of Diagnosis Year of Diagnosis Year of Diagnosis Year of Diagnosis
SEE
R C
ancer Statistics Review
1975-2016N
ational Cancer Institute
Joinpoint Analyses for Whites and Blacks from 1975-2016and for AsianPacific Islanders American IndiansAlaska Natives and Hispanics from 2000-2016
0
5
10
15
20
1975 1985 1995 2005 20160
5
10
15
20
1975 1985 1995 2005 2016
White
Black
API
AIAN
Hispanic
SEER Incidence and US Death RatesLeukemia Both Sexes
Figure 133
Source Incidence data for whites and blacks are from the SEER 9 areas (San Francisco Connecticut Detroit Hawaii Iowa New Mexico Seattle Utah Atlanta)Incidence data for AsianPacific Islanders American IndiansAlaska Natives and Hispanics are from the SEER 21 areas (SEER 9 areas San Jose-MontereyLos Angeles Alaska Native Registry Rural Georgia California excluding SFSJMLA Kentucky Louisiana New Jersey Georgia excluding ATLRG Idaho New York andMassachusetts)Mortality data are from US Mortality Files National Center for Health Statistics CDCRates are age-adjusted to the 2000 US Std Population (19 age groups - Census P25-1103)Regression lines are calculated using the Joinpoint Regression Program Version 47 February 2019 National Cancer Institute Joinpoint analyses for Whites andBlacks during the 1975-2016 period allow a maximum of 5 joinpoints Analyses for other ethnic groups during the period 2000-2016 allow a maximum of 3 joinpointsAPI = AsianPacific IslanderAIAN = American IndianAlaska Native Rates for American IndianAlaska Native are based on the PurchasedReferred Care Delivery Area (PRCDA) countiesHispanic is not mutually exclusive from whites blacks AsianPacific Islanders and American IndiansAlaska Natives Incidence data for Hispanics are based onNHIA and exclude cases from the Alaska Native Registry
Incidence MortalityRate per 100000 Rate per 100000
Year of Diagnosis Year of Death
a
d
a
b
c
c
b
d
SEE
R C
ancer Statistics Review
1975-2016N
ational Cancer Institute
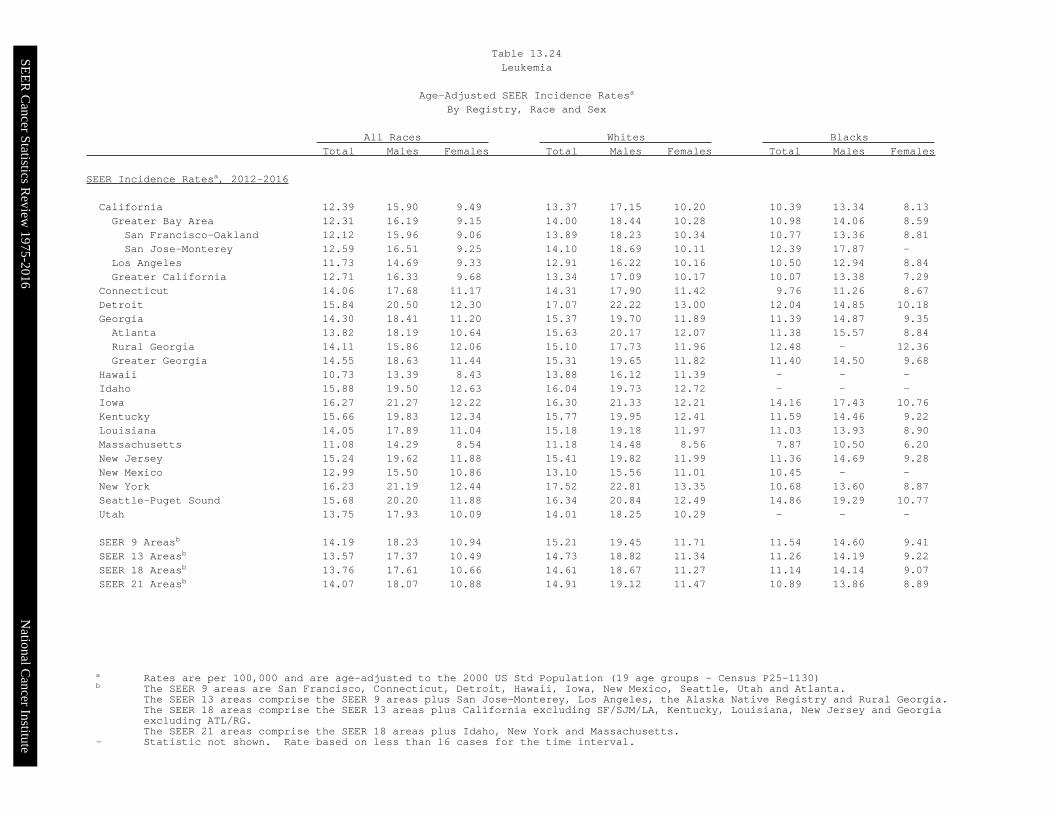
SEE
R C
ancer Statistics Review
1975-2016N
ational Cancer Institute
a Rates are per 100000 and are age-adjusted to the 2000 US Std Population (19 age groups - Census P25-1130)b The SEER 9 areas are San Francisco Connecticut Detroit Hawaii Iowa New Mexico Seattle Utah and Atlanta
The SEER 13 areas comprise the SEER 9 areas plus San Jose-Monterey Los Angeles the Alaska Native Registry and Rural GeorgiaThe SEER 18 areas comprise the SEER 13 areas plus California excluding SFSJMLA Kentucky Louisiana New Jersey and Georgiaexcluding ATLRGThe SEER 21 areas comprise the SEER 18 areas plus Idaho New York and Massachusetts
- Statistic not shown Rate based on less than 16 cases for the time interval
All Races Whites Blacks Total Males Females Total Males Females Total Males Females
SEER Incidence Ratesa 2012-2016
California 1239 1590 949 1337 1715 1020 1039 1334 813Greater Bay Area 1231 1619 915 1400 1844 1028 1098 1406 859San Francisco-Oakland 1212 1596 906 1389 1823 1034 1077 1336 881San Jose-Monterey 1259 1651 925 1410 1869 1011 1239 1787 -
Los Angeles 1173 1469 933 1291 1622 1016 1050 1294 884Greater California 1271 1633 968 1334 1709 1017 1007 1338 729
Connecticut 1406 1768 1117 1431 1790 1142 976 1126 867Detroit 1584 2050 1230 1707 2222 1300 1204 1485 1018Georgia 1430 1841 1120 1537 1970 1189 1139 1487 935Atlanta 1382 1819 1064 1563 2017 1207 1138 1557 884Rural Georgia 1411 1586 1206 1510 1773 1196 1248 - 1236Greater Georgia 1455 1863 1144 1531 1965 1182 1140 1450 968
Hawaii 1073 1339 843 1388 1612 1139 - - -Idaho 1588 1950 1263 1604 1973 1272 - - -Iowa 1627 2127 1222 1630 2133 1221 1416 1743 1076Kentucky 1566 1983 1234 1577 1995 1241 1159 1446 922Louisiana 1405 1789 1104 1518 1918 1197 1103 1393 890Massachusetts 1108 1429 854 1118 1448 856 787 1050 620New Jersey 1524 1962 1188 1541 1982 1199 1136 1469 928New Mexico 1299 1550 1086 1310 1556 1101 1045 - -New York 1623 2119 1244 1752 2281 1335 1068 1360 887Seattle-Puget Sound 1568 2020 1188 1634 2084 1249 1486 1929 1077Utah 1375 1793 1009 1401 1825 1029 - - -
SEER 9 Areasb 1419 1823 1094 1521 1945 1171 1154 1460 941SEER 13 Areasb 1357 1737 1049 1473 1882 1134 1126 1419 922SEER 18 Areasb 1376 1761 1066 1461 1867 1127 1114 1414 907SEER 21 Areasb 1407 1807 1088 1491 1912 1147 1089 1386 889
Table 1324Leukemia
Age-Adjusted SEER Incidence Ratesa
By Registry Race and Sex
SEE
R C
ancer Statistics Review
1975-2016N
ational Cancer Institute
a US Mortality Files National Center for Health Statistics Centers for Disease Control and PreventionRates are per 100000 and are age-adjusted to the 2000 US Std Population (19 age groups - Census P25-1130)
b The SEER 9 areas are San Francisco Connecticut Detroit Hawaii Iowa New Mexico Seattle Utah and AtlantaThe SEER 13 areas comprise the SEER 9 areas plus San Jose-Monterey Los Angeles the Alaska Native Registry and Rural GeorgiaThe SEER 18 areas comprise the SEER 13 areas plus California excluding SFSJMLA Kentucky Louisiana New Jersey and Georgiaexcluding ATLRGThe SEER 21 areas comprise the SEER 18 areas plus Idaho New York and Massachusetts
- Statistic not shown Rate based on less than 16 cases for the time interval
All Races Whites Blacks Total Males Females Total Males Females Total Males Females
SEER Death Ratesa 2012-2016
California 617 811 470 671 885 507 560 711 461Greater Bay Area 563 759 419 640 869 470 551 742 424San Francisco-Oakland 551 753 405 631 871 455 544 726 421San Jose-Monterey 584 768 446 653 863 495 604 - -
Los Angeles 608 797 468 675 894 513 571 717 483Greater California 639 835 489 677 886 515 553 687 458
Connecticut 622 837 465 639 862 474 536 665 449Detroit 662 915 485 691 967 494 573 723 475Georgia 614 817 467 642 855 478 538 706 438Atlanta 568 757 437 615 802 483 487 658 374Rural Georgia 581 628 538 579 635 - - - -Greater Georgia 639 851 482 654 879 477 576 745 483
Hawaii 463 593 362 543 632 440 - - -Idaho 655 846 497 661 865 492 - - -Iowa 693 961 498 700 963 508 - - -Kentucky 742 949 592 750 953 603 633 894 455Louisiana 677 906 514 705 953 520 603 776 498Massachusetts 622 830 478 647 869 490 463 524 444New Jersey 615 810 478 657 871 504 474 549 429New Mexico 560 759 400 589 794 421 - - -New York 621 842 466 675 910 506 450 602 356Seattle-Puget Sound 618 795 481 637 807 503 708 975 499Utah 679 865 526 693 876 542 - - -
SEER 9 Areasb 610 818 457 651 869 487 540 711 427SEER 13 Areasb 609 810 460 658 874 494 544 708 437SEER 18 Areasb 630 832 480 671 887 508 552 705 455SEER 21 Areasb 628 834 477 670 889 506 520 670 426
Total US 654 876 489 681 912 506 550 721 439
Table 1325Leukemia
Age-Adjusted SEER Death Ratesa
By Registry Race and Sex
SEER Cancer Statistics Review 1975-2016 National Cancer Institute
a US Mortality Files National Center for Health Statistics Centers for Disease Control andPrevention Rates are per 100000 and are age-adjusted to the 2000 US Std Population (19age groups - Census P25-1130)
b Difference between state rate and total US rate is statistically significant (plt=0002)c Absolute percent difference between state rate and total US rate is 15 or mored Rank of state level death rate and the 95 confidence intervals (low high) for the rankSE Standard error of the ratePD Percent difference between state rate and total US rate- Statistic not shown Rate based on less than 16 cases for the time interval
State Rate SE Rank(CI)d PD TOTAL US 654 002
High Five StatesOklahoma 790 019 01(0108) 2083c
West Virginia 749 025 02(0123) 1449South Dakota 747 040 03(0133) 1415Kentucky 742 018 04(0116) 1352Kansas 742 022 05(0122) 1350
Low Five StatesColorado 609 016 47(2649) -692Alaska 596 050 48(0451) -885New Mexico 560 022 49(3650) -1430DC 504 041 50(3251) -2293c
Hawaii 463 024 51(4951) -2913c
State Rate SE Rank(CI)d PD State Rate SE Rank(CI)d PD
Alabama 689 016 17(0532) 533 Montana 613 032 45(0950) -634Alaska 596 050 48(0451) -885 Nebraska 718 026 10(0131) 983Arizona 632 013 36(2248) -329 Nevada 644 021 28(1148) -157Arkansas 719 021 09(0127) 993 New Hampshire 638 029 31(0749) -238California 617 006 42(3248) -572 New Jersey 615 011 43(2849) -592Colorado 609 016 47(2649) -692 New Mexico 560 022 49(3650) -1430Connecticut 622 017 40(2249) -490 New York 621 007 41(2948) -499Delaware 664 035 24(0249) 152 North Carolina 634 011 34(2347) -310DC 504 041 50(3251) -2293c North Dakota 656 040 26(0249) 029Florida 630 007 38(2645) -370 Ohio 694 010 13(0626) 608Georgia 614 012 44(2849) -604 Oklahoma 790 019 01(0108) 2083c
Hawaii 463 024 51(4951) -2913c Oregon 632 017 37(1948) -331Idaho 655 028 27(0548) 012 Pennsylvania 680 009 21(1029) 396Illinois 684 010 19(0928) 463 Rhode Island 656 033 25(0349) 037Indiana 719 014 08(0222) 994 South Carolina 682 016 20(0634) 435Iowa 693 019 14(0334) 604 South Dakota 747 040 03(0133) 1415Kansas 742 022 05(0122) 1350 Tennessee 702 014 12(0327) 729Kentucky 742 018 04(0116) 1352 Texas 640 007 30(2342) -215Louisiana 677 017 23(0637) 356 Utah 679 024 22(0346) 387Maine 638 027 32(0949) -240 Vermont 636 041 33(0350) -277Maryland 633 014 35(2148) -323 Virginia 611 012 46(2849) -661Massachusetts 622 013 39(2548) -482 Washington 640 013 29(2047) -209Michigan 685 011 18(0829) 476 West Virginia 749 025 02(0123) 1449Minnesota 691 015 16(0430) 564 Wisconsin 727 015 06(0219) 1110Mississippi 692 021 15(0337) 580 Wyoming 721 049 07(0148) 1028Missouri 711 014 11(0324) 874
Table 1326Leukemia
Age-Adjusted Cancer Deatha Rates By State All Races 2012-2016
Males and Females
SEER Cancer Statistics Review 1975-2016 National Cancer Institute
a US Mortality Files National Center for Health Statistics Centers for Disease Control andPrevention Rates are per 100000 and are age-adjusted to the 2000 US Std Population (19age groups - Census P25-1130)
b Difference between state rate and total US rate is statistically significant (plt=0002)c Absolute percent difference between state rate and total US rate is 15 or mored Rank of state level death rate and the 95 confidence intervals (low high) for the rankSE Standard error of the ratePD Percent difference between state rate and total US rate- Statistic not shown Rate based on less than 16 cases for the time interval
State Rate SE Rank(CI)d PD TOTAL US 876 003
High Five StatesOklahoma 1022 034 01(0120) 1669c
Kansas 1018 039 02(0123) 1625c
Arkansas 991 037 03(0127) 1309South Dakota 985 068 04(0147) 1249Delaware 984 065 05(0144) 1236
Low Five StatesMontana 795 053 47(1150) -921New Mexico 759 039 48(2650) -1336Alaska 711 081 49(0851) -1887c
DC 704 078 50(1051) -1959c
Hawaii 593 040 51(4951) -3228c
State Rate SE Rank(CI)d PD State Rate SE Rank(CI)d PD
Alabama 939 029 17(0233) 725 Montana 795 053 47(1150) -921Alaska 711 081 49(0851) -1887c Nebraska 958 046 12(0141) 935Arizona 827 022 41(2449) -555 Nevada 858 037 33(0849) -210Arkansas 991 037 03(0127) 1309 New Hampshire 884 051 25(0149) 088California 811 010 43(3348) -738 New Jersey 810 020 44(2749) -747Colorado 834 028 39(2049) -484 New Mexico 759 039 48(2650) -1336Connecticut 837 031 37(1549) -441 New York 842 013 35(2546) -387Delaware 984 065 05(0144) 1236 North Carolina 863 020 31(1945) -149DC 704 078 50(1051) -1959c North Dakota 873 070 27(0150) -030Florida 839 012 36(2645) -422 Ohio 931 018 19(0529) 627Georgia 817 021 42(2649) -677 Oklahoma 1022 034 01(0120) 1669c
Hawaii 593 040 51(4951) -3228c Oregon 866 029 29(1147) -112Idaho 846 047 34(0550) -339 Pennsylvania 912 016 21(0931) 416Illinois 928 018 20(0529) 594 Rhode Island 911 059 22(0149) 400Indiana 960 025 11(0127) 959 South Carolina 951 029 13(0131) 853Iowa 961 035 08(0131) 969 South Dakota 985 068 04(0147) 1249Kansas 1018 039 02(0123) 1625c Tennessee 960 025 10(0127) 959Kentucky 949 031 15(0133) 832 Texas 870 013 28(2139) -069Louisiana 906 030 23(0442) 342 Utah 865 041 30(0549) -122Maine 803 046 46(1450) -836 Vermont 874 074 26(0150) -026Maryland 861 026 32(1447) -176 Virginia 809 021 45(2650) -770Massachusetts 830 023 40(2349) -529 Washington 835 023 38(2248) -463Michigan 937 020 18(0428) 702 West Virginia 972 044 06(0135) 1095Minnesota 948 027 16(0229) 826 Wisconsin 960 026 09(0127) 961Mississippi 970 039 07(0132) 1077 Wyoming 885 081 24(0150) 102Missouri 951 025 14(0228) 852
Table 1327Leukemia
Age-Adjusted Cancer Deatha Rates By State All Races 2012-2016
Males
SEER Cancer Statistics Review 1975-2016 National Cancer Institute
a US Mortality Files National Center for Health Statistics Centers for Disease Control andPrevention Rates are per 100000 and are age-adjusted to the 2000 US Std Population (19age groups - Census P25-1130)
b Difference between state rate and total US rate is statistically significant (plt=0002)c Absolute percent difference between state rate and total US rate is 15 or mored Rank of state level death rate and the 95 confidence intervals (low high) for the rankSE Standard error of the ratePD Percent difference between state rate and total US rate- Statistic not shown Rate based on less than 16 cases for the time interval
State Rate SE Rank(CI)d PD TOTAL US 489 002
High Five StatesOklahoma 615 023 01(0108) 2584c
Wyoming 596 060 02(0147) 2194c
Kentucky 592 021 03(0111) 2126c
West Virginia 576 030 04(0126) 1792c
South Dakota 564 047 05(0145) 1551c
Low Five StatesColorado 441 018 47(2250) -972Delaware 428 037 48(0751) -1247New Mexico 400 025 49(3151) -1803c
DC 381 046 50(1251) -2203c
Hawaii 362 029 51(4151) -2598c
State Rate SE Rank(CI)d PD State Rate SE Rank(CI)d PD
Alabama 512 019 18(0440) 483 Montana 452 037 43(0551) -745Alaska 485 062 27(0151) -073 Nebraska 531 030 10(0144) 864Arizona 473 015 31(1347) -308 Nevada 455 025 42(1150) -695Arkansas 516 024 15(0344) 554 New Hampshire 449 033 45(0651) -807California 470 007 34(2345) -383 New Jersey 478 013 30(1346) -223Colorado 441 018 47(2250) -972 New Mexico 400 025 49(3151) -1803c
Connecticut 465 020 40(1249) -487 New York 466 009 38(2246) -456Delaware 428 037 48(0751) -1247 North Carolina 471 012 32(1747) -350DC 381 046 50(1251) -2203c North Dakota 479 046 28(0151) -189Florida 460 008 41(2647) -582 Ohio 520 012 12(0529) 653Georgia 467 013 37(1747) -433 Oklahoma 615 023 01(0108) 2584c
Hawaii 362 029 51(4151) -2598c Oregon 449 019 44(1850) -799Idaho 497 033 22(0249) 174 Pennsylvania 516 011 14(0629) 556Illinois 514 011 16(0631) 526 Rhode Island 471 037 33(0351) -363Indiana 540 017 07(0226) 1052 South Carolina 495 018 23(0645) 133Iowa 498 022 20(0547) 200 South Dakota 564 047 05(0145) 1551c
Kansas 539 025 08(0137) 1032 Tennessee 517 016 13(0435) 590Kentucky 592 021 03(0111) 2126c Texas 467 008 36(2246) -431Louisiana 514 020 17(0442) 520 Utah 526 029 11(0146) 778Maine 508 032 19(0248) 403 Vermont 444 045 46(0351) -906Maryland 470 016 35(1448) -389 Virginia 465 014 39(1848) -474Massachusetts 478 015 29(1247) -220 Washington 487 016 25(0946) -022Michigan 498 013 21(0939) 192 West Virginia 576 030 04(0126) 1792c
Minnesota 494 017 24(0745) 121 Wisconsin 545 017 06(0225) 1162Mississippi 485 023 26(0548) -067 Wyoming 596 060 02(0147) 2194c
Missouri 535 017 09(0327) 953
Table 1328Leukemia
Age-Adjusted Cancer Deatha Rates By State All Races 2012-2016
Females
SEE
R C
ancer Statistics Review
1975-2016N
ational Cancer Institute
a US 2016 cancer prevalence counts are based on 2016 cancer prevalence proportions from the SEER 13 Areas (excluding the AlaskaNative Registry) and 112016 US population estimates based on the average of 2015 and 2016 population estimates from theUS Bureau of the CensusPrevalence was calculated using the first invasive tumor for each cancer site diagnosed during the previous 24 years
b Maximum limited-duration prevalence is 24 years for 1992-2016 datac Percentages are age-adjusted to the 2000 US Standard Population (19 age groups - Census P25-1130) by 5-year age groupsd Cases diagnosed more than 24 years ago were estimated using the completeness index method (Capocaccia et al 1997
Merrill et al 2000)e Complete prevalence is obtained by summing 0 to lt24 and gt=24- Statistic not shown Statistic based on fewer than 5 cases estimated alive in SEER for the time interval+ Not available
Years Since Diagnosis 0 to lt5 5 to lt10 10 to lt15 15 to lt20 20 to lt24 0 to lt24b gt=24d Completee
Race Sex All Races Both Sexes 153253 100309 63581 38012 21353 376508 38265 414773
Males 90192 57683 36029 21220 12020 217145 18411 235556Females 63061 42625 27552 16792 9333 159363 19854 179217
White Both Sexes 132173 87961 56051 33596 19035 328814 32999 370135Males 78368 50894 32033 18770 10845 190910 15102 210930Females 53805 37067 24018 14826 8190 137905 17897 159205
Black Both Sexes 12734 6564 4233 2487 1259 27277 4070 31347Males 6847 3556 2204 1334 637 14578 1776 16354Females 5887 3008 2029 1153 622 12699 2294 14992
Asian Both Sexes 3926 2561 1778 1164 690 10120 + +Pacific Males 2235 1462 936 646 351 5630 + +Islander Females 1691 1100 842 519 339 4490 + +
Hispanic Both Sexes 14464 9581 6796 4462 2630 37933 + +Males 8166 5374 3794 2408 1538 21280 + +Females 6298 4207 3002 2055 1092 16654 + +
Age Specific (Crude) Age-Adjustedc Age at Prevalence All Ages 0-9 10-19 20-29 30-39 40-49 50-59 60-69 70-79 80+ All Ages
Race Sex All Races Both Sexes 01168 00328 00640 00628 00377 00561 01053 02263 04023 05111 01054
Males 01369 00339 00706 00685 00419 00657 01287 02888 05282 07048 01306Females 00974 00317 00572 00570 00333 00466 00829 01696 02974 03919 00844
White Both Sexes 01304 00369 00715 00712 00410 00584 01106 02389 04249 05386 01127Males 01528 00379 00789 00771 00457 00682 01349 03042 05558 07387 01389Females 01084 00359 00637 00650 00362 00484 00869 01784 03135 04133 00904
Black Both Sexes 00605 00145 00322 00320 00267 00463 00752 01455 02470 03076 00660Males 00674 00142 00357 00338 00281 00530 00919 01737 03249 04580 00816Females 00541 00148 00286 00301 00255 00402 00605 01230 01927 02334 00552
Asian Both Sexes 00497 00264 00531 00426 00230 00390 00553 00882 01245 01389 00513Pacific Males 00577 00298 00555 00507 00249 00461 00665 01122 01552 01904 00613Islander Females 00423 00228 00507 00345 00212 00327 00456 00688 00999 01057 00430
Hispanic Both Sexes 00664 00375 00737 00728 00395 00485 00723 01191 01987 02074 00746Males 00737 00397 00827 00807 00471 00576 00831 01350 02221 02551 00854Females 00589 00352 00642 00641 00312 00391 00617 01050 01809 01780 00647
Table 1329Leukemia
Estimated United States Cancer Prevalence Countsa on January 1 2016By RaceEthnicity Sex and Years Since Diagnosis
Estimated prevalence percenta on January 1 2016 of the SEER population diagnosed in the previous 24 yearsBy Age at Prevalence RaceEthnicity and Sex
SEE
R C
ancer Statistics Review
1975-2016N
ational Cancer Institute
a US 2016 cancer prevalence counts are based on 2016 cancer prevalence proportions from the SEER 13 Areas (excluding the AlaskaNative Registry) and 112016 US population estimates based on the average of 2015 and 2016 population estimates from theUS Bureau of the CensusPrevalence was calculated using the first invasive tumor for each cancer site diagnosed during the previous 24 years
b Maximum limited-duration prevalence is 24 years for 1992-2016 datac Percentages are age-adjusted to the 2000 US Standard Population (19 age groups - Census P25-1130) by 5-year age groupsd Cases diagnosed more than 24 years ago were estimated using the completeness index method (Capocaccia et al 1997
Merrill et al 2000)e Complete prevalence is obtained by summing 0 to lt24 and gt=24- Statistic not shown Statistic based on fewer than 5 cases estimated alive in SEER for the time interval+ Not available
Years Since Diagnosis 0 to lt5 5 to lt10 10 to lt15 15 to lt20 20 to lt24 0 to lt24b gt=24d Completee
Race Sex All Races Both Sexes 20277 16033 13721 12074 8203 70308 25456 95764
Males 11203 9049 7751 6542 4634 39179 12997 52176Females 9074 6984 5971 5531 3568 31129 12460 43589
White Both Sexes 17123 13855 11870 10663 7154 60665 21823 83282Males 9549 7741 6768 5696 4084 33839 11286 45559Females 7573 6114 5102 4967 3070 26826 10537 37723
Black Both Sexes 1590 1133 923 727 553 4926 1609 6535Males 809 734 473 411 290 2716 592 3308Females 781 399 450 317 263 2210 1017 3227
Asian Both Sexes 998 720 669 486 361 3234 + +Pacific Males 527 406 369 313 178 1793 + +Islander Females 472 314 300 173 183 1441 + +
Hispanic Both Sexes 5905 4543 3352 2717 1749 18266 + +Males 3302 2686 1899 1465 1058 10409 + +Females 2603 1857 1454 1252 692 7857 + +
Age Specific (Crude) Age-Adjustedc Age at Prevalence All Ages 0-9 10-19 20-29 30-39 40-49 50-59 60-69 70-79 80+ All Ages
Race Sex All Races Both Sexes 00218 00276 00541 00467 00139 00078 00059 00065 00053 00033 00228
Males 00247 00286 00591 00520 00163 00095 00066 00069 00056 00035 00251Females 00190 00266 00488 00410 00115 00062 00053 00062 00050 00032 00204
White Both Sexes 00241 00315 00612 00542 00161 00086 00063 00070 00056 00033 00259Males 00271 00323 00670 00598 00186 00107 00069 00074 00060 00032 00284Females 00211 00306 00551 00482 00135 00064 00057 00066 00053 00033 00232
Black Both Sexes 00109 00107 00250 00197 00067 00042 00039 00029 00012 00027 00102Males 00126 00112 00281 00224 00079 00035 00052 00026 00012 00027 00112Females 00094 00102 00219 00171 00056 00047 00028 00032 00013 00027 00092
Asian Both Sexes 00159 00208 00418 00289 00071 00064 00045 00050 00054 00036 00163Pacific Males 00184 00226 00427 00360 00086 00069 00055 00054 00033 00055 00180Islander Females 00136 00190 00408 00219 00058 00059 00036 00047 00071 00023 00146
Hispanic Both Sexes 00320 00328 00637 00574 00165 00107 00093 00100 00084 00012 00279Males 00361 00342 00710 00648 00205 00131 00110 00063 00072 - 00309Females 00278 00312 00562 00494 00122 00082 00077 00133 00093 00020 00246
Table 1330Acute Lymphocytic Leukemia
Estimated United States Cancer Prevalence Countsa on January 1 2016By RaceEthnicity Sex and Years Since Diagnosis
Estimated prevalence percenta on January 1 2016 of the SEER population diagnosed in the previous 24 yearsBy Age at Prevalence RaceEthnicity and Sex
0
5
10
15
20
25
1975 1985 1995 2005 20160
5
10
15
20
25
1975 1985 1995 2005 20160
3
6
9
12
15
1975 1985 1995 2005 20160
3
6
9
12
15
1975 1985 1995 2005 2016
Delay-Adj IncidenceDelay-Adj Incidence
Observed IncidenceObserved Incidence
MortalityMortality
SEER Observed Incidence SEER Delay Adjusted Incidence and US Death RatesLeukemia by Race and Sex
a
Figure 131
Source SEER 9 areas and US Mortality Files (National Center for Health Statistics CDC)Rates are age-adjusted to the 2000 US Std Population (19 age groups - Census P25-1103)Regression lines and APCs are calculated using the Joinpoint Regression Program Version 47 February 2019 National Cancer InstituteThe APC is the Annual Percent Change for the regression line segments The APC shown on the graph is for the most recent trendThe APC is significantly different from zero (p lt 005)
a
White Male Black Male White Female Black FemaleRate per 100000 Rate per 100000 Rate per 100000 Rate per 100000
Year of DiagnosisDeath Year of DiagnosisDeath Year of DiagnosisDeath Year of DiagnosisDeath
SEER Incidence APCsDelay Adj 1998-16 = 08Observed 1975-16 = 03
US Mortality APC2013-16 = -30
SEER Incidence APCsDelay Adj 1975-16 = 02Observed 1975-16 = 01
US Mortality APC1993-16 = -15
SEER Incidence APCsDelay Adj 1975-16 = 06Observed 1975-16 = 05
US Mortality APC2000-16 = -12
SEER Incidence APCsDelay Adj 1975-16 = 03Observed 1975-16 = 02
US Mortality APC1993-16 = -13
SEE
R C
ancer Statistics Review
1975-2016N
ational Cancer Institute
0
1
2
3
4
5
6
7
8
1975 1985 1995 2005 20160
1
2
3
4
5
6
7
8
1975 1985 1995 2005 20160
1
2
3
4
5
6
7
8
1975 1985 1995 2005 20160
1
2
3
4
5
6
7
8
1975 1985 1995 2005 2016
Chronic
Acute
SEER Observed Incidence RatesLymphocytic and Myeloid Leukemia (Acute and Chronic) by Sex
a
Figure 132
Source SEER 9 areas Rates are age-adjusted to the 2000 US Std Population (19 age groups - Census P25-1103)Regression lines and APCs are calculated using the Joinpoint Regression Program Version 47 February 2019 National Cancer Institute
a
Male Female Male FemaleLymphocytic Leukemia Myeloid Leukemia
Rate per 100000 Rate per 100000 Rate per 100000 Rate per 100000
Year of Diagnosis Year of Diagnosis Year of Diagnosis Year of Diagnosis
SEE
R C
ancer Statistics Review
1975-2016N
ational Cancer Institute
Joinpoint Analyses for Whites and Blacks from 1975-2016and for AsianPacific Islanders American IndiansAlaska Natives and Hispanics from 2000-2016
0
5
10
15
20
1975 1985 1995 2005 20160
5
10
15
20
1975 1985 1995 2005 2016
White
Black
API
AIAN
Hispanic
SEER Incidence and US Death RatesLeukemia Both Sexes
Figure 133
Source Incidence data for whites and blacks are from the SEER 9 areas (San Francisco Connecticut Detroit Hawaii Iowa New Mexico Seattle Utah Atlanta)Incidence data for AsianPacific Islanders American IndiansAlaska Natives and Hispanics are from the SEER 21 areas (SEER 9 areas San Jose-MontereyLos Angeles Alaska Native Registry Rural Georgia California excluding SFSJMLA Kentucky Louisiana New Jersey Georgia excluding ATLRG Idaho New York andMassachusetts)Mortality data are from US Mortality Files National Center for Health Statistics CDCRates are age-adjusted to the 2000 US Std Population (19 age groups - Census P25-1103)Regression lines are calculated using the Joinpoint Regression Program Version 47 February 2019 National Cancer Institute Joinpoint analyses for Whites andBlacks during the 1975-2016 period allow a maximum of 5 joinpoints Analyses for other ethnic groups during the period 2000-2016 allow a maximum of 3 joinpointsAPI = AsianPacific IslanderAIAN = American IndianAlaska Native Rates for American IndianAlaska Native are based on the PurchasedReferred Care Delivery Area (PRCDA) countiesHispanic is not mutually exclusive from whites blacks AsianPacific Islanders and American IndiansAlaska Natives Incidence data for Hispanics are based onNHIA and exclude cases from the Alaska Native Registry
Incidence MortalityRate per 100000 Rate per 100000
Year of Diagnosis Year of Death
a
d
a
b
c
c
b
d
SEE
R C
ancer Statistics Review
1975-2016N
ational Cancer Institute
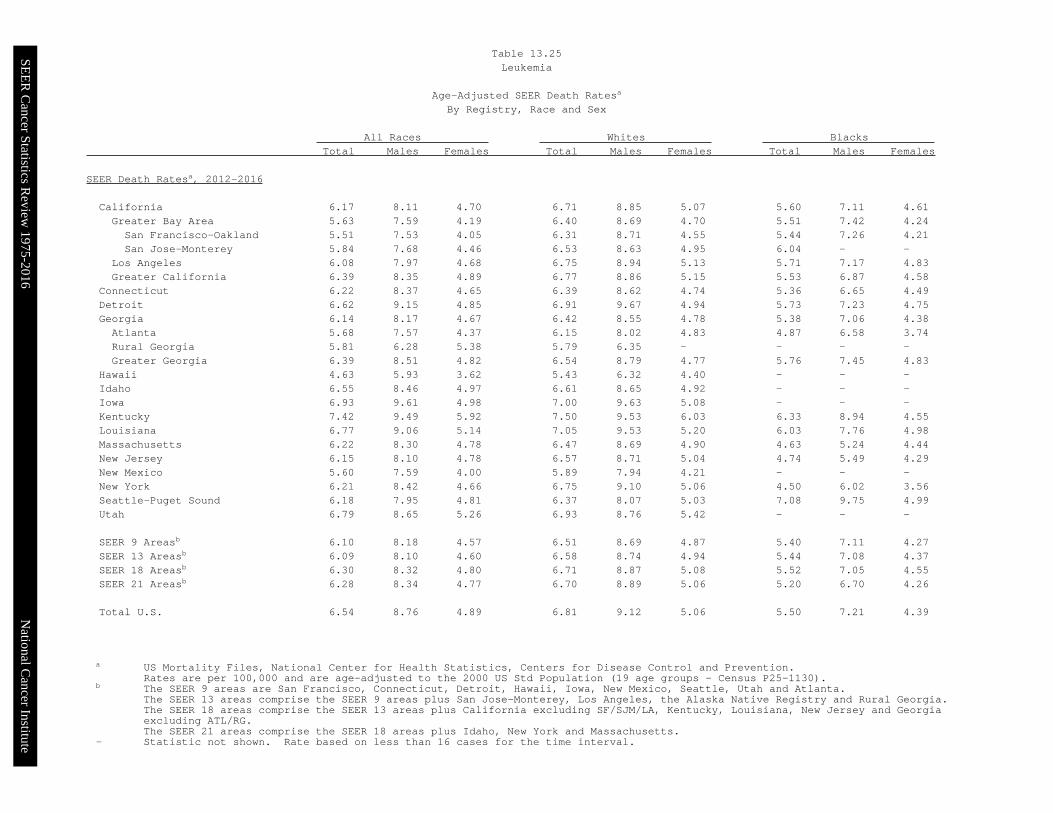
SEE
R C
ancer Statistics Review
1975-2016N
ational Cancer Institute
a US Mortality Files National Center for Health Statistics Centers for Disease Control and PreventionRates are per 100000 and are age-adjusted to the 2000 US Std Population (19 age groups - Census P25-1130)
b The SEER 9 areas are San Francisco Connecticut Detroit Hawaii Iowa New Mexico Seattle Utah and AtlantaThe SEER 13 areas comprise the SEER 9 areas plus San Jose-Monterey Los Angeles the Alaska Native Registry and Rural GeorgiaThe SEER 18 areas comprise the SEER 13 areas plus California excluding SFSJMLA Kentucky Louisiana New Jersey and Georgiaexcluding ATLRGThe SEER 21 areas comprise the SEER 18 areas plus Idaho New York and Massachusetts
- Statistic not shown Rate based on less than 16 cases for the time interval
All Races Whites Blacks Total Males Females Total Males Females Total Males Females
SEER Death Ratesa 2012-2016
California 617 811 470 671 885 507 560 711 461Greater Bay Area 563 759 419 640 869 470 551 742 424San Francisco-Oakland 551 753 405 631 871 455 544 726 421San Jose-Monterey 584 768 446 653 863 495 604 - -
Los Angeles 608 797 468 675 894 513 571 717 483Greater California 639 835 489 677 886 515 553 687 458
Connecticut 622 837 465 639 862 474 536 665 449Detroit 662 915 485 691 967 494 573 723 475Georgia 614 817 467 642 855 478 538 706 438Atlanta 568 757 437 615 802 483 487 658 374Rural Georgia 581 628 538 579 635 - - - -Greater Georgia 639 851 482 654 879 477 576 745 483
Hawaii 463 593 362 543 632 440 - - -Idaho 655 846 497 661 865 492 - - -Iowa 693 961 498 700 963 508 - - -Kentucky 742 949 592 750 953 603 633 894 455Louisiana 677 906 514 705 953 520 603 776 498Massachusetts 622 830 478 647 869 490 463 524 444New Jersey 615 810 478 657 871 504 474 549 429New Mexico 560 759 400 589 794 421 - - -New York 621 842 466 675 910 506 450 602 356Seattle-Puget Sound 618 795 481 637 807 503 708 975 499Utah 679 865 526 693 876 542 - - -
SEER 9 Areasb 610 818 457 651 869 487 540 711 427SEER 13 Areasb 609 810 460 658 874 494 544 708 437SEER 18 Areasb 630 832 480 671 887 508 552 705 455SEER 21 Areasb 628 834 477 670 889 506 520 670 426
Total US 654 876 489 681 912 506 550 721 439
Table 1325Leukemia
Age-Adjusted SEER Death Ratesa
By Registry Race and Sex
SEER Cancer Statistics Review 1975-2016 National Cancer Institute
a US Mortality Files National Center for Health Statistics Centers for Disease Control andPrevention Rates are per 100000 and are age-adjusted to the 2000 US Std Population (19age groups - Census P25-1130)
b Difference between state rate and total US rate is statistically significant (plt=0002)c Absolute percent difference between state rate and total US rate is 15 or mored Rank of state level death rate and the 95 confidence intervals (low high) for the rankSE Standard error of the ratePD Percent difference between state rate and total US rate- Statistic not shown Rate based on less than 16 cases for the time interval
State Rate SE Rank(CI)d PD TOTAL US 654 002
High Five StatesOklahoma 790 019 01(0108) 2083c
West Virginia 749 025 02(0123) 1449South Dakota 747 040 03(0133) 1415Kentucky 742 018 04(0116) 1352Kansas 742 022 05(0122) 1350
Low Five StatesColorado 609 016 47(2649) -692Alaska 596 050 48(0451) -885New Mexico 560 022 49(3650) -1430DC 504 041 50(3251) -2293c
Hawaii 463 024 51(4951) -2913c
State Rate SE Rank(CI)d PD State Rate SE Rank(CI)d PD
Alabama 689 016 17(0532) 533 Montana 613 032 45(0950) -634Alaska 596 050 48(0451) -885 Nebraska 718 026 10(0131) 983Arizona 632 013 36(2248) -329 Nevada 644 021 28(1148) -157Arkansas 719 021 09(0127) 993 New Hampshire 638 029 31(0749) -238California 617 006 42(3248) -572 New Jersey 615 011 43(2849) -592Colorado 609 016 47(2649) -692 New Mexico 560 022 49(3650) -1430Connecticut 622 017 40(2249) -490 New York 621 007 41(2948) -499Delaware 664 035 24(0249) 152 North Carolina 634 011 34(2347) -310DC 504 041 50(3251) -2293c North Dakota 656 040 26(0249) 029Florida 630 007 38(2645) -370 Ohio 694 010 13(0626) 608Georgia 614 012 44(2849) -604 Oklahoma 790 019 01(0108) 2083c
Hawaii 463 024 51(4951) -2913c Oregon 632 017 37(1948) -331Idaho 655 028 27(0548) 012 Pennsylvania 680 009 21(1029) 396Illinois 684 010 19(0928) 463 Rhode Island 656 033 25(0349) 037Indiana 719 014 08(0222) 994 South Carolina 682 016 20(0634) 435Iowa 693 019 14(0334) 604 South Dakota 747 040 03(0133) 1415Kansas 742 022 05(0122) 1350 Tennessee 702 014 12(0327) 729Kentucky 742 018 04(0116) 1352 Texas 640 007 30(2342) -215Louisiana 677 017 23(0637) 356 Utah 679 024 22(0346) 387Maine 638 027 32(0949) -240 Vermont 636 041 33(0350) -277Maryland 633 014 35(2148) -323 Virginia 611 012 46(2849) -661Massachusetts 622 013 39(2548) -482 Washington 640 013 29(2047) -209Michigan 685 011 18(0829) 476 West Virginia 749 025 02(0123) 1449Minnesota 691 015 16(0430) 564 Wisconsin 727 015 06(0219) 1110Mississippi 692 021 15(0337) 580 Wyoming 721 049 07(0148) 1028Missouri 711 014 11(0324) 874
Table 1326Leukemia
Age-Adjusted Cancer Deatha Rates By State All Races 2012-2016
Males and Females
SEER Cancer Statistics Review 1975-2016 National Cancer Institute
a US Mortality Files National Center for Health Statistics Centers for Disease Control andPrevention Rates are per 100000 and are age-adjusted to the 2000 US Std Population (19age groups - Census P25-1130)
b Difference between state rate and total US rate is statistically significant (plt=0002)c Absolute percent difference between state rate and total US rate is 15 or mored Rank of state level death rate and the 95 confidence intervals (low high) for the rankSE Standard error of the ratePD Percent difference between state rate and total US rate- Statistic not shown Rate based on less than 16 cases for the time interval
State Rate SE Rank(CI)d PD TOTAL US 876 003
High Five StatesOklahoma 1022 034 01(0120) 1669c
Kansas 1018 039 02(0123) 1625c
Arkansas 991 037 03(0127) 1309South Dakota 985 068 04(0147) 1249Delaware 984 065 05(0144) 1236
Low Five StatesMontana 795 053 47(1150) -921New Mexico 759 039 48(2650) -1336Alaska 711 081 49(0851) -1887c
DC 704 078 50(1051) -1959c
Hawaii 593 040 51(4951) -3228c
State Rate SE Rank(CI)d PD State Rate SE Rank(CI)d PD
Alabama 939 029 17(0233) 725 Montana 795 053 47(1150) -921Alaska 711 081 49(0851) -1887c Nebraska 958 046 12(0141) 935Arizona 827 022 41(2449) -555 Nevada 858 037 33(0849) -210Arkansas 991 037 03(0127) 1309 New Hampshire 884 051 25(0149) 088California 811 010 43(3348) -738 New Jersey 810 020 44(2749) -747Colorado 834 028 39(2049) -484 New Mexico 759 039 48(2650) -1336Connecticut 837 031 37(1549) -441 New York 842 013 35(2546) -387Delaware 984 065 05(0144) 1236 North Carolina 863 020 31(1945) -149DC 704 078 50(1051) -1959c North Dakota 873 070 27(0150) -030Florida 839 012 36(2645) -422 Ohio 931 018 19(0529) 627Georgia 817 021 42(2649) -677 Oklahoma 1022 034 01(0120) 1669c
Hawaii 593 040 51(4951) -3228c Oregon 866 029 29(1147) -112Idaho 846 047 34(0550) -339 Pennsylvania 912 016 21(0931) 416Illinois 928 018 20(0529) 594 Rhode Island 911 059 22(0149) 400Indiana 960 025 11(0127) 959 South Carolina 951 029 13(0131) 853Iowa 961 035 08(0131) 969 South Dakota 985 068 04(0147) 1249Kansas 1018 039 02(0123) 1625c Tennessee 960 025 10(0127) 959Kentucky 949 031 15(0133) 832 Texas 870 013 28(2139) -069Louisiana 906 030 23(0442) 342 Utah 865 041 30(0549) -122Maine 803 046 46(1450) -836 Vermont 874 074 26(0150) -026Maryland 861 026 32(1447) -176 Virginia 809 021 45(2650) -770Massachusetts 830 023 40(2349) -529 Washington 835 023 38(2248) -463Michigan 937 020 18(0428) 702 West Virginia 972 044 06(0135) 1095Minnesota 948 027 16(0229) 826 Wisconsin 960 026 09(0127) 961Mississippi 970 039 07(0132) 1077 Wyoming 885 081 24(0150) 102Missouri 951 025 14(0228) 852
Table 1327Leukemia
Age-Adjusted Cancer Deatha Rates By State All Races 2012-2016
Males
SEER Cancer Statistics Review 1975-2016 National Cancer Institute
a US Mortality Files National Center for Health Statistics Centers for Disease Control andPrevention Rates are per 100000 and are age-adjusted to the 2000 US Std Population (19age groups - Census P25-1130)
b Difference between state rate and total US rate is statistically significant (plt=0002)c Absolute percent difference between state rate and total US rate is 15 or mored Rank of state level death rate and the 95 confidence intervals (low high) for the rankSE Standard error of the ratePD Percent difference between state rate and total US rate- Statistic not shown Rate based on less than 16 cases for the time interval
State Rate SE Rank(CI)d PD TOTAL US 489 002
High Five StatesOklahoma 615 023 01(0108) 2584c
Wyoming 596 060 02(0147) 2194c
Kentucky 592 021 03(0111) 2126c
West Virginia 576 030 04(0126) 1792c
South Dakota 564 047 05(0145) 1551c
Low Five StatesColorado 441 018 47(2250) -972Delaware 428 037 48(0751) -1247New Mexico 400 025 49(3151) -1803c
DC 381 046 50(1251) -2203c
Hawaii 362 029 51(4151) -2598c
State Rate SE Rank(CI)d PD State Rate SE Rank(CI)d PD
Alabama 512 019 18(0440) 483 Montana 452 037 43(0551) -745Alaska 485 062 27(0151) -073 Nebraska 531 030 10(0144) 864Arizona 473 015 31(1347) -308 Nevada 455 025 42(1150) -695Arkansas 516 024 15(0344) 554 New Hampshire 449 033 45(0651) -807California 470 007 34(2345) -383 New Jersey 478 013 30(1346) -223Colorado 441 018 47(2250) -972 New Mexico 400 025 49(3151) -1803c
Connecticut 465 020 40(1249) -487 New York 466 009 38(2246) -456Delaware 428 037 48(0751) -1247 North Carolina 471 012 32(1747) -350DC 381 046 50(1251) -2203c North Dakota 479 046 28(0151) -189Florida 460 008 41(2647) -582 Ohio 520 012 12(0529) 653Georgia 467 013 37(1747) -433 Oklahoma 615 023 01(0108) 2584c
Hawaii 362 029 51(4151) -2598c Oregon 449 019 44(1850) -799Idaho 497 033 22(0249) 174 Pennsylvania 516 011 14(0629) 556Illinois 514 011 16(0631) 526 Rhode Island 471 037 33(0351) -363Indiana 540 017 07(0226) 1052 South Carolina 495 018 23(0645) 133Iowa 498 022 20(0547) 200 South Dakota 564 047 05(0145) 1551c
Kansas 539 025 08(0137) 1032 Tennessee 517 016 13(0435) 590Kentucky 592 021 03(0111) 2126c Texas 467 008 36(2246) -431Louisiana 514 020 17(0442) 520 Utah 526 029 11(0146) 778Maine 508 032 19(0248) 403 Vermont 444 045 46(0351) -906Maryland 470 016 35(1448) -389 Virginia 465 014 39(1848) -474Massachusetts 478 015 29(1247) -220 Washington 487 016 25(0946) -022Michigan 498 013 21(0939) 192 West Virginia 576 030 04(0126) 1792c
Minnesota 494 017 24(0745) 121 Wisconsin 545 017 06(0225) 1162Mississippi 485 023 26(0548) -067 Wyoming 596 060 02(0147) 2194c
Missouri 535 017 09(0327) 953
Table 1328Leukemia
Age-Adjusted Cancer Deatha Rates By State All Races 2012-2016
Females
SEE
R C
ancer Statistics Review
1975-2016N
ational Cancer Institute
a US 2016 cancer prevalence counts are based on 2016 cancer prevalence proportions from the SEER 13 Areas (excluding the AlaskaNative Registry) and 112016 US population estimates based on the average of 2015 and 2016 population estimates from theUS Bureau of the CensusPrevalence was calculated using the first invasive tumor for each cancer site diagnosed during the previous 24 years
b Maximum limited-duration prevalence is 24 years for 1992-2016 datac Percentages are age-adjusted to the 2000 US Standard Population (19 age groups - Census P25-1130) by 5-year age groupsd Cases diagnosed more than 24 years ago were estimated using the completeness index method (Capocaccia et al 1997
Merrill et al 2000)e Complete prevalence is obtained by summing 0 to lt24 and gt=24- Statistic not shown Statistic based on fewer than 5 cases estimated alive in SEER for the time interval+ Not available
Years Since Diagnosis 0 to lt5 5 to lt10 10 to lt15 15 to lt20 20 to lt24 0 to lt24b gt=24d Completee
Race Sex All Races Both Sexes 153253 100309 63581 38012 21353 376508 38265 414773
Males 90192 57683 36029 21220 12020 217145 18411 235556Females 63061 42625 27552 16792 9333 159363 19854 179217
White Both Sexes 132173 87961 56051 33596 19035 328814 32999 370135Males 78368 50894 32033 18770 10845 190910 15102 210930Females 53805 37067 24018 14826 8190 137905 17897 159205
Black Both Sexes 12734 6564 4233 2487 1259 27277 4070 31347Males 6847 3556 2204 1334 637 14578 1776 16354Females 5887 3008 2029 1153 622 12699 2294 14992
Asian Both Sexes 3926 2561 1778 1164 690 10120 + +Pacific Males 2235 1462 936 646 351 5630 + +Islander Females 1691 1100 842 519 339 4490 + +
Hispanic Both Sexes 14464 9581 6796 4462 2630 37933 + +Males 8166 5374 3794 2408 1538 21280 + +Females 6298 4207 3002 2055 1092 16654 + +
Age Specific (Crude) Age-Adjustedc Age at Prevalence All Ages 0-9 10-19 20-29 30-39 40-49 50-59 60-69 70-79 80+ All Ages
Race Sex All Races Both Sexes 01168 00328 00640 00628 00377 00561 01053 02263 04023 05111 01054
Males 01369 00339 00706 00685 00419 00657 01287 02888 05282 07048 01306Females 00974 00317 00572 00570 00333 00466 00829 01696 02974 03919 00844
White Both Sexes 01304 00369 00715 00712 00410 00584 01106 02389 04249 05386 01127Males 01528 00379 00789 00771 00457 00682 01349 03042 05558 07387 01389Females 01084 00359 00637 00650 00362 00484 00869 01784 03135 04133 00904
Black Both Sexes 00605 00145 00322 00320 00267 00463 00752 01455 02470 03076 00660Males 00674 00142 00357 00338 00281 00530 00919 01737 03249 04580 00816Females 00541 00148 00286 00301 00255 00402 00605 01230 01927 02334 00552
Asian Both Sexes 00497 00264 00531 00426 00230 00390 00553 00882 01245 01389 00513Pacific Males 00577 00298 00555 00507 00249 00461 00665 01122 01552 01904 00613Islander Females 00423 00228 00507 00345 00212 00327 00456 00688 00999 01057 00430
Hispanic Both Sexes 00664 00375 00737 00728 00395 00485 00723 01191 01987 02074 00746Males 00737 00397 00827 00807 00471 00576 00831 01350 02221 02551 00854Females 00589 00352 00642 00641 00312 00391 00617 01050 01809 01780 00647
Table 1329Leukemia
Estimated United States Cancer Prevalence Countsa on January 1 2016By RaceEthnicity Sex and Years Since Diagnosis
Estimated prevalence percenta on January 1 2016 of the SEER population diagnosed in the previous 24 yearsBy Age at Prevalence RaceEthnicity and Sex
SEE
R C
ancer Statistics Review
1975-2016N
ational Cancer Institute
a US 2016 cancer prevalence counts are based on 2016 cancer prevalence proportions from the SEER 13 Areas (excluding the AlaskaNative Registry) and 112016 US population estimates based on the average of 2015 and 2016 population estimates from theUS Bureau of the CensusPrevalence was calculated using the first invasive tumor for each cancer site diagnosed during the previous 24 years
b Maximum limited-duration prevalence is 24 years for 1992-2016 datac Percentages are age-adjusted to the 2000 US Standard Population (19 age groups - Census P25-1130) by 5-year age groupsd Cases diagnosed more than 24 years ago were estimated using the completeness index method (Capocaccia et al 1997
Merrill et al 2000)e Complete prevalence is obtained by summing 0 to lt24 and gt=24- Statistic not shown Statistic based on fewer than 5 cases estimated alive in SEER for the time interval+ Not available
Years Since Diagnosis 0 to lt5 5 to lt10 10 to lt15 15 to lt20 20 to lt24 0 to lt24b gt=24d Completee
Race Sex All Races Both Sexes 20277 16033 13721 12074 8203 70308 25456 95764
Males 11203 9049 7751 6542 4634 39179 12997 52176Females 9074 6984 5971 5531 3568 31129 12460 43589
White Both Sexes 17123 13855 11870 10663 7154 60665 21823 83282Males 9549 7741 6768 5696 4084 33839 11286 45559Females 7573 6114 5102 4967 3070 26826 10537 37723
Black Both Sexes 1590 1133 923 727 553 4926 1609 6535Males 809 734 473 411 290 2716 592 3308Females 781 399 450 317 263 2210 1017 3227
Asian Both Sexes 998 720 669 486 361 3234 + +Pacific Males 527 406 369 313 178 1793 + +Islander Females 472 314 300 173 183 1441 + +
Hispanic Both Sexes 5905 4543 3352 2717 1749 18266 + +Males 3302 2686 1899 1465 1058 10409 + +Females 2603 1857 1454 1252 692 7857 + +
Age Specific (Crude) Age-Adjustedc Age at Prevalence All Ages 0-9 10-19 20-29 30-39 40-49 50-59 60-69 70-79 80+ All Ages
Race Sex All Races Both Sexes 00218 00276 00541 00467 00139 00078 00059 00065 00053 00033 00228
Males 00247 00286 00591 00520 00163 00095 00066 00069 00056 00035 00251Females 00190 00266 00488 00410 00115 00062 00053 00062 00050 00032 00204
White Both Sexes 00241 00315 00612 00542 00161 00086 00063 00070 00056 00033 00259Males 00271 00323 00670 00598 00186 00107 00069 00074 00060 00032 00284Females 00211 00306 00551 00482 00135 00064 00057 00066 00053 00033 00232
Black Both Sexes 00109 00107 00250 00197 00067 00042 00039 00029 00012 00027 00102Males 00126 00112 00281 00224 00079 00035 00052 00026 00012 00027 00112Females 00094 00102 00219 00171 00056 00047 00028 00032 00013 00027 00092
Asian Both Sexes 00159 00208 00418 00289 00071 00064 00045 00050 00054 00036 00163Pacific Males 00184 00226 00427 00360 00086 00069 00055 00054 00033 00055 00180Islander Females 00136 00190 00408 00219 00058 00059 00036 00047 00071 00023 00146
Hispanic Both Sexes 00320 00328 00637 00574 00165 00107 00093 00100 00084 00012 00279Males 00361 00342 00710 00648 00205 00131 00110 00063 00072 - 00309Females 00278 00312 00562 00494 00122 00082 00077 00133 00093 00020 00246
Table 1330Acute Lymphocytic Leukemia
Estimated United States Cancer Prevalence Countsa on January 1 2016By RaceEthnicity Sex and Years Since Diagnosis
Estimated prevalence percenta on January 1 2016 of the SEER population diagnosed in the previous 24 yearsBy Age at Prevalence RaceEthnicity and Sex
0
5
10
15
20
25
1975 1985 1995 2005 20160
5
10
15
20
25
1975 1985 1995 2005 20160
3
6
9
12
15
1975 1985 1995 2005 20160
3
6
9
12
15
1975 1985 1995 2005 2016
Delay-Adj IncidenceDelay-Adj Incidence
Observed IncidenceObserved Incidence
MortalityMortality
SEER Observed Incidence SEER Delay Adjusted Incidence and US Death RatesLeukemia by Race and Sex
a
Figure 131
Source SEER 9 areas and US Mortality Files (National Center for Health Statistics CDC)Rates are age-adjusted to the 2000 US Std Population (19 age groups - Census P25-1103)Regression lines and APCs are calculated using the Joinpoint Regression Program Version 47 February 2019 National Cancer InstituteThe APC is the Annual Percent Change for the regression line segments The APC shown on the graph is for the most recent trendThe APC is significantly different from zero (p lt 005)
a
White Male Black Male White Female Black FemaleRate per 100000 Rate per 100000 Rate per 100000 Rate per 100000
Year of DiagnosisDeath Year of DiagnosisDeath Year of DiagnosisDeath Year of DiagnosisDeath
SEER Incidence APCsDelay Adj 1998-16 = 08Observed 1975-16 = 03
US Mortality APC2013-16 = -30
SEER Incidence APCsDelay Adj 1975-16 = 02Observed 1975-16 = 01
US Mortality APC1993-16 = -15
SEER Incidence APCsDelay Adj 1975-16 = 06Observed 1975-16 = 05
US Mortality APC2000-16 = -12
SEER Incidence APCsDelay Adj 1975-16 = 03Observed 1975-16 = 02
US Mortality APC1993-16 = -13
SEE
R C
ancer Statistics Review
1975-2016N
ational Cancer Institute
0
1
2
3
4
5
6
7
8
1975 1985 1995 2005 20160
1
2
3
4
5
6
7
8
1975 1985 1995 2005 20160
1
2
3
4
5
6
7
8
1975 1985 1995 2005 20160
1
2
3
4
5
6
7
8
1975 1985 1995 2005 2016
Chronic
Acute
SEER Observed Incidence RatesLymphocytic and Myeloid Leukemia (Acute and Chronic) by Sex
a
Figure 132
Source SEER 9 areas Rates are age-adjusted to the 2000 US Std Population (19 age groups - Census P25-1103)Regression lines and APCs are calculated using the Joinpoint Regression Program Version 47 February 2019 National Cancer Institute
a
Male Female Male FemaleLymphocytic Leukemia Myeloid Leukemia
Rate per 100000 Rate per 100000 Rate per 100000 Rate per 100000
Year of Diagnosis Year of Diagnosis Year of Diagnosis Year of Diagnosis
SEE
R C
ancer Statistics Review
1975-2016N
ational Cancer Institute
Joinpoint Analyses for Whites and Blacks from 1975-2016and for AsianPacific Islanders American IndiansAlaska Natives and Hispanics from 2000-2016
0
5
10
15
20
1975 1985 1995 2005 20160
5
10
15
20
1975 1985 1995 2005 2016
White
Black
API
AIAN
Hispanic
SEER Incidence and US Death RatesLeukemia Both Sexes
Figure 133
Source Incidence data for whites and blacks are from the SEER 9 areas (San Francisco Connecticut Detroit Hawaii Iowa New Mexico Seattle Utah Atlanta)Incidence data for AsianPacific Islanders American IndiansAlaska Natives and Hispanics are from the SEER 21 areas (SEER 9 areas San Jose-MontereyLos Angeles Alaska Native Registry Rural Georgia California excluding SFSJMLA Kentucky Louisiana New Jersey Georgia excluding ATLRG Idaho New York andMassachusetts)Mortality data are from US Mortality Files National Center for Health Statistics CDCRates are age-adjusted to the 2000 US Std Population (19 age groups - Census P25-1103)Regression lines are calculated using the Joinpoint Regression Program Version 47 February 2019 National Cancer Institute Joinpoint analyses for Whites andBlacks during the 1975-2016 period allow a maximum of 5 joinpoints Analyses for other ethnic groups during the period 2000-2016 allow a maximum of 3 joinpointsAPI = AsianPacific IslanderAIAN = American IndianAlaska Native Rates for American IndianAlaska Native are based on the PurchasedReferred Care Delivery Area (PRCDA) countiesHispanic is not mutually exclusive from whites blacks AsianPacific Islanders and American IndiansAlaska Natives Incidence data for Hispanics are based onNHIA and exclude cases from the Alaska Native Registry
Incidence MortalityRate per 100000 Rate per 100000
Year of Diagnosis Year of Death
a
d
a
b
c
c
b
d
SEE
R C
ancer Statistics Review
1975-2016N
ational Cancer Institute
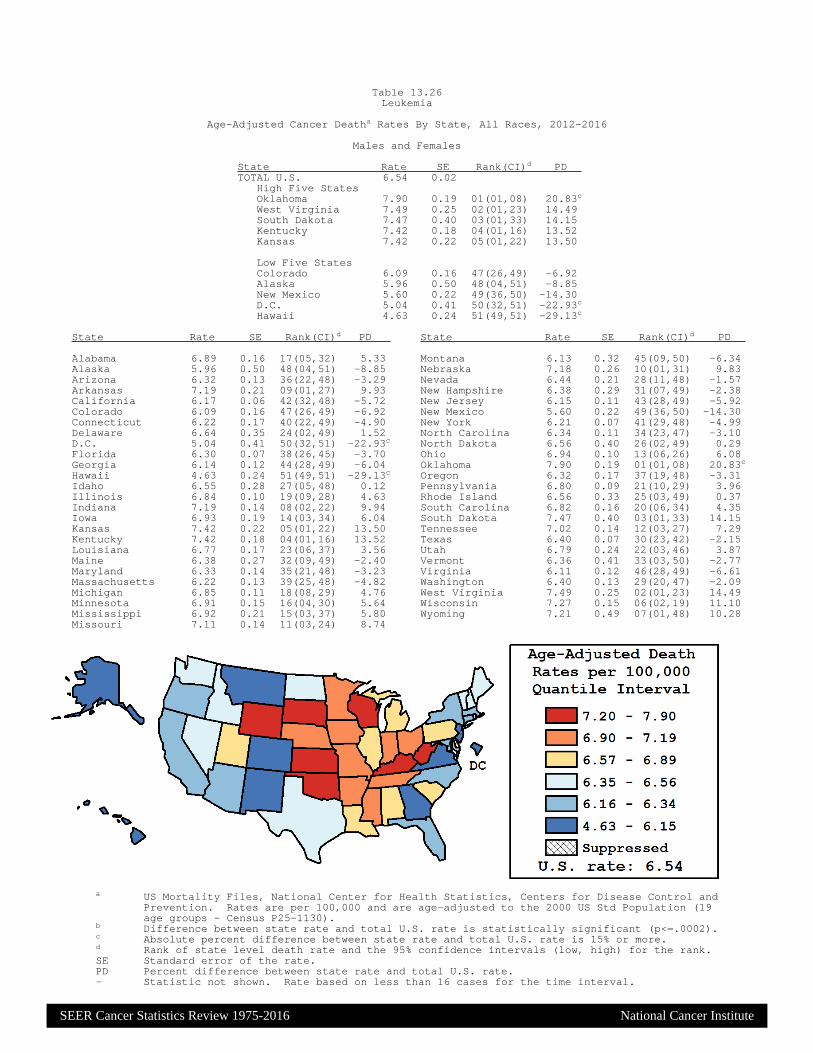
SEER Cancer Statistics Review 1975-2016 National Cancer Institute
a US Mortality Files National Center for Health Statistics Centers for Disease Control andPrevention Rates are per 100000 and are age-adjusted to the 2000 US Std Population (19age groups - Census P25-1130)
b Difference between state rate and total US rate is statistically significant (plt=0002)c Absolute percent difference between state rate and total US rate is 15 or mored Rank of state level death rate and the 95 confidence intervals (low high) for the rankSE Standard error of the ratePD Percent difference between state rate and total US rate- Statistic not shown Rate based on less than 16 cases for the time interval
State Rate SE Rank(CI)d PD TOTAL US 654 002
High Five StatesOklahoma 790 019 01(0108) 2083c
West Virginia 749 025 02(0123) 1449South Dakota 747 040 03(0133) 1415Kentucky 742 018 04(0116) 1352Kansas 742 022 05(0122) 1350
Low Five StatesColorado 609 016 47(2649) -692Alaska 596 050 48(0451) -885New Mexico 560 022 49(3650) -1430DC 504 041 50(3251) -2293c
Hawaii 463 024 51(4951) -2913c
State Rate SE Rank(CI)d PD State Rate SE Rank(CI)d PD
Alabama 689 016 17(0532) 533 Montana 613 032 45(0950) -634Alaska 596 050 48(0451) -885 Nebraska 718 026 10(0131) 983Arizona 632 013 36(2248) -329 Nevada 644 021 28(1148) -157Arkansas 719 021 09(0127) 993 New Hampshire 638 029 31(0749) -238California 617 006 42(3248) -572 New Jersey 615 011 43(2849) -592Colorado 609 016 47(2649) -692 New Mexico 560 022 49(3650) -1430Connecticut 622 017 40(2249) -490 New York 621 007 41(2948) -499Delaware 664 035 24(0249) 152 North Carolina 634 011 34(2347) -310DC 504 041 50(3251) -2293c North Dakota 656 040 26(0249) 029Florida 630 007 38(2645) -370 Ohio 694 010 13(0626) 608Georgia 614 012 44(2849) -604 Oklahoma 790 019 01(0108) 2083c
Hawaii 463 024 51(4951) -2913c Oregon 632 017 37(1948) -331Idaho 655 028 27(0548) 012 Pennsylvania 680 009 21(1029) 396Illinois 684 010 19(0928) 463 Rhode Island 656 033 25(0349) 037Indiana 719 014 08(0222) 994 South Carolina 682 016 20(0634) 435Iowa 693 019 14(0334) 604 South Dakota 747 040 03(0133) 1415Kansas 742 022 05(0122) 1350 Tennessee 702 014 12(0327) 729Kentucky 742 018 04(0116) 1352 Texas 640 007 30(2342) -215Louisiana 677 017 23(0637) 356 Utah 679 024 22(0346) 387Maine 638 027 32(0949) -240 Vermont 636 041 33(0350) -277Maryland 633 014 35(2148) -323 Virginia 611 012 46(2849) -661Massachusetts 622 013 39(2548) -482 Washington 640 013 29(2047) -209Michigan 685 011 18(0829) 476 West Virginia 749 025 02(0123) 1449Minnesota 691 015 16(0430) 564 Wisconsin 727 015 06(0219) 1110Mississippi 692 021 15(0337) 580 Wyoming 721 049 07(0148) 1028Missouri 711 014 11(0324) 874
Table 1326Leukemia
Age-Adjusted Cancer Deatha Rates By State All Races 2012-2016
Males and Females
SEER Cancer Statistics Review 1975-2016 National Cancer Institute
a US Mortality Files National Center for Health Statistics Centers for Disease Control andPrevention Rates are per 100000 and are age-adjusted to the 2000 US Std Population (19age groups - Census P25-1130)
b Difference between state rate and total US rate is statistically significant (plt=0002)c Absolute percent difference between state rate and total US rate is 15 or mored Rank of state level death rate and the 95 confidence intervals (low high) for the rankSE Standard error of the ratePD Percent difference between state rate and total US rate- Statistic not shown Rate based on less than 16 cases for the time interval
State Rate SE Rank(CI)d PD TOTAL US 876 003
High Five StatesOklahoma 1022 034 01(0120) 1669c
Kansas 1018 039 02(0123) 1625c
Arkansas 991 037 03(0127) 1309South Dakota 985 068 04(0147) 1249Delaware 984 065 05(0144) 1236
Low Five StatesMontana 795 053 47(1150) -921New Mexico 759 039 48(2650) -1336Alaska 711 081 49(0851) -1887c
DC 704 078 50(1051) -1959c
Hawaii 593 040 51(4951) -3228c
State Rate SE Rank(CI)d PD State Rate SE Rank(CI)d PD
Alabama 939 029 17(0233) 725 Montana 795 053 47(1150) -921Alaska 711 081 49(0851) -1887c Nebraska 958 046 12(0141) 935Arizona 827 022 41(2449) -555 Nevada 858 037 33(0849) -210Arkansas 991 037 03(0127) 1309 New Hampshire 884 051 25(0149) 088California 811 010 43(3348) -738 New Jersey 810 020 44(2749) -747Colorado 834 028 39(2049) -484 New Mexico 759 039 48(2650) -1336Connecticut 837 031 37(1549) -441 New York 842 013 35(2546) -387Delaware 984 065 05(0144) 1236 North Carolina 863 020 31(1945) -149DC 704 078 50(1051) -1959c North Dakota 873 070 27(0150) -030Florida 839 012 36(2645) -422 Ohio 931 018 19(0529) 627Georgia 817 021 42(2649) -677 Oklahoma 1022 034 01(0120) 1669c
Hawaii 593 040 51(4951) -3228c Oregon 866 029 29(1147) -112Idaho 846 047 34(0550) -339 Pennsylvania 912 016 21(0931) 416Illinois 928 018 20(0529) 594 Rhode Island 911 059 22(0149) 400Indiana 960 025 11(0127) 959 South Carolina 951 029 13(0131) 853Iowa 961 035 08(0131) 969 South Dakota 985 068 04(0147) 1249Kansas 1018 039 02(0123) 1625c Tennessee 960 025 10(0127) 959Kentucky 949 031 15(0133) 832 Texas 870 013 28(2139) -069Louisiana 906 030 23(0442) 342 Utah 865 041 30(0549) -122Maine 803 046 46(1450) -836 Vermont 874 074 26(0150) -026Maryland 861 026 32(1447) -176 Virginia 809 021 45(2650) -770Massachusetts 830 023 40(2349) -529 Washington 835 023 38(2248) -463Michigan 937 020 18(0428) 702 West Virginia 972 044 06(0135) 1095Minnesota 948 027 16(0229) 826 Wisconsin 960 026 09(0127) 961Mississippi 970 039 07(0132) 1077 Wyoming 885 081 24(0150) 102Missouri 951 025 14(0228) 852
Table 1327Leukemia
Age-Adjusted Cancer Deatha Rates By State All Races 2012-2016
Males
SEER Cancer Statistics Review 1975-2016 National Cancer Institute
a US Mortality Files National Center for Health Statistics Centers for Disease Control andPrevention Rates are per 100000 and are age-adjusted to the 2000 US Std Population (19age groups - Census P25-1130)
b Difference between state rate and total US rate is statistically significant (plt=0002)c Absolute percent difference between state rate and total US rate is 15 or mored Rank of state level death rate and the 95 confidence intervals (low high) for the rankSE Standard error of the ratePD Percent difference between state rate and total US rate- Statistic not shown Rate based on less than 16 cases for the time interval
State Rate SE Rank(CI)d PD TOTAL US 489 002
High Five StatesOklahoma 615 023 01(0108) 2584c
Wyoming 596 060 02(0147) 2194c
Kentucky 592 021 03(0111) 2126c
West Virginia 576 030 04(0126) 1792c
South Dakota 564 047 05(0145) 1551c
Low Five StatesColorado 441 018 47(2250) -972Delaware 428 037 48(0751) -1247New Mexico 400 025 49(3151) -1803c
DC 381 046 50(1251) -2203c
Hawaii 362 029 51(4151) -2598c
State Rate SE Rank(CI)d PD State Rate SE Rank(CI)d PD
Alabama 512 019 18(0440) 483 Montana 452 037 43(0551) -745Alaska 485 062 27(0151) -073 Nebraska 531 030 10(0144) 864Arizona 473 015 31(1347) -308 Nevada 455 025 42(1150) -695Arkansas 516 024 15(0344) 554 New Hampshire 449 033 45(0651) -807California 470 007 34(2345) -383 New Jersey 478 013 30(1346) -223Colorado 441 018 47(2250) -972 New Mexico 400 025 49(3151) -1803c
Connecticut 465 020 40(1249) -487 New York 466 009 38(2246) -456Delaware 428 037 48(0751) -1247 North Carolina 471 012 32(1747) -350DC 381 046 50(1251) -2203c North Dakota 479 046 28(0151) -189Florida 460 008 41(2647) -582 Ohio 520 012 12(0529) 653Georgia 467 013 37(1747) -433 Oklahoma 615 023 01(0108) 2584c
Hawaii 362 029 51(4151) -2598c Oregon 449 019 44(1850) -799Idaho 497 033 22(0249) 174 Pennsylvania 516 011 14(0629) 556Illinois 514 011 16(0631) 526 Rhode Island 471 037 33(0351) -363Indiana 540 017 07(0226) 1052 South Carolina 495 018 23(0645) 133Iowa 498 022 20(0547) 200 South Dakota 564 047 05(0145) 1551c
Kansas 539 025 08(0137) 1032 Tennessee 517 016 13(0435) 590Kentucky 592 021 03(0111) 2126c Texas 467 008 36(2246) -431Louisiana 514 020 17(0442) 520 Utah 526 029 11(0146) 778Maine 508 032 19(0248) 403 Vermont 444 045 46(0351) -906Maryland 470 016 35(1448) -389 Virginia 465 014 39(1848) -474Massachusetts 478 015 29(1247) -220 Washington 487 016 25(0946) -022Michigan 498 013 21(0939) 192 West Virginia 576 030 04(0126) 1792c
Minnesota 494 017 24(0745) 121 Wisconsin 545 017 06(0225) 1162Mississippi 485 023 26(0548) -067 Wyoming 596 060 02(0147) 2194c
Missouri 535 017 09(0327) 953
Table 1328Leukemia
Age-Adjusted Cancer Deatha Rates By State All Races 2012-2016
Females
SEE
R C
ancer Statistics Review
1975-2016N
ational Cancer Institute
a US 2016 cancer prevalence counts are based on 2016 cancer prevalence proportions from the SEER 13 Areas (excluding the AlaskaNative Registry) and 112016 US population estimates based on the average of 2015 and 2016 population estimates from theUS Bureau of the CensusPrevalence was calculated using the first invasive tumor for each cancer site diagnosed during the previous 24 years
b Maximum limited-duration prevalence is 24 years for 1992-2016 datac Percentages are age-adjusted to the 2000 US Standard Population (19 age groups - Census P25-1130) by 5-year age groupsd Cases diagnosed more than 24 years ago were estimated using the completeness index method (Capocaccia et al 1997
Merrill et al 2000)e Complete prevalence is obtained by summing 0 to lt24 and gt=24- Statistic not shown Statistic based on fewer than 5 cases estimated alive in SEER for the time interval+ Not available
Years Since Diagnosis 0 to lt5 5 to lt10 10 to lt15 15 to lt20 20 to lt24 0 to lt24b gt=24d Completee
Race Sex All Races Both Sexes 153253 100309 63581 38012 21353 376508 38265 414773
Males 90192 57683 36029 21220 12020 217145 18411 235556Females 63061 42625 27552 16792 9333 159363 19854 179217
White Both Sexes 132173 87961 56051 33596 19035 328814 32999 370135Males 78368 50894 32033 18770 10845 190910 15102 210930Females 53805 37067 24018 14826 8190 137905 17897 159205
Black Both Sexes 12734 6564 4233 2487 1259 27277 4070 31347Males 6847 3556 2204 1334 637 14578 1776 16354Females 5887 3008 2029 1153 622 12699 2294 14992
Asian Both Sexes 3926 2561 1778 1164 690 10120 + +Pacific Males 2235 1462 936 646 351 5630 + +Islander Females 1691 1100 842 519 339 4490 + +
Hispanic Both Sexes 14464 9581 6796 4462 2630 37933 + +Males 8166 5374 3794 2408 1538 21280 + +Females 6298 4207 3002 2055 1092 16654 + +
Age Specific (Crude) Age-Adjustedc Age at Prevalence All Ages 0-9 10-19 20-29 30-39 40-49 50-59 60-69 70-79 80+ All Ages
Race Sex All Races Both Sexes 01168 00328 00640 00628 00377 00561 01053 02263 04023 05111 01054
Males 01369 00339 00706 00685 00419 00657 01287 02888 05282 07048 01306Females 00974 00317 00572 00570 00333 00466 00829 01696 02974 03919 00844
White Both Sexes 01304 00369 00715 00712 00410 00584 01106 02389 04249 05386 01127Males 01528 00379 00789 00771 00457 00682 01349 03042 05558 07387 01389Females 01084 00359 00637 00650 00362 00484 00869 01784 03135 04133 00904
Black Both Sexes 00605 00145 00322 00320 00267 00463 00752 01455 02470 03076 00660Males 00674 00142 00357 00338 00281 00530 00919 01737 03249 04580 00816Females 00541 00148 00286 00301 00255 00402 00605 01230 01927 02334 00552
Asian Both Sexes 00497 00264 00531 00426 00230 00390 00553 00882 01245 01389 00513Pacific Males 00577 00298 00555 00507 00249 00461 00665 01122 01552 01904 00613Islander Females 00423 00228 00507 00345 00212 00327 00456 00688 00999 01057 00430
Hispanic Both Sexes 00664 00375 00737 00728 00395 00485 00723 01191 01987 02074 00746Males 00737 00397 00827 00807 00471 00576 00831 01350 02221 02551 00854Females 00589 00352 00642 00641 00312 00391 00617 01050 01809 01780 00647
Table 1329Leukemia
Estimated United States Cancer Prevalence Countsa on January 1 2016By RaceEthnicity Sex and Years Since Diagnosis
Estimated prevalence percenta on January 1 2016 of the SEER population diagnosed in the previous 24 yearsBy Age at Prevalence RaceEthnicity and Sex
SEE
R C
ancer Statistics Review
1975-2016N
ational Cancer Institute
a US 2016 cancer prevalence counts are based on 2016 cancer prevalence proportions from the SEER 13 Areas (excluding the AlaskaNative Registry) and 112016 US population estimates based on the average of 2015 and 2016 population estimates from theUS Bureau of the CensusPrevalence was calculated using the first invasive tumor for each cancer site diagnosed during the previous 24 years
b Maximum limited-duration prevalence is 24 years for 1992-2016 datac Percentages are age-adjusted to the 2000 US Standard Population (19 age groups - Census P25-1130) by 5-year age groupsd Cases diagnosed more than 24 years ago were estimated using the completeness index method (Capocaccia et al 1997
Merrill et al 2000)e Complete prevalence is obtained by summing 0 to lt24 and gt=24- Statistic not shown Statistic based on fewer than 5 cases estimated alive in SEER for the time interval+ Not available
Years Since Diagnosis 0 to lt5 5 to lt10 10 to lt15 15 to lt20 20 to lt24 0 to lt24b gt=24d Completee
Race Sex All Races Both Sexes 20277 16033 13721 12074 8203 70308 25456 95764
Males 11203 9049 7751 6542 4634 39179 12997 52176Females 9074 6984 5971 5531 3568 31129 12460 43589
White Both Sexes 17123 13855 11870 10663 7154 60665 21823 83282Males 9549 7741 6768 5696 4084 33839 11286 45559Females 7573 6114 5102 4967 3070 26826 10537 37723
Black Both Sexes 1590 1133 923 727 553 4926 1609 6535Males 809 734 473 411 290 2716 592 3308Females 781 399 450 317 263 2210 1017 3227
Asian Both Sexes 998 720 669 486 361 3234 + +Pacific Males 527 406 369 313 178 1793 + +Islander Females 472 314 300 173 183 1441 + +
Hispanic Both Sexes 5905 4543 3352 2717 1749 18266 + +Males 3302 2686 1899 1465 1058 10409 + +Females 2603 1857 1454 1252 692 7857 + +
Age Specific (Crude) Age-Adjustedc Age at Prevalence All Ages 0-9 10-19 20-29 30-39 40-49 50-59 60-69 70-79 80+ All Ages
Race Sex All Races Both Sexes 00218 00276 00541 00467 00139 00078 00059 00065 00053 00033 00228
Males 00247 00286 00591 00520 00163 00095 00066 00069 00056 00035 00251Females 00190 00266 00488 00410 00115 00062 00053 00062 00050 00032 00204
White Both Sexes 00241 00315 00612 00542 00161 00086 00063 00070 00056 00033 00259Males 00271 00323 00670 00598 00186 00107 00069 00074 00060 00032 00284Females 00211 00306 00551 00482 00135 00064 00057 00066 00053 00033 00232
Black Both Sexes 00109 00107 00250 00197 00067 00042 00039 00029 00012 00027 00102Males 00126 00112 00281 00224 00079 00035 00052 00026 00012 00027 00112Females 00094 00102 00219 00171 00056 00047 00028 00032 00013 00027 00092
Asian Both Sexes 00159 00208 00418 00289 00071 00064 00045 00050 00054 00036 00163Pacific Males 00184 00226 00427 00360 00086 00069 00055 00054 00033 00055 00180Islander Females 00136 00190 00408 00219 00058 00059 00036 00047 00071 00023 00146
Hispanic Both Sexes 00320 00328 00637 00574 00165 00107 00093 00100 00084 00012 00279Males 00361 00342 00710 00648 00205 00131 00110 00063 00072 - 00309Females 00278 00312 00562 00494 00122 00082 00077 00133 00093 00020 00246
Table 1330Acute Lymphocytic Leukemia
Estimated United States Cancer Prevalence Countsa on January 1 2016By RaceEthnicity Sex and Years Since Diagnosis
Estimated prevalence percenta on January 1 2016 of the SEER population diagnosed in the previous 24 yearsBy Age at Prevalence RaceEthnicity and Sex
0
5
10
15
20
25
1975 1985 1995 2005 20160
5
10
15
20
25
1975 1985 1995 2005 20160
3
6
9
12
15
1975 1985 1995 2005 20160
3
6
9
12
15
1975 1985 1995 2005 2016
Delay-Adj IncidenceDelay-Adj Incidence
Observed IncidenceObserved Incidence
MortalityMortality
SEER Observed Incidence SEER Delay Adjusted Incidence and US Death RatesLeukemia by Race and Sex
a
Figure 131
Source SEER 9 areas and US Mortality Files (National Center for Health Statistics CDC)Rates are age-adjusted to the 2000 US Std Population (19 age groups - Census P25-1103)Regression lines and APCs are calculated using the Joinpoint Regression Program Version 47 February 2019 National Cancer InstituteThe APC is the Annual Percent Change for the regression line segments The APC shown on the graph is for the most recent trendThe APC is significantly different from zero (p lt 005)
a
White Male Black Male White Female Black FemaleRate per 100000 Rate per 100000 Rate per 100000 Rate per 100000
Year of DiagnosisDeath Year of DiagnosisDeath Year of DiagnosisDeath Year of DiagnosisDeath
SEER Incidence APCsDelay Adj 1998-16 = 08Observed 1975-16 = 03
US Mortality APC2013-16 = -30
SEER Incidence APCsDelay Adj 1975-16 = 02Observed 1975-16 = 01
US Mortality APC1993-16 = -15
SEER Incidence APCsDelay Adj 1975-16 = 06Observed 1975-16 = 05
US Mortality APC2000-16 = -12
SEER Incidence APCsDelay Adj 1975-16 = 03Observed 1975-16 = 02
US Mortality APC1993-16 = -13
SEE
R C
ancer Statistics Review
1975-2016N
ational Cancer Institute
0
1
2
3
4
5
6
7
8
1975 1985 1995 2005 20160
1
2
3
4
5
6
7
8
1975 1985 1995 2005 20160
1
2
3
4
5
6
7
8
1975 1985 1995 2005 20160
1
2
3
4
5
6
7
8
1975 1985 1995 2005 2016
Chronic
Acute
SEER Observed Incidence RatesLymphocytic and Myeloid Leukemia (Acute and Chronic) by Sex
a
Figure 132
Source SEER 9 areas Rates are age-adjusted to the 2000 US Std Population (19 age groups - Census P25-1103)Regression lines and APCs are calculated using the Joinpoint Regression Program Version 47 February 2019 National Cancer Institute
a
Male Female Male FemaleLymphocytic Leukemia Myeloid Leukemia
Rate per 100000 Rate per 100000 Rate per 100000 Rate per 100000
Year of Diagnosis Year of Diagnosis Year of Diagnosis Year of Diagnosis
SEE
R C
ancer Statistics Review
1975-2016N
ational Cancer Institute
Joinpoint Analyses for Whites and Blacks from 1975-2016and for AsianPacific Islanders American IndiansAlaska Natives and Hispanics from 2000-2016
0
5
10
15
20
1975 1985 1995 2005 20160
5
10
15
20
1975 1985 1995 2005 2016
White
Black
API
AIAN
Hispanic
SEER Incidence and US Death RatesLeukemia Both Sexes
Figure 133
Source Incidence data for whites and blacks are from the SEER 9 areas (San Francisco Connecticut Detroit Hawaii Iowa New Mexico Seattle Utah Atlanta)Incidence data for AsianPacific Islanders American IndiansAlaska Natives and Hispanics are from the SEER 21 areas (SEER 9 areas San Jose-MontereyLos Angeles Alaska Native Registry Rural Georgia California excluding SFSJMLA Kentucky Louisiana New Jersey Georgia excluding ATLRG Idaho New York andMassachusetts)Mortality data are from US Mortality Files National Center for Health Statistics CDCRates are age-adjusted to the 2000 US Std Population (19 age groups - Census P25-1103)Regression lines are calculated using the Joinpoint Regression Program Version 47 February 2019 National Cancer Institute Joinpoint analyses for Whites andBlacks during the 1975-2016 period allow a maximum of 5 joinpoints Analyses for other ethnic groups during the period 2000-2016 allow a maximum of 3 joinpointsAPI = AsianPacific IslanderAIAN = American IndianAlaska Native Rates for American IndianAlaska Native are based on the PurchasedReferred Care Delivery Area (PRCDA) countiesHispanic is not mutually exclusive from whites blacks AsianPacific Islanders and American IndiansAlaska Natives Incidence data for Hispanics are based onNHIA and exclude cases from the Alaska Native Registry
Incidence MortalityRate per 100000 Rate per 100000
Year of Diagnosis Year of Death
a
d
a
b
c
c
b
d
SEE
R C
ancer Statistics Review
1975-2016N
ational Cancer Institute
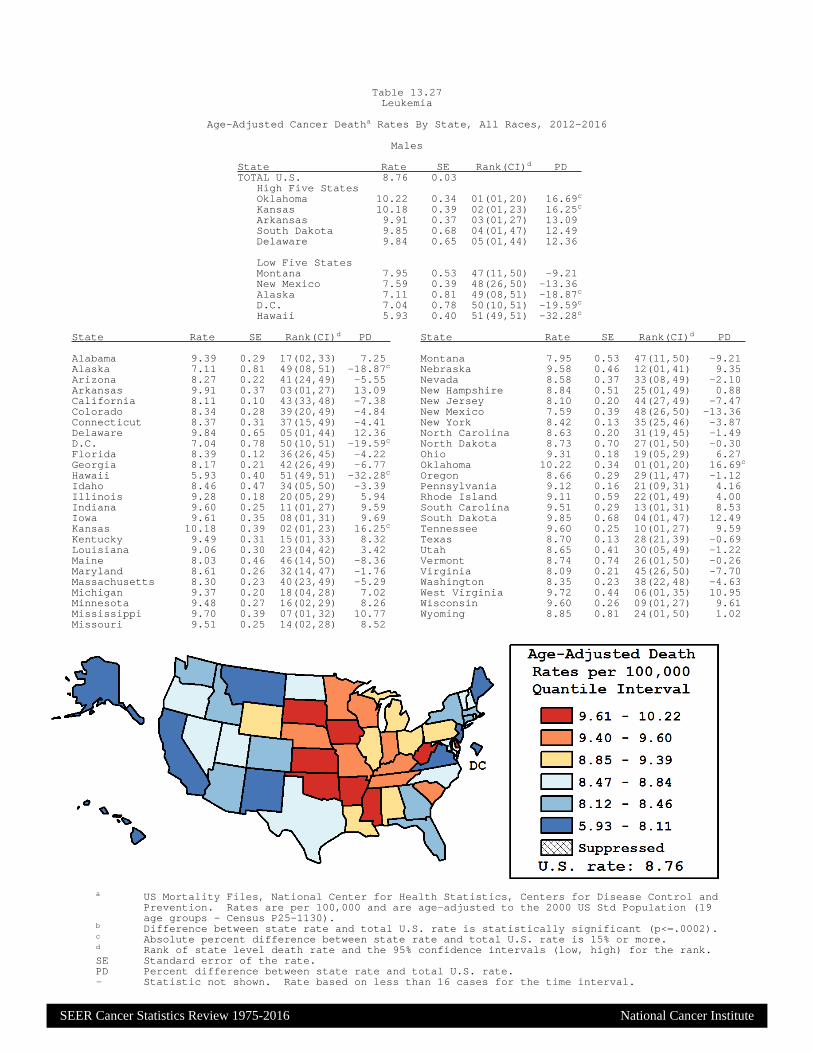
SEER Cancer Statistics Review 1975-2016 National Cancer Institute
a US Mortality Files National Center for Health Statistics Centers for Disease Control andPrevention Rates are per 100000 and are age-adjusted to the 2000 US Std Population (19age groups - Census P25-1130)
b Difference between state rate and total US rate is statistically significant (plt=0002)c Absolute percent difference between state rate and total US rate is 15 or mored Rank of state level death rate and the 95 confidence intervals (low high) for the rankSE Standard error of the ratePD Percent difference between state rate and total US rate- Statistic not shown Rate based on less than 16 cases for the time interval
State Rate SE Rank(CI)d PD TOTAL US 876 003
High Five StatesOklahoma 1022 034 01(0120) 1669c
Kansas 1018 039 02(0123) 1625c
Arkansas 991 037 03(0127) 1309South Dakota 985 068 04(0147) 1249Delaware 984 065 05(0144) 1236
Low Five StatesMontana 795 053 47(1150) -921New Mexico 759 039 48(2650) -1336Alaska 711 081 49(0851) -1887c
DC 704 078 50(1051) -1959c
Hawaii 593 040 51(4951) -3228c
State Rate SE Rank(CI)d PD State Rate SE Rank(CI)d PD
Alabama 939 029 17(0233) 725 Montana 795 053 47(1150) -921Alaska 711 081 49(0851) -1887c Nebraska 958 046 12(0141) 935Arizona 827 022 41(2449) -555 Nevada 858 037 33(0849) -210Arkansas 991 037 03(0127) 1309 New Hampshire 884 051 25(0149) 088California 811 010 43(3348) -738 New Jersey 810 020 44(2749) -747Colorado 834 028 39(2049) -484 New Mexico 759 039 48(2650) -1336Connecticut 837 031 37(1549) -441 New York 842 013 35(2546) -387Delaware 984 065 05(0144) 1236 North Carolina 863 020 31(1945) -149DC 704 078 50(1051) -1959c North Dakota 873 070 27(0150) -030Florida 839 012 36(2645) -422 Ohio 931 018 19(0529) 627Georgia 817 021 42(2649) -677 Oklahoma 1022 034 01(0120) 1669c
Hawaii 593 040 51(4951) -3228c Oregon 866 029 29(1147) -112Idaho 846 047 34(0550) -339 Pennsylvania 912 016 21(0931) 416Illinois 928 018 20(0529) 594 Rhode Island 911 059 22(0149) 400Indiana 960 025 11(0127) 959 South Carolina 951 029 13(0131) 853Iowa 961 035 08(0131) 969 South Dakota 985 068 04(0147) 1249Kansas 1018 039 02(0123) 1625c Tennessee 960 025 10(0127) 959Kentucky 949 031 15(0133) 832 Texas 870 013 28(2139) -069Louisiana 906 030 23(0442) 342 Utah 865 041 30(0549) -122Maine 803 046 46(1450) -836 Vermont 874 074 26(0150) -026Maryland 861 026 32(1447) -176 Virginia 809 021 45(2650) -770Massachusetts 830 023 40(2349) -529 Washington 835 023 38(2248) -463Michigan 937 020 18(0428) 702 West Virginia 972 044 06(0135) 1095Minnesota 948 027 16(0229) 826 Wisconsin 960 026 09(0127) 961Mississippi 970 039 07(0132) 1077 Wyoming 885 081 24(0150) 102Missouri 951 025 14(0228) 852
Table 1327Leukemia
Age-Adjusted Cancer Deatha Rates By State All Races 2012-2016
Males
SEER Cancer Statistics Review 1975-2016 National Cancer Institute
a US Mortality Files National Center for Health Statistics Centers for Disease Control andPrevention Rates are per 100000 and are age-adjusted to the 2000 US Std Population (19age groups - Census P25-1130)
b Difference between state rate and total US rate is statistically significant (plt=0002)c Absolute percent difference between state rate and total US rate is 15 or mored Rank of state level death rate and the 95 confidence intervals (low high) for the rankSE Standard error of the ratePD Percent difference between state rate and total US rate- Statistic not shown Rate based on less than 16 cases for the time interval
State Rate SE Rank(CI)d PD TOTAL US 489 002
High Five StatesOklahoma 615 023 01(0108) 2584c
Wyoming 596 060 02(0147) 2194c
Kentucky 592 021 03(0111) 2126c
West Virginia 576 030 04(0126) 1792c
South Dakota 564 047 05(0145) 1551c
Low Five StatesColorado 441 018 47(2250) -972Delaware 428 037 48(0751) -1247New Mexico 400 025 49(3151) -1803c
DC 381 046 50(1251) -2203c
Hawaii 362 029 51(4151) -2598c
State Rate SE Rank(CI)d PD State Rate SE Rank(CI)d PD
Alabama 512 019 18(0440) 483 Montana 452 037 43(0551) -745Alaska 485 062 27(0151) -073 Nebraska 531 030 10(0144) 864Arizona 473 015 31(1347) -308 Nevada 455 025 42(1150) -695Arkansas 516 024 15(0344) 554 New Hampshire 449 033 45(0651) -807California 470 007 34(2345) -383 New Jersey 478 013 30(1346) -223Colorado 441 018 47(2250) -972 New Mexico 400 025 49(3151) -1803c
Connecticut 465 020 40(1249) -487 New York 466 009 38(2246) -456Delaware 428 037 48(0751) -1247 North Carolina 471 012 32(1747) -350DC 381 046 50(1251) -2203c North Dakota 479 046 28(0151) -189Florida 460 008 41(2647) -582 Ohio 520 012 12(0529) 653Georgia 467 013 37(1747) -433 Oklahoma 615 023 01(0108) 2584c
Hawaii 362 029 51(4151) -2598c Oregon 449 019 44(1850) -799Idaho 497 033 22(0249) 174 Pennsylvania 516 011 14(0629) 556Illinois 514 011 16(0631) 526 Rhode Island 471 037 33(0351) -363Indiana 540 017 07(0226) 1052 South Carolina 495 018 23(0645) 133Iowa 498 022 20(0547) 200 South Dakota 564 047 05(0145) 1551c
Kansas 539 025 08(0137) 1032 Tennessee 517 016 13(0435) 590Kentucky 592 021 03(0111) 2126c Texas 467 008 36(2246) -431Louisiana 514 020 17(0442) 520 Utah 526 029 11(0146) 778Maine 508 032 19(0248) 403 Vermont 444 045 46(0351) -906Maryland 470 016 35(1448) -389 Virginia 465 014 39(1848) -474Massachusetts 478 015 29(1247) -220 Washington 487 016 25(0946) -022Michigan 498 013 21(0939) 192 West Virginia 576 030 04(0126) 1792c
Minnesota 494 017 24(0745) 121 Wisconsin 545 017 06(0225) 1162Mississippi 485 023 26(0548) -067 Wyoming 596 060 02(0147) 2194c
Missouri 535 017 09(0327) 953
Table 1328Leukemia
Age-Adjusted Cancer Deatha Rates By State All Races 2012-2016
Females
SEE
R C
ancer Statistics Review
1975-2016N
ational Cancer Institute
a US 2016 cancer prevalence counts are based on 2016 cancer prevalence proportions from the SEER 13 Areas (excluding the AlaskaNative Registry) and 112016 US population estimates based on the average of 2015 and 2016 population estimates from theUS Bureau of the CensusPrevalence was calculated using the first invasive tumor for each cancer site diagnosed during the previous 24 years
b Maximum limited-duration prevalence is 24 years for 1992-2016 datac Percentages are age-adjusted to the 2000 US Standard Population (19 age groups - Census P25-1130) by 5-year age groupsd Cases diagnosed more than 24 years ago were estimated using the completeness index method (Capocaccia et al 1997
Merrill et al 2000)e Complete prevalence is obtained by summing 0 to lt24 and gt=24- Statistic not shown Statistic based on fewer than 5 cases estimated alive in SEER for the time interval+ Not available
Years Since Diagnosis 0 to lt5 5 to lt10 10 to lt15 15 to lt20 20 to lt24 0 to lt24b gt=24d Completee
Race Sex All Races Both Sexes 153253 100309 63581 38012 21353 376508 38265 414773
Males 90192 57683 36029 21220 12020 217145 18411 235556Females 63061 42625 27552 16792 9333 159363 19854 179217
White Both Sexes 132173 87961 56051 33596 19035 328814 32999 370135Males 78368 50894 32033 18770 10845 190910 15102 210930Females 53805 37067 24018 14826 8190 137905 17897 159205
Black Both Sexes 12734 6564 4233 2487 1259 27277 4070 31347Males 6847 3556 2204 1334 637 14578 1776 16354Females 5887 3008 2029 1153 622 12699 2294 14992
Asian Both Sexes 3926 2561 1778 1164 690 10120 + +Pacific Males 2235 1462 936 646 351 5630 + +Islander Females 1691 1100 842 519 339 4490 + +
Hispanic Both Sexes 14464 9581 6796 4462 2630 37933 + +Males 8166 5374 3794 2408 1538 21280 + +Females 6298 4207 3002 2055 1092 16654 + +
Age Specific (Crude) Age-Adjustedc Age at Prevalence All Ages 0-9 10-19 20-29 30-39 40-49 50-59 60-69 70-79 80+ All Ages
Race Sex All Races Both Sexes 01168 00328 00640 00628 00377 00561 01053 02263 04023 05111 01054
Males 01369 00339 00706 00685 00419 00657 01287 02888 05282 07048 01306Females 00974 00317 00572 00570 00333 00466 00829 01696 02974 03919 00844
White Both Sexes 01304 00369 00715 00712 00410 00584 01106 02389 04249 05386 01127Males 01528 00379 00789 00771 00457 00682 01349 03042 05558 07387 01389Females 01084 00359 00637 00650 00362 00484 00869 01784 03135 04133 00904
Black Both Sexes 00605 00145 00322 00320 00267 00463 00752 01455 02470 03076 00660Males 00674 00142 00357 00338 00281 00530 00919 01737 03249 04580 00816Females 00541 00148 00286 00301 00255 00402 00605 01230 01927 02334 00552
Asian Both Sexes 00497 00264 00531 00426 00230 00390 00553 00882 01245 01389 00513Pacific Males 00577 00298 00555 00507 00249 00461 00665 01122 01552 01904 00613Islander Females 00423 00228 00507 00345 00212 00327 00456 00688 00999 01057 00430
Hispanic Both Sexes 00664 00375 00737 00728 00395 00485 00723 01191 01987 02074 00746Males 00737 00397 00827 00807 00471 00576 00831 01350 02221 02551 00854Females 00589 00352 00642 00641 00312 00391 00617 01050 01809 01780 00647
Table 1329Leukemia
Estimated United States Cancer Prevalence Countsa on January 1 2016By RaceEthnicity Sex and Years Since Diagnosis
Estimated prevalence percenta on January 1 2016 of the SEER population diagnosed in the previous 24 yearsBy Age at Prevalence RaceEthnicity and Sex
SEE
R C
ancer Statistics Review
1975-2016N
ational Cancer Institute
a US 2016 cancer prevalence counts are based on 2016 cancer prevalence proportions from the SEER 13 Areas (excluding the AlaskaNative Registry) and 112016 US population estimates based on the average of 2015 and 2016 population estimates from theUS Bureau of the CensusPrevalence was calculated using the first invasive tumor for each cancer site diagnosed during the previous 24 years
b Maximum limited-duration prevalence is 24 years for 1992-2016 datac Percentages are age-adjusted to the 2000 US Standard Population (19 age groups - Census P25-1130) by 5-year age groupsd Cases diagnosed more than 24 years ago were estimated using the completeness index method (Capocaccia et al 1997
Merrill et al 2000)e Complete prevalence is obtained by summing 0 to lt24 and gt=24- Statistic not shown Statistic based on fewer than 5 cases estimated alive in SEER for the time interval+ Not available
Years Since Diagnosis 0 to lt5 5 to lt10 10 to lt15 15 to lt20 20 to lt24 0 to lt24b gt=24d Completee
Race Sex All Races Both Sexes 20277 16033 13721 12074 8203 70308 25456 95764
Males 11203 9049 7751 6542 4634 39179 12997 52176Females 9074 6984 5971 5531 3568 31129 12460 43589
White Both Sexes 17123 13855 11870 10663 7154 60665 21823 83282Males 9549 7741 6768 5696 4084 33839 11286 45559Females 7573 6114 5102 4967 3070 26826 10537 37723
Black Both Sexes 1590 1133 923 727 553 4926 1609 6535Males 809 734 473 411 290 2716 592 3308Females 781 399 450 317 263 2210 1017 3227
Asian Both Sexes 998 720 669 486 361 3234 + +Pacific Males 527 406 369 313 178 1793 + +Islander Females 472 314 300 173 183 1441 + +
Hispanic Both Sexes 5905 4543 3352 2717 1749 18266 + +Males 3302 2686 1899 1465 1058 10409 + +Females 2603 1857 1454 1252 692 7857 + +
Age Specific (Crude) Age-Adjustedc Age at Prevalence All Ages 0-9 10-19 20-29 30-39 40-49 50-59 60-69 70-79 80+ All Ages
Race Sex All Races Both Sexes 00218 00276 00541 00467 00139 00078 00059 00065 00053 00033 00228
Males 00247 00286 00591 00520 00163 00095 00066 00069 00056 00035 00251Females 00190 00266 00488 00410 00115 00062 00053 00062 00050 00032 00204
White Both Sexes 00241 00315 00612 00542 00161 00086 00063 00070 00056 00033 00259Males 00271 00323 00670 00598 00186 00107 00069 00074 00060 00032 00284Females 00211 00306 00551 00482 00135 00064 00057 00066 00053 00033 00232
Black Both Sexes 00109 00107 00250 00197 00067 00042 00039 00029 00012 00027 00102Males 00126 00112 00281 00224 00079 00035 00052 00026 00012 00027 00112Females 00094 00102 00219 00171 00056 00047 00028 00032 00013 00027 00092
Asian Both Sexes 00159 00208 00418 00289 00071 00064 00045 00050 00054 00036 00163Pacific Males 00184 00226 00427 00360 00086 00069 00055 00054 00033 00055 00180Islander Females 00136 00190 00408 00219 00058 00059 00036 00047 00071 00023 00146
Hispanic Both Sexes 00320 00328 00637 00574 00165 00107 00093 00100 00084 00012 00279Males 00361 00342 00710 00648 00205 00131 00110 00063 00072 - 00309Females 00278 00312 00562 00494 00122 00082 00077 00133 00093 00020 00246
Table 1330Acute Lymphocytic Leukemia
Estimated United States Cancer Prevalence Countsa on January 1 2016By RaceEthnicity Sex and Years Since Diagnosis
Estimated prevalence percenta on January 1 2016 of the SEER population diagnosed in the previous 24 yearsBy Age at Prevalence RaceEthnicity and Sex
0
5
10
15
20
25
1975 1985 1995 2005 20160
5
10
15
20
25
1975 1985 1995 2005 20160
3
6
9
12
15
1975 1985 1995 2005 20160
3
6
9
12
15
1975 1985 1995 2005 2016
Delay-Adj IncidenceDelay-Adj Incidence
Observed IncidenceObserved Incidence
MortalityMortality
SEER Observed Incidence SEER Delay Adjusted Incidence and US Death RatesLeukemia by Race and Sex
a
Figure 131
Source SEER 9 areas and US Mortality Files (National Center for Health Statistics CDC)Rates are age-adjusted to the 2000 US Std Population (19 age groups - Census P25-1103)Regression lines and APCs are calculated using the Joinpoint Regression Program Version 47 February 2019 National Cancer InstituteThe APC is the Annual Percent Change for the regression line segments The APC shown on the graph is for the most recent trendThe APC is significantly different from zero (p lt 005)
a
White Male Black Male White Female Black FemaleRate per 100000 Rate per 100000 Rate per 100000 Rate per 100000
Year of DiagnosisDeath Year of DiagnosisDeath Year of DiagnosisDeath Year of DiagnosisDeath
SEER Incidence APCsDelay Adj 1998-16 = 08Observed 1975-16 = 03
US Mortality APC2013-16 = -30
SEER Incidence APCsDelay Adj 1975-16 = 02Observed 1975-16 = 01
US Mortality APC1993-16 = -15
SEER Incidence APCsDelay Adj 1975-16 = 06Observed 1975-16 = 05
US Mortality APC2000-16 = -12
SEER Incidence APCsDelay Adj 1975-16 = 03Observed 1975-16 = 02
US Mortality APC1993-16 = -13
SEE
R C
ancer Statistics Review
1975-2016N
ational Cancer Institute
0
1
2
3
4
5
6
7
8
1975 1985 1995 2005 20160
1
2
3
4
5
6
7
8
1975 1985 1995 2005 20160
1
2
3
4
5
6
7
8
1975 1985 1995 2005 20160
1
2
3
4
5
6
7
8
1975 1985 1995 2005 2016
Chronic
Acute
SEER Observed Incidence RatesLymphocytic and Myeloid Leukemia (Acute and Chronic) by Sex
a
Figure 132
Source SEER 9 areas Rates are age-adjusted to the 2000 US Std Population (19 age groups - Census P25-1103)Regression lines and APCs are calculated using the Joinpoint Regression Program Version 47 February 2019 National Cancer Institute
a
Male Female Male FemaleLymphocytic Leukemia Myeloid Leukemia
Rate per 100000 Rate per 100000 Rate per 100000 Rate per 100000
Year of Diagnosis Year of Diagnosis Year of Diagnosis Year of Diagnosis
SEE
R C
ancer Statistics Review
1975-2016N
ational Cancer Institute
Joinpoint Analyses for Whites and Blacks from 1975-2016and for AsianPacific Islanders American IndiansAlaska Natives and Hispanics from 2000-2016
0
5
10
15
20
1975 1985 1995 2005 20160
5
10
15
20
1975 1985 1995 2005 2016
White
Black
API
AIAN
Hispanic
SEER Incidence and US Death RatesLeukemia Both Sexes
Figure 133
Source Incidence data for whites and blacks are from the SEER 9 areas (San Francisco Connecticut Detroit Hawaii Iowa New Mexico Seattle Utah Atlanta)Incidence data for AsianPacific Islanders American IndiansAlaska Natives and Hispanics are from the SEER 21 areas (SEER 9 areas San Jose-MontereyLos Angeles Alaska Native Registry Rural Georgia California excluding SFSJMLA Kentucky Louisiana New Jersey Georgia excluding ATLRG Idaho New York andMassachusetts)Mortality data are from US Mortality Files National Center for Health Statistics CDCRates are age-adjusted to the 2000 US Std Population (19 age groups - Census P25-1103)Regression lines are calculated using the Joinpoint Regression Program Version 47 February 2019 National Cancer Institute Joinpoint analyses for Whites andBlacks during the 1975-2016 period allow a maximum of 5 joinpoints Analyses for other ethnic groups during the period 2000-2016 allow a maximum of 3 joinpointsAPI = AsianPacific IslanderAIAN = American IndianAlaska Native Rates for American IndianAlaska Native are based on the PurchasedReferred Care Delivery Area (PRCDA) countiesHispanic is not mutually exclusive from whites blacks AsianPacific Islanders and American IndiansAlaska Natives Incidence data for Hispanics are based onNHIA and exclude cases from the Alaska Native Registry
Incidence MortalityRate per 100000 Rate per 100000
Year of Diagnosis Year of Death
a
d
a
b
c
c
b
d
SEE
R C
ancer Statistics Review
1975-2016N
ational Cancer Institute
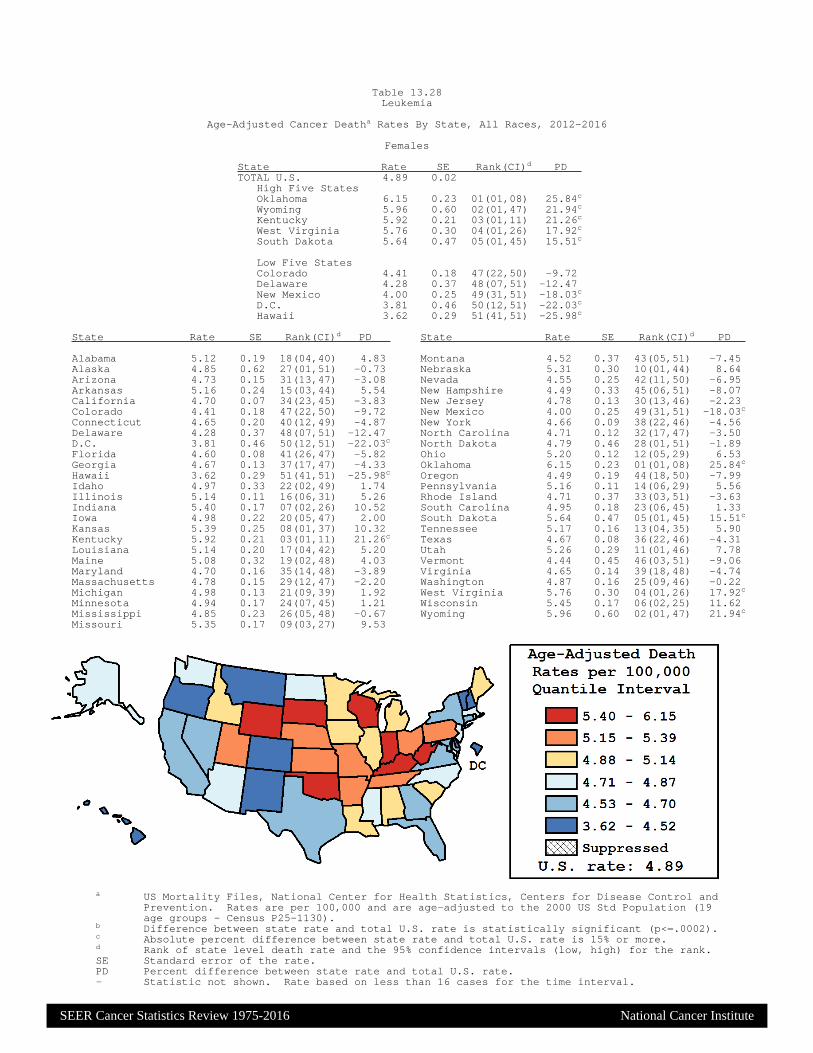
SEER Cancer Statistics Review 1975-2016 National Cancer Institute
a US Mortality Files National Center for Health Statistics Centers for Disease Control andPrevention Rates are per 100000 and are age-adjusted to the 2000 US Std Population (19age groups - Census P25-1130)
b Difference between state rate and total US rate is statistically significant (plt=0002)c Absolute percent difference between state rate and total US rate is 15 or mored Rank of state level death rate and the 95 confidence intervals (low high) for the rankSE Standard error of the ratePD Percent difference between state rate and total US rate- Statistic not shown Rate based on less than 16 cases for the time interval
State Rate SE Rank(CI)d PD TOTAL US 489 002
High Five StatesOklahoma 615 023 01(0108) 2584c
Wyoming 596 060 02(0147) 2194c
Kentucky 592 021 03(0111) 2126c
West Virginia 576 030 04(0126) 1792c
South Dakota 564 047 05(0145) 1551c
Low Five StatesColorado 441 018 47(2250) -972Delaware 428 037 48(0751) -1247New Mexico 400 025 49(3151) -1803c
DC 381 046 50(1251) -2203c
Hawaii 362 029 51(4151) -2598c
State Rate SE Rank(CI)d PD State Rate SE Rank(CI)d PD
Alabama 512 019 18(0440) 483 Montana 452 037 43(0551) -745Alaska 485 062 27(0151) -073 Nebraska 531 030 10(0144) 864Arizona 473 015 31(1347) -308 Nevada 455 025 42(1150) -695Arkansas 516 024 15(0344) 554 New Hampshire 449 033 45(0651) -807California 470 007 34(2345) -383 New Jersey 478 013 30(1346) -223Colorado 441 018 47(2250) -972 New Mexico 400 025 49(3151) -1803c
Connecticut 465 020 40(1249) -487 New York 466 009 38(2246) -456Delaware 428 037 48(0751) -1247 North Carolina 471 012 32(1747) -350DC 381 046 50(1251) -2203c North Dakota 479 046 28(0151) -189Florida 460 008 41(2647) -582 Ohio 520 012 12(0529) 653Georgia 467 013 37(1747) -433 Oklahoma 615 023 01(0108) 2584c
Hawaii 362 029 51(4151) -2598c Oregon 449 019 44(1850) -799Idaho 497 033 22(0249) 174 Pennsylvania 516 011 14(0629) 556Illinois 514 011 16(0631) 526 Rhode Island 471 037 33(0351) -363Indiana 540 017 07(0226) 1052 South Carolina 495 018 23(0645) 133Iowa 498 022 20(0547) 200 South Dakota 564 047 05(0145) 1551c
Kansas 539 025 08(0137) 1032 Tennessee 517 016 13(0435) 590Kentucky 592 021 03(0111) 2126c Texas 467 008 36(2246) -431Louisiana 514 020 17(0442) 520 Utah 526 029 11(0146) 778Maine 508 032 19(0248) 403 Vermont 444 045 46(0351) -906Maryland 470 016 35(1448) -389 Virginia 465 014 39(1848) -474Massachusetts 478 015 29(1247) -220 Washington 487 016 25(0946) -022Michigan 498 013 21(0939) 192 West Virginia 576 030 04(0126) 1792c
Minnesota 494 017 24(0745) 121 Wisconsin 545 017 06(0225) 1162Mississippi 485 023 26(0548) -067 Wyoming 596 060 02(0147) 2194c
Missouri 535 017 09(0327) 953
Table 1328Leukemia
Age-Adjusted Cancer Deatha Rates By State All Races 2012-2016
Females
SEE
R C
ancer Statistics Review
1975-2016N
ational Cancer Institute
a US 2016 cancer prevalence counts are based on 2016 cancer prevalence proportions from the SEER 13 Areas (excluding the AlaskaNative Registry) and 112016 US population estimates based on the average of 2015 and 2016 population estimates from theUS Bureau of the CensusPrevalence was calculated using the first invasive tumor for each cancer site diagnosed during the previous 24 years
b Maximum limited-duration prevalence is 24 years for 1992-2016 datac Percentages are age-adjusted to the 2000 US Standard Population (19 age groups - Census P25-1130) by 5-year age groupsd Cases diagnosed more than 24 years ago were estimated using the completeness index method (Capocaccia et al 1997
Merrill et al 2000)e Complete prevalence is obtained by summing 0 to lt24 and gt=24- Statistic not shown Statistic based on fewer than 5 cases estimated alive in SEER for the time interval+ Not available
Years Since Diagnosis 0 to lt5 5 to lt10 10 to lt15 15 to lt20 20 to lt24 0 to lt24b gt=24d Completee
Race Sex All Races Both Sexes 153253 100309 63581 38012 21353 376508 38265 414773
Males 90192 57683 36029 21220 12020 217145 18411 235556Females 63061 42625 27552 16792 9333 159363 19854 179217
White Both Sexes 132173 87961 56051 33596 19035 328814 32999 370135Males 78368 50894 32033 18770 10845 190910 15102 210930Females 53805 37067 24018 14826 8190 137905 17897 159205
Black Both Sexes 12734 6564 4233 2487 1259 27277 4070 31347Males 6847 3556 2204 1334 637 14578 1776 16354Females 5887 3008 2029 1153 622 12699 2294 14992
Asian Both Sexes 3926 2561 1778 1164 690 10120 + +Pacific Males 2235 1462 936 646 351 5630 + +Islander Females 1691 1100 842 519 339 4490 + +
Hispanic Both Sexes 14464 9581 6796 4462 2630 37933 + +Males 8166 5374 3794 2408 1538 21280 + +Females 6298 4207 3002 2055 1092 16654 + +
Age Specific (Crude) Age-Adjustedc Age at Prevalence All Ages 0-9 10-19 20-29 30-39 40-49 50-59 60-69 70-79 80+ All Ages
Race Sex All Races Both Sexes 01168 00328 00640 00628 00377 00561 01053 02263 04023 05111 01054
Males 01369 00339 00706 00685 00419 00657 01287 02888 05282 07048 01306Females 00974 00317 00572 00570 00333 00466 00829 01696 02974 03919 00844
White Both Sexes 01304 00369 00715 00712 00410 00584 01106 02389 04249 05386 01127Males 01528 00379 00789 00771 00457 00682 01349 03042 05558 07387 01389Females 01084 00359 00637 00650 00362 00484 00869 01784 03135 04133 00904
Black Both Sexes 00605 00145 00322 00320 00267 00463 00752 01455 02470 03076 00660Males 00674 00142 00357 00338 00281 00530 00919 01737 03249 04580 00816Females 00541 00148 00286 00301 00255 00402 00605 01230 01927 02334 00552
Asian Both Sexes 00497 00264 00531 00426 00230 00390 00553 00882 01245 01389 00513Pacific Males 00577 00298 00555 00507 00249 00461 00665 01122 01552 01904 00613Islander Females 00423 00228 00507 00345 00212 00327 00456 00688 00999 01057 00430
Hispanic Both Sexes 00664 00375 00737 00728 00395 00485 00723 01191 01987 02074 00746Males 00737 00397 00827 00807 00471 00576 00831 01350 02221 02551 00854Females 00589 00352 00642 00641 00312 00391 00617 01050 01809 01780 00647
Table 1329Leukemia
Estimated United States Cancer Prevalence Countsa on January 1 2016By RaceEthnicity Sex and Years Since Diagnosis
Estimated prevalence percenta on January 1 2016 of the SEER population diagnosed in the previous 24 yearsBy Age at Prevalence RaceEthnicity and Sex
SEE
R C
ancer Statistics Review
1975-2016N
ational Cancer Institute
a US 2016 cancer prevalence counts are based on 2016 cancer prevalence proportions from the SEER 13 Areas (excluding the AlaskaNative Registry) and 112016 US population estimates based on the average of 2015 and 2016 population estimates from theUS Bureau of the CensusPrevalence was calculated using the first invasive tumor for each cancer site diagnosed during the previous 24 years
b Maximum limited-duration prevalence is 24 years for 1992-2016 datac Percentages are age-adjusted to the 2000 US Standard Population (19 age groups - Census P25-1130) by 5-year age groupsd Cases diagnosed more than 24 years ago were estimated using the completeness index method (Capocaccia et al 1997
Merrill et al 2000)e Complete prevalence is obtained by summing 0 to lt24 and gt=24- Statistic not shown Statistic based on fewer than 5 cases estimated alive in SEER for the time interval+ Not available
Years Since Diagnosis 0 to lt5 5 to lt10 10 to lt15 15 to lt20 20 to lt24 0 to lt24b gt=24d Completee
Race Sex All Races Both Sexes 20277 16033 13721 12074 8203 70308 25456 95764
Males 11203 9049 7751 6542 4634 39179 12997 52176Females 9074 6984 5971 5531 3568 31129 12460 43589
White Both Sexes 17123 13855 11870 10663 7154 60665 21823 83282Males 9549 7741 6768 5696 4084 33839 11286 45559Females 7573 6114 5102 4967 3070 26826 10537 37723
Black Both Sexes 1590 1133 923 727 553 4926 1609 6535Males 809 734 473 411 290 2716 592 3308Females 781 399 450 317 263 2210 1017 3227
Asian Both Sexes 998 720 669 486 361 3234 + +Pacific Males 527 406 369 313 178 1793 + +Islander Females 472 314 300 173 183 1441 + +
Hispanic Both Sexes 5905 4543 3352 2717 1749 18266 + +Males 3302 2686 1899 1465 1058 10409 + +Females 2603 1857 1454 1252 692 7857 + +
Age Specific (Crude) Age-Adjustedc Age at Prevalence All Ages 0-9 10-19 20-29 30-39 40-49 50-59 60-69 70-79 80+ All Ages
Race Sex All Races Both Sexes 00218 00276 00541 00467 00139 00078 00059 00065 00053 00033 00228
Males 00247 00286 00591 00520 00163 00095 00066 00069 00056 00035 00251Females 00190 00266 00488 00410 00115 00062 00053 00062 00050 00032 00204
White Both Sexes 00241 00315 00612 00542 00161 00086 00063 00070 00056 00033 00259Males 00271 00323 00670 00598 00186 00107 00069 00074 00060 00032 00284Females 00211 00306 00551 00482 00135 00064 00057 00066 00053 00033 00232
Black Both Sexes 00109 00107 00250 00197 00067 00042 00039 00029 00012 00027 00102Males 00126 00112 00281 00224 00079 00035 00052 00026 00012 00027 00112Females 00094 00102 00219 00171 00056 00047 00028 00032 00013 00027 00092
Asian Both Sexes 00159 00208 00418 00289 00071 00064 00045 00050 00054 00036 00163Pacific Males 00184 00226 00427 00360 00086 00069 00055 00054 00033 00055 00180Islander Females 00136 00190 00408 00219 00058 00059 00036 00047 00071 00023 00146
Hispanic Both Sexes 00320 00328 00637 00574 00165 00107 00093 00100 00084 00012 00279Males 00361 00342 00710 00648 00205 00131 00110 00063 00072 - 00309Females 00278 00312 00562 00494 00122 00082 00077 00133 00093 00020 00246
Table 1330Acute Lymphocytic Leukemia
Estimated United States Cancer Prevalence Countsa on January 1 2016By RaceEthnicity Sex and Years Since Diagnosis
Estimated prevalence percenta on January 1 2016 of the SEER population diagnosed in the previous 24 yearsBy Age at Prevalence RaceEthnicity and Sex
0
5
10
15
20
25
1975 1985 1995 2005 20160
5
10
15
20
25
1975 1985 1995 2005 20160
3
6
9
12
15
1975 1985 1995 2005 20160
3
6
9
12
15
1975 1985 1995 2005 2016
Delay-Adj IncidenceDelay-Adj Incidence
Observed IncidenceObserved Incidence
MortalityMortality
SEER Observed Incidence SEER Delay Adjusted Incidence and US Death RatesLeukemia by Race and Sex
a
Figure 131
Source SEER 9 areas and US Mortality Files (National Center for Health Statistics CDC)Rates are age-adjusted to the 2000 US Std Population (19 age groups - Census P25-1103)Regression lines and APCs are calculated using the Joinpoint Regression Program Version 47 February 2019 National Cancer InstituteThe APC is the Annual Percent Change for the regression line segments The APC shown on the graph is for the most recent trendThe APC is significantly different from zero (p lt 005)
a
White Male Black Male White Female Black FemaleRate per 100000 Rate per 100000 Rate per 100000 Rate per 100000
Year of DiagnosisDeath Year of DiagnosisDeath Year of DiagnosisDeath Year of DiagnosisDeath
SEER Incidence APCsDelay Adj 1998-16 = 08Observed 1975-16 = 03
US Mortality APC2013-16 = -30
SEER Incidence APCsDelay Adj 1975-16 = 02Observed 1975-16 = 01
US Mortality APC1993-16 = -15
SEER Incidence APCsDelay Adj 1975-16 = 06Observed 1975-16 = 05
US Mortality APC2000-16 = -12
SEER Incidence APCsDelay Adj 1975-16 = 03Observed 1975-16 = 02
US Mortality APC1993-16 = -13
SEE
R C
ancer Statistics Review
1975-2016N
ational Cancer Institute
0
1
2
3
4
5
6
7
8
1975 1985 1995 2005 20160
1
2
3
4
5
6
7
8
1975 1985 1995 2005 20160
1
2
3
4
5
6
7
8
1975 1985 1995 2005 20160
1
2
3
4
5
6
7
8
1975 1985 1995 2005 2016
Chronic
Acute
SEER Observed Incidence RatesLymphocytic and Myeloid Leukemia (Acute and Chronic) by Sex
a
Figure 132
Source SEER 9 areas Rates are age-adjusted to the 2000 US Std Population (19 age groups - Census P25-1103)Regression lines and APCs are calculated using the Joinpoint Regression Program Version 47 February 2019 National Cancer Institute
a
Male Female Male FemaleLymphocytic Leukemia Myeloid Leukemia
Rate per 100000 Rate per 100000 Rate per 100000 Rate per 100000
Year of Diagnosis Year of Diagnosis Year of Diagnosis Year of Diagnosis
SEE
R C
ancer Statistics Review
1975-2016N
ational Cancer Institute
Joinpoint Analyses for Whites and Blacks from 1975-2016and for AsianPacific Islanders American IndiansAlaska Natives and Hispanics from 2000-2016
0
5
10
15
20
1975 1985 1995 2005 20160
5
10
15
20
1975 1985 1995 2005 2016
White
Black
API
AIAN
Hispanic
SEER Incidence and US Death RatesLeukemia Both Sexes
Figure 133
Source Incidence data for whites and blacks are from the SEER 9 areas (San Francisco Connecticut Detroit Hawaii Iowa New Mexico Seattle Utah Atlanta)Incidence data for AsianPacific Islanders American IndiansAlaska Natives and Hispanics are from the SEER 21 areas (SEER 9 areas San Jose-MontereyLos Angeles Alaska Native Registry Rural Georgia California excluding SFSJMLA Kentucky Louisiana New Jersey Georgia excluding ATLRG Idaho New York andMassachusetts)Mortality data are from US Mortality Files National Center for Health Statistics CDCRates are age-adjusted to the 2000 US Std Population (19 age groups - Census P25-1103)Regression lines are calculated using the Joinpoint Regression Program Version 47 February 2019 National Cancer Institute Joinpoint analyses for Whites andBlacks during the 1975-2016 period allow a maximum of 5 joinpoints Analyses for other ethnic groups during the period 2000-2016 allow a maximum of 3 joinpointsAPI = AsianPacific IslanderAIAN = American IndianAlaska Native Rates for American IndianAlaska Native are based on the PurchasedReferred Care Delivery Area (PRCDA) countiesHispanic is not mutually exclusive from whites blacks AsianPacific Islanders and American IndiansAlaska Natives Incidence data for Hispanics are based onNHIA and exclude cases from the Alaska Native Registry
Incidence MortalityRate per 100000 Rate per 100000
Year of Diagnosis Year of Death
a
d
a
b
c
c
b
d
SEE
R C
ancer Statistics Review
1975-2016N
ational Cancer Institute

SEE
R C
ancer Statistics Review
1975-2016N
ational Cancer Institute
a US 2016 cancer prevalence counts are based on 2016 cancer prevalence proportions from the SEER 13 Areas (excluding the AlaskaNative Registry) and 112016 US population estimates based on the average of 2015 and 2016 population estimates from theUS Bureau of the CensusPrevalence was calculated using the first invasive tumor for each cancer site diagnosed during the previous 24 years
b Maximum limited-duration prevalence is 24 years for 1992-2016 datac Percentages are age-adjusted to the 2000 US Standard Population (19 age groups - Census P25-1130) by 5-year age groupsd Cases diagnosed more than 24 years ago were estimated using the completeness index method (Capocaccia et al 1997
Merrill et al 2000)e Complete prevalence is obtained by summing 0 to lt24 and gt=24- Statistic not shown Statistic based on fewer than 5 cases estimated alive in SEER for the time interval+ Not available
Years Since Diagnosis 0 to lt5 5 to lt10 10 to lt15 15 to lt20 20 to lt24 0 to lt24b gt=24d Completee
Race Sex All Races Both Sexes 153253 100309 63581 38012 21353 376508 38265 414773
Males 90192 57683 36029 21220 12020 217145 18411 235556Females 63061 42625 27552 16792 9333 159363 19854 179217
White Both Sexes 132173 87961 56051 33596 19035 328814 32999 370135Males 78368 50894 32033 18770 10845 190910 15102 210930Females 53805 37067 24018 14826 8190 137905 17897 159205
Black Both Sexes 12734 6564 4233 2487 1259 27277 4070 31347Males 6847 3556 2204 1334 637 14578 1776 16354Females 5887 3008 2029 1153 622 12699 2294 14992
Asian Both Sexes 3926 2561 1778 1164 690 10120 + +Pacific Males 2235 1462 936 646 351 5630 + +Islander Females 1691 1100 842 519 339 4490 + +
Hispanic Both Sexes 14464 9581 6796 4462 2630 37933 + +Males 8166 5374 3794 2408 1538 21280 + +Females 6298 4207 3002 2055 1092 16654 + +
Age Specific (Crude) Age-Adjustedc Age at Prevalence All Ages 0-9 10-19 20-29 30-39 40-49 50-59 60-69 70-79 80+ All Ages
Race Sex All Races Both Sexes 01168 00328 00640 00628 00377 00561 01053 02263 04023 05111 01054
Males 01369 00339 00706 00685 00419 00657 01287 02888 05282 07048 01306Females 00974 00317 00572 00570 00333 00466 00829 01696 02974 03919 00844
White Both Sexes 01304 00369 00715 00712 00410 00584 01106 02389 04249 05386 01127Males 01528 00379 00789 00771 00457 00682 01349 03042 05558 07387 01389Females 01084 00359 00637 00650 00362 00484 00869 01784 03135 04133 00904
Black Both Sexes 00605 00145 00322 00320 00267 00463 00752 01455 02470 03076 00660Males 00674 00142 00357 00338 00281 00530 00919 01737 03249 04580 00816Females 00541 00148 00286 00301 00255 00402 00605 01230 01927 02334 00552
Asian Both Sexes 00497 00264 00531 00426 00230 00390 00553 00882 01245 01389 00513Pacific Males 00577 00298 00555 00507 00249 00461 00665 01122 01552 01904 00613Islander Females 00423 00228 00507 00345 00212 00327 00456 00688 00999 01057 00430
Hispanic Both Sexes 00664 00375 00737 00728 00395 00485 00723 01191 01987 02074 00746Males 00737 00397 00827 00807 00471 00576 00831 01350 02221 02551 00854Females 00589 00352 00642 00641 00312 00391 00617 01050 01809 01780 00647
Table 1329Leukemia
Estimated United States Cancer Prevalence Countsa on January 1 2016By RaceEthnicity Sex and Years Since Diagnosis
Estimated prevalence percenta on January 1 2016 of the SEER population diagnosed in the previous 24 yearsBy Age at Prevalence RaceEthnicity and Sex
SEE
R C
ancer Statistics Review
1975-2016N
ational Cancer Institute
a US 2016 cancer prevalence counts are based on 2016 cancer prevalence proportions from the SEER 13 Areas (excluding the AlaskaNative Registry) and 112016 US population estimates based on the average of 2015 and 2016 population estimates from theUS Bureau of the CensusPrevalence was calculated using the first invasive tumor for each cancer site diagnosed during the previous 24 years
b Maximum limited-duration prevalence is 24 years for 1992-2016 datac Percentages are age-adjusted to the 2000 US Standard Population (19 age groups - Census P25-1130) by 5-year age groupsd Cases diagnosed more than 24 years ago were estimated using the completeness index method (Capocaccia et al 1997
Merrill et al 2000)e Complete prevalence is obtained by summing 0 to lt24 and gt=24- Statistic not shown Statistic based on fewer than 5 cases estimated alive in SEER for the time interval+ Not available
Years Since Diagnosis 0 to lt5 5 to lt10 10 to lt15 15 to lt20 20 to lt24 0 to lt24b gt=24d Completee
Race Sex All Races Both Sexes 20277 16033 13721 12074 8203 70308 25456 95764
Males 11203 9049 7751 6542 4634 39179 12997 52176Females 9074 6984 5971 5531 3568 31129 12460 43589
White Both Sexes 17123 13855 11870 10663 7154 60665 21823 83282Males 9549 7741 6768 5696 4084 33839 11286 45559Females 7573 6114 5102 4967 3070 26826 10537 37723
Black Both Sexes 1590 1133 923 727 553 4926 1609 6535Males 809 734 473 411 290 2716 592 3308Females 781 399 450 317 263 2210 1017 3227
Asian Both Sexes 998 720 669 486 361 3234 + +Pacific Males 527 406 369 313 178 1793 + +Islander Females 472 314 300 173 183 1441 + +
Hispanic Both Sexes 5905 4543 3352 2717 1749 18266 + +Males 3302 2686 1899 1465 1058 10409 + +Females 2603 1857 1454 1252 692 7857 + +
Age Specific (Crude) Age-Adjustedc Age at Prevalence All Ages 0-9 10-19 20-29 30-39 40-49 50-59 60-69 70-79 80+ All Ages
Race Sex All Races Both Sexes 00218 00276 00541 00467 00139 00078 00059 00065 00053 00033 00228
Males 00247 00286 00591 00520 00163 00095 00066 00069 00056 00035 00251Females 00190 00266 00488 00410 00115 00062 00053 00062 00050 00032 00204
White Both Sexes 00241 00315 00612 00542 00161 00086 00063 00070 00056 00033 00259Males 00271 00323 00670 00598 00186 00107 00069 00074 00060 00032 00284Females 00211 00306 00551 00482 00135 00064 00057 00066 00053 00033 00232
Black Both Sexes 00109 00107 00250 00197 00067 00042 00039 00029 00012 00027 00102Males 00126 00112 00281 00224 00079 00035 00052 00026 00012 00027 00112Females 00094 00102 00219 00171 00056 00047 00028 00032 00013 00027 00092
Asian Both Sexes 00159 00208 00418 00289 00071 00064 00045 00050 00054 00036 00163Pacific Males 00184 00226 00427 00360 00086 00069 00055 00054 00033 00055 00180Islander Females 00136 00190 00408 00219 00058 00059 00036 00047 00071 00023 00146
Hispanic Both Sexes 00320 00328 00637 00574 00165 00107 00093 00100 00084 00012 00279Males 00361 00342 00710 00648 00205 00131 00110 00063 00072 - 00309Females 00278 00312 00562 00494 00122 00082 00077 00133 00093 00020 00246
Table 1330Acute Lymphocytic Leukemia
Estimated United States Cancer Prevalence Countsa on January 1 2016By RaceEthnicity Sex and Years Since Diagnosis
Estimated prevalence percenta on January 1 2016 of the SEER population diagnosed in the previous 24 yearsBy Age at Prevalence RaceEthnicity and Sex
0
5
10
15
20
25
1975 1985 1995 2005 20160
5
10
15
20
25
1975 1985 1995 2005 20160
3
6
9
12
15
1975 1985 1995 2005 20160
3
6
9
12
15
1975 1985 1995 2005 2016
Delay-Adj IncidenceDelay-Adj Incidence
Observed IncidenceObserved Incidence
MortalityMortality
SEER Observed Incidence SEER Delay Adjusted Incidence and US Death RatesLeukemia by Race and Sex
a
Figure 131
Source SEER 9 areas and US Mortality Files (National Center for Health Statistics CDC)Rates are age-adjusted to the 2000 US Std Population (19 age groups - Census P25-1103)Regression lines and APCs are calculated using the Joinpoint Regression Program Version 47 February 2019 National Cancer InstituteThe APC is the Annual Percent Change for the regression line segments The APC shown on the graph is for the most recent trendThe APC is significantly different from zero (p lt 005)
a
White Male Black Male White Female Black FemaleRate per 100000 Rate per 100000 Rate per 100000 Rate per 100000
Year of DiagnosisDeath Year of DiagnosisDeath Year of DiagnosisDeath Year of DiagnosisDeath
SEER Incidence APCsDelay Adj 1998-16 = 08Observed 1975-16 = 03
US Mortality APC2013-16 = -30
SEER Incidence APCsDelay Adj 1975-16 = 02Observed 1975-16 = 01
US Mortality APC1993-16 = -15
SEER Incidence APCsDelay Adj 1975-16 = 06Observed 1975-16 = 05
US Mortality APC2000-16 = -12
SEER Incidence APCsDelay Adj 1975-16 = 03Observed 1975-16 = 02
US Mortality APC1993-16 = -13
SEE
R C
ancer Statistics Review
1975-2016N
ational Cancer Institute
0
1
2
3
4
5
6
7
8
1975 1985 1995 2005 20160
1
2
3
4
5
6
7
8
1975 1985 1995 2005 20160
1
2
3
4
5
6
7
8
1975 1985 1995 2005 20160
1
2
3
4
5
6
7
8
1975 1985 1995 2005 2016
Chronic
Acute
SEER Observed Incidence RatesLymphocytic and Myeloid Leukemia (Acute and Chronic) by Sex
a
Figure 132
Source SEER 9 areas Rates are age-adjusted to the 2000 US Std Population (19 age groups - Census P25-1103)Regression lines and APCs are calculated using the Joinpoint Regression Program Version 47 February 2019 National Cancer Institute
a
Male Female Male FemaleLymphocytic Leukemia Myeloid Leukemia
Rate per 100000 Rate per 100000 Rate per 100000 Rate per 100000
Year of Diagnosis Year of Diagnosis Year of Diagnosis Year of Diagnosis
SEE
R C
ancer Statistics Review
1975-2016N
ational Cancer Institute
Joinpoint Analyses for Whites and Blacks from 1975-2016and for AsianPacific Islanders American IndiansAlaska Natives and Hispanics from 2000-2016
0
5
10
15
20
1975 1985 1995 2005 20160
5
10
15
20
1975 1985 1995 2005 2016
White
Black
API
AIAN
Hispanic
SEER Incidence and US Death RatesLeukemia Both Sexes
Figure 133
Source Incidence data for whites and blacks are from the SEER 9 areas (San Francisco Connecticut Detroit Hawaii Iowa New Mexico Seattle Utah Atlanta)Incidence data for AsianPacific Islanders American IndiansAlaska Natives and Hispanics are from the SEER 21 areas (SEER 9 areas San Jose-MontereyLos Angeles Alaska Native Registry Rural Georgia California excluding SFSJMLA Kentucky Louisiana New Jersey Georgia excluding ATLRG Idaho New York andMassachusetts)Mortality data are from US Mortality Files National Center for Health Statistics CDCRates are age-adjusted to the 2000 US Std Population (19 age groups - Census P25-1103)Regression lines are calculated using the Joinpoint Regression Program Version 47 February 2019 National Cancer Institute Joinpoint analyses for Whites andBlacks during the 1975-2016 period allow a maximum of 5 joinpoints Analyses for other ethnic groups during the period 2000-2016 allow a maximum of 3 joinpointsAPI = AsianPacific IslanderAIAN = American IndianAlaska Native Rates for American IndianAlaska Native are based on the PurchasedReferred Care Delivery Area (PRCDA) countiesHispanic is not mutually exclusive from whites blacks AsianPacific Islanders and American IndiansAlaska Natives Incidence data for Hispanics are based onNHIA and exclude cases from the Alaska Native Registry
Incidence MortalityRate per 100000 Rate per 100000
Year of Diagnosis Year of Death
a
d
a
b
c
c
b
d
SEE
R C
ancer Statistics Review
1975-2016N
ational Cancer Institute
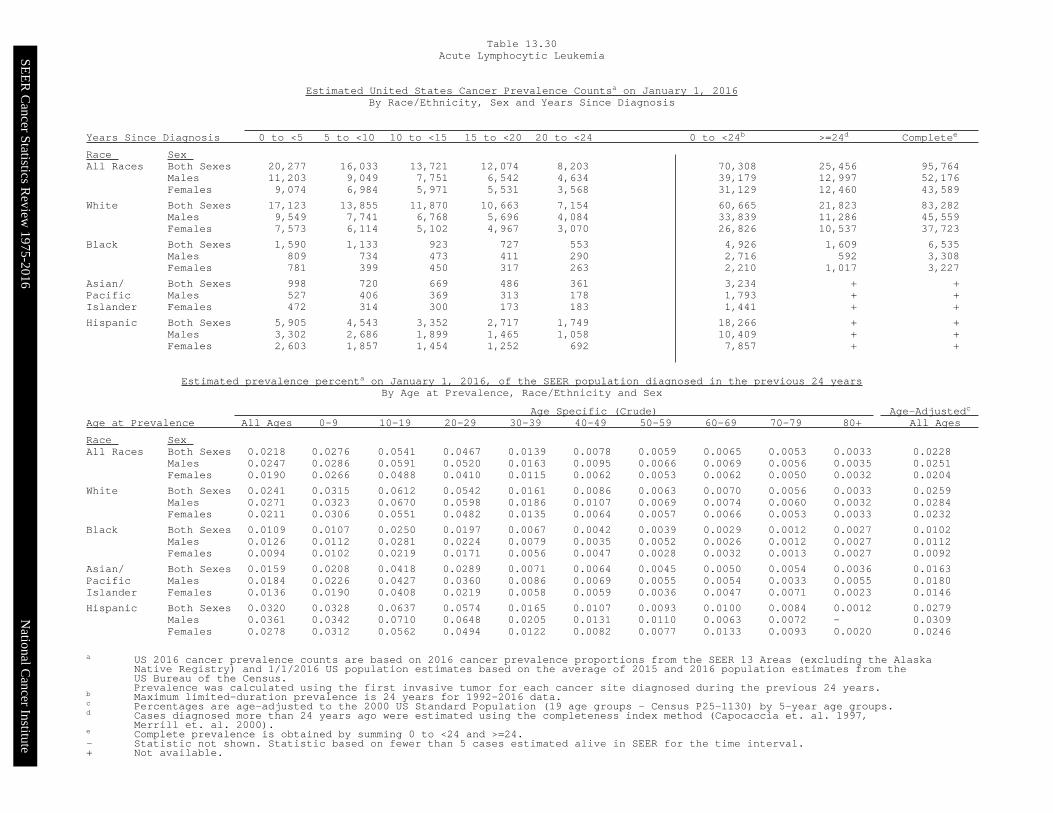
SEE
R C
ancer Statistics Review
1975-2016N
ational Cancer Institute
a US 2016 cancer prevalence counts are based on 2016 cancer prevalence proportions from the SEER 13 Areas (excluding the AlaskaNative Registry) and 112016 US population estimates based on the average of 2015 and 2016 population estimates from theUS Bureau of the CensusPrevalence was calculated using the first invasive tumor for each cancer site diagnosed during the previous 24 years
b Maximum limited-duration prevalence is 24 years for 1992-2016 datac Percentages are age-adjusted to the 2000 US Standard Population (19 age groups - Census P25-1130) by 5-year age groupsd Cases diagnosed more than 24 years ago were estimated using the completeness index method (Capocaccia et al 1997
Merrill et al 2000)e Complete prevalence is obtained by summing 0 to lt24 and gt=24- Statistic not shown Statistic based on fewer than 5 cases estimated alive in SEER for the time interval+ Not available
Years Since Diagnosis 0 to lt5 5 to lt10 10 to lt15 15 to lt20 20 to lt24 0 to lt24b gt=24d Completee
Race Sex All Races Both Sexes 20277 16033 13721 12074 8203 70308 25456 95764
Males 11203 9049 7751 6542 4634 39179 12997 52176Females 9074 6984 5971 5531 3568 31129 12460 43589
White Both Sexes 17123 13855 11870 10663 7154 60665 21823 83282Males 9549 7741 6768 5696 4084 33839 11286 45559Females 7573 6114 5102 4967 3070 26826 10537 37723
Black Both Sexes 1590 1133 923 727 553 4926 1609 6535Males 809 734 473 411 290 2716 592 3308Females 781 399 450 317 263 2210 1017 3227
Asian Both Sexes 998 720 669 486 361 3234 + +Pacific Males 527 406 369 313 178 1793 + +Islander Females 472 314 300 173 183 1441 + +
Hispanic Both Sexes 5905 4543 3352 2717 1749 18266 + +Males 3302 2686 1899 1465 1058 10409 + +Females 2603 1857 1454 1252 692 7857 + +
Age Specific (Crude) Age-Adjustedc Age at Prevalence All Ages 0-9 10-19 20-29 30-39 40-49 50-59 60-69 70-79 80+ All Ages
Race Sex All Races Both Sexes 00218 00276 00541 00467 00139 00078 00059 00065 00053 00033 00228
Males 00247 00286 00591 00520 00163 00095 00066 00069 00056 00035 00251Females 00190 00266 00488 00410 00115 00062 00053 00062 00050 00032 00204
White Both Sexes 00241 00315 00612 00542 00161 00086 00063 00070 00056 00033 00259Males 00271 00323 00670 00598 00186 00107 00069 00074 00060 00032 00284Females 00211 00306 00551 00482 00135 00064 00057 00066 00053 00033 00232
Black Both Sexes 00109 00107 00250 00197 00067 00042 00039 00029 00012 00027 00102Males 00126 00112 00281 00224 00079 00035 00052 00026 00012 00027 00112Females 00094 00102 00219 00171 00056 00047 00028 00032 00013 00027 00092
Asian Both Sexes 00159 00208 00418 00289 00071 00064 00045 00050 00054 00036 00163Pacific Males 00184 00226 00427 00360 00086 00069 00055 00054 00033 00055 00180Islander Females 00136 00190 00408 00219 00058 00059 00036 00047 00071 00023 00146
Hispanic Both Sexes 00320 00328 00637 00574 00165 00107 00093 00100 00084 00012 00279Males 00361 00342 00710 00648 00205 00131 00110 00063 00072 - 00309Females 00278 00312 00562 00494 00122 00082 00077 00133 00093 00020 00246
Table 1330Acute Lymphocytic Leukemia
Estimated United States Cancer Prevalence Countsa on January 1 2016By RaceEthnicity Sex and Years Since Diagnosis
Estimated prevalence percenta on January 1 2016 of the SEER population diagnosed in the previous 24 yearsBy Age at Prevalence RaceEthnicity and Sex
0
5
10
15
20
25
1975 1985 1995 2005 20160
5
10
15
20
25
1975 1985 1995 2005 20160
3
6
9
12
15
1975 1985 1995 2005 20160
3
6
9
12
15
1975 1985 1995 2005 2016
Delay-Adj IncidenceDelay-Adj Incidence
Observed IncidenceObserved Incidence
MortalityMortality
SEER Observed Incidence SEER Delay Adjusted Incidence and US Death RatesLeukemia by Race and Sex
a
Figure 131
Source SEER 9 areas and US Mortality Files (National Center for Health Statistics CDC)Rates are age-adjusted to the 2000 US Std Population (19 age groups - Census P25-1103)Regression lines and APCs are calculated using the Joinpoint Regression Program Version 47 February 2019 National Cancer InstituteThe APC is the Annual Percent Change for the regression line segments The APC shown on the graph is for the most recent trendThe APC is significantly different from zero (p lt 005)
a
White Male Black Male White Female Black FemaleRate per 100000 Rate per 100000 Rate per 100000 Rate per 100000
Year of DiagnosisDeath Year of DiagnosisDeath Year of DiagnosisDeath Year of DiagnosisDeath
SEER Incidence APCsDelay Adj 1998-16 = 08Observed 1975-16 = 03
US Mortality APC2013-16 = -30
SEER Incidence APCsDelay Adj 1975-16 = 02Observed 1975-16 = 01
US Mortality APC1993-16 = -15
SEER Incidence APCsDelay Adj 1975-16 = 06Observed 1975-16 = 05
US Mortality APC2000-16 = -12
SEER Incidence APCsDelay Adj 1975-16 = 03Observed 1975-16 = 02
US Mortality APC1993-16 = -13
SEE
R C
ancer Statistics Review
1975-2016N
ational Cancer Institute
0
1
2
3
4
5
6
7
8
1975 1985 1995 2005 20160
1
2
3
4
5
6
7
8
1975 1985 1995 2005 20160
1
2
3
4
5
6
7
8
1975 1985 1995 2005 20160
1
2
3
4
5
6
7
8
1975 1985 1995 2005 2016
Chronic
Acute
SEER Observed Incidence RatesLymphocytic and Myeloid Leukemia (Acute and Chronic) by Sex
a
Figure 132
Source SEER 9 areas Rates are age-adjusted to the 2000 US Std Population (19 age groups - Census P25-1103)Regression lines and APCs are calculated using the Joinpoint Regression Program Version 47 February 2019 National Cancer Institute
a
Male Female Male FemaleLymphocytic Leukemia Myeloid Leukemia
Rate per 100000 Rate per 100000 Rate per 100000 Rate per 100000
Year of Diagnosis Year of Diagnosis Year of Diagnosis Year of Diagnosis
SEE
R C
ancer Statistics Review
1975-2016N
ational Cancer Institute
Joinpoint Analyses for Whites and Blacks from 1975-2016and for AsianPacific Islanders American IndiansAlaska Natives and Hispanics from 2000-2016
0
5
10
15
20
1975 1985 1995 2005 20160
5
10
15
20
1975 1985 1995 2005 2016
White
Black
API
AIAN
Hispanic
SEER Incidence and US Death RatesLeukemia Both Sexes
Figure 133
Source Incidence data for whites and blacks are from the SEER 9 areas (San Francisco Connecticut Detroit Hawaii Iowa New Mexico Seattle Utah Atlanta)Incidence data for AsianPacific Islanders American IndiansAlaska Natives and Hispanics are from the SEER 21 areas (SEER 9 areas San Jose-MontereyLos Angeles Alaska Native Registry Rural Georgia California excluding SFSJMLA Kentucky Louisiana New Jersey Georgia excluding ATLRG Idaho New York andMassachusetts)Mortality data are from US Mortality Files National Center for Health Statistics CDCRates are age-adjusted to the 2000 US Std Population (19 age groups - Census P25-1103)Regression lines are calculated using the Joinpoint Regression Program Version 47 February 2019 National Cancer Institute Joinpoint analyses for Whites andBlacks during the 1975-2016 period allow a maximum of 5 joinpoints Analyses for other ethnic groups during the period 2000-2016 allow a maximum of 3 joinpointsAPI = AsianPacific IslanderAIAN = American IndianAlaska Native Rates for American IndianAlaska Native are based on the PurchasedReferred Care Delivery Area (PRCDA) countiesHispanic is not mutually exclusive from whites blacks AsianPacific Islanders and American IndiansAlaska Natives Incidence data for Hispanics are based onNHIA and exclude cases from the Alaska Native Registry
Incidence MortalityRate per 100000 Rate per 100000
Year of Diagnosis Year of Death
a
d
a
b
c
c
b
d
SEE
R C
ancer Statistics Review
1975-2016N
ational Cancer Institute
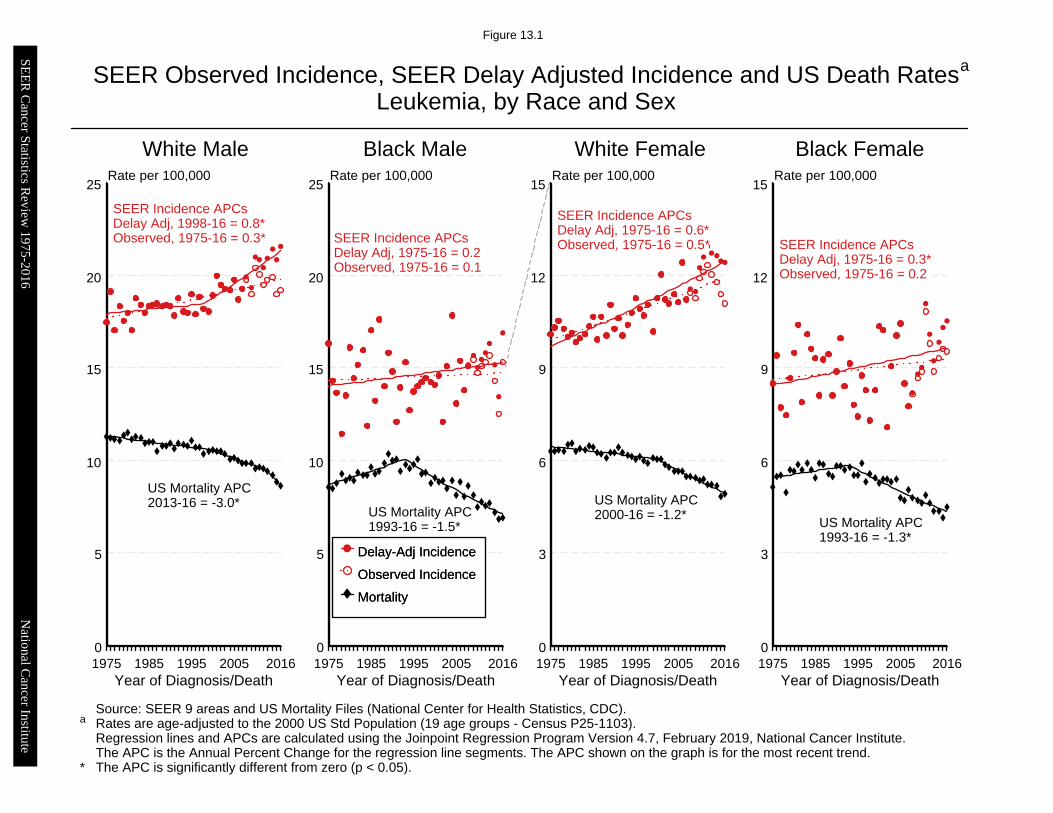
0
5
10
15
20
25
1975 1985 1995 2005 20160
5
10
15
20
25
1975 1985 1995 2005 20160
3
6
9
12
15
1975 1985 1995 2005 20160
3
6
9
12
15
1975 1985 1995 2005 2016
Delay-Adj IncidenceDelay-Adj Incidence
Observed IncidenceObserved Incidence
MortalityMortality
SEER Observed Incidence SEER Delay Adjusted Incidence and US Death RatesLeukemia by Race and Sex
a
Figure 131
Source SEER 9 areas and US Mortality Files (National Center for Health Statistics CDC)Rates are age-adjusted to the 2000 US Std Population (19 age groups - Census P25-1103)Regression lines and APCs are calculated using the Joinpoint Regression Program Version 47 February 2019 National Cancer InstituteThe APC is the Annual Percent Change for the regression line segments The APC shown on the graph is for the most recent trendThe APC is significantly different from zero (p lt 005)
a
White Male Black Male White Female Black FemaleRate per 100000 Rate per 100000 Rate per 100000 Rate per 100000
Year of DiagnosisDeath Year of DiagnosisDeath Year of DiagnosisDeath Year of DiagnosisDeath
SEER Incidence APCsDelay Adj 1998-16 = 08Observed 1975-16 = 03
US Mortality APC2013-16 = -30
SEER Incidence APCsDelay Adj 1975-16 = 02Observed 1975-16 = 01
US Mortality APC1993-16 = -15
SEER Incidence APCsDelay Adj 1975-16 = 06Observed 1975-16 = 05
US Mortality APC2000-16 = -12
SEER Incidence APCsDelay Adj 1975-16 = 03Observed 1975-16 = 02
US Mortality APC1993-16 = -13
SEE
R C
ancer Statistics Review
1975-2016N
ational Cancer Institute
0
1
2
3
4
5
6
7
8
1975 1985 1995 2005 20160
1
2
3
4
5
6
7
8
1975 1985 1995 2005 20160
1
2
3
4
5
6
7
8
1975 1985 1995 2005 20160
1
2
3
4
5
6
7
8
1975 1985 1995 2005 2016
Chronic
Acute
SEER Observed Incidence RatesLymphocytic and Myeloid Leukemia (Acute and Chronic) by Sex
a
Figure 132
Source SEER 9 areas Rates are age-adjusted to the 2000 US Std Population (19 age groups - Census P25-1103)Regression lines and APCs are calculated using the Joinpoint Regression Program Version 47 February 2019 National Cancer Institute
a
Male Female Male FemaleLymphocytic Leukemia Myeloid Leukemia
Rate per 100000 Rate per 100000 Rate per 100000 Rate per 100000
Year of Diagnosis Year of Diagnosis Year of Diagnosis Year of Diagnosis
SEE
R C
ancer Statistics Review
1975-2016N
ational Cancer Institute
Joinpoint Analyses for Whites and Blacks from 1975-2016and for AsianPacific Islanders American IndiansAlaska Natives and Hispanics from 2000-2016
0
5
10
15
20
1975 1985 1995 2005 20160
5
10
15
20
1975 1985 1995 2005 2016
White
Black
API
AIAN
Hispanic
SEER Incidence and US Death RatesLeukemia Both Sexes
Figure 133
Source Incidence data for whites and blacks are from the SEER 9 areas (San Francisco Connecticut Detroit Hawaii Iowa New Mexico Seattle Utah Atlanta)Incidence data for AsianPacific Islanders American IndiansAlaska Natives and Hispanics are from the SEER 21 areas (SEER 9 areas San Jose-MontereyLos Angeles Alaska Native Registry Rural Georgia California excluding SFSJMLA Kentucky Louisiana New Jersey Georgia excluding ATLRG Idaho New York andMassachusetts)Mortality data are from US Mortality Files National Center for Health Statistics CDCRates are age-adjusted to the 2000 US Std Population (19 age groups - Census P25-1103)Regression lines are calculated using the Joinpoint Regression Program Version 47 February 2019 National Cancer Institute Joinpoint analyses for Whites andBlacks during the 1975-2016 period allow a maximum of 5 joinpoints Analyses for other ethnic groups during the period 2000-2016 allow a maximum of 3 joinpointsAPI = AsianPacific IslanderAIAN = American IndianAlaska Native Rates for American IndianAlaska Native are based on the PurchasedReferred Care Delivery Area (PRCDA) countiesHispanic is not mutually exclusive from whites blacks AsianPacific Islanders and American IndiansAlaska Natives Incidence data for Hispanics are based onNHIA and exclude cases from the Alaska Native Registry
Incidence MortalityRate per 100000 Rate per 100000
Year of Diagnosis Year of Death
a
d
a
b
c
c
b
d
SEE
R C
ancer Statistics Review
1975-2016N
ational Cancer Institute
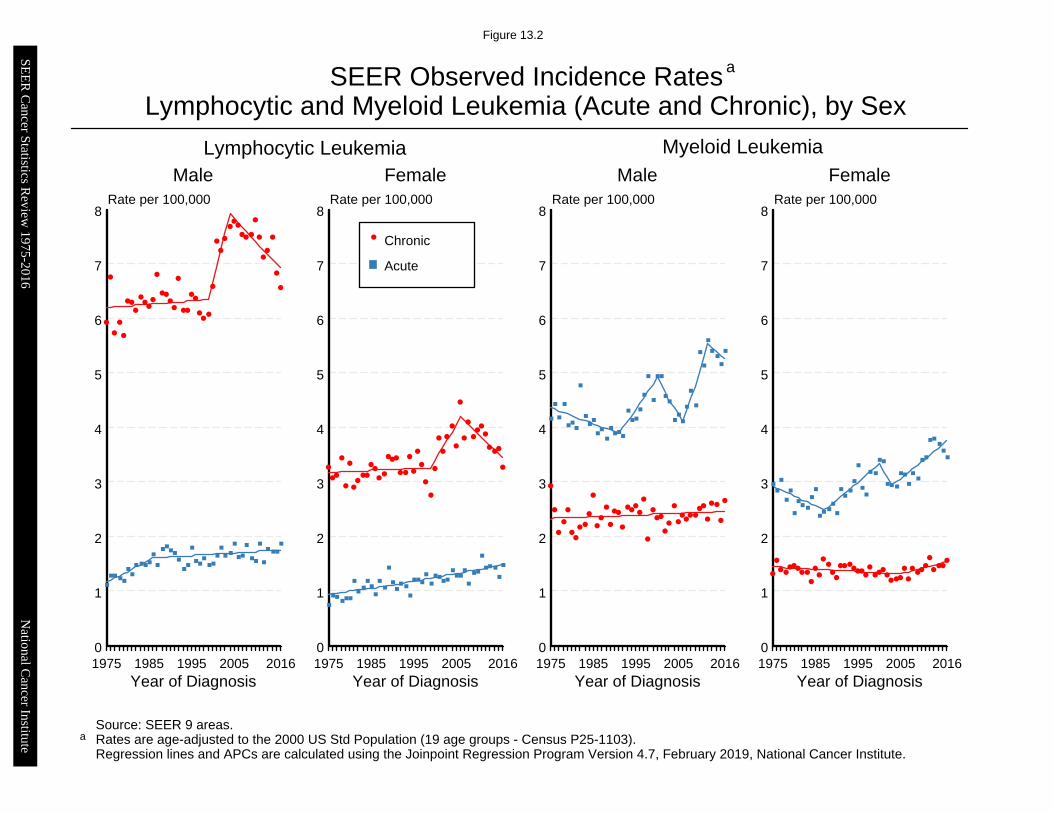
0
1
2
3
4
5
6
7
8
1975 1985 1995 2005 20160
1
2
3
4
5
6
7
8
1975 1985 1995 2005 20160
1
2
3
4
5
6
7
8
1975 1985 1995 2005 20160
1
2
3
4
5
6
7
8
1975 1985 1995 2005 2016
Chronic
Acute
SEER Observed Incidence RatesLymphocytic and Myeloid Leukemia (Acute and Chronic) by Sex
a
Figure 132
Source SEER 9 areas Rates are age-adjusted to the 2000 US Std Population (19 age groups - Census P25-1103)Regression lines and APCs are calculated using the Joinpoint Regression Program Version 47 February 2019 National Cancer Institute
a
Male Female Male FemaleLymphocytic Leukemia Myeloid Leukemia
Rate per 100000 Rate per 100000 Rate per 100000 Rate per 100000
Year of Diagnosis Year of Diagnosis Year of Diagnosis Year of Diagnosis
SEE
R C
ancer Statistics Review
1975-2016N
ational Cancer Institute
Joinpoint Analyses for Whites and Blacks from 1975-2016and for AsianPacific Islanders American IndiansAlaska Natives and Hispanics from 2000-2016
0
5
10
15
20
1975 1985 1995 2005 20160
5
10
15
20
1975 1985 1995 2005 2016
White
Black
API
AIAN
Hispanic
SEER Incidence and US Death RatesLeukemia Both Sexes
Figure 133
Source Incidence data for whites and blacks are from the SEER 9 areas (San Francisco Connecticut Detroit Hawaii Iowa New Mexico Seattle Utah Atlanta)Incidence data for AsianPacific Islanders American IndiansAlaska Natives and Hispanics are from the SEER 21 areas (SEER 9 areas San Jose-MontereyLos Angeles Alaska Native Registry Rural Georgia California excluding SFSJMLA Kentucky Louisiana New Jersey Georgia excluding ATLRG Idaho New York andMassachusetts)Mortality data are from US Mortality Files National Center for Health Statistics CDCRates are age-adjusted to the 2000 US Std Population (19 age groups - Census P25-1103)Regression lines are calculated using the Joinpoint Regression Program Version 47 February 2019 National Cancer Institute Joinpoint analyses for Whites andBlacks during the 1975-2016 period allow a maximum of 5 joinpoints Analyses for other ethnic groups during the period 2000-2016 allow a maximum of 3 joinpointsAPI = AsianPacific IslanderAIAN = American IndianAlaska Native Rates for American IndianAlaska Native are based on the PurchasedReferred Care Delivery Area (PRCDA) countiesHispanic is not mutually exclusive from whites blacks AsianPacific Islanders and American IndiansAlaska Natives Incidence data for Hispanics are based onNHIA and exclude cases from the Alaska Native Registry
Incidence MortalityRate per 100000 Rate per 100000
Year of Diagnosis Year of Death
a
d
a
b
c
c
b
d
SEE
R C
ancer Statistics Review
1975-2016N
ational Cancer Institute
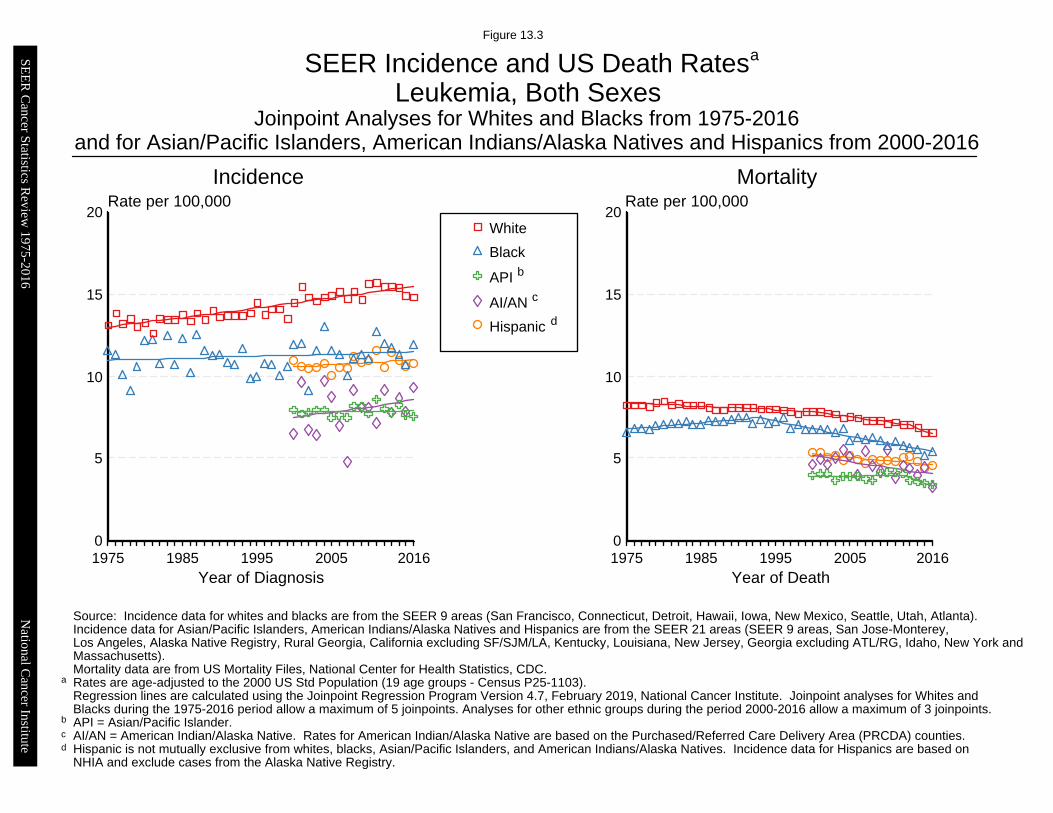