Embed Size (px)
Citation preview

Rhode Island NECAP Science Results for Students in Grades 4, 8, and 11
May 2010 Test Administration
Rhode Island Department of Elementary and Secondary Education
Office of Instruction, Assessment, and Curriculum
Director: Phyllis Lynch, Ph.D.
SEPTEMBER 28, 2010

2010 RI NECAP Science Results for Students in Grades 4, 8, and 11
1 | P a g e
Table of Contents ................................................................................................................ 1
Executive Summary .......................................................................................................... 2
Section 1: State-By-State Comparisons .......................................................................... 3
Section 2: District and School Comparisons .................................................................. 6
Grade 4 ........................................................................................................................... 6
Grade 8 ......................................................................................................................... 10
Grade 11 ....................................................................................................................... 13
Section 3: Sub-Group Comparisons .............................................................................. 16
Achievement Gaps ..................................................................................................... 17
Appendix: Definition of Confidence Interval (CI) ......................................................... 18

2010 RI NECAP Science Results for Students in Grades 4, 8, and 11
2 | P a g e
EEXXEECCUUTTIIVVEE SSUUMMMMAARRYY Results of the New England Common Assessment Program (NECAP) Science assessment, administered last
May to students in grades 4, 8, and 11 showed that statewide, roughly 29 percent of Rhode Island students were
proficient in science (up 3.6 percent from the previous administration in May 2009). Additionally, all grades
across the state this year had a higher percentage of students who scored in the proficient category and, with the
exception of elementary school students, had a lower percentage of students who scored in the substantially
below proficient category.
In Grade 4 approximately 44 percent of students were proficient or above, representing the second largest gain
(up nearly 4%) of the three tested grades. In Grade 8, nearly 23 percent of students were at or above proficient,
representing the largest gain (up 5%) of the three grades tested compared to results from last year’s test
administration. Grade 11 had the smallest gain (up only 1%), with roughly 21 percent of students across the
state scoring at or above proficient.
Table 1. Statewide results by grade level.
Grade
%
SBP
2008
%
PP
2008
%
P
2008
%
PwD
2008
% P
+
PwD
2008 CI
%
SBP
2009
%
PP
2009
% P
2009
%
PwD
2009
% P
+
PwD
2009 CI
%
SBP
2010
%
PP
2010
% P
2010
%
PwD
2010
% P
+
PwD
2010 CI
Difference
between
2009 and
2010 % P
or above
ALL 33.1 43.1 23.1 0.8 23.8 0.2 31.4 43.4 24.7 0.5 25.2 0.2 28 43.3 27.9 0.9 28.8 0.3 3.6
4th 21.8 41.8 35.2 1.2 36.4 0.5 19.9 39.9 39.9 0.3 40.3 0.5 20 35.9 42.8 1.3 44.1 0.5 3.8
8th 38 43.3 18.3 0.4 18.7 0.4 37.6 44.9 17.1 0.4 17.6 0.4 31.2 46.2 22.2 0.4 22.6 0.4 5.0
11th 39.3 44.3 15.7 0.7 16.4 0.4 35.5 45 18.8 0.7 19.4 0.4 32.3 47.2 19.5 1.0 20.5 0.4 1.1
Key
SBP = Substantially Below Proficient
PP = Partially Proficient P = Proficient
PwD = Proficient with Distinction
CI = Confidence Interval (see Appendix) = Statistically significant increase in percent of students proficient or above from 2009 to 2010 NECAP science results
Overall, while there were some notable increases in the percentage of students who scored at or above proficient
on the NECAP Science assessment in various student subgroups and at some Rhode Island schools and districts,
there is still much work to be done across the state in order to increase student achievement in the area of
science.

2010 RI NECAP Science Results for Students in Grades 4, 8, and 11
3 | P a g e
QQUUEESSTTIIOONN::
How are Grade 4 students in Rhode Island performing on the NECAP science compared to
students in New Hampshire and Vermont?
SSUUPPPPOORRTTIINNGG DDAATTAA::
Table 3. NECAP Science Assessment percent of Grade 4 students at or above proficient across states
Year NH RI VT
2008 51 36 48
2009 53 40 52
2010 54 44 54
Figure 1. Grade 4 science proficiency: NH vs. RI vs. VT
AANNAALLYYSSIISS::
In 2010, Rhode Island increased achievement in Grade 4 science by 4% compared to 1% and 2% for
New Hampshire and Vermont, respectively.
During the three years that NECAP Science has been administered in the three states, the percent of
Grade 4 students scoring proficient or above has increased the most in Rhode Island, with 8% compared
to 3% and 6% increases for New Hampshire and Vermont, respectively.
While the gap is narrowing, Rhode Island Grade 4 students continue to lag far behind those of the other
two NECAP states in science proficiency.
51
36
4853
40
5254
44
54
0
10
20
30
40
50
60
70
80
90
100
NH RI VT
% P
rofi
cie
nt
2008
2009
2010

2010 RI NECAP Science Results for Students in Grades 4, 8, and 11
4 | P a g e
QQUUEESSTTIIOONN::
How are Grade 8 students in Rhode Island performing on the NECAP science compared to
students in New Hampshire and Vermont?
SSUUPPPPOORRTTIINNGG DDAATTAA::
Table 4. NECAP Science Assessment percent of Grade 8 students at or above proficient across states
Year NH RI VT
2008 26 18 27
2009 24 17 25
2010 27 22 29
Figure 2. Grade 8 science proficiency: NH vs. RI vs. VT
In 2010, while all three NECAP states experienced an increase in Grade 8 science achievement, the
percent of Rhode Island Grade 8 students scoring proficient or higher increased the most (5% increase
vs. 3% and 4% for New Hampshire and Vermont, respectively.
Rhode Island Grade 8 students continue to lag behind those of the other two NECAP states in science
proficiency.
26
18
2724
17
252722
29
0
10
20
30
40
50
60
70
80
90
100
NH RI VT
% P
rofi
cie
nt
2008
2009
2010

2010 RI NECAP Science Results for Students in Grades 4, 8, and 11
5 | P a g e
::
How are Grade 11 students in Rhode Island performing on the NECAP science compared to
students in New Hampshire and Vermont?
SSUUPPPPOORRTTIINNGG DDAATTAA::
Table 5. NECAP Science Assessment percent of Grade 11 students at or above proficient across states
Year NH RI VT
2008 22 17 25
2009 24 19 27
2010 24 20 28
Figure 3. Grade 11 science proficiency: NH vs. RI vs. VT
AANNAALLYYSSIISS::
In 2010, Vermont and Rhode Island had slight increases (+1%) in Grade 11 science achievement while
New Hampshire held constant.
Rhode Island Grade 11 students continue to lag behind those of the other two NECAP states in science
proficiency.
2217
252419
2724
20
28
0
10
20
30
40
50
60
70
80
90
100
NH RI VT
% P
rofi
cie
nt
2008
2009
2010

2010 RI NECAP Science Results for Students in Grades 4, 8, and 11
6 | P a g e
QQUUEESSTTIIOONN::
How did districts and schools in RI perform on the NECAP science assessment compared to each other?
SSUUPPPPOORRTTIINNGG DDAATTAA (presented by grade)::
Table 6. Percent of Students At/Above Proficient by District: Grade 4 only (table sorted based on 2010 results)
District
N
tested
2008
%
prof.
2008
CI
N
tested
2009
%
prof.
2009
CI
N
tested
2010
%
prof.
2010
CI
2009 to 2010
Gr. 4 difference
in % prof.
Kingston Hill Academy 42 47.6 7.7 34 50.0 8.6 21 90.5 6.4 40.5
The Compass School 17 70.6 11.1 17 52.9 12.1 18 88.9 7.4 35.9
East Greenwich 200 58.0 3.5 146 70.5 3.8 184 76.6 3.1 6.1
Chariho 266 54.1 3.1 273 51.6 3.0 245 73.9 2.8 22.2
Barrington 245 70.2 2.9 236 76.3 2.8 286 73.8 2.6 -2.5
Little Compton 34 50.0 8.6 45 53.3 7.4 34 73.5 7.6 20.2
Jamestown 45 42.2 7.4 56 67.9 6.2 52 71.2 6.3 3.3
South Kingstown 265 52.1 3.1 246 61.8 3.1 250 70.8 2.9 9.0
Scituate 155 52.9 4.0 121 57.0 4.5 126 69.0 4.1 12.0
Portsmouth 195 51.8 3.6 196 60.7 3.5 189 68.3 3.4 7.5
Smithfield 197 58.9 3.5 175 64.0 3.6 165 67.9 3.6 3.9
North Kingstown 322 56.8 2.8 281 62.3 2.9 282 65.6 2.8 3.3
Tiverton 148 49.3 4.1 131 47.3 4.4 146 64.4 4.0 17.1
Coventry 413 46.2 2.5 364 46.7 2.6 400 60.8 2.4 14.0
North Smithfield 141 52.5 4.2 131 59.5 4.3 114 60.5 4.6 1.0
Glocester 130 50.0 4.4 96 46.9 5.1 101 60.4 4.9 13.5
Foster 57 56.1 6.6 35 62.9 8.2 44 59.1 7.4 -3.8
Johnston 280 45.0 3.0 211 44.5 3.4 194 58.8 3.5 14.2
Lincoln 258 51.6 3.1 227 59.0 3.3 216 58.3 3.4 -0.7
Bristol Warren 253 46.6 3.1 218 45.4 3.4 236 52.1 3.3 6.7
Cranston 781 50.3 1.8 722 48.9 1.9 760 50.8 1.8 1.9
Westerly 234 48.3 3.3 218 47.2 3.4 217 48.8 3.4 1.6
Exeter-West Greenwich 136 36.8 4.1 138 53.6 4.2 130 48.5 4.4 -5.2
Narragansett 77 50.6 5.7 86 58.1 5.3 108 48.1 4.8 -10.0
Cumberland 372 40.1 2.5 370 44.9 2.6 309 46.0 2.8 1.1
Middletown 176 38.6 3.7 190 47.9 3.6 169 45.6 3.8 -2.3
North Providence 222 31.5 3.1 190 37.9 3.5 210 44.8 3.4 6.9
Rhode Island Gr. 4 11004 36.4 0.5 9648 40.3 0.5 10059 44.1 0.5 3.8
Warwick 824 43.7 1.7 715 45.7 1.9 721 43.6 1.8 -2.2
Newport 179 34.6 3.6 123 30.9 4.2 175 43.4 3.7 12.5
East Providence 456 35.7 2.2 328 38.7 2.7 411 41.6 2.4 2.9
Paul Cuffee Charter School 47 31.9 6.8 50 32.0 6.6 54 40.7 6.7 8.7
Burrillville 166 39.8 3.8 166 39.8 3.8 192 39.1 3.5 -0.7
Woonsocket 515 20.4 1.8 390 25.4 2.2 381 34.4 2.4 9.0
West Warwick 259 25.5 2.7 231 34.2 3.1 271 32.1 2.8 -2.1
Central Falls 264 15.2 2.2 203 15.3 2.5 222 22.1 2.8 6.8
International Charter 49 10.2 4.3 49 22.4 6.0 47 21.3 6.0 -1.2
Pawtucket 660 17.1 1.5 626 20.6 1.6 630 19.5 1.6 -1.1
Providence 1843 9.4 0.7 1476 12.4 0.9 1641 16.3 0.9 3.9
Learning Community 40 22.5 6.6 57 21.1 5.4 54 13.0 4.6 -8.1
Highlander 17 23.5 10.3 18 16.7 8.8 36 8.3 4.6 -8.3
New Shoreham 10 70.0 14.5 11 72.7 13.4 - - - -
R.I. School for the Deaf - - - - - - - - - -
Key
CI = Confidence Interval (see Appendix) - = All information associated with n sizes <10 has been redacted as per RIDE policy.
= Statistically significant decrease in percent of students proficient or above from 2009 to 2010 NECAP science results
= Statistically significant increase in percent of students proficient or above from 2009 to 2010 NECAP science results = No statistically significant change from 2009 to 2010 NECAP science results

2010 RI NECAP Science Results for Students in Grades 4, 8, and 11
7 | P a g e
Figure 4. Difference Between 2009 and 2010 Percent Proficient in Each District: Grade 4
Table 7. Percent of Students At/Above Proficient by School: Grade 4 only (table sorted based on 2010 results)
District School
N
tested
2009
% prof.
2009 CI
N
tested
2010
% prof.
2010 CI
2009 to 2010 Gr. 4
difference in % prof.
Smithfield Raymond C. LaPerche School 41 95.1 3.4 24 95.8 4.1 0.7
Kingston Hill Academy Kingston Hill Academy 34 50.0 8.6 21 90.5 6.4 40.5
The Compass School The Compass School 17 52.9 12.1 18 88.9 7.4 36.0
South Kingstown Matunuck School 55 61.8 6.6 60 85.0 4.6 23.2
East Greenwich George Hanaford School 72 81.9 4.5 89 79.8 4.3 -2.2
Cranston Woodridge School 44 59.1 7.4 45 77.8 6.2 18.7
Chariho Charlestown Elementary School 72 52.8 5.9 74 77.0 4.9 24.3
Lincoln Saylesville Elementary School 61 63.9 6.2 44 75.0 6.5 11.1
Chariho Ashaway Elementary School 52 42.3 6.9 36 75.0 7.2 32.7
South Kingstown Peace Dale Elementary School 81 56.8 5.5 83 74.7 4.8 17.9
Scituate Hope Elementary School 37 54.1 8.2 47 74.5 6.4 20.4
Barrington Hampden Meadows School 236 76.3 2.8 286 73.8 2.6 -2.5
East Greenwich James H. Eldredge El. School 74 59.5 5.7 95 73.7 4.5 14.2
Portsmouth Elmhurst School 73 67.1 5.5 68 73.5 5.4 6.4
Little Compton Wilbur and McMahon Schools 45 53.3 7.4 34 73.5 7.6 20.2
Tiverton Fort Barton School 23 60.9 10.2 45 73.3 6.6 12.5
Chariho Richmond Elementary School 101 57.4 4.9 93 73.1 4.6 15.7
Cranston Edward S. Rhodes School 35 57.1 8.4 35 71.4 7.6 14.3
Jamestown Jamestown School-Melrose 56 67.9 6.2 52 71.2 6.3 3.3
Smithfield Anna M. McCabe School 49 51.0 7.1 54 70.4 6.2 19.4
North Kingstown Hamilton Elementary School 180 70.6 3.4 174 70.1 3.5 -0.4
Smithfield William Winsor School 50 64.0 6.8 46 69.6 6.8 5.6
Warwick Cedar Hill School 65 60.0 6.1 62 69.4 5.9 9.4
Chariho Hope Valley Elementary School 48 47.9 7.2 42 69.0 7.1 21.1

2010 RI NECAP Science Results for Students in Grades 4, 8, and 11
8 | P a g e
District School
N
tested
2009
% prof.
2009 CI
N
tested
2010
% prof.
2010 CI
2009 to 2010 Gr. 4
difference in % prof.
Cranston Hope Highlands Elementary 53 64.2 6.6 47 68.1 6.8 3.9
Lincoln Lincoln Central Elementary 73 72.6 5.2 61 67.2 6.0 -5.4
Scituate Clayville Elementary School 36 69.4 7.7 39 66.7 7.6 -2.8
Tiverton Walter E. Ranger School 62 56.5 6.3 51 66.7 6.6 10.2
Coventry Western Coventry School 64 78.1 5.2 68 66.2 5.7 -12.0
Johnston Brown Avenue School 43 60.5 7.5 44 65.9 7.2 5.4
Portsmouth Howard Hathaway School 65 56.9 6.1 75 65.3 5.5 8.4
Portsmouth Melville Elementary School 58 56.9 6.5 46 65.2 7.0 8.3
Scituate North Scituate Elementary School 48 50.0 7.2 40 65.0 7.5 15.0
Johnston Sarah Dyer Barnes School 46 43.5 7.3 20 65.0 10.7 21.5
Coventry Tiogue School 48 70.8 6.6 76 64.5 5.5 -6.4
Bristol Warren Rockwell School 39 66.7 7.6 45 64.4 7.1 -2.2
Cranston Oak Lawn School 50 30.0 6.5 47 63.8 7.0 33.8
North Providence Greystone School 27 37.0 9.3 33 63.6 8.4 26.6
Cranston Orchard Farms Elementary School 59 71.2 5.9 60 61.7 6.3 -9.5
South Kingstown Wakefield Elementary School 51 66.7 6.6 47 61.7 7.1 -5.0
Newport William J. Underwood School 20 40.0 11.0 44 61.4 7.3 21.4
Glocester Fogarty Memorial School 40 57.5 7.8 49 61.2 7.0 3.7
Cranston Stone Hill School 43 65.1 7.3 46 60.9 7.2 -4.3
Warwick Park School 38 44.7 8.1 28 60.7 9.2 16.0
East Providence Myron J. Francis Elementary 48 64.6 6.9 76 60.5 5.6 -4.1
North Smithfield Halliwell Memorial School 131 59.5 4.3 114 60.5 4.6 1.0
Glocester West Glocester Elementary 56 39.3 6.5 52 59.6 6.8 20.3
North Kingstown Henseler Quidnessett Elementary 101 47.5 5.0 106 59.4 4.8 11.9
South Kingstown West Kingston Elementary 59 64.4 6.2 59 59.3 6.4 -5.1
Foster Captain Isaac Paine Elementary 35 62.9 8.2 44 59.1 7.4 -3.8
Coventry Blackrock School 73 42.5 5.8 70 58.6 5.9 16.1
Coventry Washington Oak School 93 38.7 5.1 116 58.6 4.6 19.9
Cumberland Community School 104 60.6 4.8 87 57.5 5.3 -3.1
Cranston Stadium School 43 30.2 7.0 40 57.5 7.8 27.3
Johnston Winsor Hill School 71 40.8 5.8 77 57.1 5.6 16.3
North Providence James L. McGuire School 32 40.6 8.7 35 57.1 8.4 16.5
Coventry Hopkins Hill School 46 21.7 6.1 70 57.1 5.9 35.4
East Providence Alice M. Waddington School 50 44.0 7.0 74 56.8 5.8 12.8
Warwick Greenwood School 48 58.3 7.1 39 56.4 7.9 -1.9
Bristol Warren Guiteras School 42 54.8 7.7 49 55.1 7.1 0.3
Cranston Eden Park School 45 46.7 7.4 40 55.0 7.9 8.3
Woonsocket Bernon Heights School 51 37.3 6.8 48 54.2 7.2 16.9
Tiverton Pocasset School 46 28.3 6.6 50 54.0 7.1 25.7
Johnston Thornton School 51 37.3 6.8 52 53.8 6.9 16.6
Westerly Springbrook Elementary School 54 35.2 6.5 67 53.7 6.1 18.6
Warwick Wyman School 45 46.7 7.4 43 53.5 7.6 6.8
Cumberland McLaughlin Cumberland Hill School 90 48.9 5.3 73 53.4 5.8 4.5
Lincoln Lonsdale Elementary School 33 45.5 8.7 41 51.2 7.8 5.8
Westerly Bradford Elementary School 22 63.6 10.3 20 50.0 11.2 -13.6
Cranston Chester W. Barrows School 31 61.3 8.8 36 50.0 8.3 -11.3
East Providence Silver Spring School 24 50.0 10.2 44 50.0 7.5 0.0
Exeter-West Greenwich Metcalf School 138 53.6 4.3 130 48.5 4.4 -5.2
Westerly State Street School 47 57.4 7.2 60 48.3 6.5 -9.1
Narragansett Narragansett Elementary School 86 58.1 5.3 108 48.1 4.8 -10.0
Bristol Warren Colt Andrews School 56 44.6 6.6 75 48.0 5.8 3.4
Smithfield Old County Road School 35 45.7 8.4 40 47.5 7.9 1.8
Cranston Daniel D. Waterman School 33 60.6 8.5 38 47.4 8.1 -13.2
Bristol Warren Hugh Cole School 81 30.9 5.1 67 46.3 6.1 15.4
East Providence Agnes B. Hennessey School 49 26.5 6.3 37 45.9 8.2 19.4
Middletown Joseph H. Gaudet Learning Academy n/a n/a n/a 169 45.6 3.8 n/a
Cumberland Garvin Memorial School 68 44.1 6.0 57 45.6 6.6 1.5
Providence Vartan Gregorian Elementary 30 50.0 9.1 55 45.5 6.7 -4.6
Providence R. F. Kennedy Elementary 78 41.0 5.6 77 45.5 5.7 4.4
Newport Coggeshall School 19 26.3 10.1 44 45.5 7.5 19.1
Warwick Oakland Beach Elementary School 41 22.0 6.5 53 45.3 6.8 23.3

2010 RI NECAP Science Results for Students in Grades 4, 8, and 11
9 | P a g e
District School
N
tested
2009
% prof.
2009 CI
N
tested
2010
% prof.
2010 CI
2009 to 2010 Gr. 4
difference in % prof.
North Providence Stephen Olney School 40 30.0 7.3 40 45.0 7.9 15.0
Westerly Dunn's Corners School 44 54.5 7.5 69 44.9 6.0 -9.6
Lincoln Northern Lincoln Elementary 60 45.0 6.4 69 44.9 6.0 -0.1
Rhode Island Grade 4 9648 40.3 0.5 10059 44.1 0.5 3.8
Warwick Cottrell F. Hoxsie School 36 47.2 8.3 50 44.0 7.0 -3.2
Woonsocket Leo A. Savoie School 44 29.5 6.9 57 43.9 6.6 14.3
Burrillville Steere Farm Elementary 93 29.0 4.7 106 41.5 4.8 12.5
Warwick Holliman School 42 57.1 7.6 51 41.2 6.9 -16.0
Paul Cuffee Charter Sch Paul Cuffee Charter School 50 32.0 6.6 54 40.7 6.7 8.7
Cranston Garden City School 36 44.4 8.3 37 40.5 8.1 -3.9
Woonsocket Globe Park School 53 34.0 6.5 47 40.4 7.2 6.5
Warwick John Wickes School 44 43.2 7.5 40 40.0 7.8 -3.2
Cranston George J. Peters School 35 42.9 8.4 50 40.0 6.9 -2.9
Warwick Randall Holden School 26 53.8 9.8 28 39.3 9.2 -14.6
Providence Carnevale Elementary School 69 20.3 4.8 51 39.2 6.8 18.9
Pawtucket Francis J. Varieur School 45 37.8 7.2 41 39.0 7.6 1.3
Warwick Francis School 47 51.1 7.3 44 38.6 7.3 -12.4
Warwick E. G. Robertson School 45 44.4 7.4 52 38.5 6.8 -6.0
Warwick Warwick Neck School 33 30.3 8.0 50 38.0 6.9 7.7
Cranston Gladstone Street School 83 37.3 5.3 87 37.9 5.2 0.6
Central Falls Margaret I. Robertson School 33 39.4 8.5 40 37.5 7.7 -1.9
West Warwick Greenbush Elementary School 61 39.3 6.3 72 37.5 5.7 -1.8
Pawtucket Curvin-McCabe School 52 25.0 6.0 59 37.3 6.3 12.3
Cranston Glen Hills School 45 40.0 7.3 43 37.2 7.4 -2.8
Newport Cranston - Calvert School 42 26.2 6.8 43 37.2 7.4 11.0
Warwick Sherman School 45 35.6 7.1 66 36.4 5.9 0.8
Burrillville William L. Callahan School 73 53.4 5.8 86 36.0 5.2 -17.4
North Providence Dr. Joseph A Whelan Elementary 27 37.0 9.3 25 36.0 9.6 -1.0
West Warwick John F. Horgan Elementary 66 36.4 5.9 74 35.1 5.6 -1.2
North Providence Marieville Elementary School 33 36.4 8.4 43 34.9 7.3 -1.5
East Providence Kent Heights School 45 57.8 7.4 49 34.7 6.8 -23.1
Cranston Arlington School 20 25.0 9.7 26 34.6 9.3 9.6
Woonsocket Harris School 64 21.9 5.2 61 34.4 6.1 12.6
Warwick Norwood School 39 35.9 7.7 42 33.3 7.3 -2.6
North Providence Centredale School 31 48.4 9.0 34 32.4 8.0 -16.0
Cranston William R. Dutemple School 43 41.9 7.5 44 31.8 7.0 -10.0
Warwick Harold F. Scott School 59 55.9 6.5 38 31.6 7.5 -24.4
Cumberland Ashton School 53 35.8 6.6 48 31.3 6.7 -4.6
Newport Dr. M. H. Sullivan School 20 5.0 4.9 42 31.0 7.1 26.0
Cranston Edgewood Highland School 24 50.0 10.2 36 30.6 7.7 -19.4
Warwick Lippitt School 31 19.4 7.1 30 30.0 8.4 10.7
West Warwick Wakefield Hills Elementary 62 33.9 6.0 74 29.7 5.3 -4.1
Woonsocket Citizens Memorial School 105 21.9 4.0 82 29.3 5.0 7.4
East Providence Emma G. Whiteknact School 22 13.6 7.3 42 28.6 7.0 14.9
Providence Reservoir Avenue School 36 5.6 3.8 25 28.0 9.0 22.4
Cumberland B.F. Norton Elementary School 55 18.2 5.2 44 27.3 6.7 9.1
Providence Dr. M. L. King Jr. Elementary 45 42.2 7.4 51 25.5 6.1 -16.7
West Warwick Maisie E. Quinn Elementary 42 23.8 6.6 50 24.0 6.0 0.2
Providence Harry Kizirian Elementary School 66 7.6 3.3 78 21.8 4.7 14.2
East Providence James R. D. Oldham School 49 26.5 6.3 37 21.6 6.8 -4.9
Pawtucket Flora S. Curtis Memorial School 33 15.2 6.2 37 21.6 6.8 6.5
International Charter International Charter School 49 22.4 6.0 47 21.3 6.0 -1.2
Providence Veazie Street School 76 13.2 3.9 84 20.2 4.4 7.1
Pawtucket Potter-Burns School 79 20.3 4.5 70 20.0 4.8 -0.3
Woonsocket Kevin K. Coleman Elementary 73 16.4 4.3 81 19.8 4.4 3.3
Central Falls Ella Risk School 71 11.3 3.8 89 19.1 4.2 7.8
Pawtucket M. Virginia Cunningham School 57 21.1 5.4 64 18.8 4.9 -2.3
Pawtucket Nathanael Greene School 78 23.1 4.8 71 18.3 4.6 -4.8
Central Falls Veterans Memorial Elementary 78 11.5 3.6 93 18.3 4.0 6.7
Providence William D'Abate Elementary 74 5.4 2.6 78 17.9 4.4 12.5
Providence Windmill Street Elementary 49 8.2 3.9 55 16.4 5.0 8.2

2010 RI NECAP Science Results for Students in Grades 4, 8, and 11
10 | P a g e
District School
N
tested
2009
% prof.
2009 CI
N
tested
2010
% prof.
2010 CI
2009 to 2010 Gr. 4
difference in % prof.
Pawtucket Fallon Memorial School 76 21.1 4.7 68 16.2 4.5 -4.9
Providence Asa Messer Elementary School 68 4.4 2.5 68 16.2 4.5 11.8
Pawtucket Agnes E. Little School 43 18.6 5.9 58 15.5 4.8 -3.1
East Providence Orlo Avenue School 41 17.1 5.9 47 14.9 5.2 -2.2
Providence Charles N. Fortes Elementary 69 5.8 2.8 61 14.8 4.5 9.0
Pawtucket Elizabeth Baldwin School 109 17.4 3.6 93 14.0 3.6 -3.5
Providence Times2 Academy 48 22.9 6.1 51 13.7 4.8 -9.2
Learning Community Learning Community Charter Sch. 57 21.1 5.4 54 13.0 4.6 -8.1
Providence Feinstein Elementary Sackett Street 77 2.6 1.8 77 13.0 3.8 10.4
Providence Alfred Lima Sr. Elementary School 27 22.2 8.0 63 12.7 4.2 -9.5
Providence Carl G. Lauro Elementary School 100 10.0 3.0 113 12.4 3.1 2.4
Providence Webster Avenue School 25 24.0 8.5 25 12.0 6.5 -12.0
Providence George J. West Elementary 94 16.0 3.8 100 12.0 3.3 -4.0
Providence Mary E. Fogarty Elementary 55 1.8 1.8 67 11.9 4.0 10.1
Providence Frank D. Spaziano Ave. Elementary 89 4.5 2.2 80 10.0 3.4 5.5
Providence Feinstein Elementary at Broad St. 45 15.6 5.4 54 9.3 3.9 -6.3
Highlander Highlander Charter School 18 16.7 8.8 36 8.3 4.6 -8.3
Providence Sgt.Cornel Young Jr. Elementary 36 2.8 2.7 36 8.3 4.6 5.6
Pawtucket Henry J. Winters School 54 9.3 3.9 65 7.7 3.3 -1.6
Providence Pleasant View School 47 4.3 2.9 52 7.7 3.7 3.4
Providence West Broadway Elementary 43 2.3 2.3 66 6.1 2.9 3.7
Providence Edmund W. Flynn Elementary 53 3.8 2.6 83 3.6 2.1 -0.2
Providence Robert L Bailey IV Elementary 33 3.0 3.0 41 2.4 2.4 -0.6
Providence Charlotte Woods Elementary 44 4.5 3.1 47 2.1 2.1 -2.4
New Shoreham Block Island School 11 72.7 13.4 - - - -
R.I. Sch for the Deaf Rhode Island School for the Deaf - - - - - - -
Key
CI = Confidence Interval (see Appendix) - = All information associated with n sizes <10 has been redacted as per RIDE policy.
n/a = Information not available
= Statistically significant decrease in percent of students proficient or above from 2009 to 2010 NECAP science results = Statistically significant increase in percent of students proficient or above from 2009 to 2010 NECAP science results
= No statistically significant change from 2009 to 2010 NECAP science results
Table 8. Percent of Students At/Above Proficient by District: Grade 8 only (table sorted based on 2010 results)
District
N
tested
2008
% prof.
2008 CI
N
tested
2009
% prof.
2009 CI
N
tested
2010
% prof.
2010 CI
2009 to 2010 Gr. 8
difference in % prof.
Barrington 299 64.2 2.8 264 63.6 3.0 267 65.2 2.9 1.5
East Greenwich 216 43.5 3.4 188 48.9 3.6 206 55.3 3.5 6.4
Smithfield 227 44.1 3.3 199 31.2 3.3 236 50.8 3.3 19.7
The Compass School 11 27.3 13.4 15 33.3 12.2 14 50.0 13.4 16.7
Jamestown 57 29.8 6.1 55 30.9 6.2 53 47.2 6.9 16.3
North Kingstown 350 30.0 2.4 354 28.0 2.4 338 44.1 2.7 16.1
South Kingstown 319 43.9 2.8 283 37.5 2.9 274 43.1 3.0 5.6
Little Compton 38 21.1 6.6 32 40.6 8.7 33 39.4 8.5 -1.2
Coventry 469 31.1 2.1 434 26.7 2.1 417 38.6 2.4 11.9
Exeter-West Greenwich 161 29.2 3.6 160 33.8 3.7 165 38.2 3.8 4.4
Portsmouth 256 30.1 2.9 218 31.2 3.1 237 37.6 3.1 6.4
Scituate 143 39.2 4.1 148 32.4 3.8 146 36.3 4.0 3.9
Narragansett 135 29.6 3.9 129 32.6 4.1 127 33.1 4.2 0.5
Chariho 297 30.0 2.7 278 32.0 2.8 280 30.7 2.8 -1.3
Tiverton 158 16.5 2.9 167 10.8 2.4 148 29.7 3.8 19.0
Foster-Glocester 224 18.8 2.6 199 16.1 2.6 190 29.5 3.3 13.4
Middletown 177 34.5 3.6 196 26.0 3.1 185 28.6 3.3 2.6
Westerly 276 25.7 2.6 279 25.8 2.6 238 26.9 2.9 1.1
Cumberland 436 21.1 2.0 418 16.5 1.8 382 25.7 2.2 9.1
2010 RI NECAP Science Results for Students in Grades 4, 8, and 11
11 | P a g e
District
N
tested
2008
% prof.
2008 CI
N
tested
2009
% prof.
2009 CI
N
tested
2010
% prof.
2010 CI
2009 to 2010 Gr. 8
difference in % prof.
Cranston 902 17.4 1.3 844 17.4 1.3 880 25.2 1.5 7.8
Bristol Warren 282 19.1 2.3 261 18.8 2.4 269 24.9 2.6 6.1
Lincoln 292 24.7 2.5 270 21.9 2.5 305 23.6 2.4 1.8
Rhode Island Gr. 8 11883 18.7 0.4 11238 17.6 0.4 11120 22.6 0.4 5.0
North Smithfield 148 13.5 2.8 161 21.1 3.2 140 22.1 3.5 1.0
Johnston 272 24.3 2.6 289 9.3 1.7 290 20.7 2.4 11.3
Warwick 873 15.8 1.2 868 17.3 1.3 862 20.2 1.4 2.9
Newport 170 12.4 2.5 175 18.9 3.0 142 15.5 3.0 -3.4
East Providence 472 10.8 1.4 419 13.6 1.7 422 15.2 1.7 1.6
West Warwick 292 13.0 2.0 254 7.9 1.7 252 14.3 2.2 6.4
Paul Cuffee Charter Sch 39 7.7 4.3 44 6.8 3.8 47 12.8 4.9 5.9
Highlander 32 6.3 4.3 32 0.0 0.0 32 12.5 5.8 12.5
Burrillville 214 29.9 3.1 174 16.1 2.8 176 11.9 2.4 -4.2
North Providence 276 11.2 1.9 263 7.6 1.6 281 10.3 1.8 2.7
Woonsocket 431 2.6 0.8 418 5.7 1.1 422 6.9 1.2 1.1
Pawtucket 751 7.1 0.9 698 6.6 0.9 726 6.7 0.9 0.2
Providence 1828 1.8 0.3 1588 3.1 0.4 1623 5.1 0.5 2.0
Central Falls 275 1.5 0.7 273 1.1 0.6 240 4.6 1.3 3.5
Urban Collaborative 56 0.0 0.0 74 1.4 1.3 59 1.7 1.7 0.3
DCYF - - - - - - - - - -
R.I. Sch. for the Deaf - - - - - - - - - -
Key
CI = Confidence Interval (see Appendix)
- = All information associated with n sizes <10 has been redacted as per RIDE policy.
= Statistically significant decrease in percent of students proficient or above from 2009 to 2010 NECAP science results = Statistically significant increase in percent of students proficient or above from 2009 to 2010 NECAP science results
= No statistically significant change from 2009 to 2010 NECAP science results
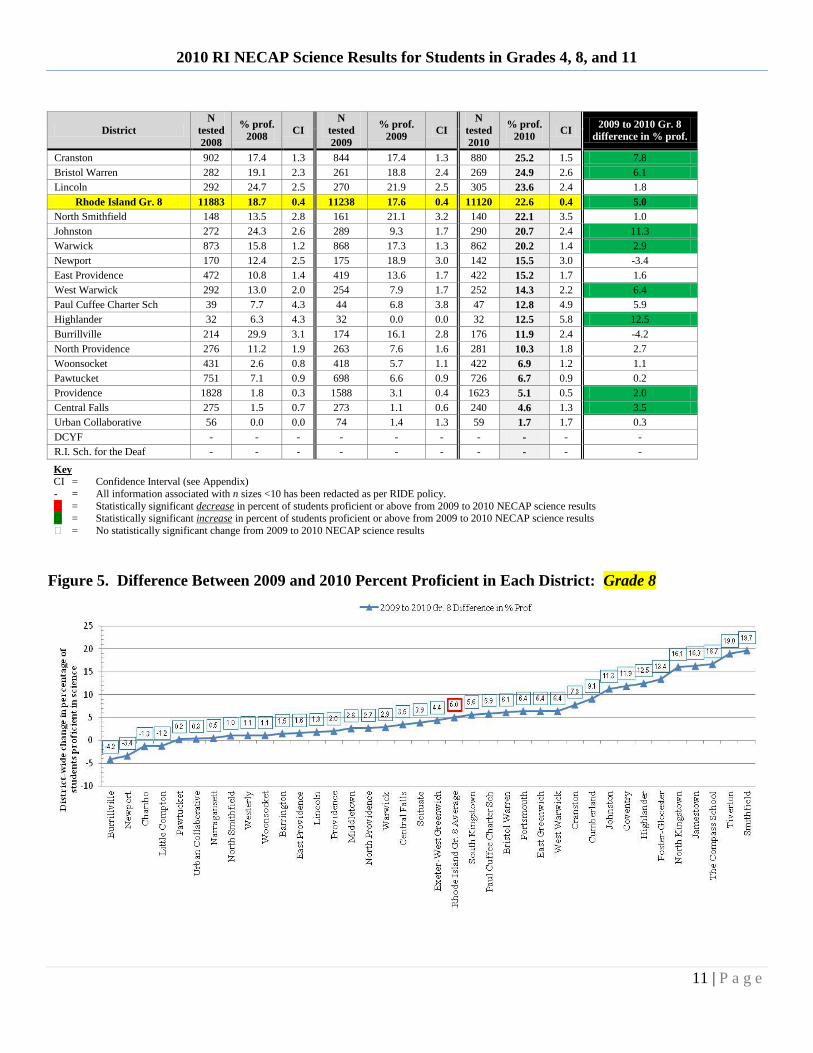
Figure 5. Difference Between 2009 and 2010 Percent Proficient in Each District: Grade 8

2010 RI NECAP Science Results for Students in Grades 4, 8, and 11
12 | P a g e
Table 9. Percent of Students At/Above Proficient by School: Grade 8 only (table sorted based on 2010 results)
District School N tested
2009
% prof
2009 CI
N tested
2010
% prof
2010 CI
2009 to 2010 Gr. 8
difference in % proficient
Barrington Barrington Middle School 264 63.6 3.0 267 65.2 2.9 1.5
East Greenwich Archie R. Cole Middle School 188 48.9 3.7 204 55.9 3.5 6.9
Smithfield Vincent J. Gallagher Middle School 199 31.2 3.3 236 50.8 3.3 19.7
The Compass School The Compass School 15 33.3 12.2 14 50.0 13.4 16.7
North Kingstown Wickford Middle School 162 25.3 3.4 153 47.7 4.0 22.4
Jamestown Jamestown School-Lawn 55 30.9 6.2 53 47.2 6.9 16.3
South Kingstown Curtis Corner Middle School 141 44.0 4.2 273 43.2 3.0 -0.7
North Kingstown Davisville Middle School 192 30.2 3.3 183 41.5 3.6 11.3
Little Compton Wilbur and McMahon Schools 32 40.6 8.7 33 39.4 8.5 -1.2
Coventry Feinstein Middle School Of Coventry 434 26.7 2.1 415 38.8 2.4 12.1
Exeter-West Greenwich Exeter-W. Greenwich Reg. Junior High 160 33.8 3.7 164 38.4 3.8 4.7
Portsmouth Portsmouth Middle School 218 31.2 3.1 235 37.9 3.2 6.7
Scituate Scituate Middle School 148 32.4 3.9 146 36.3 4.0 3.9
Narragansett Narragansett Pier School 129 32.6 4.1 125 33.6 4.2 1.0
Chariho Chariho Regional Middle School 266 33.5 2.9 272 31.6 2.8 -1.8
Cumberland North Cumberland Middle School 232 19.8 2.6 212 31.1 3.2 11.3
Cranston Western Hills Middle School 373 20.6 2.1 377 30.2 2.4 9.6
Tiverton Tiverton Middle School 167 10.8 2.4 147 29.9 3.8 19.2
Foster-Glocester Ponaganset Middle School 199 16.1 2.6 190 29.5 3.3 13.4
Middletown Joseph H. Gaudet School 196 26.0 3.1 183 29.0 3.4 2.9
Westerly Westerly Middle School 279 25.8 2.6 235 27.2 2.9 1.4
Cranston Park View Middle School 256 15.6 2.3 260 26.9 2.8 11.3
Bristol Warren Kickemuit Middle School 261 18.8 2.4 269 24.9 2.6 6.1
Lincoln Lincoln Middle School 270 21.9 2.5 303 23.8 2.5 1.9
Warwick Winman Junior High School 272 24.3 2.6 279 23.3 2.5 -1.0
Rhode Island Grade 8 11238 17.6 0.4 11120 22.6 0.4 5.0
North Smithfield North Smithfield Middle School 161 21.1 3.2 140 22.1 3.5 1.0
Providence Nathanael Greene Middle School 306 10.5 1.8 308 21.8 2.4 11.3
Johnston Nicholas A. Ferri Middle School 289 9.3 1.7 287 20.9 2.4 11.6
Warwick Gorton Junior High School 274 13.9 2.1 298 19.5 2.3 5.6
Cumberland Joseph L. McCourt Middle School 186 12.4 2.4 166 19.3 3.1 6.9
Warwick Aldrich Junior High School 322 14.3 2.0 280 18.2 2.3 3.9
East Providence Riverside Middle School 153 13.7 2.8 163 17.2 3.0 3.5
Cranston Hugh B. Bain Middle School 215 14.0 2.4 236 16.1 2.4 2.1
Newport Frank E. Thompson Middle School 175 18.9 3.0 139 15.8 3.1 -3.0
East Providence Edward R. Martin Middle School 266 13.5 2.1 252 14.3 2.2 0.8
West Warwick John F. Deering Middle School 254 7.9 1.7 251 14.3 2.2 6.5
North Providence Birchwood Middle School 133 9.0 2.5 136 14.0 3.0 4.9
Paul Cuffee Charter Sch Paul Cuffee Charter School 44 6.8 3.8 47 12.8 4.9 5.9
Highlander Highlander Charter School 32 0.0 0.0 32 12.5 5.9 12.5
Burrillville Burrillville Middle School 174 16.1 2.8 176 11.9 2.4 -4.2
Pawtucket Goff Junior High School 232 9.1 1.9 251 9.6 1.9 0.5
Providence Times2 Academy 60 8.3 3.6 67 7.5 3.2 -0.9
Woonsocket Woonsocket Middle School 418 5.7 1.1 410 7.1 1.3 1.3
North Providence Dr. Edward A. Ricci Middle School 130 6.2 2.1 145 6.9 2.1 0.7
Pawtucket Joseph Jenks Junior High School 193 4.7 1.5 199 5.5 1.6 0.9
Pawtucket Samuel Slater Junior High School 273 5.9 1.4 262 5.3 1.4 -0.5
Central Falls Dr. Earl F. Calcutt Middle School 273 1.1 0.6 239 4.6 1.4 3.5
Urban Collaborative Urban Collaborative Accelerated Prog. 74 1.4 1.3 59 1.7 1.7 0.3
Providence Gilbert Stuart Middle School 225 0.4 0.4 232 1.7 0.9 1.3
Providence Oliver Hazard Perry Middle School 216 0.5 0.5 211 1.4 0.8 1.0
Providence Esek Hopkins Middle School 158 0.6 0.6 145 0.7 0.7 0.1
Providence Samuel W. Bridgham Middle School 213 0.9 0.7 198 0.5 0.5 -0.4
Providence Roger Williams Middle School 237 0.0 0.0 287 0.3 0.4 0.3
Providence DelSesto Middle School 173 4.0 1.5 154 0.0 0.0 -4.0
Chariho The R.Y.S.E. School 12 0.0 0.0 - - - -
R.I. Sch for the Deaf R.I. School for the Deaf - - - - - - - Key
CI = Confidence Interval (see Appendix)
- = All information associated with n sizes <10 has been redacted as per RIDE policy.
= Statistically significant decrease in percent of students proficient or above from 2009 to 2010 NECAP science results
= Statistically significant increase in percent of students proficient or above from 2009 to 2010 NECAP science results
= No statistically significant change from 2009 to 2010 NECAP science results

2010 RI NECAP Science Results for Students in Grades 4, 8, and 11
13 | P a g e
Table 10. Percent of Students At/Above Proficient by District: Grade 11 only (table sorted based on 2010 results)
District
N
tested
2008
%
prof.
2008
CI
N
tested
2009
%
prof.
2009
CI
N
tested
2010
% prof.
2010 CI
2009 to 2010 Gr. 11
difference in % prof.
Portsmouth 224 36.6 3.2 235 42.6 3.2 232 51.7 3.3 9.2
East Greenwich 177 38.4 3.7 186 50.0 3.7 185 50.8 3.7 0.8
Narragansett 115 27.0 4.1 112 46.4 4.7 113 50.4 4.7 4.0
Barrington 283 55.5 3.0 271 55.7 3.0 292 50.0 2.9 -5.7
South Kingstown 300 35.7 2.8 296 43.9 2.9 251 43.0 3.1 -0.9
Westerly 269 21.6 2.5 225 18.2 2.6 257 40.1 3.1 21.9
Chariho 294 21.4 2.4 239 27.2 2.9 284 37.7 2.9 10.5
Smithfield 224 28.6 3.0 205 32.2 3.3 190 37.4 3.5 5.2
Scituate 119 16.8 3.4 136 27.9 3.8 126 36.5 4.3 8.6
Lincoln 265 25.7 2.7 224 29.5 3.0 238 34.0 3.1 4.6
North Smithfield 142 27.5 3.7 134 23.9 3.7 137 29.9 3.9 6.0
North Kingstown 388 26.0 2.2 382 26.2 2.2 403 28.3 2.2 2.1
New Shoreham 19 36.8 11.1 11 18.2 11.6 19 26.3 10.1 8.1
Cumberland 336 18.8 2.1 341 29.3 2.5 371 25.1 2.3 -4.3
Middletown 140 15.7 3.1 130 39.2 4.3 135 24.4 3.7 -14.8
Foster-Glocester 219 14.2 2.4 198 28.8 3.2 202 23.3 3.0 -5.5
Cranston 841 13.8 1.2 825 15.5 1.3 800 22.8 1.5 7.2
Coventry 426 14.8 1.7 429 14.9 1.7 396 22.5 2.1 7.6
Tiverton 154 30.5 3.7 155 25.8 3.5 126 21.4 3.7 -4.4
Rhode Island Gr. 11 10471 16.4 0.4 10301 19.4 0.4 10305 20.5 0.4 1.1
Bristol Warren 248 19.0 2.5 231 27.3 2.9 258 19.0 2.4 -8.3
Exeter-West Greenwich 164 25.6 3.4 138 23.2 3.6 150 18.7 3.2 -4.5
Newport 123 15.4 3.3 117 9.4 2.7 152 17.1 3.1 7.7
Burrillville 184 8.7 2.1 209 19.6 2.7 197 15.2 2.6 -4.4
Davies Career and Tech 157 3.2 1.4 171 12.9 2.6 163 14.7 2.8 1.9
Beacon Charter School 21 4.8 4.6 51 13.7 4.8 42 14.3 5.4 0.6
Warwick 842 13.7 1.2 796 16.5 1.3 765 13.6 1.2 -2.9
Johnston 181 16.0 2.7 143 11.2 2.6 219 12.3 2.2 1.1
West Warwick 222 14.9 2.4 275 12.4 2.0 223 10.8 2.1 -1.6
North Providence 281 9.6 1.8 276 9.8 1.8 251 10.0 1.9 0.2
Pawtucket 449 9.4 1.4 424 11.1 1.5 489 8.6 1.3 -2.5
East Providence 441 8.2 1.3 420 14.8 1.7 414 8.0 1.3 -6.8
Providence 1463 4.6 0.6 1431 4.7 0.6 1414 6.9 0.7 2.2
Blackstone Academy 37 2.7 2.7 43 16.3 5.6 39 5.1 3.5 -11.2
Woonsocket 364 4.9 1.1 341 11.1 1.7 378 4.8 1.1 -6.4
Central Falls 166 4.2 1.6 186 2.7 1.2 189 3.7 1.4 1.0
MET Career and Tech 155 2.6 1.3 187 7.0 1.9 176 0.6 0.6 -6.4
DCYF - - - 11 0.0 0.0 - - - -
R.I. School for the Deaf - - - - - - - - - -
Key
CI = Confidence Interval (see Appendix)
- = All information associated with n sizes <10 has been redacted as per RIDE policy. = Statistically significant decrease in percent of students proficient or above from 2009 to 2010 NECAP science results
= Statistically significant increase in percent of students proficient or above from 2009 to 2010 NECAP science results
= No statistically significant change from 2009 to 2010 NECAP science results

2010 RI NECAP Science Results for Students in Grades 4, 8, and 11
14 | P a g e
Figure 6. Difference Between 2009 and 2010 Percent Proficient in Each District: Grade 11
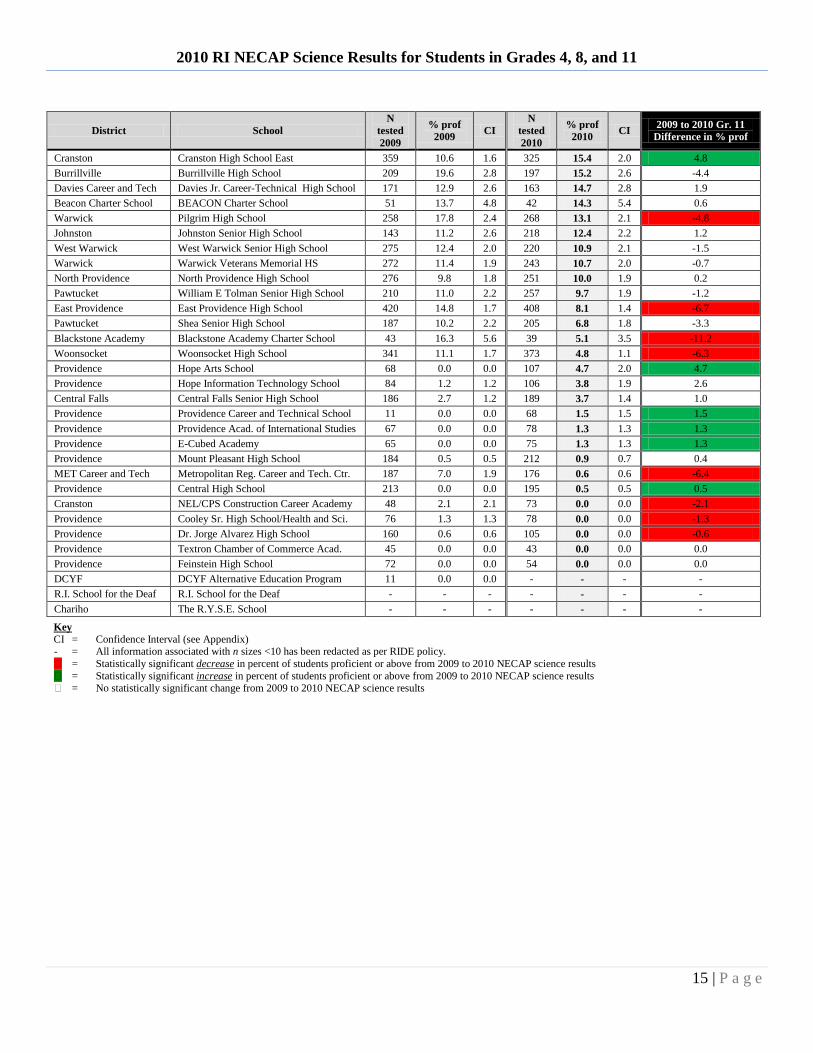
Table 11. Percent of Students At/Above Proficient by School: Grade 11 only (table sorted based on 2010 results)
District School
N
tested
2009
% prof
2009 CI
N
tested
2010
% prof
2010 CI
2009 to 2010 Gr. 11
Difference in % prof
Portsmouth Portsmouth High School 235 42.6 3.2 231 51.9 3.3 9.4
East Greenwich East Greenwich High School 186 50.0 3.7 184 51.1 3.7 1.1
Narragansett Narragansett High School 112 46.4 4.7 111 50.5 4.8 4.0
Barrington Barrington High School 271 55.7 3.0 291 50.2 2.9 -5.5
South Kingstown South Kingstown High School 296 43.9 2.9 250 43.2 3.1 -0.7
Westerly Westerly High School 225 18.2 2.6 256 40.2 3.1 22.0
Chariho Chariho Regional High School 238 27.3 2.9 280 38.2 2.9 10.9
Smithfield Smithfield Senior High School 205 32.2 3.3 190 37.4 3.5 5.2
Scituate Scituate High School 136 27.9 3.9 126 36.5 4.3 8.6
Lincoln Lincoln Senior High School 224 29.5 3.1 238 34.0 3.1 4.6
Cranston Cranston High School West 418 21.3 2.0 401 32.9 2.4 11.6
Providence Classical High School 265 21.1 2.5 244 30.3 2.9 9.2
North Smithfield North Smithfield High School 134 23.9 3.7 136 30.1 3.9 6.3
Providence Times2 Academy 36 16.7 6.2 30 30.0 8.4 13.3
North Kingstown North Kingstown Senior High School 382 26.2 2.3 402 28.4 2.3 2.2
New Shoreham Block Island School 11 18.2 11.6 19 26.3 10.1 8.1
Middletown Middletown High School 130 39.2 4.3 131 25.2 3.8 -14.0
Cumberland Cumberland High School 341 29.3 2.5 371 25.1 2.3 -4.3
Foster-Glocester Ponaganset High School 198 28.8 3.2 202 23.3 3.0 -5.5
Coventry Coventry High School 429 14.9 1.7 396 22.5 2.1 7.6
Tiverton Tiverton High School 155 25.8 3.5 125 21.6 3.7 -4.2
Rhode Island Grade 11 10301 19.4 0.4 10305 20.5 0.4 1.0
Bristol Warren Mt. Hope High School 231 27.3 2.9 255 19.2 2.5 -8.1
Exeter-West Greenwich Exeter-W. Greenwich Reg. High School 138 23.2 3.6 150 18.7 3.2 -4.5
Warwick Toll Gate High School 266 20.3 2.5 248 17.3 2.4 -3.0
Newport Rogers High School 117 9.4 2.7 151 17.2 3.1 7.8
Pawtucket Walsh School for the Performing and 27 18.5 7.5 19 15.8 8.4 -2.7
2010 RI NECAP Science Results for Students in Grades 4, 8, and 11
15 | P a g e
District School
N
tested
2009
% prof
2009 CI
N
tested
2010
% prof
2010 CI
2009 to 2010 Gr. 11
Difference in % prof
Cranston Cranston High School East 359 10.6 1.6 325 15.4 2.0 4.8
Burrillville Burrillville High School 209 19.6 2.8 197 15.2 2.6 -4.4
Davies Career and Tech Davies Jr. Career-Technical High School 171 12.9 2.6 163 14.7 2.8 1.9
Beacon Charter School BEACON Charter School 51 13.7 4.8 42 14.3 5.4 0.6
Warwick Pilgrim High School 258 17.8 2.4 268 13.1 2.1 -4.8
Johnston Johnston Senior High School 143 11.2 2.6 218 12.4 2.2 1.2
West Warwick West Warwick Senior High School 275 12.4 2.0 220 10.9 2.1 -1.5
Warwick Warwick Veterans Memorial HS 272 11.4 1.9 243 10.7 2.0 -0.7
North Providence North Providence High School 276 9.8 1.8 251 10.0 1.9 0.2
Pawtucket William E Tolman Senior High School 210 11.0 2.2 257 9.7 1.9 -1.2
East Providence East Providence High School 420 14.8 1.7 408 8.1 1.4 -6.7
Pawtucket Shea Senior High School 187 10.2 2.2 205 6.8 1.8 -3.3
Blackstone Academy Blackstone Academy Charter School 43 16.3 5.6 39 5.1 3.5 -11.2
Woonsocket Woonsocket High School 341 11.1 1.7 373 4.8 1.1 -6.3
Providence Hope Arts School 68 0.0 0.0 107 4.7 2.0 4.7
Providence Hope Information Technology School 84 1.2 1.2 106 3.8 1.9 2.6
Central Falls Central Falls Senior High School 186 2.7 1.2 189 3.7 1.4 1.0
Providence Providence Career and Technical School 11 0.0 0.0 68 1.5 1.5 1.5
Providence Providence Acad. of International Studies 67 0.0 0.0 78 1.3 1.3 1.3
Providence E-Cubed Academy 65 0.0 0.0 75 1.3 1.3 1.3
Providence Mount Pleasant High School 184 0.5 0.5 212 0.9 0.7 0.4
MET Career and Tech Metropolitan Reg. Career and Tech. Ctr. 187 7.0 1.9 176 0.6 0.6 -6.4
Providence Central High School 213 0.0 0.0 195 0.5 0.5 0.5
Cranston NEL/CPS Construction Career Academy 48 2.1 2.1 73 0.0 0.0 -2.1
Providence Cooley Sr. High School/Health and Sci. 76 1.3 1.3 78 0.0 0.0 -1.3
Providence Dr. Jorge Alvarez High School 160 0.6 0.6 105 0.0 0.0 -0.6
Providence Textron Chamber of Commerce Acad. 45 0.0 0.0 43 0.0 0.0 0.0
Providence Feinstein High School 72 0.0 0.0 54 0.0 0.0 0.0
DCYF DCYF Alternative Education Program 11 0.0 0.0 - - - -
R.I. School for the Deaf R.I. School for the Deaf - - - - - - -
Chariho The R.Y.S.E. School - - - - - - -
Key
CI = Confidence Interval (see Appendix) - = All information associated with n sizes <10 has been redacted as per RIDE policy.
= Statistically significant decrease in percent of students proficient or above from 2009 to 2010 NECAP science results
= Statistically significant increase in percent of students proficient or above from 2009 to 2010 NECAP science results = No statistically significant change from 2009 to 2010 NECAP science results

2010 RI NECAP Science Results for Students in Grades 4, 8, and 11
16 | P a g e
QQUUEESSTTIIOONN::
How did various student subgroups perform on the NECAP science assessment?
SSUUPPPPOORRTTIINNGG DDAATTAA::
Table 12. Percent of Students At/Above Proficient by Sub-Group on the NECAP Science Assessment.
Sub-Group Grade 4 Grade 8 Grade 11
2009 2010 Diff. 2009 2010 Diff. 2009 2010 Diff.
State Average 40.3 44.1 3.8 17.6 22.6 5.0 19.4 20.5 1.1
Males 39.5 44.3 4.8 18.7 22.8 4.1 20.1 21.1 1.0
Females 41.1 43.9 2.8 16.3 22.3 6.0 18.8 19.9 1.1
IEP 16.1 14.7 -1.4 3.6 3.8 0.1 2.9 2.5 -0.4
Non-IEP 44.8 49.0 4.1 20.5 26.4 5.9 22.0 23.6 1.5
LEP 5.7 6.8 1.1 0.0 1.5 1.5 0.4 0.8 0.4
LEP Mon 19.2 18.0 -1.2 2.6 4.4 1.8 1.2 0.0 -1.2
Non-LEP 42.8 47.3 4.5 18.3 23.6 5.3 20.0 21.1 1.1
Econ Disadv. 18.8 24.8 5.9 5.6 7.4 1.8 6.3 7.6 1.4
Non-Econ Disadv. 56.3 61.4 5.1 25.5 33.7 8.2 25.3 27.4 2.1
Key
= Statistically significant decrease in percent of students proficient or above from 2009 to 2010 NECAP science results = Statistically significant increase in percent of students proficient or above from 2009 to 2010 NECAP science results
= No statistically significant change from 2009 to 2010 NECAP science results
Table 13. Percent of Students At/Above Proficient by Race/Ethnicity on the NECAP Science Assessment.
Race/
Ethnicity
Grade 4 Grade 8 Grade 11
2009 2010 Diff. 2009 2010 Diff. 2009 2010 Diff.
State Average 40.3 44.1 3.8 17.6 22.6 5.0 19.4 20.5 1.1
AI/AK Nat. 20.3 24.2 3.9 4.3 15.0 10.7 10.5 11.1 0.6
Asian 37.3 49.6 12.3 18.7 26.4 7.7 21.3 28.2 6.9
Black 17.3 18.9 1.6 3.7 5.6 1.8 4.4 4.5 0.1
Hispanic 14.8 18.2 3.4 3.0 5.1 2.1 4.5 5.7 1.2
White 50.3 55.3 4.9 23.0 29.2 6.1 24.4 25.5 1.2
Key
AI/AK Nat. = American Indian/Alaska Native
= Statistically significant decrease in percent of students proficient or above from 2009 to 2010 NECAP science results = Statistically significant increase in percent of students proficient or above from 2009 to 2010 NECAP science results
= No statistically significant change from 2009 to 2010 NECAP science results

2010 RI NECAP Science Results for Students in Grades 4, 8, and 11
17 | P a g e

2010 RI NECAP Science Results for Students in Grades 4, 8, and 11
18 | P a g e
Table 14. 2010 Science Achievement Gap: White Students vs. Black or Hispanic Students
Groups Grade 4 Grade 8 Grade 11
N 2010 %
prof. CI Gap N
2010 %
prof. CI Gap N
2010 %
prof. CI Gap
White Students* 6704 55.3 0.6 - 7706 29.2 0.5 - 7336 25.5 0.5 -
Black Students 921 18.9 1.3 36.4 972 5.6 0.7 23.6 920 4.5 0.7 21.1
Hispanic Students 1994 18.2 0.9 37.1 2003 5.1 0.5 24.1 1651 5.7 0.6 19.9
Key
* = Group to which Black Students and Hispanic Students is being compared to determine gap.
N. = Number of students who took the NECAP Science Assessment in 2010 CI = Confidence Interval (see Appendix)
= Statistically significant gap between white students and comparison group in percent who scored proficient or above on the NECAP Science Assessment
Table 15. 2010 Science Achievement Gap: Students without IEPs vs. Students with IEPs
Groups Grade 4 Grade 8 Grade 11
N 2010 %
prof. CI Gap N
2010 %
prof. CI Gap N
2010 %
prof. CI Gap
Students w/o IEPs* 8630 49.0 0.5 - 9229 26.4 0.5 - 8783 23.6 0.5 -
Students w/IEPs 1429 14.7 0.9 34.3 1891 3.8 0.4 22.7 1522 2.5 0.4 21.1
Key
* = Group to which Students with IEPs is being compared to determine gap
N. = Number of students who took the NECAP Science Assessment in 2010 CI = Confidence Interval (see Appendix)
= Statistically significant gap between students with IEPs and students without IEPs in percent who scored proficient or above on the NECAP Science
Assessment
Table 16. 2010 Science Achievement Gap: Non-LEP Students vs. LEP Students
Groups Grade 4 Grade 8 Grade 11
N 2010 %
prof. CI Gap N
2010 %
prof. CI Gap N
2010 %
prof. CI Gap
Non-LEP Students* 9215 47.3 0.5 - 10567 23.6 0.4 - 9961 21.1 0.4 -
LEP Students 644 6.8 1.0 40.4 395 1.5 0.6 22.1 245 .8 0.6 20.3
Key
* = Group to which LEP Students is being compared to determine gap N. = Number of students who took the NECAP Science Assessment in 2010
CI = Confidence Interval (see Appendix)
= Statistically significant gap between LEP students and Non-LEP students in percent who scored proficient or above on the NECAP Science Assessment
Table 17. 2010 Science Achievement Gap: Non-Economically Disadvantaged vs. Econ. Disadv. Students
Groups Grade 4 Grade 8 Grade 11
N 2010 %
prof. CI Gap N
2010 %
prof. CI Gap N
2010 %
prof. CI Gap
Non-Econ. Disadv.* 5313 61.4 0.7 - 6412 33.7 0.6 - 6689 27.4 0.5 -
Econ. Disadvantaged 4746 24.8 0.6 36.6 4708 7.4 0.4 26.3 3616 7.6 0.4 19.8
Key
* = Group to which Economically Disadvantaged Students is being compared to determine gap
N. = Number of students who took the NECAP Science Assessment in 2010 CI = Confidence Interval (see Appendix)
= Statistically significant gap between Low SES students and students not identified as Low SES in percent who scored proficient or above on the NECAP
Science Assessment

2010 RI NECAP Science Results for Students in Grades 4, 8, and 11
19 | P a g e
AAPPPPEENNDDIIXX
Confidence Interval (CI)
For the purposes of this report, Confidence Interval (CI) is defined as a measurement of the standard error of a
percentage (e.g., % proficient, used throughout this report). Mathematically, CI’s were calculated as follows:
(CI) = , where p is the percent of students who are proficient, q= (100-p) and N is the population or group
size.
It is important to note that the derived CI is based on the size of the group being examined and its respective
performance (e.g., % proficient) on the NECAP Science Assessment. The CI can be envisioned as range of
values equal to the CI centered around the percent proficient, p. That is, viewing p as the center point, if one
adds the value of CI to p and also subtracts the value of CI from p, then the full confidence interval is created
with both an upper and lower boundary. For example, if the percent proficient, p equals 70% and CI equals .5,
then the confidence interval ranges from 69.5% to 70.5%. This is the range in which one can be confident that
the “true” value of the group’s performance (e.g., % proficient) exists.