Embed Size (px)
Citation preview

1
New Hampshire – Addenda Ppt Slides
State Level Results (slides 2-7)2 Enrollment - Grades 3-8 for 2005 and 20063 Reading - 2006 NECAP4 Mathematics - 2006 NECAP5 Writing - 2006 NECAP6 2005/2006 Comparison7 Reading - Cohort Comparison8 Mathematics - Cohort Comparison
Fun with Data slides from RI (slides 8-12)9 Fun with Student Level Reports10 Fun with Released Support Materials11 Fun with Grade Level Summaries12 Fun with Disaggregated Results13 Fun with School Level Summary Data

2
New Hampshire Results
Enrollment in NH Schools - Grades 3-8
12000
13000
14000
15000
16000
17000
18000
Grade Level
Enrollment
2005
2006
2005 15139 15305 15804 16235 16545 17276
2006 15052 15178 15388 15924 16399 16624
3 4 5 6 7 8
3
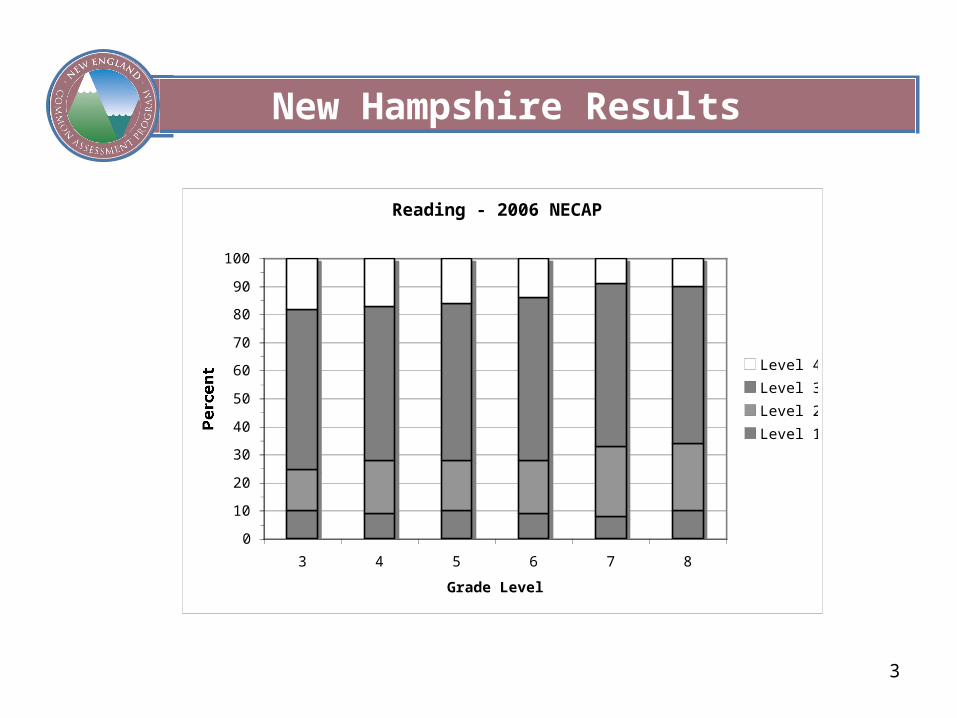
New Hampshire Results
Reading - 2006 NECAP
0
10
20
30
40
50
60
70
80
90
100
3 4 5 6 7 8
Grade Level
Percent
Level 4
Level 3
Level 2
Level 1
4
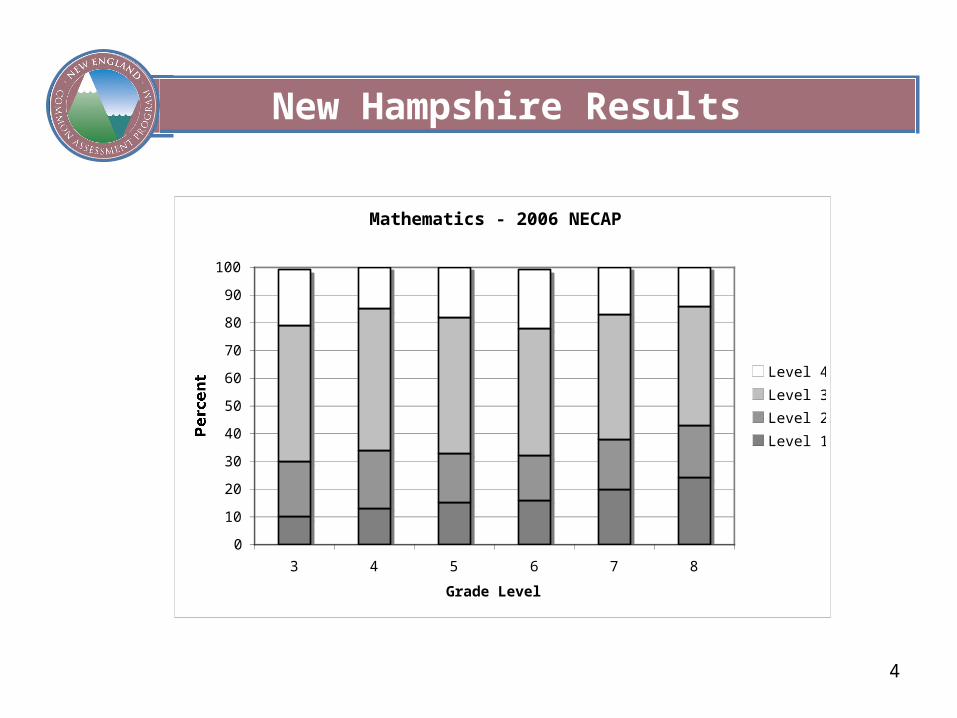
New Hampshire Results
Mathematics - 2006 NECAP
0
10
20
30
40
50
60
70
80
90
100
3 4 5 6 7 8
Grade Level
Percent
Level 4
Level 3
Level 2
Level 1

5
New Hampshire Results
Writing - 2006 NECAP
Level 1Level 1
Level 2Level 2
Level 3
Level 3
Level 4Level 4
0
10
20
30
40
50
60
70
80
90
100
5 8
Grade Level
Percent

6
New Hampshire Results
NH NECAP Math Performance
0
20
40
60
80
100
3&4 1
Achievement Levels
Percent
NH NECAP Reading Performance
0
20
40
60
80
100
3&4 1
Achievement Levels
Percent
2005
2006
NH NECAP Writing Performance
0
20
40
60
80
100
3&4 1
Achievement Levels
Percent
A comparison of the percent of students in grades 3-8 scoring Proficient or Above (levels 3&4) and Substantially Below Proficient (Level 1) in the 2005 and 2006 NECAP assessment for Reading, Mathematics, and Writing.
Comparison of 2005 and 2006 NECAP Results

7
New Hampshire Results
Reading - Cohort Comparison
0
10
20
30
40
50
60
70
80
90
100
3 4 5 6 7 8
Fall 2005 Gade Level
Percent Proficient or above
2005 NECAP Score
2006 NECAP Score
A cohort comparison of students scoring Proficient or above in one grade last year compared to those same student in the follow grade this year.

8
New Hampshire Results
Mathematics - Cohort Comparison
0
10
20
30
40
50
60
70
80
90
100
3 4 5 6 7 8
Fall 2005 Grade Level
Percent Proficient or above
2005 NECAP Score
2006 NECAP Score
A cohort comparison of students scoring Proficient or above in one grade last year compared to those same student in the follow grade this year.

9
• Review to be sure you have a student report for every student tested in October, 2006.
• Prepare a letter to provide your interpretation of the results for your school and/or district.
• Be sure teachers are prepared and comfortable discussing individual student results with families, including any instructional interventions.
• Use your district data file to analyze growth between students you had last year and this year.
Fun with Student Level Reports!

10
Fun with Released Support Materials!
• Build practice tests
• Share writing samples as models
• Mock scoring sessions to calibrate teacher judgments
• Compare released items (GLE and DOK) with classroom instruction and assessments and student work.
• Map instruction and scaffolding practices to items based on student performance.
11
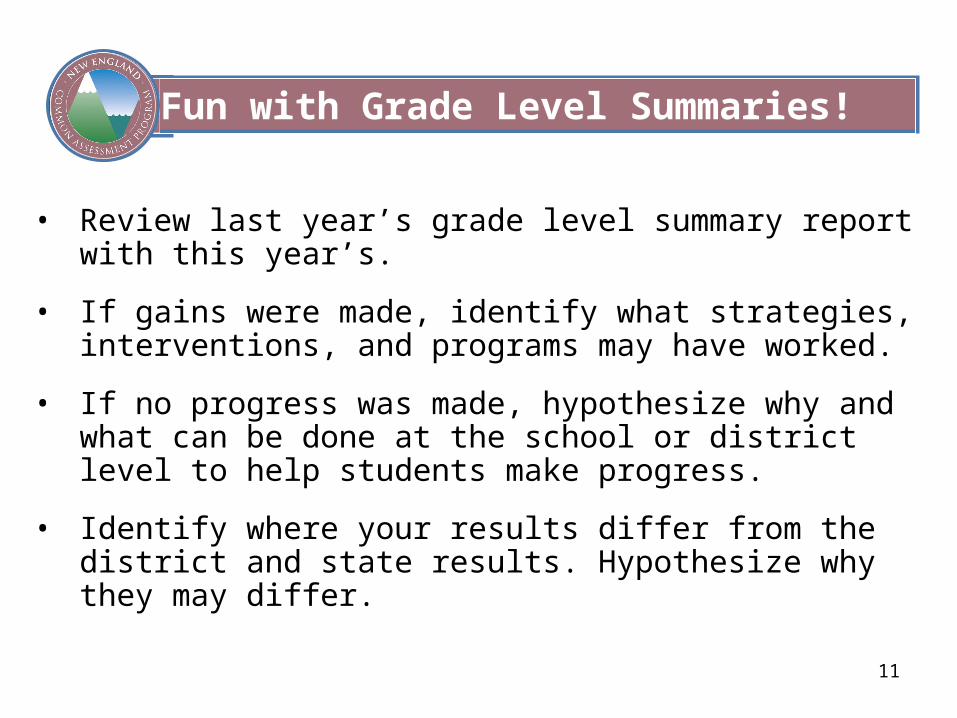
• Review last year’s grade level summary report with this year’s.
• If gains were made, identify what strategies, interventions, and programs may have worked.
• If no progress was made, hypothesize why and what can be done at the school or district level to help students make progress.
• Identify where your results differ from the district and state results. Hypothesize why they may differ.
Fun with Grade Level Summaries!

12
• Compare last year’s Disaggregated Report with this year’s• Highlight in yellow, groups that had significant positive
increases• Highlight in blue, groups that remained stable or had decreases
• Establish cross-grade and content groups to hypothesize what the school can do to close gaps and maintain increases• Access to rigorous curriculum?• Professional development in a specific area?• Adequate support programs?• Adequate family involvement?
Fun with Disaggregated Results!
13
• Are there consistent patterns of achievement across grades? Across content areas?
• Compare results to last year’s school summary• Highlight in yellow, areas where there has been
significant growth. Highlight in blue, areas where there has been no growth or decline.
• Establish cross-grade and content groups to hypothesize what the school can do to close gaps and maintain increases
• Develop a school/district plan to address areas of weakness and continue areas of growth
Fun with School Level Summary Data!