Embed Size (px)
Citation preview
25%
30%
35%
40%
45%
50%
1917
19
22
1927
19
32
1937
19
42
1947
19
52
1957
19
62
1967
19
72
1977
19
82
1987
19
92
1997
20
02
2007
20
12
Top
10%
Inco
me
Shar
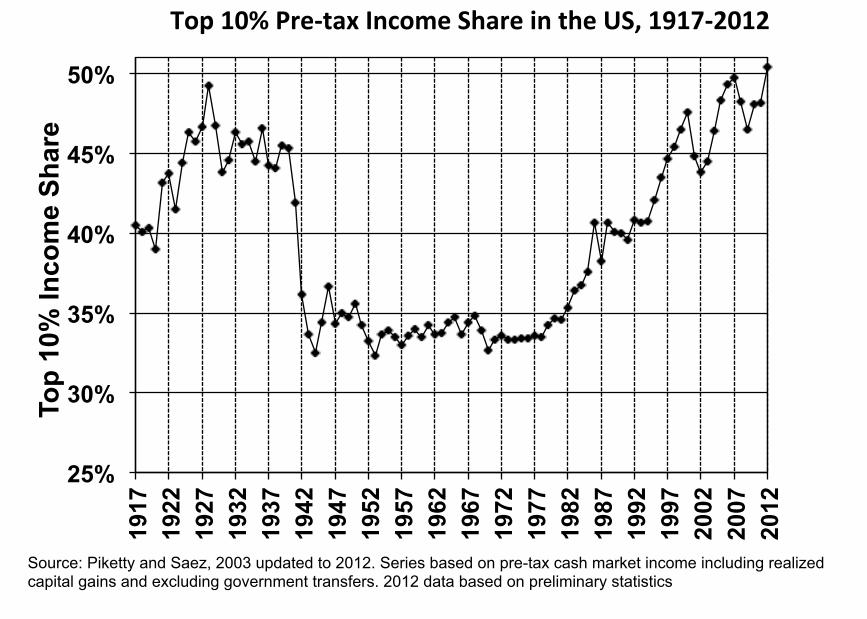
e Top 10% Pre-‐tax Income Share in the US, 1917-‐2012
Source: Piketty and Saez, 2003 updated to 2012. Series based on pre-tax cash market income including realized capital gains and excluding government transfers. 2012 data based on preliminary statistics
0%
5%
10%
15%
20%
25%
1913
19
18
1923
19
28
1933
19
38
1943
19
48
1953
19
58
1963
19
68
1973
19
78
1983
19
88
1993
19
98
2003
20
08
Shar
e of
tota
l inc
ome
for e
ach
grou
p
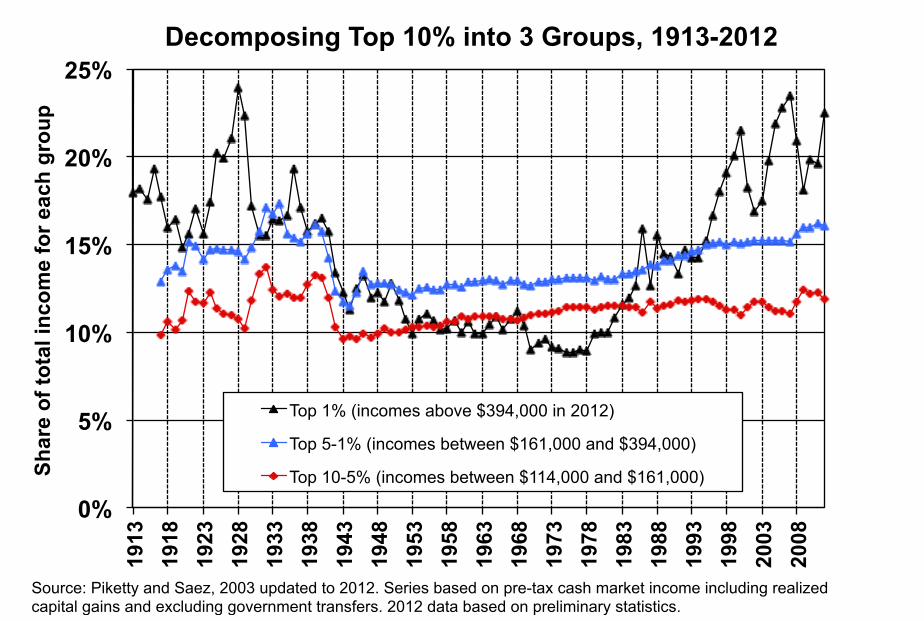
Decomposing Top 10% into 3 Groups, 1913-2012
Top 1% (incomes above $394,000 in 2012)
Top 5-1% (incomes between $161,000 and $394,000)
Top 10-5% (incomes between $114,000 and $161,000)
Source: Piketty and Saez, 2003 updated to 2012. Series based on pre-tax cash market income including realized capital gains and excluding government transfers. 2012 data based on preliminary statistics.

Public Finance and Public Policy Jonathan Gruber Third Edition Copyright © 2010 Worth Publishers
C H A P T E R 1 ■ W H Y S T U D Y P U B L I C E C O N O M I C S ?
11 of 24
The Congressional Budget Office: Government Scorekeepers � The methods and results derived from empirical economics
are central to the development of public policy at all levels of government.
� The Congressional Budget Office (CBO) provides Congress with the objective, timely, nonpartisan analyses needed for economic and budget decisions.
� The CBO increasingly plays a critical role as a “scorekeeper” for government policy debates.
� Legislative spending proposals that are to become law must first have their costs estimated by the analysts at the CBO.
It is not an overstatement to say that the economists who work at the CBO frequently hold the fate of a legislative proposal in their hands. The large price tag that the CBO assigned to the Clinton administration’s plan to reform health care in the United States in 1994 is often cited as a key factor in the defeat of that proposal.
1.1
The Four Questions of Public Finance APPLICATION �
�

2A. Tax revenue/GDP in the US, UK, and Sweden
0%
10%
20%
30%
40%
50%
60%18
68
1878
1888
1898
1908
1918
1928
1938
1948
1958
1968
1978
1988
1998
2008
Tota
l Tax
Rev
enue
/GD
P
United States
United Kingdom
Sweden
Source: Kleven-Kreiner-Saez NBER WP 2009
Public Finance and Public Policy Jonathan Gruber Fourth Edition Copyright © 2012 Worth Publishers
C H A P T E R 1 ■ W H Y S T U D Y P U B L I C E C O N O M I C S ?
15 of 32
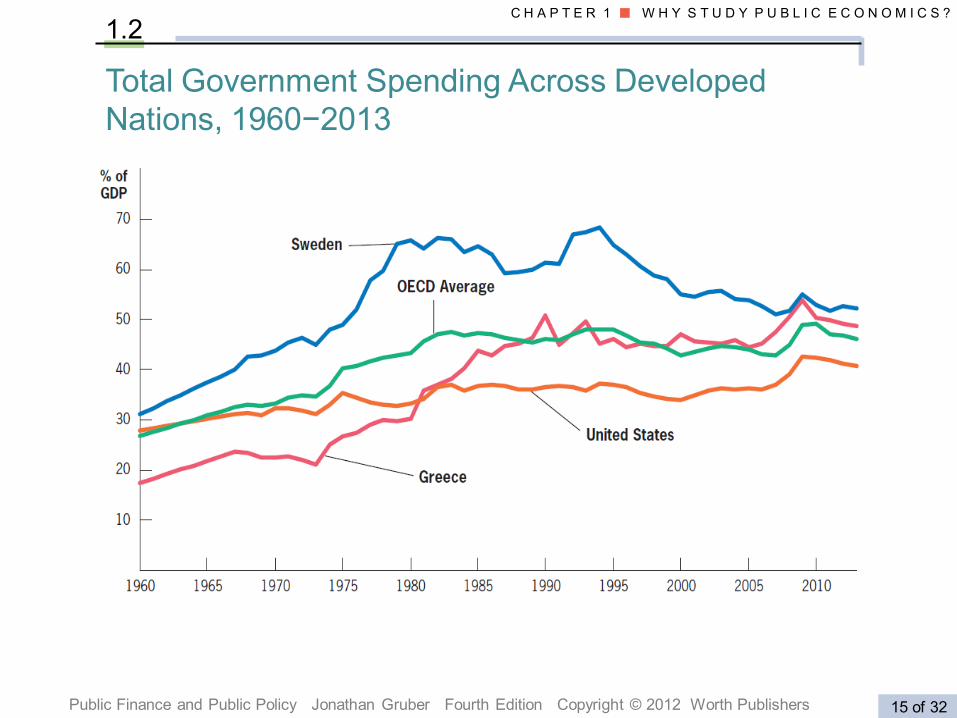
1.2
Total Government Spending Across Developed Nations, 1960−2013
Public Finance and Public Policy Jonathan Gruber Fourth Edition Copyright © 2012 Worth Publishers
C H A P T E R 1 ■ W H Y S T U D Y P U B L I C E C O N O M I C S ?
18 of 32
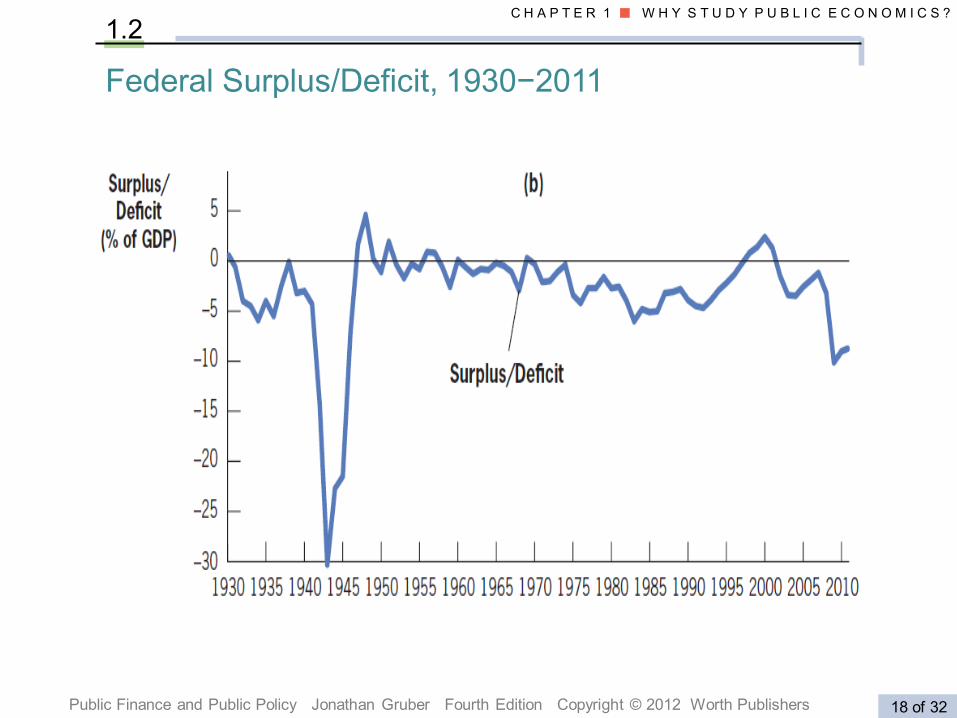
Federal Surplus/Deficit, 1930−2011
1.2
Public Finance and Public Policy Jonathan Gruber Fourth Edition Copyright © 2012 Worth Publishers
C H A P T E R 1 ■ W H Y S T U D Y P U B L I C E C O N O M I C S ?
19 of 32
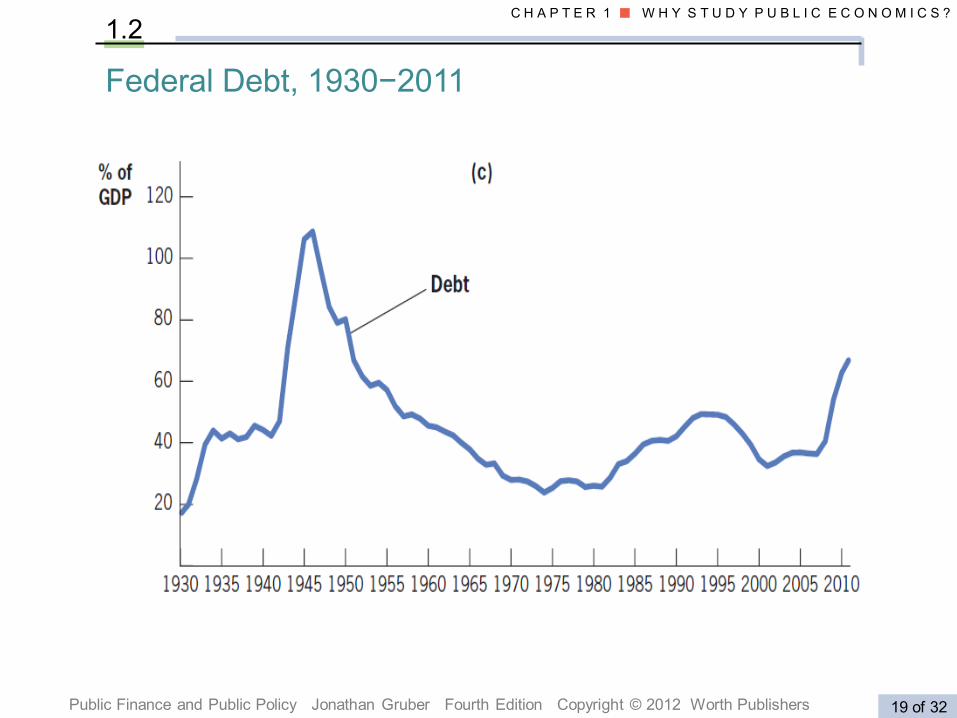
Federal Debt, 1930−2011
1.2
Public Finance and Public Policy Jonathan Gruber Fourth Edition Copyright © 2012 Worth Publishers
C H A P T E R 1 ■ W H Y S T U D Y P U B L I C E C O N O M I C S ?
20 of 32
1.2
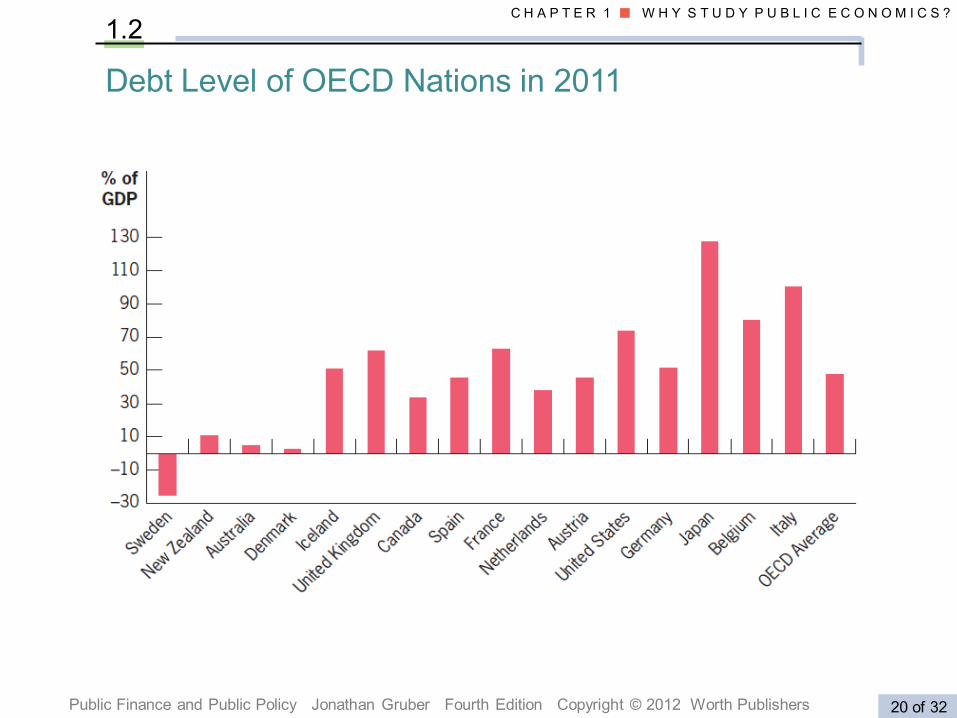
Debt Level of OECD Nations in 2011

Public Finance and Public Policy Jonathan Gruber Third Edition Copyright © 2010 Worth Publishers
C H A P T E R 1 ■ W H Y S T U D Y P U B L I C E C O N O M I C S ?
16 of 24
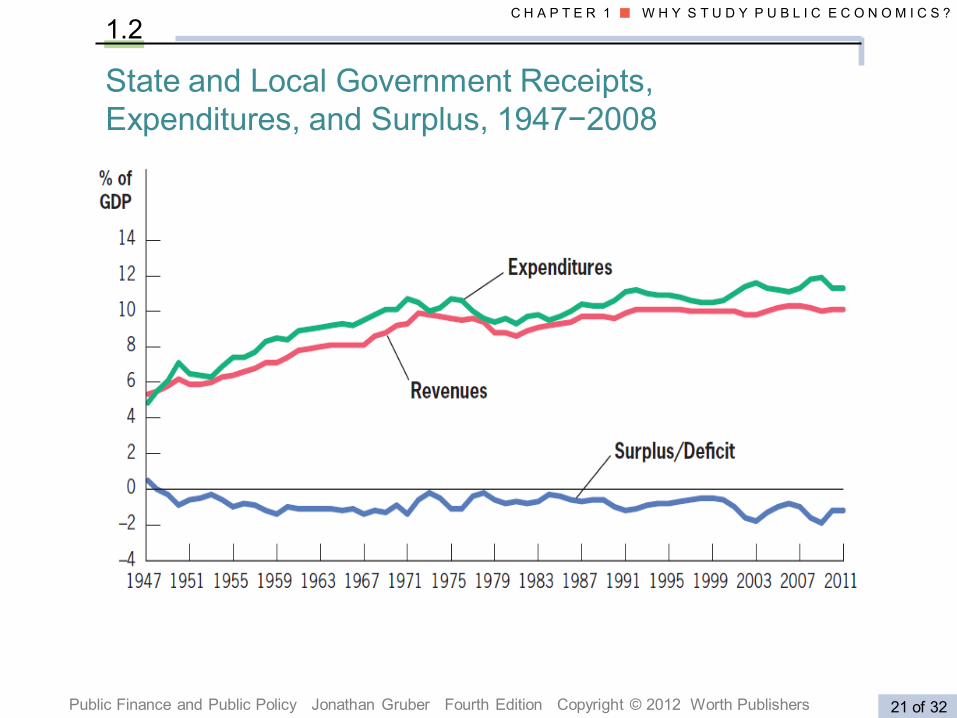
Decentralization
Why Study Public Finance? Facts on Government in the United States and around the World
A key feature of governments is the degree of centralization across local and national government units—that is, the extent to which spending is concentrated at higher (federal) levels or lower (state and local) levels.
1.2
Public Finance and Public Policy Jonathan Gruber Fourth Edition Copyright © 2012 Worth Publishers
C H A P T E R 1 ■ W H Y S T U D Y P U B L I C E C O N O M I C S ?
21 of 32
1.2
State and Local Government Receipts, Expenditures, and Surplus, 1947−2008

Public Finance and Public Policy Jonathan Gruber Third Edition Copyright © 2010 Worth Publishers
C H A P T E R 1 ■ W H Y S T U D Y P U B L I C E C O N O M I C S ?
21 of 24
Distribution of Spending
1.2
The Distribution of Federal and State Expenditures, 1960 and 2007 • This figure shows the changing composition of federal and state spending over time, as a share of total spending. (a) For the federal government, defense spending has fallen and Social Security and health spending have risen. (b) For the states, the distribution has been more constant, with a small decline in education and welfare spending and a rise in health spending.

Public Finance and Public Policy Jonathan Gruber Third Edition Copyright © 2010 Worth Publishers
C H A P T E R 1 ■ W H Y S T U D Y P U B L I C E C O N O M I C S ?
22 of 24
Distribution of Revenue Sources
1.2
The Distribution of Federal and State Revenues, 1960 and 2008 • This figure shows the changing composition of federal and state revenue sources over time, as a share of total revenues. (a) At the federal level, there has been a large reduction in corporate and excise tax revenues and a rise in payroll tax revenues. (b) For the states, there has been a decline in property taxes and a rise in income taxes and federal grants.
20%
30%
40%
50%
60%
Tota
l tax
reve
nues
(% n
atio
nal i
ncom
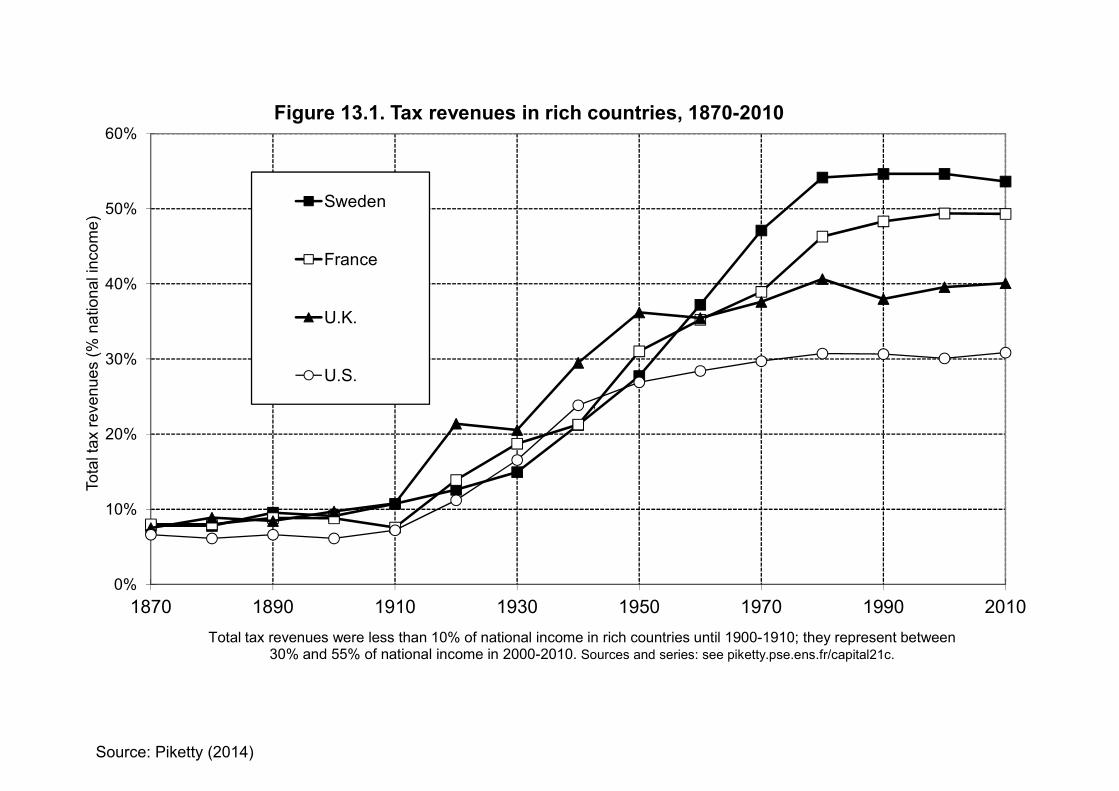
e)Figure 13.1. Tax revenues in rich countries, 1870-2010
Sweden
France
U.K.
U.S.,
0%
10%
1870 1890 1910 1930 1950 1970 1990 2010
Tota
l tax
reve
nues
(% n
atio
nal i
ncom
e)
Total tax revenues were less than 10% of national income in rich countries until 1900-1910; they represent between 30% and 55% of national income in 2000-2010. Sources and series: see piketty.pse.ens.fr/capital21c.
Source: Piketty (2014)

25%
30%
35%
40%
45%
50%
1917
1922
1927
1932
1937
1942
1947
1952
1957
1962
1967
1972
1977
1982
1987
1992
1997
2002
2007
2012
2017
% o
f nat
iona
l inc
ome
Share of pre-tax national income going to top 10% adults
Pre-tax
Source: Piketty, Saez, and Zucman (2018)
0
10,000
20,000
30,000
40,000
50,000
60,000 19
62
1966
1970
1974
1978
1982
1986
1990
1994
1998
2002
2006
2010
2014
Aver
age
inco
me
in c
onst
ant 2
014
dolla
rs
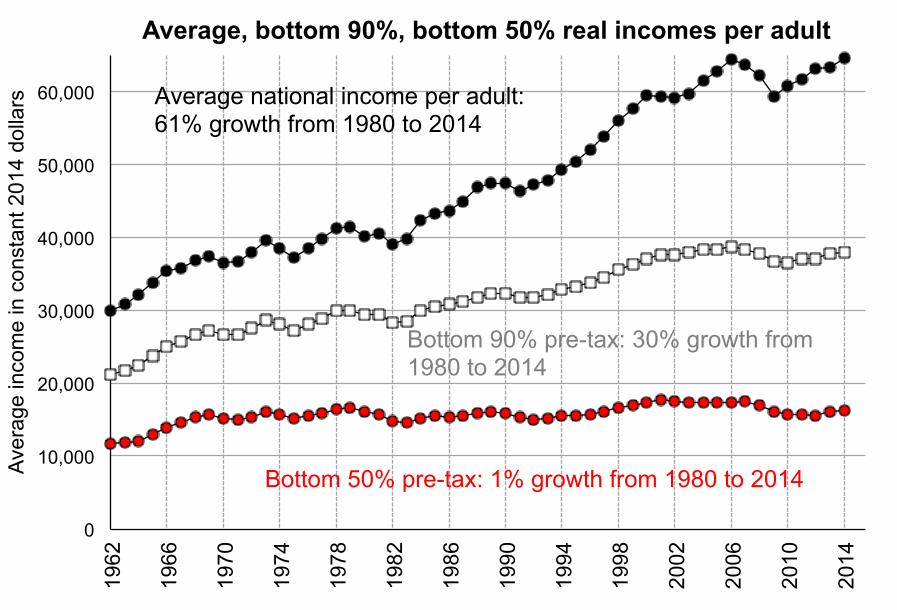
Average, bottom 90%, bottom 50% real incomes per adult
Average national income per adult: 61% growth from 1980 to 2014
Bottom 50% pre-tax: 1% growth from 1980 to 2014
Bottom 90% pre-tax: 30% growth from 1980 to 2014
10%
12%
14%
16%
18%
20%
22%
1962
1966
1970
1974
1978
1982
1986
1990
1994
1998
2002
2006
2010
2014
% o
f nat
iona
l inc
ome
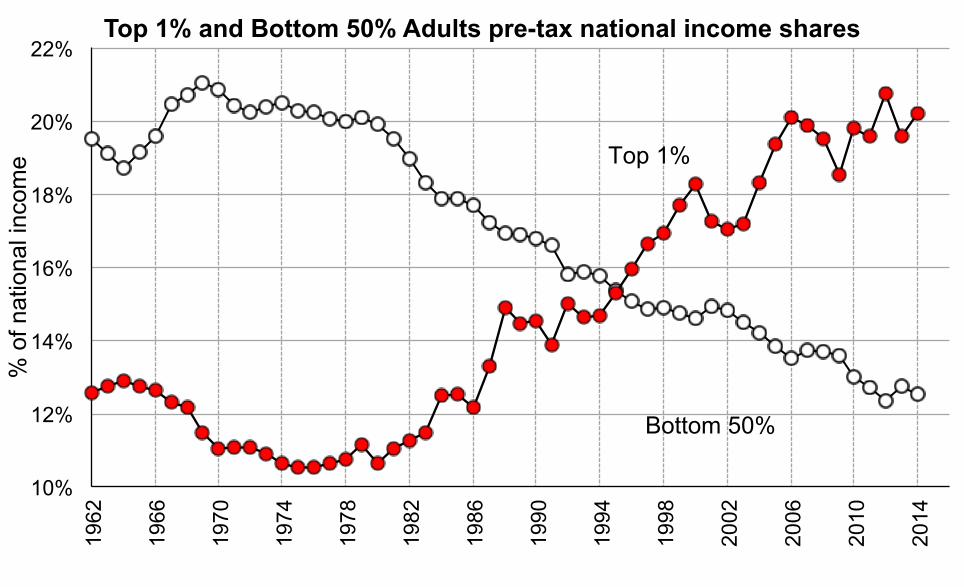
Top 1% and Bottom 50% Adults pre-tax national income shares
Bottom 50%
Top 1%
25%
30%
35%
40%
45%
50%
1917
1922
1927
1932
1937
1942
1947
1952
1957
1962
1967
1972
1977
1982
1987
1992
1997
2002
2007
2012
2017
% o
f nat
iona
l inc
ome
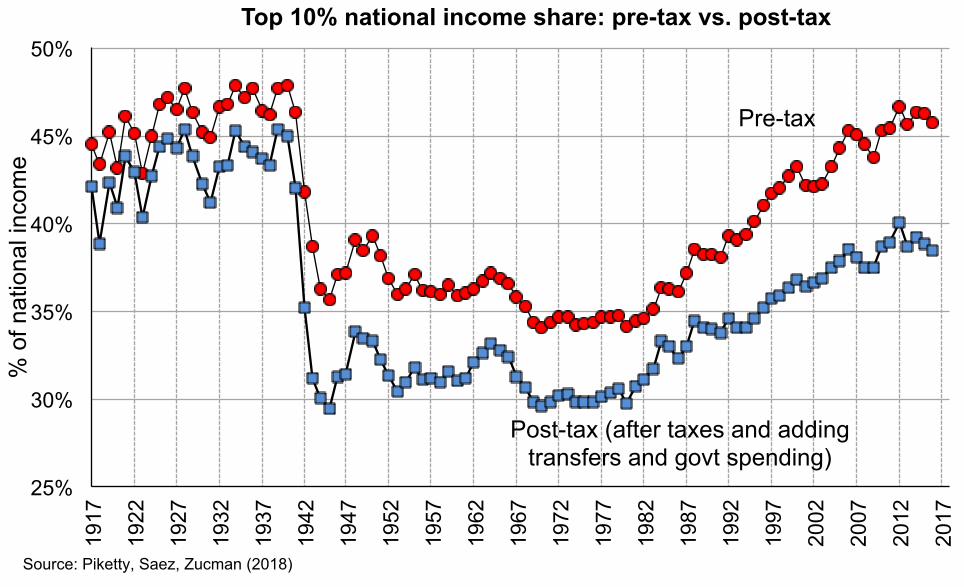
Top 10% national income share: pre-tax vs. post-tax
Pre-tax
Post-tax (after taxes and adding transfers and govt spending)
Source: Piketty, Saez, Zucman (2018)
0
10,000
20,000
30,000
40,000
50,000
60,000 19
62
1966
1970
1974
1978
1982
1986
1990
1994
1998
2002
2006
2010
2014
Aver
age
inco
me
in c
onst
ant 2
014
dolla
rs
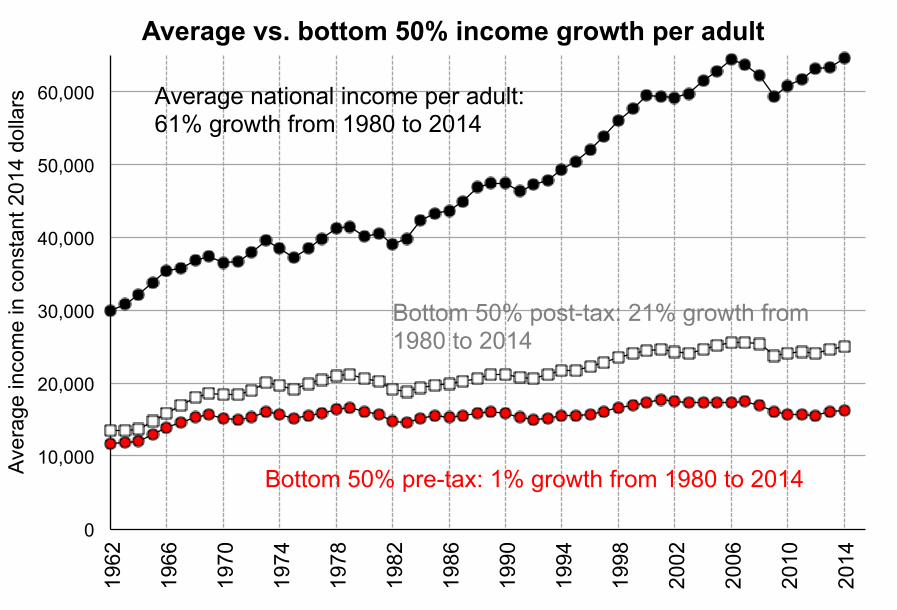
Average vs. bottom 50% income growth per adult
Average national income per adult: 61% growth from 1980 to 2014
Bottom 50% pre-tax: 1% growth from 1980 to 2014
Bottom 50% post-tax: 21% growth from 1980 to 2014
11chApteR 1: the BUdget oUtlook An UpdAte to the BUdget And economic oUtlook: 2019 to 2029
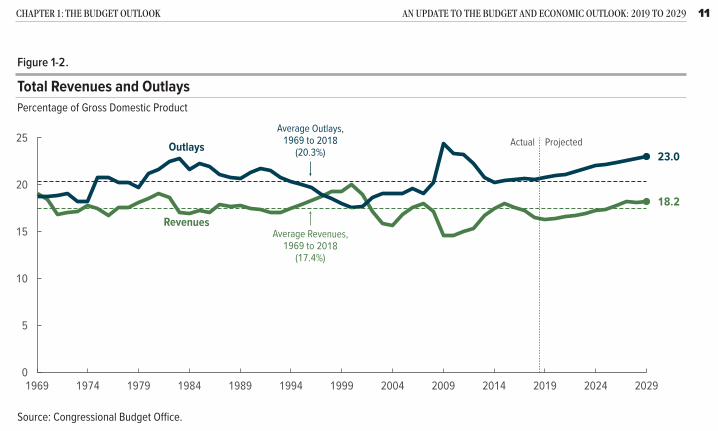
2017 tax act.) Federal outlays, adjusted to exclude shifts in the timing of certain payments, are projected to climb from 21.0 percent of GDP in 2020 to 23.0 percent in 2029 (see Figure 1-2).
Deficits are projected to average 4.7 percent of GDP over the 2020–2029 period. Over the past 50 years, deficits have averaged 2.9 percent of GDP; and in years when the unemployment rate has been below 6 percent, deficits averaged just 1.5 percent of GDP.
Primary deficits—that is, deficits excluding net outlays for interest—are projected to decrease over time, averag-ing 2.7 percent of GDP from 2020 through 2024 and 2.2 percent from 2025 through 2029. At the same time, because of projected increases in interest rates and fed-eral borrowing, net interest outlays grow steadily, from 1.8 percent of GDP in 2020 to 2.6 percent in 2029 (see Figure 1-3 on page 14).
Those deficits are projected to boost federal debt held by the public, which consists mostly of the securities that the Treasury issues to raise cash to fund federal activities and pay off the government’s maturing liabilities. The
net amount that the Treasury borrows by issuing those securities (calculated as the amounts that are sold minus the amounts that have matured) is influenced primarily by the annual budget deficit.
Consequently, under current law, debt held by the public would increase in upcoming years. In CBO’s baseline, after accounting for all of the government’s borrowing needs, debt held by the public rises from $17.8 trillion at the end of 2020 to $29.3 trillion at the end of 2029 (see Table 1-3 on page 15). As a percentage of GDP, that debt would increase from 79 percent in 2019 to 95 per-cent by the end of the projection period (see Figure 1-4 on page 16). At that point, such debt would be the largest since 1946 and more than twice the 50-year average.
Outlays Over the coming decade, CBO projects, federal outlays would grow at an average annual rate of 5 percent, reach-ing $7.1 trillion in 2029 (adjusted to exclude the effects of timing shifts). Outlays for Social Security, Medicare, and net interest account for about two-thirds of that $2.7 trillion increase.
Figure 1-2 .
Total Revenues and OutlaysPercentage of Gross Domestic Product
●
●
18.2
23.0ProjectedActual
0
5
10
15
20
25
1969 1974 1979 1984 1989 1994 1999 2004 2009 2014 2019 2024 2029
Outlays
Average Outlays,1969 to 2018
(20.3%)
Average Revenues,1969 to 2018
(17.4%)
Revenues
Source: Congressional Budget Office.
When October 1 (the first day of the fiscal year) falls on a weekend, certain payments that would have ordinarily been made on that day are instead made at the end of September and thus are shifted into the previous fiscal year. All projections presented here have been adjusted to exclude the effects of those timing shifts. Historical amounts have been adjusted as far back as the available data will allow.

0%5%
10%15%20%25%30%35%40%45%
Average tax rates by income group in 2018 (% of pre-tax income)
Corporate & property taxesConsumption taxes
Payroll taxesIndividual income taxes
Estate tax
Source: Saez and Zucman (2019)
0%
10%
20%
30%
40%
50%
60%
1870 1880 1890 1900 1910 1920 1930 1940 1950 1960 1970 1980 1990 2000 2010
Use
s of
fisc
al re
venu
es a
s %
nat
iona
l inc
ome
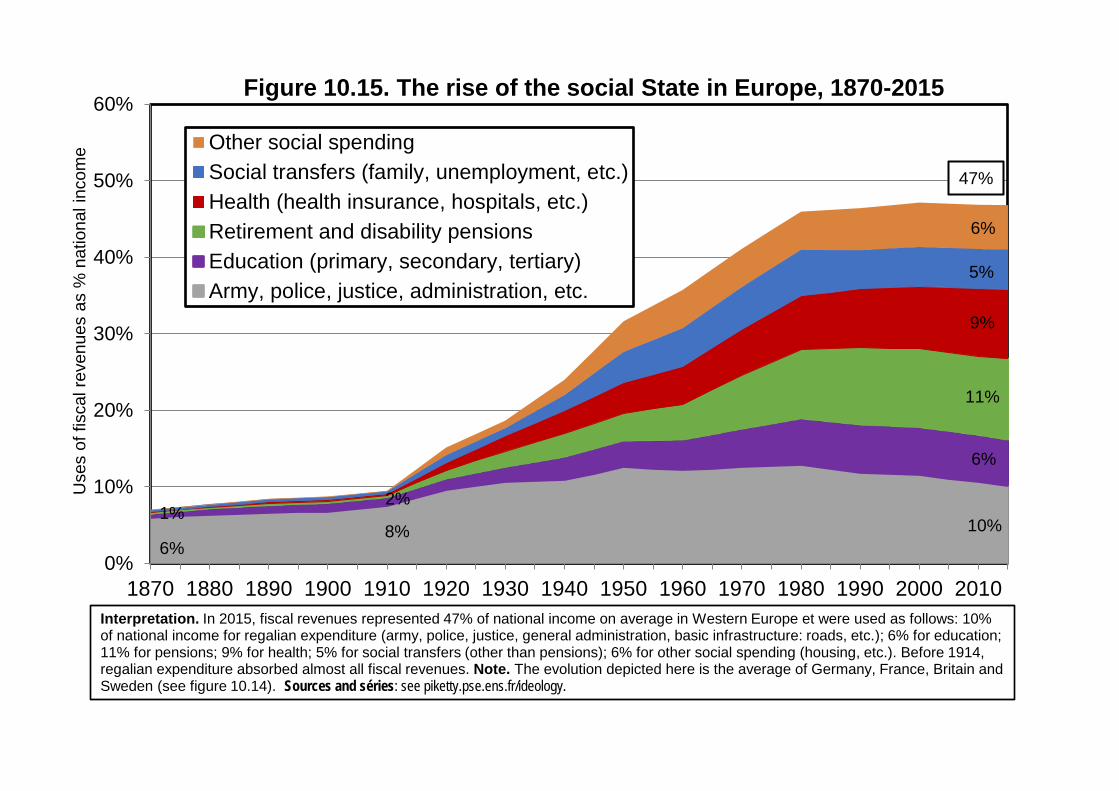
Figure 10.15. The rise of the social State in Europe, 1870-2015
Other social spendingSocial transfers (family, unemployment, etc.)Health (health insurance, hospitals, etc.)Retirement and disability pensionsEducation (primary, secondary, tertiary)Army, police, justice, administration, etc.
6%
10%
11%
Interpretation. In 2015, fiscal revenues represented 47% of national income on average in Western Europe et were used as follows: 10% of national income for regalian expenditure (army, police, justice, general administration, basic infrastructure: roads, etc.); 6% for education; 11% for pensions; 9% for health; 5% for social transfers (other than pensions); 6% for other social spending (housing, etc.). Before 1914, regalian expenditure absorbed almost all fiscal revenues. Note. The evolution depicted here is the average of Germany, France, Britain and Sweden (see figure 10.14). Sources and séries: see piketty.pse.ens.fr/ideology.
9%
8%
6%
5%
2%
6%
1%
47%
0%
10%
20%
30%
40%
50%
60%
1870 1880 1890 1900 1910 1920 1930 1940 1950 1960 1970 1980 1990 2000 2010
Tota
l tax
reve
nues
as
% n
atio
nal i
ncom
e
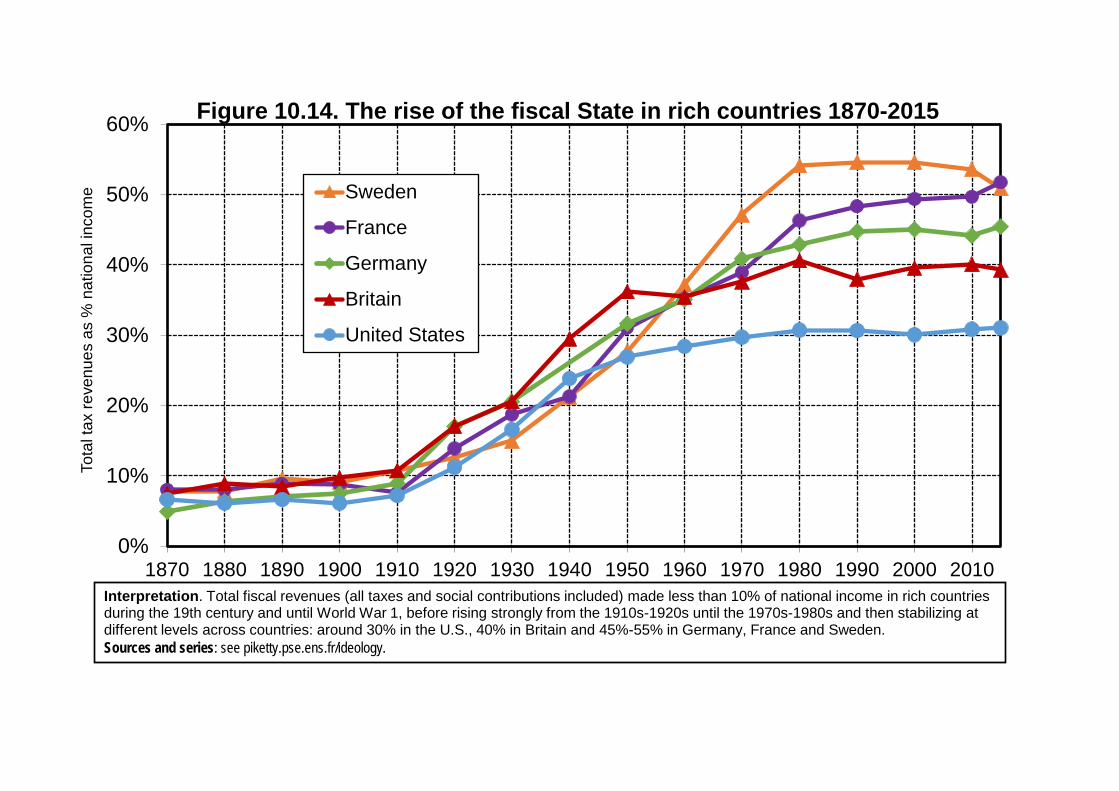
Figure 10.14. The rise of the fiscal State in rich countries 1870-2015
Sweden
France
Germany
Britain
United States
Interpretation. Total fiscal revenues (all taxes and social contributions included) made less than 10% of national income in rich countriesduring the 19th century and until World War 1, before rising strongly from the 1910s-1920s until the 1970s-1980s and then stabilizing at different levels across countries: around 30% in the U.S., 40% in Britain and 45%-55% in Germany, France and Sweden. Sources and series: see piketty.pse.ens.fr/ideology.et
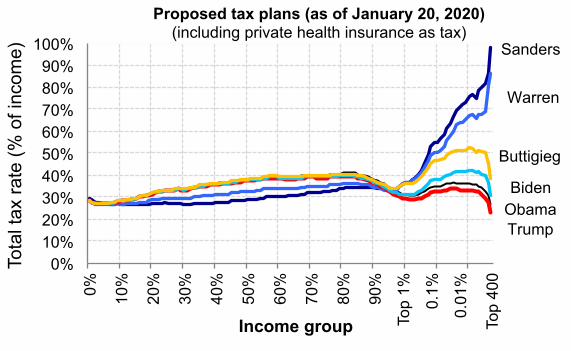
0% 10% 20% 30% 40% 50% 60% 70% 80% 90%
100%
0%
10%
20%
30%
40%
50%
60%
70%
80%
90%
Top
1%
0.1%
0.01
%
Top
400
Tota
l tax
rate
(% o
f inc
ome)
Income group
Proposed tax plans (as of January 20, 2020) (including private health insurance as tax)
Sanders
Warren
Biden
Trump
Buttigieg
Obama


![Gini Coefficient California pre-tax income, 2000, Gini=62.1%saez/course131/taxintro_ch17_new_attach.pdfFigure 1: Gini coefficient 6RXUFH .RSF]XN 6DH] 6RQJ4-( :DJHHDUQLQJVLQHTXDOLW\](https://img.pdfslide.us/doc/110x75/5f9d687763df8333422405c5/gini-coefficient-california-pre-tax-income-2000-gini621-saezcourse131taxintroch17newattachpdf.jpg)