Embed Size (px)
Citation preview

Public Finance and Public Policy Jonathan Gruber Third Edition Copyright © 2010 Worth Publishers 3 of 29
C H A P T E R 1 2 ■ S O C I A L I N S U R A N C E : T H E N E W F U N C T I O N O F G O V E R N M E N T

4 of 38
C H A P T E R 1 2 ■ S O C I A L I N S U R A N C E : T H E N E W F U N C T I O N O F G O V E R N M E N T
Public Finance and Public Policy Jonathan Gruber Fourth Edition Copyright © 2012 Worth Publishers
12
Government spending, 1953 and 2010
1953 2010
Defense 69.4% 19.1%
Income security 5.0 20.1
Social Security 3.6 15.9
Health 0.4 25.2
Other 21.6 19.7

21 of 38
C H A P T E R 1 2 ■ S O C I A L I N S U R A N C E : T H E N E W F U N C T I O N O F G O V E R N M E N T
Public Finance and Public Policy Jonathan Gruber Fourth Edition Copyright © 2012 Worth Publishers
12.2
• In 1995, Harvard stopped subsidizing its most generous plans, which were experience-rated.
• Experience rating: Charging a price for insurance that is a function of realized outcomes.
• Before 1995, there was a pooling equilibrium.
o Healthy employees chose the cheap, generous plan.
• After 1995, there was a separating equilibrium.
o Healthy employees dropped the now expensive generous plan.
APPLICATION: Adverse Selection and Health
Insurance “Death Spirals”

22 of 38
C H A P T E R 1 2 ■ S O C I A L I N S U R A N C E : T H E N E W F U N C T I O N O F G O V E R N M E N T
Public Finance and Public Policy Jonathan Gruber Fourth Edition Copyright © 2012 Worth Publishers
12.2
APPLICATION: Adverse Selection and Health
Insurance “Death Spirals”
• Because the less-healthy employees used much more medical care, the experience-rated premiums of the more generous plans increased substantially.
• By 1998, the most generous plan had gotten so expensive that it was no longer offered.
o Adverse selection had led to a “death spiral” for this plan.
o It kept getting more expensive, and healthy people kept leaving, driving its price ever higher.
29 of 38
C H A P T E R 1 2 ■ S O C I A L I N S U R A N C E : T H E N E W F U N C T I O N O F G O V E R N M E N T
Public Finance and Public Policy Jonathan Gruber Fourth Edition Copyright © 2012 Worth Publishers
• Unemployment insurance provides benefits through the replacement rate.
• UI replacement rate: The ratio of unemployment insurance benefits to pre-unemployment earnings.
• A higher replacement rate corresponds to more generous insurance.
• But private insurance reduces the consumption-smoothing value of this insurance.
12.4
Example: Unemployment Insurance

30 of 38
C H A P T E R 1 2 ■ S O C I A L I N S U R A N C E : T H E N E W F U N C T I O N O F G O V E R N M E N T
Public Finance and Public Policy Jonathan Gruber Fourth Edition Copyright © 2012 Worth Publishers
12.4
Example: Unemployment Insurance
33 of 38
C H A P T E R 1 2 ■ S O C I A L I N S U R A N C E : T H E N E W F U N C T I O N O F G O V E R N M E N T
Public Finance and Public Policy Jonathan Gruber Fourth Edition Copyright © 2012 Worth Publishers
12.5
• Prison guard Ricci DeGaetano
o Supposedly injured by an inmate. Collected $82,500 in claims over three years while operating a karate school.
• Waitress Christina Gamble
o Too injured to “stand” and “change positions.” Received $360/week in insurance payments while working as a stripper.
• Detective Rockey Sherwood
o Injured in traffic accidents. While claiming workers’ compensation, coached little league team to California World Series victory.
APPLICATION: The Problems with Assessing
Workers’ Compensation Injuries

utility
consumption

utility
consumption w (probability 1-q)
w-d (probability q)
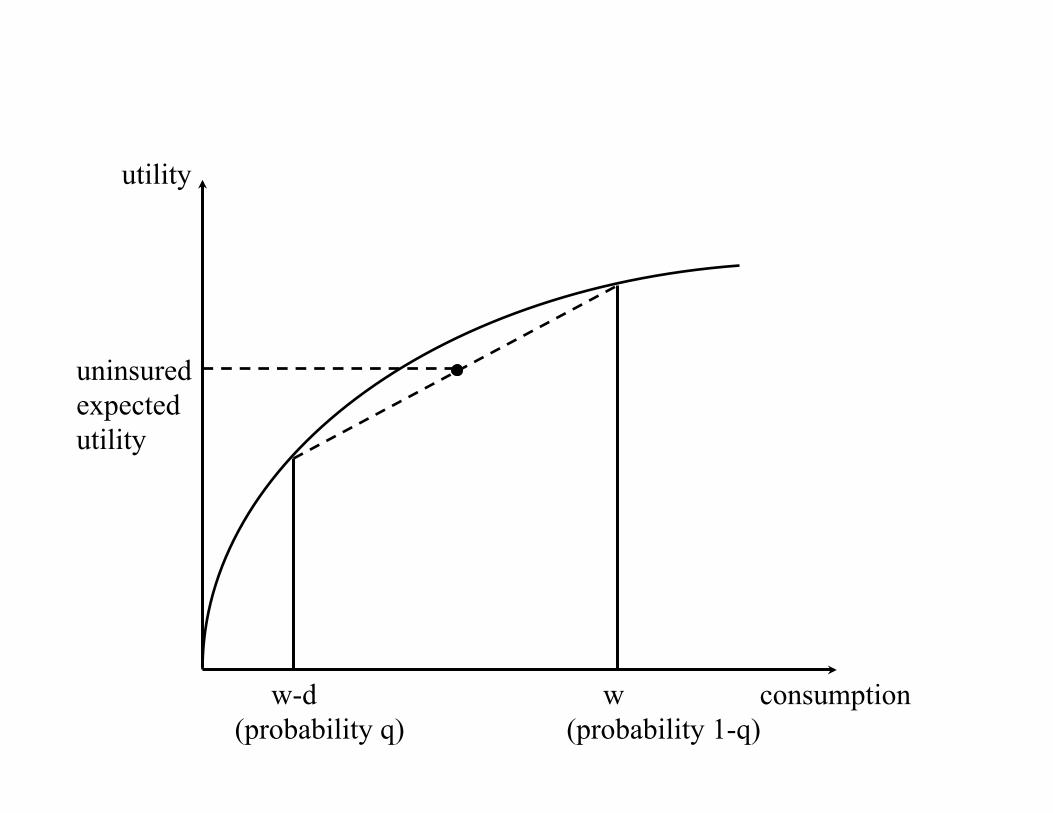
utility
consumption
uninsured expected utility
w (probability 1-q)
w-d (probability q)

utility
consumption
insured uninsured
w w-d w-d·q (with full insurance)

0%
10%
20%
30%
40%
50%
60%
1870 1880 1890 1900 1910 1920 1930 1940 1950 1960 1970 1980 1990 2000 2010
Use
s of
fisc
al re
venu
es a
s %
nat
iona
l inc
ome
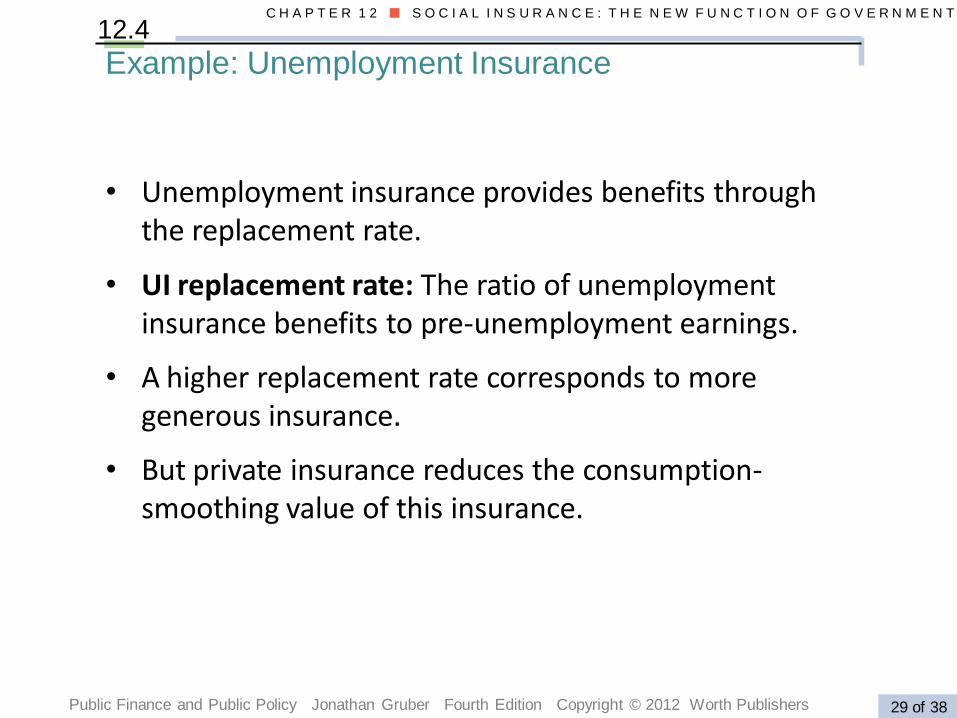
Figure 10.15. The rise of the social State in Europe, 1870-2015
Other social spendingSocial transfers (family, unemployment, etc.)Health (health insurance, hospitals, etc.)Retirement and disability pensionsEducation (primary, secondary, tertiary)Army, police, justice, administration, etc.
6%
10%
11%
Interpretation. In 2015, fiscal revenues represented 47% of national income on average in Western Europe et were used as follows: 10% of national income for regalian expenditure (army, police, justice, general administration, basic infrastructure: roads, etc.); 6% for education; 11% for pensions; 9% for health; 5% for social transfers (other than pensions); 6% for other social spending (housing, etc.). Before 1914, regalian expenditure absorbed almost all fiscal revenues. Note. The evolution depicted here is the average of Germany, France, Britain and Sweden (see figure 10.14). Sources and séries: see piketty.pse.ens.fr/ideology.
9%
8%
6%
5%
2%
6%
1%
47%

0%
10%
20%
30%
40%
50%
60%
1870 1880 1890 1900 1910 1920 1930 1940 1950 1960 1970 1980 1990 2000 2010
Use
s of
fisc
al re
venu
es a
s %
nat
iona
l inc
ome
Figure 10.15. The rise of the social State in Europe, 1870-2015
Other social spendingSocial transfers (family, unemployment, etc.)Health (health insurance, hospitals, etc.)Retirement and disability pensionsEducation (primary, secondary, tertiary)Army, police, justice, administration, etc.
6%
10%
11%
Interpretation. In 2015, fiscal revenues represented 47% of national income on average in Western Europe et were used as follows: 10% of national income for regalian expenditure (army, police, justice, general administration, basic infrastructure: roads, etc.); 6% for education; 11% for pensions; 9% for health; 5% for social transfers (other than pensions); 6% for other social spending (housing, etc.). Before 1914, regalian expenditure absorbed almost all fiscal revenues. Note. The evolution depicted here is the average of Germany, France, Britain and Sweden (see figure 10.14). Sources and séries: see piketty.pse.ens.fr/ideology.
9%
8%
6%
5%
2%
6%
1%
47%


![Gini Coefficient California pre-tax income, 2000, Gini=62.1%saez/course131/taxintro_ch17_new_attach.pdfFigure 1: Gini coefficient 6RXUFH .RSF]XN 6DH] 6RQJ4-( :DJHHDUQLQJVLQHTXDOLW\](https://img.pdfslide.us/doc/110x75/5f9d687763df8333422405c5/gini-coefficient-california-pre-tax-income-2000-gini621-saezcourse131taxintroch17newattachpdf.jpg)