Embed Size (px)
Citation preview
The Research Agenda Post-“Capital in the 21st Century”
By Emmanuel Saez, University of California, Berkeley Economist Emmanuel Saez plays a unique role in this volume. Saez is often a co-author with Thomas Piketty and worked with him to develop much of the data in “Capital in the 21st Century” as well as being a co-manager of the World Top Incomes Database, along with economists Anthony Atkinson and Facundo Alvaredo, where that data is housed. In his chapter, Saez lays out a lifetime’s worth of research ideas, much of which aims to empirically evaluate the documented rise in income and wealth inequality and what that means for economic outcomes, and highlighting three themes for future research. First, he argues that researchers still have much to do on the issue of measurement. He argues that the next step is to disaggregate our systems of National Income Accounts to include distributional measures and devote more resources to measuring wealth inequality. Second, Saez points to the question of fairness. He argues that in order to judge whether current distribution outcomes are fair, we need to understand how they come about. Is today’s wealth mostly self-made or inherited? Do incomes reflect productivity or rent? Finally, Saez pushes us to consider the role of policy in ameliorating or exacerbating inequality. He points specifically to the need to understand the effects of regulation and taxation, both of which seem to have been key in ushering in a unique and unfortunately ephemeral era of low inequality and high growth in the middle of the 20th century.
Introduction
The phenomenal success of Thomas Piketty’s Capital in the 21st Century shows there is
great interest in the issue of inequality among the public at large. Inequality matters
because people have a sense of fairness. They care about not only their own economic
situations but also how they stand relative to others in their communities. Such feelings go
well beyond “envy,” representing instead the very foundation of societies. In modern
democracies, people have collectively decided to share a large fraction of their economic
resources through government. In advanced economies, governments tax one-third to one-
half of total national income to fund transfers and public goods. Hence, inequality is a
people’s issue and it is essential to bring the findings of research into the causes and
consequences of inequality to the broader public, exactly what Piketty’s book has
succeeded in doing. How should economics and more broadly social science research
capitalize on the success of the book and tackle some of the unanswered questions that
have so fascinated the public?
2
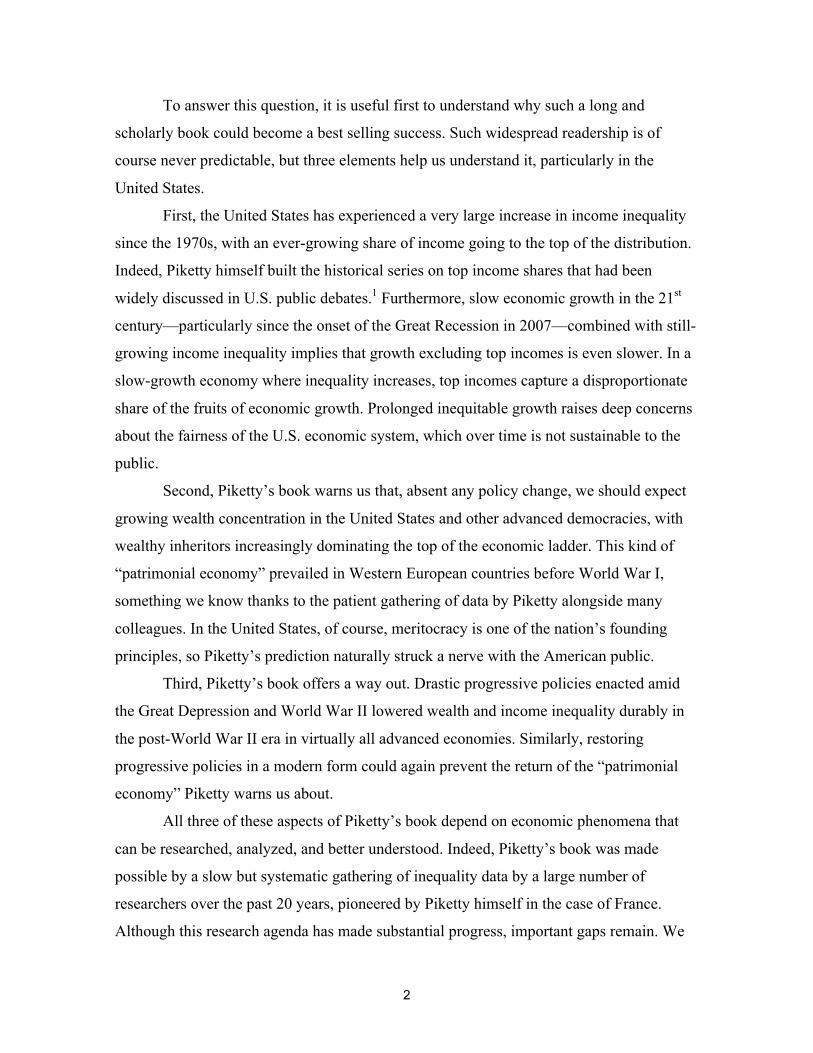
To answer this question, it is useful first to understand why such a long and
scholarly book could become a best selling success. Such widespread readership is of
course never predictable, but three elements help us understand it, particularly in the
United States.
First, the United States has experienced a very large increase in income inequality
since the 1970s, with an ever-growing share of income going to the top of the distribution.
Indeed, Piketty himself built the historical series on top income shares that had been
widely discussed in U.S. public debates.1 Furthermore, slow economic growth in the 21st
century—particularly since the onset of the Great Recession in 2007—combined with still-
growing income inequality implies that growth excluding top incomes is even slower. In a
slow-growth economy where inequality increases, top incomes capture a disproportionate
share of the fruits of economic growth. Prolonged inequitable growth raises deep concerns
about the fairness of the U.S. economic system, which over time is not sustainable to the
public.
Second, Piketty’s book warns us that, absent any policy change, we should expect
growing wealth concentration in the United States and other advanced democracies, with
wealthy inheritors increasingly dominating the top of the economic ladder. This kind of
“patrimonial economy” prevailed in Western European countries before World War I,
something we know thanks to the patient gathering of data by Piketty alongside many
colleagues. In the United States, of course, meritocracy is one of the nation’s founding
principles, so Piketty’s prediction naturally struck a nerve with the American public.
Third, Piketty’s book offers a way out. Drastic progressive policies enacted amid
the Great Depression and World War II lowered wealth and income inequality durably in
the post-World War II era in virtually all advanced economies. Similarly, restoring
progressive policies in a modern form could again prevent the return of the “patrimonial
economy” Piketty warns us about.
All three of these aspects of Piketty’s book depend on economic phenomena that
can be researched, analyzed, and better understood. Indeed, Piketty’s book was made
possible by a slow but systematic gathering of inequality data by a large number of
researchers over the past 20 years, pioneered by Piketty himself in the case of France.
Although this research agenda has made substantial progress, important gaps remain. We
3
need to improve our measurements of inequality, refine our understanding of its
mechanisms and the policy remedies needed to address it. The numerous reactions,
discussions, and criticisms of Piketty’s book over the past two years give us an opportunity
to identify the key issues outstanding. Progress in our understanding should come from a
combination of data and research. The government plays a key role in collecting data and
supplying it to researchers. Hence, in the same way that the government is key to
implementing policies to remedy inequality, it is also key in helping build the data
infrastructure needed to study inequality in the first place.
The theme of this chapter will follow the most important questions and
controversies that have arisen in the commentary on Piketty’s book. First, I discuss the
issues involved in measuring inequality. Second, I look at the underlying mechanisms of
inequality. And third, I examine policies that can remedy inequality. In all three cases, I
highlight the most promising avenues for future research, focusing particularly on the
United States, which provides the best evidence and is ground zero for the resurgence of
inequality.
Measuring Inequality
The backbone of Piketty’s book is a long and systematic collection of inequality and
growth statistics. Through his earlier long and scholarly book on France,2 Piketty led the
revival of the analysis of top income shares that had been famously pioneered by Kuznets’
own long and scholarly book.3 None of these two books made it to the bestseller lists, full
as they are of long methodological details and even longer sets of tabulated statistics. Their
long-term influence, however, has been enormous. Kuznets won the Nobel Prize, in large
part due to the famous Kuznets’ curve theory of inequality he developed based on his
statistics 5 Piketty’s older book revived the systematic analysis of top income shares. Since
then, a World Top Incomes Database has been assembled by a large team of scholars. It
covers more than 30 countries over long time periods of often a century or more.6 As
Piketty’s book shows so eloquently, this database has taught us a lot about inequality.7 Yet
it still has a number of shortcomings and gaps and that researchers will have to fill.
4
Income Inequality and Growth
First, there is a gap between the study of growth, which uses national accounts data that
exclusively focus on economic aggregates, and inequality analysis, which focuses on
distributions using micro data but without trying to be consistent with macro aggregates.
Economists lack the measurement tools to analyze inequality, growth, and the role of the
government together in a coherent framework. Historically, Kuznets was interested in both
national income and its distribution and did path-breaking advances on both fronts using
administrative tabulated data.8 But with the advent of micro-survey data in the postwar
period, inequality analysis since the 1960s has lost the connection with national accounting
and growth.
This creates two sets of issues. First, it is currently impossible to jointly analyze
economic growth and inequality and answer simple questions such as: how is macro-
economic economic growth shared between income groups? Second, it creates
comparability issues in inequality statistics computed with different datasets or in different
countries. Survey data, for example, typically does not capture well capital income that is
highly concentrated while individual tax data does. Individual tax data miss some forms of
income that are non-taxable, such as fringe benefits, and do not provide systematic
information on transfers. The comparison of inequality across countries is also particularly
difficult as different countries have different tax bases or different ways of capturing
incomes in survey data.9
National accounting has developed an international set of guidelines to make
standardized and comparable measures across time and countries.10 In the same way,
economic researchers need to develop Distributional National Accounts (DINA) that will
use a common national income basis for analyzing inequality. Such a tool can integrate the
analysis of growth and inequality and it will allow meaningful comparisons across
countries.
Preliminary steps are being taken in this direction. The World Top Income
Database (WTID) is being transformed into a Wealth and Income Database (WID) that
will offer distributional statistics on both income and wealth (instead of income only),
cover the full population (as opposed to only top incomes), and be fully consistent with
National Accounts aggregates. Atkinson et al. are laying out the preliminary guidelines.11
5
Country-specific studies are being carried out for the United States,12 France,13 and the
United Kingdom.14 The goal of these studies is to start from available micro individual
income tax data and survey data to construct annual synthetic micro-datasets that are
representative of the full population of the country and consistent with National Accounts.
This approach captures both labor and capital income. On the labor income side,
wages and salaries are augmented by fringe benefits and employer payroll taxes to scale up
to the full compensation of employees in National Accounts. On the capital income side,
corporate retained earnings are imputed to individual stockholders, returns to pension
funds are assigned to individual pension owners, and rents are imputed to homeowners
exactly as done at the aggregate level in National Accounting when estimating National
Income. The goal is to produce measures of all the key income components (labor and
capital income), wealth components, taxes and transfers from National accounts in a
micro-level database.
There have been and there are ongoing efforts to introduce distributional measures
in the National Accounts from government agencies. The U.S. Bureau of Economic
Analysis (BEA), for instance, has a long-term plan to introduce distributional information
in the National Accounts. Fixler and Johnson15 and Fixler et al.16 describe this effort and
make a first attempt to scale up income from the Current Population Survey to match
personal income from National Accounts. The Organisation for Economic Co-operation
and Development is also starting to decompose National Income by quintiles.17 Hence, the
time seems ripe for an academic and governmental partnership to push forward the
creation of Distributional National Accounting data.
With Distributional National Accounting datasets, it is possible to compute
inequality and growth statistics for both pre-tax incomes and post-tax incomes, and for
specific demographic subgroups, such as the working age population or male vs. female.
Preliminary estimates from Piketty, Saez, and Zucman show that from 1946 to 1980, the
average real annual growth rates of pre-tax income per adult for the full population and the
bottom 90 percent of income earners were the same, at 2.0 percent per year.18 From 1980
to 2012 however, the growth rate for the bottom 90 percent is 0.7 percent. This is only half
of the growth rate for all adults which is 1.4 percent, highlighting the effect of widening
inequality on the distribution of economic growth. The bottom 90 percent captured 62
6
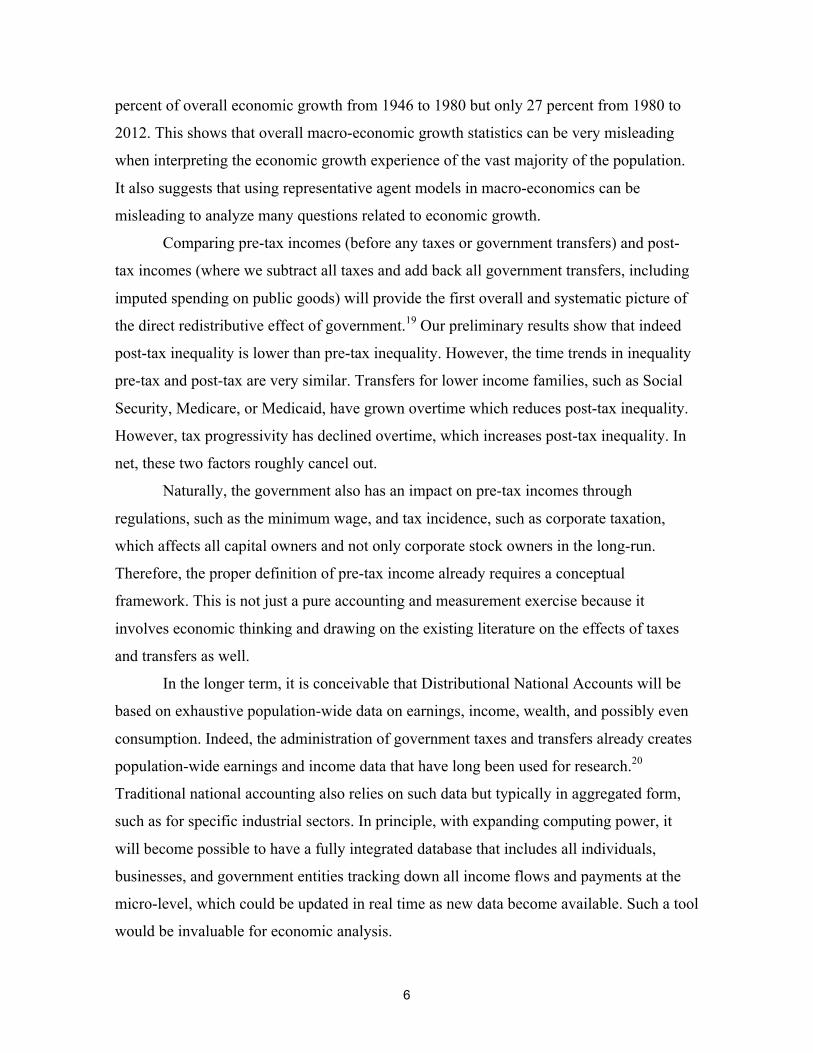
percent of overall economic growth from 1946 to 1980 but only 27 percent from 1980 to
2012. This shows that overall macro-economic growth statistics can be very misleading
when interpreting the economic growth experience of the vast majority of the population.
It also suggests that using representative agent models in macro-economics can be
misleading to analyze many questions related to economic growth.
Comparing pre-tax incomes (before any taxes or government transfers) and post-
tax incomes (where we subtract all taxes and add back all government transfers, including
imputed spending on public goods) will provide the first overall and systematic picture of
the direct redistributive effect of government.19 Our preliminary results show that indeed
post-tax inequality is lower than pre-tax inequality. However, the time trends in inequality
pre-tax and post-tax are very similar. Transfers for lower income families, such as Social
Security, Medicare, or Medicaid, have grown overtime which reduces post-tax inequality.
However, tax progressivity has declined overtime, which increases post-tax inequality. In
net, these two factors roughly cancel out.
Naturally, the government also has an impact on pre-tax incomes through
regulations, such as the minimum wage, and tax incidence, such as corporate taxation,
which affects all capital owners and not only corporate stock owners in the long-run.
Therefore, the proper definition of pre-tax income already requires a conceptual
framework. This is not just a pure accounting and measurement exercise because it
involves economic thinking and drawing on the existing literature on the effects of taxes
and transfers as well.
In the longer term, it is conceivable that Distributional National Accounts will be
based on exhaustive population-wide data on earnings, income, wealth, and possibly even
consumption. Indeed, the administration of government taxes and transfers already creates
population-wide earnings and income data that have long been used for research.20
Traditional national accounting also relies on such data but typically in aggregated form,
such as for specific industrial sectors. In principle, with expanding computing power, it
will become possible to have a fully integrated database that includes all individuals,
businesses, and government entities tracking down all income flows and payments at the
micro-level, which could be updated in real time as new data become available. Such a tool
would be invaluable for economic analysis.
7
Wealth Inequality
Piketty’s book focuses mostly on capital inequality where capital is defined as net wealth,
or the sum of assets minus debts for each individual. Unfortunately, statistics on wealth
inequality are much weaker than statistics on income: Virtually all advanced economies
have progressive individual income taxes that generate detailed information on income
inequality but very few have progressive and comprehensive individual wealth taxes. As a
result, the quality and breadth of wealth data are much lower than for income data. This is
particularly true in the United States, where the two most widely used sources to measure
wealth inequality have been estate tax data available since 1916 and the Survey of
Consumer Finances (SCF) available since 1989 (but only every third year). The two
sources have generated very different results. According to estate tax data, U.S. wealth
inequality has been low and stable since the 1980s, with the top 1 percent owning slightly
less than 20 percent of total wealth, a level of wealth inequality that is very low by
historical and international standards.21 In contrast, according to SCF data, U.S. wealth
concentration is pretty high, with the top 1 percent capturing XX DITTO: SEE
DIRECTLY ABOVE XX 36 percent of total wealth and has been growing since the late
1980s.22
Piketty created a series for U.S. wealth concentration, patching together these two
disparate sources (unfortunately, the only ones available then), trusting the estate tax data
estimates for the pre-1980 period and using SCF data since the 1980s.23 This led to the
Financial Times controversy as the rise in U.S. wealth concentration is partly the artifact of
the change in sources.24 Earlier on, the famous “Top Heavy: The Increasing Inequality of
Wealth in America and What Can be Done About It,” by Edward Wolff, had similarly
combined estate tax data and SCF data and hence also obtained an increasing level of U.S.
wealth concentration.25 The deeper issue here is that the United States does not produce
systematic administrative wealth data, which is a glaring gap given the enormous public
interest in this issue. An urgent task is to improve U.S. wealth statistics. This requires both
more research exploiting alternative sources and improving administrative U.S. wealth data
collection.
8
On the research front and after the publication of Piketty’s book, Saez and Zucman
used systematic capital income data, which is very well measured in individual tax data, to
infer wealth from capital income (using the so-called capitalization method).26 They find a
very large increase in wealth inequality since the late 1970s, with the top 1 percent wealth
share growing from 23 percent in 1978 to 42 percent in 2012. The increase since 1989 is
even stronger than the one found in the SCF. This means these new estimates are fairly
close to the patched estate-SCF earlier estimates by Wolff and Piketty in their respective
books.27 If anything, the resulting picture from the estimates by Saez and Zucman is an
even stronger increase in wealth inequality than the one proposed by Piketty.28
In light of these discrepancies across estimates and the real possibility that U.S.
wealth inequality is actually exploding, it is important to make progress on U.S. wealth
data collection to settle the debate. First, it should be possible to mobilize the richness of
existing tax data (particularly the internal tax data available only within the U.S. tax
administration agencies that is now being used by external researchers with special
agreements) to further improve the wealth estimates of Saez and Zucman.29 Individual
addresses in the internal tax data, for example, can be combined with third party data on
real estate prices (such as Zillow) to estimate precisely the value of real estate of
homeowners. Similarly, pension wealth can be estimated more precisely using Individual
Retirement Account (IRA) balances (systematically reported to the IRS) along with
longitudinal information on past pension contributions (such as 401(k) contributions).
Second, enhanced information reporting could greatly improve the quality of U.S.
wealth data. The most important step would be for financial institutions to report year-end
wealth balances on the information returns they currently send to the IRS to report capital
income payments. This requirement could be extended to student loans. Information
returns on interest and dividend payments could report outstanding account balances as
well. The existing universal balance reporting requirement of IRAs could be extended to
all defined-contribution plans such as 401(k)s. The cost of collecting all this extra
information would be modest because the information is already generated by financial
institutions to manage the accounts of their clients. In many cases, additional reporting
could help better enforce existing taxes, and so would not necessarily require congressional
action.
9
This discussion shows that government policy, research on inequality, and public
awareness of the issue all go hand-in-hand. Without government policy—particularly tax
policy—there is no systematic way to measure income inequality particularly at the top of
the distribution. Indeed, virtually all the top income share series discussed in Piketty’s
book start precisely when each country first implements a progressive individual income
tax. Before that time, it was virtually impossible to measure income concentration
accurately. Income inequality statistics using systematic administrative data can, in turn,
powerfully shape public awareness of inequality, as Piketty’s book has so eloquently
shown. Naturally, even without systematic statistics, inequality looms large in society as
reflected in political debates, or literature. Piketty famously discusses representations of
inequality and class in Balzac and Jane Austen’s novels. Modern statistics help cast light
on the issue but are not sufficient by any means to dispel all misconceptions on the issue.
Understanding Inequality Dynamics: Is Inequality Fair?
Piketty’s book not only presents inequality statistics but also provides a framework for
understanding the dynamics of inequality. This is important because not all inequalities are
made equal. Some inequalities are perceived as fair. Almost everybody agrees it is fair that
a hard working person should earn and consume more than somebody with equal skills but
who prefers to work less and enjoy leisure. Other forms of inequalities are perceived as
unfair. A high income obtained from a socially unproductive endeavor (such as rent-
seeking) is seen as unfair. Many people would view an idle and rich trust funder as
undeserving of his inherited wealth. Naturally, perceptions of unfair inequality then
translate into demands for government action through the political process.
Capital Income: Inherited vs. Self-made Wealth
Wealth is quantitatively very important, on the order of 4 to 5 years of National income in
the United States in recent years and generates capital income, which is about 30 percent of
National Income (see Piketty and Zucman,30 and Saez and Zucman,31 for detailed
statistics). Wealth is also highly concentrated so that capital income plays a large role at
the top of the distribution. Wealth comes from two sources: past savings, in which case
10
wealth is self-made, and inheritances, in which case wealth in inherited. This distinction is
crucial because our modern meritocratic societies have a strong aversion toward privilege
coming out of inheritance as opposed to one’s own merit.
The central prediction of Piketty’s book is that, absent policy changes, wealth will
become more concentrated and will come mostly from inheritance, so that undeserving
inheritors will dominate the top of the distribution. To test his central prediction, it is
necessary to measure the share of inherited wealth in total wealth and its evolution. As
explained in detail in his book, Piketty and his co-authors on the underlying research have
been able to make progress on this important question in the case of France, by digitizing
historical estate tax data and using current administrative estate tax data.32
Unfortunately, research on this question for the United States is particularly weak,
in part due to lack of adequate administrative data to measure savings and inheritances
(and inter-vivos gifts). This issue generated a controversial debate between Modigliani33
and Kotlikoff and Summers.34 Modigliani argued that inherited wealth was relatively
unimportant while Kotlikoff and Summers argued that inherited wealth was very
important. Unfortunately, little progress has been made on this question in the United
States since this debate due to lack of systematic administrative data. Therefore, measuring
better the fraction of inherited wealth in the United States should be a high priority.
The internal U.S. individual tax data track population-wide individual incomes,
trusts, gifts, and large inheritances, offering a unique opportunity to provide better
estimates for the United States. The analysis would nevertheless be challenging because of
estate tax avoidance using early and undervalued gifts through trusts. U.S. internal
individual tax data also track down college attendance of children and college tuition
effectively paid by parents. This is an important complementary data source as college
tuition has almost certainly become a very important fraction of the transfers made by
parents to adult children.35
To measure self-made wealth accurately, it is necessary to measure precisely
savings. Unfortunately, this is another critical area where measurement is poor, particularly
in the United States. Savings data in the United States at the micro-level are very limited.
Only the Consumer Expenditure Survey (CEX) has direct micro-level information on both
income and consumption that is necessary to estimate savings. The CEX does not capture
11
the top of the income distribution well, which is an issue as savings are also highly
concentrated. Therefore, even the most basic fact that the savings rate (defined as the ratio
of savings to income) increases with income or wealth is actually difficult to establish with
precision in the United States. The best attempt is Dynan, Skinner, and Zeldes, who do find
savings rates sharply increasing with income.36
At the aggregate level, the Flow of funds and National Accounts provide a very
precise picture of aggregate savings and investment. Saez and Zucman construct a
synthetic savings rate by wealth groups—defined as the savings rate needed to explain the
dynamics of top wealth shares given the dynamics of income in top wealth groups and the
price effects on assets (both of which can be measured well).37 They also find the savings
rate sharply increasing with wealth alongside plummeting middle-class savings since the
1980s. In words, the explosion in wealth concentration they obtain is explained both by an
increase in income inequality and an increase in savings inequality. Savings inequality
magnifies initial income inequalities into potentially enormous wealth inequalities: If the
middle class does not save at all, then its share of total wealth will eventually fall to zero.
This concern about wealth inequality exploding due to savings rate inequality is an old one
and was already discussed by Kuznets.38
So in terms of data collection, it should be a priority to collect savings data
systematically. With the improvements in wealth data collection through the tax
administration proposed above, only a small extra step is needed to be able to compute
savings. If we can observe end-of-year balances of financial accounts then we only need to
observe purchases and sales of assets to compute savings. The sale of an asset already
generates an information return form for taxing realized capital gains; a purchase (or
acquisition through a gift or inheritance) of an asset could generate a similar information
return. Such information on asset purchases is now already stored by financial companies
as it is an information report requirement for administering realized capital gains taxation.
Scandinavian countries collect comprehensive wealth information across many asset
classes at the micro-level so that it is possible to compute very good micro-level savings
rates. As a result, the most innovative research on savings and wealth is being done in
Scandinavian countries (see, e.g., Chetty et al.39).40
12
Labor Income: Fair vs. Unfair Earnings
In a number of countries, particularly the United States and the United Kingdom, labor
income inequality has also greatly increased since the 1970s. What is driving this increase
in labor income inequality? There are two broad views.
First, under the market view, labor is a standard good traded competitively on the
labor market. In that case, pay is determined by the supply and demand for various labor
skills, and reflects marginal productivity. Technological progress, for example, can drive
up the demand for college-educated labor, leading to a higher wage premium for educated
workers. Conversely, a rise in the supply of college graduates can depress the wage
premium for educated workers. Under the market view, pay reflects productivity. In this
scenario, pay inequality can be seen as reflecting differences in productivity and hence
consistent with meritocratic ideals of fairness.
Second, under the institutions view, labor is not a standard good. Instead pay
determination is the outcome of a bargaining process that can be affected by a number of
institutions, among them labor market regulations, unions, tax and transfer policies, and
more generally social norms regarding pay inequality. As a result, pay can depart
significantly from productivity. In this scenario, if compensation is due in part to
bargaining power, gains for some groups (such as top management) can come at the
expense of others (such as regular workers). As a result, nothing guarantees that pay
inequality resulting in part from bargaining power is always fair.
How can economic research cast light on which scenario is the most relevant in
practice, and in particular at the top of the income distribution?
At the top of the distribution, Piketty and Saez show that a significant fraction of
the surge in top income shares is due to large increases in wages and salaries as well as
business income (partnership profits or closely held S-corporation profits).41 Bakija, Cole,
and Heim using internal tax data show that fact that executives, managers, supervisors, and
financial professionals account for about two thirds of the increase in income going to the
top 0.1 percent of the income distribution from 1979 to 2005.42
The surge in wages and salaries is due to the rise in executive compensation that
has been extensively discussed in the corporate governance literature. The key issue is
whether this surge in executive compensation reflects increased value of top talent as in the
13
market view scenario (see Gabaix and Landier43) or whether it reflects the ability of
executives to extract more pay as in the institution view scenario (Bertrand and
Mullainathan44 or Bebchuk and Fried45).
Much less, however, is known about the surge in top business income that is
quantitatively even larger than wage and salary income at the top of the U.S. income
distribution.46 A number of large and highly profitable closely held businesses are
organized as partnerships or S-corporations. Limited Liability Corporations (LLCs) can be
organized as partnerships as well. Such businesses can sometimes be large and very
profitable but typically have a small number of owners and hence can generate large profits
for each owner. Traditionally, doctors and lawyers are organized as partnerships. In
finance, hedge funds or private equity firms are generally organized partnerships as well.
Most start-up firms are also typically LLCs before they become publicly traded (or are
acquired by other larger companies). Some of them might be quite large, for instance Uber
today or Facebook before its Initial Public Offering).
Whether such business profits are fair depends on the nature of the business as well
as the regulatory environment. On the one hand, almost everybody agrees that hedge funds
specializing in high-frequency trading do not add value but instead skim off gains at the
expense of other slower traders. On the other hand, there is agreement that high-tech
businesses which invent a new product that becomes widely used (such as the smart phone,
the internet search engine, or a better way to provide existing services such as Uber for
taxis or rbnb for housing rentals), add real value to the economy. Yet, many high-tech
businesses that succeed by developing a new product, end up earning quasi-monopoly
rents. In principle, monopoly rents should attract competitors. Many of the most successful
high-tech firms, such as Microsoft, Google, and Facebook have become natural
monopolies through network effects. Facebook, for example, is valuable precisely because
its enormous and unparalleled customer base gives it a decisive advantage against new
entrants. Monopoly rents can also be protected by excessively long patent rights.
Obviously, monopolies have very strong incentives to lobby government to entrench their
position. As is well known, the fortunes of the Gilded Age often originated from monopoly
positions in railways or oil production.
14
It would naturally be very valuable to know more about the industrial composition
of business income at the top of the U.S. income distribution to see whether it is dominated
by information technology business profits, or financial firms in the form of S-
Corporations or LLCs, or bio/medical research practices, or classical law firms. In
principle by merging individual tax data with business tax data, it would be possible to
trace the industrial composition of top business income and whether such profits come
from quasi-monopoly situations, patents, or closely held businesses. Such information is
central to enlighten the debate on the proper regulations or proper taxation of business
profits at the top.
Policy Remedies: What Should Be Done about Inequality?
The issue of fairness and inequality that we discussed above naturally leads to the next
question: How should unfair inequality be addressed by society?
An important lesson coming from Piketty’s book is that government policy has
played a key role in shaping inequality in the historical record. It is a striking finding that
before World War I, pretty much all Western countries had small governments (typically
raising 10 percent or less of national income in taxes) and very high levels of income and
wealth concentration. By the 1970s, the size of government has increased dramatically to
about one-third to one-half of national income in almost all advanced economies:
Economically advanced societies decided to share a much larger fraction of their income to
fund a welfare state providing public education, public retirement and disability benefits,
public health insurance, as well as a number of smaller income protection programs such
as means-tested welfare and unemployment insurance.
This new and large welfare state was funded by taxation through the development
of both broad and relatively flat taxes such as social security contributions and value added
taxes but also progressive taxes such as progressive individual income taxes, corporate
taxes falling primarily on capital, and progressive inheritance taxes. Interestingly, the
United States and the United Kingdom were the countries that implemented the most
extreme progressive tax system with extremely high top tax rates on individual income and
inheritances.47 As the size of government (measured by taxes and spending) grew, there
15
have also been drastic changes in regulation policies, which include antitrust policies,
financial regulation, consumer protection, and a vast array of labor and union regulations.
The net effect of the large welfare state, progressive taxes, and progressive
regulations has been a dramatic lowering of income and wealth concentration in almost all
advanced economies from the early 20th century to the post-World War II decades.
Importantly, countries experienced drastic reductions in inequality both pre-tax and after
taxes and transfers.
In recent decades, however, we have seen a comeback of inequality in some (but
not all countries). Increases in inequality have been the largest in the United States and the
United Kingdom, where the Reagan and Thatcher revolutions led to the sharpest policy
reversals, particularly for progressive taxation, financial regulation, and labor regulations.
The fact that the comeback in inequality happens in some (but not all) countries and that it
is highly correlated with policy reversals strongly suggests that policy plays a key role. A
pure technological/globalization driven phenomenon would have affected all advanced
economies similarly. Atkinson discusses these issues and makes bold policy proposals
along many dimensions to curb inequality in the United Kingdom.48
There is a large body of work studying separately these various policy aspects but
we do not yet have a good comprehensive picture on how each element of the policy
toolbox affects inequality and growth.
Remedies for Income Inequality
What does recent research say about the role of policy in shaping income
concentration? Piketty, Saez, and Stantcheva show that the top 1 percent income share is
highly correlated across countries and over time with top individual income tax rate with
no visible effects on growth.49 Countries that experienced the largest reductions in the top
marginal tax rates since the 1960s, among them the United States and the United Kingdom,
are also the countries that experienced the largest increases in top income shares. Yet there
is no compelling evidence that the countries which lowered their top marginal tax rates the
most and experienced large increases in income concentration, had a better growth
experience since the 1960s. This suggests that high-income earners respond to lower top
16
tax rates not by increasing productive work effort as posited by the standard supply-side
story but rather by finding ways to extract a larger share of the economic pie at the expense
of others in the economy.
Philippon and Reshef show that the size of finance in the U.S. economy and the
relative compensation of financial workers are very highly and negatively correlated with
the level of financial regulation: finance becomes large and pays very well when
regulations are weak.50 In the historical U.S. record, the period of tight financial regulation
from 1933 to 1980 is actually associated with stronger economic growth, which shows that
reining in finance does not seem to have detrimental effects on economic growth.
In the case of executive compensation, however, it seems that regulations on pay
transparency and pay for performance have largely failed or been actually
counterproductive. The 1993 U.S. tax law that limited to $1 million the deductibility of
executive compensation (for corporate tax purposes) unless it was performance-related
seems to have actually fueled the explosion of stock-option compensation. Stock options,
which tie compensation to the stock value of the company, are a very blunt tool for
compensation as stock prices fluctuate for many reasons unrelated to the performance of
executives. Hence, it is probably a very inefficient tool for compensation. Its success is
likely due to the appearance of being performance-related and the fact that it is not as
transparent and visible a form of compensation as regular salary (see Hall and Murphy).51
While there is a large literature in industrial organization on antitrust and patent
regulations and its effects on abnormal profits and monopoly rents, this literature has not
been connected to the analysis of inequality. Are such profits coming out of quasi-
monopoly rents, thus fueling the increase in income and wealth concentration? If yes, then
antitrust and patent regulation policy should not only take into account the classical
efficiency effects but also the effects on inequality.
It would be particularly valuable to see more work analyzing specifically the
relative advantages of regulations vs. taxes and transfers to address inequality issues.
Remedies for Wealth Inequality
How could wealth disparity be reduced without hurting aggregate savings and capital
accumulation that is a key element of long-run economic growth? As famously proposed in
17
Piketty’s book, a progressive wealth tax seems like the most direct instrument to curb the
accumulation of large fortunes. The advantage of the progressive wealth tax (as opposed to
the progressive income tax) is that it targets specifically accumulated wealth rather than
current income. In principle, if the concern is about inherited wealth then inheritance
taxation would be the best tool to prevent self-made fortunes from becoming inherited
wealth.52 In practice, however, inheritance taxation can be avoided through tax planning
and undervaluation of gifts and transfers before death. It would be much more difficult to
avoid an annual wealth tax where wealth is evaluated every year.
But because U.S. savings are very concentrated among top wealth holders, there is
a concern that reducing top wealth through progressive wealth or inheritance taxation
might negatively impact aggregate savings and hence capital accumulation. As we have
seen, saving rates for the U.S. middle class have plummeted since the 1980s. So in order to
maintain aggregate savings, it is important to pair progressive taxation with encouragement
for savings for the broad middle class.
Which policies are best to encourage middle-class saving depends on the reasons
for the observed drop in the middle-class saving rate. Middle-class saving might have
plummeted because of the lackluster growth in middle-class incomes relative to top
incomes, fueling demand for credit to maintain relative consumption (see Bertrand and
Morse).53 In that case, policies to boost middle-class incomes would probably boost saving
as well. Financial deregulation may have expanded borrowing opportunities (through
consumer credit, mortgage refinancing, home equity loans, subprime mortgages) and in
some cases might have left consumers insufficiently protected against some forms of
predatory lending. In this case, greater consumer protection and financial regulation could
help increasing middle-class saving.
Another factor that may be inhibiting middle-class savings are college tuition
increases, which may have increased student loans. This means publicly funded higher
education and limits on university tuition fees may have a role to play. Recent work in
behavioral economics shows that individual savings decisions respond much more to
frames and nudges (such as default option in 401(k) employer pension plans) than to tax
subsidies (see Chetty et al.).54 Therefore, the new and growing body of work in behavioral
18
finance (see Thaler and Sunstein) could be used to develop ways to promote middle-class
savings and reduce wealth inequality in the longer-run.55
Endnotes
1 Thomas Piketty and Emmanuel Saez, “Income Inequality in the United States, 1913–1998,” Quarterly Journal of Economics 118 no. 1 (2001): 1–39. Series updated to 2014 in June 2015. 2 Thomas Piketty, High incomes in France in the 20th Century (Grasset, 2001). 3 Simon Kuznets, Shares of Upper Income Groups in Income and Savings (New York: National Bureau of Economic Research, 1953). 5 Simon Kuznets, “Economic Growth and Economic Inequality,” American Economic Review, 45 (1955): 1–28). 6 See Thomas Piketty and Emmanuel Saez, “Top Incomes in the Long Run of History,” Journal of Economic Literature 49 (2011): 3–71 for a survey of this body of work. The data are online at http://www.wid.world/. 7 Thomas Piketty, Capital in the 21st Century (Cambridge, MA: Harvard University Press, 2014). 8 Simon Kuznets, National Income and Its Composition, 1919–1938 (New York: National Bureau of Economic Research, 1941); Kuznets, Shares of Upper Income Groups. 9 The Luxembourg Income Study (LIS) project has made an admirable effort at creating harmonized international micro data using existing micro survey data across countries (see http://www.lisdatacenter.org/). The LIS data are very useful but cannot capture well the top of the distribution. 10 The latest version of the System of National Accounts is the SNA 2008 (see System of National Accounts 2008 (European Communities, International Monetary Fund, Organisation for Economic Co-operation and Development, United Nations, and World Bank, 2009)). The United States National Income and Product Accounts has still not incorporated all the SNA 2008 guidelines but is slowly moving in this direction. 11 Facundo Alvaredo, Anthony B. Atkinson, Thomas Piketty, Emmanuel Saez, and Gabriel Zucman, “Distributional National Accounts (DINA) Guidelines: Concepts and Methods used in the W2ID,” Working Paper (2016).
19
12 Thomas Piketty, Emmanuel Saez, and Gabriel Zucman, "Distributional National Accounts: Methods and Estimates for the U.S. 1913–2014," Paris School of Economics and UC Berkeley (2016). 13 Bertrand Garbinti, Jonathan Goupille, Thomas Piketty, "Distributional National Accounts: Methods and Estimates for France 1970–2013," Paris School of Economics (2016). 14 Facundo Alvaredo et al., "Distributional National Accounts: Methods and Estimates for the UK," Paris School of Economics and Oxford (2016). 15 Dennis Fixler and David S. Johnson, “Accounting for the Distribution of Income in the US National Accounts,” in Measuring Economic Stability and Progress, eds. D. Jorgenson, J. S. Landefeld, and P. Schreyer (University of Chicago Press, 2014). 16 Dennis Fixler, David Johnson, Andrew Craig, and Kevin Furlong, “A Consistent Data Series to Evaluate Growth and Inequality in the National Accounts,” Bureau of Economic Analysis Working Paper (2015). 17 Maryse Fesseau and M. L. Mattonetti, “Distributional Measures Across Household Groups in a National Accounts Framework: Results from an Experimental Cross-Country Exercise on Household Income, Consumption and Saving,” OECD Statistics Working Papers (2013). 18 Piketty, Saez, and Zucman, “Distributional National Accounts.” 19 The Piketty and Saez US top income series have often been criticized for ignoring government transfers (see, e.g., Berkhauser, Larrimore, and Simon, “A Second Opinion on the Economic Health of the American Middle Class and Why it Matters in Gauging the Impact of Government Policy,” National Tax Journal 65 (2012): 7–32). In reality, both the pre-tax and post-tax distributions are of great value. Distributional National Accounts is the sound conceptual way to do this thoroughly. Many official statistics on income such as those created by the Census Bureau from the Current Population Survey blur the pre-tax vs. post-tax concepts by adding some (but not all) transfers and subtracting some (but not all) taxes from their official income definition (see Carmen DeNavas-Walt and Bernadette D. Proctor, U.S. Census Bureau, Income and Poverty in the United States: 2014 (Washington, D.C.: U.S. Government Printing Office, 2015). 20 In addition to governments, a number of institutions such as credit bureaus and educational institutions produce administrative micro-data that can be merged to supplement government micro-data. The Scandinavian countries have the most advanced central statistical agencies able to merge datasets from many different sources for research. For a discussion on improving US administrative data access for research, see David Card, Raj Chetty, Martin Feldstein, and Emmanuel Saez, "Expanding Access to Administrative
20
Data for Research in the United States," White Paper for NSF 10-069 call for papers on “Future Research in the Social, Behavioral, and Economic Sciences” (2010). 21 Wojciech Kopczuk and Emmanuel Saez, “Top Wealth Shares in the United States, 1916–2000: Evidence from Estate Tax Returns,” National Tax Journal, 57 (2004): 445–487. 22 Arthur Kennickell, “Tossed and Turned: Wealth Dynamics of US Households 2007–2009,” Finance and Economics Discussion Series Working Paper, Board of Governors of the Federal Reserve System (2011); Edward Wolff, “Household Wealth Trends in the United States, 1962–2013: What Happened over the Great Recession,” NBER Working Paper (2014). 23 Piketty, Capital in the 21st Century (Cambridge: Harvard University Press, 2014). 24 Chris Giles, “Data problems with Capital in the 21st Century,” Financial Times, May 23, 2014. 25 Edward Wolff, Top Heavy: A Study of Increasing Inequality of Wealth in America (New York: The New Press, 2002). 26 Emmanuel Saez and Gabriel Zucman, “Wealth Inequality in the United States since 1913: Evidence from Capitalized Income Tax Data,” NBER Working Paper No. 20625 (2014). 27 Wolff, Top Heavy. 28 Saez and Zucman, “Wealth Inequality in the United States since 1913.” 29 Ibid. 30 Thomas Piketty and Gabriel Zucman, “Capital is Back: Wealth-Income Ratios in Rich Countries, 1700–2010,” Quarterly Journal of Economics 129 (2014): 1255–1310. 31 Saez and Zucman, “Wealth Inequality in the United States since 1913.” 32 Thomas Piketty, Gilles Postel-Vinay, and Jean-Laurent Rosenthal, “Inherited Versus Self-Made Wealth: Theory and Evidence from a Rentier Society (1872–1927),” Explorations in Economic History 51 (2013): 21–40; Thomas Piketty and Gabriel Zucman, “Wealth and Inheritance in the Long Run,” in Handbook of Income Distribution (Vol. 2), eds. A. Atkinson and F. Bourguignon (Elsevier, 2014): 167–216. 33 Franco Modigliani, “The Role of Intergenerational Transfers and Lifecycle Savings in the Accumulation of Wealth,” Journal of Economic Perspectives 2 (1988): 15–40.
21
34 Lawrence Kotlikoff and Lawrence Summers, “The Role of Intergenerational Transfers in Aggregate Capital Accumulation,” Journal of Political Economy 89 (1981): 706–732. 35 Chetty et al. use this comprehensive data to document, college by college, the distributions of parental income and the earnings of students later in life (see Chetty, Raj, John N. Friedman, Emmanuel Saez, Nicholas Turner, and Danny Yagan (2016), "The Distribution of Student and Parent Income Across Colleges in the United States", working paper.). Their results show that elite schools serve disproportionately high income families, suggesting that higher education plays a large role in the transmission of economic privilege in the United States. 36 Karen Dynan, Jonathan Skinner, and Stephen Zeldes, “Do the Rich Save More?” Journal of Political Economy 112 (2004): 397–443. 37 Saez and Zucman, “Wealth Inequality in the United States since 1913.” 38 Kuznets, Shares of Upper Income Groups. 39 Raj Chetty, John Friedman, Soren Leth-Petersen, T. Nielsen, and Torre Olsen, “Active vs. Passive Decisions and Crowd-Out in Retirement Savings Accounts: Evidence from Denmark,” Quarterly Journal of Economics 129 (2014): 1141–1219. 40 Some recent research studies in the United States have started using data from financial institutions such as banks, credit card companies, or other financial service providers (see, e.g., Gelman et al., “Harnessing Naturally Occurring Data to Measure the Response of Spending to Income,” Science 345 (2014): 212–215). While these data can be valuable for many research questions on savings behavior, they are not representative samples of the US population and hence cannot be used to provide an overall picture of the US wealth and savings distributions. 41 Piketty and Saez, “Income Inequality in the United States.” 42 Jon Bakija, Adam Cole, and Bradley Heim, “Jobs and Income Growth of Top Earners and the Causes of Changing Income Inequality: Evidence from U.S. Tax Return Data,” Unpublished Working Paper (2012). 43 Xavier Gabaix and Augustin Landier, “Why Has CEO Pay Increased So Much?” Quarterly Journal of Economics 123 (2008): 49–100. 44 Marianne Bertrand and Sendhil Mullainathan, “Are CEOs Rewarded for Luck? The Ones without Principals Are,” Quarterly Journal of Economics 116 (2001): 901–32. 45 Lucian Bebchuk and Jesse Fried, Pay without Performance: The Unfulfilled Promise of Executive Compensation (Cambridge, MA: Harvard University Press, 2006).
22
46 Piketty and Saez, “Income Inequality in the United States.” 47 Thomas Piketty, Emmanuel Saez, and Stefanie Stantcheva, "Optimal Taxation of Top Labor Incomes: A Tale of Three Elasticities," American Economic Journal: Economic Policy 6 (2014): 230–271. 48 Anthony Atkinson, Inequality: What can be done? (Cambridge, MA: Harvard University Press, 2015). 49 Piketty, Saez, and Stancheva, “Optimal Taxation of Top Labor Incomes.” 50 Thomas Philippon and Ariell Reshef, “Wages and Human Capital in the U.S. Finance Industry: 1909–2006,” Quarterly Journal of Economics, 127 (2012): 1551–1609. 51 Brian Hall and Kevin Murphy, “The Trouble with Stock Options,” Journal of Economic Perspectives 17 (2003): 49–70. 52 The estate tax in the United States is not popular and was almost entirely repealed during the Bush administrations. The current US estate tax affects only about the top 1/1000 wealthiest decedents each year. However, unpopularity of the estate tax seems largely due to misinformation (and the success of conservatives in framing it as a death tax negatively affecting family businesses). Kuziemko et al. show that support for the estate tax doubles when people are informed that it is a tax on very wealthy decedents only (see Ilyana Kuziemko, Michael I. Norton, Emmanuel Saez, and Stefanie Stantcheva, “How Elastic are Preferences for Redistribution? Evidence from Randomized Survey Experiments,” American Economic Review 105 (2015): 1478–1508). 53 Marianne Bertrand and Adair Morse, “Trickle-Down Consumption,” NBER Working Paper No. 18883 (2013). 54 Chetty et al., “Active vs. Passive Decisions and Crowd-Out.” 55 Richard Thaler and Cass Sunstein, Nudge: Improving Decisions about Health, Wealth, and Happiness (New Haven: Yale University Press, 2008).