Embed Size (px)
Citation preview
Tools of Budget Analysis
131 Undergraduate Public Economics
Emmanuel Saez
UC Berkeley
1
OUTLINE
Chapter 4
4.1 Government Budgeting
4.2 Measuring the Budgetary Position of the Government: Al-
ternative Approaches
4.3 Do Current Debts and Deficits Mean Anything? A Long-
run Perspective
4.4 Why Do We Care About the Government’s Fiscal Position?
4.5 Conclusion
2
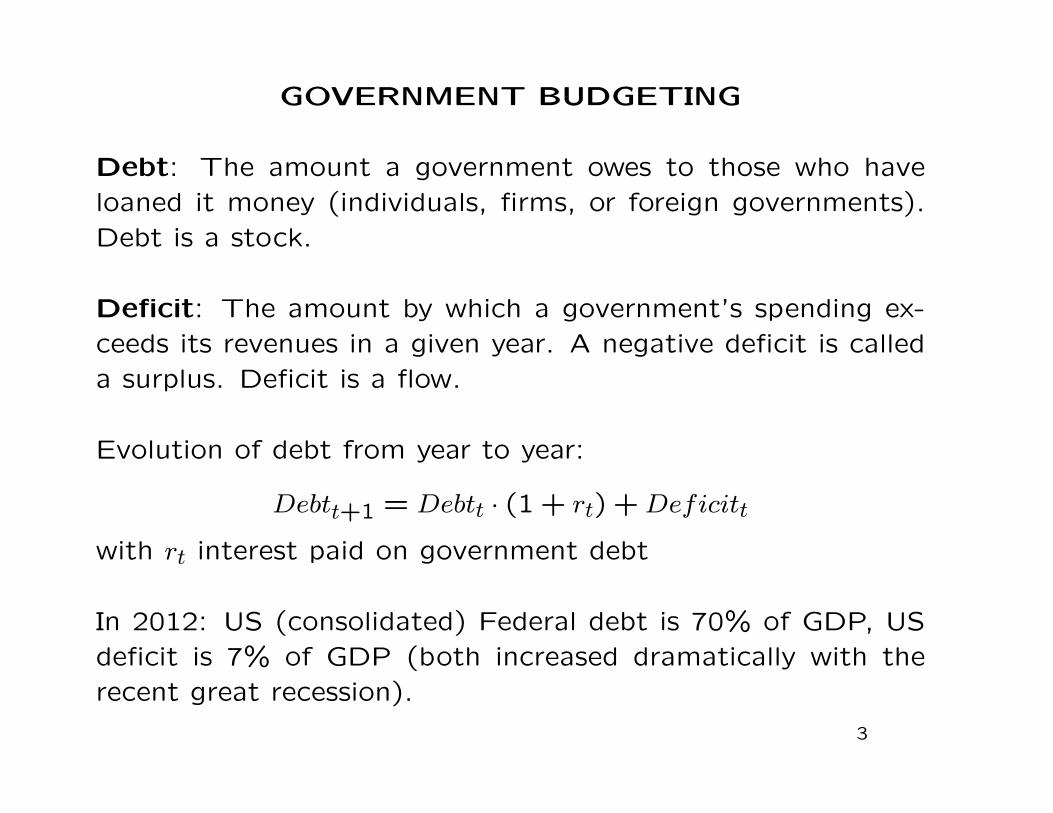
GOVERNMENT BUDGETING
Debt: The amount a government owes to those who haveloaned it money (individuals, firms, or foreign governments).Debt is a stock.
Deficit: The amount by which a government’s spending ex-ceeds its revenues in a given year. A negative deficit is calleda surplus. Deficit is a flow.
Evolution of debt from year to year:
Debtt+1 = Debtt · (1 + rt) +Deficitt
with rt interest paid on government debt
In 2012: US (consolidated) Federal debt is 70% of GDP, USdeficit is 7% of GDP (both increased dramatically with therecent great recession).
3
Public Finance and Public Policy Jonathan Gruber Third Edition Copyright © 2010 Worth Publishers 3 of 37
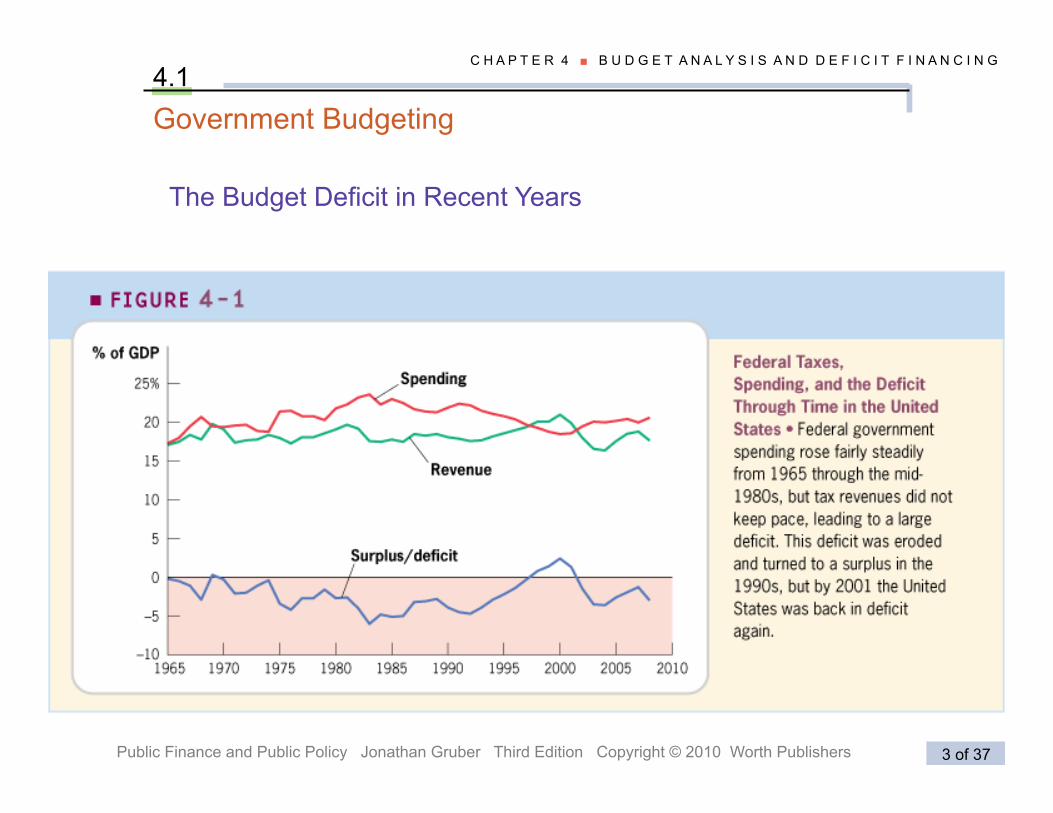
C H A P T E R 4 ■ B U D G E T A N A L Y S I S A N D D E F I C I T F I N A N C I N G
Government Budgeting
The Budget Deficit in Recent Years
4.1
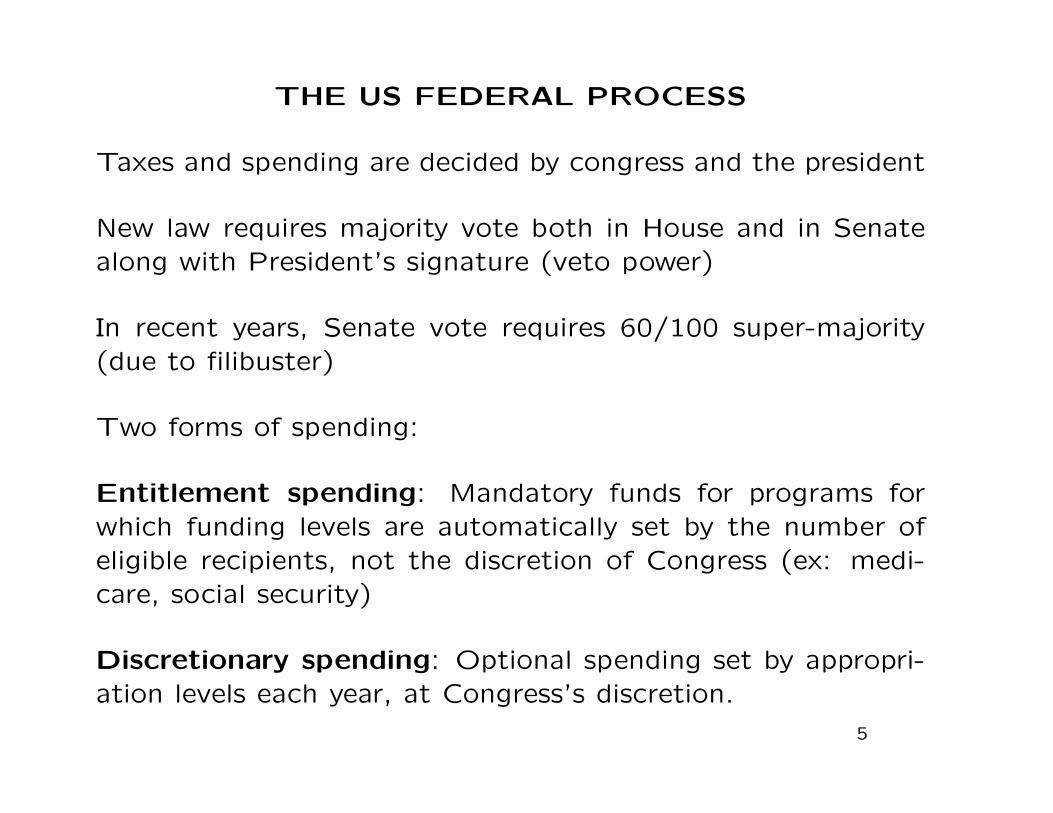
THE US FEDERAL PROCESS
Taxes and spending are decided by congress and the president
New law requires majority vote both in House and in Senatealong with President’s signature (veto power)
In recent years, Senate vote requires 60/100 super-majority(due to filibuster)
Two forms of spending:
Entitlement spending: Mandatory funds for programs forwhich funding levels are automatically set by the number ofeligible recipients, not the discretion of Congress (ex: medi-care, social security)
Discretionary spending: Optional spending set by appropri-ation levels each year, at Congress’s discretion.
5
Public Finance and Public Policy Jonathan Gruber Third Edition Copyright © 2010 Worth Publishers 5 of 37
C H A P T E R 4 ■ B U D G E T A N A L Y S I S A N D D E F I C I T F I N A N C I N G
Government Budgeting 4.1
APPLICATION �
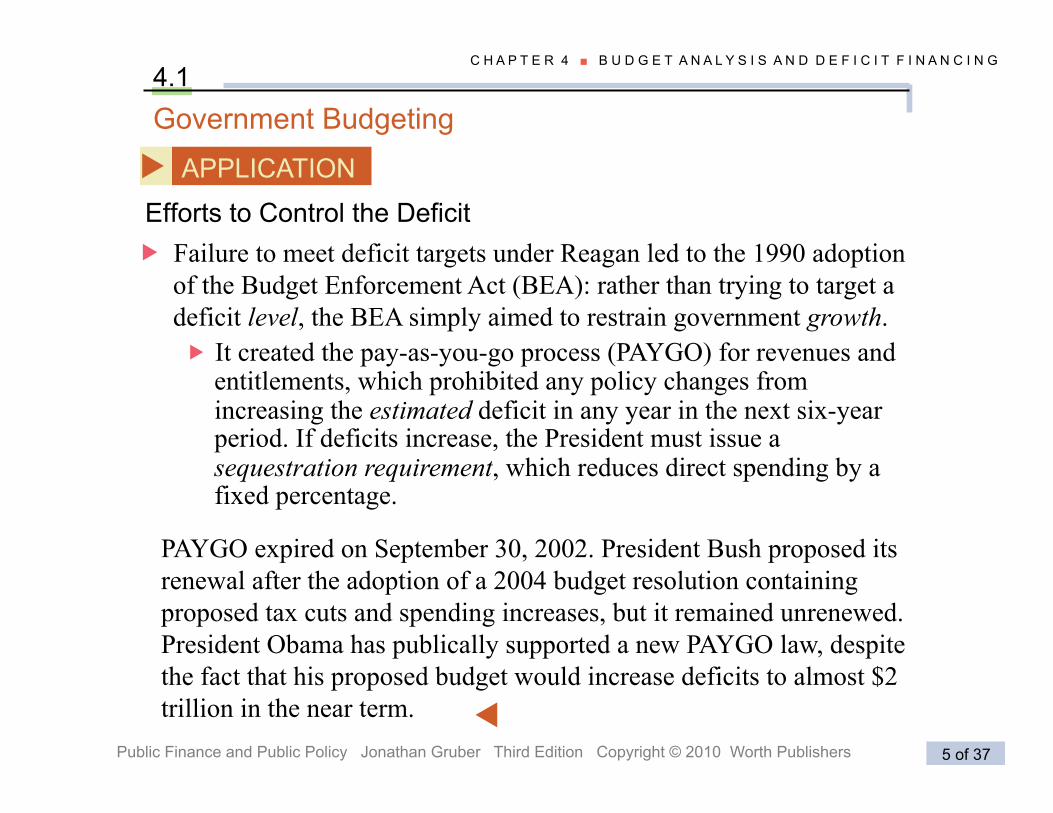
� Failure to meet deficit targets under Reagan led to the 1990 adoption of the Budget Enforcement Act (BEA): rather than trying to target a deficit level, the BEA simply aimed to restrain government growth. � It created the pay-as-you-go process (PAYGO) for revenues and
entitlements, which prohibited any policy changes from increasing the estimated deficit in any year in the next six-year period. If deficits increase, the President must issue a sequestration requirement, which reduces direct spending by a fixed percentage.
PAYGO expired on September 30, 2002. President Bush proposed its renewal after the adoption of a 2004 budget resolution containing proposed tax cuts and spending increases, but it remained unrenewed. President Obama has publically supported a new PAYGO law, despite the fact that his proposed budget would increase deficits to almost $2 trillion in the near term.
Efforts to Control the Deficit
�
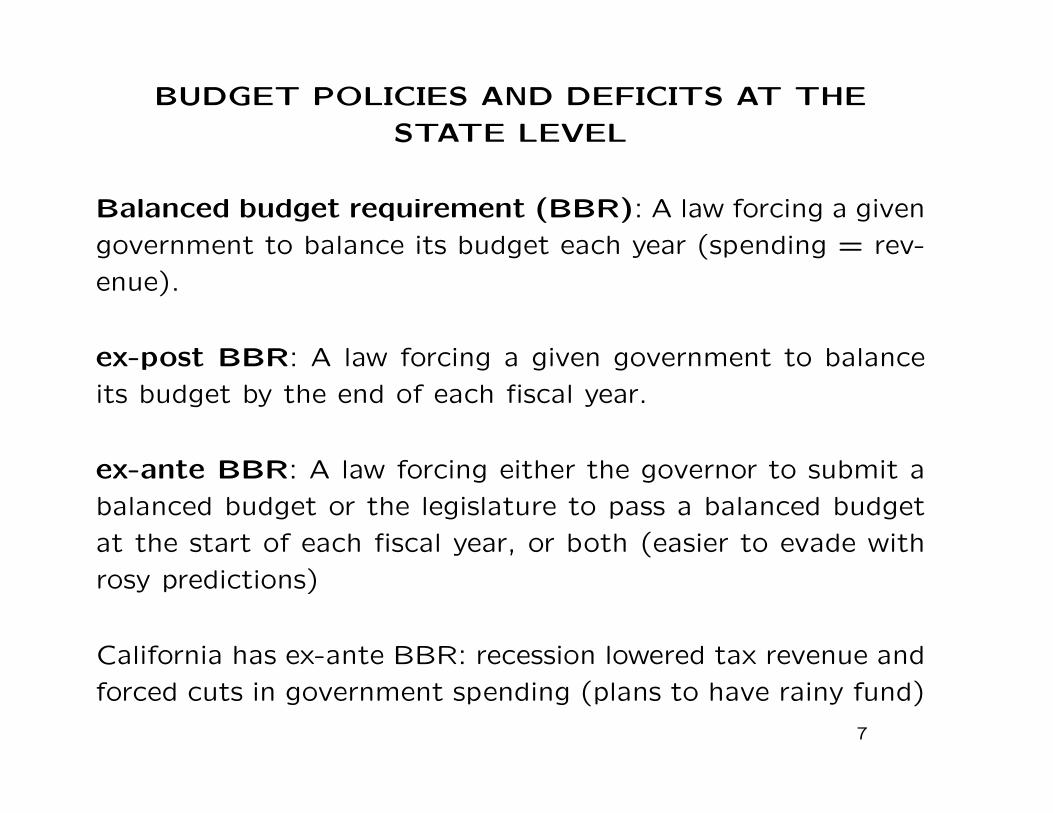
BUDGET POLICIES AND DEFICITS AT THE
STATE LEVEL
Balanced budget requirement (BBR): A law forcing a given
government to balance its budget each year (spending = rev-
enue).
ex-post BBR: A law forcing a given government to balance
its budget by the end of each fiscal year.
ex-ante BBR: A law forcing either the governor to submit a
balanced budget or the legislature to pass a balanced budget
at the start of each fiscal year, or both (easier to evade with
rosy predictions)
California has ex-ante BBR: recession lowered tax revenue and
forced cuts in government spending (plans to have rainy fund)
7
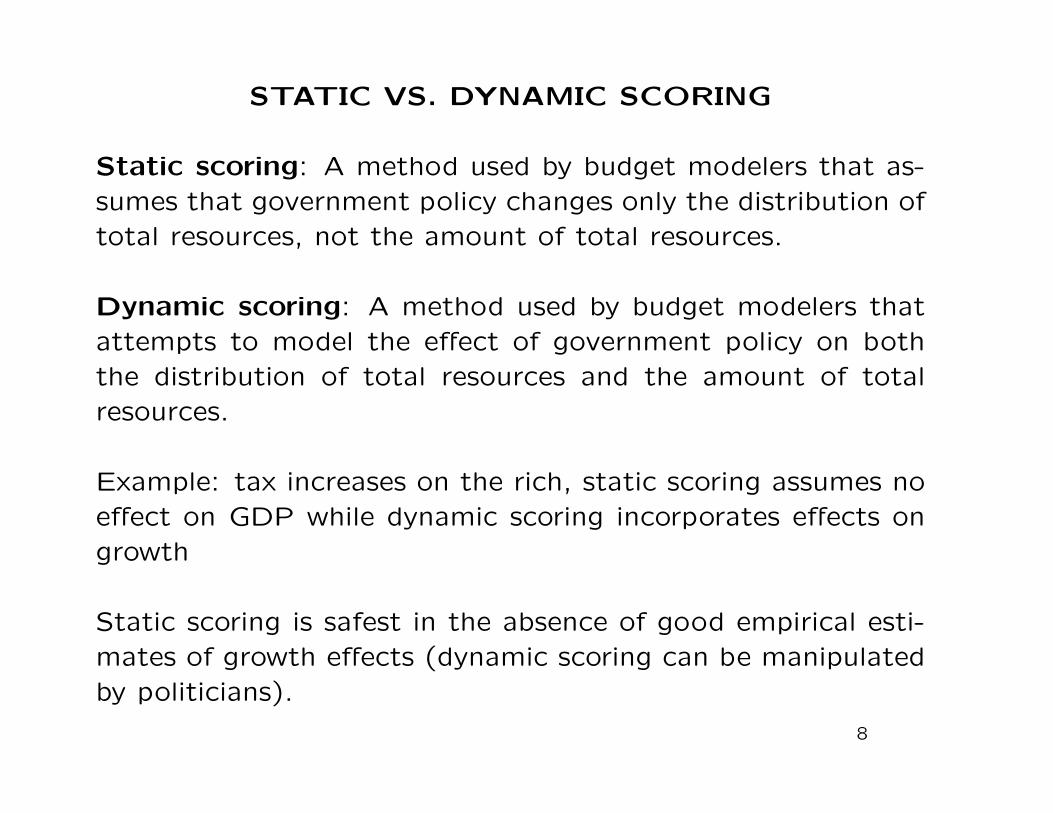
STATIC VS. DYNAMIC SCORING
Static scoring: A method used by budget modelers that as-sumes that government policy changes only the distribution oftotal resources, not the amount of total resources.
Dynamic scoring: A method used by budget modelers thatattempts to model the effect of government policy on boththe distribution of total resources and the amount of totalresources.
Example: tax increases on the rich, static scoring assumes noeffect on GDP while dynamic scoring incorporates effects ongrowth
Static scoring is safest in the absence of good empirical esti-mates of growth effects (dynamic scoring can be manipulatedby politicians).
8
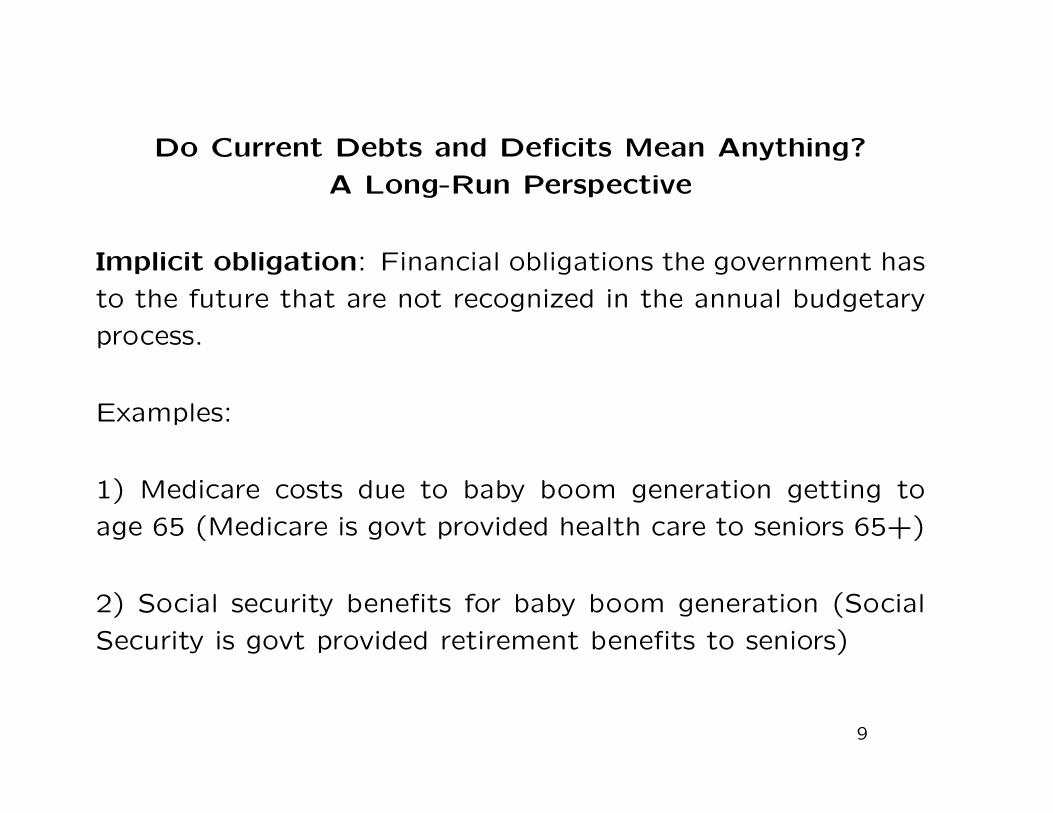
Do Current Debts and Deficits Mean Anything?
A Long-Run Perspective
Implicit obligation: Financial obligations the government has
to the future that are not recognized in the annual budgetary
process.
Examples:
1) Medicare costs due to baby boom generation getting to
age 65 (Medicare is govt provided health care to seniors 65+)
2) Social security benefits for baby boom generation (Social
Security is govt provided retirement benefits to seniors)
9
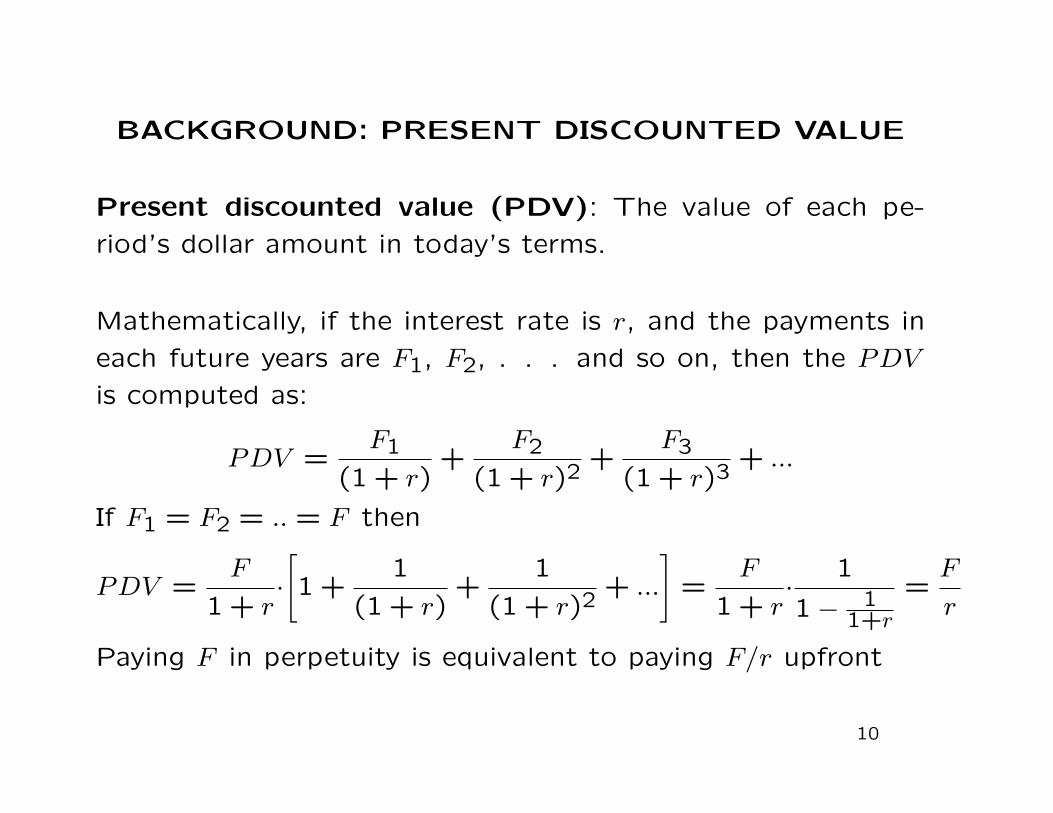
BACKGROUND: PRESENT DISCOUNTED VALUE
Present discounted value (PDV): The value of each pe-
riod’s dollar amount in today’s terms.
Mathematically, if the interest rate is r, and the payments in
each future years are F1, F2, . . . and so on, then the PDV
is computed as:
PDV =F1
(1 + r)+
F2
(1 + r)2+
F3
(1 + r)3+ ...
If F1 = F2 = .. = F then
PDV =F
1 + r·[1 +
1
(1 + r)+
1
(1 + r)2+ ...
]=
F
1 + r·
1
1− 11+r
=F
r
Paying F in perpetuity is equivalent to paying F/r upfront
10
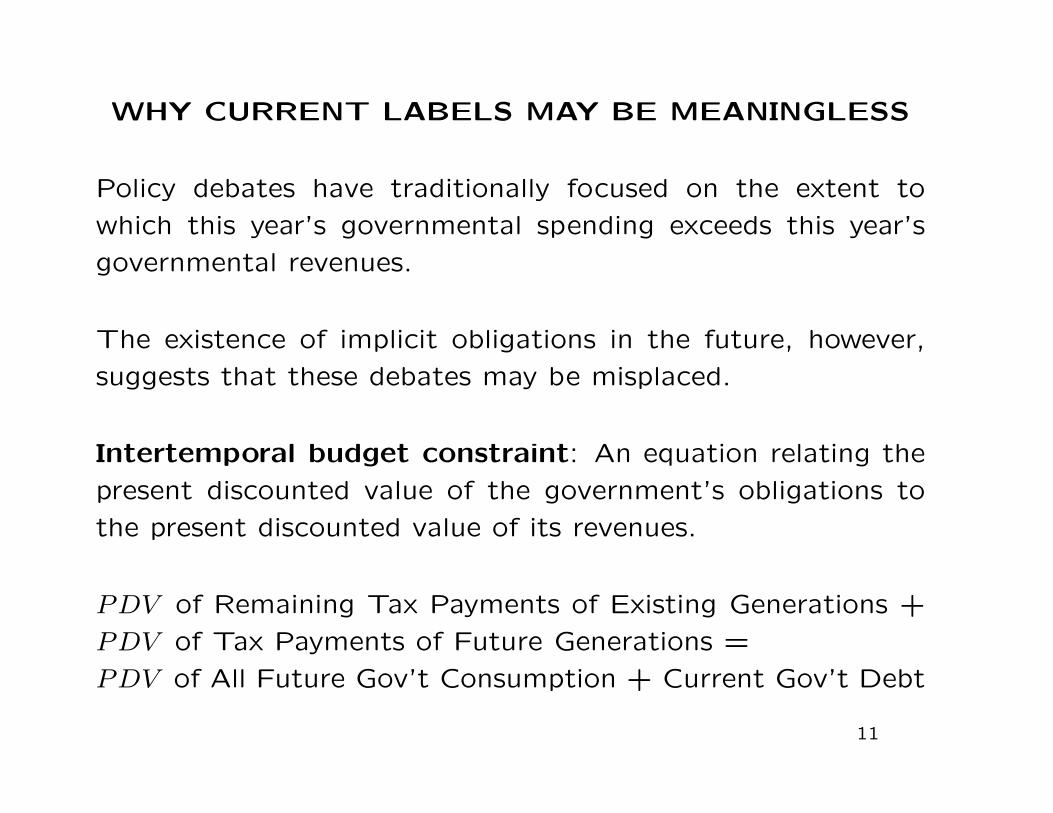
WHY CURRENT LABELS MAY BE MEANINGLESS
Policy debates have traditionally focused on the extent to
which this year’s governmental spending exceeds this year’s
governmental revenues.
The existence of implicit obligations in the future, however,
suggests that these debates may be misplaced.
Intertemporal budget constraint: An equation relating the
present discounted value of the government’s obligations to
the present discounted value of its revenues.
PDV of Remaining Tax Payments of Existing Generations +
PDV of Tax Payments of Future Generations =
PDV of All Future Gov’t Consumption + Current Gov’t Debt
11
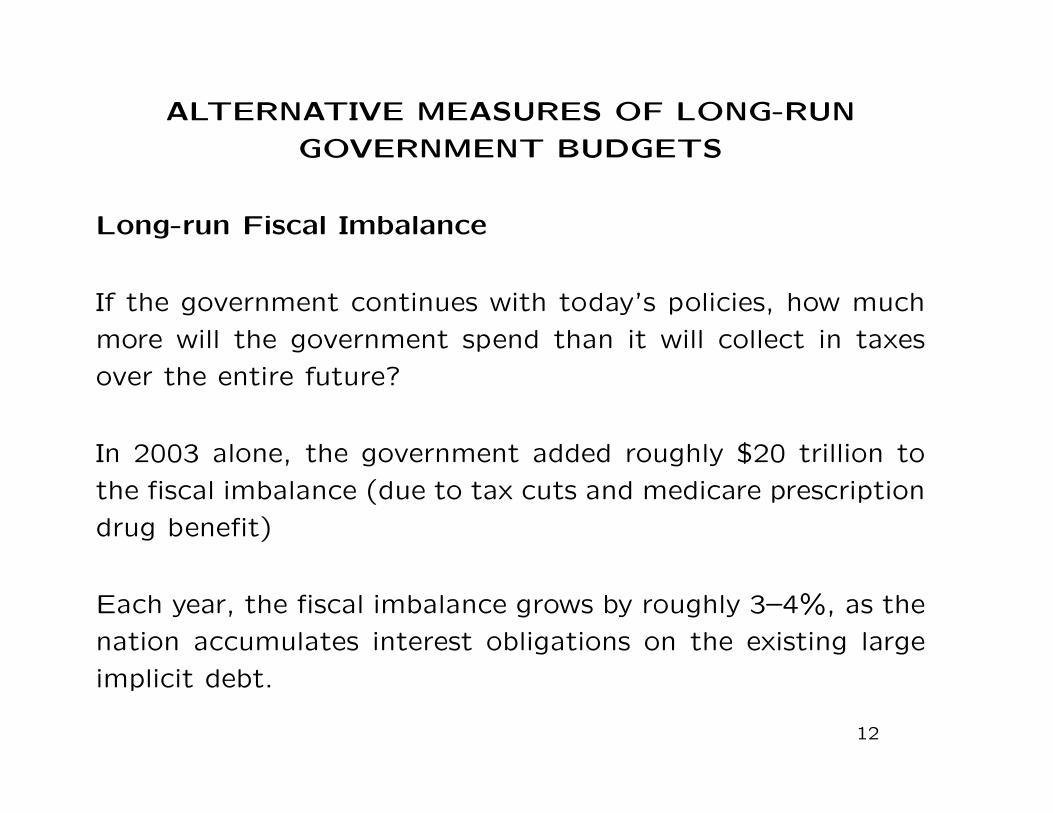
ALTERNATIVE MEASURES OF LONG-RUN
GOVERNMENT BUDGETS
Long-run Fiscal Imbalance
If the government continues with today’s policies, how much
more will the government spend than it will collect in taxes
over the entire future?
In 2003 alone, the government added roughly $20 trillion to
the fiscal imbalance (due to tax cuts and medicare prescription
drug benefit)
Each year, the fiscal imbalance grows by roughly 3–4%, as the
nation accumulates interest obligations on the existing large
implicit debt.
12
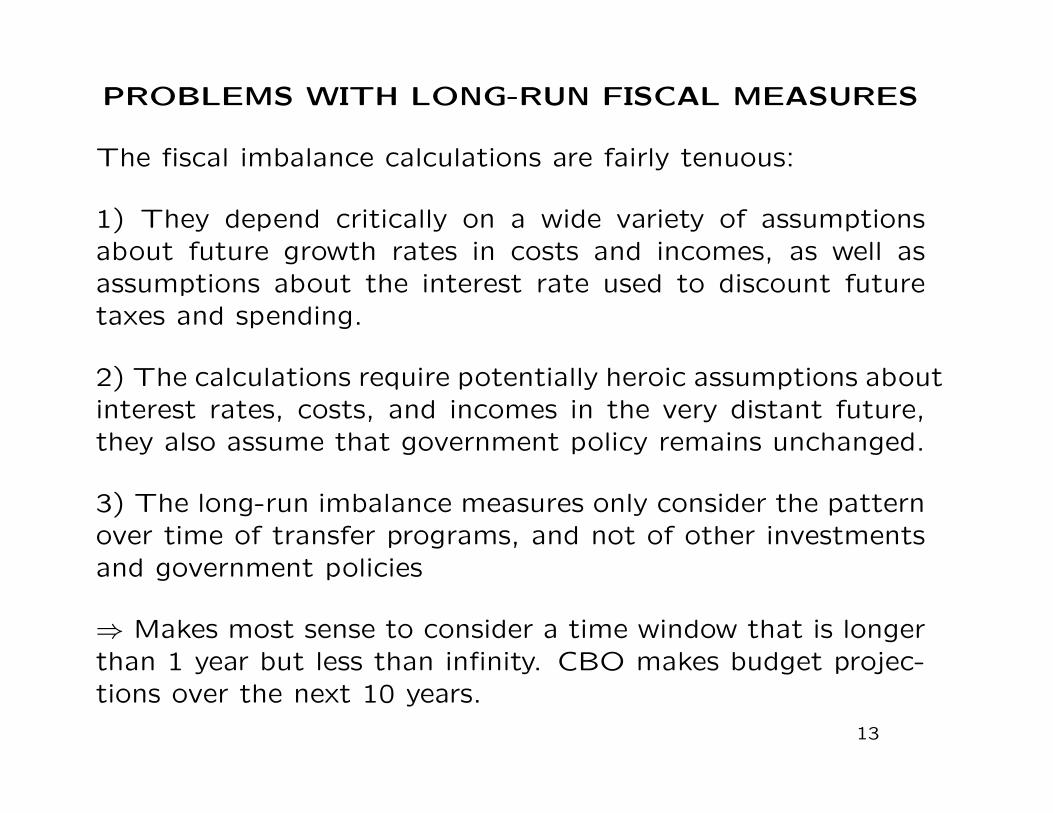
PROBLEMS WITH LONG-RUN FISCAL MEASURES
The fiscal imbalance calculations are fairly tenuous:
1) They depend critically on a wide variety of assumptionsabout future growth rates in costs and incomes, as well asassumptions about the interest rate used to discount futuretaxes and spending.
2) The calculations require potentially heroic assumptions aboutinterest rates, costs, and incomes in the very distant future,they also assume that government policy remains unchanged.
3) The long-run imbalance measures only consider the patternover time of transfer programs, and not of other investmentsand government policies
⇒ Makes most sense to consider a time window that is longerthan 1 year but less than infinity. CBO makes budget projec-tions over the next 10 years.
13
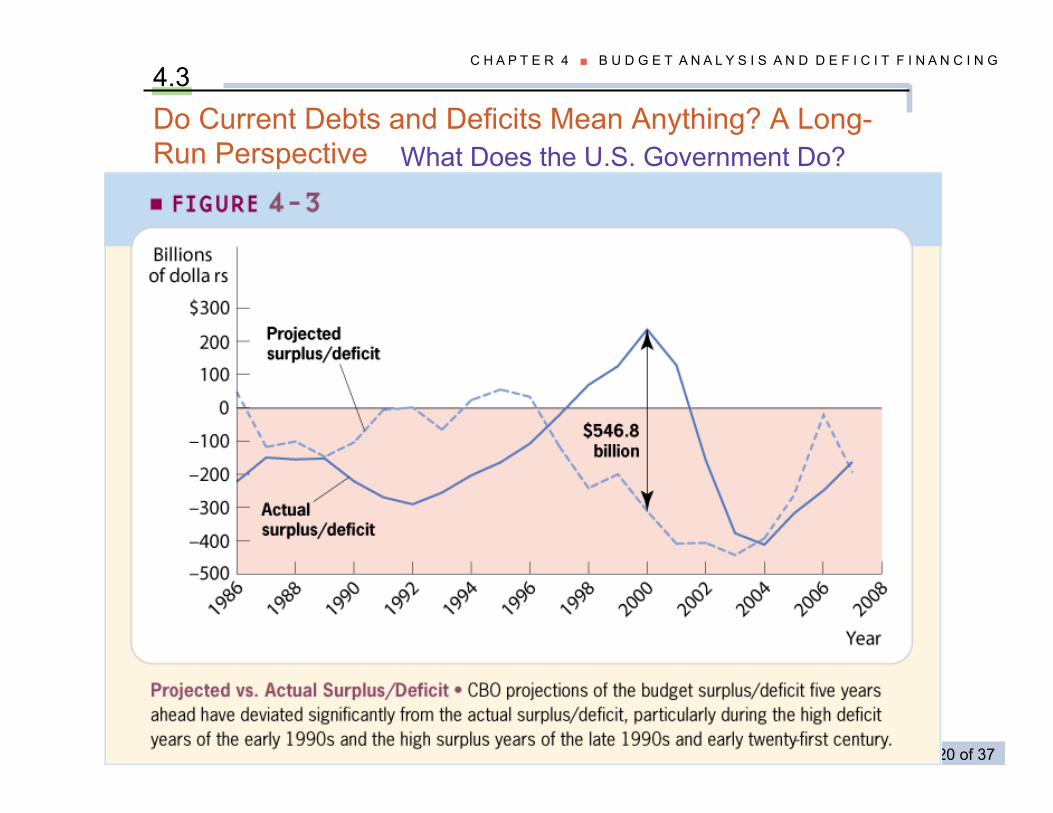
Public Finance and Public Policy Jonathan Gruber Third Edition Copyright © 2010 Worth Publishers 20 of 37
C H A P T E R 4 ■ B U D G E T A N A L Y S I S A N D D E F I C I T F I N A N C I N G 4.3 Do Current Debts and Deficits Mean Anything? A Long-Run Perspective What Does the U.S. Government Do?
Public Finance and Public Policy Jonathan Gruber Third Edition Copyright © 2010 Worth Publishers 21 of 37
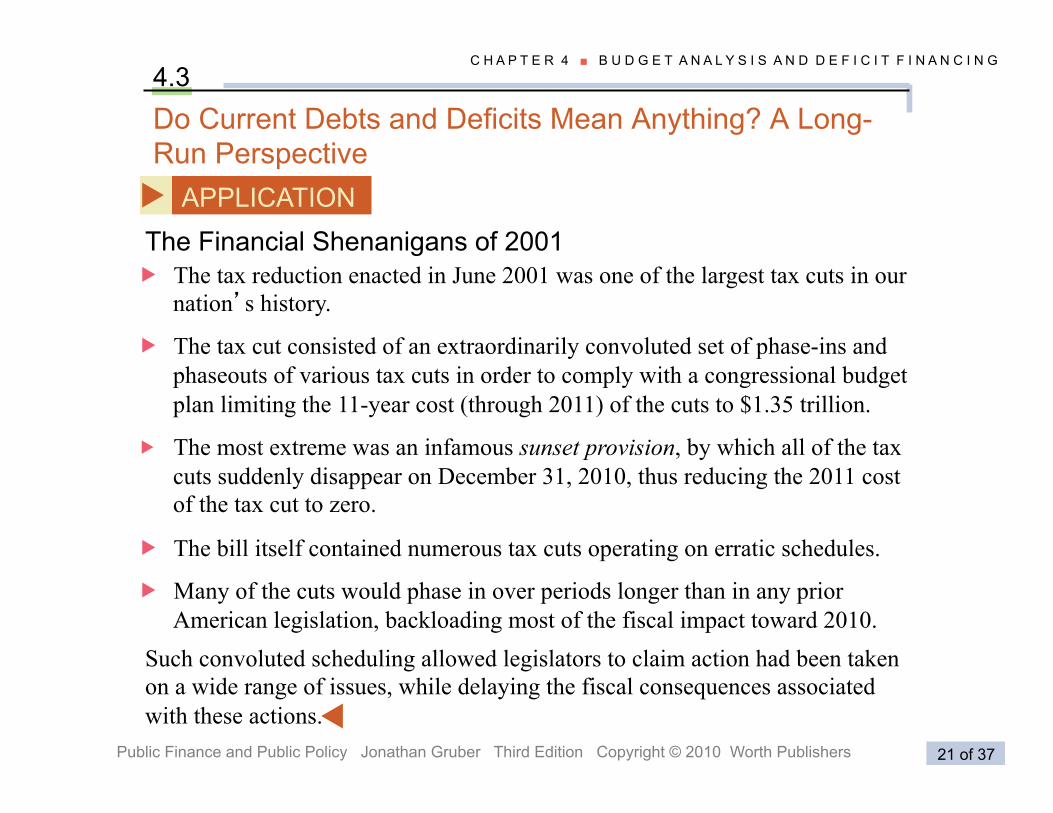
C H A P T E R 4 ■ B U D G E T A N A L Y S I S A N D D E F I C I T F I N A N C I N G 4.3 Do Current Debts and Deficits Mean Anything? A Long-Run Perspective
APPLICATION �The Financial Shenanigans of 2001 � The tax reduction enacted in June 2001 was one of the largest tax cuts in our
nation’s history.
� The tax cut consisted of an extraordinarily convoluted set of phase-ins and phaseouts of various tax cuts in order to comply with a congressional budget plan limiting the 11-year cost (through 2011) of the cuts to $1.35 trillion.
� The most extreme was an infamous sunset provision, by which all of the tax cuts suddenly disappear on December 31, 2010, thus reducing the 2011 cost of the tax cut to zero.
� The bill itself contained numerous tax cuts operating on erratic schedules.
� Many of the cuts would phase in over periods longer than in any prior American legislation, backloading most of the fiscal impact toward 2010.
Such convoluted scheduling allowed legislators to claim action had been taken on a wide range of issues, while delaying the fiscal consequences associated with these actions. �
SHORT-RUN EFFECTS OF THE GOVERNMENTON THE MACROECONOMY
Short-run stabilization issues: The role of the governmentin combating the peaks and troughs of the business cycle.
Automatic stabilization: Policies that automatically altertaxes or spending in response to economic fluctuations in orderto offset changes in household consumption levels (unemploy-ment insurance, progressive taxation, corporate profits tax)
Discretionary stabilization: Policy actions taken by the gov-ernment in response to particular instances of an underper-forming or overperforming economy. (Fiscal stimulus withSpring 2008 rebate checks, 2009-12 Obama stimulus)
⇒ Ability to run deficits in recessions is a great tool for short-run business cycle stabilization (but need to reduce debt duringgood times to keep ability to run deficits when needed)
15
LONG-RUN EFFECTS OF THE GOVERNMENT ONTHE MACROECONOMY
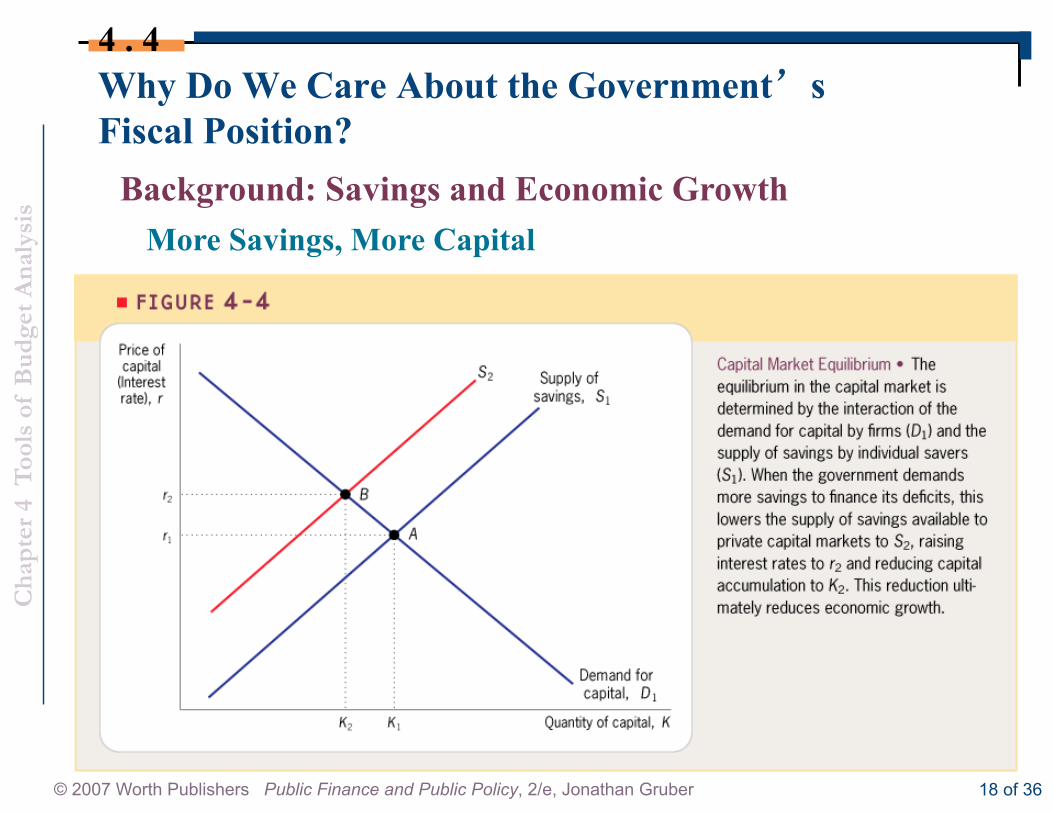
Background: Savings and Economic Growth: The earliesteconomic growth models emphasized a central role for savingsas an engine of growth, and this insight remains important forgrowth economics today.
More Capital, More Growth: As there is more capital inan economy, each worker is more productive, and total socialproduct rises. A larger capital stock means more total outputfor any level of labor supply. Thus, the size of the capitalstock might be a primary driver of growth.
Neo-classical aggregate production function:
K capital stock, L labor, A technology
Y = F (K,L) = A ·KαL1−α with α ' 30%
16
BACKGROUND: SAVINGS AND ECONOMICGROWTH
Interest rate: The rate of return in the second period ofinvestments made in the first period.
Save S in period t, you get (1 + r)S in period t+ 1
Supply and Demand for capital:
Supply of savings (from households) depends positively on r
(higher r means bigger returns to savings)
Demand for capital (from firms) depends negatively on r (firmsinvest only if return on investment is at least equal to r)
In a competitive capital market, the equilibrium amount ofcapital is determined by the intersection of these demand andsupply curves.
17
Cha
pter
4 T
ools
of
Bud
get A
naly
sis
© 2007 Worth Publishers Public Finance and Public Policy, 2/e, Jonathan Gruber 18 of 36
Why Do We Care About the Government’s Fiscal Position?
4 . 4
Background: Savings and Economic Growth More Savings, More Capital
THE FEDERAL BUDGET, INTEREST RATES, ANDECONOMIC GROWTH
The simple supply and demand framework is complicated byintroducing the federal government into the market.
If there is a federal deficit, and the government must borrowto finance the difference between its revenues and its expendi-tures.The key concern about federal deficits is that the federalgovernment’s borrowing might compete with the borrowing ofprivate firms.
If a fixed supply of savings is used to finance both the capitalof private firms and the borrowing of the government, then thegovernment’s borrowing may crowd out the borrowing of theprivate sector and lead to a lower level of capital accumulation.
In reality, there are a number of complications of how govern-ment financing affects interest rates and growth.
19
INTERNATIONAL CAPITAL MARKETS
There is a large body of economics literature that has inves-
tigated the integration of international capital markets
It has generally concluded that while integration is present
(and perhaps growing), it is far from perfect.
As a result, the supply of capital to the United States may not
be perfectly elastic, and government deficits could crowd out
private savings.
20
RICARDIAN EQUIVALENCE
A popular alternative model of savings determination was de-veloped by macroeconomist Robert Barro in the 1970s. Peo-ple save rationally and there are intergenerational links throughbequests and inheritances.
So if government provides fiscal rebates today, people knowthat they will have to pay higher taxes in future years so theydon’t spend the tax rebate and save it to pay future tax in-creases ⇒ fiscal rebates can’t have any impact.
If govt starts unfunded new spending program (like Medicare),I know that taxes will be higher on future generations, I savemore to leave larger bequests to my kids so that they can paythe future taxes!
This model has received very little empirical support in theeconomics literature (individuals are not that rational)
21
THE FEDERAL BUDGET, INTEREST RATES, ANDECONOMIC GROWTH: EVIDENCE
Theory therefore tells us that higher deficits lead to higherinterest rates and less capital investment, but it does not tellus how much higher and how much less.
Effects of deficits on interest rates depend on circumstances
In normal times, you would expect a positive effect of deficitson interest rates
If recessions (like in the US since 2008), interest rate on govtdebt is very low in spite of very large deficits (due to the“liquidity trap”)
The existing empirical literature on this question is somewhatinconclusive, although recent evidence suggests that projectedlong-term deficits do appear to be reflected to some extent inlong-term interest rates
22
CONCLUSION
The deficit has been a constant source of policy interest and
political debate over the last decade, as the government has
moved from severe deficit to large surplus and back to severe
deficit again.
The existing deficit is quite large, but what is more worrisome
than this cash flow deficit is the long-run implicit debt that is
owed to the nation’s seniors through the Social Security and
especially Medicare (as health care costs rise so fast)
⇒ US government will have to control health care costs down
the road if it wants to get back on a sustainable path for tax
revenue and spending
23


![Gini Coefficient California pre-tax income, 2000, Gini=62.1%saez/course131/taxintro_ch17_new_attach.pdfFigure 1: Gini coefficient 6RXUFH .RSF]XN 6DH] 6RQJ4-( :DJHHDUQLQJVLQHTXDOLW\](https://img.pdfslide.us/doc/110x75/5f9d687763df8333422405c5/gini-coefficient-california-pre-tax-income-2000-gini621-saezcourse131taxintroch17newattachpdf.jpg)