Embed Size (px)
Citation preview
PHYSICAL SCIENCE
CHAPTER ONE
INTRODUCTION TO SCIENCE
1.1 THE NATURE OF SCIENCE
Is science:
a set of FACTS?
OR
an ongoing PROCESS?
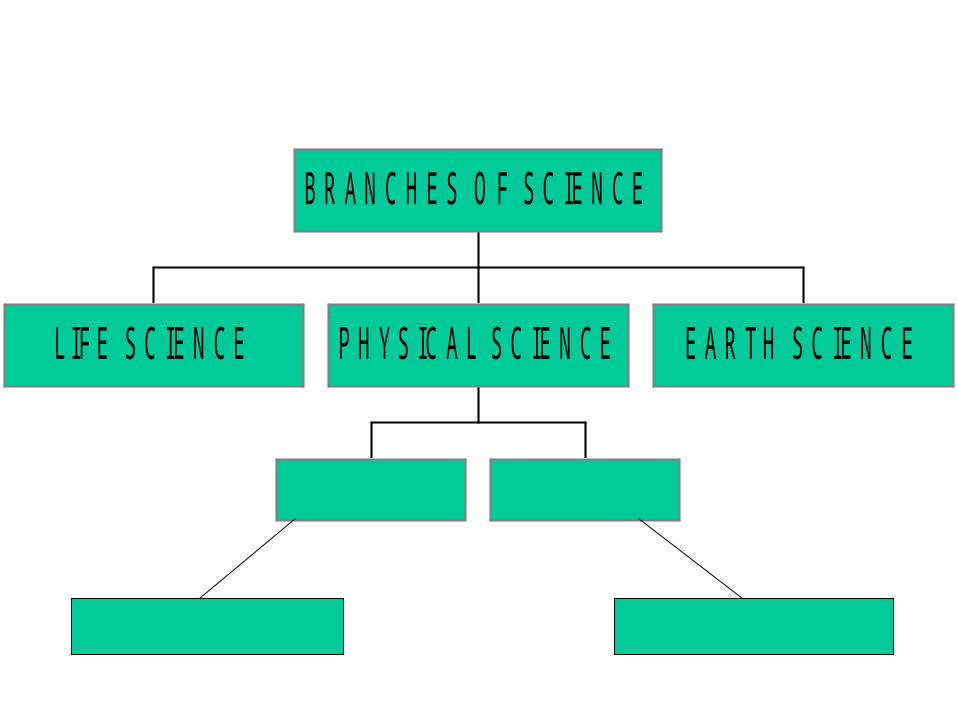
L IF E S C IE N CE P H Y S IC A L S C IE N CE E A R T H S C IE N C E
B R A N C H E S O F S C IE N C E
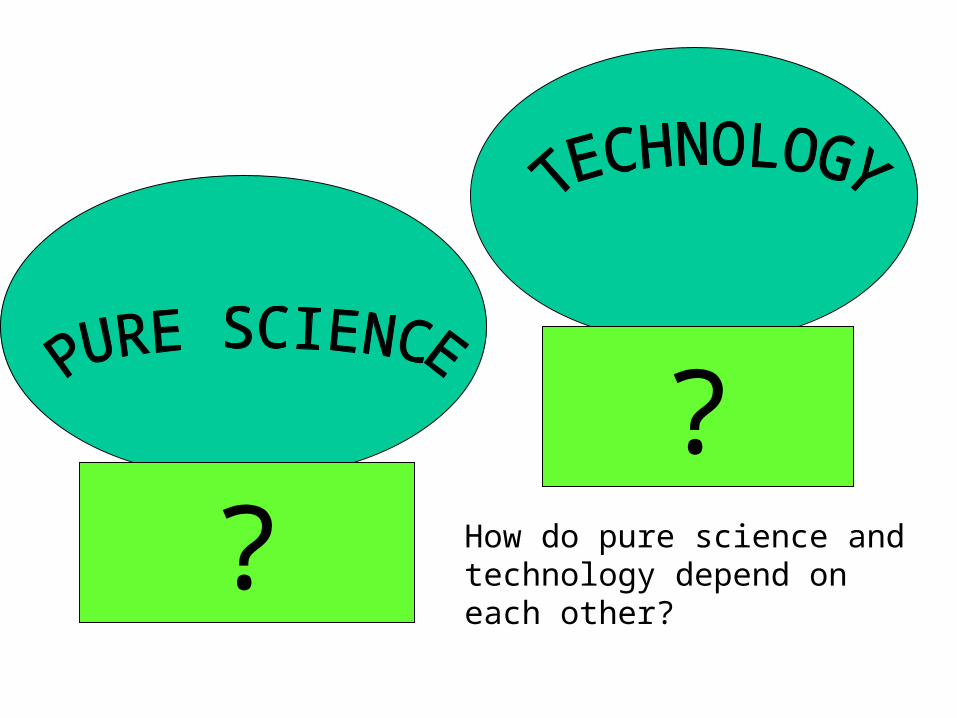
??
How do pure science and technology depend on each other?
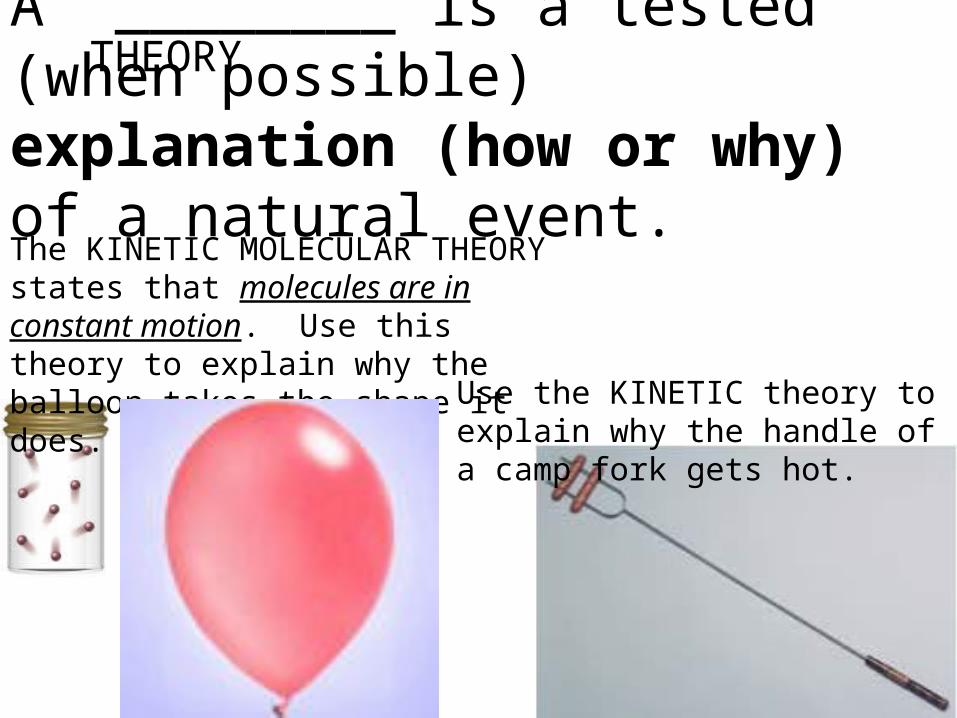
A ________ is a tested (when possible) explanation (how or why) of a natural event.
THEORY
The KINETIC MOLECULAR THEORY states that molecules are in constant motion. Use this theory to explain why the balloon takes the shape it does.
Use the KINETIC theory to explain why the handle of a camp fork gets hot.
A _____ states a summary of a repeated observation about a natural event in God’s creation.
LAW
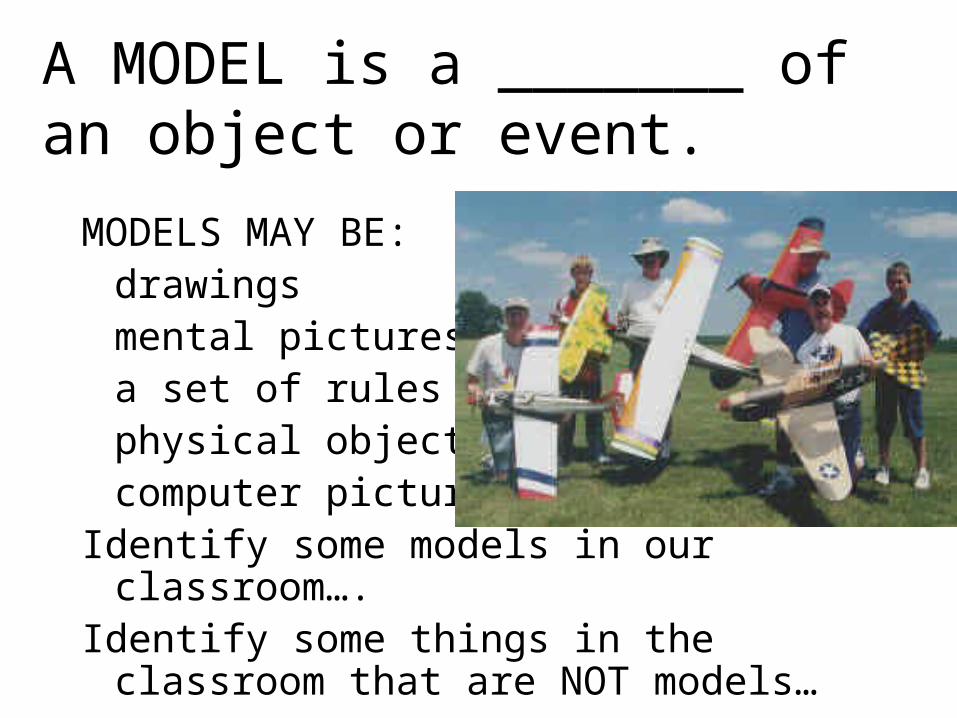
A MODEL is a _______ of an object or event.
MODELS MAY BE:drawingsmental picturesa set of rulesphysical objectscomputer pictures
Identify some models in our classroom….Identify some things in the classroom that are
NOT models…

THE WAY SCIENCE WORKS 1.2
It is a way of THINKING
THE SCIENTIFIC METHOD is a way to organize your thinking.
Using the Scientific Method to improve your social life.
After making observations…
1. Question
2. Collect Data
3. Hypothesis
4. Experiment – only one variable!!! All other conditions controlled!!!
5. Conclusion

It is using scientific TOOLS.
Name some tools found in our classroom…
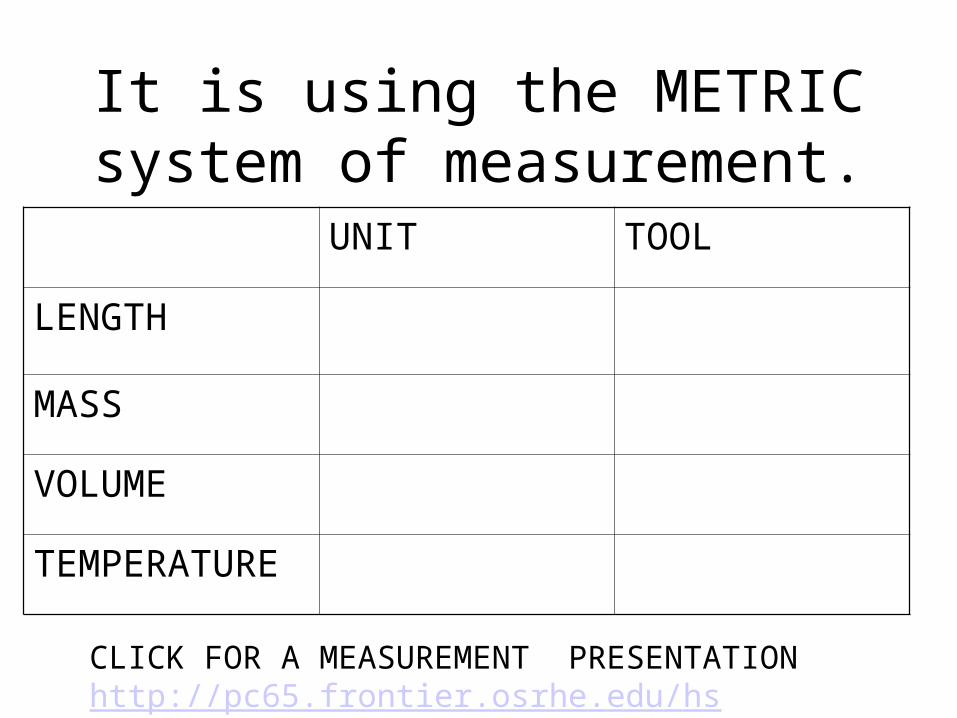
It is using the METRIC system of measurement.UNIT TOOL
LENGTH
MASS
VOLUME
TEMPERATURE
CLICK FOR A MEASUREMENT PRESENTATION http://pc65.frontier.osrhe.edu/hs/science/ppt/ps02.ppt
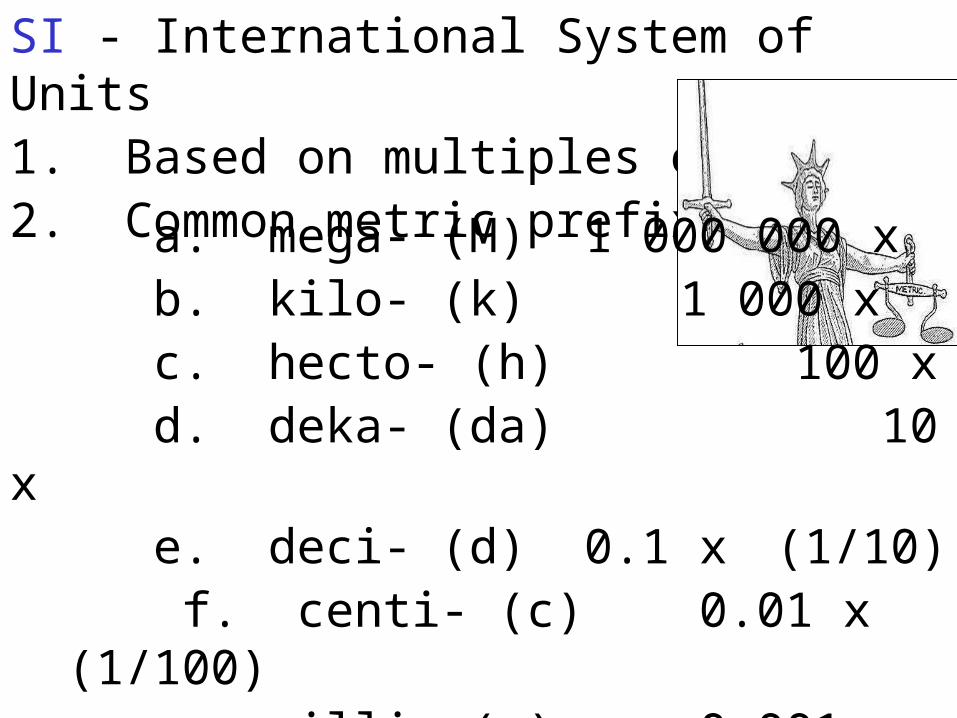
SI - International System of Units1. Based on multiples of 102. Common metric prefixes:
a. mega- (M) 1 000 000 x b. kilo- (k) 1 000 x c. hecto- (h) 100 x d. deka- (da) 10 x e. deci- (d) 0.1 x (1/10) f. centi- (c) 0.01 x (1/100) g. milli- (m) 0.001 x (1/1000) h. micro- (u) 0.000 000 001 x
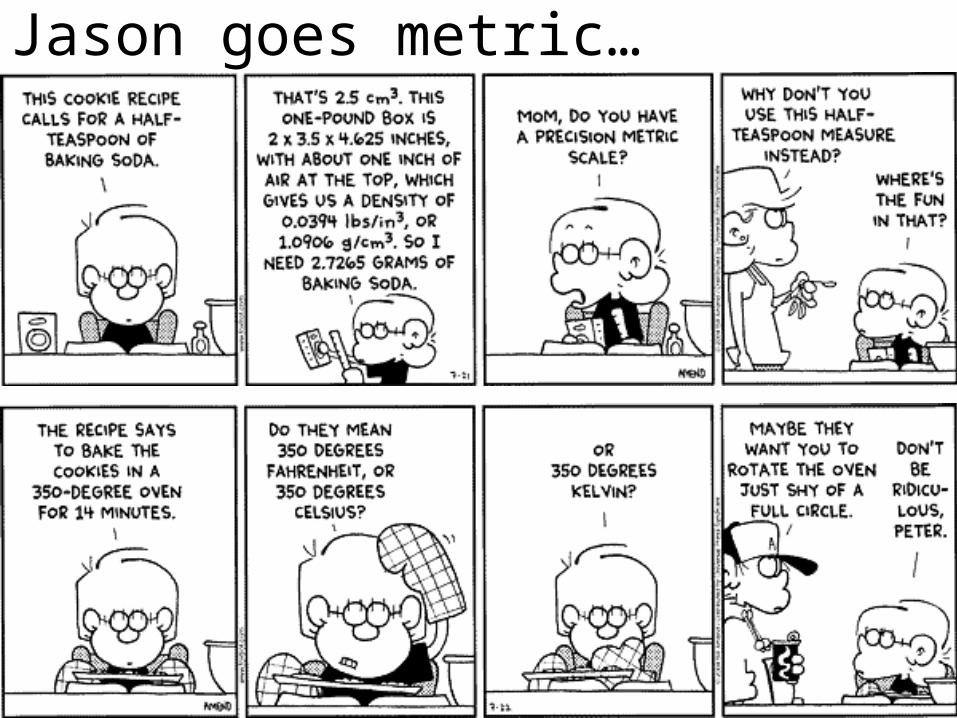
Jason goes metric…

1.3 ORGANIZING DATA
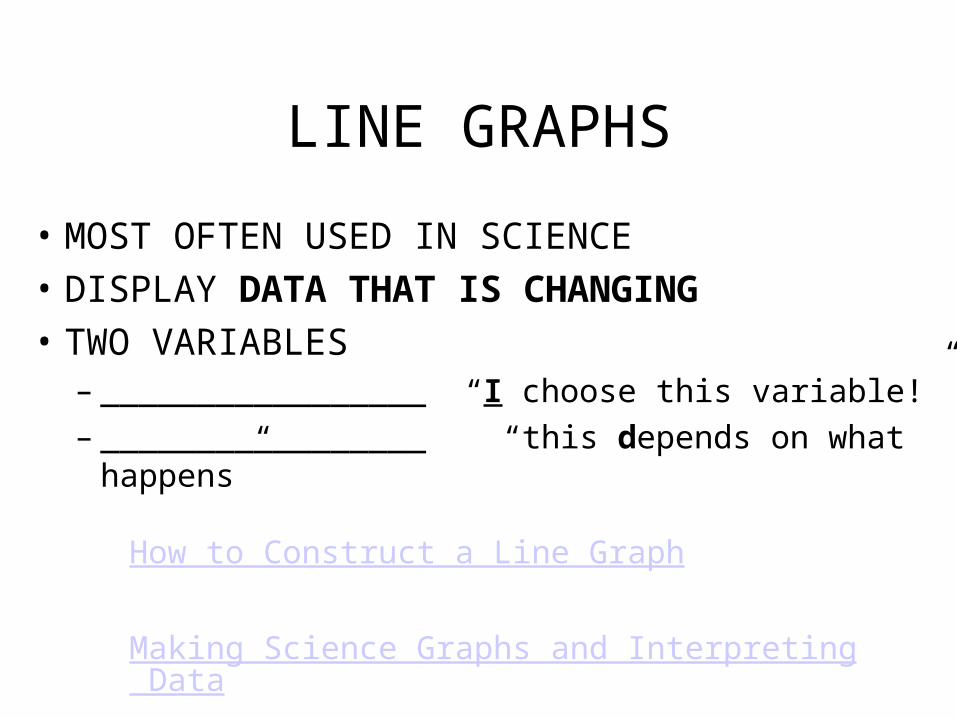
LINE GRAPHS
• MOST OFTEN USED IN SCIENCE
• DISPLAY DATA THAT IS CHANGING
• TWO VARIABLES– _________________ “I choose this variable!”– _________________ “this depends on what happens”
How to Construct a Line Graph
Making Science Graphs and Interpreting Data
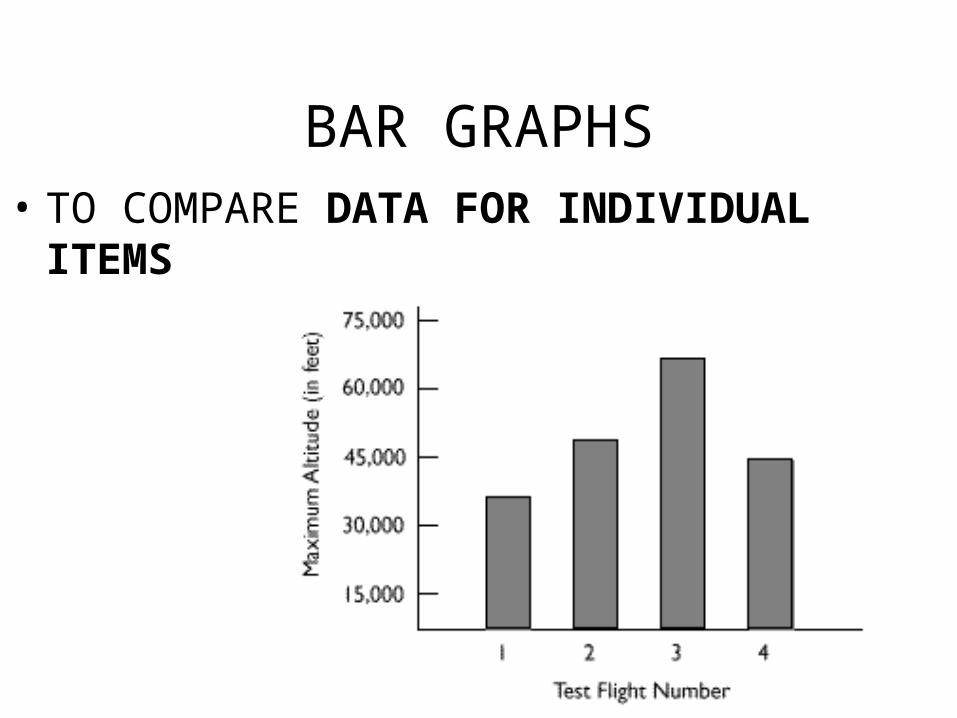
BAR GRAPHS• TO COMPARE DATA FOR INDIVIDUAL
ITEMS
PIE CHARTS
• TO DISPLAY DATA THAT ARE PARTS OF A WHOLE
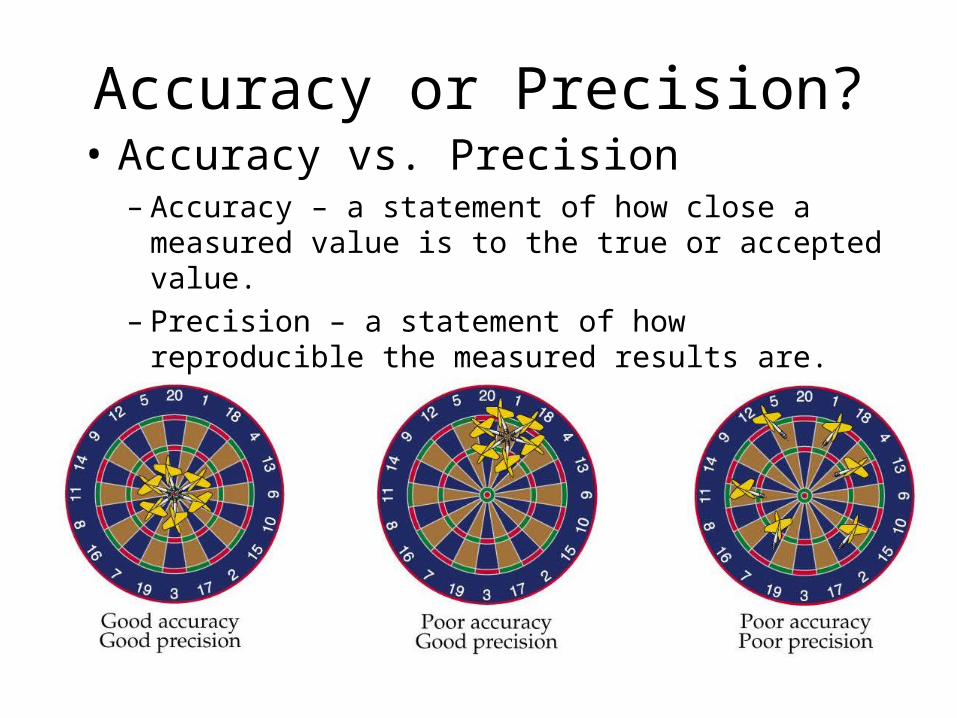
Accuracy or Precision?• Accuracy vs. Precision
– Accuracy – a statement of how close a measured value is to the true or accepted value.
– Precision – a statement of how reproducible the measured results are.
COMPARE AND CONTRAST
ACCURACY
1.
2.
3.
4.
PRECISION
1.
2.
3.
4.
WHICH WOULD YOU PREFER?
Scientific Notation
• What- a value written as a simple number multiplied by a power of 10. – The sun is 93 X 106 miles from earth.
• Why? – Very large or very small numbers are written this way as a form of number “shorthand”.
Scientific Notation
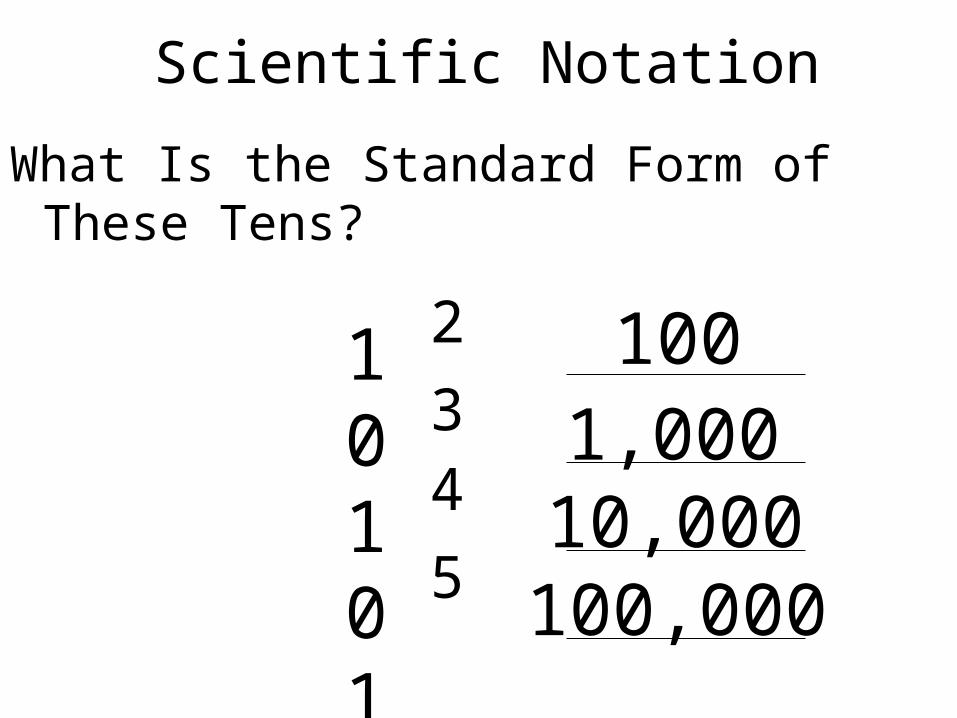
What Is the Standard Form of These Tens?
210101010
34
5
1001,00010,000100,000
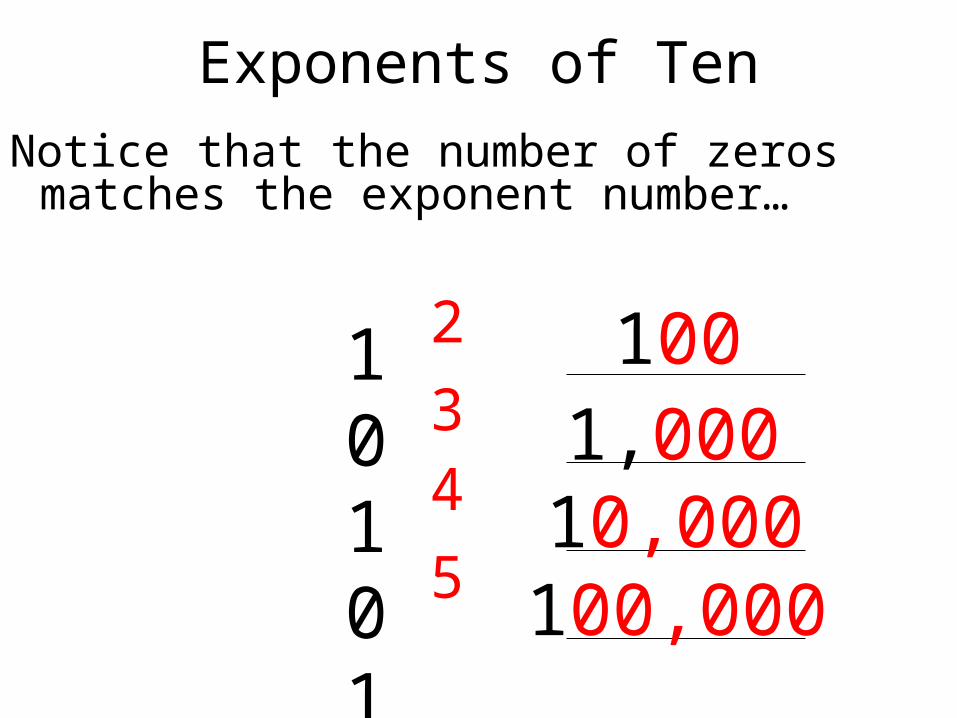
Exponents of Ten
Notice that the number of zeros matches the exponent number…
210101010
34
5
1001,00010,000100,000
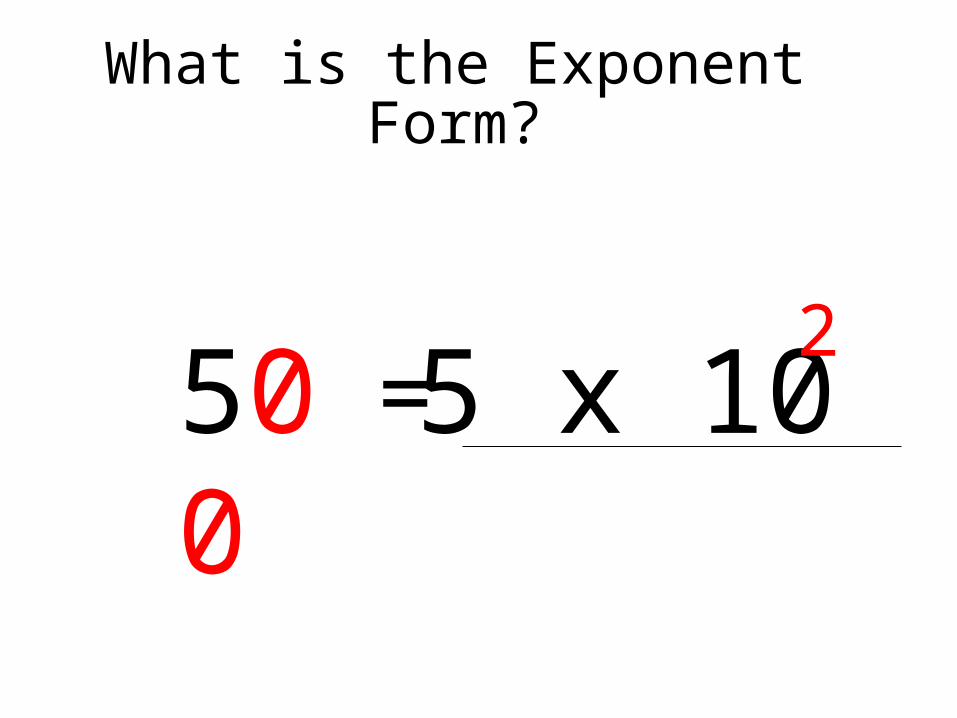
What is the Exponent Form?
5 x 10 2
=500
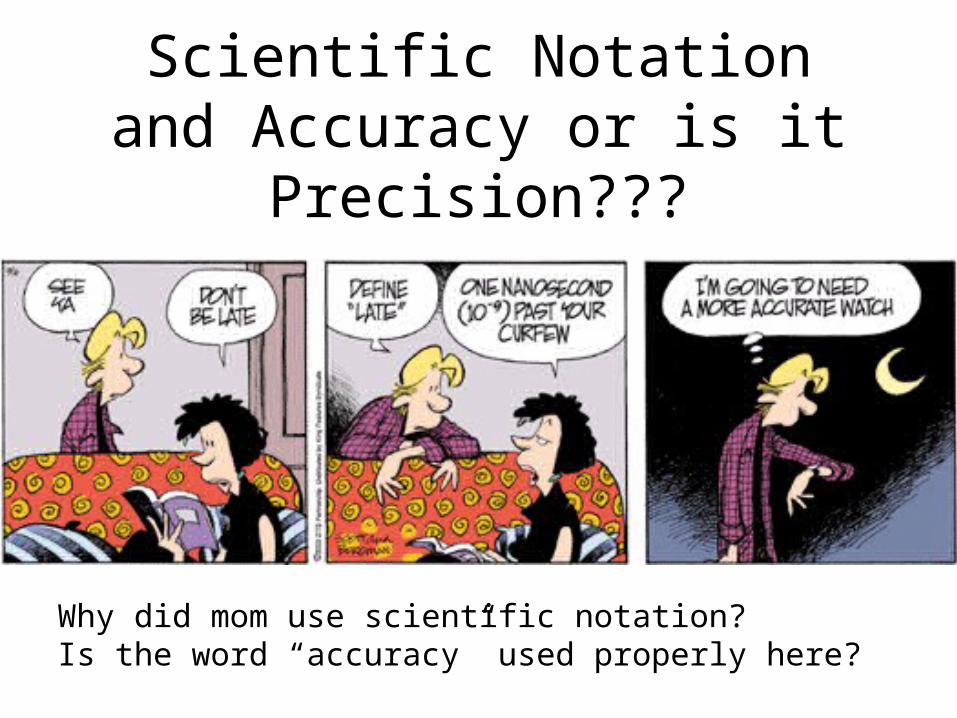
Scientific Notation and Accuracy or is it Precision???
Why did mom use scientific notation?Is the word “accuracy” used properly here?
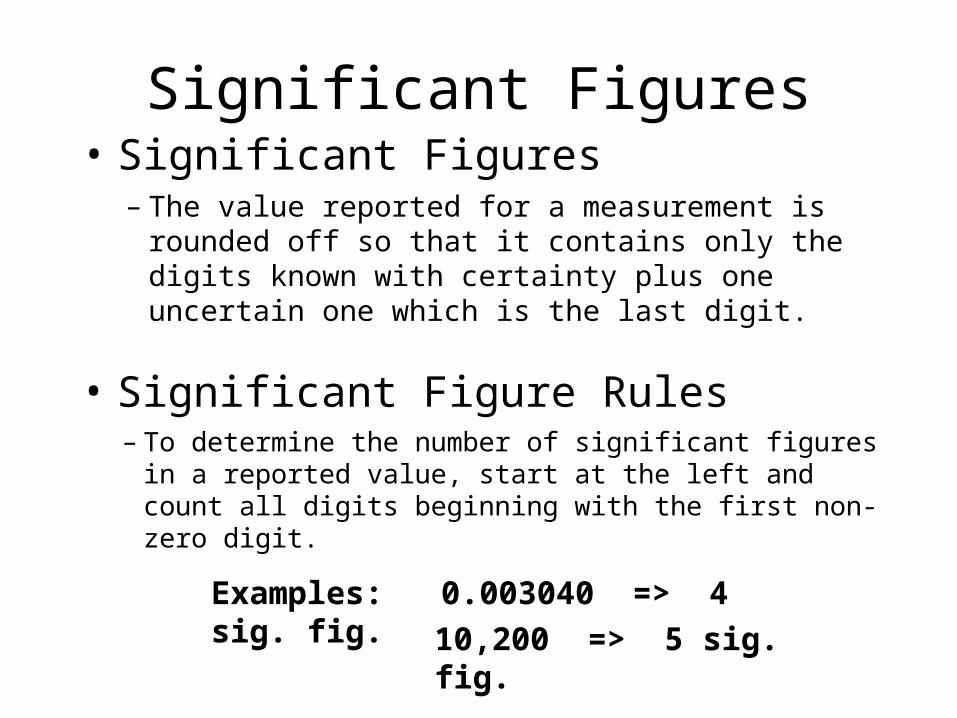
Significant Figures• Significant Figures
– The value reported for a measurement is rounded off so that it contains only the digits known with certainty plus one uncertain one which is the last digit.
• Significant Figure Rules– To determine the number of significant figures
in a reported value, start at the left and count all digits beginning with the first non-zero digit.
Examples: 0.003040 => 4 sig. fig.
10,200 => 5 sig. fig.
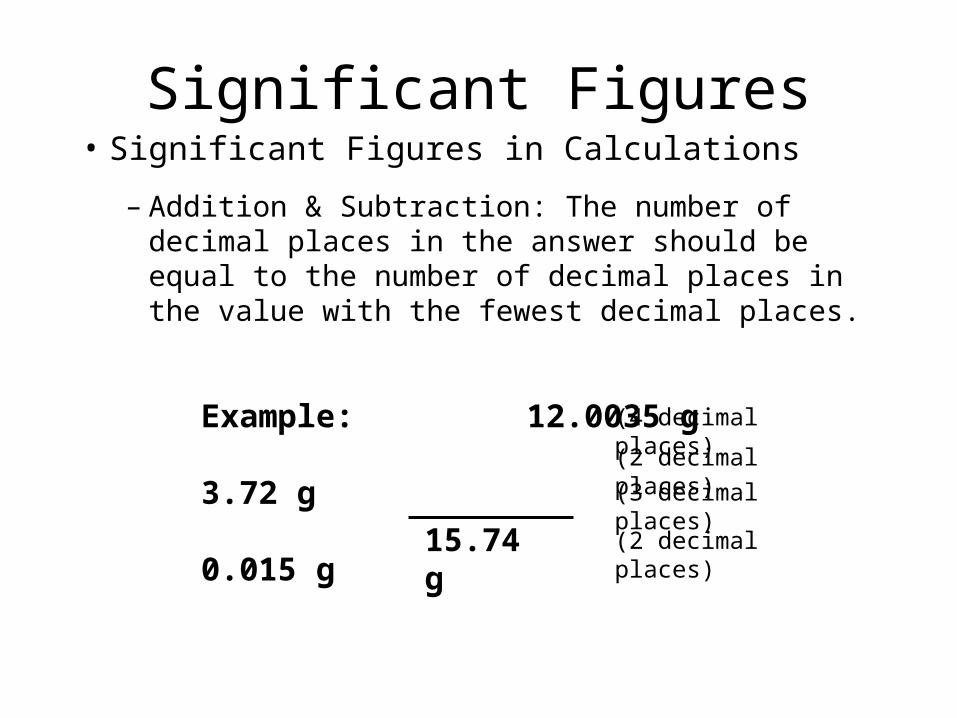
• Significant Figures in Calculations– Addition & Subtraction: The number of decimal
places in the answer should be equal to the number of decimal places in the value with the fewest decimal places.
Significant Figures
Example: 12.0035 g 3.72 g 0.015 g
15.74 g
(4 decimal places)
(2 decimal places)
(3 decimal places)
(2 decimal places)
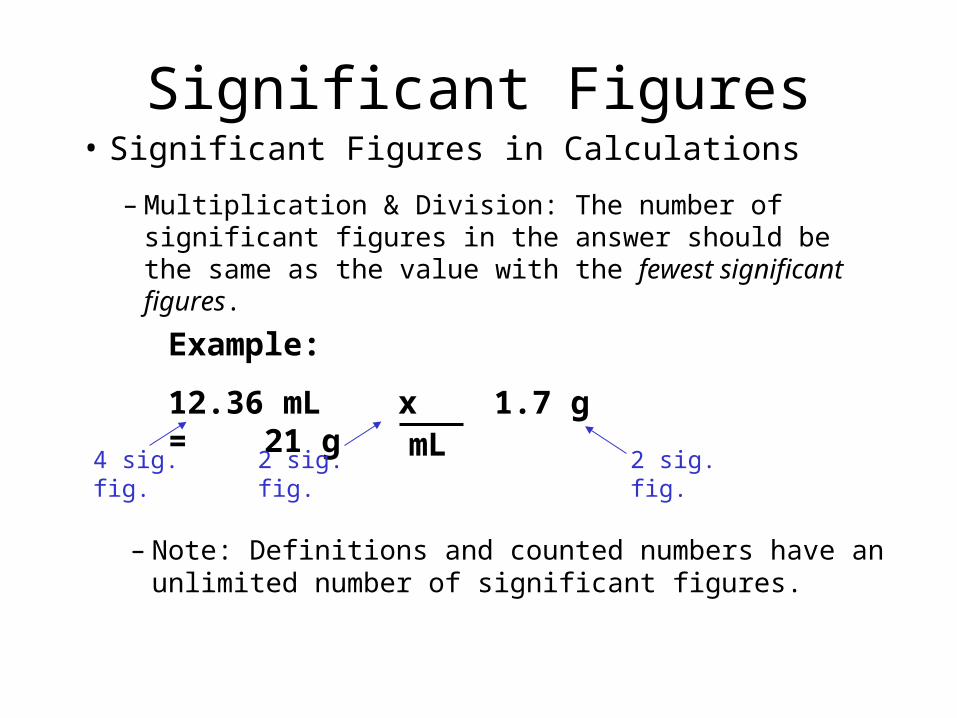
• Significant Figures in Calculations– Multiplication & Division: The number of
significant figures in the answer should be the same as the value with the fewest significant figures.
Significant Figures
Example:
12.36 mL x 1.7 g = 21 gmL4 sig. fig. 2 sig. fig. 2 sig. fig.
– Note: Definitions and counted numbers have an unlimited number of significant figures.
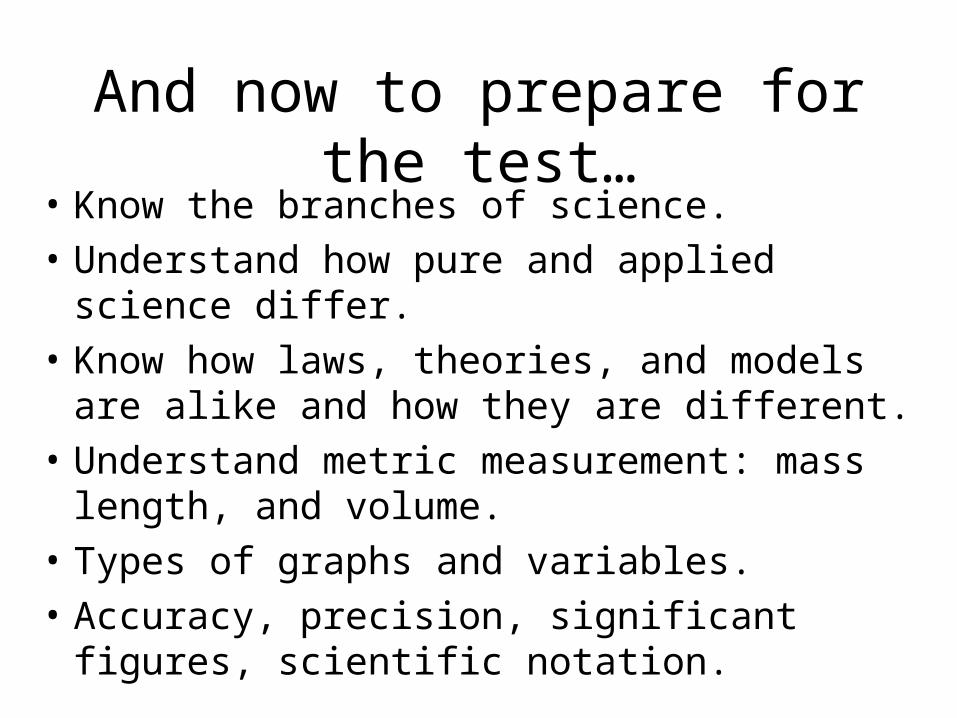
And now to prepare for the test…• Know the branches of science.
• Understand how pure and applied science differ.
• Know how laws, theories, and models are alike and how they are different.
• Understand metric measurement: mass length, and volume.
• Types of graphs and variables.
• Accuracy, precision, significant figures, scientific notation.