Embed Size (px)
Citation preview


Photo courtesy UNICEF, NRHM Assam and PHED

The last decade has witnessed a remarkable turnaround for Assam. In 2001, the State Finances were under severe stress and the law and order situation was unpredictable. There was flight of capital
from the state and development activities had come to stand still.
The people of Assam having reposed their faith in my leadership, bestowed upon me the onerous responsibility to steer the state out of this dismal situation. I and my team of equally dedicated ministerial colleagues in the Government accepted the challenges and worked
tirelessly to achieve this turnaround, and the results speak for themselves.
The Planning Commission of India has stated that Assam has achieved the 6th highest rate of improvement in economic growth among all the states in India during 2001-2010. The most interesting aspect of the Planning Commission’s report is that from 2001-02 (start of Congress Government in the State) Assam did not witness any decline in growth rate; and the average growth rate of Assam which was 2.4% during 1994-2002 increased to 5.18% during 2002-2010 – an increase of 152% given the fact that the all India rate of improvement was 28% for the same period. This implies that improvement in the economic growth of Assam was almost six times more than the improvement in the all India average.
The Human Development Report 2011 for India has acknowledged Assam’s dramatic resurgence on the path of development, the State has been ranked as number one in the percentage change in Income Index between 1999-2000 and 2007-08. Assam has also been ranked at the third place among all India states for percentage change in Health Index between 1999-2000 and 2007-08,and has also reflected remarkable progress in the percentage change in Human Development Index between 1999-2000 and 2007-08.
I dream of a resurgent and vibrant Assam, free of poverty, sickness, disease, deprivation and inequality. My Government’s emphasis on development in all spheres has yielded rich dividends.I firmly believe that inclusive development cannot be attained unless women across all social groups participate equally in the development process. My Government’s policies are a reflection of the state’s commitment towards this development agenda, and play a crucial role in shaping the nature and discourse of the development process.
To build on this growth profile and translate my vision into reality, the advancement, development and empowerment of women, and their participation and decision making

| 2 |
in social, political and economic life, needs to be ensured. My Government is thus committed to ensure equal access of women to health care, quality education at all levels, career and vocational guidance, employment, equal remuneration, occupational health and safety and social security.
Likewise my Government is committed to ensure a progressive state by investing in the health, education and overall well-being of our children – the future of a better and vibrant Assam.
We have made significant advancements in the reduction of both maternal and infant mortality, and have shown an increase in institutional delivery and immunization coverage. Maternal Mortality Ratio (MMR), Infant Mortality Rate (IMR), increase in institutional delivery and immunization cover indicators have also shown improvement . Increase in female literacy, reduction in out-of-school girls at primary and middle level, gender parity and achieving women’s empowerment through self-help groups have also progressed. However we still have to face major concerns in the areas of anemia and malnutrition, maternal mortality, child sex ratio, neonatal and infant mortality, retention of girls in higher levels of education with quality education, crimes against children and women including trafficking, witch hunting, domestic violence, as well as provision of basic services in all areas including sanitation and safe drinking water.
My eff ort will also be to encourage gender sensitive policies addressing concerns of women and children.
“The Chief Minister’s Vision for Women and Children - 2016” is a strong reiteration of my Government’s commitment as a lead agent of change in Assam through inclusive development and good governance. To eff ectively tackle the concerns highlighted above and to ensure a dedicated approach, every organ of the government shall accord priority to development imperatives vis-à-vis women and children in the State. The action plan, based on definitive goals, shall be achieved by close monitoring of performance indicators through independent monitoring system, and I request all the citizens of our state to contribute to translating this Vision into reality. Let us step forward with the best of intentions and sincerest of eff orts to work for a bright and healthy future for our women and children.
Tarun Gogoi

| 3 |
ContentsGoals for CM's Vision for Women & Children - 2016 4
Assam – on Path of Progress 6
Our women and children -present status 9
CM’s goals and strategy to achieve the goals 24
Translating the vision – the action plan 30

| 4 |
Goals for CM's Visionfor Women & Children - 2016
Goal 1 Reduction in infant mortality rate to 38 per 1000 live birth.*
Goal 2 Reduction in maternal mortality ratio to 210 per 100000 live births.*
Goal 3 Reduction of total fertility rate to 2.1*
Goal 4 Improving child sex ratio by 30 points (987).
Goal 5Reduction in percentage of anaemia in children (6-35 months old) by 45 percent to 42 percent.
Goal 6Reduction in percentage of anaemia among women (15-49 years) by 45 percent to 40 percent.
Goal 7 (A) Reducing in percentage of underweight children (0-5 years) by 30 percent to 25 percent.
(B)Reducing percentage of girls marrying before 18 years by 50 percent to 11 percent.
Goal 8 100 Percent enrolment of girls upto class VIII
Goal 9 (A)Reduction of dropout rates by 50% of the present level in 14 districts (which are above state average) by year 2014-15.**
(B)Achievement of 100% Gross enrollment ratio of girls (age group of 14-15 years) from current 52.4% in secondary levels by 2017.
Goal 1033 Percent reservation for women in all skill development programmes of government.
1
| 5 |
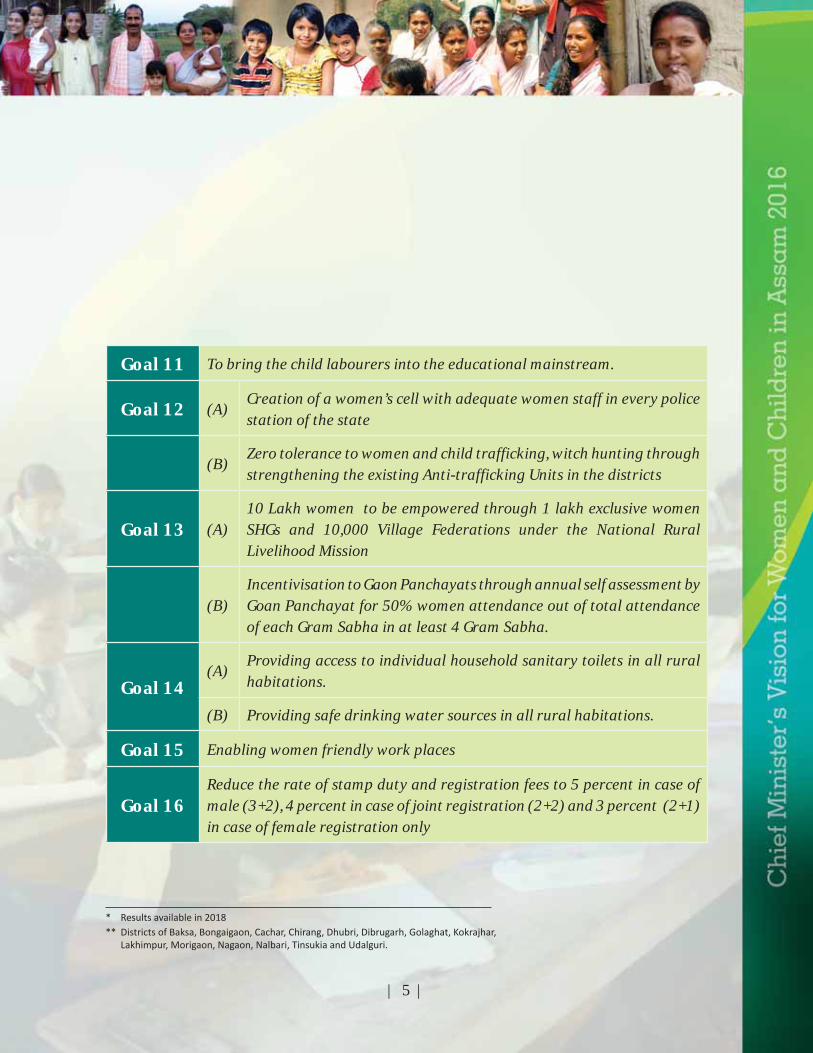
Goal 11 To bring the child labourers into the educational mainstream.
Goal 12 (A)Creation of a women’s cell with adequate women staff in every police station of the state
(B)Zero tolerance to women and child trafficking, witch hunting through strengthening the existing Anti-trafficking Units in the districts
Goal 13 (A)10 Lakh women to be empowered through 1 lakh exclusive women SHGs and 10,000 Village Federations under the National Rural Livelihood Mission
(B)Incentivisation to Gaon Panchayats through annual self assessment by Goan Panchayat for 50% women attendance out of total attendance of each Gram Sabha in at least 4 Gram Sabha.
Goal 14(A)
Providing access to individual household sanitary toilets in all rural habitations.
(B) Providing safe drinking water sources in all rural habitations.
Goal 15 Enabling women friendly work places
Goal 16Reduce the rate of stamp duty and registration fees to 5 percent in case of male (3+2), 4 percent in case of joint registration (2+2) and 3 percent (2+1) in case of female registration only
* Results available in 2018** Districts of Baksa, Bongaigaon, Cachar, Chirang, Dhubri, Dibrugarh, Golaghat, Kokrajhar,
Lakhimpur, Morigaon, Nagaon, Nalbari, Tinsukia and Udalguri.

| 6 |
Assam - on Path of ProgressThe rate of economic growth of Assam has been remarkable during 2001-2010. The Planning Commission’s recent data reveal that in terms of percentage increase in the rate of growth during the period, the state may be ranked at 6th from the top among all the states in the country (Table 1).
Table 1 Percentage increase in the real growth rate of selected states (in terms of GSDP)
States Real Growth Rate 2001-
2002(A)
Real Growth Rate2009-
2010(B)
Pc (%) increase in Real Growth Rate between
2001-2010(C)
State ranking in improvementIn growth rate
Andhra Pradesh 4.22 5.79 37 18
Assam 2.58 7.34 182 6
Bihar -4.73 8.56 281 3
Jharkhand 6.79 6.58 -3 25
Gujarat 8.41 10.23 22 21
Kerala 5.17 9.73 88 11
Rajasthan 10.87 3.95 -64 28
Tamilnadu -1.56 8.96 675 1
Uttar Pradesh 2.17 7.22 233 4Source: Planning Commission
From the Table above it is evident that the percentage increase in real growth rate or speed of improvement in economic growth in Assam has been 182 percent, which is well above states like Gujarat, Rajasthan and Kerala.
Most strikingly, the state’s rate of growth of 7.34 percent during 2009-2010 has been greater than the rate of growth of the country which has been pegged at 7.96 percent, thereby indicating a closing to the gap between the state and the country.
The average real growth rate of Assam was 2.21 percent during 1994-2002. The same has increased to 5.91 percent during 2002-2012, registering an increase of 167.4 percent over the earlier period. The corresponding all India rate has been 28 percent.
2

| 7 |
Therefore, it appears that the percentage improvement in economic growth of Assam has been about 6 times more than improvement at the country level.
The most interesting aspect of the Planning Commission’s data is that since 2001-2002 (start of the Congress rule in Assam) the state never experienced any decline in the growth rates. In fact, the state’s economy has shown tremendous improvement during last ten years from the deplorable conditions of 2000-2001, and recent growth estimates clearly speak for themselves.
Most significantly, this remarkable turnaround of the state’s economy from the quagmire of 2000-2001 has not only remained limited to growth performances of the state. The India Human Development Report of 2011 has clearly shown that the state has performed appreciably well in all fronts of human development. The report states that “What is remarkable is that for five of the low HDI states the improvement in HDI is considerably above the national average. These are Bihar, Andhra Pradesh, Madhya Pradesh, Orissa and Assam (p.22)”.
Of the three indices used to measure the overall human development index, the report places Assam at the top among all the states in terms of percentage change in income index from 1999-2000 to 2007-08. The report shows that the income index for Assam has improved from 0.152 (1999-2000) to 0.288 (2007-08) marking an increase of near 90 percent compared to the all India improvement of mere 21 percent.
The education index has also increased from 0.516 (1999-2000) to 0.636 (2007-2008) registering an improvement of about 23 percent.
It is, however, a matter of concern that improvement in the health index of the state has not been as impressive as income and education index, which is suggestive of serious
Economic Growth in %

| 8 |
challenges for all of us. The health index, which was 0.339 (1999-2000) has risen to 0.407 (2007-08) indicating an increase of about 20 percent during the period, which is nevertheless, higher than the relative national increase of 13 percent during the same period.
% of change in HDI between 1999-2000 and 2007-08
% change in income index from 1999-2000 to 2007-08

| 9 |
3Our women and children - present statusInfant HealthAfter multipronged initiatives the Infant mortality rate has reduced considerably.
Graphic depiction of the chart showing the declining IMR figure for the state of Assam
Status of IMR in Assam:
IndicatorAssam India
SRS Bulletin, RGI, 2011 SRS Bulletin, RGI, 2011
Infant Mortality Rate (IMR) per 1,000 Live Birth, 2010 58 47
As per the SRS (December, 2011), Infant Mortality Rate (IMR) in Assam (2010) is 58 per 1000 live births against 47 for the country as a whole. Admittedly, the IMR has improved considerably during 2000-2011. In 2000, the IMR for the state was 74.5 against the all
Trend of Infant Mortality Rate (IMR)per 1,000 Live Births

| 10 |
India figure of 67.8. There has, therefore, been an improvement by 22 percent in Assam vis-à-vis 30 percent for the country. This improvement is due to continuous and multipronged initiatives of the government.
Despite a marginal reduction in the Infant Mortality Rate (IMR) (by 3 points) from 61 per 1,000 live births1 (2009) to 58 per 1,000 live births (2010), Assam continues to rank among
the four highest IMR States in the country, next only to Madhya Pradesh (62 per 1,000 live births), Uttar Pradesh and Orissa (61 per 1,000 live births), and far higher than the
1SRS Bulleti n, Dec 2011
Infant Mortality Rate
IMR District wise

| 11 |
national average of 47 per 1,000 live births. Within the North East region, all the other States have better IMR as compared to Assam. Besides, the IMR in Assam is worryingly biased towards the rural and female population which indicates that if you are a girl infant in the rural areas, your chances of survival beyond the age of one year is much lower than your male or urban counterpart.
Moreover, the Neonatal Mortality Rate (NNMR), i.e. the number of infant deaths in less than 28 days of birth for Assam is 33 per 1,000 live births2 in 2009 which indicates that, of the total infant deaths in the State, 54.7 per cent take place within the first 28 days of birth.
The under-5 Mortality Rate (U5MR) in Assam is 87/1,000 live births3 in 2009, as compared to the all India figure of 64. Here again, the bias against the girl child with Assam recording 91 per 1,000 live births, which is one of the highest in the country.
It is, therefore, imperative that the IMR should be reduced at a much faster pace i.e. at least two third of the present rate, with a special emphasis on rural and girl child, so that life expectancy as well as overall human development index improves.
Maternal Health As per the SRS (July, 2011), the Maternal Mortality Ratio (MMR) in Assam (2007-09) of 390 per 100000 live births is the highest in the country, the corresponding national attainment level is 212. Nevertheless, the state has come a long way since 2001-03. In 2001-03, Assam’s MMR was 490 (India 301) which declined by a mere 2 percent to 480 (India 254) in 2004-06. However, the decline during 2006-2009 has been remarkable i.e. near 19 percent considering the high base. This has been possible due to progress in institutional deliveries especially initiatives under the Janani Surakhsa Yojana (JSY).
One of the measures for improving MMR is the safe delivery. Incidentally, safe deliveries remain a challenge in the State; as per the DLHS-3(2007-08) data, approximately 40 percent of deliveries in Assam are attended by trained attendants while the corresponding figure for all India is 52.7 percent. The JSY is a safe motherhood intervention under the National Rural Health Mission (NRHM) which focuses on reducing maternal and neo-natal mortality by promoting institutional delivery among the poor pregnant women. With the introduction of the JSY from the year 2005, there has been almost 22 times increase in institutional delivery in the State. However, improving the safe motherhood still remains a major challenge for overall improvement in the maternal and therefore child health in the State.
2SRS Bulleti n, 20103SRS Bulleti n, 2010

| 12 |
Trend of Insti tuti onal Delivery in Assam (HMIS Report)showing number of insti tuti onal deliveries over the years
Trend of JSY Benefi ciaries in Assam (HMIS Report)showing number of benefi ciaries over the years
Status

| 13 |
IndicatorSource : ORGI/SRS 2007-09 / June 2011
Assam IndiaMaternal Mortality Ratio (MMR) per 1,00,000 Live Births
390 212
One of the biggest challenges facing Assam in the area of children and women development is high maternal mortality. Although we have achieved the maximum decline of 90 points in maternal mortality ratio between 2005-06 and 2007-094, Assam, continues to remain the State having the highest Maternal Mortality Ratio (MMR) of 390 per 100,000 live births in the country (all India average : 212, with Kerala having the lowest MMR at 81).
Safe deliveries, too, remain a challenge; as per the DLHS-3 data, 39.9% of deliveries are attended by trained attendants; the all India average is 52.7%.
As for institutional births, Assam is at 64.4% (CES, 2009) which is lower than the national average of 72.9%.
Total Fertility RateAs per SRS (July, 2011), the TFR in Assam (2009) is 2.6 which is at par with the all India level, the TFR in rural (2.8) areas of the State is higher than the urban areas (1.5). Since
4SRS Bulleti n
Maternal Mortality Rati o in Assam

| 14 |
2001, the TFR in the state is showing a secular decline from 3.0 to 2.6, the rate of decline being equivalent to the national level. However, given the present growth rate of population, although the percentage decadal growth in population registered a decline from 18.92% (1991-2001) to 16.93% (2001-2011), in absolute numbers, the population of the State increased by 45 lakhs during the last decade, with all districts reporting population growth.The fertility rate is close to the all India average at 2.6, with the birth rate (21.95) and death rate (7.26) lower than the all India average.
TFR equivalent to replacement rate (2.1) is essential for equal sharing of the benefits of growth.
Family planning and reduced family size are important processes in shaping health outcomes. The state government has been trying to promote family planning measures to address the reduction in TFR. The data from NFHS-III (2005-06) over NFHS-II (1997-98) reveal that family planning method adopted by currently married women in the age group of 15-49 has increased from 43.3 percent to 56.5 percent. Similar trend is also observed in the DLHS-II (2002-04) and DLHS-III (2007-08).
Status
IndicatorSource :
Assam (2005) Assam (2009) India (2009)
Total Fertility Rate 2.9 2.6 2.6
Source: SRS Bulletin, 2010
Maternal Mortality Rati o
5 & 6Annual Health Survey 2010-11

| 15 |
Child Sex RatioStatus
IndicatorSource : Provisional 2011 Census
Assam (1991) Assam (2011) India (2011)
Child Sex Ratio (0-6 year female children per 1,000 male children)
975 957 914
Assam’s sex ratio i.e. females per 1,000 males stands at 9547, with almost all districts showing significant improvement over the last decade. While the State ranks higher than
the all India average of 940 per 1,000 males, we have a long way to go if we are to achieve gender parity of States such as Chhatisgarh (992) or Tamil Nadu (995).
What is of concern, however, is that the child sex ratio, i.e. the number of female children per 1,000 male children in the 0-6 year age group shows a significant decline from 975 in 1991 to 957 in 2011, with 10 of the 27 district recording a lower child sex ratio than the State average. This is an indication that a lesser number of girl children are being allowed to survive, develop and grow into healthy and productive citizens of our State.
7Provisional Census 2011

| 16 |
8NFHS-3 2005-069NFHS-2 1998-99
Anaemia & UndernutritionStatus
IndicatorSource : NFHS-3 (2005-06)
Assam India (Yr)
% Children (0-3 years) who are underweight 40.4 42.5
% Children (6-35 months) who are Anaemic 76.7 78.9
As per NFHS-III, an estimated 35.8% of 0-3 year old children in Assam are underweight (low weight for age); with strong rural (36.7) urban (27.9) diff erences. The all India data from the NFHS-III shows that percentage of underweight children is 40.4 percent and the corresponding rural and urban figures are 43.7 percent and 30.1 percent respectively. Although the available statistics indicate that the state is relatively better off compared to the all India level, it is still a matter of concern since more than one-third of Assam’s young children remain vulnerable.
Anameia in children impair cognitive performance, motor development, and scholastic achievement thereby severely implicating human development. The situation therefore needs urgent attention and therefore forms a major component of my vision plan for women and children.
The prevalence of nutritional anaemia, in young children (6-35 months is high with an estimated 77.3% children reported as being anaemic8 -- an increase from the previous 63.2%9.
Status
IndicatorSource : NFHS-3 (2005-06)
Assam India (Yr)
% Adolescent Girls (15-19 years) who are anaemic 67.8 55.8
% Anaemia in Pregnant Women (15-49 years) 72.657.9
Anaemia in women Assam is fairly high. As per NFHS-III, the incidence of anemia has been found among 72 percent of pregnant women within the age group of (15-49) years in Assam. In rural areas the situation is marginally worse (72.7 percent). The all India
Source: Nati onal Family Health Survey, 2005-06
Anaemia

| 17 |
the corresponding figure is 57.9 percent and 59 percent respectively. Most significantly, the prevalence of anemia in the state is getting worse since it has increased by 3 percent during 1998-99 to 2005-06. Besides, the anemia is also widely prevalent among women in general and NFHS-III records that 69.6 percent of ever married women (15-49 years) are anemic.
Approximately 67.8% percent of adolescent girls (15-19 years) are anemic in the State. Incidence of anemia in women can result in maternal mortality, weakness, diminished physical and mental capacity, and increased morbidity from infectious diseases, pre-natal mortality, premature delivery, low birth weight. Therefore redressing anemia among women in the state requires an urgent attention.
Girls marrying before 18 years Status
IndicatorSource : DLHS-3 (2007-08)
Assam India (Yr)
Girls married before age of 18 years (during survey period)
21.8 21.5
As per the DLHS-III (2007-08), in Assam 40 percent of women in the age group of 20-24 years were married before the legal age of 18 years. The corresponding all India figure is 42.9. percent. The survey further, shows that girls married below age 18 (marriages occurring during reference period i.e. 2004) is 20.8 percent in the state against the all India figure of 22.1 percent. The data indicates that so far as the legal age of marriage is concerned, the situation in Assam vis-à-vis the all India scenario is better. Further, the trend is indicative of significant improvement in the age at marriage of women. This is corroborated by the increase in the mean age at marriage of girls from 20.4 years (DLHS-II) to 20.8 years (DLHS-III) in the state. The increase in the mean age of marriage for women has cascading eff ect on the maternal and child health. Given this backdrop, there is need for further acceleration of this positive trend
Education for the female childThe C.M’s Vision 2016 for women and children also lays emphasis on education. Within the social sector, the influence of education is the most important and education impacts all types of human development outcomes. Education (especially of the girl child) is an important input as well as an outcome indicator influencing other development indicators like health, nutritional status, income and family planning. The benefits of education, particularly, girl’s education accrues from one generation to another.

| 18 |
The universalisation up to secondary level of education during the next five years would therefore call for definite actions in increasing enrolment across gender not only at the level of primary but also at the level of secondary together with reducing the drop-out rates at all levels of elementary education( class I-VIII).
Status
IndicatorSource : Census of India 2001 & 2011 / SSA Report
Assam (2001) Assam (2011) India (2011)
Literacy Rate (population above 7 years) (%)
63.25 73.18 74.04
Female Literacy Rate (%) 54.6 67.27 65.46
Male Literacy Rate (%) 71.28 78.81 82.14
Transition Rate for Girls from Class IV to V
90.5(2007-08)
92.4 (2010-11)
Assam’s literacy rate for population above 7 years is 73.18%10 (an increase of nearly 10% as compared to 2001); this, however, is lower than the national average of 74.04%.
While male literacy rate at 78.81% is higher than the female literacy rate at 67.27%, a positive sign is that female literacy has increased at a faster pace as compared to male literacy.
At 104.4%11 Assam’s gross enrolment ratio (GER) at the primary level is at par with the national average; however, enrolment at the upper primary level is 96.8 %, which is proposed to be improved.
10Provisional Census 201111DISE 2011-12
11010111 ProProvisiononal CenCenCenCenCenCenCenCenss

| 19 |
Assam, however, has shown a positive trend in the reduction in out-of-school children in the 6-14 age group from 24.39% (2002) to 2.02% (2011-12)12; however, despite this increase in the number of children enrolled in school, more than 1.19 lakh children remain out of the ambit of education.
Another concern relates to retaining enrolled children, especially girls, in school and enabling them to
complete elementary education. Of those enrolled, the average dropout rate for girls has increased from 5.0% (2009-10) to 11.9% (2011-12) at primary level, and from 13.5% (2009-10) to 14.3% at the upper primary level13 and remains an areas that needs to be addressed.
Reducing dropout rates of girl students of class IX and X in 14 districts:
RMSA, Assam has resolved that all 14 districts (which are above state average of dropout rates for girls students in class IX & X) will be targeted for bringing down drop out rate by 50% of the present level by year 2014-15.
State average dropout rate in Class IX – 14.0%
State average dropout rate in Class X - 24.5%
12Assam SSA data13Assam SSA data
Literacy rate of populati on 7 and above
TREND OF DROPOUT RATE FORTHE LAST 5 YEARS
YEARS PRIMARY UP
GIRLS TOTAL GIRLS TOTAL
2007-08 9.6 10.3 15.1 16.1
2008-09 7.9 8.8 14.4 15.6
2009-10 5.5 5.7 13.5 14.7
2010-11 7.2 8.3 14.4 15.2
2011-12 11.9 12.8 14.3 15.2
Source: DISE/SSA
FEMALE ENROLMENT (2011-12)
FEMALE ENROLMENT IN CLASS I* 3.86 LAKHS
FEMALE ENROLMENT IN CLASS V* 2.58 LAKHS
FEMALE ENROLMENT IN CLASS VIII* 2.86 LAKHS
FEMALE ENROLMENT IN HIGHER SEC AND JUNIOR COLLEGE
1.19 LAKHS
*Source: DISE, 2011-12

| 20 |
14Report of Asst.IG (L&O), Assam
Achieving 100% GER for Girls students in class IX & X by the year 2016-17:• Gross Enrolment Ratio (GER) of Assam in comparison to national level is as below:• Gross Enrolment ratio (GER) of Girl students in secondary section in India = 46.23%• Gross Enrolment ratio (GER) of Girl students in secondary section in Assam = 52.4%
(SEMIS 2010-11)RMSA, Assam has resolved to achieve 100% GER by year 2016-2017 in class IX and Xth
Crime Against WomenStatus
Data shows that cases relating to crimes against women and girls are on the rise. The number of rape cases increased from 1,631 (2009) to 1,721 (2010); during the same period, molestation cases increased from 1389 to 1611, and the number of reported trafficking cases also increased from 41 to 47. The increase of the total number of cases related to cruelty by husband from 4,355 to 5,189 between 2009 and 201014 attest to a high incidence of domestic violence
Women and economic empowermentStatus
The recent Gender Human Development Indices Report, 2009 published by Ministry of Women and Child in collaboration with UNDP and IIPA, mesures States in terms of Human Development Index and Gender Development Index (which includes the parameters of health, education and income) and Gender Empowerment Index (which includes

| 21 |
parameters of poliitcal and economic participation and decision making powers in them and power over economic resources).
For Assam though there has been an improvement in all the indicators but the improvement from 1996 to 2006 has been marginal in terms of both GDI (26th) and in GEM . Household decision making capacity, workforce participation rate and control over resources are lower for the women of Assam in comparison to India. The capacity of Self Help groups also varies with literacy level of the women members.
SELF HELP GROUP UNDER SGSY (1999-2010-2011)No. of SHGs formed 2.35 lakhs
Women SHGs formed 1.50 lakhs
SHGs taking up Economic activity 0.80 lakhsSource: Statistical Handbook
Sanitation & safe drinking water provisionWorldwide over 80% of diarrhoeal deaths are due to unsafe water, in adequate sanitation and poor hygiene. Provision of adequate as well as safe drinking water sources and sanitation facilities is a basic service. This alongwith the behavioural hygiene practices directly translates to health benefit and sustainable livelihood.
Availibility of drinking water facility(as per census 2011)In the field of drinking water, the habitation covered in respect of availability of drinking water facility within the premises is 54.8 % as per census 2011 as compared to 37.9%
ECONOMIC AND POLITICAL

| 22 |
recorded in census 2001. The growth recorded is 44.6% in census 2011 over census 2001. However at the national level, the habitation covered under availability of drinking water within the premises is recorded at 46.6 % in census 2011 as against 39.0% recorded in census 2001 and the growth recorded is 19.5 % .
Availability of sanitation facility (as per census 2011)As per census 2011, the toilet facility within the premises has increased to 64.9% from 29.1% in census 2001 and the growth registered is 123.0 %.
The toilet facility within the premises is recorded at 46.9% in census 2011 against 24.7% recorded in census 2001 in the country as a whole. The growth is registered as 89.9%.
Source: Provisional Census 2011

| 23 |
Gender budgeting for womenThe process of Gender Budgeting in Assam has been introduced in the financial year 2008-09. Thirteen departments in the state at present have been covered under gender budget approach of the government. Gender budgeting examines the resource allocation through gender lens and stresses on re-prioritization rather than an increase in public expenditure.
Good gender budgeting relies on good quality data so that policies and programmes can be evidence based rather than myths and prejudices. Initially data are required to see the reflections of the programmes at the gender desegregated level with special focus on women and children and next to make an impact assessment of the policies on the quality of life and environment.
The gender budget analysis will acknowledge the gender patterns in the society and then help in allocation of resources to those policies which aim to ameliorate negative patterns that create discrimination among gender with the ultimate objective of ensuring better opportunity and participation for all.

| 24 |
4CM’s goals and strategy to achieve the goalsGoal 1: Reduction in infant mortality rate to 38 per 1000 live birth*
Department Responsible: Health & Family Welfare
Strategy
Strengthening of new born care by improving services of “New Born care Corner • (NBCC)”, “Newborn Stabilization Unit (NSU)” and “Sick Newborn Care Unit (SNCU)”.Eff ective implementation of home based newborn care through ASHA. • Implementation of Janani Sishu Suruksha Karyakram (JSSK) to provide free treatment • of sick newborn up to 30 days.Implementation of Facility based IMNCI (F-IMNCI).• Educating mother/ care giver on early initiation and exclusive breastfeeding upto 6 • months, complementary feeding from 6 months onwards with continued breastfeeding up to 2 yrs of age.Deployment of adequately trained human resource•
Goal 2: Reduction in maternal mortality ratio to 210 per 100000 live births*
Department Responsible: Health & Family Welfare
Strategy
Tracking of pregnant women with Anemia and PIH during pregnancy at Village and Sub • centre level for early referral and management.Ensuring quality ANC through ASHA Incentive @ Rs. 100/- per PW (4 ANCs including • registration + consumption of 100 IFA tablets + TT2/Booster).Introduction of Iron Sucrose injection for moderate to severe anemic pregnant and • postpartum women Strengthening quality ANC and thereby identifying high risk pregnancy and complication • during pregnancy and referral.
*Results available in 2018

| 25 |
Successful implementation of Mamoni under Assam Bikash Yojana for nutritional • support to pregnant women during antenatal period,ANC tracking through MCTS(Mother Child Tracking System), • Conduct of regular Maternal Death Audit (MDA) and taking corrective action.• Strengthening of health facilities, in terms of functional FRU, 24X7 PHC and Sub centre • delivery points have been taken up for improved Institutional Delivery and Case Management,Implementation of Janani Sishu Suruksha Karyakram (JSSK) to improve the acceptance • of health care by pregnant women.Special emphasis to be given to night C Sections depending on adequate number of • specialists.
Goal 3: Reduction of total fertility rate to 2.1*
Department Responsible: Health & Family Welfare
Strategy
Identification of eligible couples not adopting modern family planning methods by • updating eligible couple register and counseling.Increasing service delivery points up to Block PHC level.• Improving spacing of Contraceptive by ASHA through social marketing • Capacity building of healthcare provider.•
Goal 4: Improving child sex ratio by 30 points (987)
Department Responsible: Health & Family Welfare
Strategy
Eff ective implementation of the PCPNDT Act.• Regular monitoring of the USG clinics of the State to prevent determination of sex of the • child before birth.The State under Assam BikashYojana has introduced the “MAJONI” scheme to promote • girl child. Under this scheme all the girl child born up to 2nd order on Govt. Hospital are given a fixed Deposit of Rs. 5,000/ which matures on attaining 18 years of age
*Results available in 2018

| 26 |
Goal 5: Reduction in percentage of anaemia in children (6-35 months old) by 45 percent to 42 percent
Department Responsible: Health & Family Welfare
Strategy
Implementation of “Continuum of care” for children upto two years of age in two pilot • blocks of Dibrugarh and Darrang districts.
Promotion and practice of Infant & Young Child Nutrition practices (IYCN) that include • early and exclusive breastfeeding up to six months followed by timely and age appropriate complementary feeding with continued breastfeeding up to age of two years;
Using VHND as a platform for growth monitoring and counselling of mothers on young • child feeding practices.
Expansion of Nutrition Rehabilitation Centres (NRC) to treat severely malnourished • children
Goal 6: Reduction in percentage of anaemia among women (15-49 years) by 45 percent to 40 percent.
Department Responsible: Health & Family Welfare
Strategy
Administration of IFA supplementation.• Appropriate IYCN counselling support to pregnant and lactating mothers;• Implementation of the WIFS programme (Weekly Iron Folic Supplementation) of • Govt of India in convergence with the Social Welfare Department and the Education department. Promotion of nutrition & health education and personal hygiene practices among • adolescents using VHSNC/VHND as a platform.Ensuring of quality ANC for pregnant women, including Hb estimation.• Counselling on nutrition, diet diversification and appropriate maternal health • practices
Goal 7: (A) Reducing in percentage of underweight children (0-5 years) by 30 percent to 25 percent.
(B) Reducing percentage of girls marrying before 18 years by 50 percent to 11 percent.
Department Responsible: Social Welfare Department

| 27 |
Strategy
Improved supplementary Nutrition Programme delivery through Anganwadis.• Oversight of Anganwadis by Matri Sahayak Got of mothers of registered children of • AWCs. Implementation of the provisions of the Prohibition of Child Marriage Act 2006, including • compulsory registration of all marriages;Expansion of SABLA Scheme to cover all districts• Life skills education to empower Kishori Samooha (Adolescent Girls Collectives) under • SABLA
Goal 8: 100 percent enrolment of girls upto class VIIIDepartment Responsible: Elementary Education Department
Strategy
To identify all out-of-school girls (6-14 age group) enrol them in neighbourhood schools • and provide them special trainingTo provide Mid-day Meal to all children (6-14 years) attending Government schools• To ensure that all teachers are trained as per RTE norms• To ensure Pupil-Teacher Ratio (PTR) as per RTE norms (1:30 for primary schools and • 1:35 for upper primary schools)
Goal 9: (A) Reduction of dropout rates by 50% of the present level in 14 districts (which are above state average) by year 2014-15.**
(B) Achievement of 100% gross enrollment ratio of girls (age group of 14-15 years) from current 52.4% in secondary levels by 2016- 2017.
Department Responsible: Secondary Education Department
Strategy
Provision of drinking water facilities & toilet blocks in all High School & Higher Secondary • School by the year 2014-15.Construction of 100 bedded girls hostel and model schools in all 81 educationally • backward blocks by 2015.Operationalization of school activities monitoring system through integrated vioce • response system (IVRS) and other ICT methods.
Goal 10: 33 percent reservation for women in all skill development programmes of government.
Department Responsible: Labour Department

| 28 |
Goal 11: To bring the child labourers into the educational mainstream
Department Responsible: Labour & Employment Department
Strategy
Identify, rescue and enrol child labourers in formal schools through SSA;• Amend the State Rules of Child Labour (Prohibition and Regulation) Act 1986 to • synchronise it with the Right to (Free and Compulsory) Education Act 2009;Recognise National Child Labout Project (NCLP) schools as Special ShikshaKendras • (SSKs) under Right to (Free and Compulsory) Education Act 2009;Increase prosecution of employers of child labourers under Child Labour (Prohibition • and Regulation) Act 1986, Bonded Labour System (Abolition) Act 1976.
Goal 12: (A) Creation of a women’s cell with adequate women staff in every police station of the state
(B) Zero tolerance to women and child trafficking, witch hunting through strengthening the existing Anti-trafficking Units in the districts
Department Responsible: Home Department
Strategy
Activation of VDP/Gaon Burah network for improved information to thanas on girls/ • children going outside the state Analysis of crime against women and children on a quarterly basis • Establish Anti- Human Trafficking Units (AHTUs) in all districts of the State;• Increase prosecutions of perpetrators of trafficking as per the provisions of The Immoral • Trafficking (Prevention) Act 1956;To activate and strengthen the prevention mechanisms as per the provisions of the • Integrated Child Protection Scheme (ICPS);Strengthen the Juvenile Justice delivery system as envisaged under the Juvenile Justice • (Care and Protection) of Children Act, 2000;
Goal 13: (A) 10 lakh women to be empowered through 1 lakh exclusive women ( Self Help Groups) SHGs and 10,000 village federations under the National Rural Livelihood Mission
(B) Incentivisation to Gaon Panchayats through annual self assessment by Goan Panchayat for 50% women attendance out of total attendance of each Gram Sabha in at least 4 Gram Sabha
Department Responsible: Panchayat and Rural Development Department
15Separate toilets for girls and boys which are gender sensiti ve and water connecti vity as well as having inclusive elements such as ramp, etc.16Child friendly sanitati on units with water connecti vity

| 29 |
* Results available in 2018** Districts of Baksa, Bongaigaon, Cachar, Chirang, Dhubri, Dibrugarh, Golaghat,
Kokrajhar, Lakhimpur, Morigaon, Nagaon, Nalbari, Tinsukia and Udalguri.
Strategy
Operationalise the National Rural Livelihoods Mission specifically targeting women’s • empowermentWork towards better participation of women in Gram Sabhas, MGNREGA and other • development schemesEnsure better training / capacity building to elected women representatives•
Goal 14: (A) Providing access to individual household sanitary toilets in all rural habitations.
(B) Providing safe drinking water sources in all rural habitations.
Department Responsible: Public Health Engineering Department
Strategy
Enable all rural habitations to have access to, and use, safe drinking water sources.• Provide safe drinking water to all quality-aff ected rural habitations.• Enable all rural BPL & APL households to have access to and use sanitary toilets, and • adopt key behaviours linked to personal hygiene and sanitation.Ensure all rural government schools and anganwadis have functional toilets, urinals • and access to safe drinking water.Ensure sustainability of drinking water sources and systems.• Support an enabling environment so that Panchayats and local communities can manage • their own drinking water sources and systems, and sanitation.
Goal 15: Enabling women friendly work placesDepartment Responsible: Social Welfare Department
Strategy:
Legislation to ensure safe working conditions for women in workplaces.•
Promotion of women friendly infrastructure etc. in workplaces.•
Goal 16: Reduce the rate of stamp duty and registration fees to 5 percent in case of male (3+2), 4 percent in case of joint registration (2+2) and 3 percent (2+1) in case of female registration only
Department Responsible: Revenue Department and Disaster Management Department

| 30 |
Translating the vision – the Action PlanThe C.M’s Vision to improve the status of women and children of Assam shall be put into action by envisaging goals for each department of the state government to achieve. Separately, the progress towards the achievement of these goals shall be reviewed based on specific monitorable indicators and system of review meetings on a quarterly basis at the level of the Chief Secretary and a quarterly/ half yearly review under the chairmanship of the Chief Minister shall be institutionalised.
Independent evaluation studies and monitoring by independent monitors from time to time will be undertaken by the Planning & Development Department. The tea garden areas and char areas would be the focus areas for achieving the Goals.
The Panchayati Raj institutions would be closely associated and encouraged to achieved the outcomes.
The Departments would be advised to implement gender sensitive policies addressing concerns of women relating to food security, income generation, fuel, electricity, shelter, public transport etc.
A web portal on key indicators and performance appraisal report shall be hosted which shall allow for scrutiny of the progress from any convenient quarter.
5

| 31 |
ANNEXURE-I
Sector/ Department wise Monitorable Indicators
Health and Family Welfare Department
Monitorable Indicators
Sl. Monitorable IndicatorsData to be filled
(numerator)Master Data
(Denominator)Percentage / Ratio
1Maternal Mortality (No. of Maternal Death against total expected deliveries)
No of Maternal Death Reported
Probable Maternal Deaths Percentage
2Neo-Natal Mortality (No of Neo-Natal Death against Total Expected Deliveries)
No of Neo-natal death reported
Probable Neo Natal Deaths. Percentage
3
PCPNDT Observance (No of cases registered under Form F to Total ultrasound centre in the District)
No of registered genetic clinics maintaining Form F
Total number of clinics registered Percentage
4 Sex Ratio at Birth Live Birth- Female / Live Birth - Male Sex ratio at Birth. Ratio
5Children Immunization (No of Children fully immunized against target)
No of Children (0-1 Year) fully Immunized
Total no of Children of that Age Group (Annual Target of Infants 0-1 years)
Percentage
6
Anemia in pregnant women (Pregnant Women with Hb count<11 to Total expected pregnancies)
No of Pregnant Women with Hb count < 11
No of Pregnant Women Registered for ANC Percentage
7Sterilization (No of Sterilization against ELA)
Total Sterilization (Male & Female )
Expected Level of Achievement (ELA for Sterilization)
Percentage
8 IUD (No of IUD Against ELA) Total IUD insertionExpected Level of Achievement (ELA for IUCD)
Percentage
9Institutional Delivery (No of Institutional Delivery Reported (Public + Pvt.))
No. of institutional delivery reported (Public+Pvt.)
No of Deliveries Expected during the period
Percentage
Social Welfare Department
Monitorable Indicators
Sl. No.
Indicator Data to be filledMaster Data of
districtPercentage /Ratio
1
No. of days provided Take Home Ration (THR) against number of pregnant women
registered with AWCs
No. of days provided Take Home Ration (THR) Total of 300 days

| 32 |
Sl. No.
Indicator Data to be filledMaster Data of
districtPercentage /Ratio
2
No. of pregnant mothers provided Take Home Ration (THR) against number of pregnant women registered with AWCs
No. of pregnant mothers provided Take Home Ration (THR)
Total no. of pregnant women registered with AWCs
3
No. of (0-5) children registered in AWC and number weighed and number found (A) Normal (B) Moderately underweight (C) Severely underweight
No. of children weighed and found normal (A)
No. of (0-5) children registered in AWC
No. of children weighed and found Moderately underweight (B)
No. of children weighed and found Severely underweight (C)
3 (a)Total no. of children (0-5) weighed against total no. of children registered in AWC
Total no. of children weighed (A+B+C)
No. of (0-5) children registered in AWC
4
No. of days Adolescent girls provided Take Home ration (THR) at AWC against total no. of girls registered at AWC
No. of days provided Take Home ration (THR) at AWC
Total of 300 days
5 No. of Adolescent girls provided Take Home ration (THR) at AWC against total no.
No. of Adolescent girls provided Take Home ration (THR) at AWC
Total no. of Adolescent girls registered at AWC
6
No. of days malnourished children (6 mths-3 years) provided Take Home ration (THR)at AWC against total no. registered at AWC
No. of days malnourished children provided Take Home ration (THR)at AWC
Total of 300 days
7
No. of malnourished children (6 mths-3 years) provided Take Home ration (THR)at AWW against total no. registered at AWC
No. of malnourished children provided Take Home ration (THR)at AWC
Total no. of malnourished children (6 mths-3 years) registered at AWC
8No. of days hot cooked meal provided to children (3-5) attending AWW centers against desirable 300 days
No. of days hot cooked meal provided to children (3-5 ) attending AWC centers in every quarter
Desirable 300 days
9 No. of Anganwadi Matri Sahayak Got constituted
No. of Anganwadi Matri Sahayak Got constituted
Total No.s of AWWs of the Department.
| 33 |
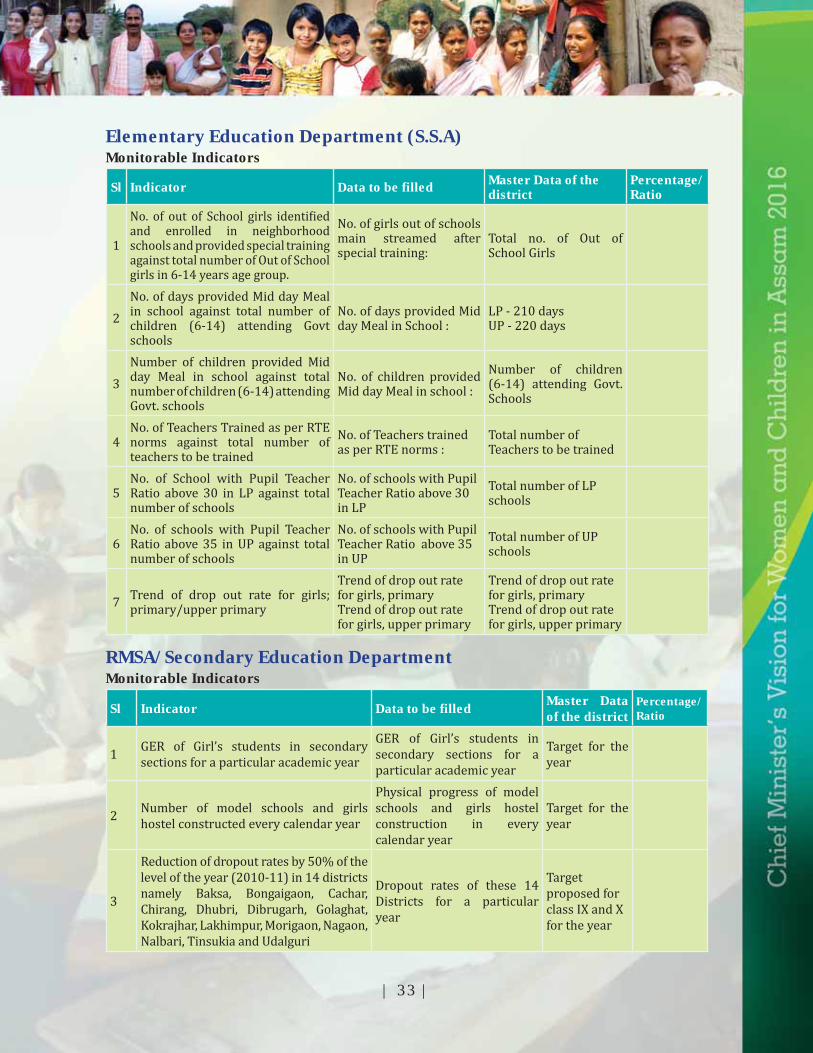
Elementary Education Department (S.S.A) Monitorable Indicators
Sl Indicator Data to be filled Master Data of the district
Percentage/Ratio
1
No. of out of School girls identified and enrolled in neighborhood schools and provided special training against total number of Out of School girls in 6-14 years age group.
No. of girls out of schools main streamed after special training:
Total no. of Out of School Girls
2No. of days provided Mid day Meal in school against total number of children (6-14) attending Govt schools
No. of days provided Mid day Meal in School :
LP - 210 daysUP - 220 days
3Number of children provided Mid day Meal in school against total number of children (6-14) attending Govt. schools
No. of children provided Mid day Meal in school :
Number of children (6-14) attending Govt. Schools
4No. of Teachers Trained as per RTE norms against total number of teachers to be trained
No. of Teachers trained as per RTE norms :
Total number of Teachers to be trained
5No. of School with Pupil Teacher Ratio above 30 in LP against total number of schools
No. of schools with Pupil Teacher Ratio above 30 in LP
Total number of LP schools
6No. of schools with Pupil Teacher Ratio above 35 in UP against total number of schools
No. of schools with Pupil Teacher Ratio above 35 in UP
Total number of UP schools
7 Trend of drop out rate for girls; primary/upper primary
Trend of drop out rate for girls, primaryTrend of drop out rate for girls, upper primary
Trend of drop out rate for girls, primaryTrend of drop out rate for girls, upper primary
RMSA/Secondary Education DepartmentMonitorable Indicators
Sl Indicator Data to be filled Master Data of the district
Percentage/Ratio
1 GER of Girl’s students in secondary sections for a particular academic year
GER of Girl’s students in secondary sections for a particular academic year
Target for the year
2 Number of model schools and girls hostel constructed every calendar year
Physical progress of model schools and girls hostel construction in every calendar year
Target for the year
3
Reduction of dropout rates by 50% of the level of the year (2010-11) in 14 districts namely Baksa, Bongaigaon, Cachar, Chirang, Dhubri, Dibrugarh, Golaghat, Kokrajhar, Lakhimpur, Morigaon, Nagaon, Nalbari, Tinsukia and Udalguri
Dropout rates of these 14 Districts for a particular year
Target proposed for class IX and X for the year

| 34 |
Labour & Employment DepartmentObjectives
Sl. No. Indicator Data to be filled Master Data of district Percentage /Ratio
1 Child labour mainstreamed
No. of children mainstreamed
Total No. of child labour reported Percentage
2 Child labour employers prosecuted
No. of prosecutions launched Total No. of prosecutions
PHE DepartmentMonitorable Indicatorsa. Drinking Water Sector:
Sl. No.
Indicators Data to be filled upMaster Data
of districtPercentage /
Ratio
1 Rural Habitations with access to Drinking Water sources
Nos. of rural Habitations covered with Drinking Water sources
Nos. of rural Habitations
2Quality aff ected rural Habitations provided with safe Drinking Water
Nos. of quality eff ected rural Habitations provided with safe Drinking Water
Nos. of quality aff ected rural Habitations
3 Rural Schools with access to safe Drinking Water sources
Nos. of rural Govt. Schools provided with safe Drinking Water sources
Nos of Rural Govt. Schools
b. Rural Sanitation Sector :
Sl. No.
Indicators Data to be filled upMaster Data of district as per
Sanctioned status
Percentage /Ratio
1Rural Households with access to sanitary Toilet
Nos of rural BPL Households provided with Sanitary Toilets
Nos of rural BPL Households sanitary toilets
2 Nos of rural APL Households covered with Sanitary Toilets
Nos of rural APL Households sanitary toilets
3 Rural Schools with access to Sanitary Toilet
Nos of rural Govt. Schools provided with sanitary Toilet facilities
Nos of rural Govt. School sanitary toilets
4 Rural Anganwadi Centres with access to Sanitary Toilet
Nos of rural Govt. Anganwadi Centres (Govt. bldg) provided with Sanitary Toilet facilities
Nos of rural Govt. Anganwadi Centre Sanitary Toilet
5 Gaon Panchayats awarded Nirmal Gram Puraskar
No. of Gaon Panchayats awarded Nirmal Gram Puraskar in that year
Total number of Gaon Panchayats

| 35 |
Home & Political Department
Monitorable Indicators
Sl. No. Indicator Success
Indicator Base Data Percentage/Ratio
Cumulative ratio of
previous period
1.
No. of Police Stations where Women Cells have been operationalized
NumberNumber of Police Stations in the districts
2.No. of cases relating to incidents of crime
against Women
No. of cases charge
sheeted No. of cases registered relating to crime against women
in the districtNo. of cases
resulting into conviction
3
Efficacy of Criminal Justice system in eff ectively disposing the cases relating to Human Trafficking
No. of cases charge
sheeted No. of cases
registered relating to human trafficking
(girl/women and child) in the district
No. of cases resulting into
conviction
4
Efficacy of Criminal Justice system in
eff ectively disposing the cases relating to
Witch Hunting
No. of cases charge
sheetedNo. of cases
registered relating to Witch Hunting (girl/
women and child)No. of cases
resulting into conviction

| 36 |
P & RD Department
Monitorable Indicators
Sl. No.
Indicator Data to be filledMaster Data of
districtPercentage /
Ratio
1
No. of women SHGs earning Rs 10000/pm or above against total women SHGs in districts under SGSY/NRLM
No. of women SHGs earning Rs 10,000/pm
Total women SHGs in districts under SGSY/NRLM
2
No. of women job card holders provided employment under MGNREGA against total job card holders provided employment
No. of women job card holders provided employment under MGNREGA
Total job card holders provided employment
3No. of female Mates and % to male Mates under MGNREGA
No. of female Mates under MGNREGA Total no. of mates
4
Elected women Panchayat representatives trained against total no. of elected women Panchayat representatives
No. of elected women representatives trained
Total no. of elected women Panchayat representatives

Photo courtesy UNICEF, NRHM Assam and PHED

Exclusive/PDD/0412