Embed Size (px)
Citation preview
The Freeway Performance Measurement System
(PeMS)
(PeMS Version 3)
1
Table of Contents
�Background
�Capabilities
�Your Feedback
�Appendix
2
What is PeMS?
� The Freeway Performance Measurement System (PeMS) provides an easy-to-access source of historical and real-time traffic data
� PeMS is a consolidated database of information collected via Caltrans loop detectors from traffic management centers (TMCs) throughout the state
� PeMS is accessed via a standard internet browser and contains a series of built-in analytical capabilities to support a variety of uses
� PeMS supports system management objectives as envisioned in Caltrans’ Traffic Operations Strategies (TOPS) : reducing highway congestion, increasing trip reliability, enhancing customer safety, utilizing existing system fully, being demand sensitive
� PeMS can serve as a decision support tool to monitor highway performance using measures consistent with the statewide Performance Measurement Initiative led by Caltrans
� PeMS provides traffic information to the public through Value Added Resellers (VARs)
Background
3
History of PeMS
�PeMS was initiated as a Partners for Advanced Transit and Highways (PATH) research project at the University of California, Berkeley. The original intent was to support the data needs of traffic engineering researchers
�PeMS was quickly perceived to have value beyond research and the development focus shifted to meeting the practical needs of Caltrans engineers and planners
� In the near future, PeMS will be able to support a number of on-going Caltrans initiatives:– Helping to build the intelligent infrastructure necessary for system management and TOPS– Collecting mobility data using loop detectors for the State Highway Congestion Monitoring
Program (HICOMP)– Monitoring highway mobility and reliability for performance measurement
Background
4
Current Status of PeMS
�PeMS is a functioning Internet application that collects, stores, and analyzes data
�Real-time data from District 7,8,3,12 are sent to and stored in PeMS
�The system is being rolled-out statewide:– Districts 11,4 are expected to be connected in July 2001– Remaining districts that collect sensor data will be linked to PeMS by 2002
Background
5
Communications Architecture
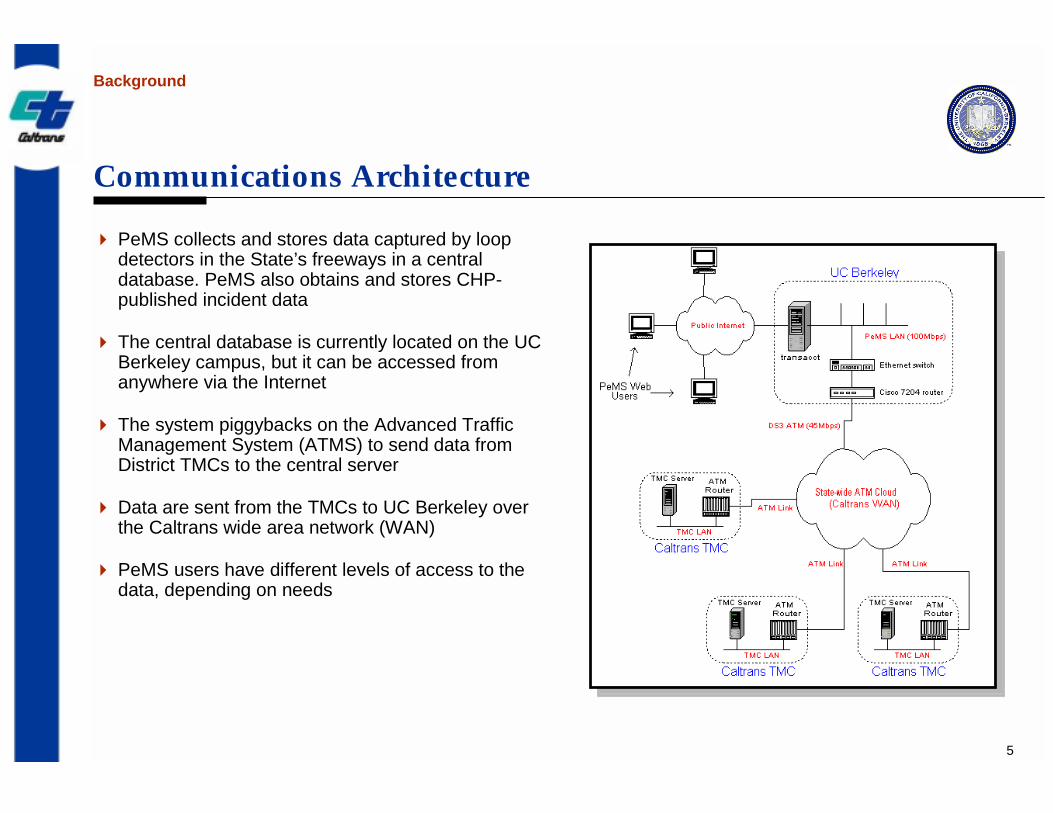
� PeMS collects and stores data captured by loop detectors in the State’s freeways in a central database. PeMS also obtains and stores CHP-published incident data
� The central database is currently located on the UC Berkeley campus, but it can be accessed from anywhere via the Internet
� The system piggybacks on the Advanced Traffic Management System (ATMS) to send data from District TMCs to the central server
� Data are sent from the TMCs to UC Berkeley over the Caltrans wide area network (WAN)
� PeMS users have different levels of access to the data, depending on needs
Background
6
PeMS Design Goals
�Provide historical and real-time data to assist transportation system management
�Complement existing and future Advanced Traffic Management System (ATMS)
�Be easy to use and support everyday applications
�Provide information to understand what is currently happening in the highway system
�Be a low-cost system by using commercial off-the-shelf products, the Caltrans WAN, and the Internet
�Be easy to deploy– Support incremental data additions– Allow additional districts to be added without TMC disruption
Background
7
Intended Users
�PeMS can be valuable to a range of users:
– Decision Makers: “big picture” view of conditions
– Caltrans Engineers: detailed traffic analyses
– Planners: “choke point” analyses, trends
– The Public: traveler information through the Internet and VARs
Background
8
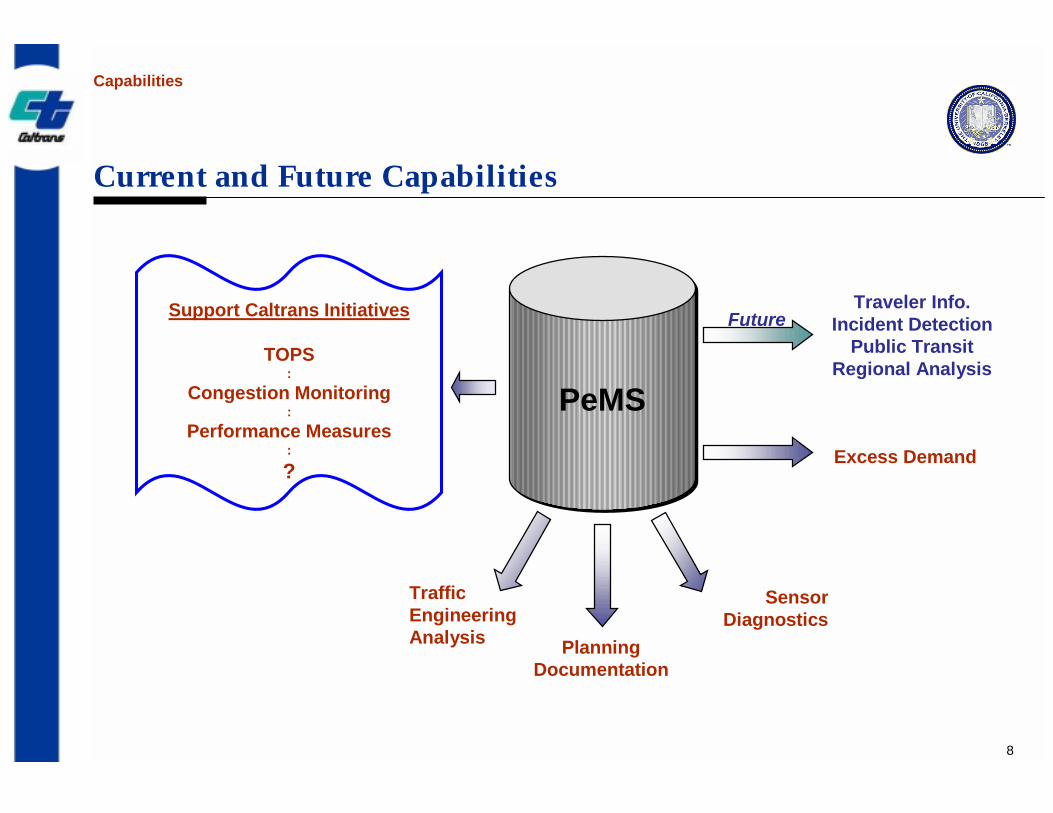
Current and Future Capabilities
Capabilities
PeMSPeMS
TrafficEngineeringAnalysis
SensorDiagnostics
Traveler Info.Incident Detection
Public TransitRegional Analysis
Excess Demand
PlanningDocumentation
Support Caltrans Initiatives
TOPS:
Congestion Monitoring:
Performance Measures:
?
Future
9
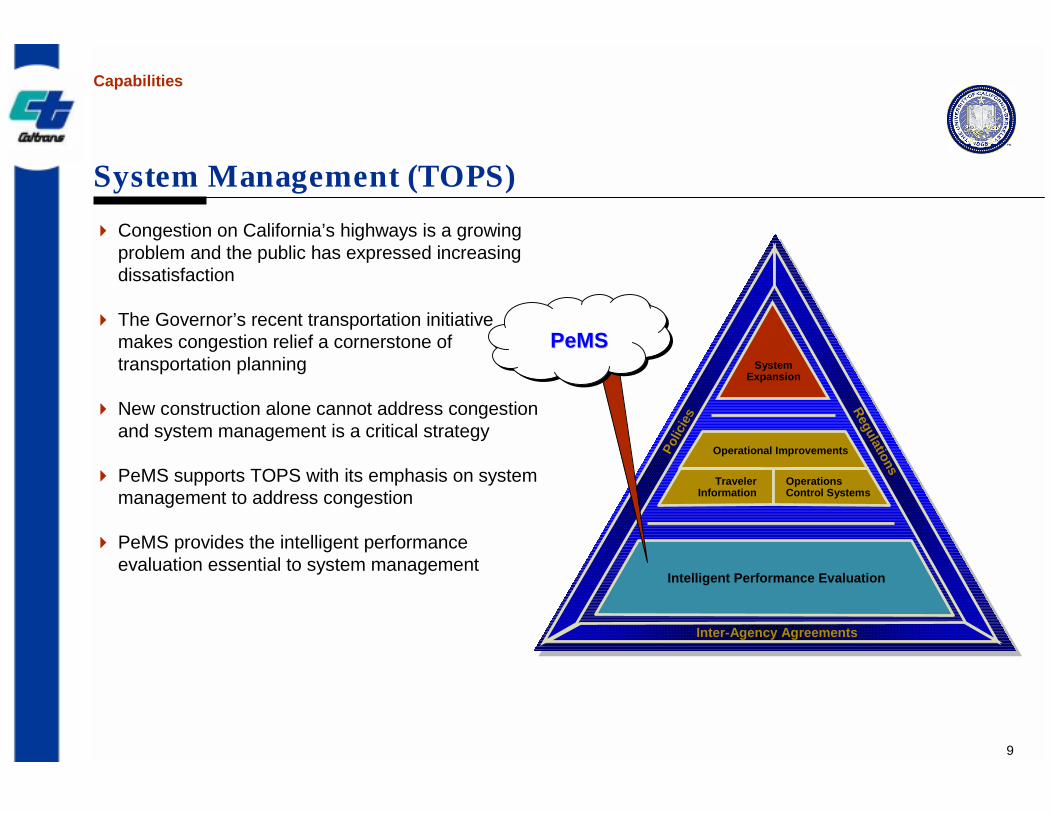
System Management (TOPS)� Congestion on California’s highways is a growing
problem and the public has expressed increasing dissatisfaction
� The Governor’s recent transportation initiative makes congestion relief a cornerstone of transportation planning
� New construction alone cannot address congestion and system management is a critical strategy
� PeMS supports TOPS with its emphasis on system management to address congestion
� PeMS provides the intelligent performance evaluation essential to system management
Intelligent Performance Evaluation
SystemExpansion
Operational Improvements
Traveler Information
Operations Control Systems
Inter-Agency Agreements
Polic
ies Regulations
Capabilities
PeMSPeMSPeMS
10
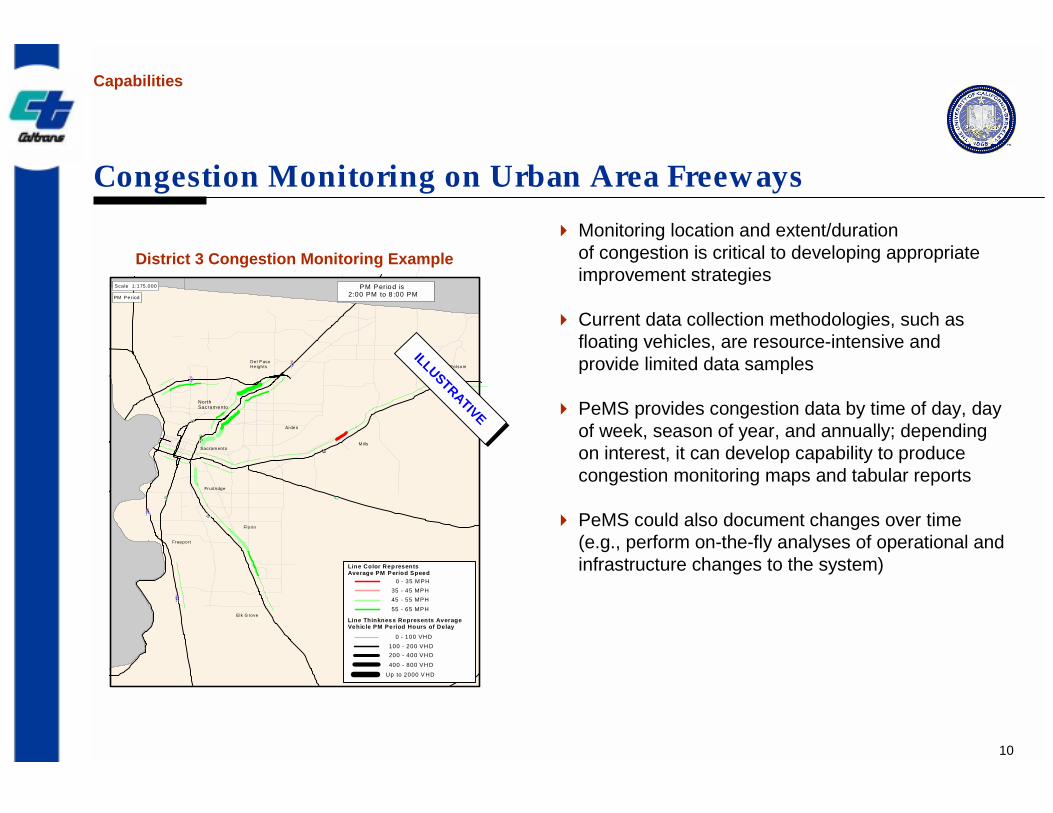
Congestion Monitoring on Urban Area Freeways� Monitoring location and extent/duration
of congestion is critical to developing appropriate improvement strategies
� Current data collection methodologies, such as floating vehicles, are resource-intensive and provide limited data samples
� PeMS provides congestion data by time of day, day of week, season of year, and annually; depending on interest, it can develop capability to produce congestion monitoring maps and tabular reports
� PeMS could also document changes over time (e.g., perform on-the-fly analyses of operational and infrastructure changes to the system)
Sacram ento
Folsom
Elk G rove
Arden
Florin
Freeport
Del PasoHeights
North Sacram ento
Mills
Fruitridge
<=D
<=u <=»
)u
!"#@
!"#E
<=u
123k
!"#@
!"#E
0 - 100 VHD100 - 200 VH D200 - 400 VH D400 - 800 VH D
Up to 2000 V HD
Line Thinkness Represents AverageVehicle PM Period Hours of Delay
0 - 35 M PH35 - 45 MPH45 - 55 MPH55 - 65 MPH
Line Color RepresentsAverage PM Period Speed
Scale 1:175,000 PM Period is 2:00 PM to 8 :00 PMPM Period
District 3 Congestion Monitoring Example
ILLUSTRATIVE
ILLUSTRATIVE
Capabilities
11
Performance Measures Initiative
� It is difficult to improve existing highway system operations without measuring the performance of past efforts and existing conditions
� Over the last two years, Caltrans has undertaken a statewide performance measurement initiative and begun to incorporate performance measurement in planning and decision-making
� Over the next few months, PeMS will be updated to measure mobility and reliability consistent with the methodologies suggested by the performance measurement initiative:– Mobility can be measured as the average point-to-point travel time and is reduced by travel delay– Reliability is defined as the day-to-day variability between the expected average travel time and the actual
travel time
� PeMS can be designed to estimate these performance measures using data directly from the sensors reported through TMCs– User could see how mobility and reliability change over time for individual freeway corridors and different
time intervals
Capabilities
12
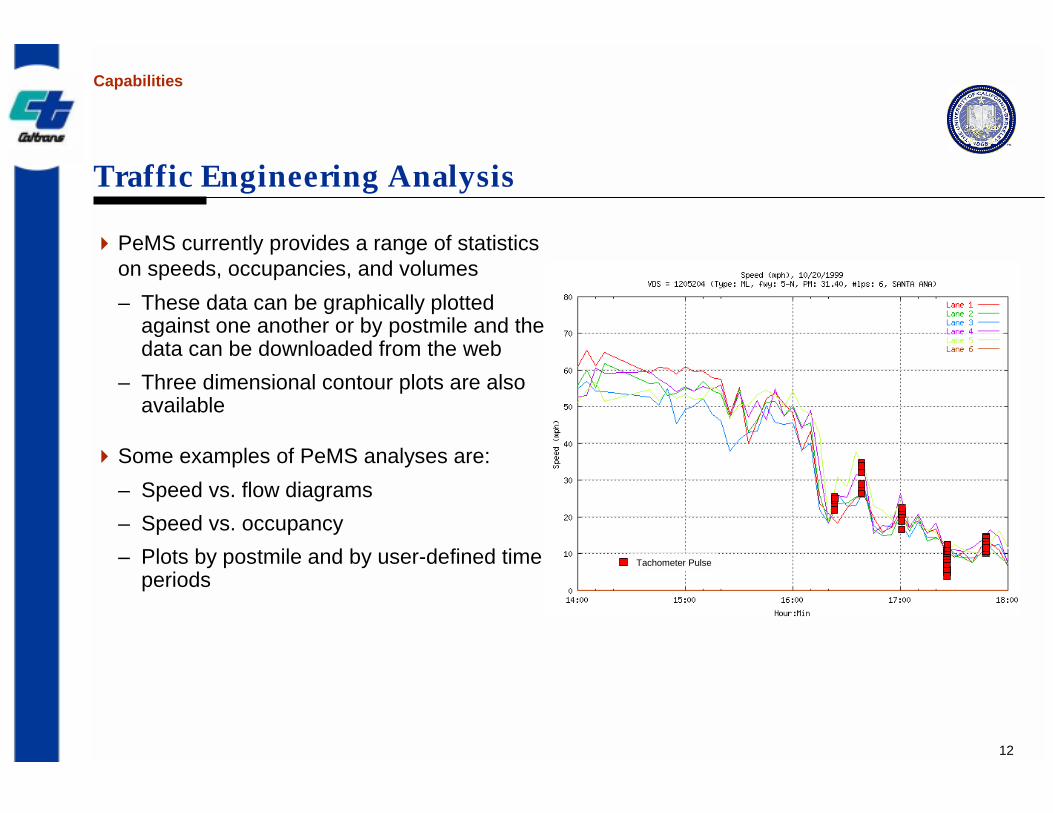
Traffic Engineering Analysis
�PeMS currently provides a range of statistics on speeds, occupancies, and volumes– These data can be graphically plotted
against one another or by postmile and the data can be downloaded from the web
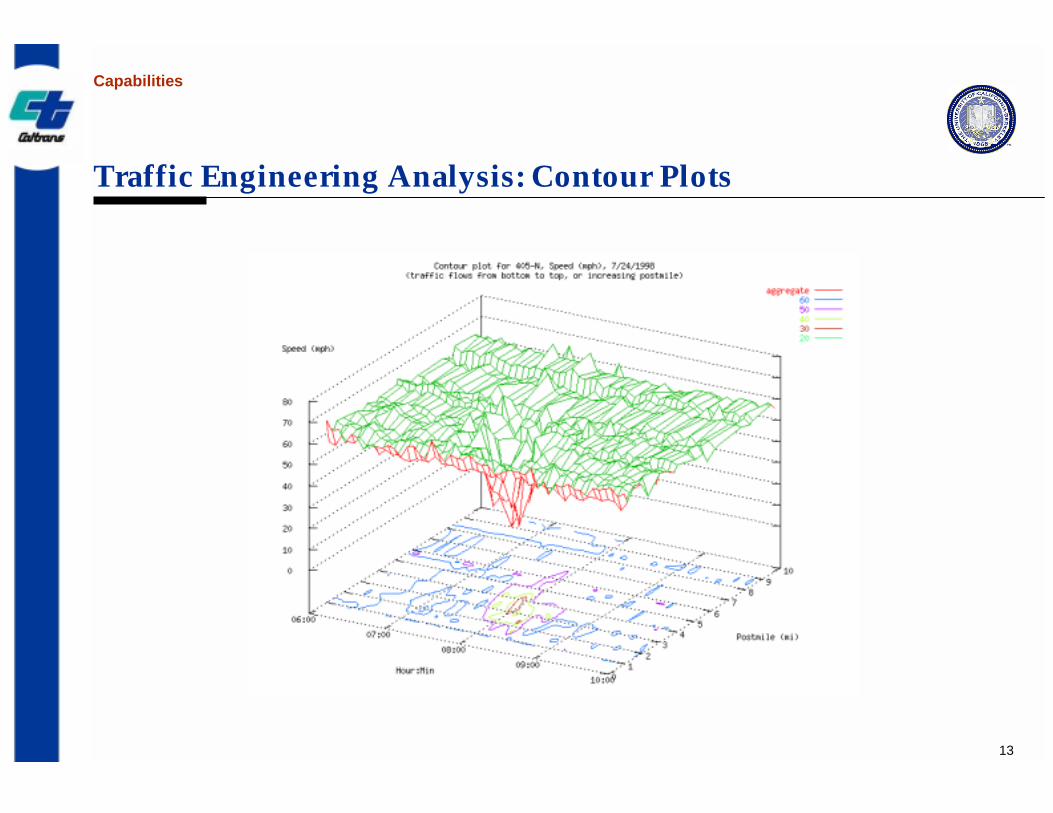
– Three dimensional contour plots are also available
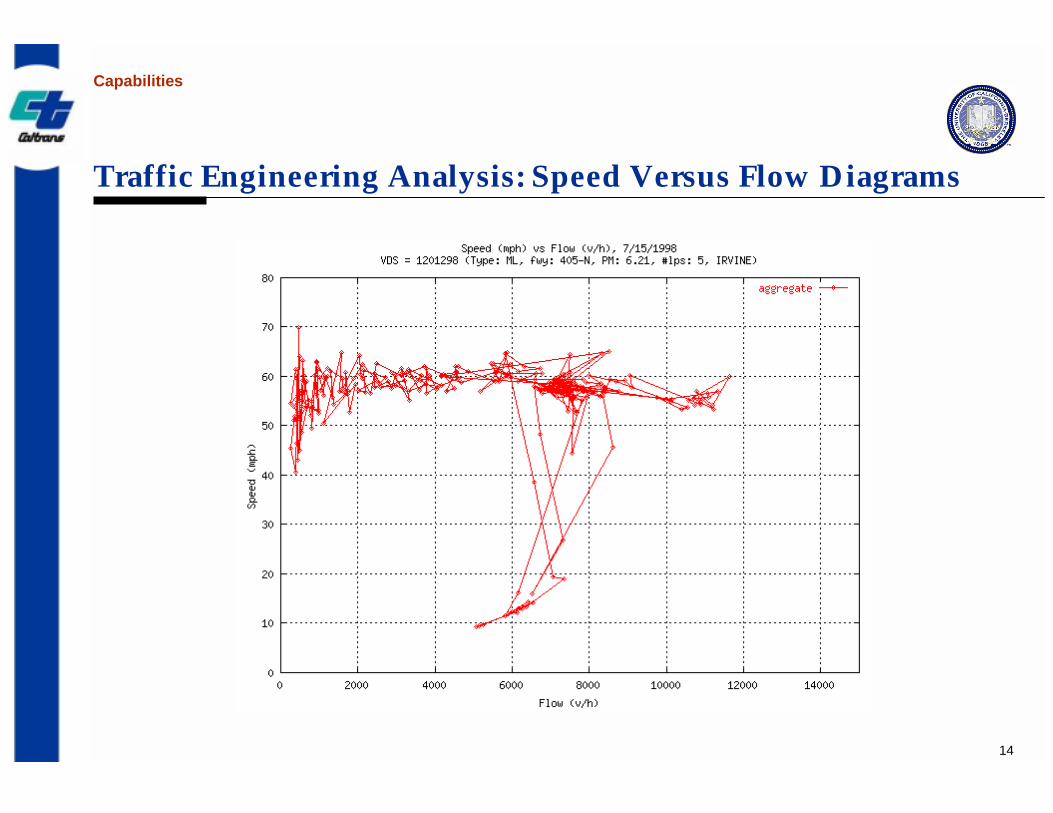
�Some examples of PeMS analyses are:– Speed vs. flow diagrams– Speed vs. occupancy– Plots by postmile and by user-defined time
periods
Capabilities
Tachometer Pulse
13
Traffic Engineering Analysis: Contour Plots
Capabilities
14
Traffic Engineering Analysis: Speed Versus Flow Diagrams
Capabilities
15
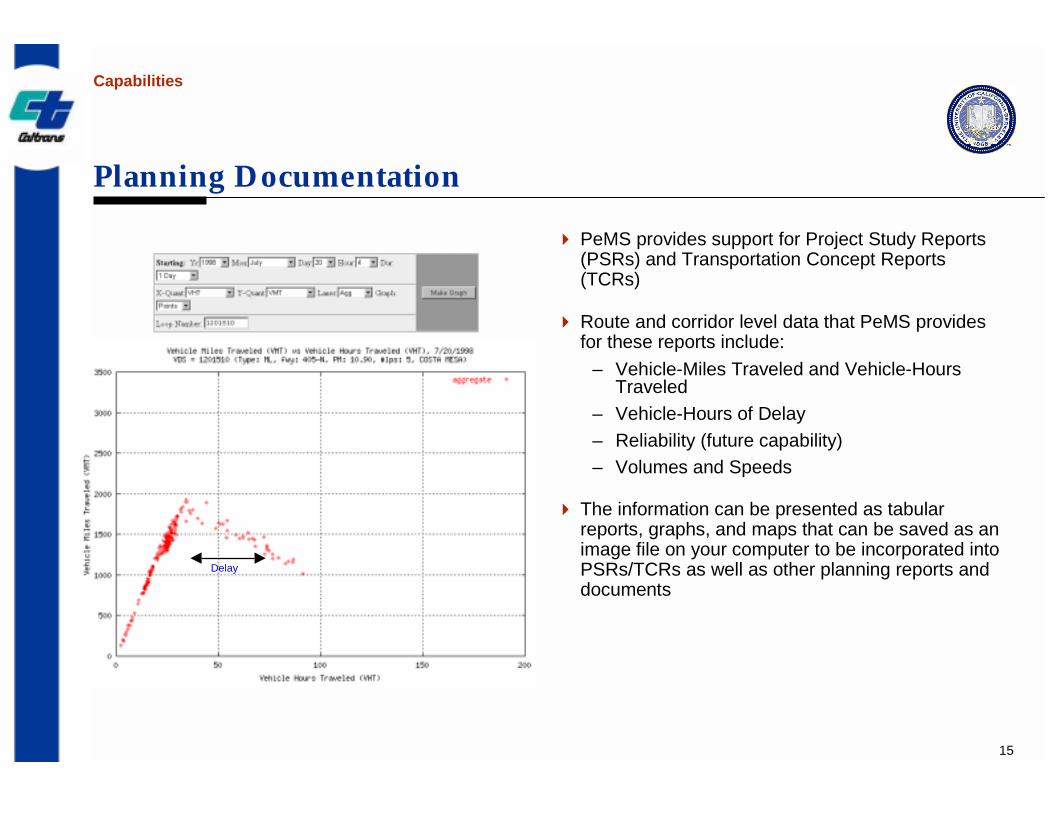
Planning Documentation
� PeMS provides support for Project Study Reports (PSRs) and Transportation Concept Reports (TCRs)
� Route and corridor level data that PeMS provides for these reports include:
– Vehicle-Miles Traveled and Vehicle-Hours Traveled
– Vehicle-Hours of Delay– Reliability (future capability)– Volumes and Speeds
� The information can be presented as tabular reports, graphs, and maps that can be saved as an image file on your computer to be incorporated into PSRs/TCRs as well as other planning reports and documents
Capabilities
Delay
16
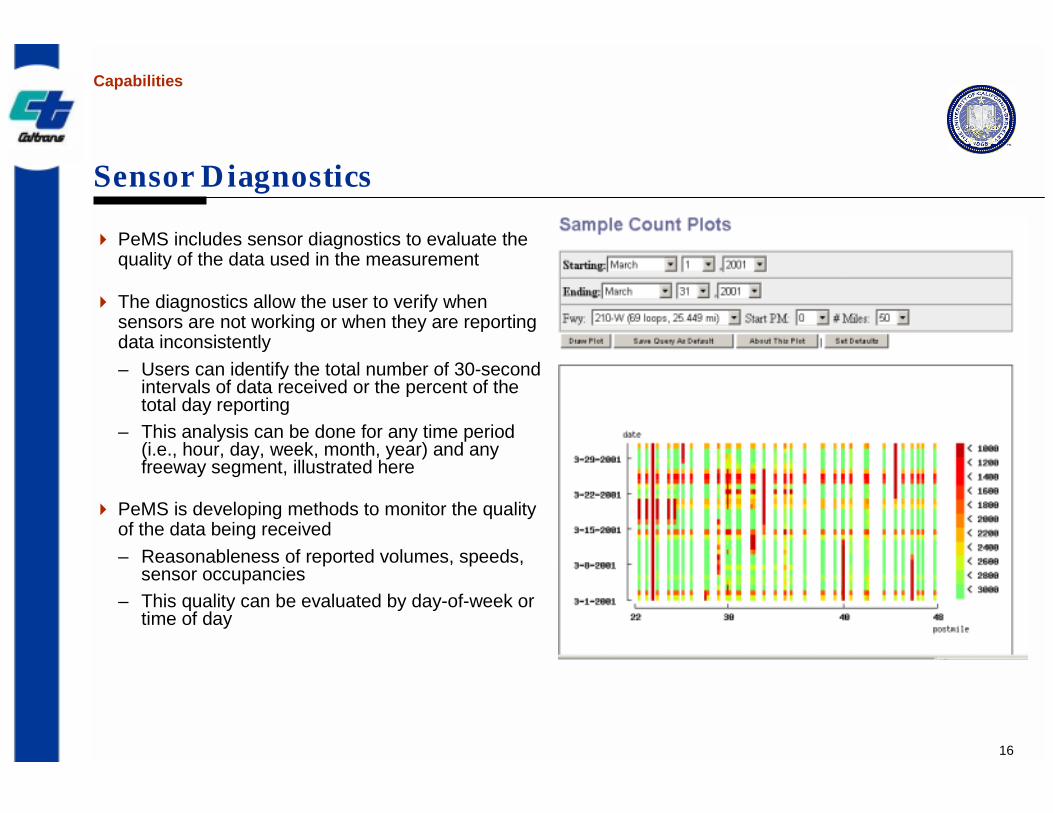
Sensor Diagnostics
� PeMS includes sensor diagnostics to evaluate the quality of the data used in the measurement
� The diagnostics allow the user to verify when sensors are not working or when they are reporting data inconsistently– Users can identify the total number of 30-second
intervals of data received or the percent of the total day reporting
– This analysis can be done for any time period (i.e., hour, day, week, month, year) and any freeway segment, illustrated here
� PeMS is developing methods to monitor the quality of the data being received– Reasonableness of reported volumes, speeds,
sensor occupancies– This quality can be evaluated by day-of-week or
time of day
Capabilities
17
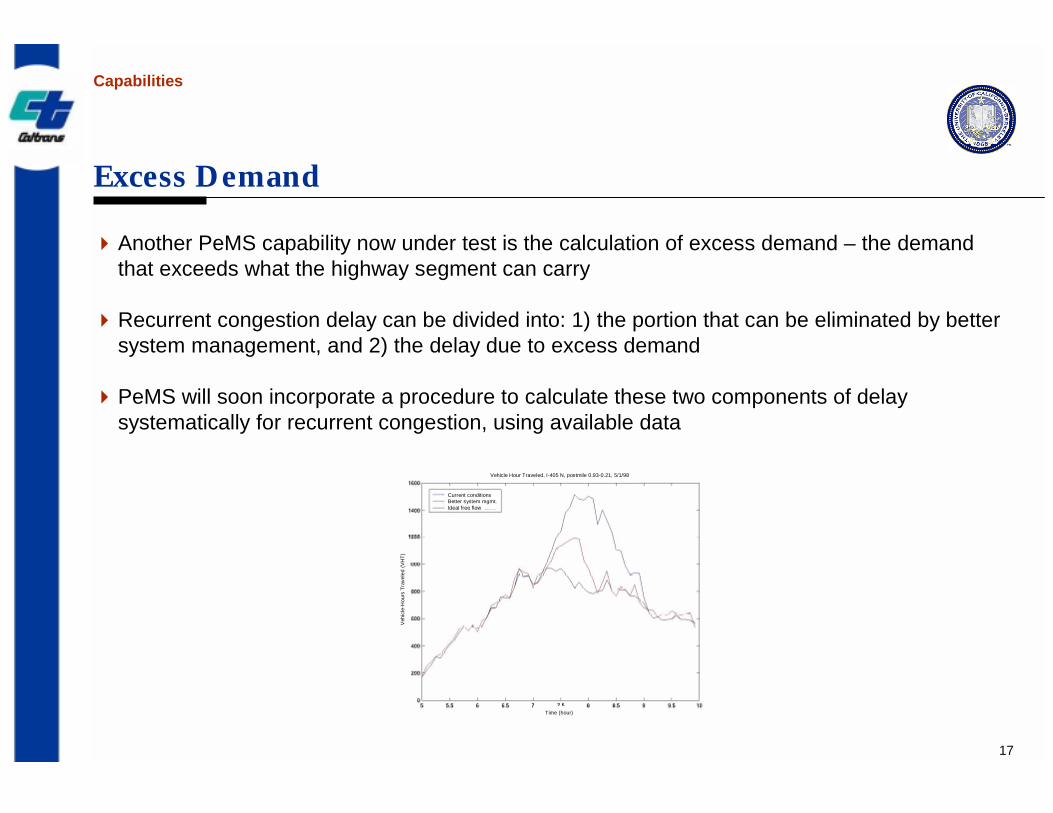
Excess Demand
�Another PeMS capability now under test is the calculation of excess demand – the demand that exceeds what the highway segment can carry
�Recurrent congestion delay can be divided into: 1) the portion that can be eliminated by better system management, and 2) the delay due to excess demand
�PeMS will soon incorporate a procedure to calculate these two components of delay systematically for recurrent congestion, using available data
Capabilities
Current conditionsBetter system mgmt.Ideal free flow
Vehicle Hour Traveled, I-405 N, postmile 0.93-0.21, 5/1/98
Time (hour)
Veh
icle
-Hou
rs T
rave
led
(VH
T)
18
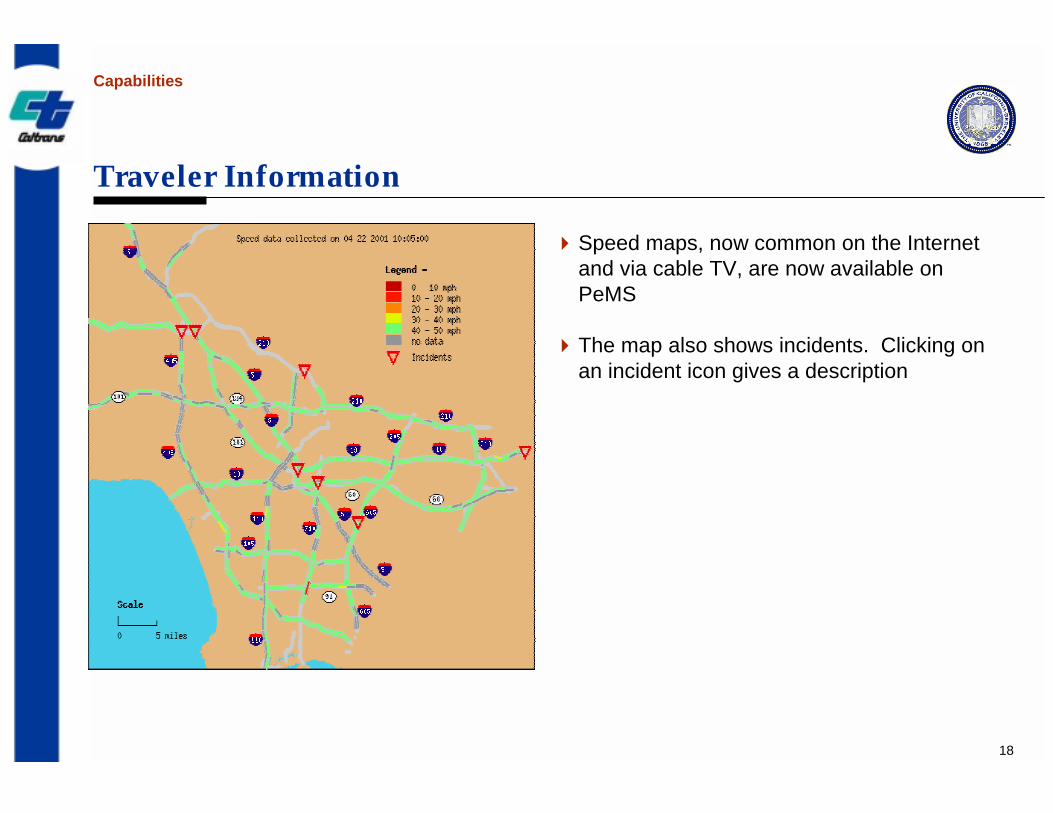
Traveler Information
�Speed maps, now common on the Internet and via cable TV, are now available on PeMS
�The map also shows incidents. Clicking on an incident icon gives a description
Capabilities
19
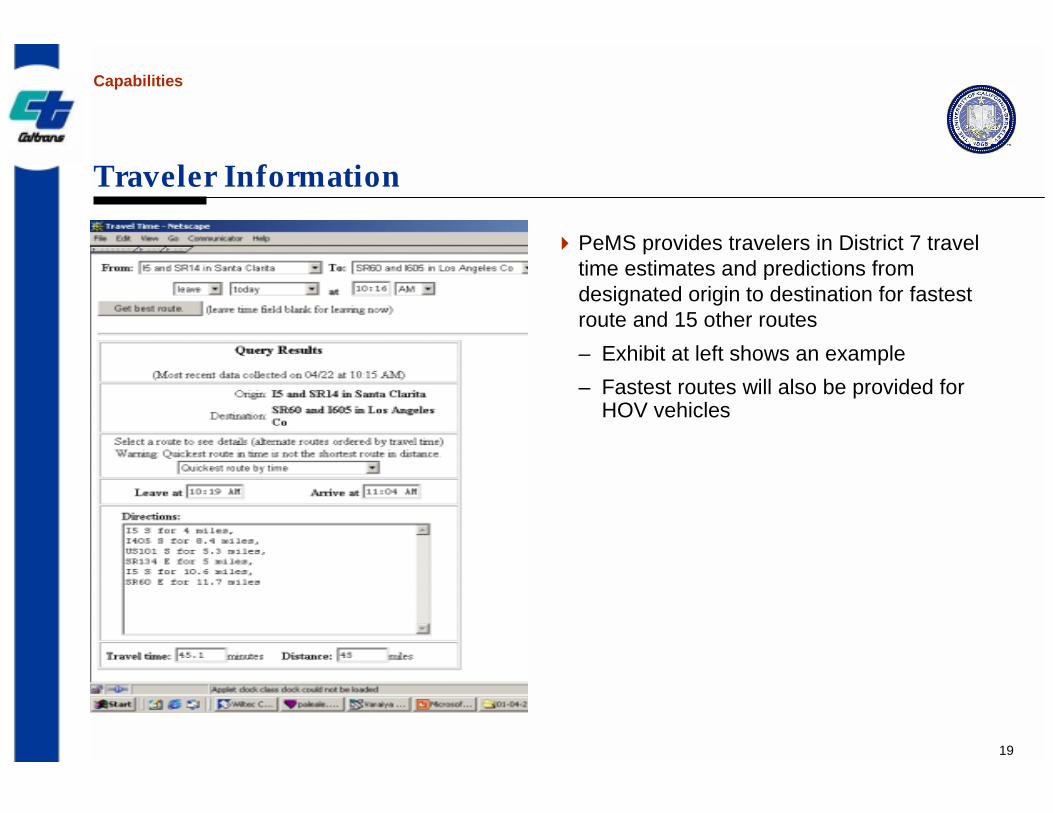
Traveler Information
�PeMS provides travelers in District 7 travel time estimates and predictions from designated origin to destination for fastest route and 15 other routes– Exhibit at left shows an example – Fastest routes will also be provided for
HOV vehicles
Capabilities
20
Longer-Term Capabilities
� PeMS could include incident detection and prediction information– This information can assist TMC staff to identify potential incident “hot spots” based on real-time analysis– Historical traffic characteristics, incidents, and other data such as weather conditions can be used to
develop statistical prediction rules that can provide probabilities that incidents may occur at particular locations under current conditions
� For planners, PeMS could help with large-scale analysis. For example, traffic conditions can be presented alongside regional demographic and survey data to identify trends in system use
� At some future date, PeMS may improve the accuracy of transit information– For example transit traveler information systems currently under development (e.g., TravInfo and NextBus
in the San Francisco Bay Area and Transtar in Southern California) may provide better transit travel time information
� Also in the future, PeMS may incorporate video data produced, for example, in the Berkeley Highway Lab
Capabilities
21
Example study: Air quality
�Determine speed correction factors for emissions using data from “chase” car on test segments
� Issue: what is the LoS on test segments?
�Solution– Match segments with PeMS database; extract and process loop data for volumes, speed,
occupancies– Determine LoS– Select additional segments with “desired” LoS for further data collection
Capabilities
22
Areas for Feedback
�Who do you envision as most likely to use PeMS?– Planners– Engineers– Others
�How do you anticipate they would use the tool?
�What are currently the most useful and least useful features of PeMS?
�What enhancements do you suggest?
�How can PeMS be better tailored to assist in engineering analyses? Planning studies?
Your Feedback
23
Areas for Feedback (continued)
�What are useful levels of aggregating data?– Corridor– Loop-to-loop– TCR segmentation
�How should “bad” or missing sensor data be handled?– What is the definition of “bad” data?– Should missing data be ignored or estimated?– If missing data are estimated, what method should be used?
� Is there a need to conduct analyses across districts?– Statewide analyses– Routes that cross district boundaries
Your Feedback
24
Areas for Feedback (continued)
�How useful are mapping capabilities, such as zooming on analysis areas, for conducting planning/engineering analyses?
�Would you like to be able to export PeMS data rather than rely solely on the user interface?
�What additional tools should we consider linking to the PeMS interface (e.g., ArcView, SAS, modeling programs, MATLAB)?
Send us examples of analyses you would like included in PeMS (e.g., graphs commonly used, PSRs/TCRs, local HICOMP reports)
Your Feedback
25
Appendix
�Forums for Providing Input
�How to Access PeMS
�Web Site Layout
26
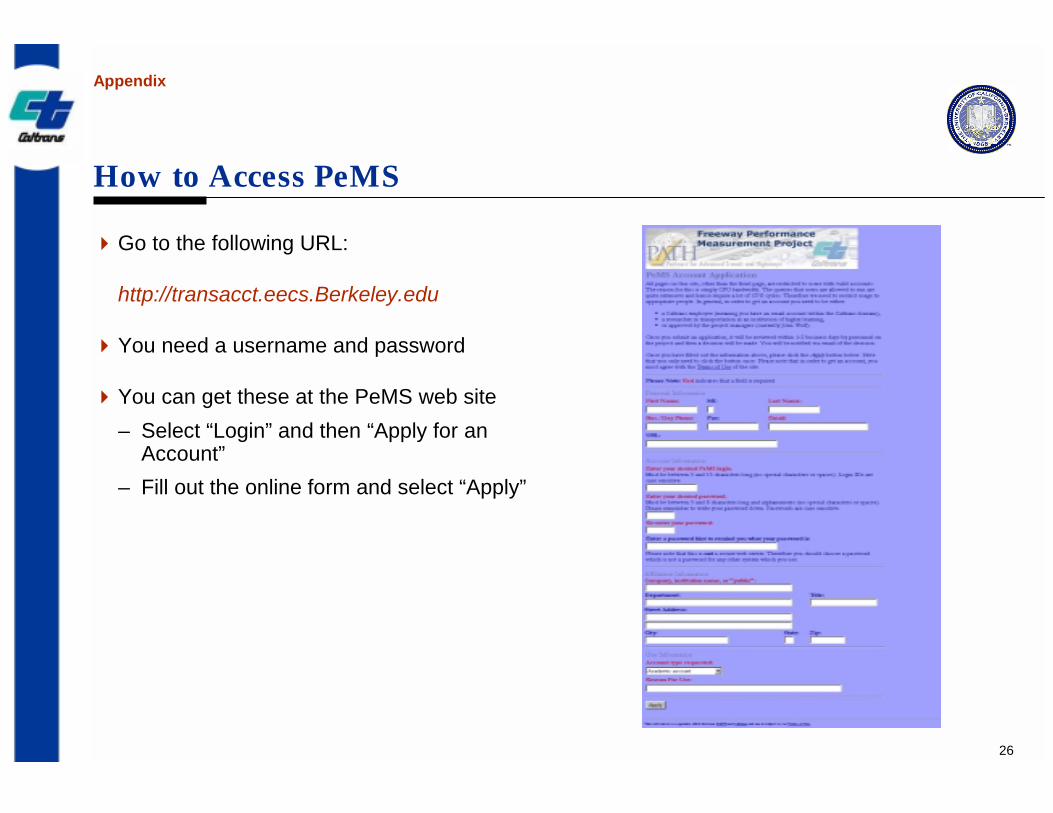
How to Access PeMS
Appendix
�Go to the following URL:
http://transacct.eecs.Berkeley.edu
�You need a username and password
�You can get these at the PeMS web site– Select “Login” and then “Apply for an
Account”– Fill out the online form and select “Apply”
27
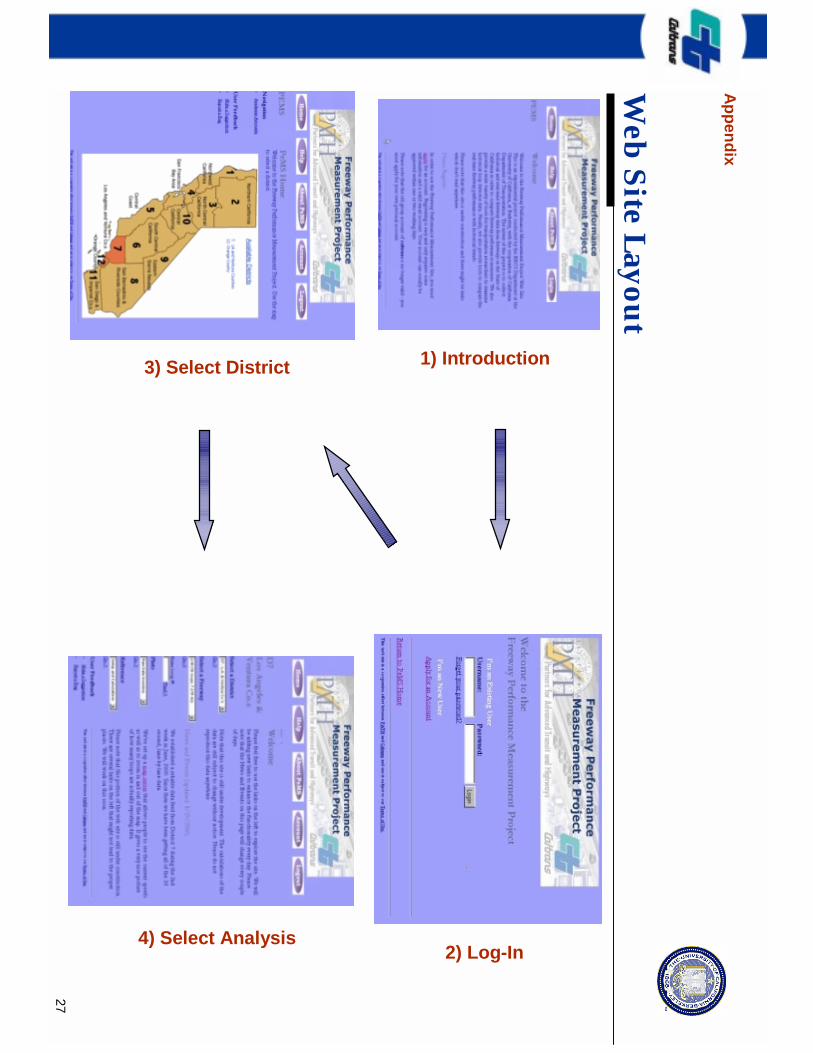
Web Site Layout
Appendix
1) Introduction
2) Log-In
3) Select District
4) Select Analysis
28
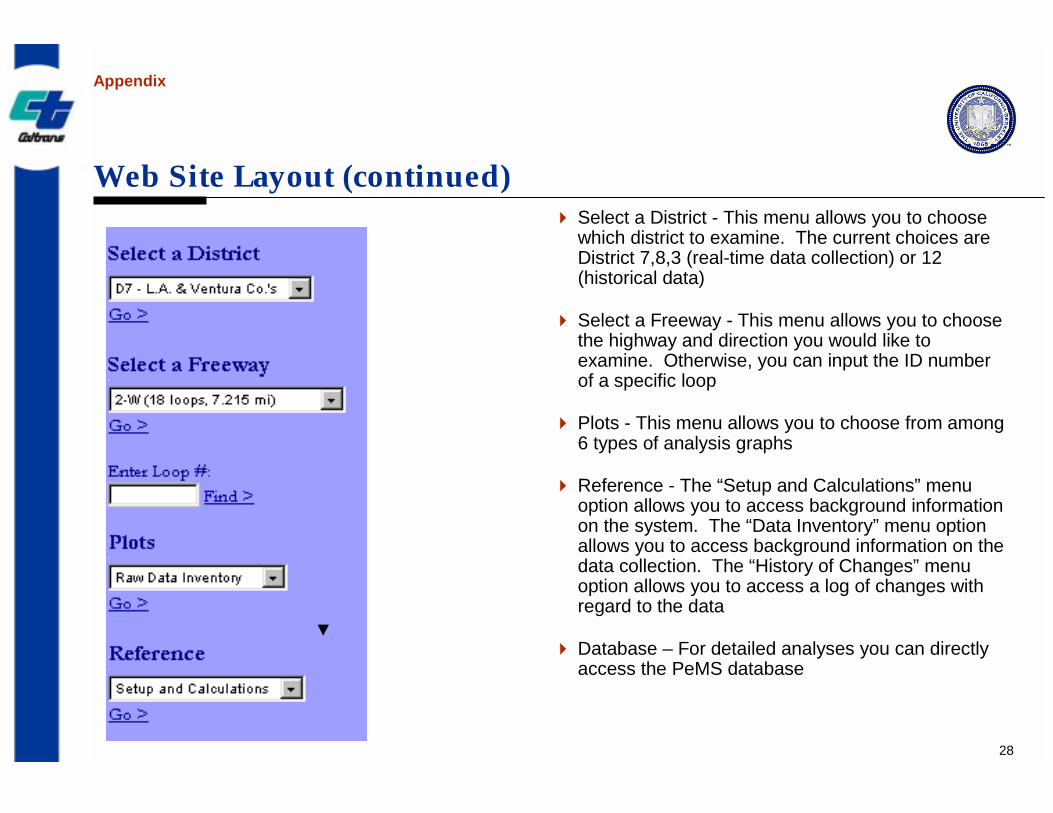
Web Site Layout (continued)� Select a District - This menu allows you to choose
which district to examine. The current choices are District 7,8,3 (real-time data collection) or 12 (historical data)
� Select a Freeway - This menu allows you to choose the highway and direction you would like to examine. Otherwise, you can input the ID number of a specific loop
� Plots - This menu allows you to choose from among 6 types of analysis graphs
� Reference - The “Setup and Calculations” menu option allows you to access background information on the system. The “Data Inventory” menu option allows you to access background information on the data collection. The “History of Changes” menu option allows you to access a log of changes with regard to the data
� Database – For detailed analyses you can directly access the PeMS database
Appendix