Embed Size (px)
Citation preview
MARKETVIEW
Occupier and investment markets
enjoy steady start to the year
Asia Pacific, Q1 2017
OFFICE
RETAIL
LOGISTICS
INVESTMENT
Q1 2017 CBRE Research © CBRE Inc. 2017 | 1
Quick Stats
Office q-o-q y-o-y
Rent +0.6% +2.1%
Capital value +0.7% +4.7%
Retail q-o-q y-o-y
Rent + 0.6% + 1.0%
Capital value +0.6% +3.1%
Logistics q-o-q y-o-y
Rent +0.2% +0.6%
Capital value +0.9% +5.6%
Investment* q-o-q y-o-y
Total volume -39% +6.2%
Cross-border -38% +33%
Source: CBRE Research, Q1 2017.
*Transactions include deals above US$10
million in the office, retail, mixed, industrial,
hotel and other commercial sectors
+4.4% in 2017F Q2 2017 +4.1% in 2017F
MARKETVIEW
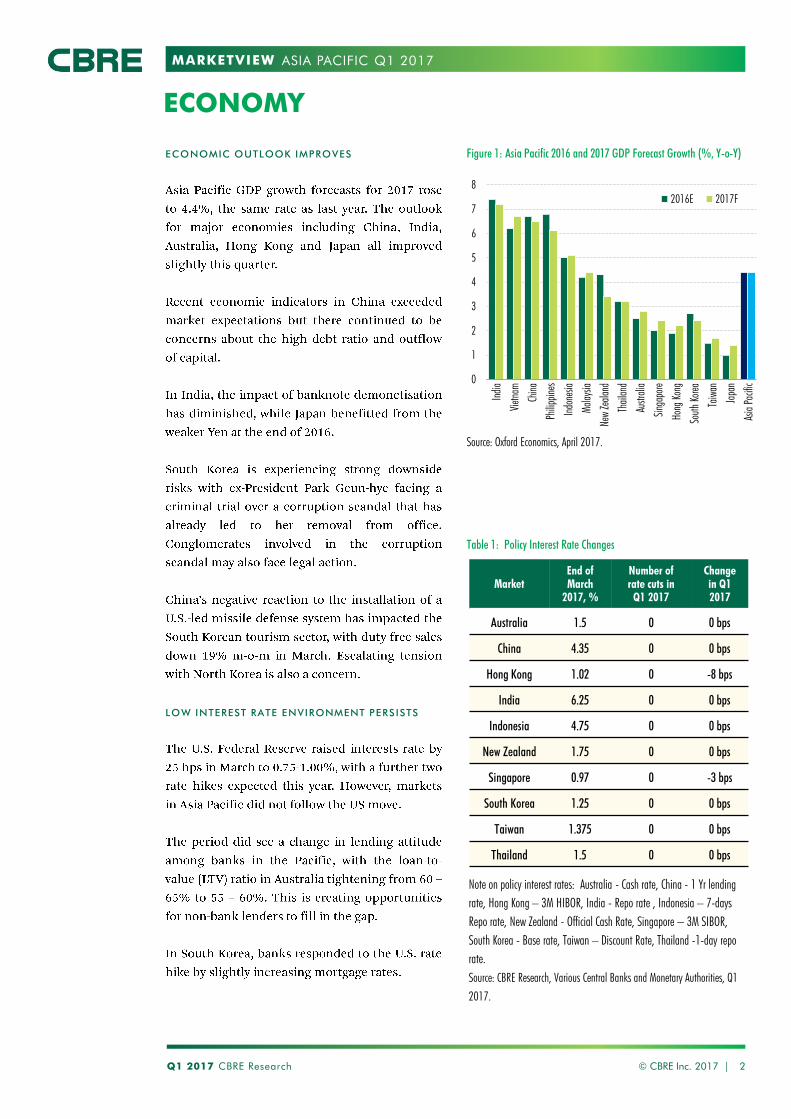
ECONOMIC OUTLOOK IMPROVES
LOW INTEREST RATE ENVIRONMENT PERSISTS
Figure 1: Asia Pacific 2016 and 2017 GDP Forecast Growth (%, Y-o-Y)
Q1 2017 CBRE Research © CBRE Inc. 2017 | 2
ASIA PACIFIC Q1 2017
Table 1: Policy Interest Rate Changes
Source: Oxford Economics, April 2017.
Note on policy interest rates: Australia - Cash rate, China - 1 Yr lending
rate, Hong Kong – 3M HIBOR, India - Repo rate , Indonesia – 7-days
Repo rate, New Zealand - Official Cash Rate, Singapore – 3M SIBOR,
South Korea - Base rate, Taiwan – Discount Rate, Thailand -1-day repo
rate.
Source: CBRE Research, Various Central Banks and Monetary Authorities, Q1
2017.
ECONOMY
Market
End of
March
2017, %
Number of
rate cuts in
Q1 2017
Change
in Q1
2017
Australia 1.5 0 0 bps
China 4.35 0 0 bps
Hong Kong 1.02 0 -8 bps
India 6.25 0 0 bps
Indonesia 4.75 0 0 bps
New Zealand 1.75 0 0 bps
Singapore 0.97 0 -3 bps
South Korea 1.25 0 0 bps
Taiwan 1.375 0 0 bps
Thailand 1.5 0 0 bps
0
1
2
3
4
5
6
7
8
India
Vie
tnam
Chin
a
Philip
pin
es
Indonesia
Mala
ysia
New
Zeala
nd
Thailand
Austr
alia
Sin
gapore
Hong K
ong
South
Kore
a
Taiw
an
Japan
Asia
Pacific
2016E 2017F
MARKETVIEW
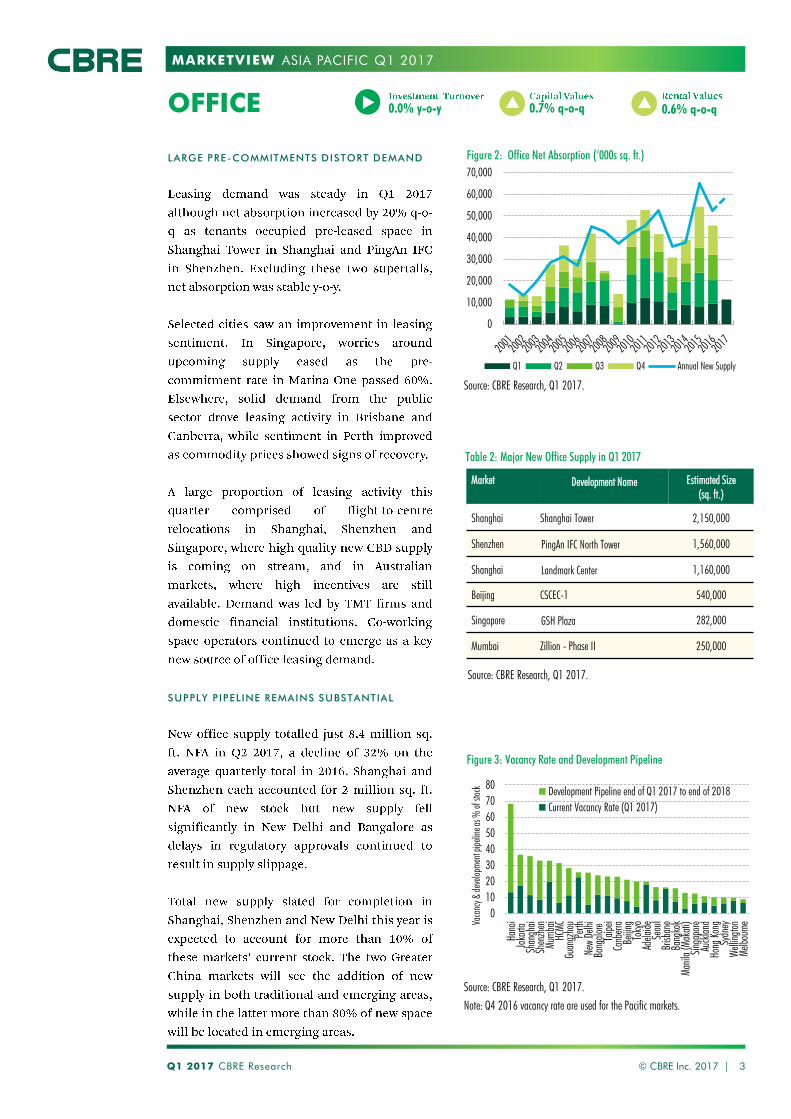
Figure 2: Office Net Absorption (‘000s sq. ft.)
© CBRE Inc. 2017 | 3
ASIA PACIFIC Q1 2017
Table 2: Major New Office Supply in Q1 2017
Figure 3: Vacancy Rate and Development Pipeline
Source: CBRE Research, Q1 2017.
Source: CBRE Research, Q1 2017.
Source: CBRE Research, Q1 2017.
Note: Q4 2016 vacancy rate are used for the Pacific markets.
OFFICE 0.0% y-o-y 0.7% q-o-q 0.6% q-o-q
Q1 2017 CBRE Research
LARGE PRE-COMMITMENTS DISTORT DEMAND
SUPPLY PIPELINE REMAINS SUBSTANTIAL
0
10,000
20,000
30,000
40,000
50,000
60,000
70,000
Q1 Q2 Q3 Q4 Annual New Supply
Market Development Name Estimated Size
(sq. ft.)
Shanghai Shanghai Tower 2,150,000
Shenzhen PingAn IFC North Tower 1,560,000
Shanghai Landmark Center 1,160,000
Beijing CSCEC-1 540,000
Singapore GSH Plaza 282,000
Mumbai Zillion - Phase II 250,000
0
10
20
30
40
50
60
70
80
Hanoi
Jakart
a
Shanghai
Shenzhen
Mum
bai
HCM
C
Guangzhou
Pert
h
New
Delh
i
Bangalo
re
Taip
ei
Canberr
a
Beijin
g
Tokyo
Adela
ide
Seoul
Brisbane
Bangkok
Manila (
Makati)
Sin
gapore
Auckla
nd
Hong K
ong
Sydney
Wellin
gto
n
Melb
ourn
eVacancy &
develo
pm
ent pip
eline a
s %
of sto
ck
Development Pipeline end of Q1 2017 to end of 2018
Current Vacancy Rate (Q1 2017)
MARKETVIEW
Figure 4: Asia Pacific Vacancy Rate (%)
Q1 2017 CBRE Research © CBRE Inc. 2017 | 4
ASIA PACIFIC Q1 2017
Figure 5: Asia Pacific Office Rental and Capital Value Index
Figure 6: Strongest Grade A Rental Growth, Q-o-Q
Source: CBRE Research, Q1 2017.
Source: CBRE Research, Q1 2017.
Source: CBRE Research, Q1 2017.
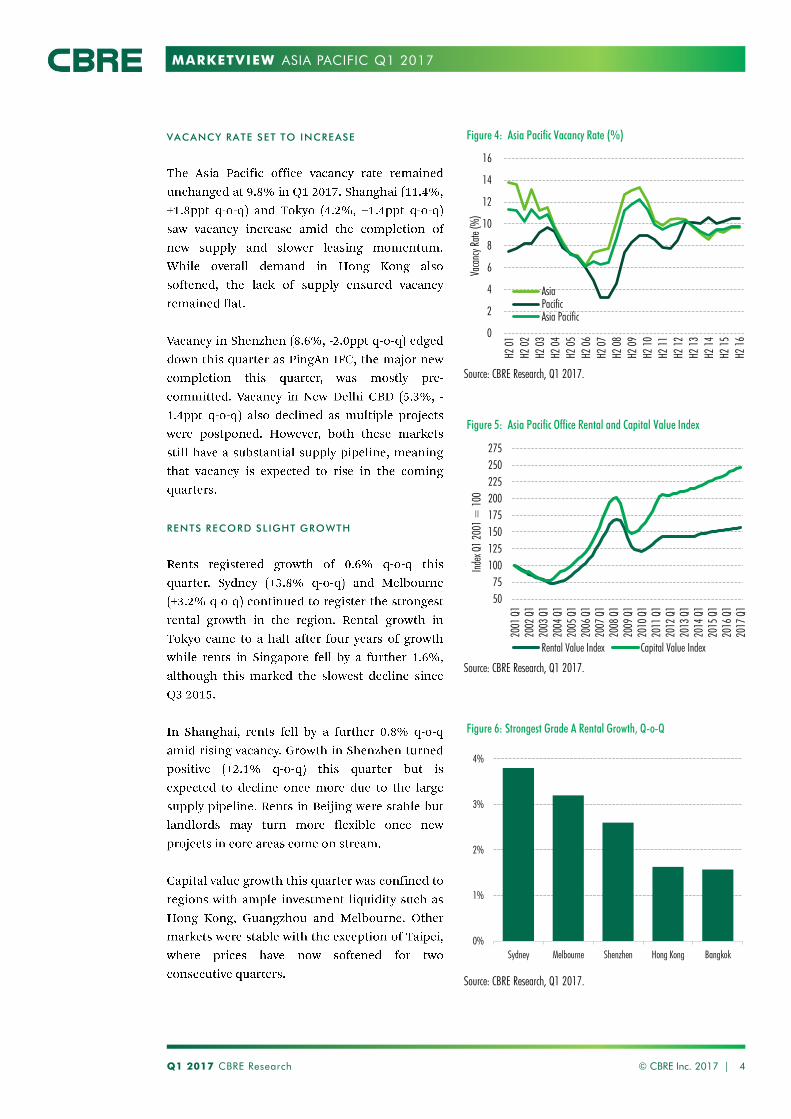
VACANCY RATE SET TO INCREASE
RENTS RECORD SLIGHT GROWTH
0
2
4
6
8
10
12
14
16
H2
01
H2
02
H2
03
H2
04
H2
05
H2
06
H2
07
H2
08
H2
09
H2 1
0
H2
11
H2
12
H2
13
H2
14
H2 1
5
H2
16
Vacancy R
ate
(%
)
Asia
Pacific
Asia Pacific
50
75
100
125
150
175
200
225
250
275
200
1 Q
1
200
2 Q
1
200
3 Q
1
200
4 Q
1
200
5 Q
1
200
6 Q
1
200
7 Q
1
200
8 Q
1
200
9 Q
1
201
0 Q
1
201
1 Q
1
201
2 Q
1
201
3 Q
1
201
4 Q
1
201
5 Q
1
201
6 Q
1
201
7 Q
1
Index Q
1 2
00
1 =
100
Rental Value Index Capital Value Index
0%
1%
2%
3%
4%
Sydney Melbourne Shenzhen Hong Kong Bangkok
MARKETVIEW
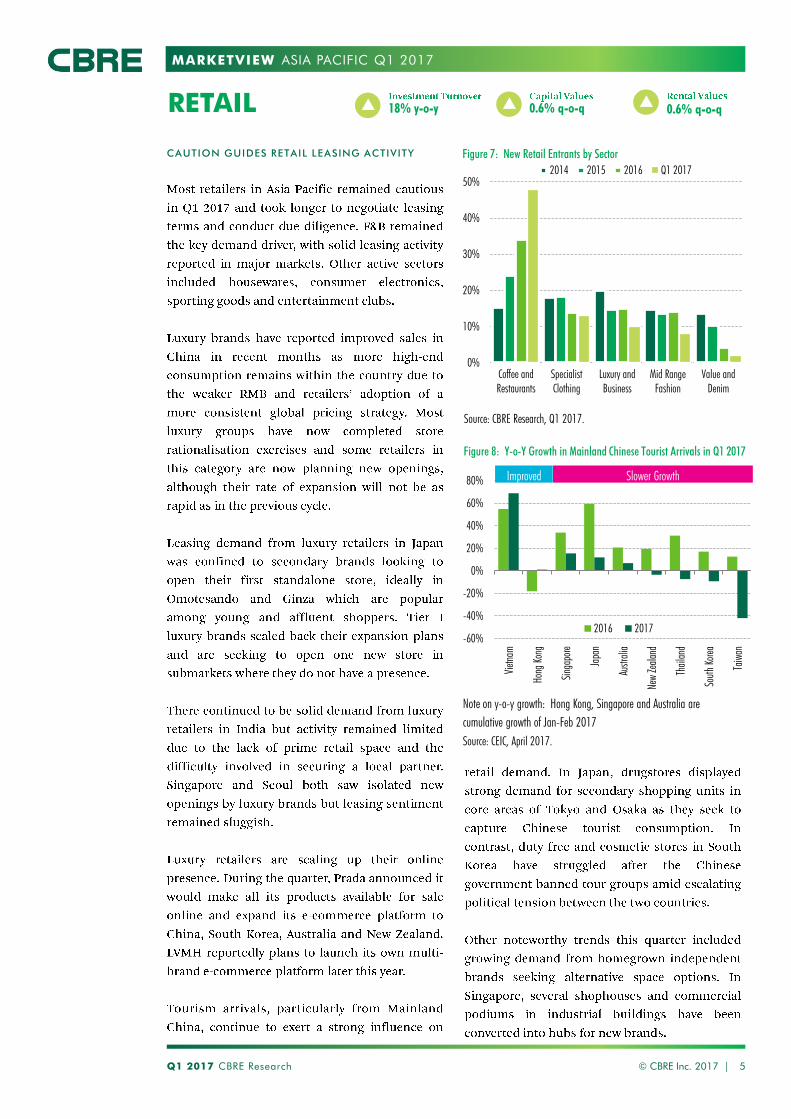
CAUTION GUIDES RETAIL LEASING ACTIVITY
Figure 8: Y-o-Y Growth in Mainland Chinese Tourist Arrivals in Q1 2017
Q1 2017 CBRE Research © CBRE Inc. 2017 | 5
ASIA PACIFIC Q1 2017
Source: CBRE Research, Q1 2017.
0%
10%
20%
30%
40%
50%
Coffee and
Restaurants
Specialist
Clothing
Luxury and
Business
Mid Range
Fashion
Value and
Denim
2014 2015 2016 Q1 2017
RETAIL 18% y-o-y 0.6% q-o-q 0.6% q-o-q
Figure 7: New Retail Entrants by Sector
-60%
-40%
-20%
0%
20%
40%
60%
80%
Vie
tnam
Hong K
ong
Sin
gapore
Japan
Austr
alia
New
Zeala
nd
Thailand
South
Kore
a
Taiw
an
2016 2017
Note on y-o-y growth: Hong Kong, Singapore and Australia are
cumulative growth of Jan-Feb 2017
Source: CEIC, April 2017.
Improved Slower Growth
MARKETVIEW
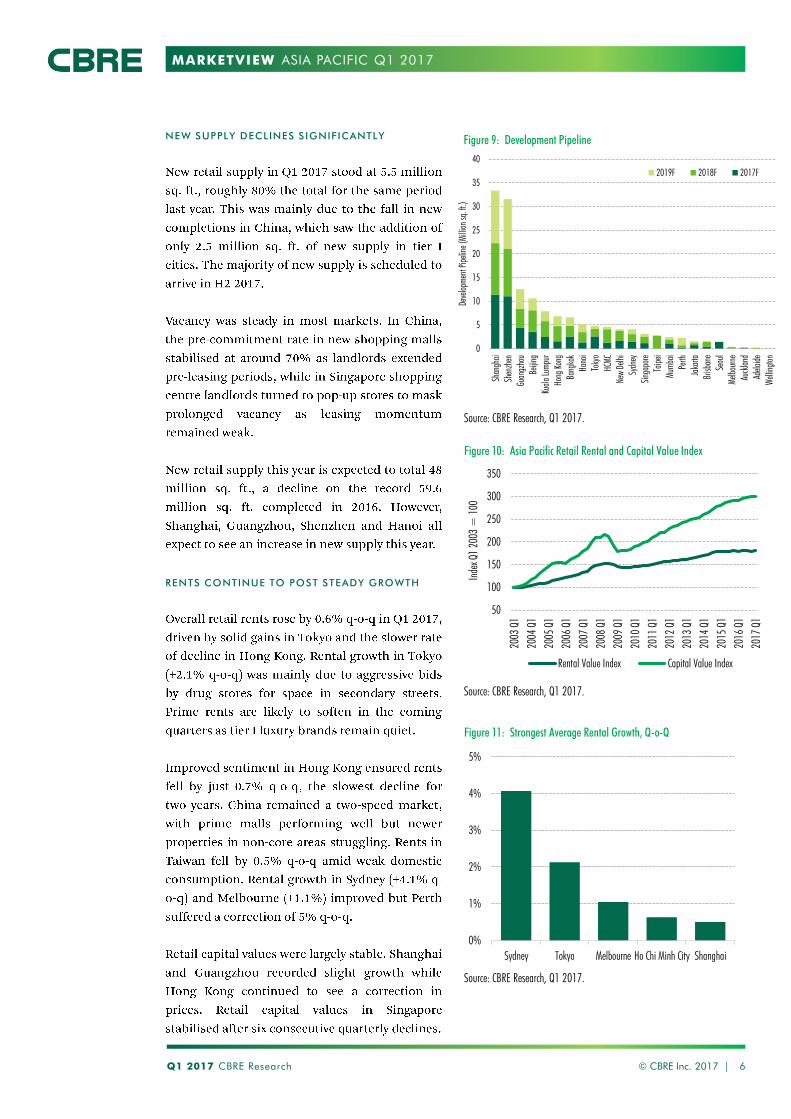
NEW SUPPLY DECLINES SIGNIFICANTLY
RENTS CONTINUE TO POST STEADY GROWTH
Figure 10: Asia Pacific Retail Rental and Capital Value Index
Q1 2017 CBRE Research © CBRE Inc. 2017 | 6
ASIA PACIFIC Q1 2017
Figure 11: Strongest Average Rental Growth, Q-o-Q
Figure 9: Development Pipeline
Source: CBRE Research, Q1 2017.
Source: CBRE Research, Q1 2017.
Source: CBRE Research, Q1 2017.
50
100
150
200
250
300
350
200
3 Q
1
200
4 Q
1
200
5 Q
1
200
6 Q
1
200
7 Q
1
200
8 Q
1
200
9 Q
1
201
0 Q
1
201
1 Q
1
201
2 Q
1
201
3 Q
1
201
4 Q
1
201
5 Q
1
201
6 Q
1
201
7 Q
1
Index Q
1 2
003 =
100
Rental Value Index Capital Value Index
0%
1%
2%
3%
4%
5%
Sydney Tokyo Melbourne Ho Chi Minh City Shanghai
0
5
10
15
20
25
30
35
40
Shanghai
Shenzhen
Guangzhou
Beijin
g
Kuala
Lum
pur
Hong K
ong
Bangkok
Hanoi
Tokyo
HCM
C
New
Delh
i
Sydney
Sin
gapore
Taip
ei
Mum
bai
Pert
h
Jakart
a
Brisbane
Seoul
Melb
ourn
e
Auckla
nd
Adela
ide
Wellin
gto
n
Develo
pm
ent Pip
eline (
Million s
q. ft
.)
2019F 2018F 2017F
MARKETVIEW
Source: CBRE Research, Q1 2017.
Figure 12: Logistics Rental Growth (%)
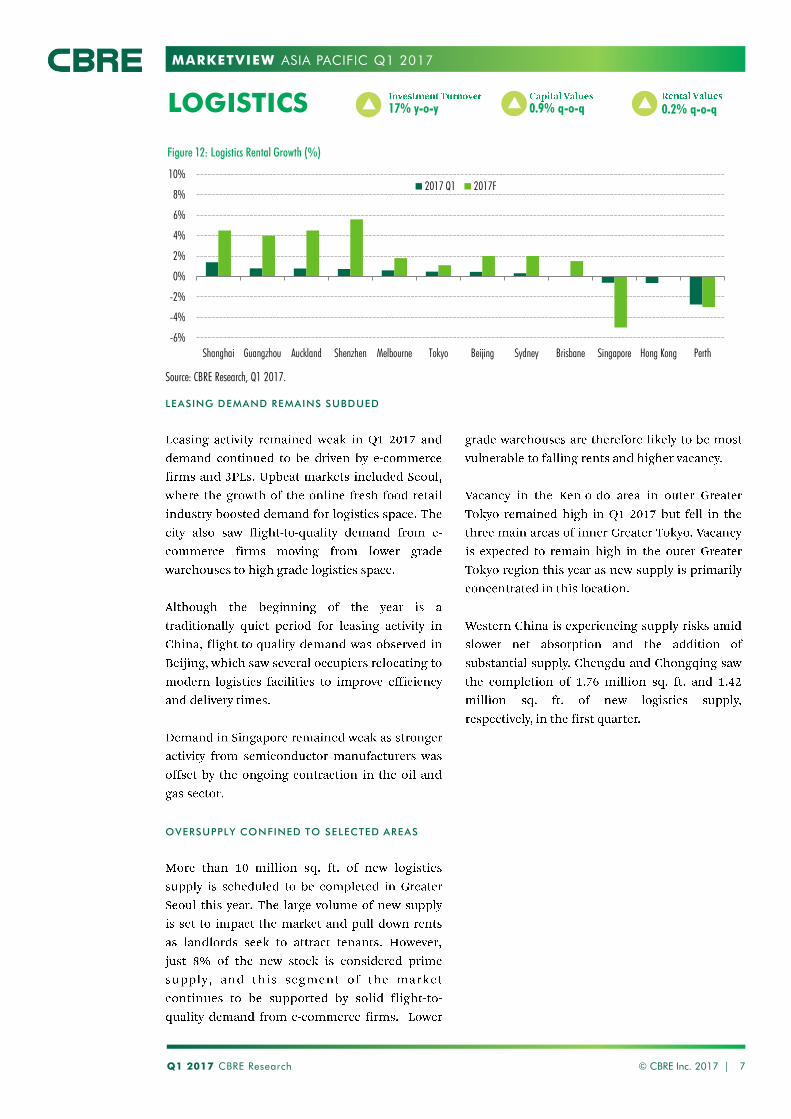
LEASING DEMAND REMAINS SUBDUED
OVERSUPPLY CONFINED TO SELECTED AREAS
Q1 2017 CBRE Research © CBRE Inc. 2017 | 7
ASIA PACIFIC Q1 2017
LOGISTICS 17% y-o-y 0.9% q-o-q 0.2% q-o-q
-6%
-4%
-2%
0%
2%
4%
6%
8%
10%
Shanghai Guangzhou Auckland Shenzhen Melbourne Tokyo Beijing Sydney Brisbane Singapore Hong Kong Perth
2017 Q1 2017F
MARKETVIEW
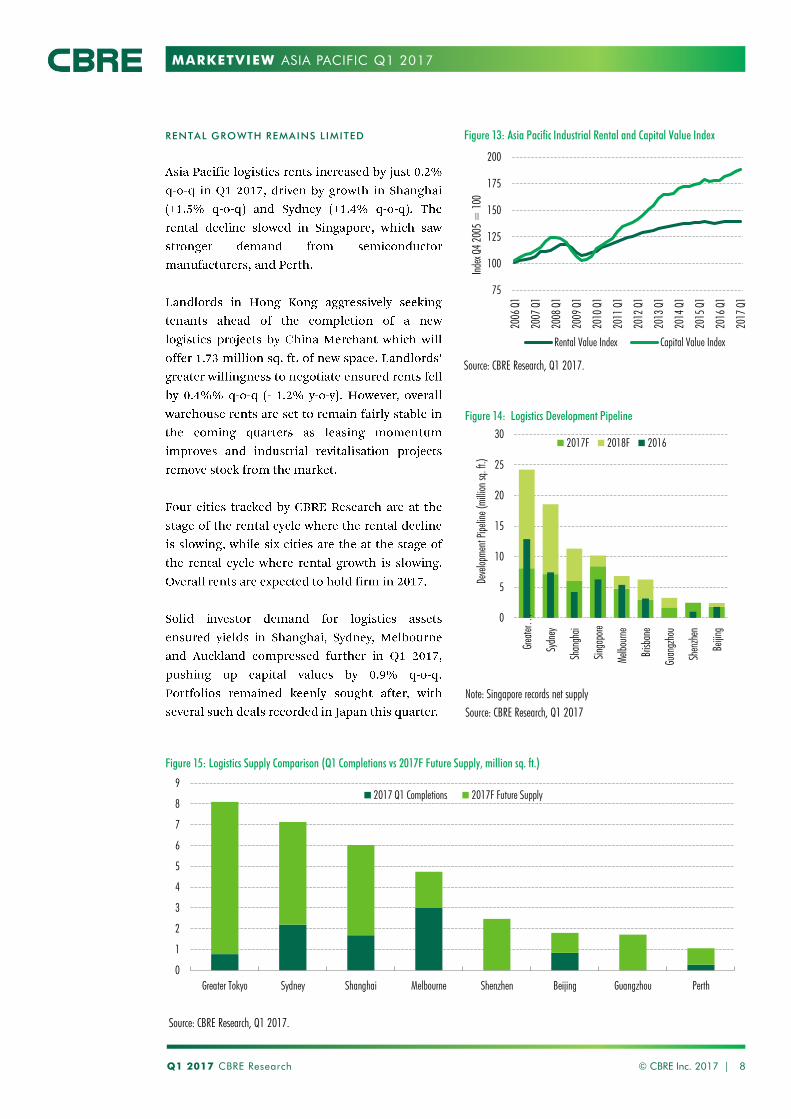
RENTAL GROWTH REMAINS LIMITED Figure 13: Asia Pacific Industrial Rental and Capital Value Index
Q1 2017 CBRE Research © CBRE Inc. 2017 | 8
Source: CBRE Research, Q1 2017.
Figure 15: Logistics Supply Comparison (Q1 Completions vs 2017F Future Supply, million sq. ft.)
Source: CBRE Research, Q1 2017.
ASIA PACIFIC Q1 2017
Figure 14: Logistics Development Pipeline
Note: Singapore records net supply
Source: CBRE Research, Q1 2017
0
5
10
15
20
25
30
Gre
ate
r…
Sydney
Shanghai
Sin
gapore
Melb
ourn
e
Brisbane
Guangzhou
Shenzhen
Beijin
g
Develo
pm
ent
Pip
eline (
million s
q. ft.)
2017F 2018F 2016
0
1
2
3
4
5
6
7
8
9
Greater Tokyo Sydney Shanghai Melbourne Shenzhen Beijing Guangzhou Perth
2017 Q1 Completions 2017F Future Supply
75
100
125
150
175
200
200
6 Q
1
200
7 Q
1
200
8 Q
1
200
9 Q
1
201
0 Q
1
201
1 Q
1
201
2 Q
1
201
3 Q
1
201
4 Q
1
201
5 Q
1
201
6 Q
1
201
7 Q
1
Index Q
4 2
00
5 =
100
Rental Value Index Capital Value Index
MARKETVIEW
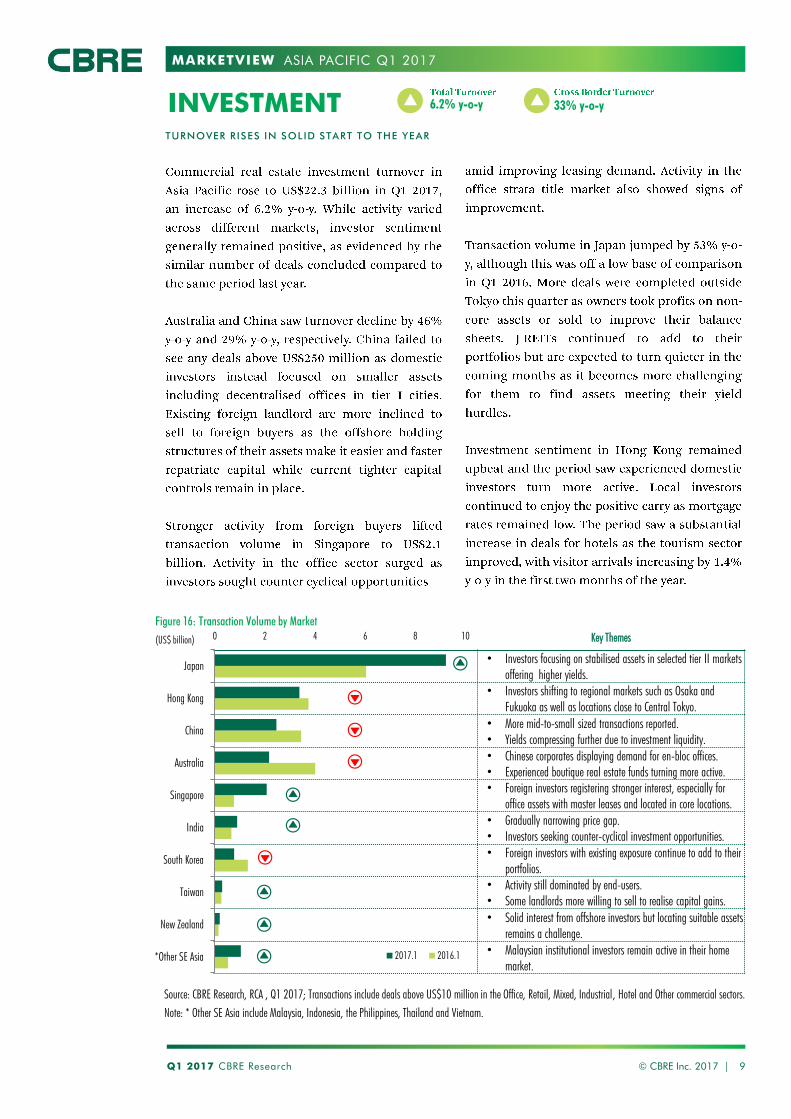
Key Themes
• Investors focusing on stabilised assets in selected tier II markets
offering higher yields.
• Investors shifting to regional markets such as Osaka and
Fukuoka as well as locations close to Central Tokyo.
• More mid-to-small sized transactions reported.
• Yields compressing further due to investment liquidity.
• Chinese corporates displaying demand for en-bloc offices.
• Experienced boutique real estate funds turning more active.
• Foreign investors registering stronger interest, especially for
office assets with master leases and located in core locations.
• Gradually narrowing price gap.
• Investors seeking counter-cyclical investment opportunities.
• Foreign investors with existing exposure continue to add to their
portfolios.
• Activity still dominated by end-users.
• Some landlords more willing to sell to realise capital gains.
• Solid interest from offshore investors but locating suitable assets
remains a challenge.
• Malaysian institutional investors remain active in their home
market.
Q1 2017 CBRE Research © CBRE Inc. 2017 | 9
ASIA PACIFIC Q1 2017
Source: CBRE Research, RCA , Q1 2017; Transactions include deals above US$10 million in the Office, Retail, Mixed, Industrial, Hotel and Other commercial sectors.
Note: * Other SE Asia include Malaysia, Indonesia, the Philippines, Thailand and Vietnam.
Figure 16: Transaction Volume by Market
INVESTMENT 6.2% y-o-y 33% y-o-y
TURNOVER RISES IN SOLID START TO THE YEAR
0 2 4 6 8 10
*Other SE Asia
New Zealand
Taiwan
South Korea
India
Singapore
Australia
China
Hong Kong
Japan
(US$ billion)
2017.1 2016.1
MARKETVIEW
0%
20%
40%
60%
80%
0
2
4
6
8
2013.1 2014.1 2015.1 2016.1 2017.1
US$
Billion
Chinese Capital Other Capital Sources
Chinese as % to total (RHS)
Q1 2017 CBRE Research © CBRE Inc. 2017 | 10
ASIA PACIFIC Q1 2017
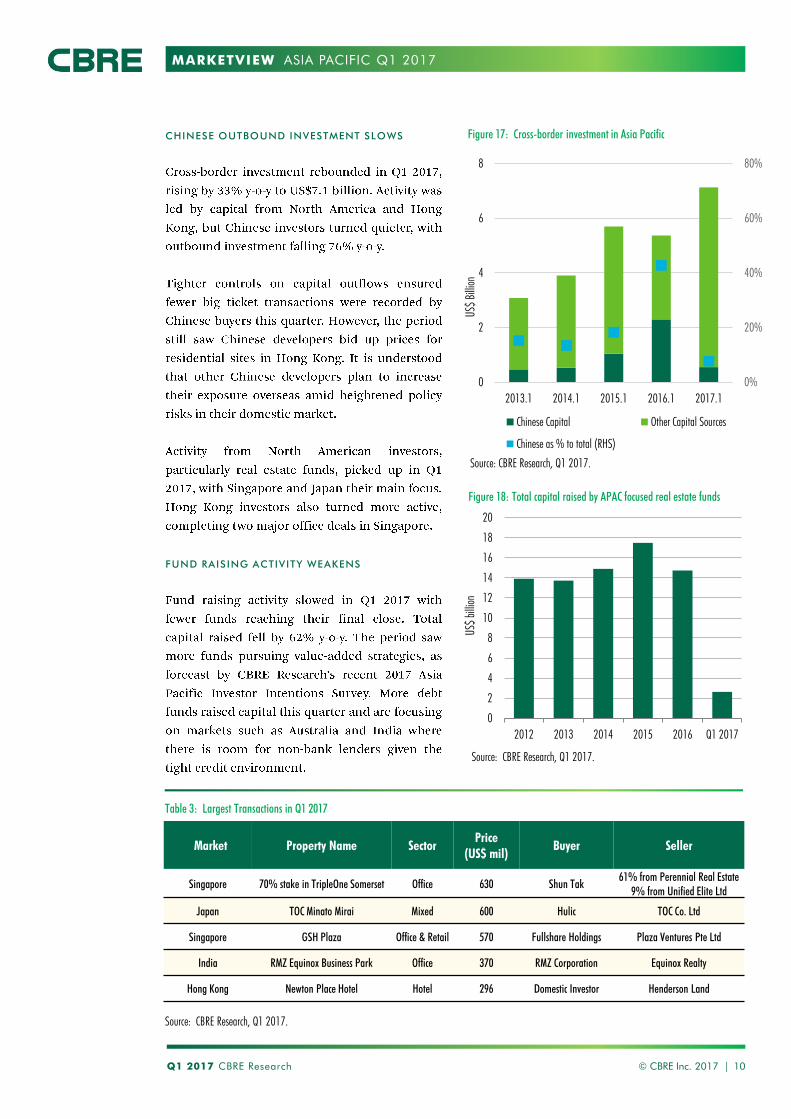
Figure 18: Total capital raised by APAC focused real estate funds
Source: CBRE Research, Q1 2017.
Table 3: Largest Transactions in Q1 2017
CHINESE OUTBOUND INVESTMENT SLOWS
FUND RAISING ACTIVITY WEAKENS
Market Property Name SectorPrice
(US$ mil)Buyer Seller
Singapore 70% stake in TripleOne Somerset Office 630 Shun Tak61% from Perennial Real Estate
9% from Unified Elite Ltd
Japan TOC Minato Mirai Mixed 600 Hulic TOC Co. Ltd
Singapore GSH Plaza Office & Retail 570 Fullshare Holdings Plaza Ventures Pte Ltd
India RMZ Equinox Business Park Office 370 RMZ Corporation Equinox Realty
Hong Kong Newton Place Hotel Hotel 296 Domestic Investor Henderson Land
Source: CBRE Research, Q1 2017.
Figure 17: Cross-border investment in Asia Pacific
0
2
4
6
8
10
12
14
16
18
20
2012 2013 2014 2015 2016 Q1 2017
US$
billion
Source: CBRE Research, Q1 2017.
MARKETVIEW
OFFICE
RETAIL
LOGISTICS
INVESTMENT
ASIA PACIFIC Q1 2017
Q1 2017 CBRE Research © CBRE Inc. 2017 | 11
OUTLOOK
MARKETVIEW
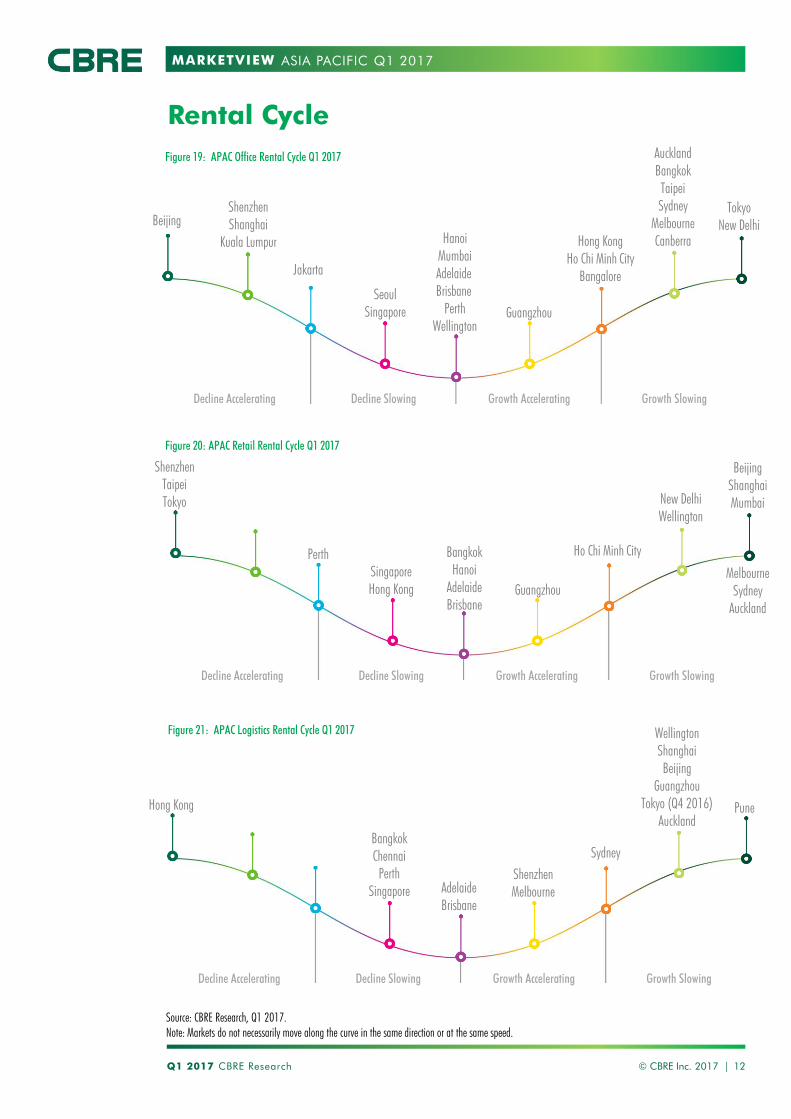
Rental Cycle
ASIA PACIFIC Q1 2017
Source: CBRE Research, Q1 2017.
Note: Markets do not necessarily move along the curve in the same direction or at the same speed.
Figure 20: APAC Retail Rental Cycle Q1 2017
Figure 19: APAC Office Rental Cycle Q1 2017
Q1 2017 CBRE Research © CBRE Inc. 2017 | 12
Figure 21: APAC Logistics Rental Cycle Q1 2017
Decline Accelerating Decline Slowing Growth Accelerating Growth Slowing
Decline Accelerating Decline Slowing Growth Accelerating Growth Slowing
Perth Bangkok
Hanoi
Adelaide
Brisbane
Guangzhou
Ho Chi Minh City
New Delhi
Wellington
Beijing
Shanghai
Mumbai
Melbourne
Sydney
Auckland
Hong Kong
Bangkok
Chennai
Perth
Singapore Adelaide
Brisbane
Shenzhen
Melbourne
Wellington
Shanghai
Beijing
Guangzhou
Tokyo (Q4 2016)
Auckland
Pune
Sydney
Singapore
Hong Kong
Shenzhen
Taipei
Tokyo
Decline Accelerating Decline Slowing Growth Accelerating Growth Slowing
Seoul
Singapore
Hanoi
Mumbai
Adelaide
Brisbane
Perth
Wellington
Guangzhou
Hong Kong
Ho Chi Minh City
Bangalore
Auckland
Bangkok
Taipei
Sydney
Melbourne
Canberra
Tokyo
New Delhi
Shenzhen
Shanghai
Kuala Lumpur
Beijing
Jakarta
MARKETVIEW
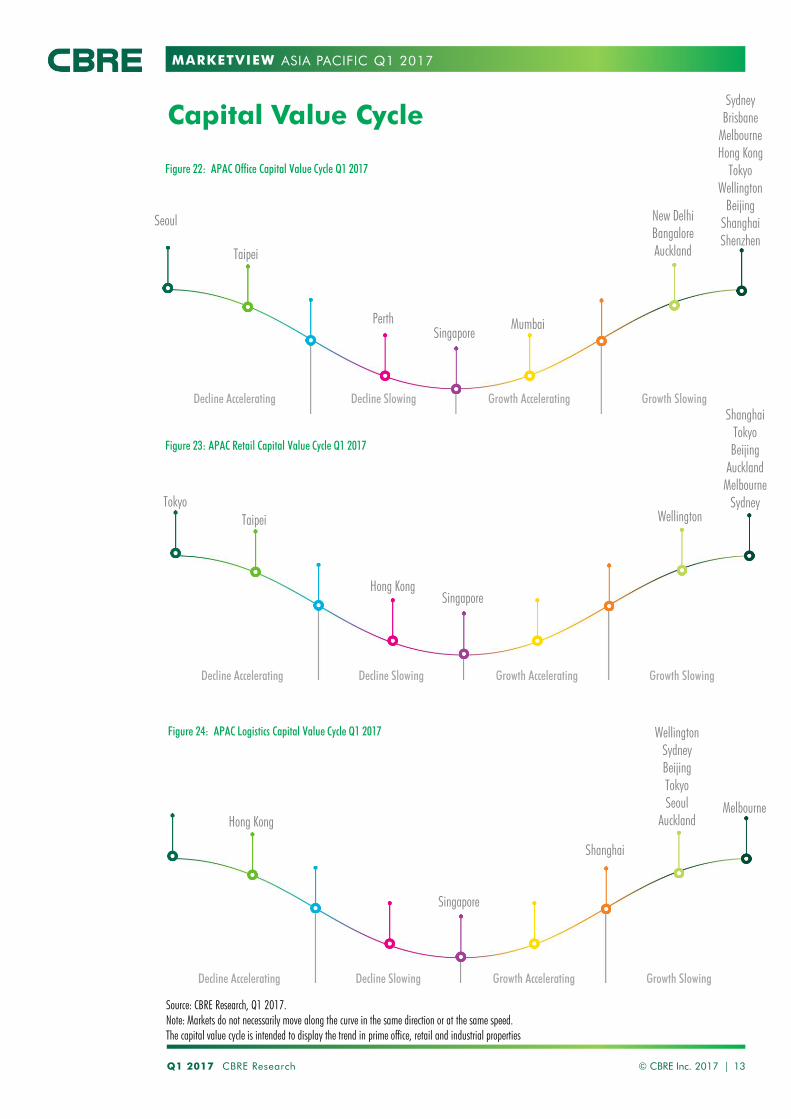
Capital Value Cycle
ASIA PACIFIC Q1 2017
Source: CBRE Research, Q1 2017.
Note: Markets do not necessarily move along the curve in the same direction or at the same speed.
The capital value cycle is intended to display the trend in prime office, retail and industrial properties
Figure 22: APAC Office Capital Value Cycle Q1 2017
Q1 2017 CBRE Research © CBRE Inc. 2017 | 13
Figure 24: APAC Logistics Capital Value Cycle Q1 2017
Decline Accelerating Decline Slowing Growth Accelerating Growth Slowing
Decline Accelerating Decline Slowing Growth Accelerating Growth Slowing
Decline Accelerating Decline Slowing Growth Accelerating Growth Slowing
Sydney
Brisbane
Melbourne
Hong Kong
Tokyo
Wellington
Beijing
Shanghai
Shenzhen
New Delhi
Bangalore
Auckland
Mumbai
Shanghai
Tokyo
Beijing
Auckland
Melbourne
Sydney
WellingtonTaipei
Melbourne
Wellington
Sydney
Beijing
Tokyo
Seoul
Auckland
Singapore
Taipei
Figure 23: APAC Retail Capital Value Cycle Q1 2017
Hong Kong
Perth
Singapore
Tokyo
Singapore
Hong Kong
Seoul
Shanghai
MARKETVIEW ASIA PACIFIC Q1 2017
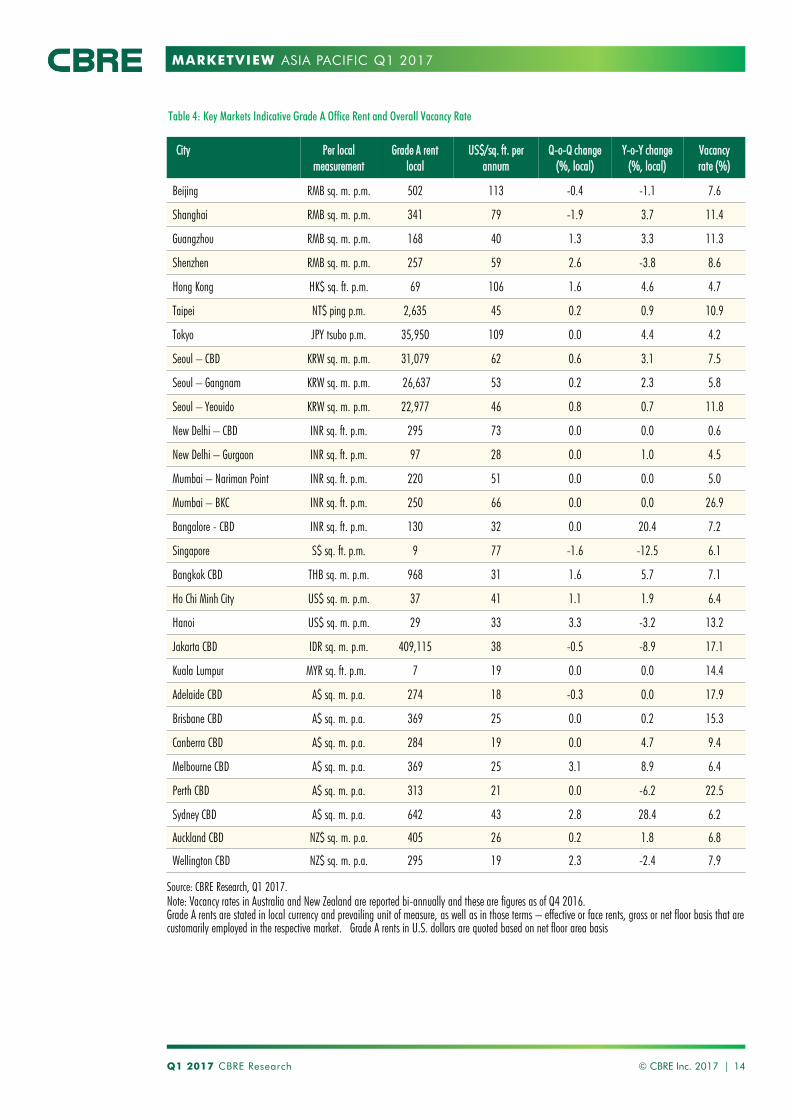
Table 4: Key Markets Indicative Grade A Office Rent and Overall Vacancy Rate
© CBRE Inc. 2017 | 14
Source: CBRE Research, Q1 2017.
Note: Vacancy rates in Australia and New Zealand are reported bi-annually and these are figures as of Q4 2016.
Grade A rents are stated in local currency and prevailing unit of measure, as well as in those terms – effective or face rents, gross or net floor basis that are
customarily employed in the respective market. Grade A rents in U.S. dollars are quoted based on net floor area basis
Q1 2017 CBRE Research
City Per local
measurement
Grade A rent
local
US$/sq. ft. per
annum
Q-o-Q change
(%, local)
Y-o-Y change
(%, local)
Vacancy
rate (%)
Beijing RMB sq. m. p.m. 502 113 -0.4 -1.1 7.6
Shanghai RMB sq. m. p.m. 341 79 -1.9 3.7 11.4
Guangzhou RMB sq. m. p.m. 168 40 1.3 3.3 11.3
Shenzhen RMB sq. m. p.m. 257 59 2.6 -3.8 8.6
Hong Kong HK$ sq. ft. p.m. 69 106 1.6 4.6 4.7
Taipei NT$ ping p.m. 2,635 45 0.2 0.9 10.9
Tokyo JPY tsubo p.m. 35,950 109 0.0 4.4 4.2
Seoul – CBD KRW sq. m. p.m. 31,079 62 0.6 3.1 7.5
Seoul – Gangnam KRW sq. m. p.m. 26,637 53 0.2 2.3 5.8
Seoul – Yeouido KRW sq. m. p.m. 22,977 46 0.8 0.7 11.8
New Delhi – CBD INR sq. ft. p.m. 295 73 0.0 0.0 0.6
New Delhi – Gurgaon INR sq. ft. p.m. 97 28 0.0 1.0 4.5
Mumbai – Nariman Point INR sq. ft. p.m. 220 51 0.0 0.0 5.0
Mumbai – BKC INR sq. ft. p.m. 250 66 0.0 0.0 26.9
Bangalore - CBD INR sq. ft. p.m. 130 32 0.0 20.4 7.2
Singapore S$ sq. ft. p.m. 9 77 -1.6 -12.5 6.1
Bangkok CBD THB sq. m. p.m. 968 31 1.6 5.7 7.1
Ho Chi Minh City US$ sq. m. p.m. 37 41 1.1 1.9 6.4
Hanoi US$ sq. m. p.m. 29 33 3.3 -3.2 13.2
Jakarta CBD IDR sq. m. p.m. 409,115 38 -0.5 -8.9 17.1
Kuala Lumpur MYR sq. ft. p.m. 7 19 0.0 0.0 14.4
Adelaide CBD A$ sq. m. p.a. 274 18 -0.3 0.0 17.9
Brisbane CBD A$ sq. m. p.a. 369 25 0.0 0.2 15.3
Canberra CBD A$ sq. m. p.a. 284 19 0.0 4.7 9.4
Melbourne CBD A$ sq. m. p.a. 369 25 3.1 8.9 6.4
Perth CBD A$ sq. m. p.a. 313 21 0.0 -6.2 22.5
Sydney CBD A$ sq. m. p.a. 642 43 2.8 28.4 6.2
Auckland CBD NZ$ sq. m. p.a. 405 26 0.2 1.8 6.8
Wellington CBD NZ$ sq. m. p.a. 295 19 2.3 -2.4 7.9
MARKETVIEW ASIA PACIFIC Q1 2017
City TypePer local
measurement
Average rent
local
US$/sq. ft. per
annum
Q-o-Q change
(%, local)
Y-o-Y change
(%, local)
Beijing Shopping Centre RMB sq. m. p.day 35 173 0.1 1.4
Shanghai Shopping Centre RMB sq. m. p.day 41 202 0.5 1.9
Guangzhou Shopping Centre RMB sq. m. p.day 39 190 0.2 2.7
Shenzhen Shopping Centre RMB sq. m. p.day 24 119 -0.1 0.4
Hong Kong High Street HK$ sq. ft. p.m. 504 778 -0.7 -7.1
Taipei High Street NT$ sq. m. p.m. 5,493 201 -0.5 0.2
Tokyo* High Street JPY tsubo p.m. 400,000 1,210 0.0 0.0
Singapore Shopping Centre S$ sq. ft. p.m. 25 217 -0.6 -2.7
Bangkok Shopping Centre THB sq. m. p.m. 2,180 71 0.0 0.0
Ho Chi Minh City Shopping Centre US$ sq. m. p.m. 56 279 0.6 8.6
Hanoi Shopping Centre US$ sq. m. p.m. 30 234 -1.2 -9.4
New Delhi Shopping Centre INR sq. ft. p.m. 1,250 153 0.0 0.0
New Delhi High Street INR sq. ft. p.m. 1,500 278 0.0 0.0
Mumbai Shopping Centre INR sq. ft. p.m. 750 111 0.0 7.1
Sydney High Street A$ sq. m. p.a. 5,342 379 4.1 18.0
Melbourne High Street A$ sq. m. p.a. 3,808 270 1.1 1.1
Adelaide High Street A$ sq. m. p.a. 2,033 144 0.0 0.0
Brisbane High Street A$ sq. m. p.a. 3,155 224 0.0 0.0
Perth High Street A$ sq. m. p.a. 3142 223 -5.3 -10.9
Auckland High Street NZ$ sq. m. p.a. 4,500 292 0.0 12.5
Wellington High Street NZ$ sq. m. p.a. 2,684 174 0.0 7.9
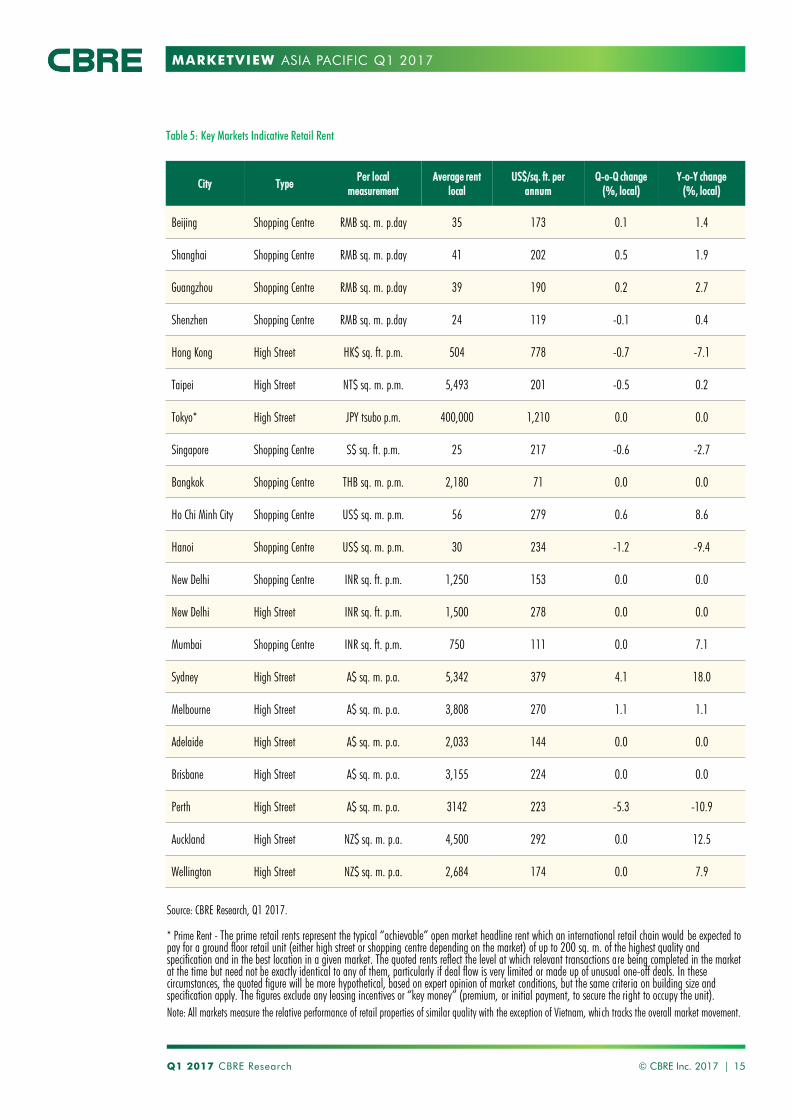
Table 5: Key Markets Indicative Retail Rent
© CBRE Inc. 2017 | 15
Source: CBRE Research, Q1 2017.
* Prime Rent - The prime retail rents represent the typical “achievable” open market headline rent which an international retail chain would be expected to
pay for a ground floor retail unit (either high street or shopping centre depending on the market) of up to 200 sq. m. of the highest quality and
specification and in the best location in a given market. The quoted rents reflect the level at which relevant transactions are being completed in the market
at the time but need not be exactly identical to any of them, particularly if deal flow is very limited or made up of unusual one-off deals. In these
circumstances, the quoted figure will be more hypothetical, based on expert opinion of market conditions, but the same criteria on building size and
specification apply. The figures exclude any leasing incentives or “key money” (premium, or initial payment, to secure the right to occupy the unit).
Note: All markets measure the relative performance of retail properties of similar quality with the exception of Vietnam, which tracks the overall market movement.
Q1 2017 CBRE Research
MARKETVIEW ASIA PACIFIC Q1 2017
City TypePer local
measurement
Prime rent
local
US$/sq. ft. per
annum
Q-o-Q change
(%, local)
Y-o-Y change
(%, local)
Beijing≠
Logistics RMB sq. m. p.m. 40.5 6.6 0.5 0.7
Shanghai≠
Logistics RMB sq. m. p.m. 44.0 7.1 1.5 6.5
Guangzhou≠
Logistics RMB sq. m. p.m. 35.9 5.8 0.8 2.9
Shenzhen≠
Logistics RMB sq. m. p.m. 43.4 7.0 0.7 6.7
Chengdu≠
Logistics RMB sq. m. p.m. 24.5 4.0 -3.2 -10.7
Tianjin≠
Logistics RMB sq. m. p.m. 29.1 4.7 0.0 0.2
Wuhan≠
Logistics RMB sq. m. p.m. 29.3 4.7 -0.7 2.6
Hong Kong Warehouse HK$ sq. ft. p.m. 12.4 19.2 -0.6 -1.2
Chennai Logistics INR sq. ft. p. m. 28.0 5.0 0.0 7.7
Pune Logistics INR sq. ft. p. m. 28.0 5.0 0.0 0.0
Greater Tokyo* Logistics JPY tsubo p.m. 6320.0 19.1 0.5 1.1
SingaporeWarehouse
(ground floor)S$ sq. ft. p.m. 1.6 14.0 -0.6 -4.7
Sydney Warehouse A$ sq. m. p.a. 124.6 8.8 0.3 5.7
Melbourne Warehouse A$ sq. m. p.a. 84.0 6.0 0.6 1.2
Brisbane Warehouse A$ sq. m. p.a. 113.0 8.0 0.0 -0.9
Adelaide Warehouse A$ sq. m. p.a. 75.0 5.3 1.4 1.4
Perth Warehouse A$ sq. m. p.a. 95.8 6.8 -2.7 -9.2
Canberra Warehouse A$ sq. m. p.a. 95.0 6.7 0.0 0.0
Auckland Warehouse NZ$ sq. m. p.a. 137.4 8.9 0.8 3.0
Wellington Warehouse NZ$ sq. m. p.a. 107.0 7.0 7.9 21.4
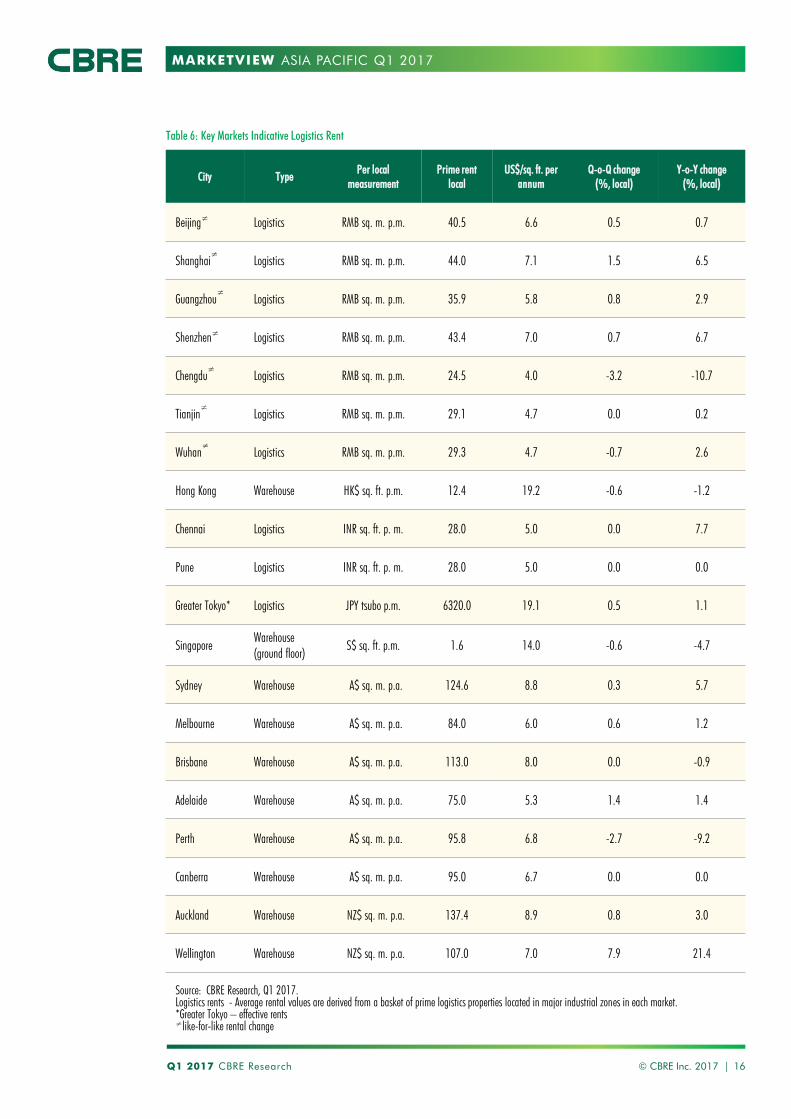
Table 6: Key Markets Indicative Logistics Rent
Q1 2017 CBRE Research © CBRE Inc. 2017 | 16
Source: CBRE Research, Q1 2017.
Logistics rents - Average rental values are derived from a basket of prime logistics properties located in major industrial zones in each market.
*Greater Tokyo – effective rents≠
like-for-like rental change
MARKETVIEW ASIA PACIFIC Q1 2017
CityPrime Office
Yield
Y-o-Y Change
(bps)
Prime Retail
Yield
Y-o-Y Change
(bps)
Prime Industrial
Yield
Y-o-Y Change
(bps)
Beijing 4.50 -30 4.60 -15 6.30 -20
Shanghai 4.25 0 4.30 -15 5.90 -75
Hong Kong 2.80 0 3.30 0 3.85 0
Taipei 2.45 10 3.00 10 3.85 -10
Tokyo 3.10 -10 2.90 -10 4.10 -20
Seoul 5.80 -10 n/a n/a 6.90 -20
Singapore 3.10 -30 4.90 0 n/a n/a
New Delhi 8.20 0 9.00 -150 10.50 0
Mumbai 9.10 -30 12.50 0 13.50 0
Sydney 5.00 -10 4.50 -25 6.20 -80
Melbourne 5.20 -20 4.20 -30 6.50 -20
Brisbane 6.00 -40 5.50 -50 7.45 0
Auckland 5.75 -25 4.80 -20 5.75 -70
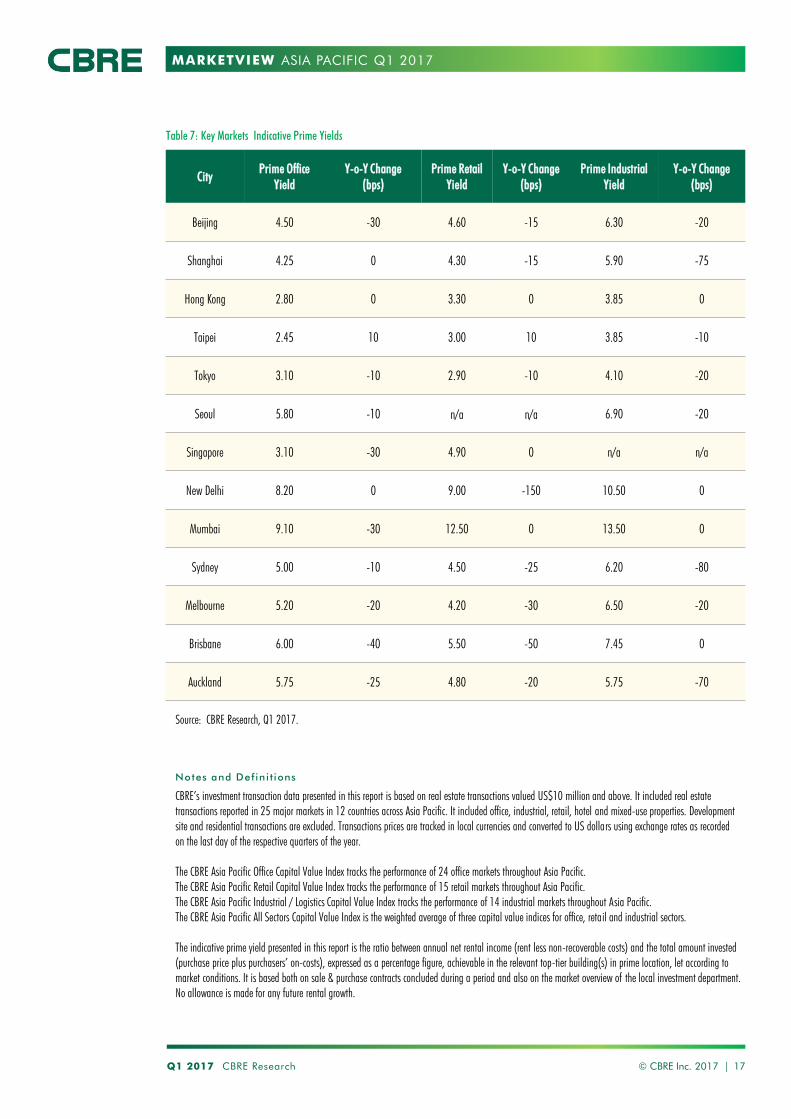
Table 7: Key Markets Indicative Prime Yields
Q1 2017 CBRE Research © CBRE Inc. 2017 | 17
Source: CBRE Research, Q1 2017.
Notes and Defini t ions
CBRE’s investment transaction data presented in this report is based on real estate transactions valued US$10 million and above. It included real estate
transactions reported in 25 major markets in 12 countries across Asia Pacific. It included office, industrial, retail, hotel and mixed-use properties. Development
site and residential transactions are excluded. Transactions prices are tracked in local currencies and converted to US dollars using exchange rates as recorded
on the last day of the respective quarters of the year.
The CBRE Asia Pacific Office Capital Value Index tracks the performance of 24 office markets throughout Asia Pacific.
The CBRE Asia Pacific Retail Capital Value Index tracks the performance of 15 retail markets throughout Asia Pacific.
The CBRE Asia Pacific Industrial / Logistics Capital Value Index tracks the performance of 14 industrial markets throughout Asia Pacific.
The CBRE Asia Pacific All Sectors Capital Value Index is the weighted average of three capital value indices for office, retail and industrial sectors.
The indicative prime yield presented in this report is the ratio between annual net rental income (rent less non-recoverable costs) and the total amount invested
(purchase price plus purchasers’ on-costs), expressed as a percentage figure, achievable in the relevant top-tier building(s) in prime location, let according to
market conditions. It is based both on sale & purchase contracts concluded during a period and also on the market overview of the local investment department.
No allowance is made for any future rental growth.
MARKETVIEW
CBRE GLOBAL RESEARCH
This report was prepared by the CBRE Asia Pacific Research Team, which forms part of CBRE Global Research – a network of preeminent researchers who
collaborate to provide real estate market research, econometric forecasting and consulting solutions to real estate investors and occupiers around the globe.
Disclaimer
All materials presented in this report, unless specifically indicated otherwise, is under copyright and proprietary to CBRE. Information contained herein, including
projections, has been obtained from materials and sources believed to be reliable at the date of publication. While we do not doubt its accuracy, we have not
verified it and make no guarantee, warranty or representation about it. Readers are responsible for independently assessing the relevance, accuracy, completeness
and currency of the information of this publication. This report is presented for information purposes only, exclusively for CBRE clients and professionals, and is not
to be used or considered as an offer or the solicitation of an offer to sell or buy or subscribe for securities or other financial instruments. All rights to the material
are reserved and none of the material, nor its content, nor any copy of it, may be altered in any way, transmitted to, copied or distributed to any other party
without prior express written permission of CBRE. Any unauthorised publication or redistribution of CBRE research reports is prohibited. CBRE will not be liable for
any loss, damage, cost or expense incurred or arising by reason of any person using or relying on information in this publication.
GLOBAL RESEARCH
ASIA PACIFIC Q1 2017
ASIA PACIFIC RESEARCH


![EMEA Corporate Occupier Conditions – Autumn 2015 [Infographic]](https://img.pdfslide.us/doc/110x75/58743d391a28ab0e6c8b5df9/emea-corporate-occupier-conditions-autumn-2015-infographic.jpg)