Embed Size (px)
Citation preview
Occupier Perspective Global Occupancy Costs - Offices 2014
Most efficient markets challenged by cost increases
DTZ Research
25 February 2014
Contents
Introduction 2
Section 1 – Global ranking 3
Section 2 – Global review 5
Section 3 – Space efficiency 7
Section 4 – Non-prime space 9
Section 5 – Regional commentary 10
Author
Milena Kuljanin
Occupier Research + 44 (0)20 3296 2305 [email protected]
Contacts Nigel Almond
Head of Strategy Research + 44 (0)20 3296 2328 [email protected]
Fergus Hicks
Global Head of Forecasting + 44 (0)20 3296 2307 [email protected]
Hans Vrensen
Global Head of Research + 44 (0)20 3296 2159 [email protected]
This 17th
edition of the Global Occupancy Costs – Offices report presents our outlook and analysis of the costs of occupying prime office space across 138 markets worldwide. This expands our coverage by twelve markets compared to last year.
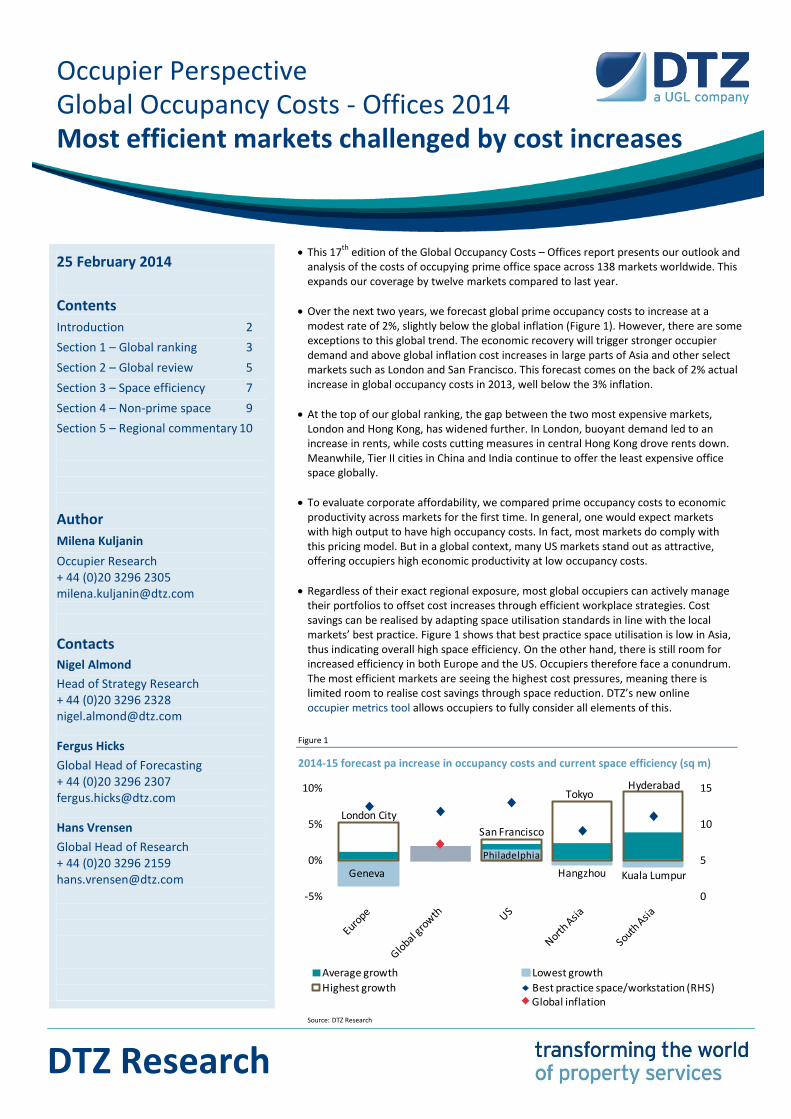
Over the next two years, we forecast global prime occupancy costs to increase at a modest rate of 2%, slightly below the global inflation (Figure 1). However, there are some exceptions to this global trend. The economic recovery will trigger stronger occupier demand and above global inflation cost increases in large parts of Asia and other select markets such as London and San Francisco. This forecast comes on the back of 2% actual increase in global occupancy costs in 2013, well below the 3% inflation.
At the top of our global ranking, the gap between the two most expensive markets, London and Hong Kong, has widened further. In London, buoyant demand led to an increase in rents, while costs cutting measures in central Hong Kong drove rents down. Meanwhile, Tier II cities in China and India continue to offer the least expensive office space globally.
To evaluate corporate affordability, we compared prime occupancy costs to economic productivity across markets for the first time. In general, one would expect markets with high output to have high occupancy costs. In fact, most markets do comply with this pricing model. But in a global context, many US markets stand out as attractive, offering occupiers high economic productivity at low occupancy costs.
Regardless of their exact regional exposure, most global occupiers can actively manage their portfolios to offset cost increases through efficient workplace strategies. Cost savings can be realised by adapting space utilisation standards in line with the local markets’ best practice. Figure 1 shows that best practice space utilisation is low in Asia, thus indicating overall high space efficiency. On the other hand, there is still room for increased efficiency in both Europe and the US. Occupiers therefore face a conundrum. The most efficient markets are seeing the highest cost pressures, meaning there is limited room to realise cost savings through space reduction. DTZ’s new online occupier metrics tool allows occupiers to fully consider all elements of this.
Figure 1
2014-15 forecast pa increase in occupancy costs and current space efficiency (sq m)
Source: DTZ Research
0
5
10
15
-5%
0%
5%
10%
Average growth Lowest growth
Highest growth Best practice space/workstation (RHS)
Tokyo
Kuala Lumpur
Hyderabad
Hangzhou
San Francisco
Geneva
London City
Philadelphia
Global inflation
Global Occupancy Costs - Offices 2014
www.dtz.com DTZ Occupier Perspective 2
Introduction
Coverage and methodology This 17th edition of Global Occupancy Costs - Offices presents occupancy costs per workstation across 138 business districts in 60 countries worldwide.
This year, we have extended our coverage in several regions. For the first time, our South America section includes Buenos Aires and Santiago. Furthermore, as occupiers seek business opportunities in the fast growing economies of Africa, this edition includes information on occupancy costs in Accra, Casablanca, Lagos and Nairobi. Our global ranking this year also provides information on occupancy costs in Athens, Bratislava, Canberra, St. Petersburg, Vienna and Zagreb.
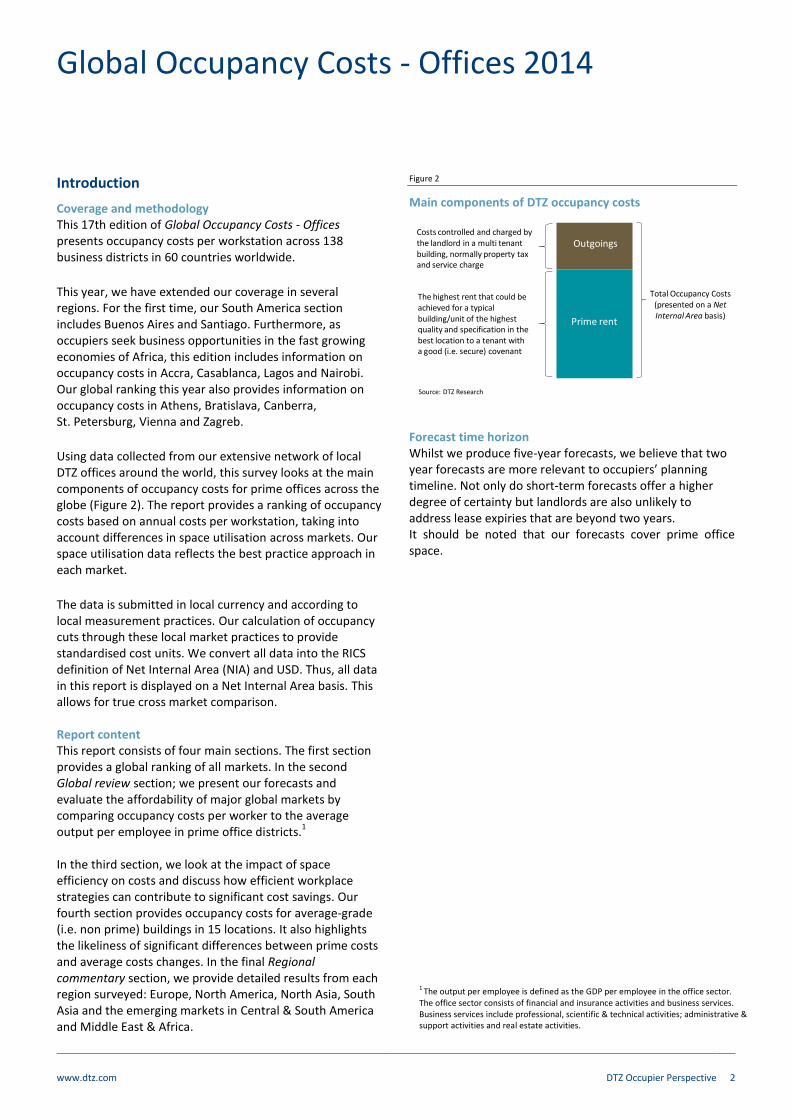
Using data collected from our extensive network of local DTZ offices around the world, this survey looks at the main components of occupancy costs for prime offices across the globe (Figure 2). The report provides a ranking of occupancy costs based on annual costs per workstation, taking into account differences in space utilisation across markets. Our space utilisation data reflects the best practice approach in each market.
The data is submitted in local currency and according to local measurement practices. Our calculation of occupancy cuts through these local market practices to provide standardised cost units. We convert all data into the RICS definition of Net Internal Area (NIA) and USD. Thus, all data in this report is displayed on a Net Internal Area basis. This allows for true cross market comparison. Report content This report consists of four main sections. The first section provides a global ranking of all markets. In the second Global review section; we present our forecasts and evaluate the affordability of major global markets by comparing occupancy costs per worker to the average output per employee in prime office districts.
1
In the third section, we look at the impact of space efficiency on costs and discuss how efficient workplace strategies can contribute to significant cost savings. Our fourth section provides occupancy costs for average-grade (i.e. non prime) buildings in 15 locations. It also highlights the likeliness of significant differences between prime costs and average costs changes. In the final Regional commentary section, we provide detailed results from each region surveyed: Europe, North America, North Asia, South Asia and the emerging markets in Central & South America and Middle East & Africa.
Figure 2
Main components of DTZ occupancy costs
Source: DTZ Research
Forecast time horizon Whilst we produce five-year forecasts, we believe that two year forecasts are more relevant to occupiers’ planning timeline. Not only do short-term forecasts offer a higher degree of certainty but landlords are also unlikely to address lease expiries that are beyond two years. It should be noted that our forecasts cover prime office space.
Prime rent
Outgoings
The highest rent that could be achieved for a typical building/unit of the highest quality and specification in the best location to a tenant with a good (i.e. secure) covenant
Costs controlled and charged by the landlord in a multi tenant building, normally property tax and service charge
Total Occupancy Costs(presented on a Net Internal Area basis)
1 The output per employee is defined as the GDP per employee in the office sector. The office sector consists of financial and insurance activities and business services. Business services include professional, scientific & technical activities; administrative & support activities and real estate activities.
Global Occupancy Costs - Offices 2014
www.dtz.com DTZ Occupier Perspective 3
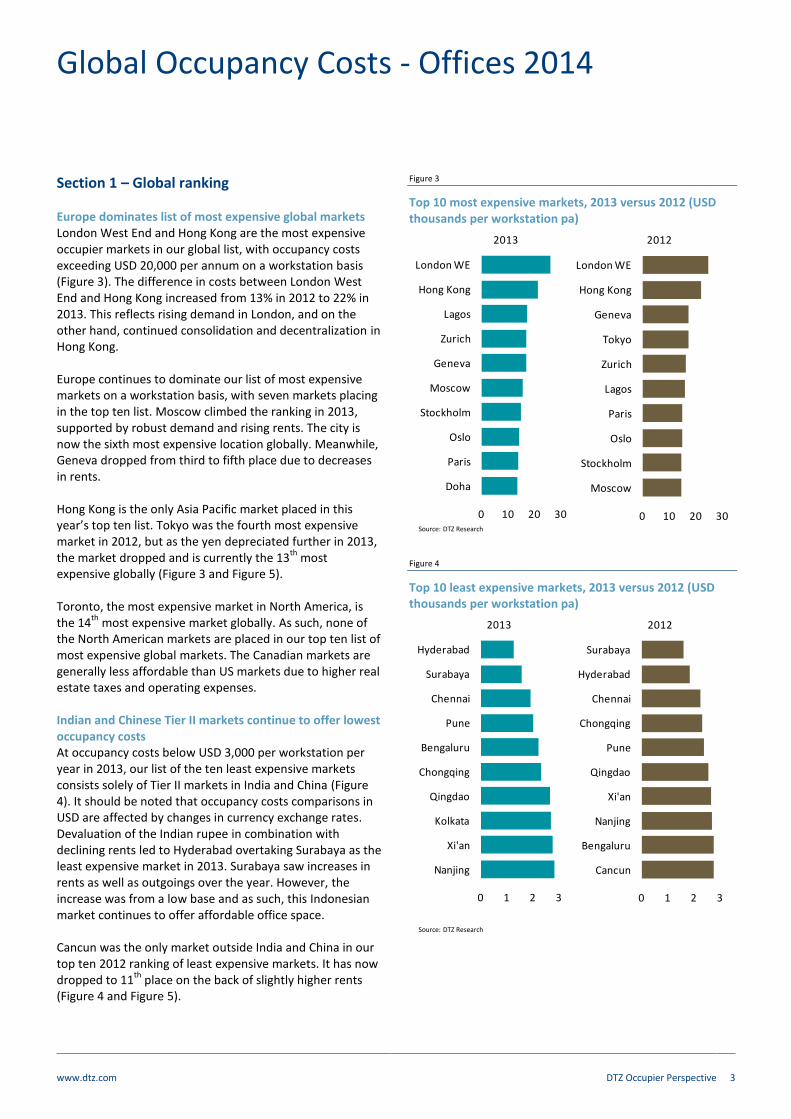
Section 1 – Global ranking Europe dominates list of most expensive global markets London West End and Hong Kong are the most expensive occupier markets in our global list, with occupancy costs exceeding USD 20,000 per annum on a workstation basis (Figure 3). The difference in costs between London West End and Hong Kong increased from 13% in 2012 to 22% in 2013. This reflects rising demand in London, and on the other hand, continued consolidation and decentralization in Hong Kong. Europe continues to dominate our list of most expensive markets on a workstation basis, with seven markets placing in the top ten list. Moscow climbed the ranking in 2013, supported by robust demand and rising rents. The city is now the sixth most expensive location globally. Meanwhile, Geneva dropped from third to fifth place due to decreases in rents. Hong Kong is the only Asia Pacific market placed in this year’s top ten list. Tokyo was the fourth most expensive market in 2012, but as the yen depreciated further in 2013, the market dropped and is currently the 13
th most
expensive globally (Figure 3 and Figure 5). Toronto, the most expensive market in North America, is the 14
th most expensive market globally. As such, none of
the North American markets are placed in our top ten list of most expensive global markets. The Canadian markets are generally less affordable than US markets due to higher real estate taxes and operating expenses. Indian and Chinese Tier II markets continue to offer lowest occupancy costs At occupancy costs below USD 3,000 per workstation per year in 2013, our list of the ten least expensive markets consists solely of Tier II markets in India and China (Figure 4). It should be noted that occupancy costs comparisons in USD are affected by changes in currency exchange rates. Devaluation of the Indian rupee in combination with declining rents led to Hyderabad overtaking Surabaya as the least expensive market in 2013. Surabaya saw increases in rents as well as outgoings over the year. However, the increase was from a low base and as such, this Indonesian market continues to offer affordable office space. Cancun was the only market outside India and China in our top ten 2012 ranking of least expensive markets. It has now dropped to 11
th place on the back of slightly higher rents
(Figure 4 and Figure 5).
Figure 3
Top 10 most expensive markets, 2013 versus 2012 (USD thousands per workstation pa)
Source: DTZ Research
Figure 4
Top 10 least expensive markets, 2013 versus 2012 (USD thousands per workstation pa)
Source: DTZ Research
0 10 20 30
Doha
Paris
Oslo
Stockholm
Moscow
Geneva
Zurich
Lagos
Hong Kong
London WE
2013
0 10 20 30
Moscow
Stockholm
Oslo
Paris
Lagos
Zurich
Tokyo
Geneva
Hong Kong
London WE
2012
0 1 2 3
Nanjing
Xi'an
Kolkata
Qingdao
Chongqing
Bengaluru
Pune
Chennai
Surabaya
Hyderabad
2013
0 1 2 3
Cancun
Bengaluru
Nanjing
Xi'an
Qingdao
Pune
Chongqing
Chennai
Hyderabad
Surabaya
2012
Global Occupancy Costs - Offices 2014
www.dtz.com DTZ Occupier Perspective 4
Figure 5
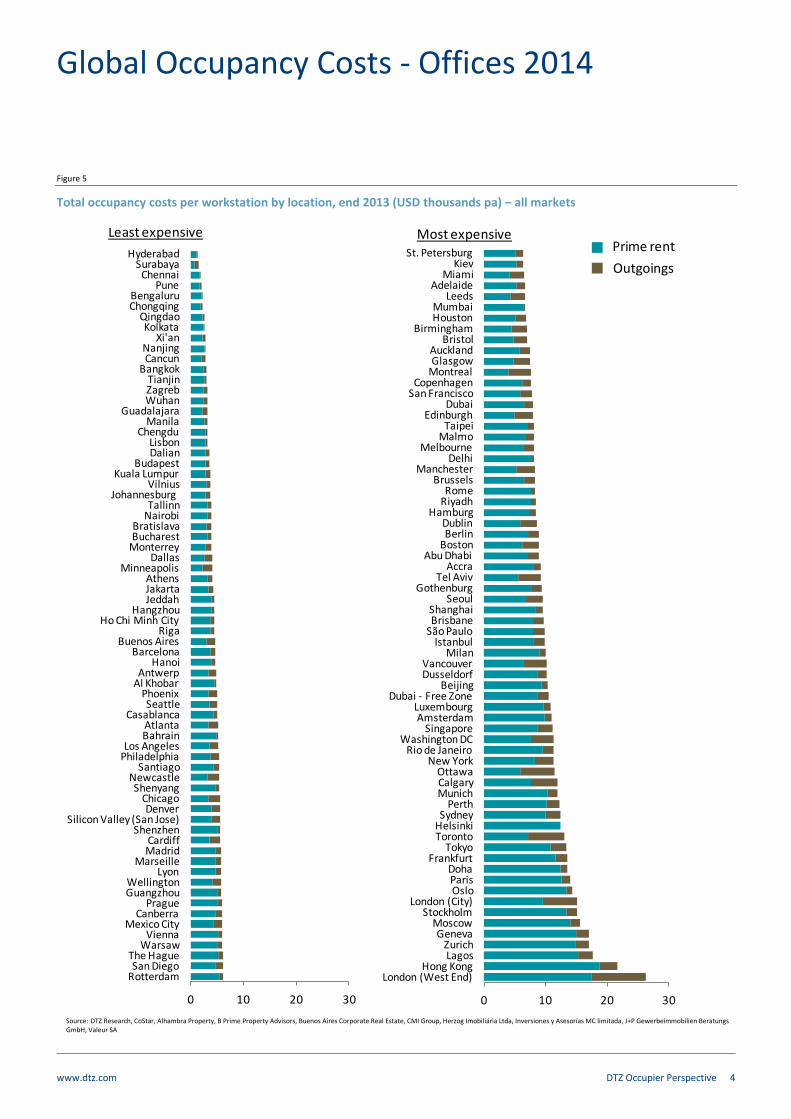
Total occupancy costs per workstation by location, end 2013 (USD thousands pa) – all markets
Source: DTZ Research, CoStar, Alhambra Property, B Prime Property Advisors, Buenos Aires Corporate Real Estate, CMI Group, Herzog Imobiliária Ltda, Inversiones y Asesorías MC limitada, J+P Gewerbeimmobilien Beratungs GmbH, Valeur SA
0 10 20 30
RotterdamSan Diego
The HagueWarsaw
ViennaMexico City
CanberraPrague
GuangzhouWellington
LyonMarseille
MadridCardiff
ShenzhenSilicon Valley (San Jose)
DenverChicago
ShenyangNewcastle
SantiagoPhiladelphiaLos Angeles
BahrainAtlanta
CasablancaSeattle
PhoenixAl KhobarAntwerp
HanoiBarcelona
Buenos AiresRiga
Ho Chi Minh CityHangzhou
JeddahJakartaAthens
MinneapolisDallas
MonterreyBucharestBratislava
NairobiTallinn
Johannesburg Vilnius
Kuala LumpurBudapest
DalianLisbon
ChengduManila
GuadalajaraWuhanZagrebTianjin
BangkokCancunNanjing
Xi'anKolkata
QingdaoChongqingBengaluru
PuneChennai
SurabayaHyderabad
Least expensive
0 10 20 30
London (West End)Hong Kong
LagosZurich
GenevaMoscow
StockholmLondon (City)
OsloParisDoha
FrankfurtTokyo
TorontoHelsinkiSydney
PerthMunichCalgaryOttawa
New YorkRio de Janeiro
Washington DCSingapore
AmsterdamLuxembourg
Dubai - Free ZoneBeijing
DusseldorfVancouver
MilanIstanbul
São PauloBrisbaneShanghai
SeoulGothenburg
Tel AvivAccra
Abu DhabiBostonBerlinDublin
HamburgRiyadhRome
BrusselsManchester
DelhiMelbourne
MalmoTaipei
EdinburghDubai
San FranciscoCopenhagen
MontrealGlasgowAuckland
BristolBirmingham
HoustonMumbai
LeedsAdelaide
MiamiKiev
St. Petersburg
Most expensivePrime rent
Outgoings
Global Occupancy Costs - Offices 2014
www.dtz.com DTZ Occupier Perspective 5
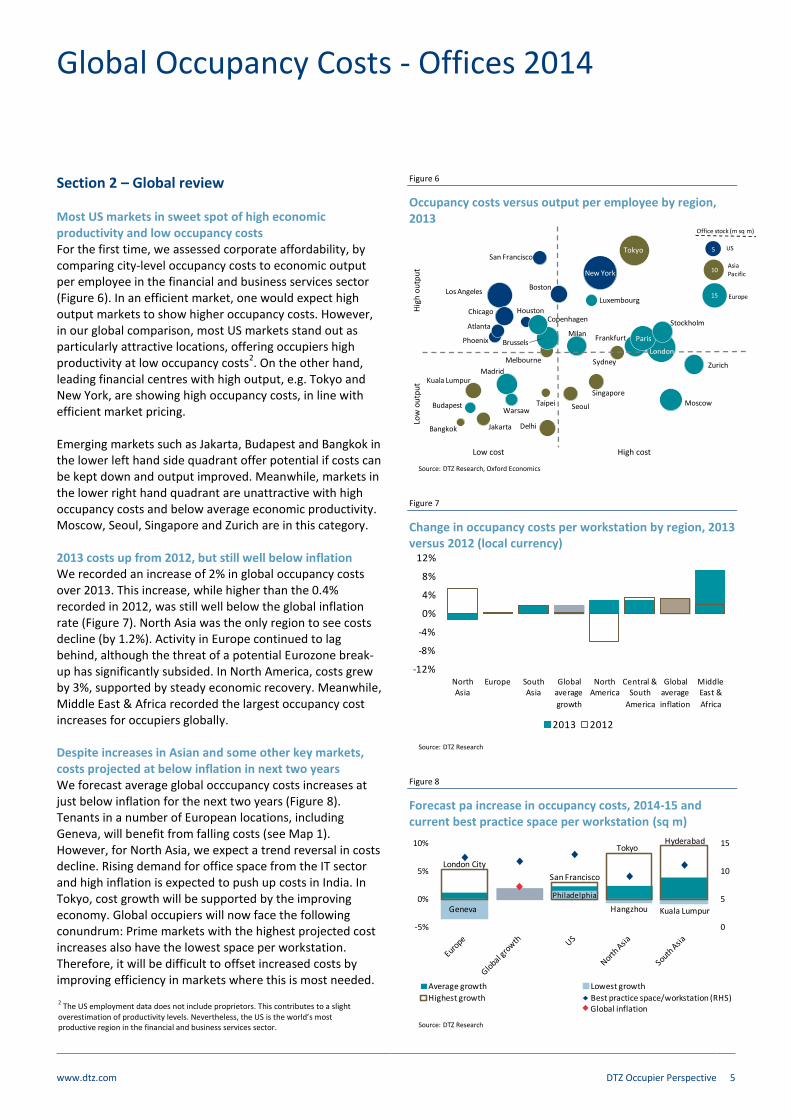
Section 2 – Global review Most US markets in sweet spot of high economic productivity and low occupancy costs For the first time, we assessed corporate affordability, by comparing city-level occupancy costs to economic output per employee in the financial and business services sector (Figure 6). In an efficient market, one would expect high output markets to show higher occupancy costs. However, in our global comparison, most US markets stand out as particularly attractive locations, offering occupiers high productivity at low occupancy costs
2. On the other hand,
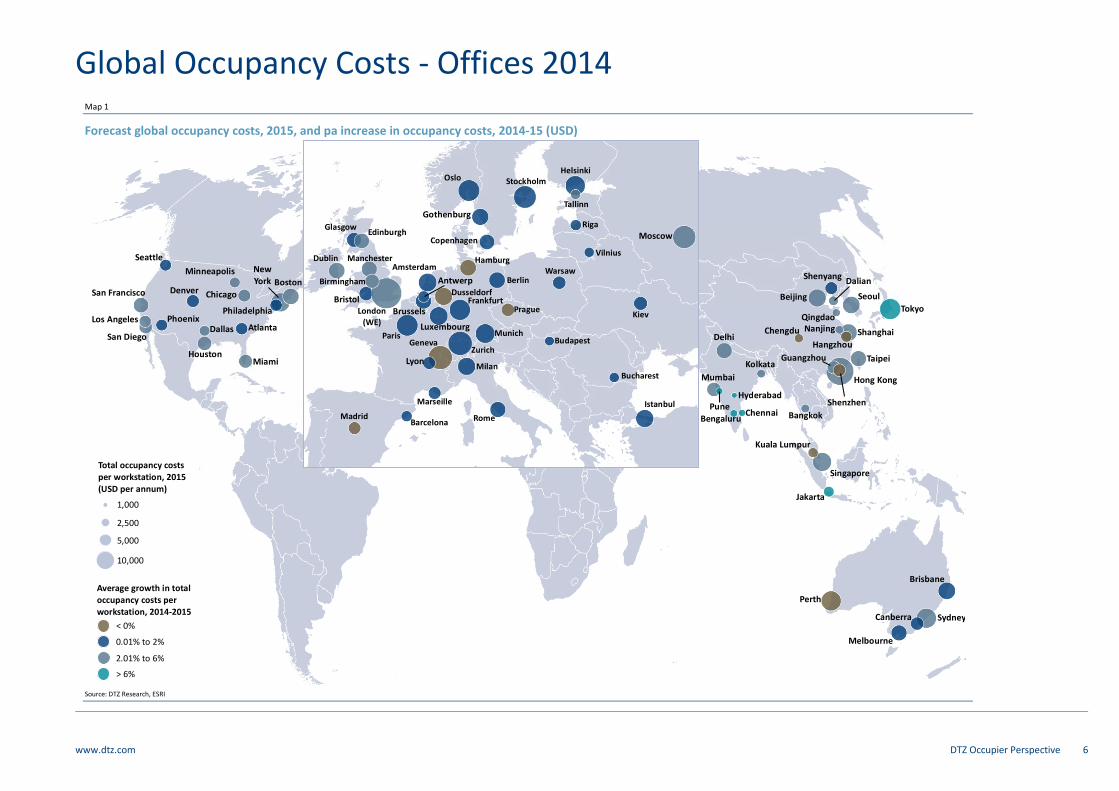
leading financial centres with high output, e.g. Tokyo and New York, are showing high occupancy costs, in line with efficient market pricing. Emerging markets such as Jakarta, Budapest and Bangkok in the lower left hand side quadrant offer potential if costs can be kept down and output improved. Meanwhile, markets in the lower right hand quadrant are unattractive with high occupancy costs and below average economic productivity. Moscow, Seoul, Singapore and Zurich are in this category. 2013 costs up from 2012, but still well below inflation We recorded an increase of 2% in global occupancy costs over 2013. This increase, while higher than the 0.4% recorded in 2012, was still well below the global inflation rate (Figure 7). North Asia was the only region to see costs decline (by 1.2%). Activity in Europe continued to lag behind, although the threat of a potential Eurozone break-up has significantly subsided. In North America, costs grew by 3%, supported by steady economic recovery. Meanwhile, Middle East & Africa recorded the largest occupancy cost increases for occupiers globally. Despite increases in Asian and some other key markets, costs projected at below inflation in next two years We forecast average global occcupancy costs increases at just below inflation for the next two years (Figure 8). Tenants in a number of European locations, including Geneva, will benefit from falling costs (see Map 1). However, for North Asia, we expect a trend reversal in costs decline. Rising demand for office space from the IT sector and high inflation is expected to push up costs in India. In Tokyo, cost growth will be supported by the improving economy. Global occupiers will now face the following conundrum: Prime markets with the highest projected cost increases also have the lowest space per workstation. Therefore, it will be difficult to offset increased costs by improving efficiency in markets where this is most needed.
Figure 6
Occupancy costs versus output per employee by region, 2013
Source: DTZ Research, Oxford Economics
Figure 7
Change in occupancy costs per workstation by region, 2013 versus 2012 (local currency)
Source: DTZ Research
Figure 8
Forecast pa increase in occupancy costs, 2014-15 and current best practice space per workstation (sq m)
Source: DTZ Research
Low
ou
tpu
t
Hig
h o
utp
ut
Low cost High cost
New York
SFO
BOS
San Francisco
Chicago
PhoenixMilan
ParisFrankfurt
London
Zurich
Moscow
SydneyMelbourne
Singapore
SeoulTaipeiWarsaw
JakartaBangkok
Budapest
Office stock (m sq m)
Tokyo US
AsiaPacific
100
Europe
Kuala LumpurMadrid
Houston
Los AngelesBoston
Atlanta
15
10
5
Delhi
Luxembourg
Brussels
Copenhagen Stockholm
-12%
-8%
-4%
0%
4%
8%
12%
North Asia
Europe South Asia
Global average
growth
North America
Central & South
America
Global average
inflation
Middle East &
Africa
2013 2012
0
5
10
15
-5%
0%
5%
10%
Average growth Lowest growth
Highest growth Best practice space/workstation (RHS)
Tokyo
Kuala Lumpur
Hyderabad
Hangzhou
San Francisco
Geneva
London City
Philadelphia
Global inflation2 The US employment data does not include proprietors. This contributes to a slight
overestimation of productivity levels. Nevertheless, the US is the world’s most productive region in the financial and business services sector.
Global Occupancy Costs - Offices 2014
www.dtz.com DTZ Occupier Perspective 6
Map 1
Forecast global occupancy costs, 2015, and pa increase in occupancy costs, 2014-15 (USD)
Source: DTZ Research, ESRI
Los Angeles
San Diego
Tokyo
Seoul
Qingdao
ShenyangNewYork
San Francisco
Seattle
Denver
ChengduDelhi
Mumbai
Kolkata
Beijing
Taipei
Melbourne
Perth
Kuala Lumpur
Bangkok
HyderabadPune
Hong Kong
Shenzhen
Guangzhou
ChennaiBengaluru
Singapore
Jakarta
Brisbane
SydneyCanberra
Hangzhou
Dalian
Nanjing
BostonRome
ParisZurich
Warsaw
Prague
Antwerp
BrusselsBucharest
Dusseldorf
Riga
Miami
Madrid
Dallas
Tallinn
Phoenix
Houston
Glasgow
Chicago
Atlanta
Helsinki
MarseilleBarcelona
MinneapolisKyiv (Kiev)
Philadelphia
Moscow
Shanghai
Brussels
Luxembourg
Antwerp
Moscow
Gothenburg
Lyon
Bristol
Rome
Paris
Zurich
Warsaw
Prague
Vilnius
Bucharest
Dusseldorf
Riga
Milan
Madrid
Geneva
Berlin
Tallinn
Glasgow
Helsinki
Budapest
Stockholm
Marseille
Barcelona
AmsterdamManchester
Copenhagen
Birmingham
Kiev
Oslo
Munich
Dublin Hamburg
Istanbul
Frankfurt
Edinburgh
London
(WE)
Total occupancy costs per workstation, 2015(USD per annum)
1,000
2,500
5,000
10,000
< 0%
0.01% to 2%
2.01% to 6%
> 6%
Average growth in total occupancy costs per workstation, 2014-2015
Global Occupancy Costs - Offices 2014
www.dtz.com DTZ Occupier Perspective 7
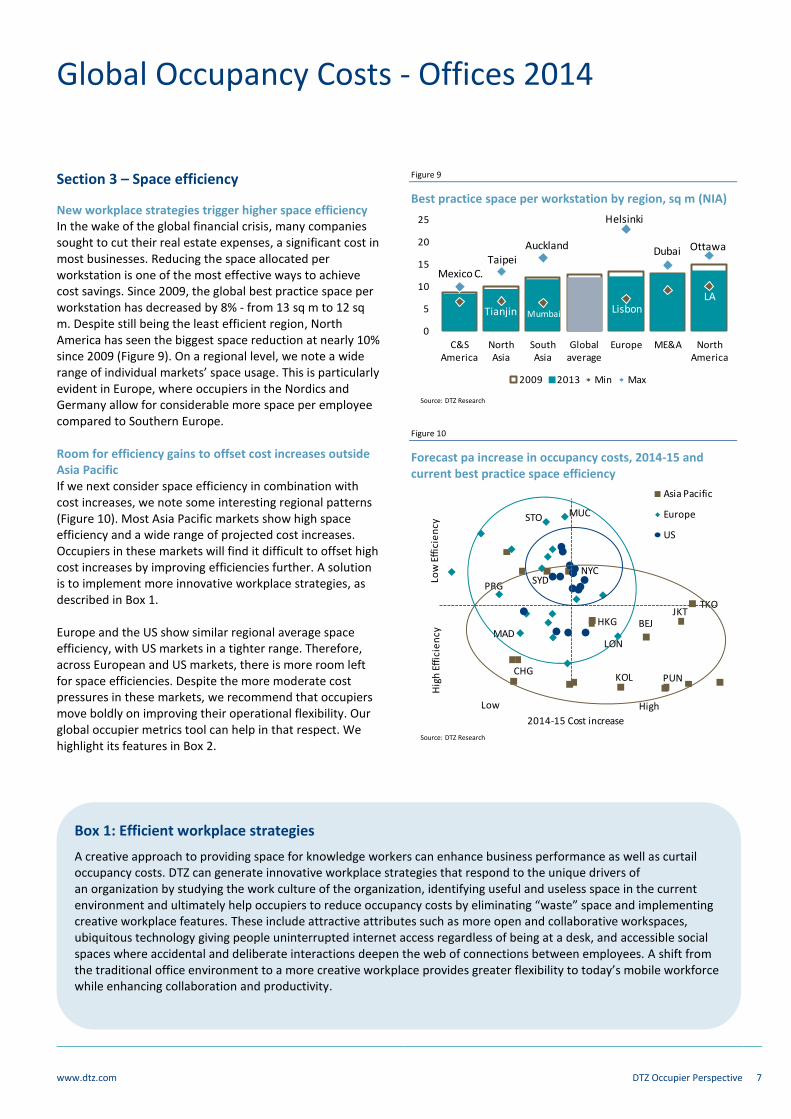
Section 3 – Space efficiency
New workplace strategies trigger higher space efficiency In the wake of the global financial crisis, many companies sought to cut their real estate expenses, a significant cost in most businesses. Reducing the space allocated per workstation is one of the most effective ways to achieve cost savings. Since 2009, the global best practice space per workstation has decreased by 8% - from 13 sq m to 12 sq m. Despite still being the least efficient region, North America has seen the biggest space reduction at nearly 10% since 2009 (Figure 9). On a regional level, we note a wide range of individual markets’ space usage. This is particularly evident in Europe, where occupiers in the Nordics and Germany allow for considerable more space per employee compared to Southern Europe. Room for efficiency gains to offset cost increases outside Asia Pacific If we next consider space efficiency in combination with cost increases, we note some interesting regional patterns (Figure 10). Most Asia Pacific markets show high space efficiency and a wide range of projected cost increases. Occupiers in these markets will find it difficult to offset high cost increases by improving efficiencies further. A solution is to implement more innovative workplace strategies, as described in Box 1. Europe and the US show similar regional average space efficiency, with US markets in a tighter range. Therefore, across European and US markets, there is more room left for space efficiencies. Despite the more moderate cost pressures in these markets, we recommend that occupiers move boldly on improving their operational flexibility. Our global occupier metrics tool can help in that respect. We highlight its features in Box 2.
Figure 9
Best practice space per workstation by region, sq m (NIA)
Source: DTZ Research
Figure 10
Forecast pa increase in occupancy costs, 2014-15 and current best practice space efficiency
Source: DTZ Research
0
5
10
15
20
25
C&S America
North Asia
South Asia
Global average
Europe ME&A North America
2009 2013 Min Max
Mexico C.Taipei
Auckland
Helsinki
Dubai Ottawa
Tianjin Mumbai LisbonLA
HKG
PUN
SYD
TKO
Asia Pacific
Europe
US
2014-15 Cost increase
CHG
BEJJKT
MAD
PRG
STO MUC
KOL
LON
NYC
Hig
h E
ffic
ien
cyLo
w E
ffic
ien
cy
Low High
Box 1: Efficient workplace strategies
A creative approach to providing space for knowledge workers can enhance business performance as well as curtail occupancy costs. DTZ can generate innovative workplace strategies that respond to the unique drivers of an organization by studying the work culture of the organization, identifying useful and useless space in the current environment and ultimately help occupiers to reduce occupancy costs by eliminating “waste” space and implementing creative workplace features. These include attractive attributes such as more open and collaborative workspaces, ubiquitous technology giving people uninterrupted internet access regardless of being at a desk, and accessible social spaces where accidental and deliberate interactions deepen the web of connections between employees. A shift from the traditional office environment to a more creative workplace provides greater flexibility to today’s mobile workforce while enhancing collaboration and productivity.
Global Occupancy Costs - Offices 2014
www.dtz.com DTZ Occupier Perspective 8
Visit the Global Occupier Metrics Tool
http://occupiermetrics.dtz.com
Box 2: Global Occupier Metrics Tool
New DTZ analytical tool offers occupiers tailored solutions In November 2013, DTZ launched its Global Occupier Metrics Tool (GOMT) giving occupiers easy online access to relevant market information across 130 worldwide markets. GOMT allows occupiers to calculate occupancy costs and identify potential cost savings by considering their own space utilisation against the local markets’ best practice. By combining workplace strategy with the most up-to-date and forecasted market information, DTZ is helping occupiers to make informed choices. Typical costs savings of up to 30%, when following local best practice Companies with a typical portfolio of offices across major European capitals can save up to 30% by adjusting their space utilisation to local market best practice, according to data from DTZ Research. This assumes a typical services company occupying offices in the ten major European capitals for 1,000 employees can save up to €1.5m a year – which, given cost-to-revenue ratio. This equates to an EBITDA increase of around three per cent.
Environmental regulation
Prevailing certification systems
Local energy costs
Typical office access modal split.
(Currently EU. only)
Head count projections
Workplace strategy
Location and building type.
Provides visuals of lease area components
Converts Net Internal Area (NIA) into local Gross Lease Area (GLA).
Total occupancy cost benchmarks
Workplace density best practice
Typical fit-out costs
Tenant obligations of occupation.
Provides latest market research on: Converts and visualises net and lease area:
Total occupancy cost simulation based on: Includes environmental regulation and best practice information:
Global Occupancy Costs - Offices 2014
www.dtz.com DTZ Occupier Perspective 9
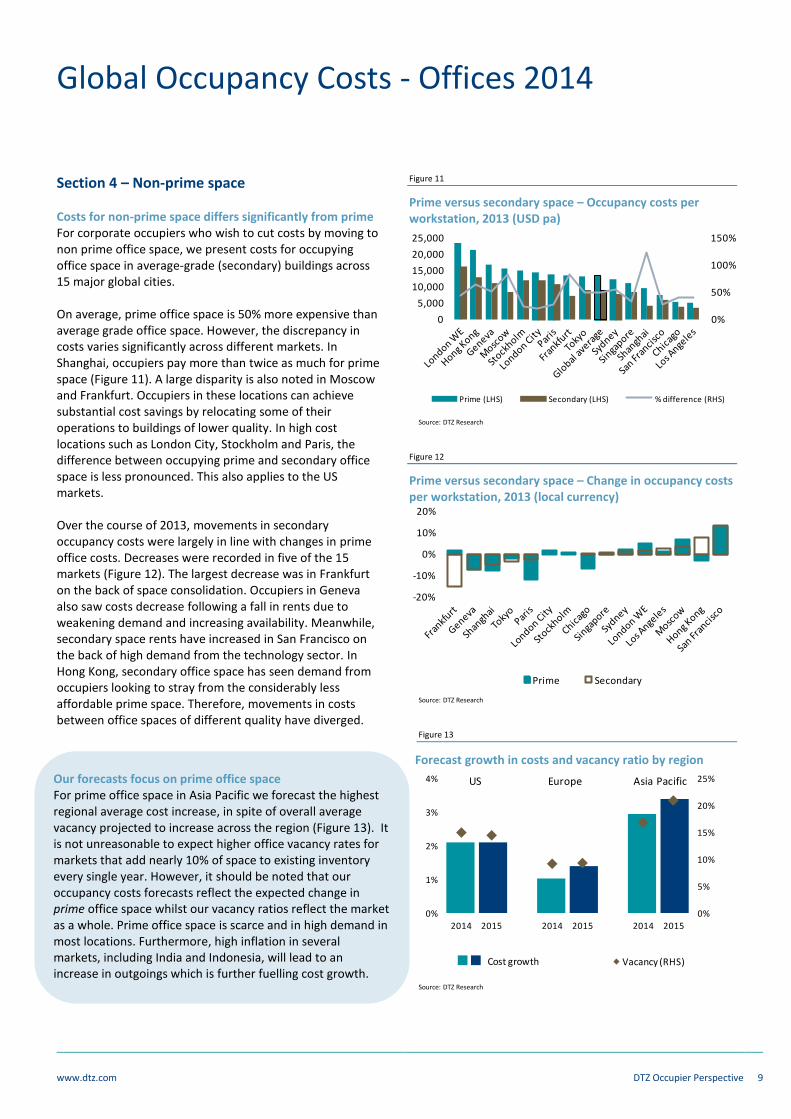
Our forecasts focus on prime office space For prime office space in Asia Pacific we forecast the highest regional average cost increase, in spite of overall average vacancy projected to increase across the region (Figure 13). It is not unreasonable to expect higher office vacancy rates for markets that add nearly 10% of space to existing inventory every single year. However, it should be noted that our occupancy costs forecasts reflect the expected change in prime office space whilst our vacancy ratios reflect the market as a whole. Prime office space is scarce and in high demand in most locations. Furthermore, high inflation in several markets, including India and Indonesia, will lead to an increase in outgoings which is further fuelling cost growth.
Section 4 – Non-prime space Costs for non-prime space differs significantly from prime For corporate occupiers who wish to cut costs by moving to non prime office space, we present costs for occupying office space in average-grade (secondary) buildings across 15 major global cities. On average, prime office space is 50% more expensive than average grade office space. However, the discrepancy in costs varies significantly across different markets. In Shanghai, occupiers pay more than twice as much for prime space (Figure 11). A large disparity is also noted in Moscow and Frankfurt. Occupiers in these locations can achieve substantial cost savings by relocating some of their operations to buildings of lower quality. In high cost locations such as London City, Stockholm and Paris, the difference between occupying prime and secondary office space is less pronounced. This also applies to the US markets. Over the course of 2013, movements in secondary occupancy costs were largely in line with changes in prime office costs. Decreases were recorded in five of the 15 markets (Figure 12). The largest decrease was in Frankfurt on the back of space consolidation. Occupiers in Geneva also saw costs decrease following a fall in rents due to weakening demand and increasing availability. Meanwhile, secondary space rents have increased in San Francisco on the back of high demand from the technology sector. In Hong Kong, secondary office space has seen demand from occupiers looking to stray from the considerably less affordable prime space. Therefore, movements in costs between office spaces of different quality have diverged.
Figure 11
Prime versus secondary space – Occupancy costs per workstation, 2013 (USD pa)
Source: DTZ Research
Figure 12
Prime versus secondary space – Change in occupancy costs per workstation, 2013 (local currency)
Source: DTZ Research
Figure 13
Forecast growth in costs and vacancy ratio by region
Source: DTZ Research
0%
50%
100%
150%
0
5,000
10,000
15,000
20,000
25,000
Prime (LHS) Secondary (LHS) % difference (RHS)
-20%
-10%
0%
10%
20%
Prime Secondary
0%
5%
10%
15%
20%
25%
0%
1%
2%
3%
4%
2014 2015 2014 2015 2014 2015
US Europe APAC
Costs growth Costs growth Vacancy (RHS)
US Europe Asia Pacific
Cost growth
Global Occupancy Costs - Offices 2014
www.dtz.com DTZ Occupier Perspective 10
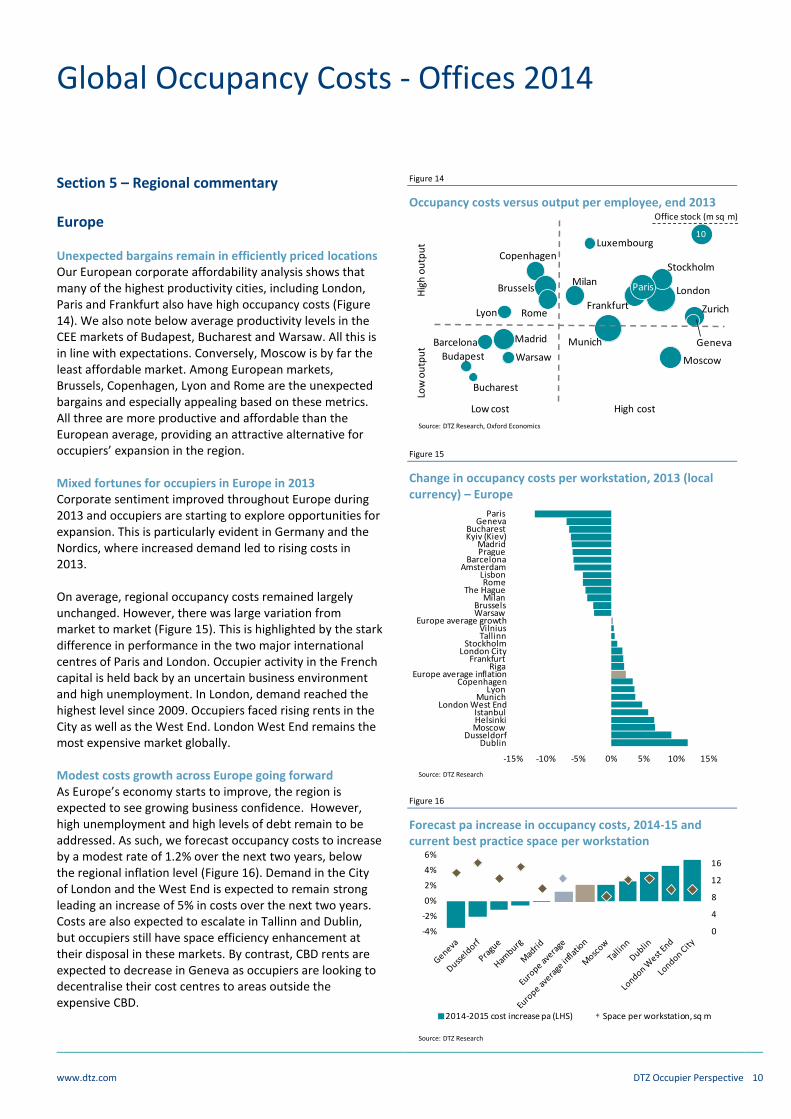
Section 5 – Regional commentary Europe Unexpected bargains remain in efficiently priced locations Our European corporate affordability analysis shows that many of the highest productivity cities, including London, Paris and Frankfurt also have high occupancy costs (Figure 14). We also note below average productivity levels in the CEE markets of Budapest, Bucharest and Warsaw. All this is in line with expectations. Conversely, Moscow is by far the least affordable market. Among European markets, Brussels, Copenhagen, Lyon and Rome are the unexpected bargains and especially appealing based on these metrics. All three are more productive and affordable than the European average, providing an attractive alternative for occupiers’ expansion in the region. Mixed fortunes for occupiers in Europe in 2013 Corporate sentiment improved throughout Europe during 2013 and occupiers are starting to explore opportunities for expansion. This is particularly evident in Germany and the Nordics, where increased demand led to rising costs in 2013. On average, regional occupancy costs remained largely unchanged. However, there was large variation from market to market (Figure 15). This is highlighted by the stark difference in performance in the two major international centres of Paris and London. Occupier activity in the French capital is held back by an uncertain business environment and high unemployment. In London, demand reached the highest level since 2009. Occupiers faced rising rents in the City as well as the West End. London West End remains the most expensive market globally. Modest costs growth across Europe going forward As Europe’s economy starts to improve, the region is expected to see growing business confidence. However, high unemployment and high levels of debt remain to be addressed. As such, we forecast occupancy costs to increase by a modest rate of 1.2% over the next two years, below the regional inflation level (Figure 16). Demand in the City of London and the West End is expected to remain strong leading an increase of 5% in costs over the next two years. Costs are also expected to escalate in Tallinn and Dublin, but occupiers still have space efficiency enhancement at their disposal in these markets. By contrast, CBD rents are expected to decrease in Geneva as occupiers are looking to decentralise their cost centres to areas outside the expensive CBD.
Figure 14
Occupancy costs versus output per employee, end 2013
Source: DTZ Research, Oxford Economics
Figure 15
Change in occupancy costs per workstation, 2013 (local currency) – Europe
Source: DTZ Research
Figure 16
Forecast pa increase in occupancy costs, 2014-15 and current best practice space per workstation
Source: DTZ Research
Luxembourg
Stockholm
LondonParis
Frankfurt
Moscow
Munich
Lyon
Copenhagen
Milan
Rome
Warsaw
MadridBarcelona
Budapest
Bucharest
Brussels
Zurich
Geneva
Low
ou
tpu
t
H
igh
ou
tpu
tLow cost High cost
Office stock (m sq m)
10
-15% -10% -5% 0% 5% 10% 15%
DublinDusseldorf
MoscowHelsinkiIstanbul
London West EndMunich
LyonCopenhagen
Europe average inflationRiga
FrankfurtLondon City
StockholmTallinnVilnius
Europe average growthWarsawBrussels
MilanThe Hague
RomeLisbon
AmsterdamBarcelona
PragueMadrid
Kyiv (Kiev)Bucharest
GenevaParis
0
4
8
12
16
-4%
-2%
0%
2%
4%
6%
2014-2015 cost increase pa (LHS) Space per workstation, sq m
Global Occupancy Costs - Offices 2014
www.dtz.com DTZ Occupier Perspective 11
North America
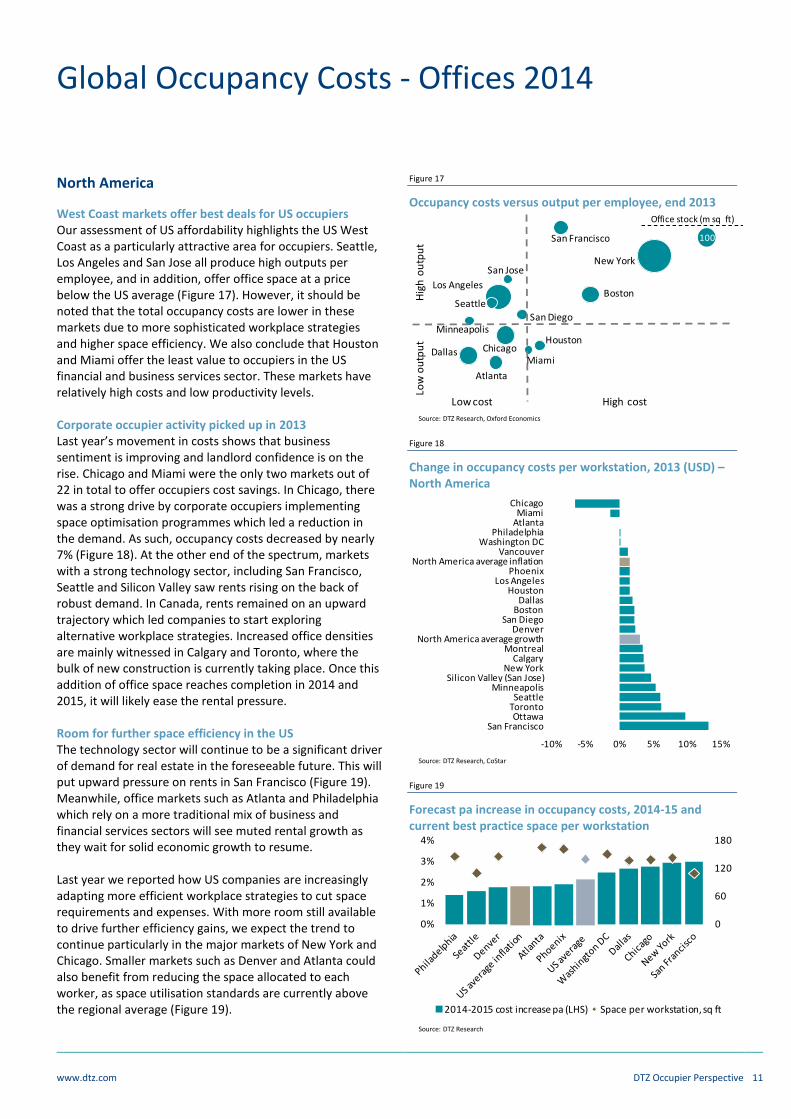
West Coast markets offer best deals for US occupiers Our assessment of US affordability highlights the US West Coast as a particularly attractive area for occupiers. Seattle, Los Angeles and San Jose all produce high outputs per employee, and in addition, offer office space at a price below the US average (Figure 17). However, it should be noted that the total occupancy costs are lower in these markets due to more sophisticated workplace strategies and higher space efficiency. We also conclude that Houston and Miami offer the least value to occupiers in the US financial and business services sector. These markets have relatively high costs and low productivity levels. Corporate occupier activity picked up in 2013 Last year’s movement in costs shows that business sentiment is improving and landlord confidence is on the rise. Chicago and Miami were the only two markets out of 22 in total to offer occupiers cost savings. In Chicago, there was a strong drive by corporate occupiers implementing space optimisation programmes which led a reduction in the demand. As such, occupancy costs decreased by nearly 7% (Figure 18). At the other end of the spectrum, markets with a strong technology sector, including San Francisco, Seattle and Silicon Valley saw rents rising on the back of robust demand. In Canada, rents remained on an upward trajectory which led companies to start exploring alternative workplace strategies. Increased office densities are mainly witnessed in Calgary and Toronto, where the bulk of new construction is currently taking place. Once this addition of office space reaches completion in 2014 and 2015, it will likely ease the rental pressure. Room for further space efficiency in the US The technology sector will continue to be a significant driver of demand for real estate in the foreseeable future. This will put upward pressure on rents in San Francisco (Figure 19). Meanwhile, office markets such as Atlanta and Philadelphia which rely on a more traditional mix of business and financial services sectors will see muted rental growth as they wait for solid economic growth to resume. Last year we reported how US companies are increasingly adapting more efficient workplace strategies to cut space requirements and expenses. With more room still available to drive further efficiency gains, we expect the trend to continue particularly in the major markets of New York and Chicago. Smaller markets such as Denver and Atlanta could also benefit from reducing the space allocated to each worker, as space utilisation standards are currently above the regional average (Figure 19).
Figure 17
Occupancy costs versus output per employee, end 2013
Source: DTZ Research, Oxford Economics
Figure 18
Change in occupancy costs per workstation, 2013 (USD) – North America
Source: DTZ Research, CoStar
Figure 19
Forecast pa increase in occupancy costs, 2014-15 and current best practice space per workstation
Source: DTZ Research
Low
ou
tpu
t
H
igh
ou
tpu
t
Low cost High cost
San Francisco
New York
Boston
Houston
Miami
San Jose
Los Angeles
Seattle
Minneapolis
Chicago
San Diego
Atlanta
Dallas
Office stock (m sq ft)
100
-10% -5% 0% 5% 10% 15%
San FranciscoOttawa
TorontoSeattle
MinneapolisSilicon Valley (San Jose)
New YorkCalgary
MontrealNorth America average growth
DenverSan Diego
BostonDallas
HoustonLos Angeles
PhoenixNorth America average inflation
VancouverWashington DC
PhiladelphiaAtlantaMiami
Chicago
0
60
120
180
0%
1%
2%
3%
4%
2014-2015 cost increase pa (LHS) Space per workstation, sq ft
Global Occupancy Costs - Offices 2014
www.dtz.com DTZ Occupier Perspective 12
North Asia
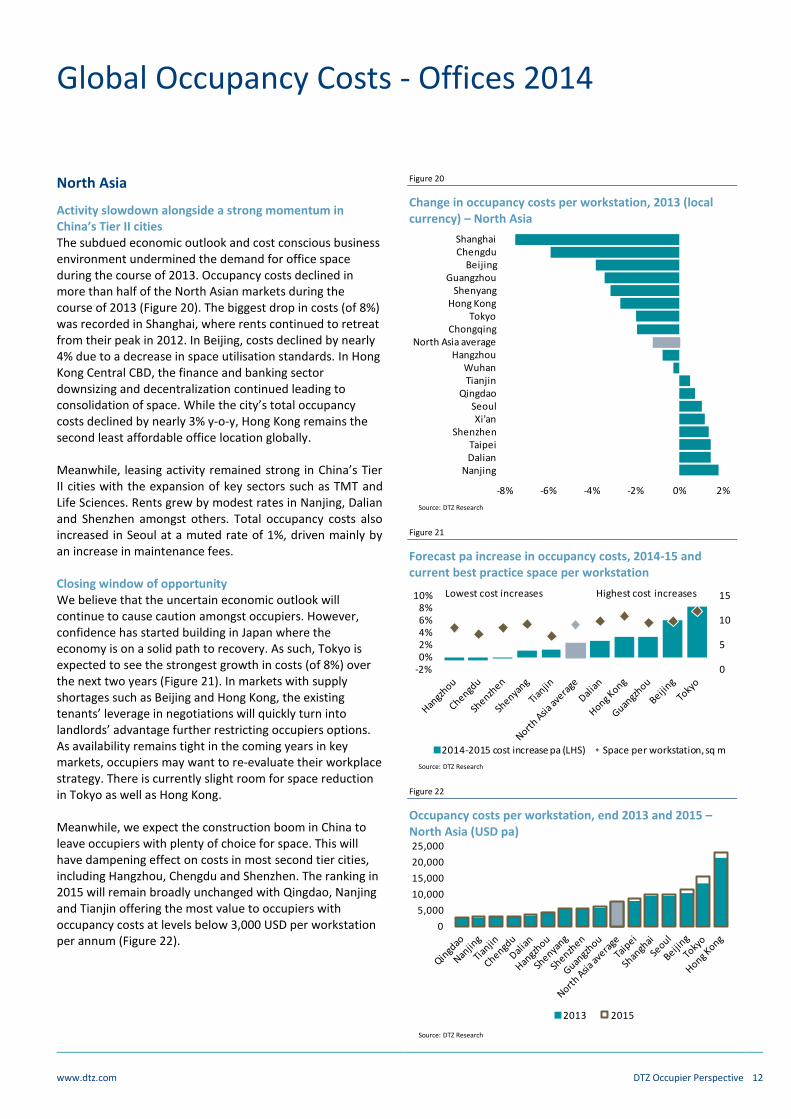
Activity slowdown alongside a strong momentum in China’s Tier II cities The subdued economic outlook and cost conscious business environment undermined the demand for office space during the course of 2013. Occupancy costs declined in more than half of the North Asian markets during the course of 2013 (Figure 20). The biggest drop in costs (of 8%) was recorded in Shanghai, where rents continued to retreat from their peak in 2012. In Beijing, costs declined by nearly 4% due to a decrease in space utilisation standards. In Hong Kong Central CBD, the finance and banking sector downsizing and decentralization continued leading to consolidation of space. While the city’s total occupancy costs declined by nearly 3% y-o-y, Hong Kong remains the second least affordable office location globally. Meanwhile, leasing activity remained strong in China’s Tier II cities with the expansion of key sectors such as TMT and Life Sciences. Rents grew by modest rates in Nanjing, Dalian and Shenzhen amongst others. Total occupancy costs also increased in Seoul at a muted rate of 1%, driven mainly by an increase in maintenance fees. Closing window of opportunity We believe that the uncertain economic outlook will continue to cause caution amongst occupiers. However, confidence has started building in Japan where the economy is on a solid path to recovery. As such, Tokyo is expected to see the strongest growth in costs (of 8%) over the next two years (Figure 21). In markets with supply shortages such as Beijing and Hong Kong, the existing tenants’ leverage in negotiations will quickly turn into landlords’ advantage further restricting occupiers options. As availability remains tight in the coming years in key markets, occupiers may want to re-evaluate their workplace strategy. There is currently slight room for space reduction in Tokyo as well as Hong Kong.
Meanwhile, we expect the construction boom in China to leave occupiers with plenty of choice for space. This will have dampening effect on costs in most second tier cities, including Hangzhou, Chengdu and Shenzhen. The ranking in 2015 will remain broadly unchanged with Qingdao, Nanjing and Tianjin offering the most value to occupiers with occupancy costs at levels below 3,000 USD per workstation per annum (Figure 22).
Figure 20
Change in occupancy costs per workstation, 2013 (local currency) – North Asia
Source: DTZ Research
Figure 21
Forecast pa increase in occupancy costs, 2014-15 and current best practice space per workstation
Source: DTZ Research
Figure 22
Occupancy costs per workstation, end 2013 and 2015 – North Asia (USD pa)
Source: DTZ Research
-8% -6% -4% -2% 0% 2%
NanjingDalianTaipei
ShenzhenXi'an
SeoulQingdao
TianjinWuhan
HangzhouNorth Asia average
ChongqingTokyo
Hong KongShenyang
GuangzhouBeijing
ChengduShanghai
0
5
10
15
-2%0%2%4%6%8%
10%
2014-2015 cost increase pa (LHS) Space per workstation, sq m
Lowest cost increases Highest cost increases
0
5,000
10,000
15,000
20,000
25,000
2013 2015
Global Occupancy Costs - Offices 2014
www.dtz.com DTZ Occupier Perspective 13
South Asia
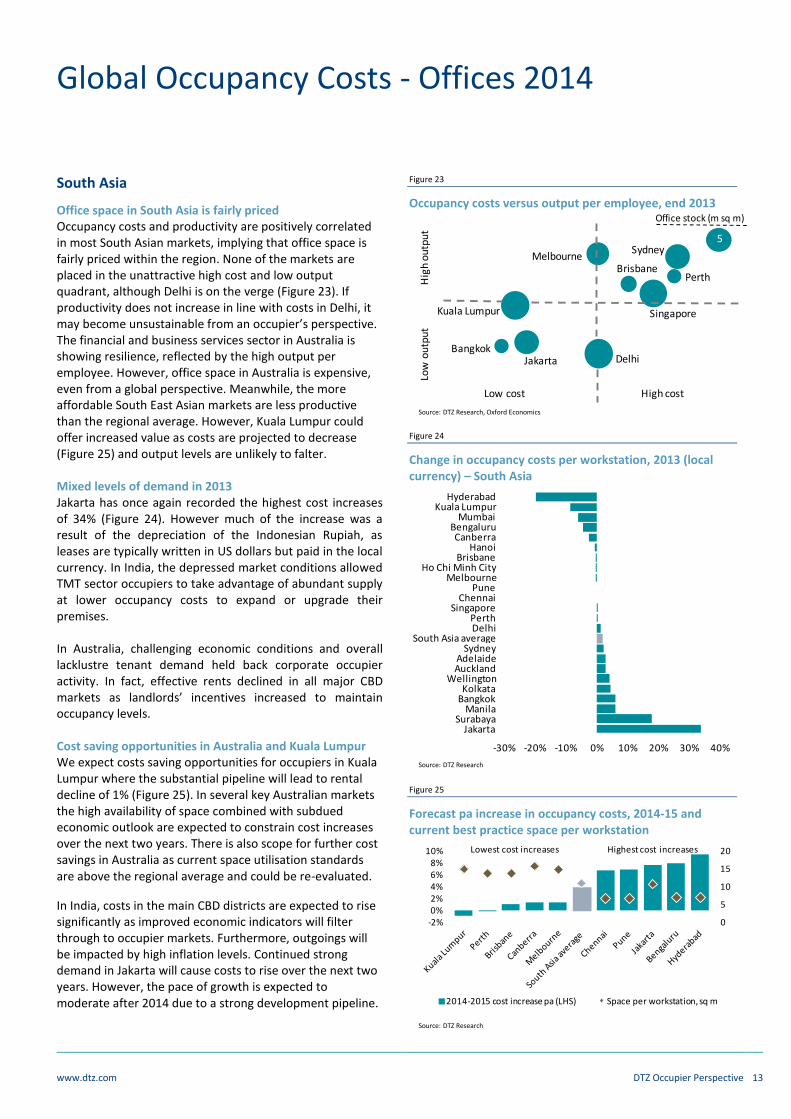
Office space in South Asia is fairly priced Occupancy costs and productivity are positively correlated in most South Asian markets, implying that office space is fairly priced within the region. None of the markets are placed in the unattractive high cost and low output quadrant, although Delhi is on the verge (Figure 23). If productivity does not increase in line with costs in Delhi, it may become unsustainable from an occupier’s perspective. The financial and business services sector in Australia is showing resilience, reflected by the high output per employee. However, office space in Australia is expensive, even from a global perspective. Meanwhile, the more affordable South East Asian markets are less productive than the regional average. However, Kuala Lumpur could offer increased value as costs are projected to decrease (Figure 25) and output levels are unlikely to falter. Mixed levels of demand in 2013 Jakarta has once again recorded the highest cost increases of 34% (Figure 24). However much of the increase was a result of the depreciation of the Indonesian Rupiah, as leases are typically written in US dollars but paid in the local currency. In India, the depressed market conditions allowed TMT sector occupiers to take advantage of abundant supply at lower occupancy costs to expand or upgrade their premises. In Australia, challenging economic conditions and overall lacklustre tenant demand held back corporate occupier activity. In fact, effective rents declined in all major CBD markets as landlords’ incentives increased to maintain occupancy levels. Cost saving opportunities in Australia and Kuala Lumpur We expect costs saving opportunities for occupiers in Kuala Lumpur where the substantial pipeline will lead to rental decline of 1% (Figure 25). In several key Australian markets the high availability of space combined with subdued economic outlook are expected to constrain cost increases over the next two years. There is also scope for further cost savings in Australia as current space utilisation standards are above the regional average and could be re-evaluated.
In India, costs in the main CBD districts are expected to rise significantly as improved economic indicators will filter through to occupier markets. Furthermore, outgoings will be impacted by high inflation levels. Continued strong demand in Jakarta will cause costs to rise over the next two years. However, the pace of growth is expected to moderate after 2014 due to a strong development pipeline.
Figure 23
Occupancy costs versus output per employee, end 2013
Source: DTZ Research, Oxford Economics
Figure 24
Change in occupancy costs per workstation, 2013 (local currency) – South Asia
Source: DTZ Research
Figure 25
Forecast pa increase in occupancy costs, 2014-15 and current best practice space per workstation
Source: DTZ Research
Low cost High cost
Low
ou
tpu
t
Hig
h o
utp
ut
Sydney
Singapore
PerthBrisbane
Melbourne
DelhiJakarta
Kuala Lumpur
Bangkok
Office stock (m sq m)15
5
-30% -20% -10% 0% 10% 20% 30% 40%
JakartaSurabaya
ManilaBangkokKolkata
WellingtonAucklandAdelaide
SydneySouth Asia average
DelhiPerth
SingaporeChennai
PuneMelbourne
Ho Chi Minh CityBrisbane
HanoiCanberra
BengaluruMumbai
Kuala LumpurHyderabad
0
5
10
15
20
-2%0%2%4%6%8%
10%
2014-2015 cost increase pa (LHS) Space per workstation, sq m
Lowest cost increases Highest cost increases
Global Occupancy Costs - Offices 2014
www.dtz.com DTZ Occupier Perspective 14
Box 3: The growing markets in Africa
Since 2001, Africa’s GDP has expanded more quickly each year than the global average. Economic growth in the region has mainly been driven by rising commodity prices, mobile technology, improved governance and increased trade, particularly with China. As such, the region is seeing increasing demand for office space from multinationals as well as domestic companies predominantly within the TMT, banking and petroleum industry. DTZ Leadenhall, headquartered in Johannesburg, South Africa, has established a major network of best-in-class third party contractors across the continent of Africa with permanent long-term networking partnerships in Angola, Ghana, Kenya, Mauritius, Nigeria and Tanzania.
Emerging markets
Central & South America
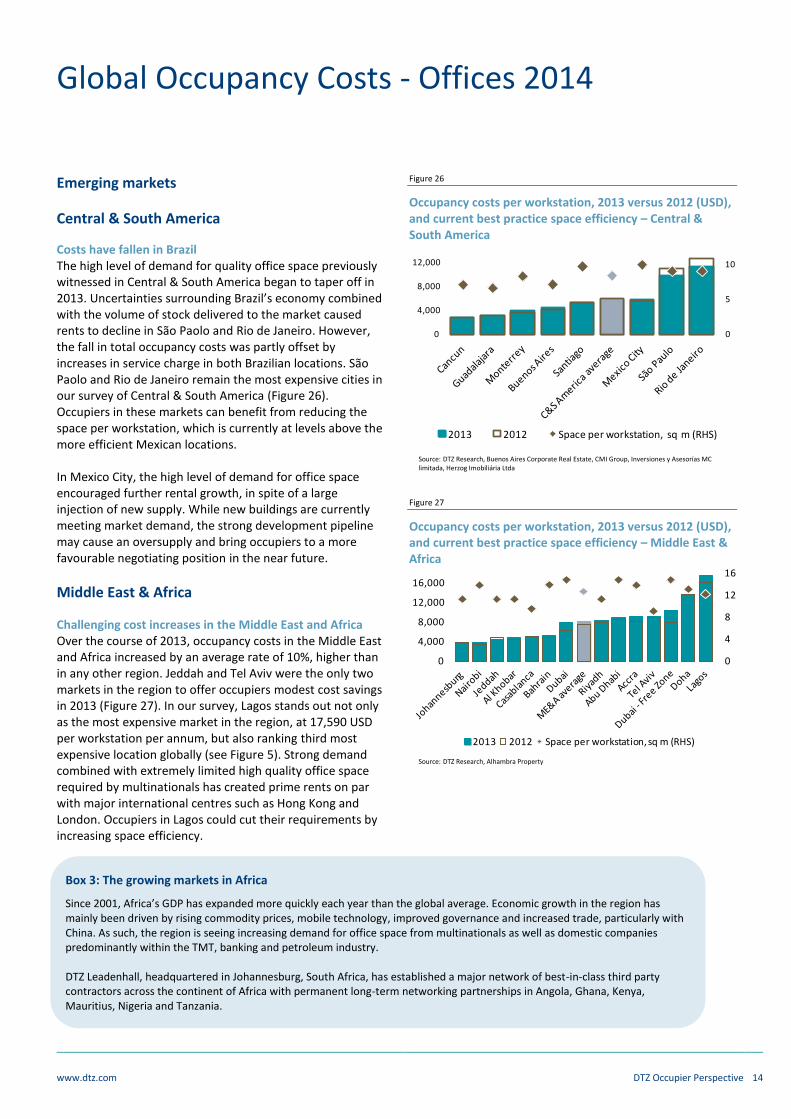
Costs have fallen in Brazil The high level of demand for quality office space previously witnessed in Central & South America began to taper off in 2013. Uncertainties surrounding Brazil’s economy combined with the volume of stock delivered to the market caused rents to decline in São Paolo and Rio de Janeiro. However, the fall in total occupancy costs was partly offset by increases in service charge in both Brazilian locations. São Paolo and Rio de Janeiro remain the most expensive cities in our survey of Central & South America (Figure 26). Occupiers in these markets can benefit from reducing the space per workstation, which is currently at levels above the more efficient Mexican locations. In Mexico City, the high level of demand for office space encouraged further rental growth, in spite of a large injection of new supply. While new buildings are currently meeting market demand, the strong development pipeline may cause an oversupply and bring occupiers to a more favourable negotiating position in the near future.
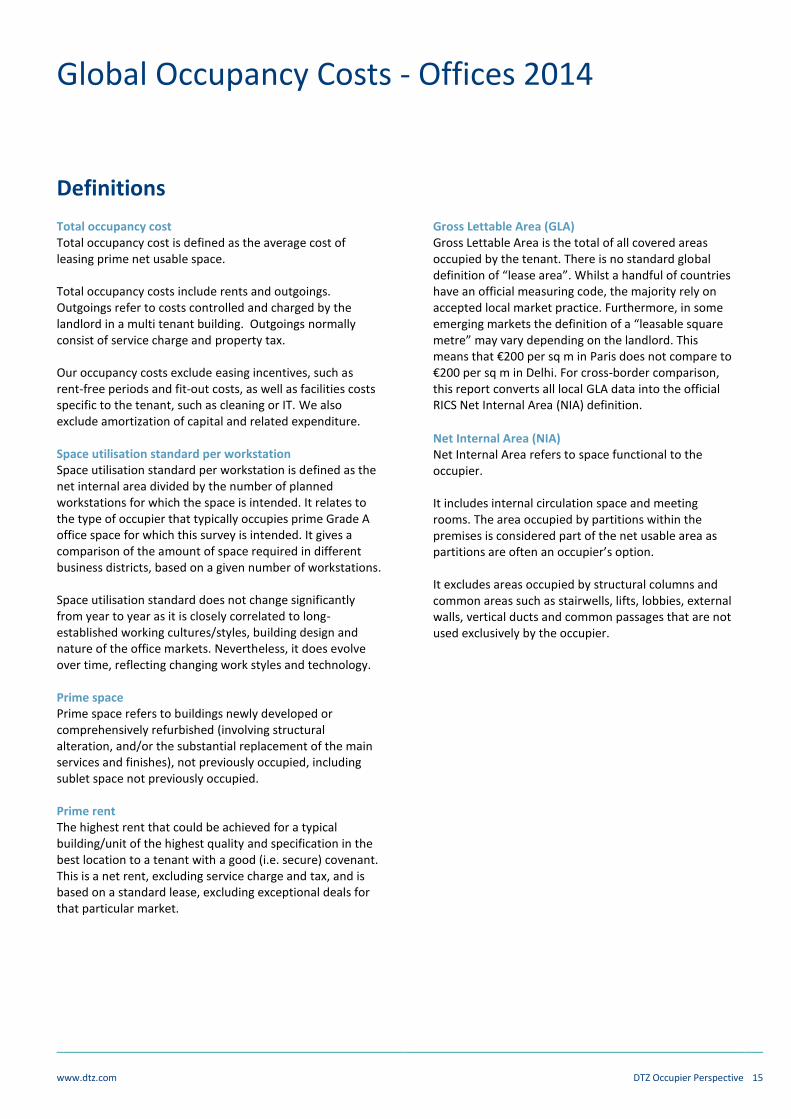
Middle East & Africa
Challenging cost increases in the Middle East and Africa Over the course of 2013, occupancy costs in the Middle East and Africa increased by an average rate of 10%, higher than in any other region. Jeddah and Tel Aviv were the only two markets in the region to offer occupiers modest cost savings in 2013 (Figure 27). In our survey, Lagos stands out not only as the most expensive market in the region, at 17,590 USD per workstation per annum, but also ranking third most expensive location globally (see Figure 5). Strong demand combined with extremely limited high quality office space required by multinationals has created prime rents on par with major international centres such as Hong Kong and London. Occupiers in Lagos could cut their requirements by increasing space efficiency.
Figure 26
Occupancy costs per workstation, 2013 versus 2012 (USD), and current best practice space efficiency – Central & South America
Source: DTZ Research, Buenos Aires Corporate Real Estate, CMI Group, Inversiones y Asesorías MC limitada, Herzog Imobiliária Ltda
Figure 27
Occupancy costs per workstation, 2013 versus 2012 (USD), and current best practice space efficiency – Middle East & Africa
Source: DTZ Research, Alhambra Property
0
5
10
0
4,000
8,000
12,000
2013 2012 Space per workstation, sq m (RHS)
0
4
8
12
16
0
4,000
8,000
12,000
16,000
2013 2012 Space per workstation, sq m (RHS)
Global Occupancy Costs - Offices 2014
www.dtz.com DTZ Occupier Perspective 15
Definitions Total occupancy cost Total occupancy cost is defined as the average cost of leasing prime net usable space.
Total occupancy costs include rents and outgoings. Outgoings refer to costs controlled and charged by the landlord in a multi tenant building. Outgoings normally consist of service charge and property tax.
Our occupancy costs exclude easing incentives, such as rent-free periods and fit-out costs, as well as facilities costs specific to the tenant, such as cleaning or IT. We also exclude amortization of capital and related expenditure.
Space utilisation standard per workstation Space utilisation standard per workstation is defined as the net internal area divided by the number of planned workstations for which the space is intended. It relates to the type of occupier that typically occupies prime Grade A office space for which this survey is intended. It gives a comparison of the amount of space required in different business districts, based on a given number of workstations.
Space utilisation standard does not change significantly from year to year as it is closely correlated to long-established working cultures/styles, building design and nature of the office markets. Nevertheless, it does evolve over time, reflecting changing work styles and technology.
Prime space Prime space refers to buildings newly developed or comprehensively refurbished (involving structural alteration, and/or the substantial replacement of the main services and finishes), not previously occupied, including sublet space not previously occupied. Prime rent The highest rent that could be achieved for a typical building/unit of the highest quality and specification in the best location to a tenant with a good (i.e. secure) covenant. This is a net rent, excluding service charge and tax, and is based on a standard lease, excluding exceptional deals for that particular market.
Gross Lettable Area (GLA) Gross Lettable Area is the total of all covered areas occupied by the tenant. There is no standard global definition of “lease area”. Whilst a handful of countries have an official measuring code, the majority rely on accepted local market practice. Furthermore, in some emerging markets the definition of a “leasable square metre” may vary depending on the landlord. This means that €200 per sq m in Paris does not compare to €200 per sq m in Delhi. For cross-border comparison, this report converts all local GLA data into the official RICS Net Internal Area (NIA) definition.
Net Internal Area (NIA) Net Internal Area refers to space functional to the occupier. It includes internal circulation space and meeting rooms. The area occupied by partitions within the premises is considered part of the net usable area as partitions are often an occupier’s option. It excludes areas occupied by structural columns and common areas such as stairwells, lifts, lobbies, external walls, vertical ducts and common passages that are not used exclusively by the occupier.
Global Occupancy Costs - Offices 2014
www.dtz.com DTZ Occupier Perspective 16
Other DTZ Research Reports Other research reports can be downloaded from www.dtz.com/research. These include:
Occupier Perspective Updates on occupational markets from an occupier perspective, with commentary, analysis, charts and data. Global Occupancy Costs Offices Global Occupancy Costs Logistics Obligations of Occupation Americas Obligations of Occupation Asia Pacific Obligations of Occupation EMEA Global Office Review Regional Headquarters Asia Pacific- November 2013 Sweden - Computer Games developers – November 2013 India Office Demand and Trends Survey 2012-13 Poland Banking Sector - January
Property Times Regular updates on occupational markets from a landlord perspective, with commentary, charts, data and forecasts. Coverage includes Asia Pacific, Bangkok, Beijing, Berlin, Brisbane, Bristol, Brussels, Budapest, Central London, Chengdu, Chongqing, Dalian, Edinburgh, Europe, Frankfurt, Glasgow, Guangzhou, Hangzhou, Ho Chi Minh City, Hong Kong, India, Jakarta, Japan, Kuala Lumpur, Luxembourg, Madrid, Manchester, Melbourne, Milan, Nanjing, Newcastle, Paris, Poland, Prague, Qingdao, Rome, Seoul, Shanghai, Shenyang, Shenzhen, Singapore, Stockholm, Sydney, Taipei, Tianjin, Ukraine, Warsaw, Wuhan, Xian.
Investment Market Update Regular updates on investment market activity, with commentary, significant deals, charts, data and forecasts. Coverage includes Asia Pacific, Australia, Belgium, Czech Republic, Europe, France, Germany, Italy, Japan, Mainland China, South East Asia, Spain, Sweden, UK.
Money into Property For more than 35 years, this has been DTZ's flagship research report, analysing invested stock and capital flows into real estate markets across the world. It measures the development and structure of the global investment market. Available for Global, Asia Pacific, Europe, North America and UK.
Foresight Quarterly commentary, analysis and insight into our in-house data forecasts, including the DTZ Fair Value Index™. Available for Global, Asia Pacific, Europe, UK and China. In addition we publish an annual outlook report.
Insight Thematic, ad hoc, topical and thought leading reports on areas and issues of specific interest and relevance to real estate markets. China Investment Market Sentiment Survey January 2014 China The Technology Sector January 2014 Insight Czech Republic Green buildings December 2013 Net Debt Funding Gap - November 2013 UK secondary market pricing - October 2013 German Open Ended Funds - October 2013 Great Wall of Money - October 2013 Quantitative Easing - UK Regions - September 2013 Singapore Government Land Sales - September 2013 UK lending market -September 2013 Quantitative Easing - August 2013 Property Investment Guide Asia Pacific 2013-2014
DTZ Research Data Services
For more detailed data and information, the following are available for subscription. Please contact [email protected] for more information.
Property Market Indicators Time series of commercial and industrial market data in Asia Pacific and Europe.
Real Estate Forecasts, including the DTZ Fair Value Index
TM
Five-year rolling forecasts of commercial and industrial markets in Asia Pacific, Europe and the USA.
Investment Transaction Database Aggregated overview of investment activity in Asia Pacific and Europe.
Money into Property DTZ’s flagship research product for over 35 years providing capital markets data covering capital flows, size, structure, ownership, developments and trends, and findings of annual investor and lender intention surveys.
www.dtz.com DTZ Occupier Perspective 17
DTZ Research
DTZ Research Contacts
Global Head of Research Hans Vrensen Phone: +44 (0)20 3296 2159 Email: [email protected] Head of Forecasting Fergus Hicks Phone: +44 (0)20 3296 2307 Email: [email protected] Head of Strategy Research Nigel Almond Phone: +44 (0)20 3296 2328 Email: [email protected] Head of UK Research Richard Yorke Phone: +44 (0)20 3296 2319 Email: [email protected] Head of CEMEA Research Magali Marton Phone: +33 1 49 64 49 54 Email: [email protected]
Head of North Asia Research Andrew Ness Phone: +852 2507 0507 Email: [email protected] Head of South East Asia / Australia New Zealand Research Dominic Brown Phone: +61 (0)2 8243 9999 Email: [email protected] Head of Americas Research John Wickes Phone: +1 312 424 8087 Email: [email protected] Head of Asia Pacific Forecasting and Strategy Dennis Fung Phone: +852 2250 8864 Email: [email protected]
DTZ Business Contacts
Global Occupier Services Steven Quick Phone: +1 312 424 8182 Email: [email protected] Global Occupier Services, EMEA James Maddock Phone: +44 (0)20 3296 3353 Email: [email protected] Global Occupier Services, APAC Adam Catchpole Phone: +852 2507 0729 Email: [email protected]
Global Occupier Services, US Martin Woodrow Phone: +1 303 729 2356 Email: [email protected]
Global Occupier Services, Workplace Strategy Antonia Cardone Phone: +1 415 352 2673 Email: [email protected]
DISCLAIMER This report should not be relied upon as a basis for entering into transactions without seeking specific, qualified, professional advice. Whilst facts have been rigorously checked, DTZ can take no responsibility for any damage or loss suffered as a result of any inadvertent inaccuracy within this report. Information contained herein should not, in whole or part, be published, reproduced or referred to without prior approval. Any such reproduction should be credited to DTZ. © DTZ February 2014
We thank the following for their contribution to this year’s report: Alhambra Property (Morocco), B Prime Property Advisors (Portugal), Buenos Aires Corporate Real Estate (Argentina), CMI Group (Mexico), Herzog Imobiliária Ltda (Brazil), Inversiones y Asesorías MC limitada (Chile), J+P Gewerbeimmobilien Beratungs GmbH (Austria) and Valeur SA (Greece)