Embed Size (px)
Citation preview

Neurotox and Cardiac Safety Assessment: Case
Studies Employing iPS Cell lines and Next Generation
MEA Technology

Workshop Outline
In vitro Assessments of Drug-induced Neuronal Modulationand MEA-based Seizure Prediction
Blake Anson, PhD Cellular Dynamics International
Comprehensive In-vitro Proarrhythmia Assay (CiPA)MEA and hiPSC-cardiomyocytes as reproducible and predictive tools for detecting proarrhythmia
Hong Shi, PhD Bristol-Myers Squibb
Get Ready to LEAPTM
Mike Clements, PhD AXION Biosystems
Please use this link to access the seizure prediction slides
Please use this link to access more information on iCell Cardiomyocytes and Cardiomyocytes2
Please use this link to learn more about the Maestro Edge

In vitro Assessments of Drug-induced Neuronal Modulationand MEA-based Seizure Prediction
Blake Anson, PhD Cellular Dynamics International
Please use this link to access the slides

Comprehensive In-vitro Proarrhythmia Assay (CiPA)
MEA and hiPSC-cardiomyocytes as reproducible and predictive tools for detecting proarrhythmia
Hong Shi, MD BMS

Talk Outline
Comprehensive In-vitro Proarrhythmia Assay (CiPA)
System stability and cross site reproducibility
• CiPA Paradigm
• MEA Tracings and Drug Effects
• Baseline and Control Responses• Data from BMS
• CiPA Compound Responses• Data from BMS
• Multi-site Correlations
• Summary
iCell Cardiomyocytes2
MaestroMultiwell MEA Platform

Short CiPA Overview
Comprehensive In-vitro Proarrhythmia Assay (CiPA)
Cross site correlations

Human iPSC-derived cardiomyocytes and MEA recordings detect
electrophysiological phenotypes related to key mechanistic effects.
MEA Tracings
Phenotypes of hiPSC-CM Electrophysiology

• Baseline histograms were compiled across 14 separate 48-well plates for BP, AMP, FPDc (Fridericia), and BP Coefficient of Variability.
• BP CoV and AMP passed the CiPAPhase 2 Protocol inclusion criteria.
• BP, BP CoV, and FPDc were highly reliable across plates for the study.
Human iPSC-derived cardiomyocytes and MEA recordings provide a stable
platform for detect electrophysiological phenotypes
Baseline Data
Safety assays require a consistent phenotype across wells and plates

The label-free assay supports reliable and minimal responses to vehicle
control responses, enabling sensitive detection of the positive control.
0.5nM Dofetilide- IC50 ~ 12nM1
- Used a submaximal
concentrations for
maximal system
sensitivity1Snyders and Chaudhary,
1996
Negative control- Inter-plate stability
- Also used as experimental check
Vehicle and Positive Controls
Detection of positive control compounds defines assay sensitivity

Compound selection was determined by experts and designed to cross
multiple classifications with concentrations that bracket the therapeutic level
CiPA Phase 2 Compounds
Detection of positive control compounds defines assay sensitivity

Low risk compounds generally had little effect on FPDc or elicited a shortening of FPDc.
Intermediate risk compounds ranged from minimal to significant prolongation of FPDc.
High risk compounds consistently induced significant prolongation.
Human iPSC-derived cardiomyocytes and MEA recordings show appropriate
compound classification for arrhythmogenic potential
Low Risk Intermediate Risk High Risk
0/9 compounds showed FPDc
prolongation >50% by 30x
Cmax
Note: EADs included for FPDc calculation
5/11 compounds
showed FPDc
prolongation
>50% by 30x
Cmax
7/8 compounds showed
FPDc prolongation >50%
by 30x Cmax
Compound ResponsesBMS Data

Data from BMS matched well with that from multiple sites (Eisai, Genentech, Axion)
Overall the test system shows good multi-site reproducibility
Data divergence generally occurred at >30X Cmax, or upon incidence of EADs
Low Risk Intermediate Risk High Risk
Human iPSC-derived cardiomyocytes and MEA recordings show reproducible
classification results across multiple sites
Compound ResponsesMulti-Site Data

• Each point in the scatter plot represents the percent change in FPDc at two sites for a single compound and concentration.
• The data show extremely high correlation for conditions that do not elicit EADs, and good correlation even when EADs are present.
• The CiPA Phase 2 data was highly correlated across all sites using the CDI/Maestro cell-platform combination.
BMS AXN GNE ESI
BMS 1 0.94 0.95 0.94
AXN 0.94 1 0.89 0.92
GNE 0.95 0.89 1 0.95
ESI 0.94 0.92 0.95 1
Blinova et al. submitted
Human iPSC-derived cardiomyocytes and MEA recordings show reproducible
quantitative data across multiple sites
Multi-Site Correlations
Site-to-site consistency highlights a reliable assay
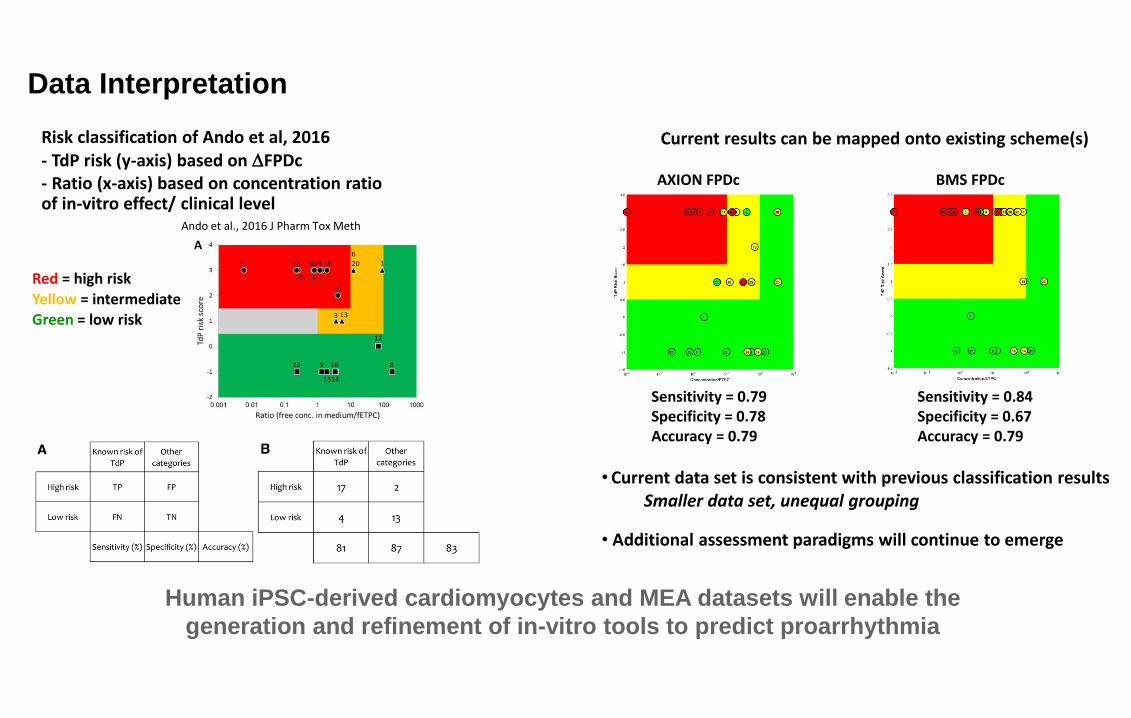
Risk classification of Ando et al, 2016- TdP risk (y-axis) based on FPDc- Ratio (x-axis) based on concentration ratio of in-vitro effect/ clinical level
Red = high risk
Yellow = intermediateGreen = low risk
Ando et al., 2016 J Pharm Tox Meth
AXION FPDc
Sensitivity = 0.79Specificity = 0.78Accuracy = 0.79
Sensitivity = 0.84Specificity = 0.67Accuracy = 0.79
BMS FPDc
Human iPSC-derived cardiomyocytes and MEA datasets will enable the
generation and refinement of in-vitro tools to predict proarrhythmia
•Current data set is consistent with previous classification resultsSmaller data set, unequal grouping
• Additional assessment paradigms will continue to emerge
Data Interpretation
Current results can be mapped onto existing scheme(s)

• Positive Controls
• Reproducible (see left)
• Were used at sub-maximal concentrations
(0.5nM Dofetilide) to demonstrate
detection of sensitive effects
• Compound Responses
• Highly correlated across sites (≥ 0.89)
• Risk Classification was robust across sites
• Translated well to available clinical data
• Baseline data was reproducible• Across MEA plates
• Experimental days
• Experimental sites
• Vehicle controls• Were highly reproducible (see above)
• Acted as an internal system check
Human iPSC-derived cardiomyocytes and MEA recordings provide an
efficient, robust, and translatable in-vitro paradigm for predicting
proarrhythmia
Summary
Site-to-site consistency highlights a reliable assay

03.12.18 Society of Toxicology

Field Potential Signal for the CM-MEA Assay
Relationship to the Cardiomyocyte Signal Spectrum
Clinical ECG
Action Potential
Field Potential
LEAP
Field Potential

Field
Potential
LEAP
Local Extracellular Action Potential (LEAP)
How does it work?
Adapted from Borkholder, 1998
LEAP
Field Potential
Sealing Resistance GΩ
Re
co
rde
d A
mp
litu
de
(m
V)
Transmembrane Potential
Patent Pending

Maestro Pro & Edge
World’s most advanced MEA platforms
Maestro Pro & EdgeBioCore v4

Local Extracellular Action Potential (LEAP)
Signal Specifications
5-20 mV
Peak-to-PeakSNR ~1000+
Stable for 10-20+ minutes after induction
10 mV
FP at Same Scale
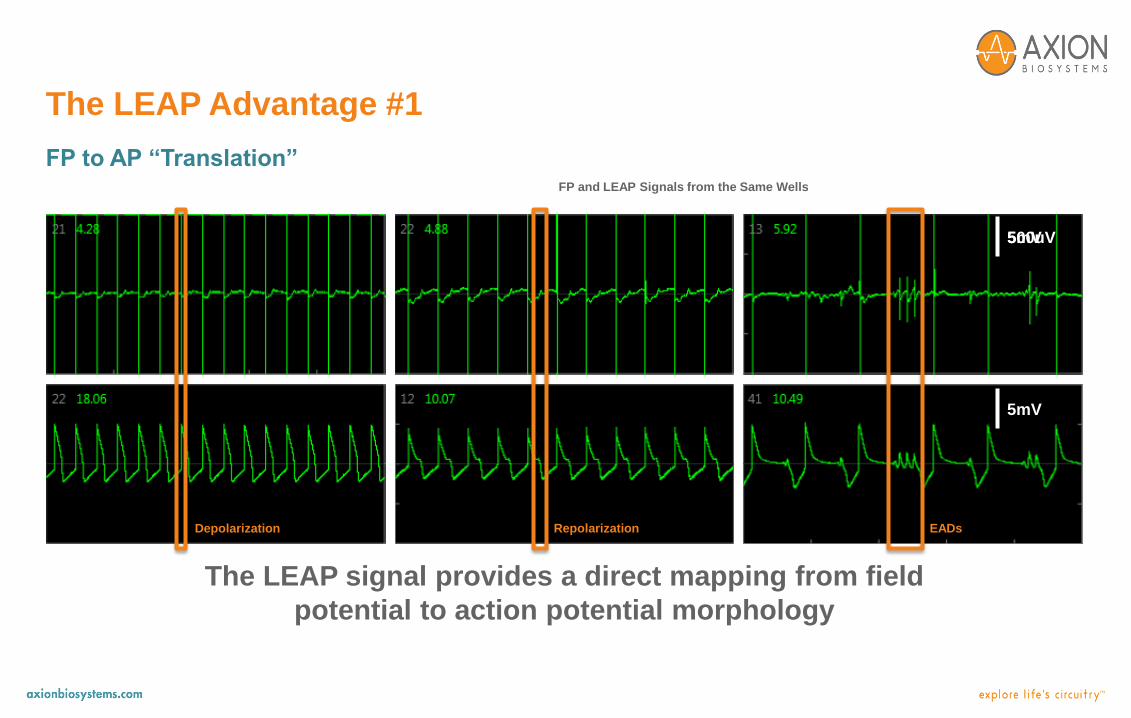
The LEAP Advantage #1
FP to AP “Translation”
500uV5mV
5mV
The LEAP signal provides a direct mapping from field
potential to action potential morphology
FP and LEAP Signals from the Same Wells, 10x Zoom on the FP
Depolarization Repolarization EADs

The LEAP Advantage #2
Arrhythmia/EAD Detection
The LEAP signal improves the accuracy of automated
analysis, and allows automation of EAD detection

The LEAP Advantage #2
Arrhythmia/EAD Detection
The updated CiPA Analysis Tool provides automated EAD
detection for LEAP signals, as well as other LEAP endpoints.

The LEAP Advantage #3
LEAP Morphology
The LEAP signal provides additional and complementary
metrics to the standard CM-MEA field potential assay
LEAP Duration (LEAPD)
5mV
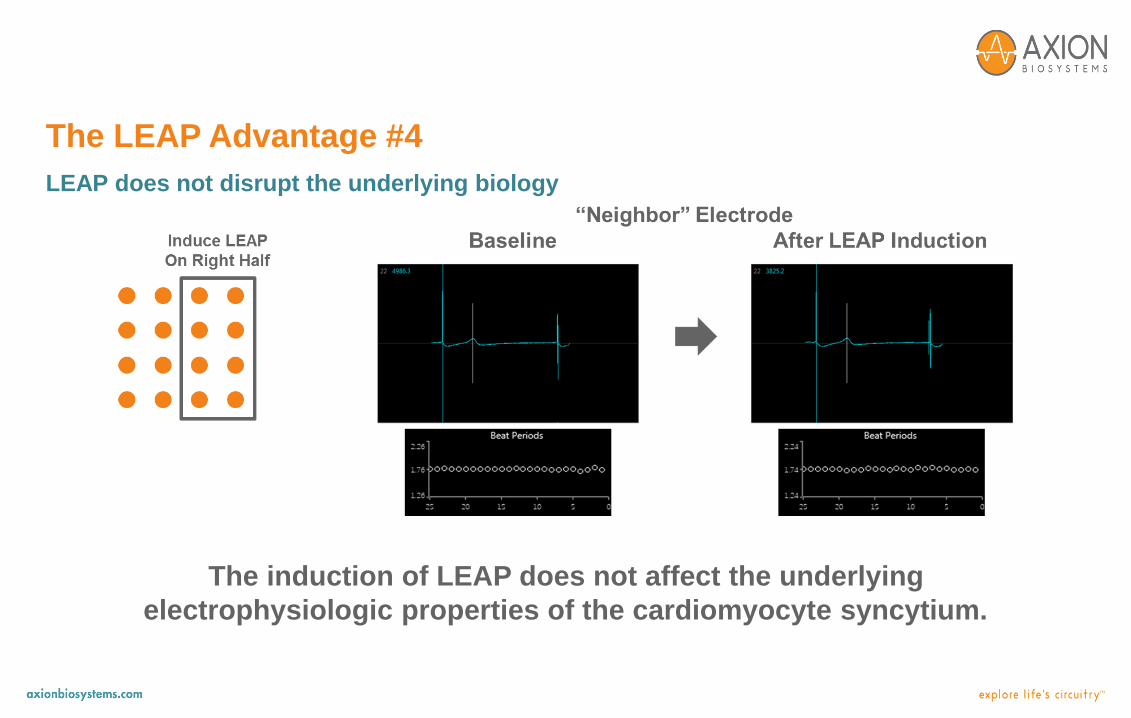
The induction of LEAP does not affect the underlying
electrophysiologic properties of the cardiomyocyte syncytium.
The LEAP Advantage #4
LEAP does not disrupt the underlying biology

Implementing the LEAP Assay
2mV100uV
800m
s
Baseline Dosed LEAP

LEAP Case Study on Selective Blockers
L-Type Calcium Block
(Nifedipine)
hERG Potassium Block
(E-4031)
Multi-Ion Channel Block
(Verapamil)

LEAP Case Study on Selective Blockers
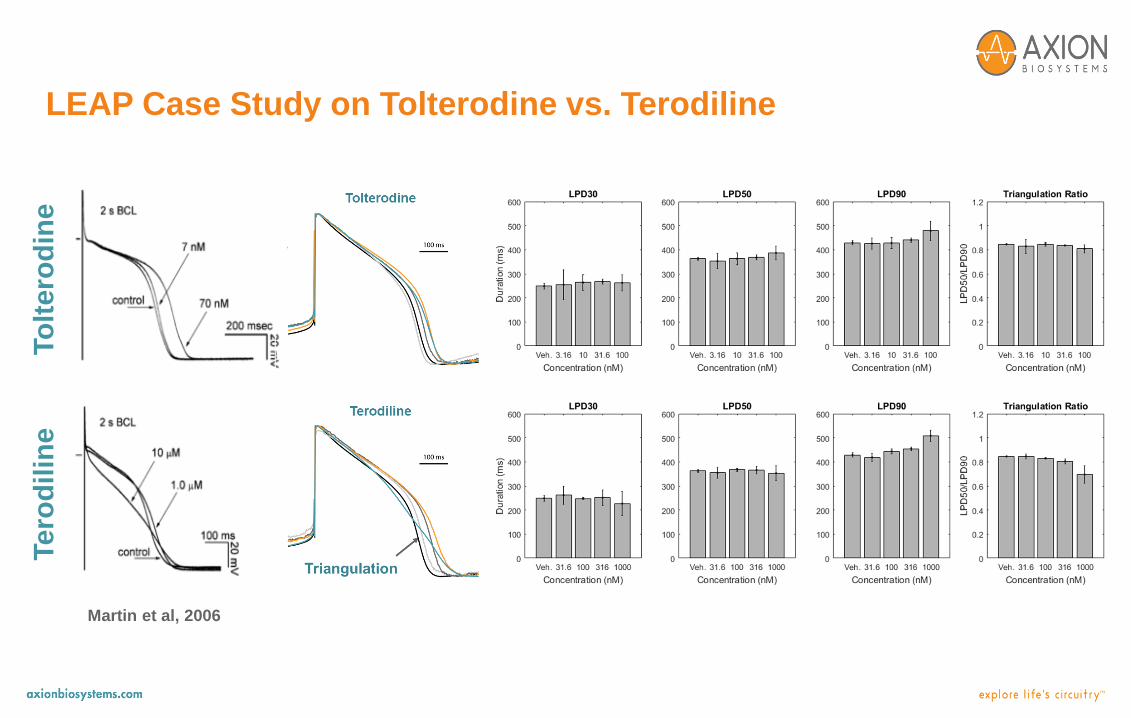
LEAP Case Study on Tolterodine vs. Terodiline
To
ltero
din
eTe
rod
ilin
e
Martin et al, 2006
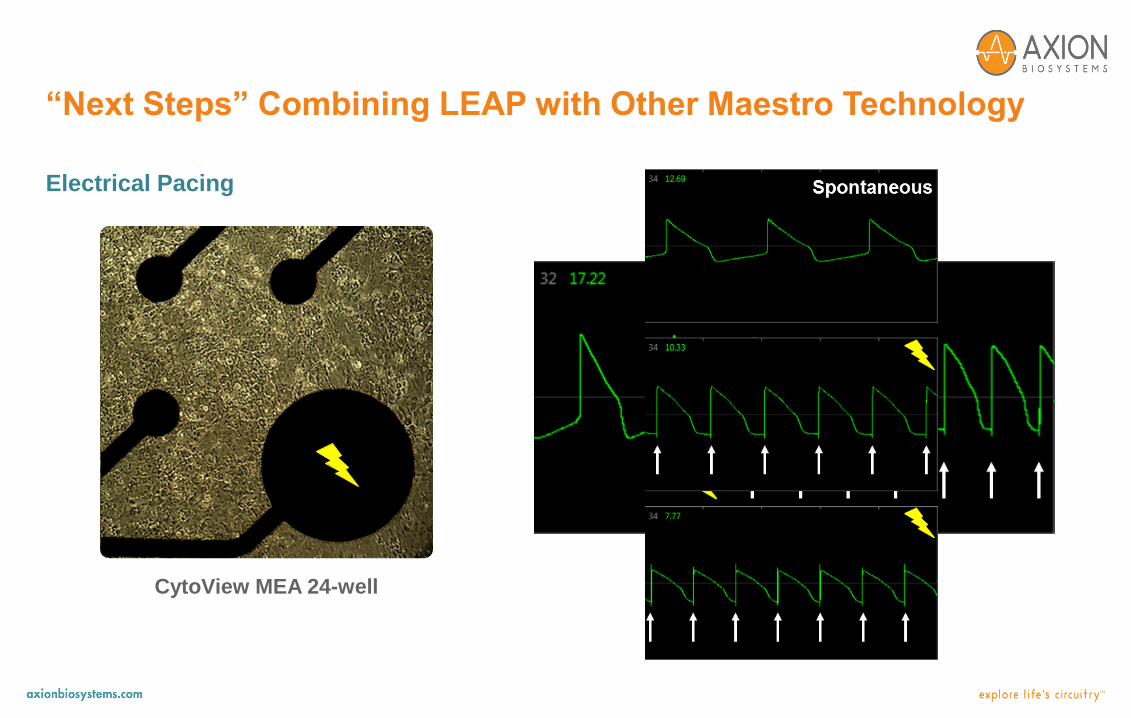
“Next Steps” Combining LEAP with Other Maestro Technology
CytoView MEA 24-well
Electrical Pacing

Maestro Pro Enables Next Generation Applications
• The Local Extracellular Action Potential (LEAP) signal adds a new dimension to the
standard CM-MEA assay
• A simple, label-free induction phase produces the LEAP signal, which is characterized
by:
• An action potential-like waveform with high amplitude
• Stability on the time scale of 10-20+ minutes
• LEAP enables:
• Clear translation of field potential signals to action potential signals
• Improvements in automated EAD detection
• Analysis of LEAP morphology to provide additional end points
• LEAP does not disrupt the underlying biology
Announcing the LEAP Assay for use in Spring 2018!

Acknowledgments
Daniel Millard
Heather Hayes
Anthony Nicolini
Colin Arrowood
Jim Ross
Visit www.axionbio.com
For more information on
the
Maestro ProTM and EdgeTM

Booth #1342Tuesday March 13 | 1:30 - 3:30pm
Poster P691
Learn more about LEAP