Embed Size (px)
Citation preview
MODEL PATHWAYS IN LIGNIN THERMOLYSIS
by
Michael T. Klein (Doctoral Candidate)andPreetinder S. Virk (Associate Professor, Chemical Engineering)
ENERGY LABORATORY REPORT NO. MIT-EL 81-005
This report is a digest of a doctoral thesis submitted in February 1981to the Department of Chemical Engineering, Massachusetts Institute ofTechnology, Cambridge, Mass.
The research was supported by seed funds from the MIT Energy Laboratory.
0-i~ "
~'~s.^~" '''"^""'1 14~4~-~lI~i: : i: e
i"';f~~";r~n: ~I -i.-i , ~
r..
:.:..r..
i

MODEL PATHWAYS IN LIGNIN THERMOLYSIS
by
Michael T. Klein and Preetinder S. Virk
Department of Chemical EngineeringMassachusetts Institute of Technology, Cambridge, MA 02139
TABLE OF CONTENTS
Abstract .......... ................ ........ 21.1 Introduction...................................... 31.2 Motivation .................................. 31.3 Lignin.............................................. 41.4 Previous Pyrolyses................. ............ 12
1.4.1 Previous Lignin Pyrolyses..................121.4.2 Previous Model Compound Pyrolyses............191.4.3 Limitations of Previous Work..................22
1.5 Present Approach.......................... ........... 231.5.1 Analysis of Lignin Structure .................. 231.5.2 Selection of Model Compounds.................271.5.3 Simulation of Lignin Thermolysis..............30
1.6 Experimental Methods................................331.7 Experimental Results ............................ 37
1.7.1 Phenethyl Phenyl Ether(PPE) Pyrolysis ......... 371.7.2 Summary of Experimental Results...............55
1.8 Implications of Experimental Results ............. 621.9 Simulated Lignin Thermolysis........................661.10 Discussion......................................74
1.10.1 The Mechanism of PPE Pyrolysis..............741.10.2 Comparison Between Simulated and Experimental
Lignin Pyrolyses............................801.11 Summary and Conclusions............................901.12 References. ................................. .. 93
MODEL PATHWAYS IN LIGNIN THERMOLYSIS
by
Michael T. Klein and Preetinder S. Virk
Department of Chemical EngineeringMassachusetts Institute of Technology, Cambridge, MA 02139
ABSTRACT
A fundamental description of lignin thermolysis was attempted.
Analysis of the chemical topology of lignin suggested likely re-action pathways of import to lignin pyrolysis. In turn, 20 model compoundpyrolysis substrates were selected to mimic the important reactive func-tional groups present in whole-lignin thermolysis. The more salient modelswere: phenethyl phenyl ether (PPE)0~'To) , which depicts the most preva-lent lignin interunit linkage, guaiacol c V , model of the predominantaromatic methoxyl, and saligenol r@" and cinnamyl alcohol %i H , modelsof important propanoid side chains.
Detailed pathway and kinetic analyses and determination of reactionArrhenius parameters provided mechanistic insights into the model compoundpyrolyses. Several pericyclic reaction mechanisms, hitherto not mentionedin the lignin pyrolysis literature, were suggested. In particular, PPElikely pyrolyses via a concerted retro-ene mechanism, whereas guaiacol andsaligenol may respectively eliminate methane and water by concerted grouptransfers.
A statistical interpretation of the lignin substrate coupled withthe experimental model compound pyrolyses allowed simulation of whole-lignin thermolysis. The simulations were in substantial agreement withexperimental pyrolyses reported in the literature in regard to overall gas,methane, carbon monoxide, individual phenols, and carbonaceous residueyields. Weight loss kinetics deduced from the time dependency of thelatter yield also accorded well with the experimental literature.
1. Summary
1.1 Introduction
ThiS thesis attempts a fundamental description of lignin thermolysis.
A series of 20 different lignin model compounds were pyrolysed in the ex-
perimental portion of this work. A mathematical lignin thermolysis model
was developed, based on both the experimental model pathways and a theo-
retical interpretation of lignin structure.
The investigation comprised three major components. First a critical
examination of lignin and lignin chemistry was undertaken, aimed at dis-
cerning likely thermolysis reaction pathways. On the basis of this theo-
retical analysis, model compounds mimicking the essential reactive units
of the whole-lignin substrate were selected and pyrolysed. The reaction
pathways suggested by the model compound pyrolyses were then coupled with
the structural analysis of whole- lignin to formulate a mathematical sim-
ulation model for whole-lignin thermolysis. Hence, the experimental model
compound results were coupled with the theoretical analysis in an effort to
describe the essential features of whole-lignin thermolysis.
1.2 Motivation
The increased utilization of biomass and coal resource bases must
be accompanied by an enhanced understanding of the fundamental events
effecting their thermal processing. The elucidation of these fundamentals
should greatly assist in the selection of catalysts, solvents, and process
operating conditions for optimal substrate conversion, as well as provide
insight into the expected results of operating in regions devoid of ex-
perimental detai-ls. The objective of this investigation is an elucidation
of the important reaction pathways and mechanisms involved in lignin
pyrolysis, with an aim toward providing a rationalization and prediction
of observed lignin pyrolysis products and kinetics.
Lignin is a major component of biomass, accounting for up to
about 36% of wood by weight. The U. S. coal reserve is composed of pre-
dominantly lignite, subbituminous, and bituminous coals, the respective
percentages being 28%, 27%, and 43%.2 In view of the evolutionary linkage
of lignin to low rank coal, the high percentage of low rank bituminous
and lignitic coals suggests that lignin therm)olysis may be relevant to
many aspects of coal pyrolysis.
Both coal and lignin are ill-defined refractory'substrates which
lack unequivocal chemical structures. Their pyrolyses yield complex and
poorly characterized product spectra. Thus, the reaction pathways and
mechanisms involved in the pyrolyses of these complex substrates have re-
mained obscure. This motivated the use of model compounds, where the
products from pyrolysis of ; awll defined substrate may be used to infer
reaction pathways, kinetics, and mechanisms.
1.3 Lignin
Pure lignin is a natural phenolic polymer composed of carbon,
hydrogen, and oxygen. The ultimate lignin precursors are carbon dioxide
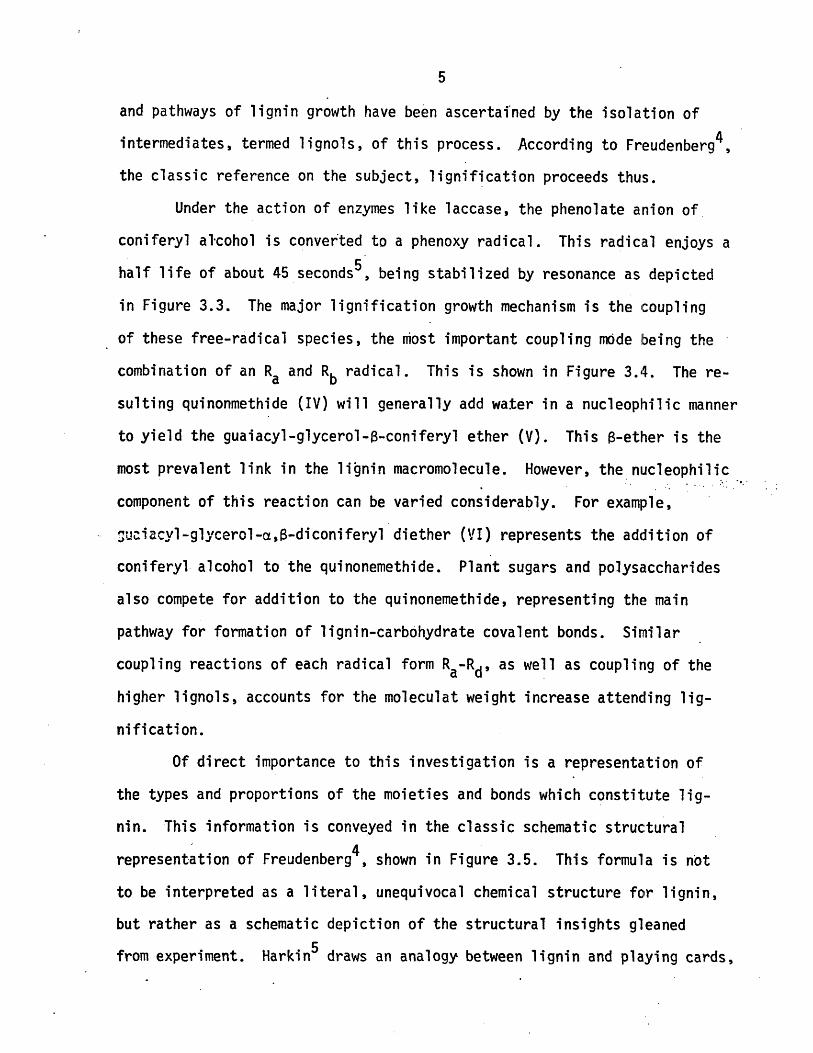
and water, biosynthetic fixation of which4 produces coumaryl, coniferyl,
and sinapyl alcohols, shown below. These three alcohols are the sole
CONIFERYL SINAPYL COUMARYL
monomeric precursors to lignin, with coniferyl alcohol predominant.
Natural lignification can be artificially duplicated by the en-
zymatic, oxidative dehydrogenation of coniferyl alcohol, which eventually
yields an amorphous polymer very similar to conifer lignin. The mechanisms
5
and pathways of lignin growth have been ascertained by the isolation of
intermediates, termed lignols, of this process. According to Freudenberg4,
the classic reference on the subject, lignification proceeds thus.
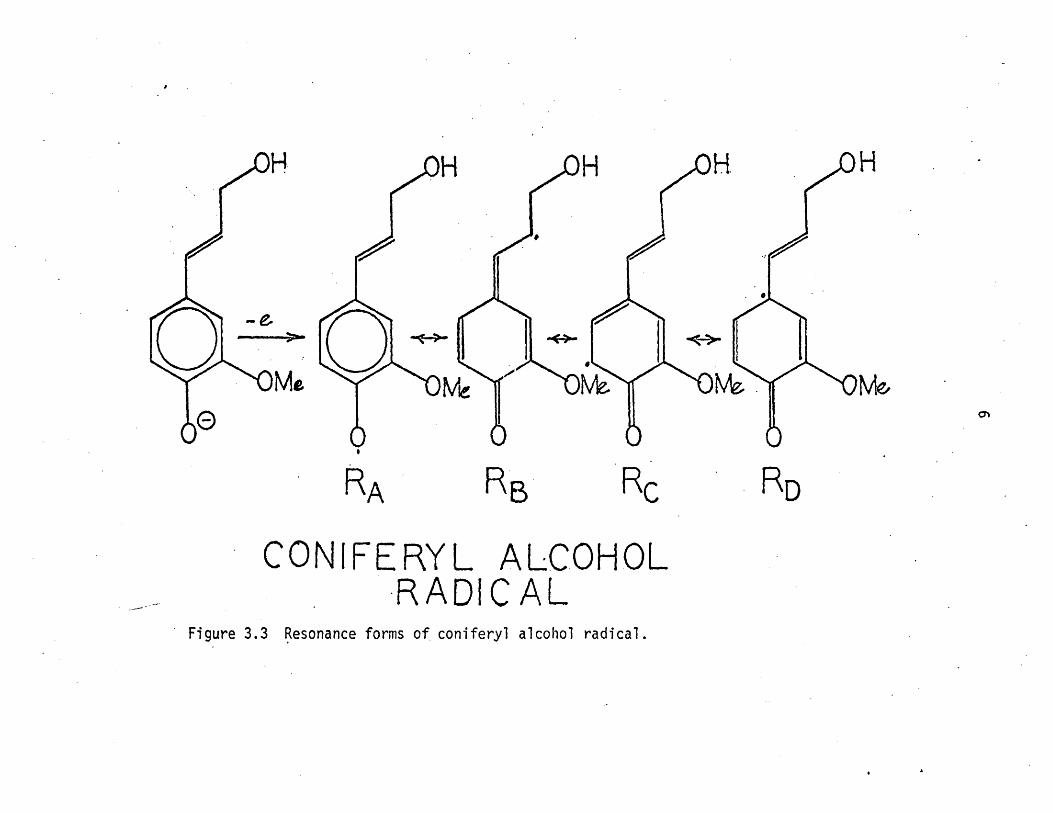
Under the action of enzymes like laccase, the phenolate anion of
coniferyl alcohol is converted to a phenoxy radical. This radical enjoys a
half life of about 45 seconds5, being stabilized by resonance as depicted
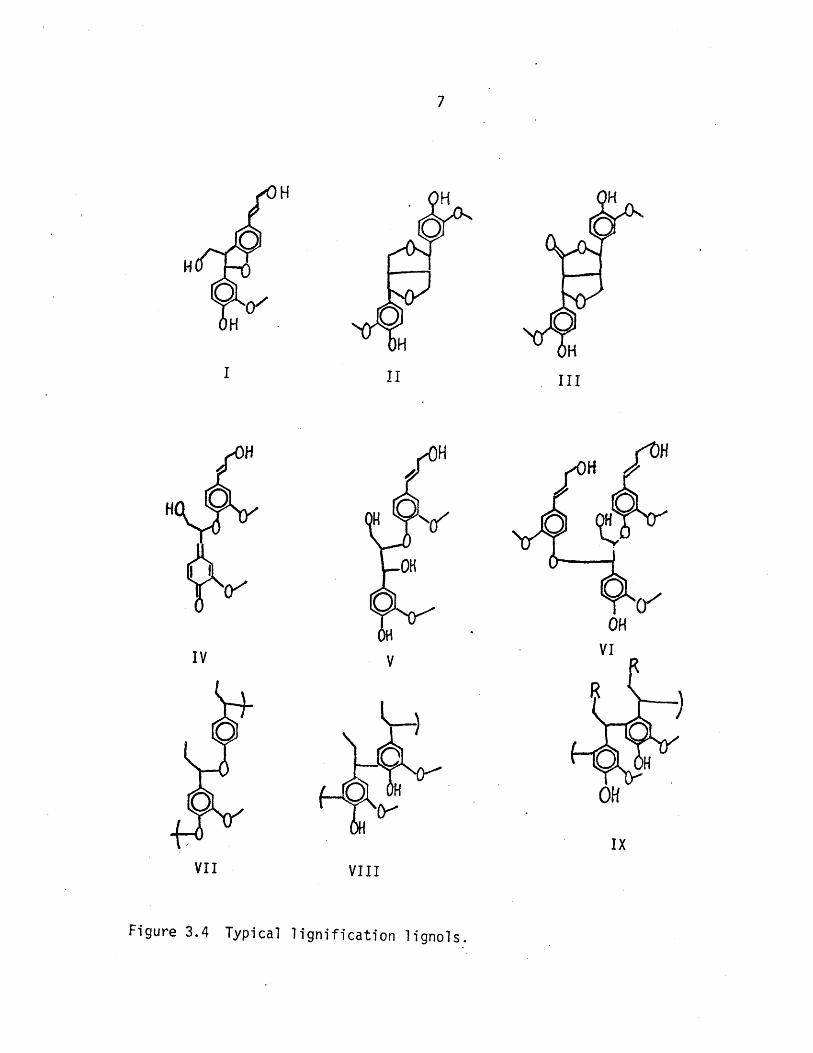
in Figure 3.3. The major lignification growth mechanism is the coupling
of these free-radical species, the most important coupling mode being the
combination of an Ra and Rb radical. This is shown in Figure 3.4. The re-
sulting quinonmethide (IV) will generally add water in a nucleophilic manner
to yield the guaiacyl-glycerol-B-coniferyl ether (V). This B-ether is the
most prevalent link in the lignin macromolecule. However, the nucleophilic
component of this reaction can be varied considerably. For example,
Suiacyl-glycerol-a,B-diconiferyl diether (VI) represents the addition of
coniferyl alcohol to the quinonemethide. Plant sugars and polysaccharides
also compete for addition to the quinonemethide, representing the main
pathway for formation of lignin-carbohydrate covalent bonds. Similar
coupling reactions of each radical form Ra-Rd , as well as coupling of the
higher lignols, accounts for the moleculat weight increase attending lig-
nification.
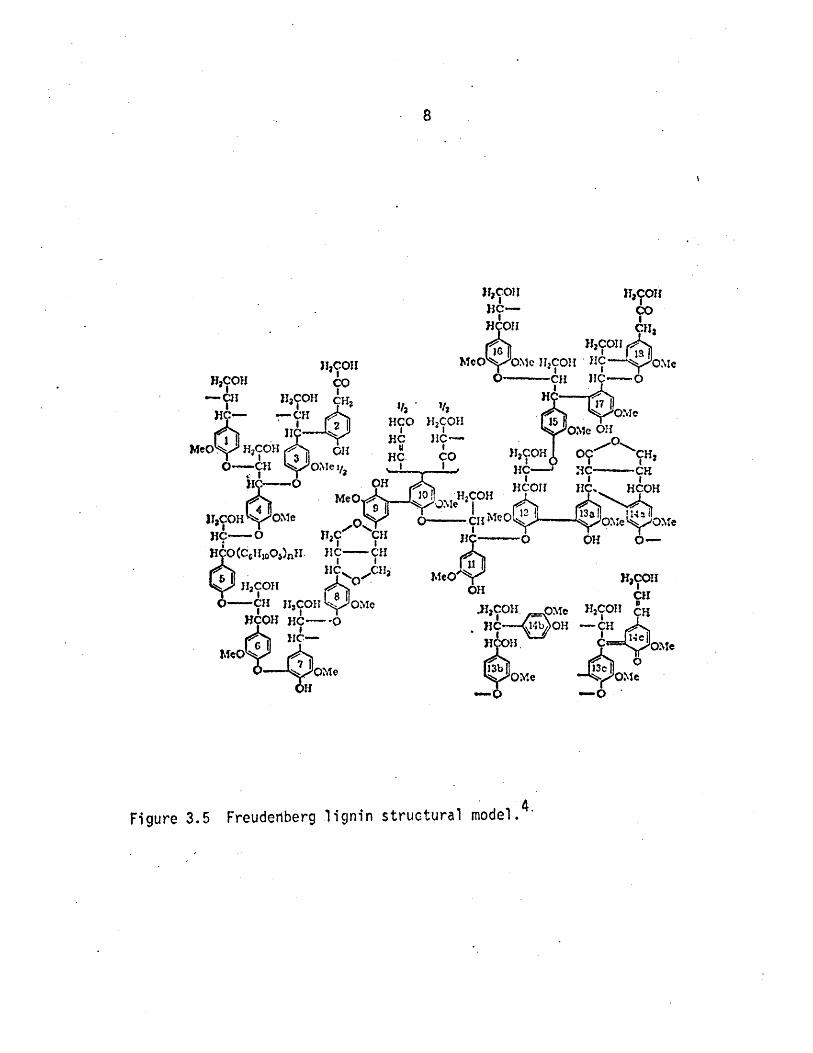
Of direct importance to this investigation is a representation of
the types and proportions of the moieties and bonds which constitute lig-
nin. This information is conveyed in the classic schematic structural
representation of Freudenberg4 , shown in Figure 3.5. This formula is not
to be interpreted as a literal, unequivocal chemical structure for lignin,
but rather as a schematic depiction of the structural insights gleaned
from experiment. Harkin 5 draws an analogy between lignin and playing cards,
MeQ-m&oM
Rc
CONIFERYL ALCOHOLRADICAL
Figure 3.3 Resonance forms of coniferyl alcohol radical.
II III
VIII
Figure 3.4 Typical lignification lignols.
VII
8
I ICOT
ITzCOil C113
MoO I I
01CI 1IZCOH C
k% Ome0.1Hc HiC- 0
Oi 1C. CO 11CO 0 Iiz0-CH ~ O O~ej.
MeO 10! lCH JOJ C ici
110-OH OH 0-I 8"oos OH PNC l
li -0 C 01I 0 OJe IiI l
I~O -Ci H11C0 01 1 -!3 omlo ;C011.11T l
Mol li - - 1e
I "c - IUlb;j OH- CH
Figureic 315 Fruebr linn tutua noe.
emphasizing the existence of a broad statistical distribution of well
known but also well shuffled chemical structures that cannot possibly be
represented in one formula. Only in the limit of infinite statistical
sampling, or infinite schematic forimula size can lignin structure truly be
realized. This emphasizes the importance of bond and moiety-, types and
their frequency distributions in lignin description. Note, for example,
that the linkages between units 1-4, 4-5, 5-6, 7-8, 10-11, 12-15, and 15-16
in Figure 3.5 are all of the B-ether type. This is clearly the single most
predominant interunit linkage.
For the present purposes the best characterization of Freudenberg's
structure was effected in terms of the phenolic units and the propanoid
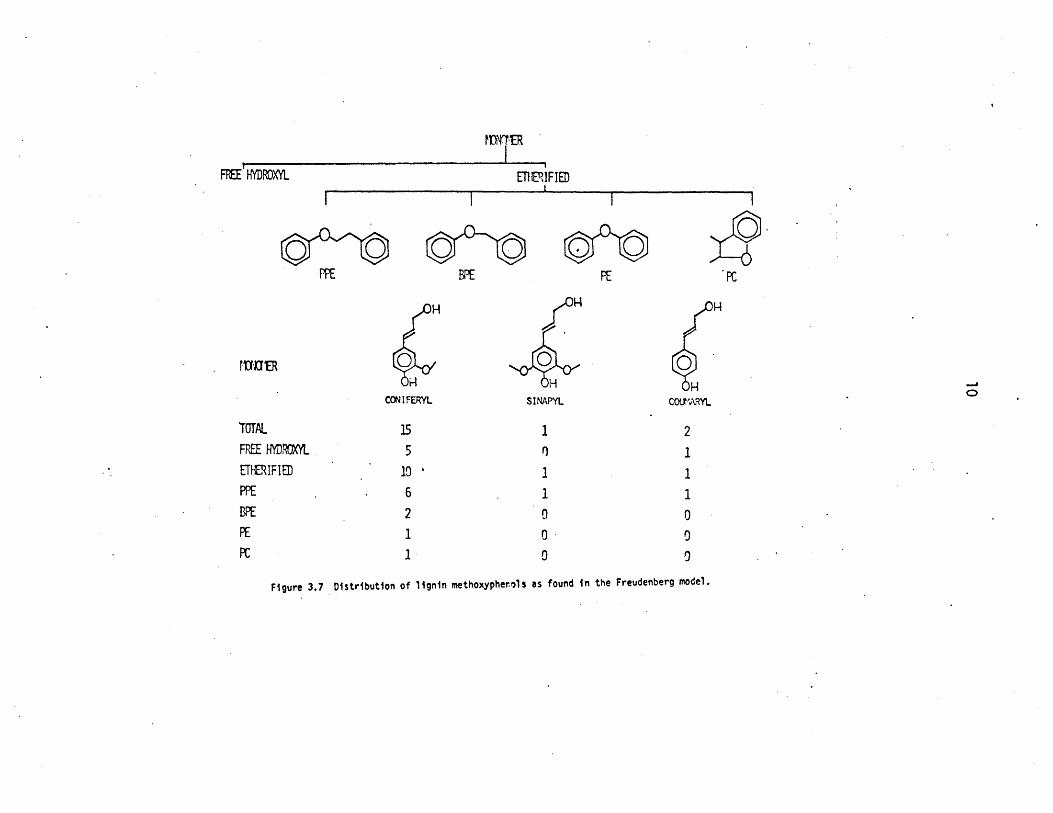
side chains of each monomer. Figure 3.7 schematically represents the types
of methoxyphenol units in Figure 3.5. The three monomer alcohols are
divided into two types, those with etherfied hydroxyls and those with free
phenolic hydroxyls. The former category is further subdivided according to
ether type. Because of the large percentage of coniferyl alcohol monomer
incorporated into the lignin macromolecule, "guaiacols, either free or
B-etherified, account for the largest proportion of the methoxyphenol units
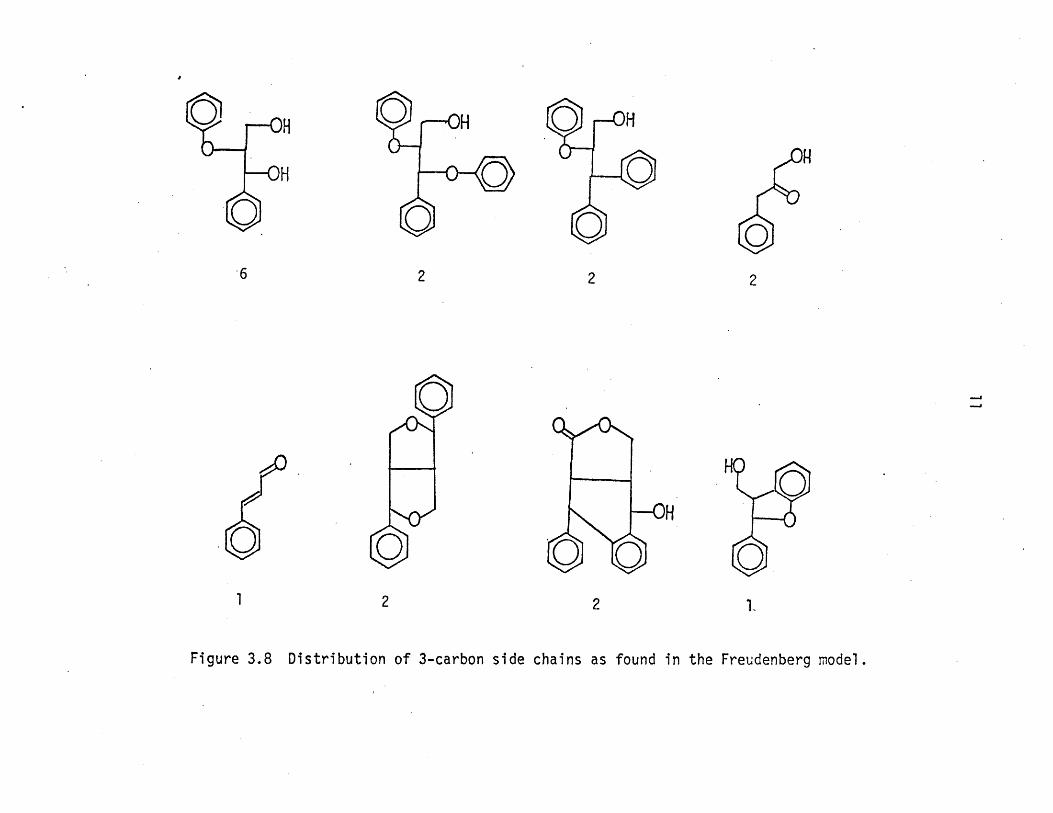
in a spruce lignin. The propanoid side chains occuring in Figure 3.5 are
shown in Figure 3.8. Despite the apparent complexity of the Freudenberg
structure, there exist but eight side chain types. The most prevalent of
these is the B-etherified guaiacyl-glycerol moiety, which occurs, e.g., as
the siae chain to unit 6. The mechanisms of lignification suggest that
while the side chain of one aromatic unit may be involved in a lignin link-
age with the guaiacyl moiety of another monomeric unit, it cannot be in-
volved in bonding with its own guaiacyl moiety. With regard to the
Freudenberg structure, this point implies that the side chain shown for
FREE HYDROXYL ETIERIFIED
PPE BPE
CON I FERY
CON IFERYL
PE
O
COiJEARYLSINAPYL
TOTAL 15 1 2FRE HYDROXYL 5 0 1ETHERIFIED 10 ' 1 I
PPE 6 1 1BPE 2 0 0PE 1 0 0PC 1 0 0
Figure 3.7 Distribution of lignin methoxypherols as found in the Freudenberg model.
FDNrrE9
I
EIIERiFIEDI
PC
2 2
-- 2
2 OH .
T 2 21
Distribution of 3-carbon side chains as found in the Freudenberg model.Figure 3.8

unit 6, for example, might be associated with any of the methoxyphenol
moieties shown for units 6, 7, 8, and 3, in proportions related to the
probabilities of the given methoxyphenol and side chain unit derived from
Figures 3.7 and 3.8.
1.4 Previous Work
A major goal of the present work was elucidation of the fundamental
reaction pathways involved in lignin pyrolysis. This section will consider
previous pyrolyses of lignin and lignin model compounds.
1.4.1 Previous Lignin Pyrolyses
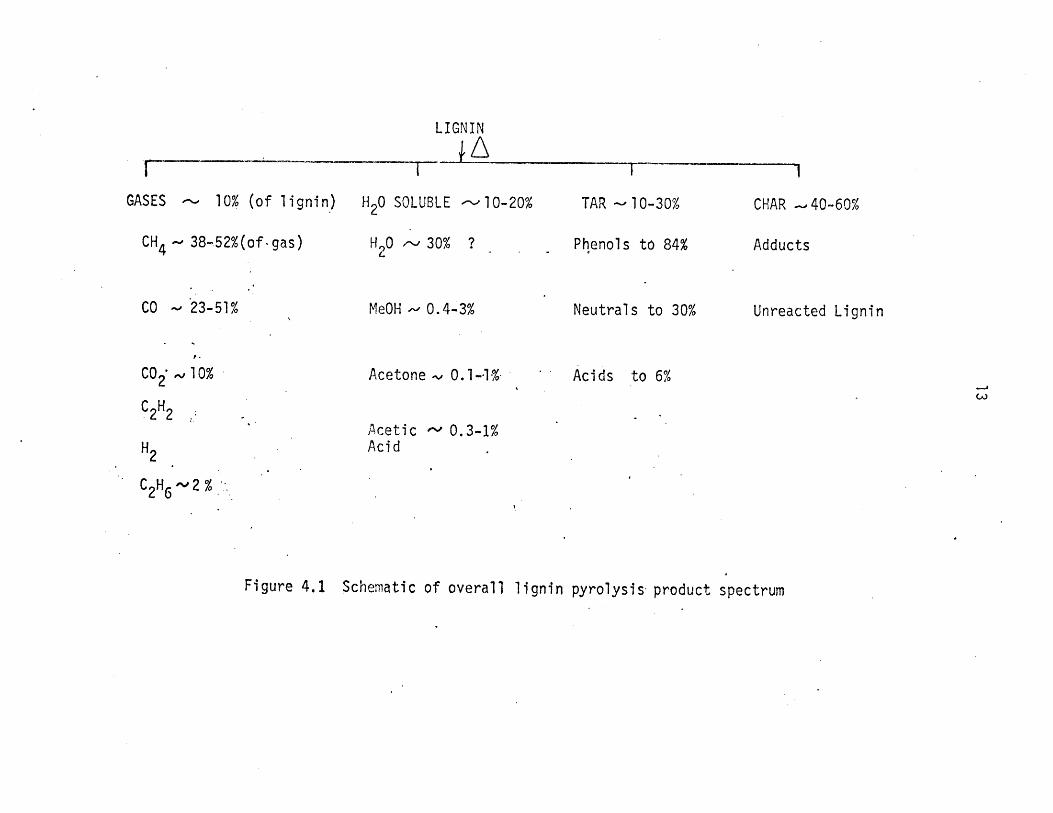
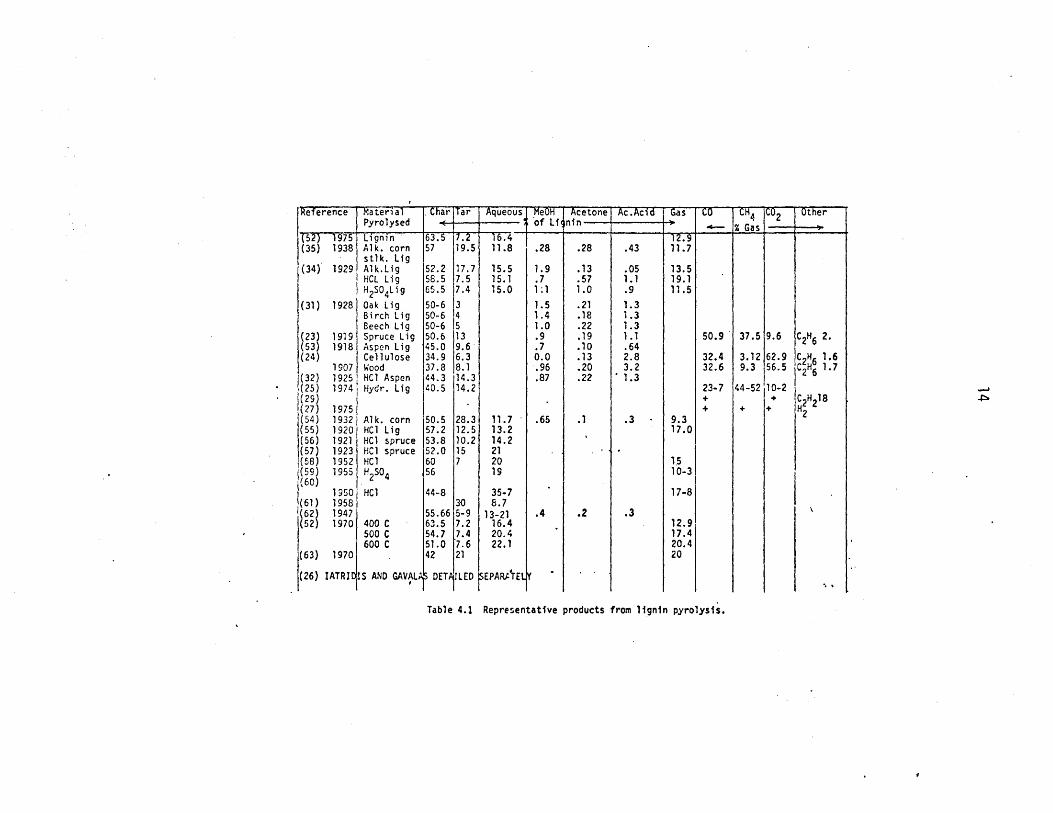
Figure 4.1 is a summary of major lignin pyrolysis products and Table
4.1 is a representative listing of the major pyrolysis products reported in
the literature.Gases
As illustrated in Table 4.1, total gas yields average 15% by weight
of lignin pyrolysed, the major product gases being CH4, CO, CO2 , and ethane.
Heuser and Skioldebrand 23 obtained a gas consisting of 50.9% CO, 37.5% CH4,
9.6% CO2, and 2% ethane from pyrolysis of an HC1 spruce lignin, while
Gladkova, et al.25, reported 25% CO, 48% CH4, and 11% CO2 in the product
gas from pyrolysis of a hydrolysis hardwood lignin. In both cases the
high contents of CO and CH4, and the rather low content of CO2, are note-
worthy. latridis and Gavalas26 pyrolysed a Douglas fir Kraft lignin;
the major gaseous products were CH4 , CO, and CO2 , with minor amounts of
other hydrocarbon gases also. The ratio CO/CH4 exhibited an interesting
variation with temperature. At 400 C, CO/CH4 was approximately 2.3 while
at 500 C this ratio dropped to roughly 0.85, and finally at 550 through
650 C the ratio climbed to values approaching 2. The relatively large
CO2 content, typically 6%, observed by these authors is inconsistent with
previous literature citations, and likely arose from modification of
LIGNIN
____-- _-- Lt\
GASES - 10% (of lignin)
CH4 - 38-52%(ofgas)
CO - 23-51%
H2 0 SOLUBLE
H20 30%
-- 10-20%
MeOH - 0.4-3%
TAR - 10-30%
Phenols to 84%
Neutrals to 30%
CHAR A40-60%
Adducts
Unreacted Lignin
Acetone Y 0.1-1%
Acetic 0.3-1%Acid
Acids to 6%
Schematic of overall lignin pyrolysis product spectrum
C02' 10%
C2 H2
Figure 4.1
Keterence
(52) 1975(35) 1938
(34) 1929
(31) 1928
23) 191953) 1918
(24)1907
(32) 1925(25) 1974(29)(27) 1975(54) 1932(55) 1920(56) 1921(57) 1923(58) 1952(59) 1955(60)
1950(61) 1958
62 19471970
(63) 1970
MaterialPyrolysed
Lignin 'Alk. cornstlk. LigAlk.LigHCL LigH2SO4Lig
Oak LigBirch LigBeech LigSpruce LigAspen LigCelluloseWoodHC1 AspenHydr. Lig
Alk. cornHC1 LigHC1 spruceHCI spruceHC1H2S04HC1
.Cnar I I ar
63.557
52.258.565.5
50-650-650-650.645.034.937.844.340.5
50.557.253.852.06056
44-8
55.6663.554.751.042
7.219.5
17.77.57.43451139.66.38.1'14.314.2
28.312.510.21157
Aqueous
16.411.8
15.515.115.0
11.713.214.2212019
35-78.7
13-2116.420.422.1
IATRI IS AND GAVAL; DET ILED jEPARAIEf
MfeUH Acetoneof Li nin-
.4
.43
.051.1.9
1.31.31.31.1.642.83.21.3
.3
.3
co CHi 4 C2 Other4-- - Gas I ; )
12.911.7
13.519.111.5
9.317.0
1.510-3
17-8
12.917.420.420
50.9
32.432.6
23-7++
37.5
3.129.3
44-52
+
9.6
62.956.5
10-2+
+
C2H6
C HC2H6C 2H
C2H2 18H2
Table 4.1 Representative products from lignin pyrolysis.
.v,#
.4
II I
~- -- ... -- rrl--rr r -~71~1i~r- _ ---- - --- T-
--- --__- ~ r _- ------ -I? ... ."~ -- - .--
Ac.Acld I GasI
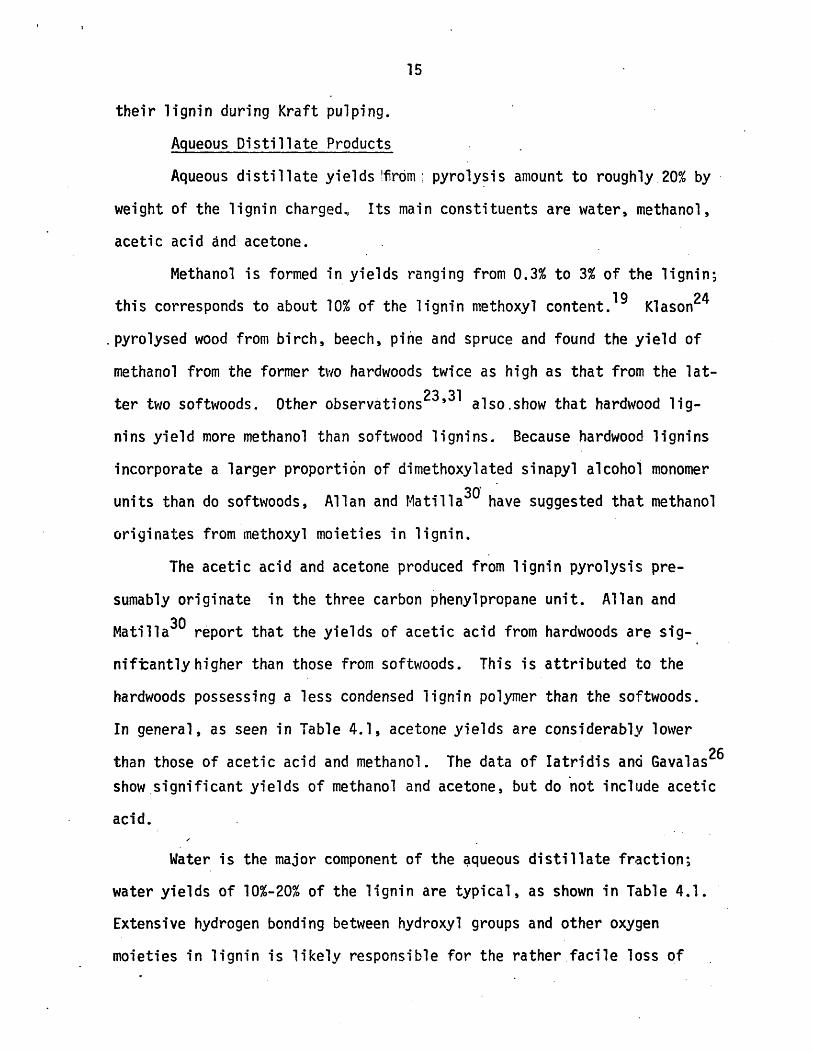
their lignin during Kraft pulping.
Aqueous Distillate Products
Aqueous distillate yields !from pyrolysis amount to roughly 20% by
weight of the lignin charged, Its main constituents are water, methanol,
acetic acid and acetone.
Methanol is formed in yields ranging from 0.3% to 3% of the lignin;
this corresponds to about 10% of the lignin methoxyl content.19 Klason 24
.pyrolysed wood from birch, beech, pine and spruce and found the yield of
methanol from the former two hardwoods twice as high as that from the lat-
ter two softwoods. Other observations23931 also.show that hardwood lig-
nins yield more methanol than softwood lignins. Because hardwood lignins
incorporate a larger proportion of dimethoxylated sinapyl alcohol monomer
units than do softwoods, Allan and Matilla 30 have suggested that: methanol
originates from methoxyl moieties in lignin.
The acetic acid and acetone produced from lignin pyrolysis pre-
sumably originate in the three carbon phenylpropane unit. Allan and
Matilla 30 report that the yields of acetic acid from hardwoods are sig-
niftantlyhigher than those from softwoods. This is attributed to the
hardwoods possessing a less condensed lignin polymer than the softwoods.
In general, as seen in Table 4.1, acetone yields are considerably lower
than those of acetic acid and methanol. The data of Iatridis and Gavalas26
show significant yields of methanol and acetone, but do not include acetic
acid.
Water is the major component of the aqueous distillate fraction;
water yields of 10%-20% of the lignin are typical, as shown in Table 4.1.
Extensive hydrogen bonding between hydroxyl groups and other oxygen
moieties in lignin is likely responsible for the rather facile loss of
water during pyrolysis. However,the mechanistic aspects of water release
are poorly understood. Also, interpretation of water yield data is com-
plicated by the inevitable presence of physically bound water in lignin
samples.
Tars and Oils
The tar fraction resulting from lignin pyrolysis has received con-
siderable attention due to the high proportion of valuable phenols in it.
As seen in Table 4.1, the tar yield is typically 15%-20% by weight of the
lignin. The lignin isolation method exerts a significant influence on tar
yields34'39. Thus pyrolysis of alkali, HC1, and H2SO4 lignins 34 yielded
17.7%, 7.5%, and 7.4% tar yields, respectively. In the rapid thermolysis
of alkali, HCI, and H2SO4 lignins39, the alkali lignin yielded the largest
proportion of phenols; it was also noteworthy that lignins from different
woods isolated by the same method were much more similar than lignins from
the same wood isolated by different methods.
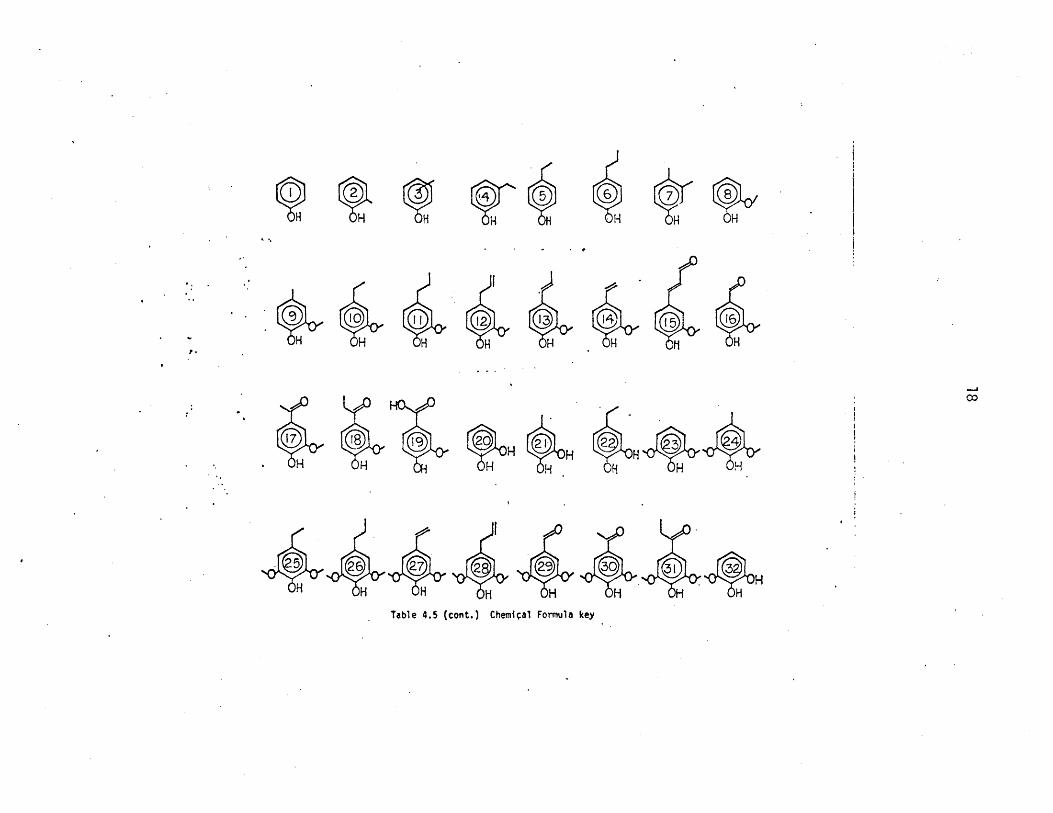
Table 4.5 is a representative listing of phenols identified in the
tar product. The phenols detected mirror the constituent lignin monomers.
Thus, guaiacol and catechol derivatives predominate, with sinapyl and
coumaryl units in evidence as well. The singly oxygenated phenols likely
arise from reactions of the guaiacyl and sinapyl moieties and also from
degradation of coumaryl alcohol monomers. Phenol substitution is in-
variably in the para position, and often includes all three carbons of the
original propanoid side chain.
The Carbonaceous Residue
A carbonaceous residue is a prevalent lignin pyrolysis product.
Chemical analysis of this product has rarely been effected, though Gillet
and Urlings48 found that coke from a Brauns and from an ethanolysis lignin
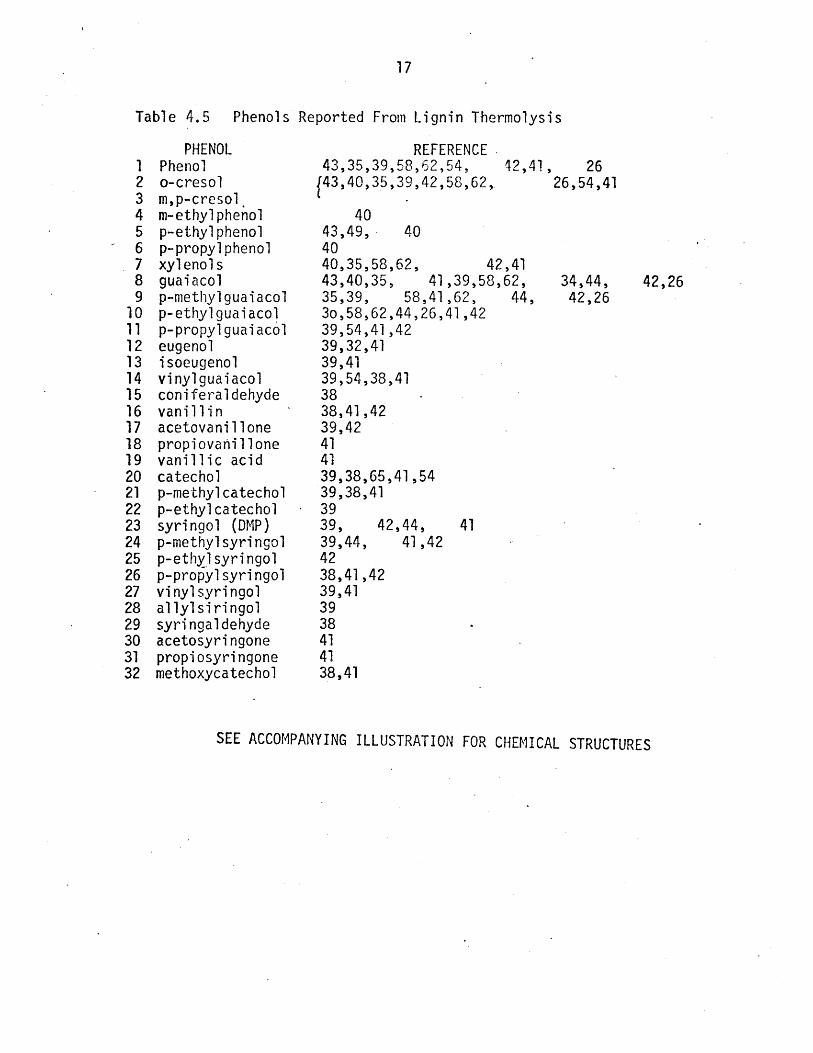
Table 4.5 Phenols Reported From Lignin Thermolysis
1234567891011121314151617181920212223242526272829303132
PHENOLPhenolo-cresolm,p-cresolm-ethyl phenolp-ethyl phenolp-propyl phenolxyl enol sguaiacolp-methylguaiacolp-ethyl guaiacolp-propyl guaiacoleugenolisoeugenolvinylguaiacolconiferal dehydevanillinacetovanillonepropiovanillonevanillic acidcatecholp-methyl catecholp-ethylcatecholsyringol (DMP)p-methyl syri ngolp-ethyl syringolp-propyl syri ngolvinyl syringolallylsiringolsyri ngal dehydeacetosyringonepropiosyringonemethoxycatechol
SEE ACCOMPANYING ILLUSTRATION FOR CHEMICAL STRUCTURES
1I, 2626,54,41
REFERENCE43,35,39,58,62,54, 42,4f43,40,35,39,42,58,62,
4043,49,- 404040,35,58,62, 42,4143,40,35, 41,39,58,62,35,39, 58,41,62, 44,30,58,62,44,26,41,4239,54,41,4239,32,4139,4139,54,38,413838,41,4239,42414139,38,65,41,5439,38,413939, 42,44, 4139,44, 41,424238,41,4239,413938414138,41
42,2634,44,42,26
P. H H' H H
-J
H H H H H H
be 45 (ont. e Formu key
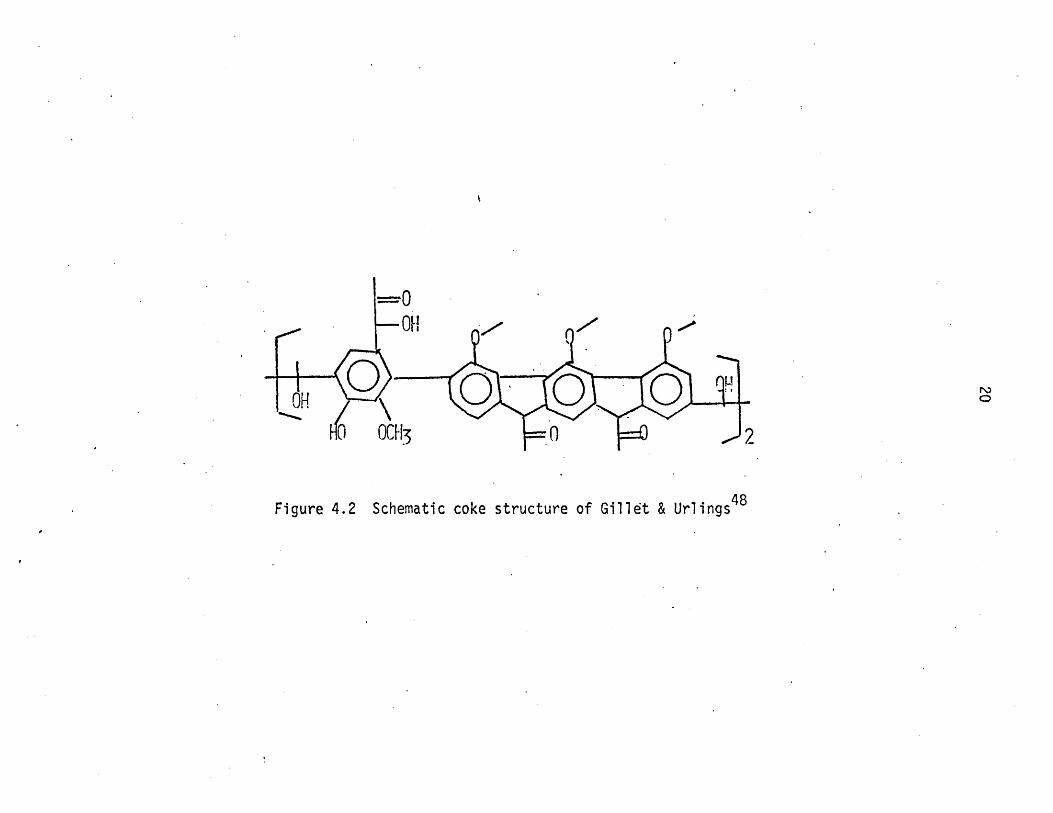
each had an elemental composition similar to that of a Rhenish lignite.
Their elemental formula of (C40H30011)2 is represented in Figure 4.2 by
their speculative coke structure.
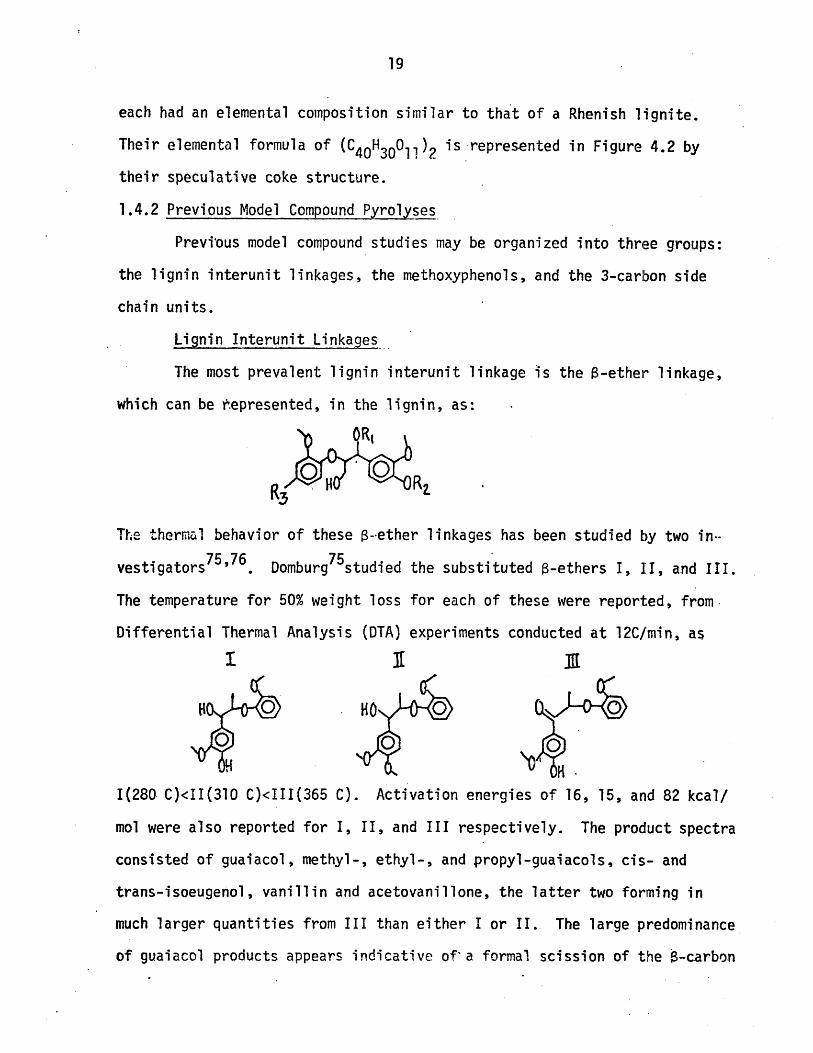
1.4.2 Previous Model Compound Pyrolyses
Previ'ous model compound studies may be organized into three groups:
the lignin interunit linkages, the methoxyphenols, and the 3-carbon side
chain units.
Lignin Interunit Linkages
The most prevalent lignin interunit linkage is the B-ether linkage,
which can be .epresented, in the lignin, as:
OR,
Th.e thermal behavior of these B-ether linkages has been studied by two in.-
vestigators75'76. Domburg75studied the substituted B-ethers I, II, and III.
The temperature for 50% weight loss for each of these were reported, from
Differential Thermal Analysis (DTA) experiments conducted at 12C/min, as
I 11 II
HOO O
1(280 C)<II(310 C)<III(365 C). Activation energies of 16, 15, and 82 kcal/
mol were also reported for I, II, and III respectively. The product spectra
consisted of guaiacol, methyl-, ethyl-, and propyl-guaiacols, cis- and
trans-isoeugenol, vanillin and acetovanillone, the latter two forming in
much larger quantities from III than either I or II. The large predominance
of guaiacol products appears indicative of'a formal scission of the B-carbon
HO OCH3 0 2
Figure 4.2 Schematic coke structure of Gillet & Urlings 48
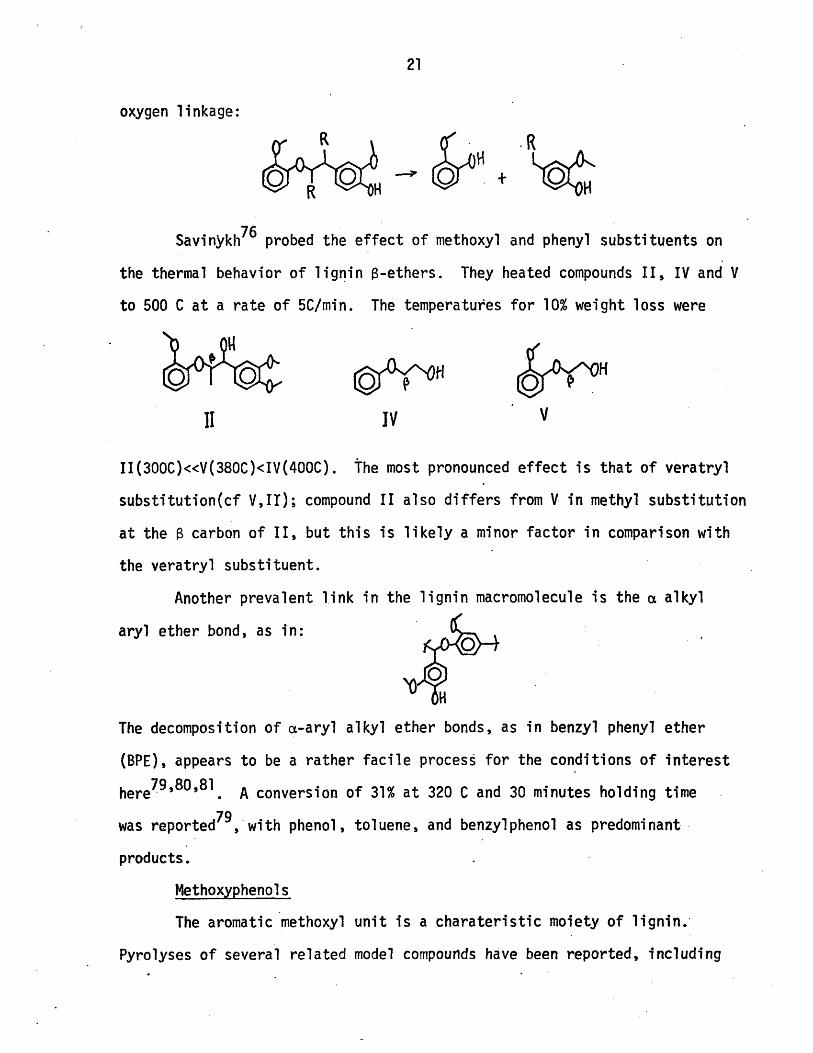
oxygen linkage:
Savinykh76 probed the effect of methoxyl and phenyl substituents on
the thermal behavior of lignin B-ethers. They heated compounds II, IV and V
to 500 C at a rate of 5C/min. The temperatures for 10% weight loss were
1I IV v
II(300C)<<V(380C)<IV(400C). The most pronounced effect is that of veratryl
substitution(cf V,IT); compound II also differs from V in methyl substitution
at the B carbon of II, but this is likely a minor factor in comparison with
the veratryl substituent.
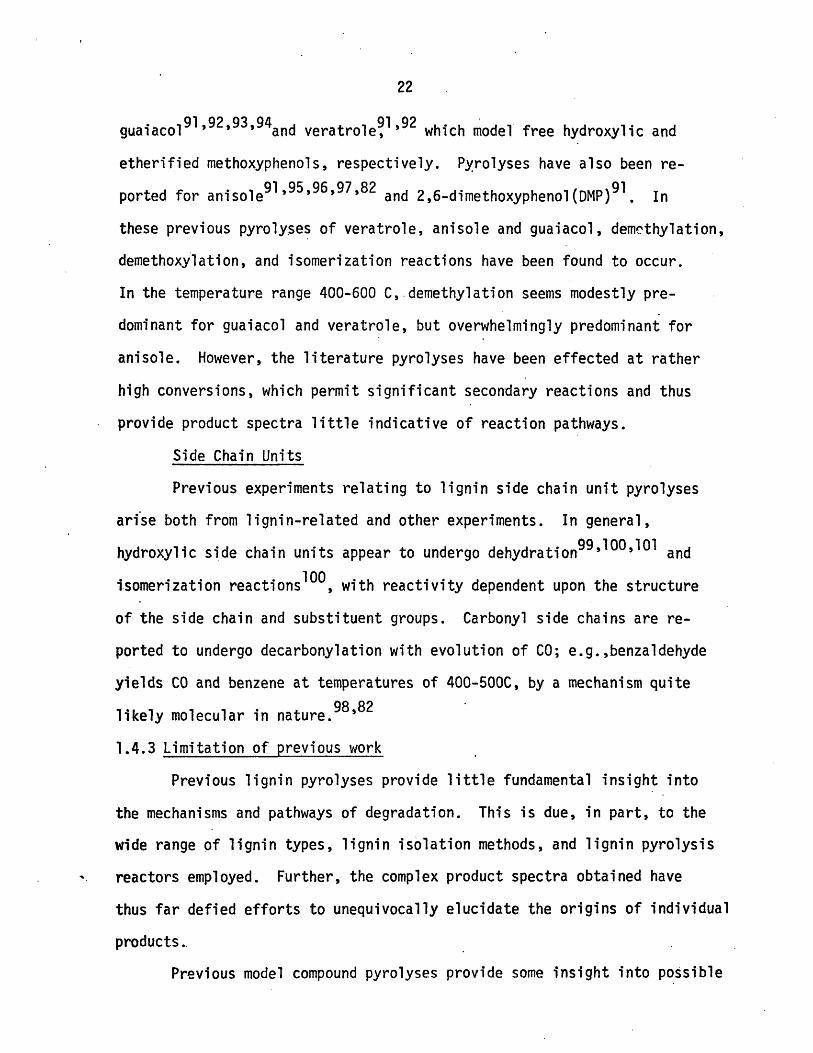
Another prevalent link in the lignin macromolecule is the a alkyl
aryl ether bond, as in:0
The decomposition of a-aryl alkyl ether bonds, as in benzyl phenyl ether
(BPE), appears to be a rather facile process for the conditions of interest
here79'80'81 A conversion of 31% at 320 C and 30 minutes holding time
was reported79 , -with phenol, toluene, and benzylphenol as predominant
products.
Methoxyphenol s
The aromatic methoxyl unit is a charateristic moiety of lignin.
Pyrolyses of several related model compounds have been reported, including
22
guaiacol' 92 93 94and veratrole 1 '92 which model free hydroxylic and
etherified methoxyphenols, respectively. Pyrolyses have also been re-
ported for anisole 91 95,96,97,82 and 2,6-dimethoxyphenol(DMP)91. In
these previous pyrolyses of veratrole, anisole and guaiacol, demethylation,
demethoxylation, and isomerization reactions have been found to occur.
In the temperature range 400-600 C, demethylation seems modestly pre-
dominant for guaiacol and veratrole, but overwhelmingly predominant for
anisole. However, the literature pyrolyses have been effected at rather
high conversions, which permit significant secondary reactions and thus
provide product spectra little indicative of reaction pathways.
Side Chain Units
Previous experiments relating to lignin side chain unit pyrolyses
arise both from lignin-related and other experiments. In general,
hydroxylic side chain units appear to undergo dehydration99 100 ,101 and
isomerization reactions100, with reactivity dependent upon the structure
of the side chain and substituent groups. Carbonyl side chains are re-
ported to undergo decarbonylation with evolution of CO; e.g.,benzaldehyde
yields CO and benzene at temperatures of 400-500C, by a mechanism quite
likely molecular in nature.98 982
1.4.3 Limitation of previous work
Previous lignin pyrolyses provide little fundamental insight into
the mechanisms and pathways of degradation. This is due, in part, to the
wide range of lignin types, lignin isolation methods, and lignin pyrolysis
reactors employed. Further, the complex product spectra obtained have
thus far defied efforts to unequivocally elucidate the origins of individual
products..
Previous model compound pyrolyses provide some insight into possible
23
lignin pyrolysis reactions, but fail to detail either product spectra or
primary reaction pathways. Few kinetic parameters are reported. Further,
many studies employ non-isothermal DTA and DTG techniques, the latter being
particularly difficult to interpret since chemical transformations, e.g.
isomerizations, need not be attended by weight loss. Finally, it is.sig-
nificant that previous model compound studies have never hitherto been
applied to describe whole-lignin pyrolysis.
1.5 Present Approach
The present approach involved analysis of the lignin to suggest
formal reaction pathways for lignin thermolysis. This permitted develop-
ment of a list of model compounds to be experimentally pyrolysed. Pyrolysis
results, combined with the earlier lignin structural analysis, then allowed
a mathematical simulation of whole-lignin thermolysis in a manner comparable
with available experiments.
1.5.1 Analysis of Lignin Structure
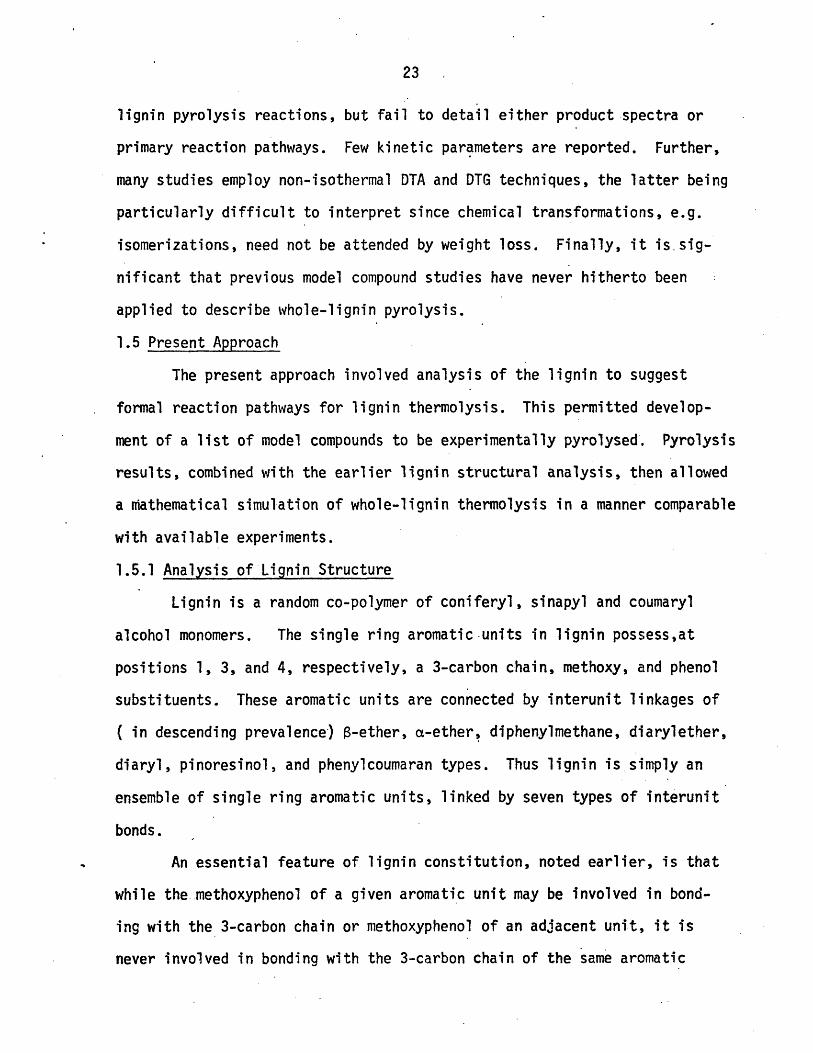
Lignin is a random co-polymer of coniferyl, sinapyl and coumaryl
alcohol monomers. The single ring aromatic units in lignin possess,at
positions 1, 3, and 4, respectively, a 3-carbon chain, methoxy, and phenol
substituents. These aromatic units are connected by interunit linkages of
( in descending prevalence) s-ether, a-ether, diphenylmethane, diarylether,
diaryl, pinoresinol, and phenylcoumaran types. Thus lignin is simply an
ensemble of single ring aromatic units, linked by seven types of interunit
bonds.
An essential feature of lignin constitution, noted earlier, is that
while the methoxyphenol of a given aromatic unit may be involved in bond-
ing with the 3-carbon chain or methoxyphenol of an adjacent unit, it is
never involved in bonding with the 3-carbon chain of the same aromatic
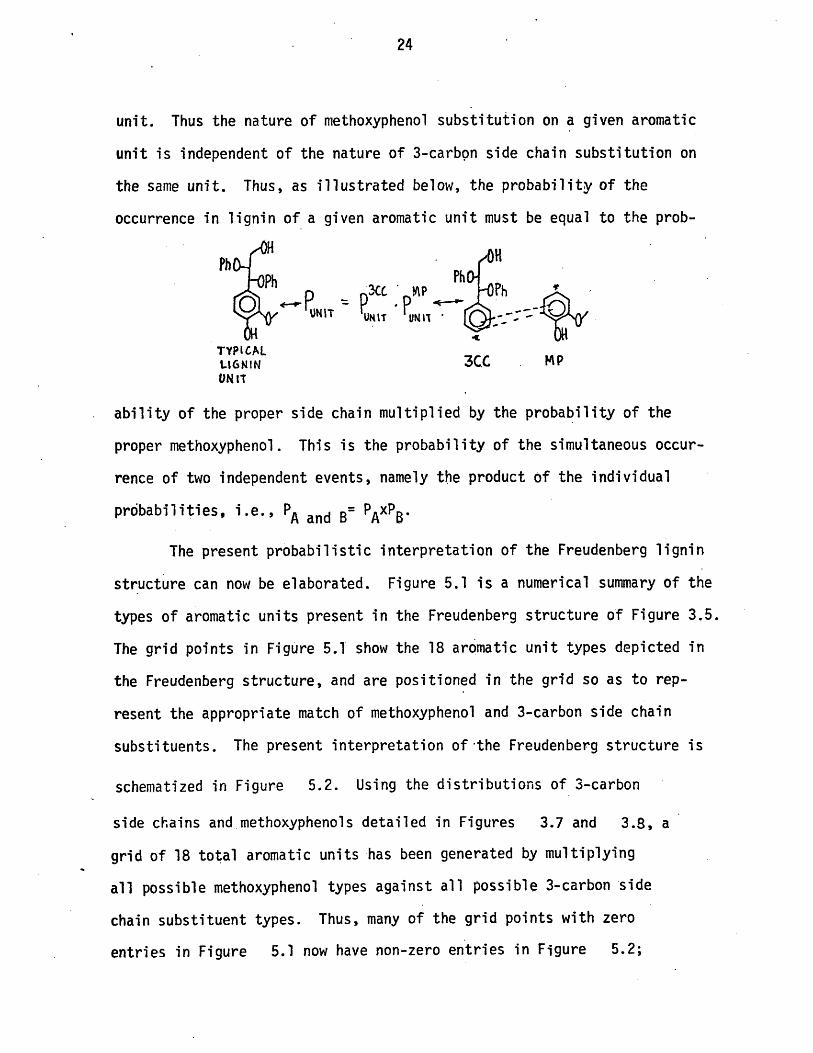
unit. Thus the nature of methoxyphenol substitution on a given aromatic
unit is independent of the nature of 3-carbon side chain substitution on
the same unit. Thus, as illustrated below, the probability of the
occurrence in lignin of a given aromatic unit must be equal to the prob-
?JO . OH
PhTYPICALL16NIN 3C.C MPUNIT
ability of the proper side chain multiplied by the probability of the
proper methoxyphenol. This is the probability of the simultaneous occur-
rence of two independent events, namely the product of the individual
probabilities, i.e., PA and B= PAxPB.
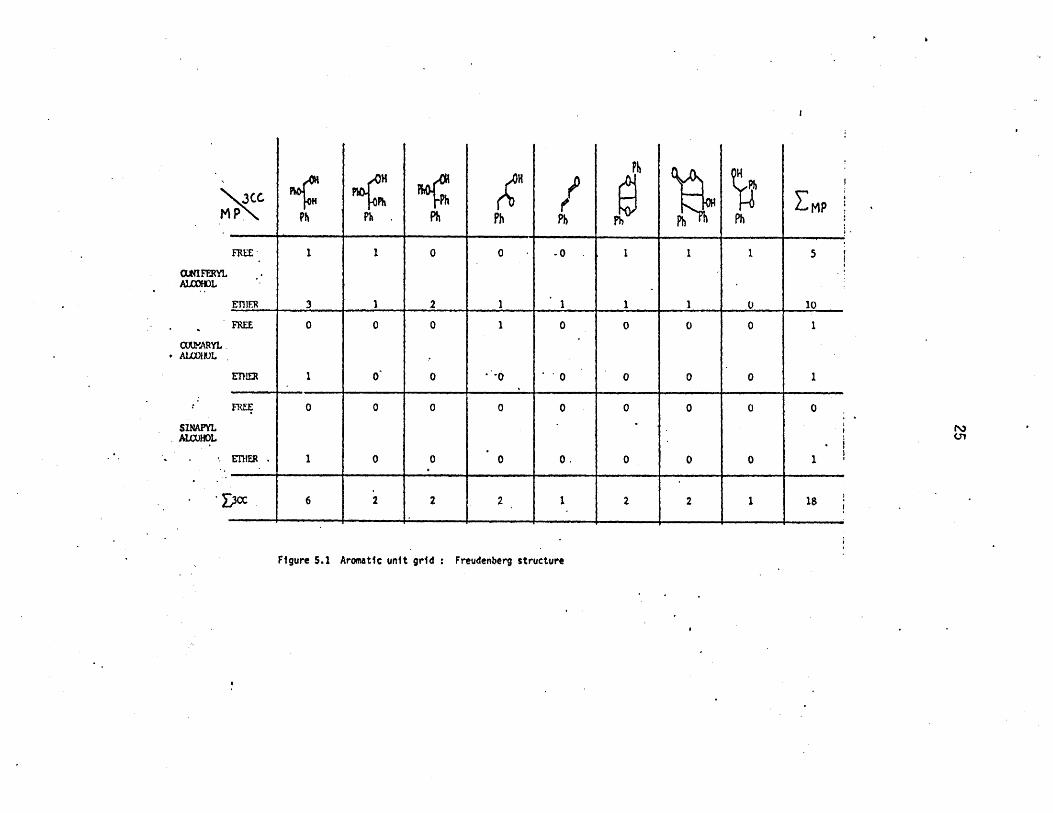
The present probabilistic interpretation of the Freudenberg lignin
structure can now be elaborated. Figure 5.1 is a numerical summary of the
types of aromatic units present in the Freudenberg structure of Figure 3.5.
The grid points in Figure 5.1 show the 18 aromatic unit types depicted in
the Freudenberg structure, and are positioned in the grid so as to rep-
resent the appropriate match of methoxyphenol and 3-carbon side chain
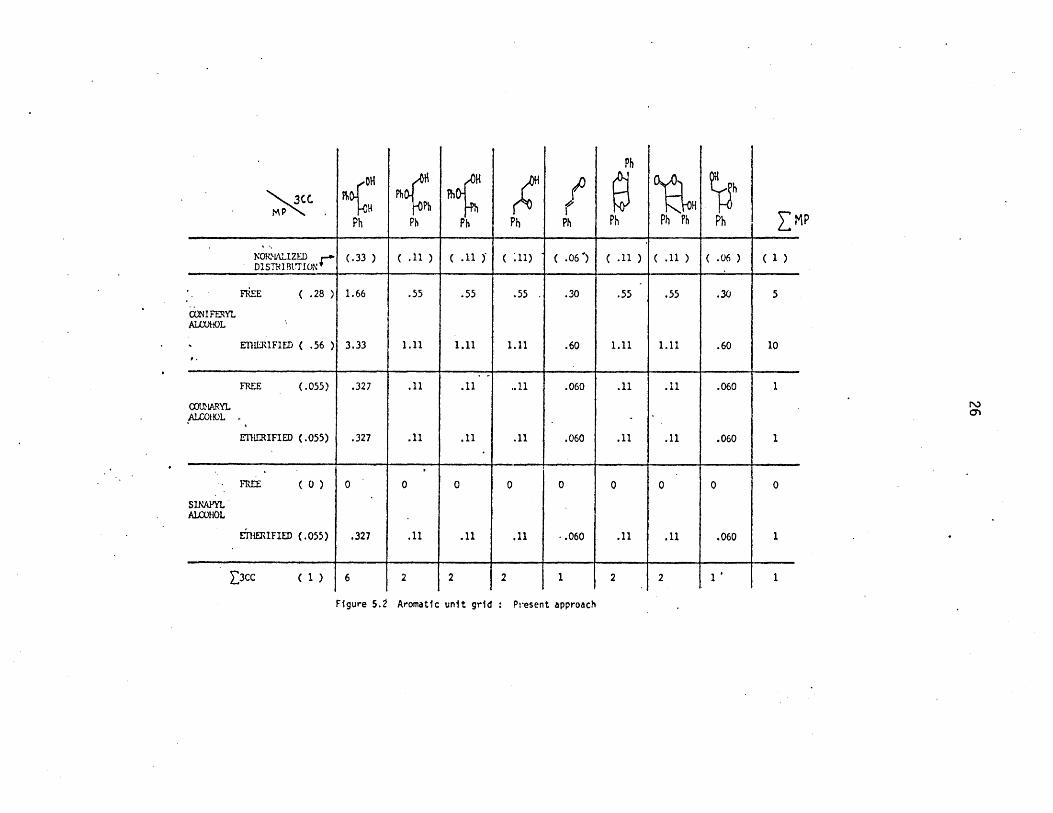
substituents. The present interpretation of the Freudenberg structure is
schematized in Figure 5.2. Using the distributions of 3-carbon
side chains and methoxyphenols detailed in Figures 3.7 and 3.8, a
grid of 18 total aromatic units has been generated by multiplying
all possible methoxyphenol types against all possible 3-carbon side
chain substituent types. Thus, many of the grid points with zero
entries in Figure 5.1 now have non-zero entries in Figure 5.2;
3CPMP Ph Ph Ph Ph Ph
PhPh
ZMPFREE 1 1 0 0 -0 . 1 1 1 5
CUNIFERYLAlWDHOL
ErlIER 3 1 2 1 I 1 1 0 10
FREE 0 0 0 1 0 0 0 0 1
CoUMARYLA )HOL
EIRER 1 0 0 " '0 0 0 0 0 1
FREE
SINAPYLAlWHOL
ETHER.
'
0
0. 0
Figure 5.1 Aromatic unit grid : Freudenberg structure
cc 6 2 2 2 1 2 2 1 18
Ph
8Ph
3CCMP31C
Ph
/0
Ph Ph Ph Ph
Ph
Ph Ph PhPhPh ZMP
NON IALIZED r- (.33 ) ( .11 ) ( .11 ( .11) ( .06) ( .11 ) ( .11 ) ( .06 ) ( 1)DISTRIBtTION
FREE ( .28 ) 1.66 .55 .5.5 555 . .30 .55 .55 .30 5
CONIFERYLAIX1HOL
-ETIRFIED ( .56 ) 3.33 1.11 1.11 1.11 .60 1.11 1.11 .60 10
FREE (.055) .327 .11 .11 .11 .060 .11 .11 .060 1
Ot. ARYLALCOIK)L
EIERIFIED (.055) .327 .11 .11 .11 .060 .11 .11 .060 1
FREE (0) 0 0 0 0 0 0 0 0 0
SINAPYLAILOHOL
EITIEIFIED (.055) .327 .11 .11 .11 - .060 .11 .11 .060 1
T3CC (1) 6 2 2 2 1
Figure 5.2 Aromatic unit grid : Present approach
2
27..
correspondingly, the proportions of certain overemphasized aromatic units
in Figure 5.1 have been reduced.
This investigation will use the preceeding statistical matching
approach to describe whole lignin.
1.5.2 Formal Pathways in Lignin Thermolysis: Selection of Model Compounds
At the temperatures of interest in most lignin thermolyses, the
aromatic units will persist. Thus, the essential reactivity of whole-
lignin will be that of the methoxyphenols, 3-carbon side chains, and
interunit linkages. Consideration of such units present in the Freudenberg
structure generated a set of compounds capable of describing the essen-
tial features of lignin pyrolysis. Table 5.1 lists these model compounds.
A complete discussion of the logic used to arrive at this list is pre-
sented on the main text of this thesis.
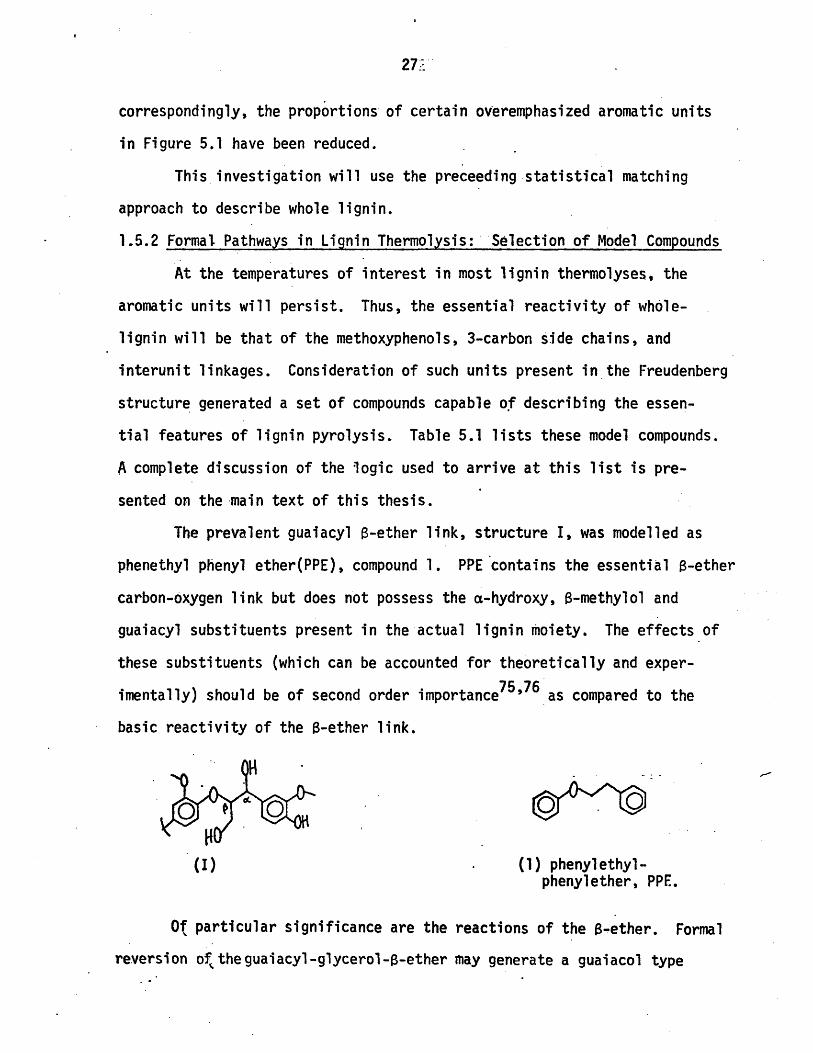
The prevalent guaiacyl O-ether link, structure I, was modelled as
phenethyl phenyl ether(PPE), compound 1. PPE contains the essential s-ether
carbon-oxygen link but does not possess the a-hydroxy, B-methylol and
guaiacyl substituents present in the actual lignin moiety, The effects of
these substituents (which can be accounted for theoretically and exper-
imentally) should be of second order importance75 '76 as compared to the
basic reactivity of the B-ether link.
(I) . (1) phenylethyl-phenylether, PPE.
Of particular significance are the reactions of the B-ether. Formal
reversion of, theguaiacyl-glycerol-$-ether may generate a guaiacol type
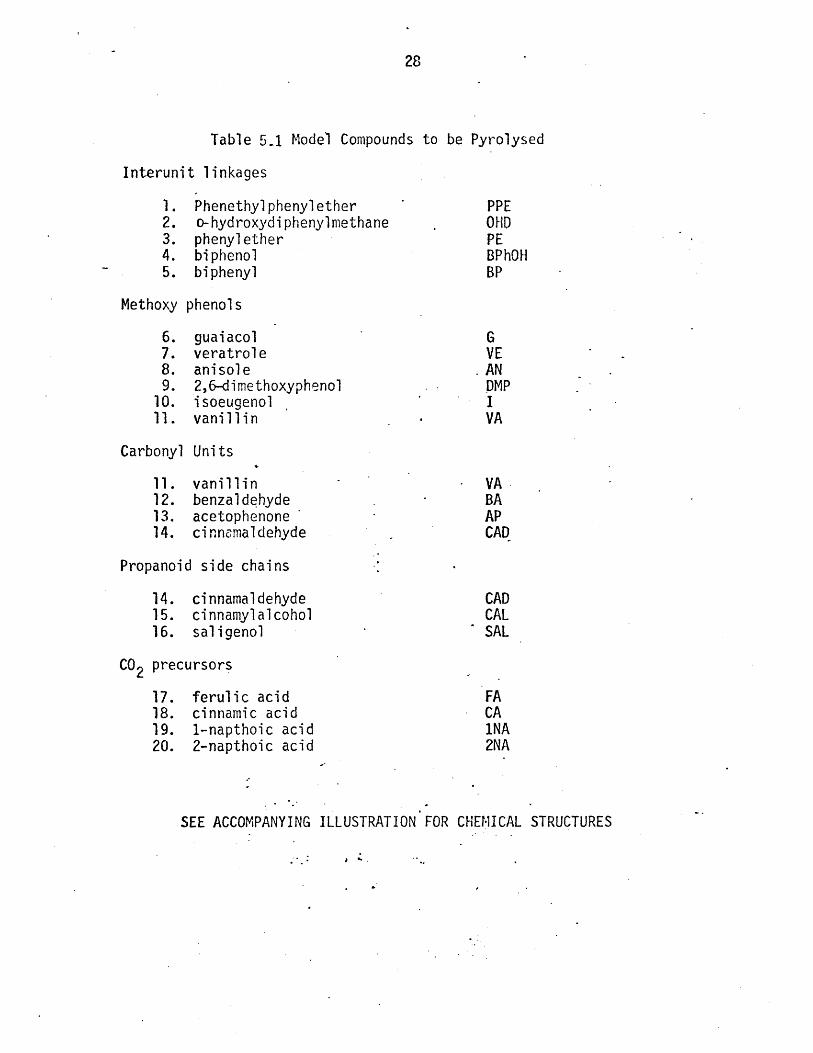
Table 5.1 Model Compounds to be Pyrolysed
Interunit linkages
1. Phenethylphenylether PPE2. o-hydroxydiphenylmethane OHD3. phenylether PE4. biphenol BPhOH5. biphenyl BP
Methoxy phenols
6. guaiacol G7. veratrole VE8. anisole AN9. 2,6-dimethoxyphenol DMP
10. isoeugenol I11. vanillin VA
Carbonyl Units
11. vanillin VA12. benzaldehyde BA13. acetophenone AP14. cinnamaldehyde CAD
Propanoid side chains
14. cinnamaldehyde CAD15. cinnamylalcohol CAL16. saligenol SAL
CO2 precursors
17. ferulic acid FA18. cinnamic acid CA19. 1-napthoic acid 1NA20. 2-napthoic acid 2NA
SEE ACCOMPANYING ILLUSTRATION FOR CHEIICAL STRUCTURES
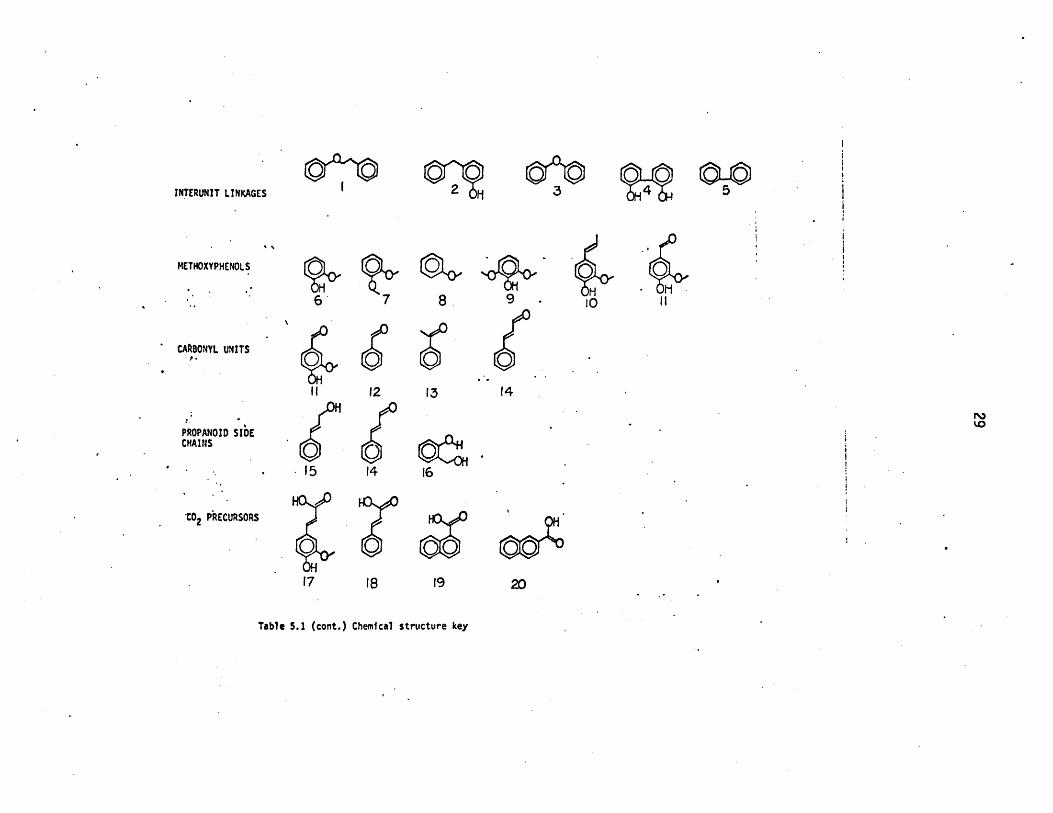
c ^ oINTERUNIT LINKAGES
METHOXYPHENOLS
CAfRBONYL UNITS
PROPANOID SIbDECHAINS
CO2 PRECURSORS
Table 5.1 (cont.) Chemical structure key
4
I I7
12
14
8 O
16
6'
15
1717
1I
1r
~111~5
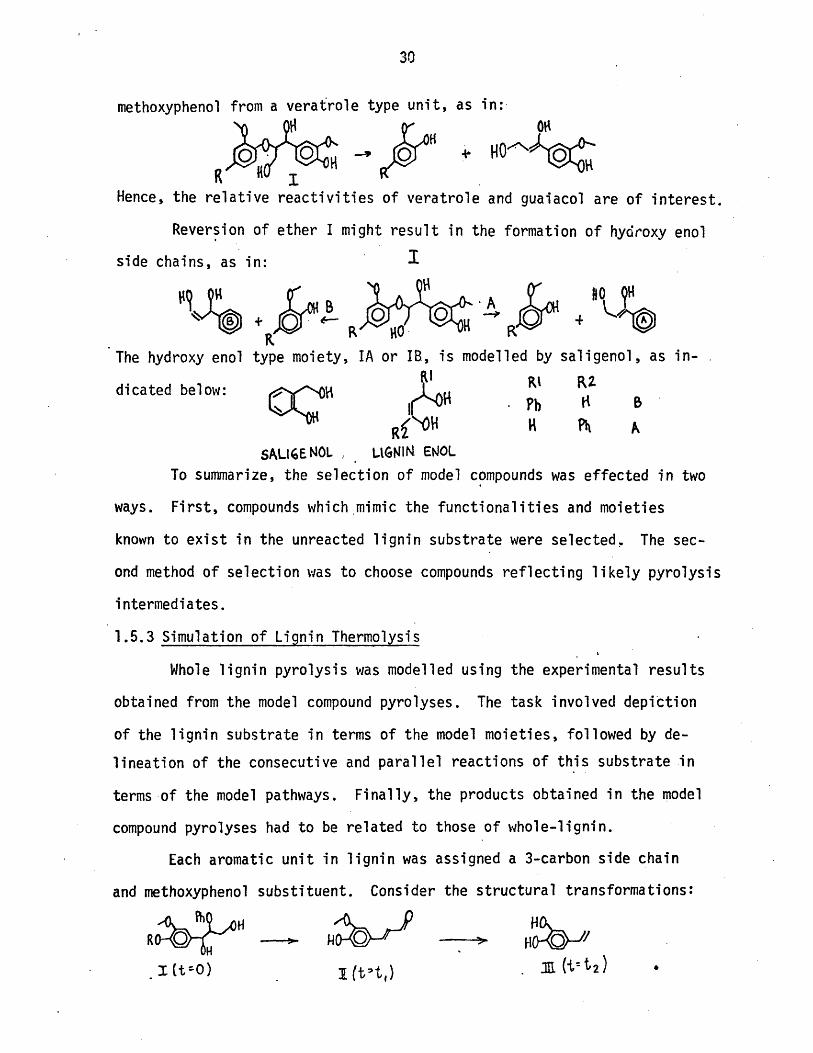
methoxyphenol from a veratrole type unit, as in:
0- HO"Hence, the relative reactivities of veratrole and guaiacol are of interest.
Reversion of ether I might result in the formation of hydroxy enol
side chains, as in: I
B B 9 R +
The hydroxy enol type moiety, IA or IB, is modelled by saligenol, as in-
dicated below: IV Ih BR
ROH H p,
SALIGENOL LIGNIN ENOL
To summarize, the selection of model compounds was effected in two
ways. First, compounds which mimic the functionalities and moieties
known to exist in the unreacted lignin substrate were selected, The sec-
ond method of selection was to choose compounds reflecting likely pyrolysis
intermediates.
1.5.3 Simulation of Lignin Thermolysis
Whole lignin pyrolysis was modelled using the experimental results
obtained from the model compound pyrolyses. The task involved depiction
of the lignin substrate in terms of the model moieties, followed by de-
lineation of the consecutive and parallel reactions of this substrate in
terms of the model pathways. Finally, the products obtained in the model
compound pyrolyses had to be related to those of whole-lignin.
Each aromatic unit in lignin was assigned a 3-carbon side chain
and methoxyphenol substituent. Consider the structural transformations:
I (t=O) (t ,) 11 (-t>2)
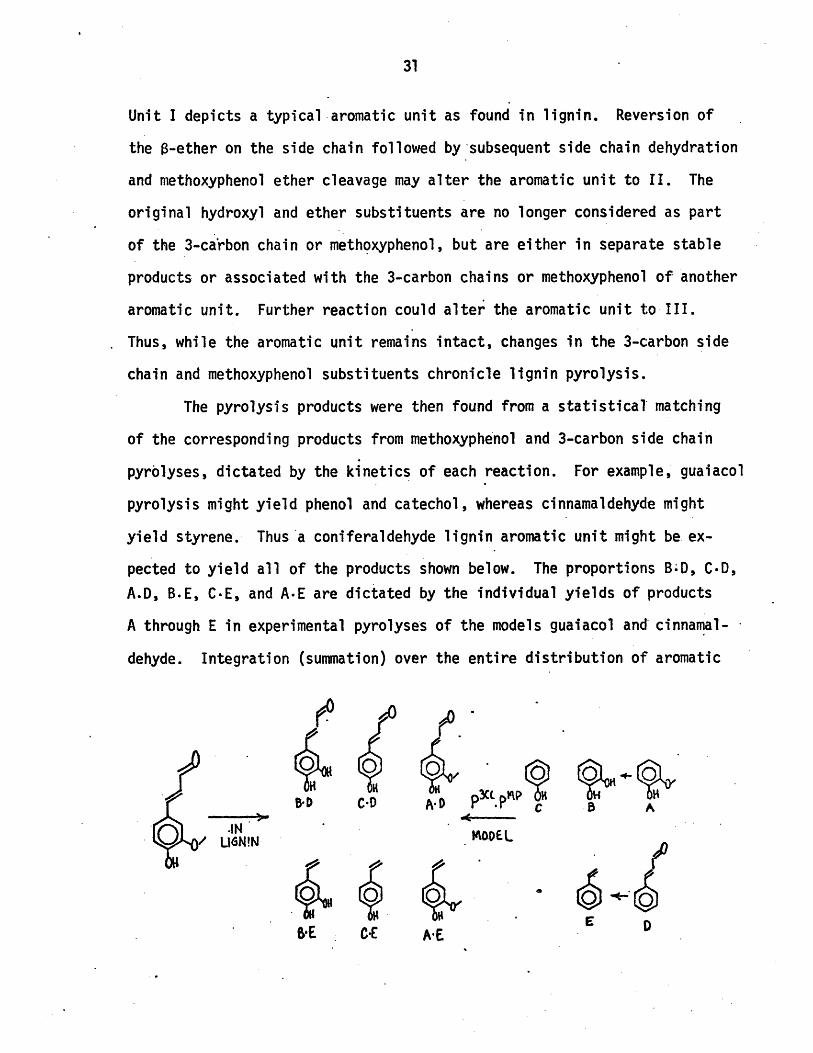
Unit I depicts a typical aromatic unit as found in lignin. Reversion of
the S-ether on the side chain followed by subsequent side chain dehydration
and methoxyphenol ether cleavage may alter the aromatic unit to II. The
original hydroxyl and ether substituents are no longer considered as part
of the 3-carbon chain or methoxyphenol, but are either in separate stable
products or associated with the 3-carbon chains or methoxyphenol of another
aromatic unit. Further reaction could alter the aromatic unit to III.
Thus, while the aromatic unit remains intact, changes in the 3-carbon side
chain and methoxyphenol substituents chronicle lignin pyrolysis.
The pyrolysis products were then found from a statistical' matching
of the corresponding products from methoxyphenol and 3-carbon side chain
pyrolyses, dictated by the kinetics of each reaction. For example, guaiacol
pyrolysis might yield phenol and catechol, whereas cinnamaldehyde might
yield styrene. Thus a coniferaldehyde lignin aromatic unit might be ex-
pected to yield all of the products shown below. The proportions B;D, C.D,
A.D, B.E, C.E, and A.E are dictated by the individual yields of products
A through E in experimental pyrolyses of the models guaiacol and cinnamal-
dehyde. Integration (summation) over the entire distribution of aromatic
B.D C-D AD0 P P c B A
SU6NN ODEL
S.E C.E A.E
units should then describe the products from whole-lignin pyrolysis.
Mathematics of the Simulation
Ordinary linear differential equations describing the variation
with time of each methoxyphenol and 3-carbon side chain moiety were used
to describe a constant volume batch pyrolysis. The rate of change of each
product was, in general, proportional to the number of mols of each other
product, or in vector form,
dI K L d (t=O)= odt - dt - -.
- - (t=)= ?
where the vector X represents all methoxyphenol products, and Y is the
3-carbon side chain. product vector. The equations were numerically in-
tegrated forward in time via a fourth order Runge-Kutta technique. The
initial conditions required for the solution of these equations were
obtained from the distribution of methoxyphenols and 3-carbon side chains
depicted in the Freudenberg structure for spruce lignin, given in Figure
5.2. These conditions reflect the molar, or moiety, fraction of each
methoxyphenol or 3-carbon chain in the initial lignin structure. Note
that the initial conditions are a function of lignin origin. As light
gases, water, and MeOH are evolved in pyrolysis, total simulation mols
are not conserved. However, the total number of methoxyphenol and 3-
carbon side chain moieties is conserved while being chemically altered
in pyrolysis; total aromatic units are also conserved. Formation of
single ring aromatic products necessitates that all interunit linkages
of the side chain and the methoxyphenols be cleaved. Two types of sub-
stituents arise, those entirely free of interunit linkages, designated
as S, and those involved in interunit bonding, designated M. Since a
single ring aromatic will form only when an S-type 3-carbon chain and an
S-type methoxyphenol are formed, the probability of single ring aromatic
, IG pMP. 3CCformation from lignin, PLIG, is PLIG = pP.p . Any other combination
involving P or p3C represents the formation of a multiple aromatic
ring product.
In summary, the simulation numerically solved a set of first order
differential equations which described the variation with time of the num-
ber of each type of 3-carbon side chain and methoxyphenol moiety per .unit
weight of lignin substrate. The initial concentration of each moiety was
obtained from the distributions depicted in the Freudenberg structural
model for lignin. Statistical matching of methoxyphenol and 3-carbon
side chain substituents at any time then described the products expected
from whole-lignin thermolysis.
1.6 Experimental Methods
Table 6.1 is a summary detailing the range of operating con-
ditions for the experimental pyrolyses. Listed are the model compound,
structure, purity, and the temperature, time and concentration range
studied. The experimental details are conveniently grouped-into three cat-
egories, namely, the source of the chemicals used for pyrolysis, the actual
apparatus used to effect the pyrolyses, and the chemical analysis system
used for product characterization.
Chemicals Used
All but one of the compounds were available commercially and were
used as received. PPE was not commercially available and this substrate
was synthesized by the method of Mademov and Khydyrov164. Structural
details of the synthesis product were confirmed by NMR. Analysis by GC
on OV-17 showed the ether to be 95% pure, with phenol, the main impurity,
amounting to 1%.
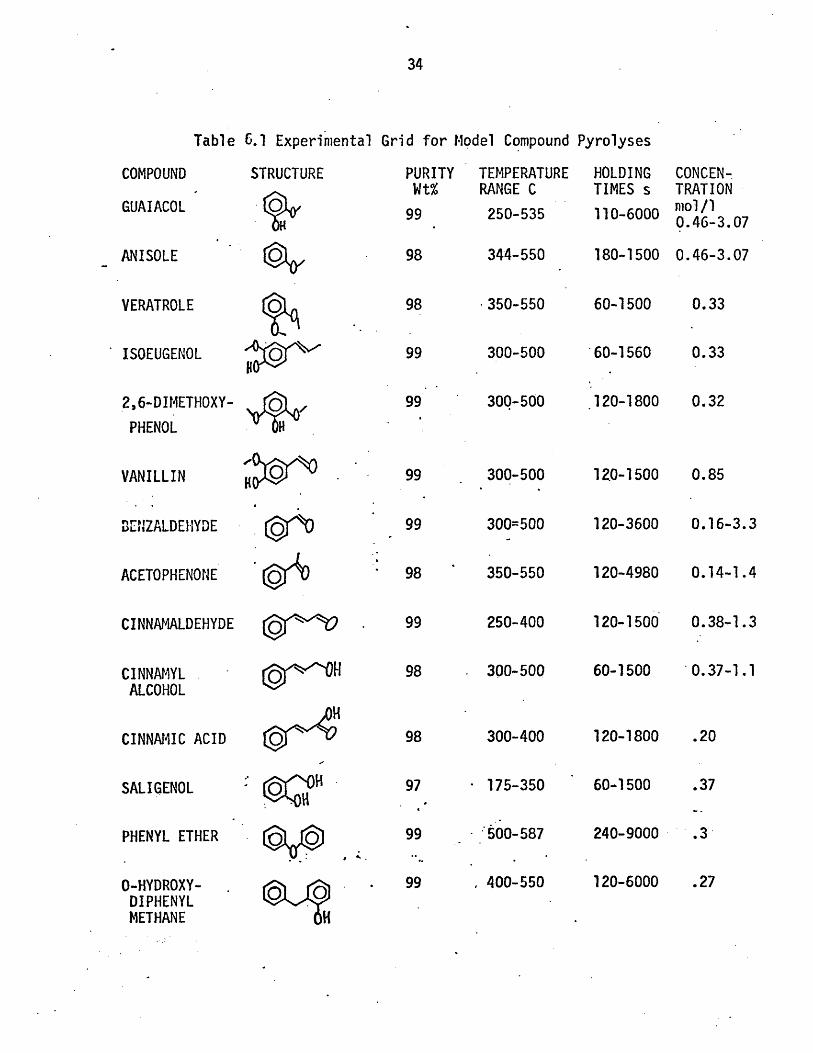
Table 6.1 Experimental Grid for Model Compound Pyrolyses
COMPOUND
GUAIACOL
ANISOLE
VERATROLE
ISOEUGENOL
2,6-DIMETHOXY-
PHENOL
STRUCTURE PURITYWt%
99
TEMPERATURERANGE C
250-535
344-550
.350-550
300-500
300-500
HOLDINGTIMES s
110-6000
CONCEN-TRATIONmol/l0.46-3.07
180-1500 0.46-3.07
60-1500
60-1560
0.33
0.33
120-1800 0.32
VANILLIN
IENZALDEHYDE
ACETOPHENONE
CINNAMALDEHYDE
CINNAMYLALCOHOL
CINNAMIC ACID
0
$9
~p~J"
I~
;~"o
SALIGENOL
PHENYL ETHER
O-HYDROXY-DIPHENYLMETHANE
99
* 175-350
S5oo00-587
* 400-550
120-1500 0.85
120-3600 0.16-3.3
120-4980 0.14-1.4
120-1500
60-1500
120-1800
60-1500
240-9000
120-6000
0.38-1.3
0.37-1.1
.20
.37
.3-
.27
300-500
300=500
350-550
250-400
300-500
300-400
~u~7
~ "OH
Io
".
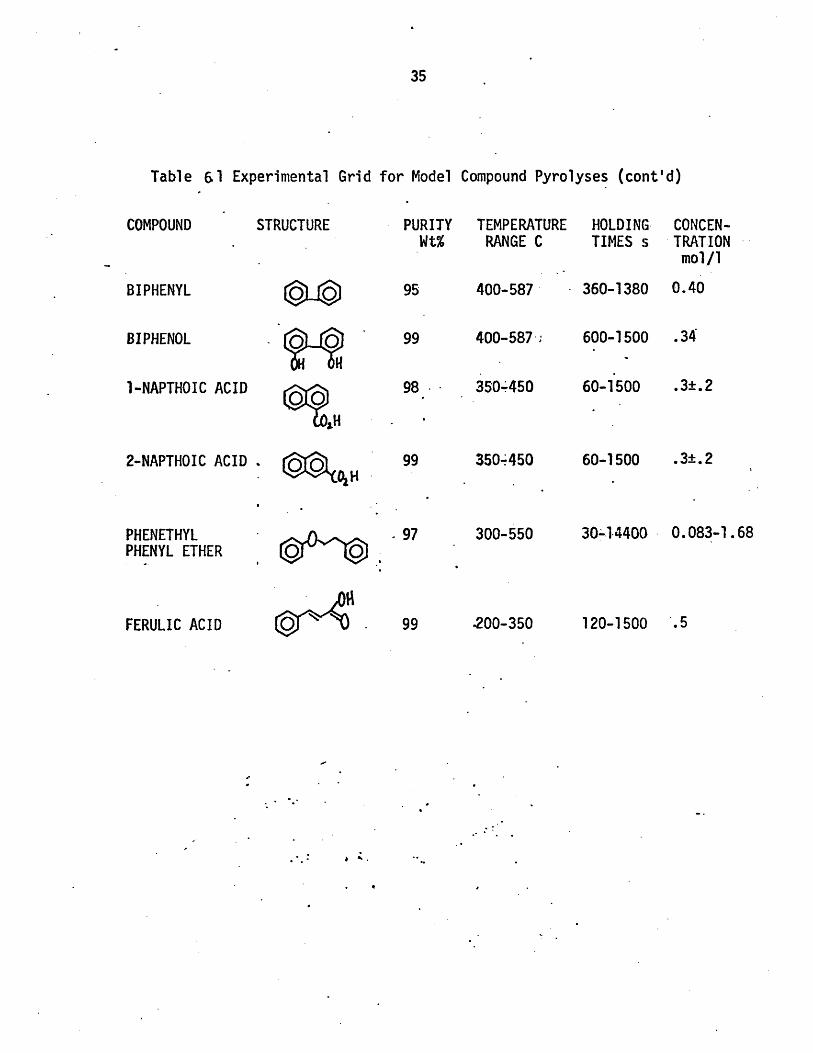
Table 61 Experimental Grid for Model Compound Pyrolyses (cont'd)
STRUCTURE
0 0
PURITY TEMPERATUREWt% RANGE C
400-587
400-587;
350-450I-NAPTHOIC ACID
HOLDING CONCEN-TIMES s TRATION
mol/l
360-1380 0.40
600-1500
60-1500
.34
2-NAPTHOIC ACID .
PHENETHYLPHENYL ETHER
- 97 300-550 30-1.4400 0.083-1.68
120-1500 .5
COMPOUND
BIPHENYL
BIPHENOL
350-450 60-1500 .3±.2mv H
.200-350FERULIC ACID
o. I
Apparatus
A batch reactor system was employed for all pyrolyses. The batch
reactors were stainless steel "tubing bombs" fashioned from Swagelok
components. Four different size r6actors were used, having volumes of
0.2, 0.6, 3.5, and 10.6 cm3 . Kinetic studies were confined to the reactors
of 0.2 and 0.6 cm3in an effort to minimize the effect of heat-up time.
The larger reactors were used for quantitative gas and liquid stoichiometry
studies.
The batch reactors were either loaded and sealed in a glove box
maintained with a nitrogen or argon inert atmosphere, or were externally
loaded and slowly purged with an inert flow before closure. The inert
served as an internal standard for later gas analyses, Loaded reactors
were then immersed in a constant temperature fluidized sand bath for the
duration of reaction, and finally quenched in an ice-water bath. After
quenching, the reactors were dried, opened, and septum-capped in a helium
environment for GC gas analysis. The liquid and solid products were then
solvent-collected for later GLC/GC analyses.
Chemical Analysis
The pyrolysis products were identified and analysed by Gas Chrom-
atography. Gases were separated by either molecular sieve(l0'), silica
gel(6'), ar porapak Q(6') columns. Analysis for light liquids, such as
H20, MeOH, EtOH, and up to about toluene and phenol was effected on
porapak Q and principally porapak P(6') columns. The heavier compounds,
including alkylbenzenes, phenols and the model compounds were separated on
an OV-17 column (6'). Product identification was primarily by GC with
standard coinjection. Quantitative product mol fractions were determined
from calibration factors obtained from standard samples of known composi-
tion.
1.7 Experimental Results
For each model compound, it was desired to:
1. Characterize and quantify pyrolysis product spectra
2. Develop product relationships and stoichiometries
3. Identify likely reaction pathways
4. Determine reaction arders
5. Measure reaction kinetics and derive Arrhenius parameters.
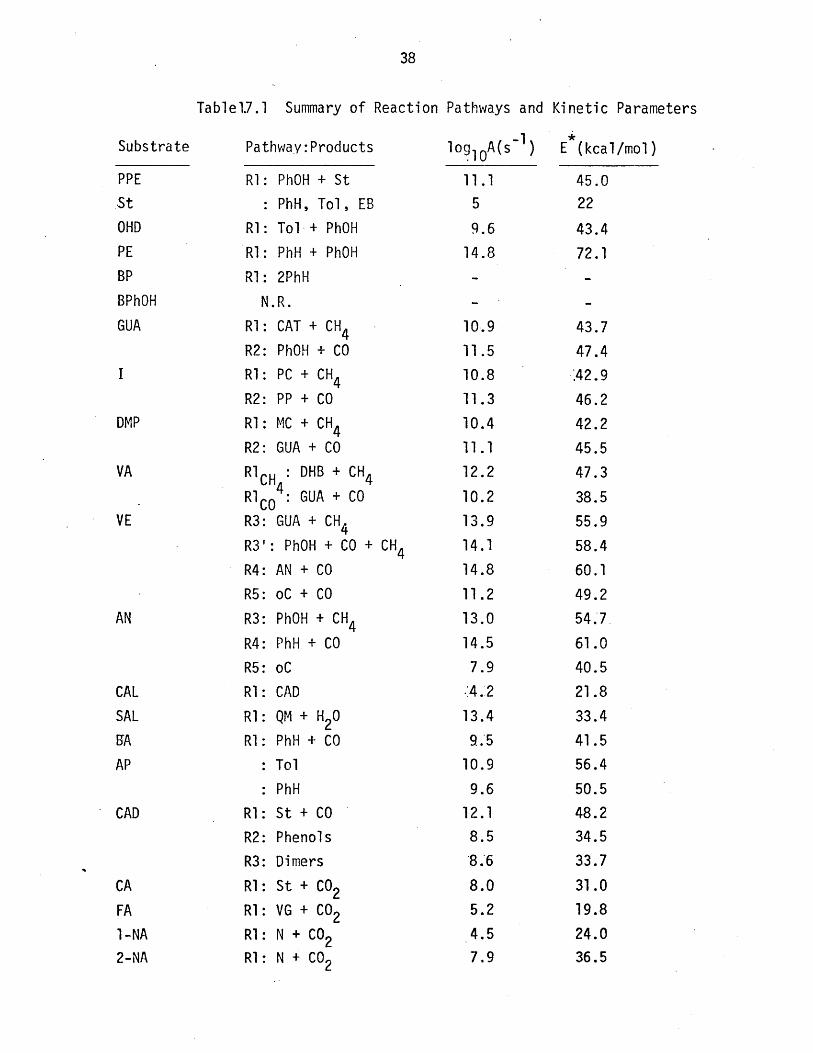
Experimental results are described for each compound, listed in
order of descending importance. Detailed description is limited to
Phenethyl Phenyl Ether (PPE) pyrolysis. Kinetic parameters and reaction
pathways for each pyrolysis are summarized in Table 1.7.1.
1.7.1 Phenethyl Phenyl Ether (PPE)
The pyrolyses were effected over the range of operating conditions
detailed in Table 6.1. The experiments were conducted at temperatures
from 300-550 C, with holding times of 1-240 minutes. Substrate conversions
were generally held to less than 30% in an effort to emphasize primary
reactions; hovever, kinetic data were obtained at conversions as high as 90%.
Initial substrate concentrations ranged from 0.083 to 1.66 mol/l in the
gas phase.
PPE was also pyrolysed in tetralin at 350, 400, and 450 C, at sub-
strate concentrations of 0.25mol/l. The effect of tetralin was examined
in detail at 400 C, where the mol ratio of tetralin to PPE, called S, was
varied from 0.245 to 9.8.
Care was taken to monitor material balance closure, quantified
by the determination of the parameter <M>, physically the average molecular
weight of the pyrolysis products, defined below. In this expression Xi is
Tablel.7.1 Summary of Reaction Pathways and Kinetic Parameters
Substrate
PPE
,St
OHD
PE
BP
BPhOH
GUA
I
DMP
VA
VE
AN
CAL
SAL
BA
AP
CAD
CA
FA
1-NA
2-NA
Pathway: Products
R1: PhOH + St
: PhH, Tol, EB
R1: Tol + PhOH
R1: PhH + PhOH
R1: 2PhH
N.R.
R1: CAT + CH4R2: PhOH + CO
R1: PC + CH4R2: PP + CO
R1: MC + CH4R2: GUA + CO
RCH : DHB + CH4
RlCO : GUA + CO
R3: GUA + CH4R3': PhOH + CO + CH4R4: AN + CO
R5: oC + CO
R3: PhOH + CH4R4: PhH + CO
R5: oC
R1: CAD
R1: QM + H20
R1: PhH + CO
: Tol
: PhH
R1: St + CO
R2: Phenols
R3: Dimers
R1: St + CO2R1: VG + CO2R1: N + CO2RI: N + CO2
log10 A(s- )
11.1
5
9.6
14.8
10.9
11.5
10.8
11.3
10.4
11.1
12.2
10.2
13.9
14.1
14.8
11.2
13.0
14.5
7.9
.4.2
13.4
9.5
10.9
9.6
12.1
8.5
8.6
8.0
5.2
4.5
7.9
E (kcal/mol)
45.0
22
43.4
72.1-
43.7
47.4
.42.9
46.2
42.2
45.5
47.3
38.5
55.9
58.4
60.1
49.2
54.7
61.0
40.5
21.8
33.4
41.5
56.4
50.5
48.2
34.5
33.7
31.0
19.8
24.0
36.5
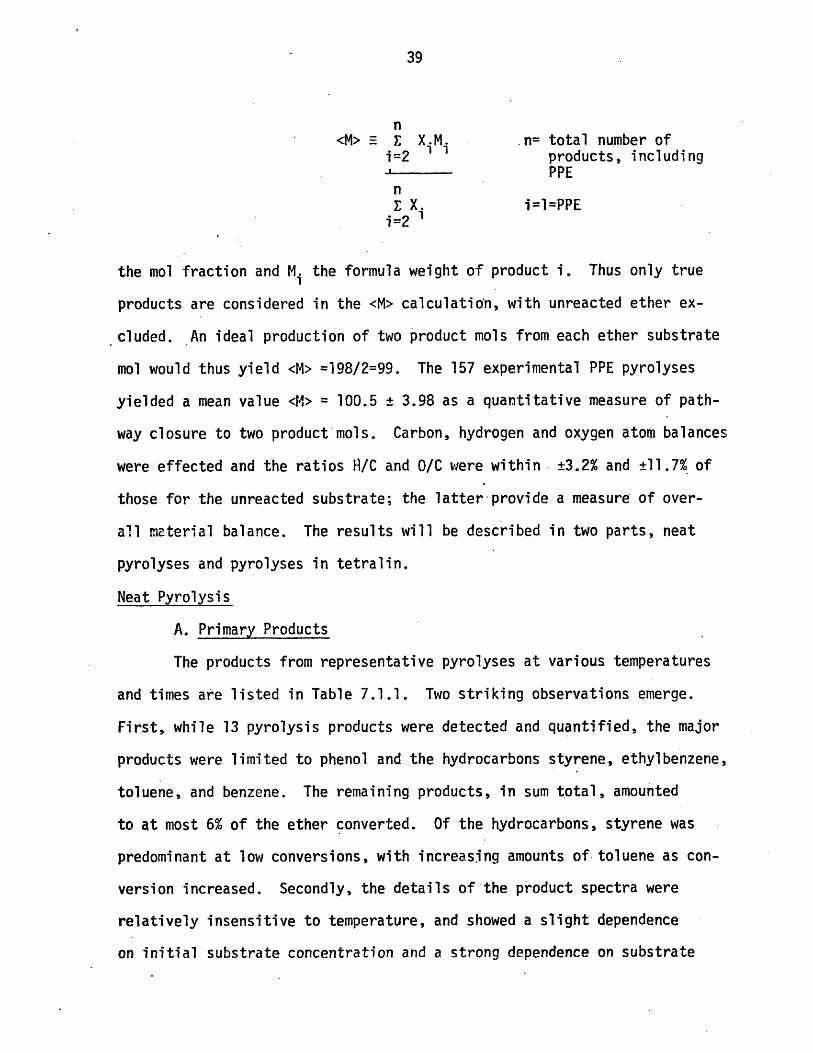
n<M> E E X .M .n= total number of
i=2 products, includingPPE
nZ X. i=I=PPE
i=2 1
the mol fraction and M.i the formula weight of product i. Thus only true
products are considered in the <M> calculation, with unreacted ether ex-
cluded. An ideal production of two product mols from each ether substrate
mol would thus yield <M> =198/2=99. The 157 experimental PPE pyrolyses
yielded a mean value <> = 100.5 ± 3.98 as a quantitative measure of path-
way closure to two product mols. Carbon, hydrogen and oxygen atom balances
were effected and the ratios H/C and 0/C were within +3.2% and +11.7% of
those for the unreacted substrate; the latter provide a measure of over-
all material balance. The results will be described in two parts, neat
pyrolyses and pyrolyses in tetralin.
Neat Pyrolysis
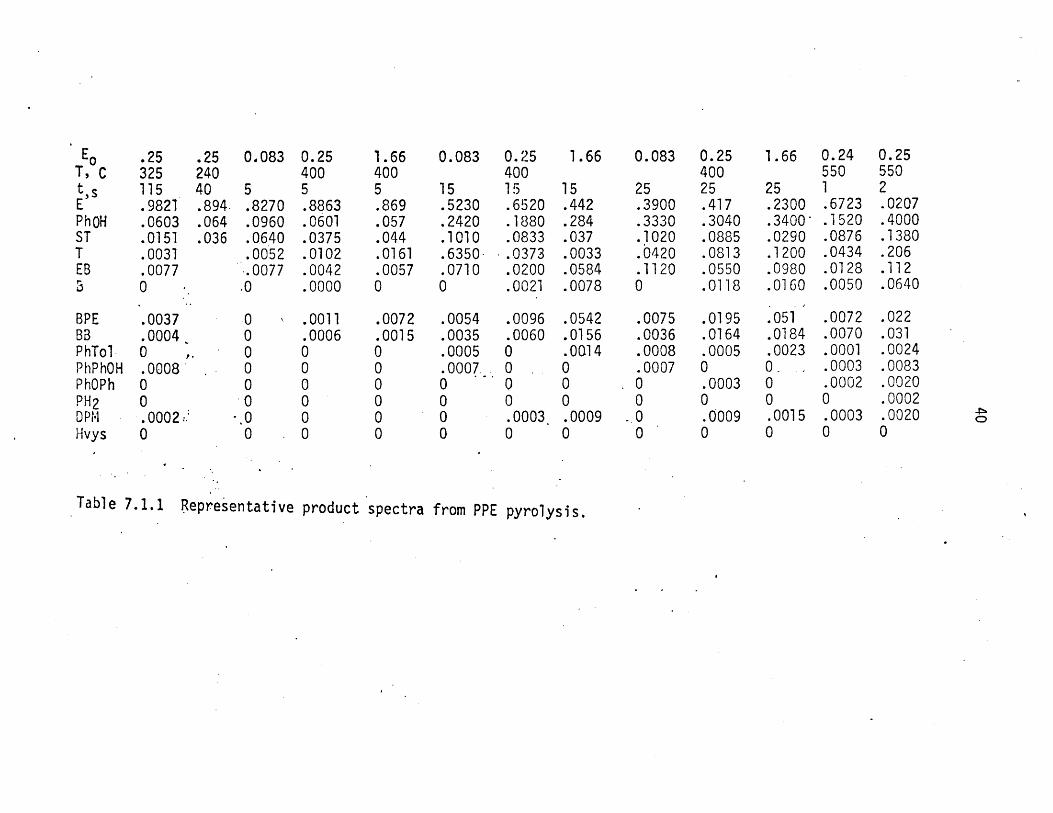
A. Primary Products
The products from representative pyrolyses at various temperatures
and times are listed in Table 7.1.1. Two striking observations emerge.
First, while 13 pyrolysis products were detected and quantified, the major
products were limited to phenol and the hydrocarbons styrene, ethylbenzene,
toluene, and benzene. The remaining products, in sum total, amounted
to at most 6% of the ether converted. Of the hydrocarbons, styrene was
predominant at low conversions, with increasing amounts of toluene as con-
version increased. Secondly, the details of the product spectra were
relatively insensitive to temperature, and showed a slight dependence
on initial substrate concentration and a strong dependence on substrate
0.083 0.25400
5 5.8270 .8863.0960 .0601.0640 .0375.0052 .0102.0077 .0042
.0 .0000
EoT, Ct~sEPhOHSTTEB
BPEBBPhTol.PhPhOHPhOPhPH2DPMHvys
.0011
.0006000000
1.664005.869.057.044.0161.00570
.0072.0015000000
0.083 0.25400
15 15.5230 .6520.2420 .1880.1010 .0833.6350- .0373.0710 .02000 .0021
.0054
.0035.0005.0007.0000
1.66 0.083 0.25400
15 25 25.442 .3900 .417.284 .3330 .3040.037 .1020 .0885.0033 .0420 .0813.0584 .1120 .0550.0078 0 .0118
.0096 .0542
.0060 .01560 .00140 00 00 0.0003 .00090 0
.0075
.0036
.0008
.000700
.00
.0195
.0164
.00050.00030.00090
1.66 0.24550
25 1.2300 .6723.3400- .1520.0290 .0876.1200 .0434.0980 .0128.0160 .0050
.051
.0184
.00230O00.00150
.0072
.0070
.0001
.0003
.00020.00030
Table 7.1.1 Representative product spectra from PPE pyrolysis.
.2524040.894..064.036
.25325115.9821.0603.0151.0031.00770
000000
0- 00
.0037
.00040.000800.0002:0
0.255502.0207.4000.1380.206.112.0640
.022
.031
.0024
.0083
.0020
.0002
.00200
conversion. The latter two observations are reflected most strongly in the
relative proportions of major hydrocarbon product.
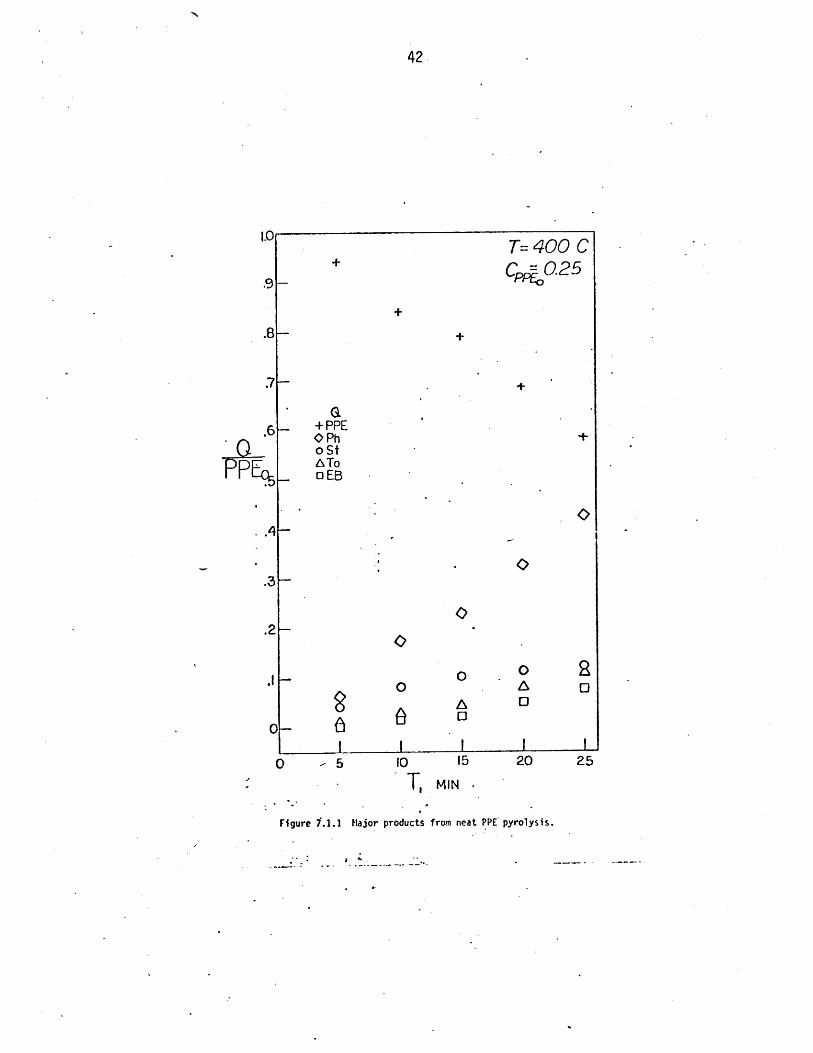
The time variation of substrate and major product proportions,in
mols per initial mol of ether for pyrolysis at 400 C and initial ether con-
centration of 0.25 mol/l,are depicted in Figure 7.1.1. The slopes of the
phenol appearance and ether disappearance are suggestive of a stoichiometric
production of phenol from substrate. Figure.7.1.1 further shows the styrene
product produced stoichiometrically with phenol at t=5 minutes and reaching
a maximum at 25 minutes. The maximum yield of styrene, coupled with apparent
initial slopes of zero for toluene and ethylbenzene production is suggestive
of secondary reactions of the styrene to other products, including tol-
uene, ethylbenzene, and benzene.
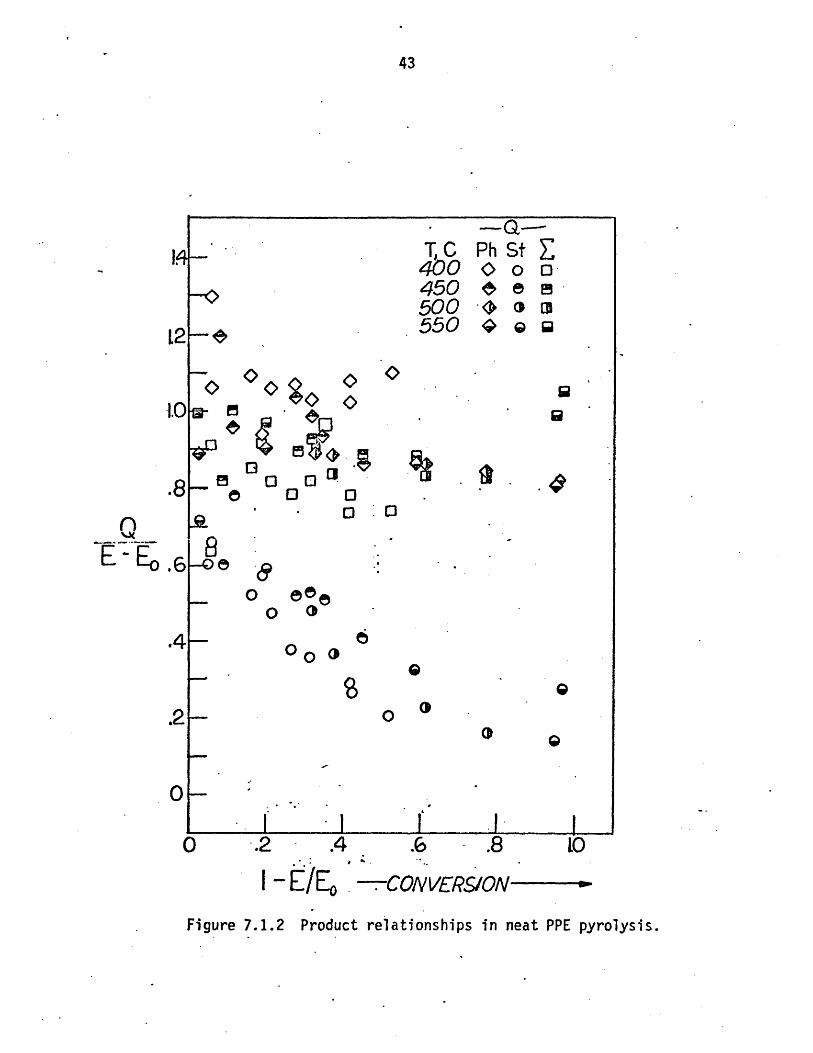
The stoichiometric implications of Figure 7.1.1 are further de-
veloped in Figure 7.1.2, where product selectivities, i.e., the mol
yields of phenol, styrene, and the hydrocarbon sum (styrene+ethylbenzene
+toluene+benzene)=(HC) per mol of decomposed substrate, are plotted as a
function of substrate conversion. The constant ordinate of unity for
phenol at all conversions in Figure 7.1.2 shows that for each mol of ether
decomposed a mol of phenol was always produced. For styrene the ordinate
decreases monotonically with increasing conversion, from about 0.8 at a
fractional conversion of 0.1 to about 0.2 at fractional conversions of 0.8.
Thus, at low substrate conversions, one mol of styrene is observed per mol
of ether decomposed, but this styrene selectivity decreases with increasing
conversion. This is indicative of secondary styrene degradation. Finally,
it is observed in Figure 7.1.2 that the hydrocarbon sum HC is essentially
unity at all substrate conversions. In summary, then, Figure 7.1.2 shows
that decomposition of one mol of ether always yielded one mol of phenol and
T= 400 C+ CO.25
+
+ PPEO PhoStATo
EB
0 0O 6
I I I
- 5 10 15
T, MIN.
20 25
Major products from neat PPE pyrolysis.
.3
.2
'I I
Figure 7.1.1
.4
T, C400450500550
-- Gt--Ph St0 0o o
S 0 0' • O
.41
.2-
or 1 i.2 .
S-E/E0
.6 .8 [0
--CON VERSON
7.1.2 Product relationships in neat PPE pyrolysis.
14-
L2-
8H
8O
O
__
E-E -E
O o
Figure
one mol of total hydrocarbons. At low substrate conversions, the hydro-
carbon is solely styrene, the primary product, which undergoes secondary
reactions to the other hydrocarbons at higher conversions. The correspond-
ing pathway for PPE decomposition is the of the type Rl:
mols 1 1 1 1
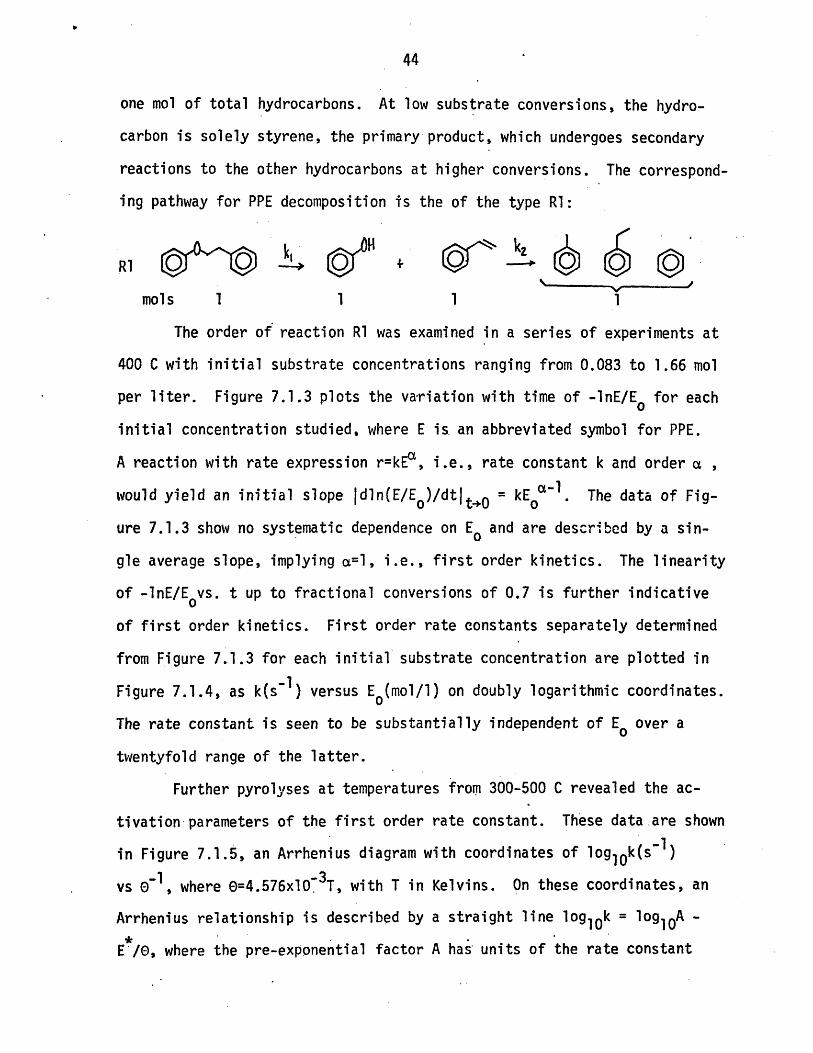
The order of reaction Rl was examined in a series of experiments at
400 C with initial substrate concentrations ranging from 0.083 to 1.66 mol
per liter. Figure 7.1.3 plots the variation with time of -InE/E 0 for each
initial concentration studied, where E is an abbreviated symbol for PPE.
A reaction with rate expression r=kEa, i.e., rate constant k and order a ,
would yield an initial slope Idln(E/E )/dtlt+0 = kE 0 -1. The data of Fig-
ure 7.1.3 show no systematic dependence on Eo and are described by a sin-
gle average slope, implying a=l, i.e., first order kinetics. The linearity
of -InE/E vs. t up to fractional conversions of 0.7 is further indicative
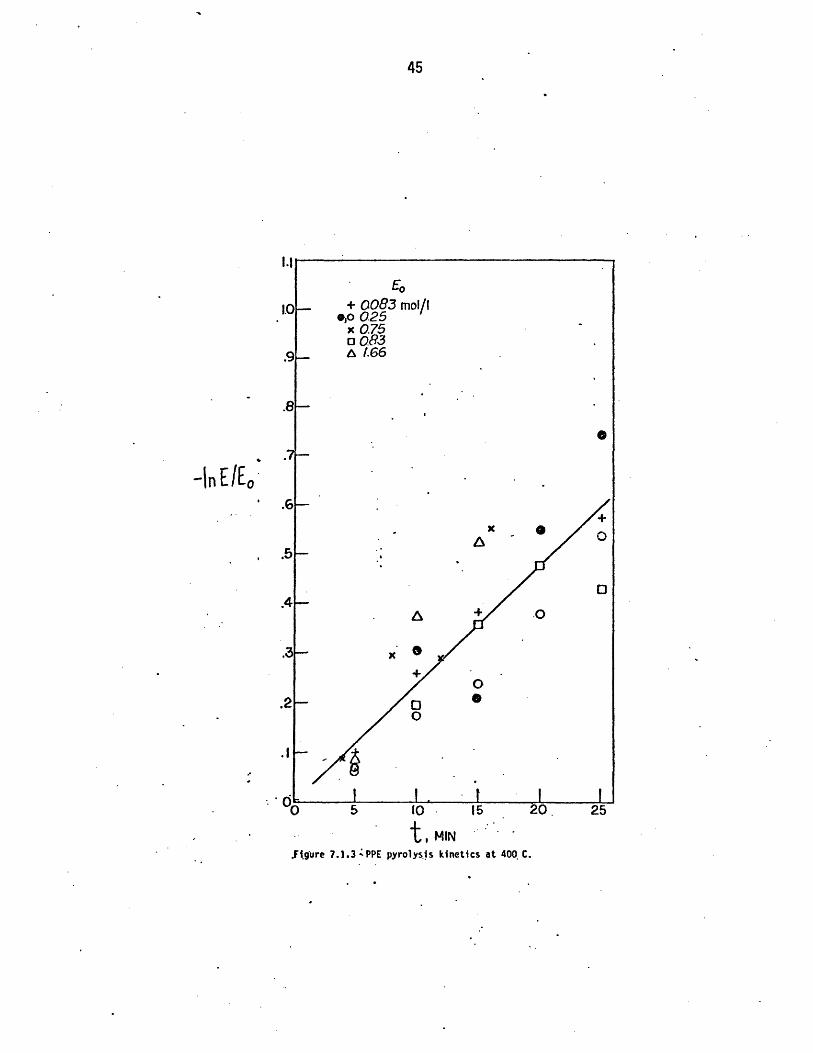
of first order kinetics. First order rate constants separately determined
from Figure 7.1.3 for each initial substrate concentration are plotted in
Figure 7.1.4, as k(s- ) versus E (mol/l) on doubly logarithmic coordinates.
The rate constant is seen to be substantially independent of Eo over a
twentyfold range of the latter.
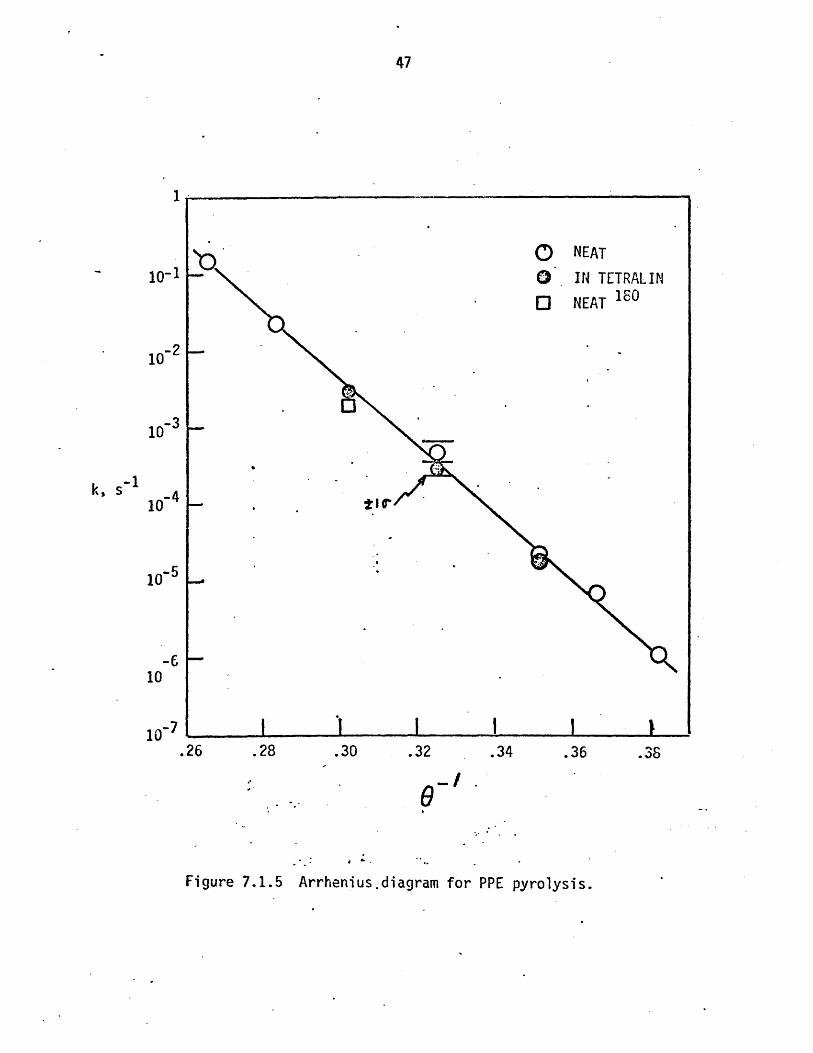
Further pyrolyses at temperatures from 300-500 C revealed the ac-
tivation parameters of the first order rate constant. These data are shown
in Figure 7.1.5, an Arrhenius diagram with coordinates of log10 k(s -l )
vs O- , where 0=4.576x10- 3 T, with T in Kelvins. On these coordinates, an
Arrhenius relationship is described by a straight line log10k = log10A -
E/O, where the pre-exponential factor A has units of the rate constant
+ 0083 mol/I*,o 025x 075o 083a 1.66
S+x~ * 0
20 25
.Figure 7.1.3 PPE pyrolysis kinetics at 400 C.
1.0O-
-InEIEo
.4-
.2-
0 150
t, MIN
I I
x*
.I _I I
-3I0
0 MEAN
-I 0 00
-410
1.0 01
Eo mol. Il
Fiure7.1.4 Variation of kPPE wfth initialFigure 7.1.4 Variation of k with initial PPE concentration
"" g
.28 .30 .32 .34 .36 .38
Figure 7.1.5 Arrhenius.diagram for PPE pyrolysis.
10-
10-2
k, s- 1
10- 5
.26
and the activation energy E is expressed in kcal/mol. It is evident from
Figure 7.1.5 that logl0k follows the Arrhenius relationship over a range
of five orders of magnitude in k. The best fit of these data yields
Arrhenius parameters (logloA(s-1 ),*(kcal/nol))=(11.1±0.9,45.2.7).
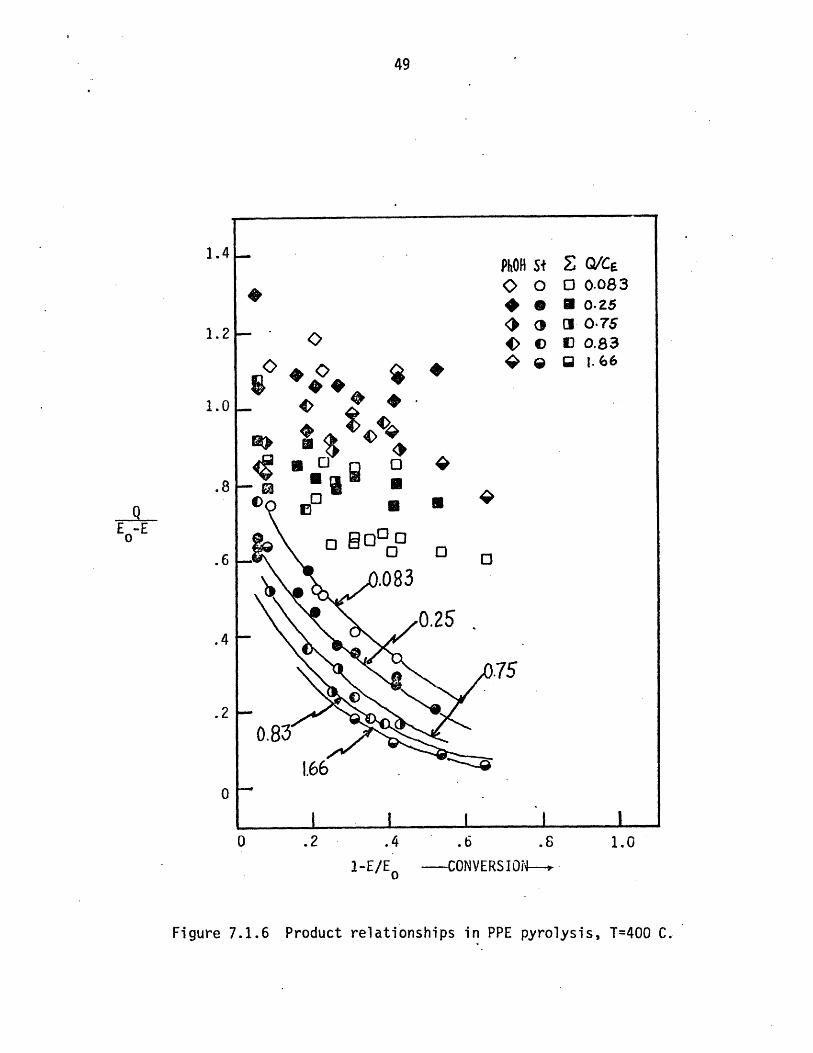
B. Secondary Products
Table 7.1.1 and Figures 7.1.1 and 7.1.2 suggested that ethylbenzene,
toluene and benzene were secondary products from styrene degradation. The
secondary reaction of styrene was concentration dependent, as depicted
in Figure 7.1.6, a plot of product appearance vs. substrate conversion at
400 C for initial PPE concentration, E , ranging from 0.083 to 1.66 mol/l.
While the ratios PhOH/(EoE ) and HC/(E -E) were substantially unity, in-
dependent of Eo and substrate conversion, a definite trend of decreasing
St/(E 0-E) with increasing Eo could be discerned at all conversion levels.
This is indicative of reaction order in excess of unity for the overall
secondary styrene reaction. From Table 7.1.1, the higher order reaction
path can be linked with toluene production, which increases with in-
creasing E ; in contrast, the ethylbenzene appearance was relatively in-
0
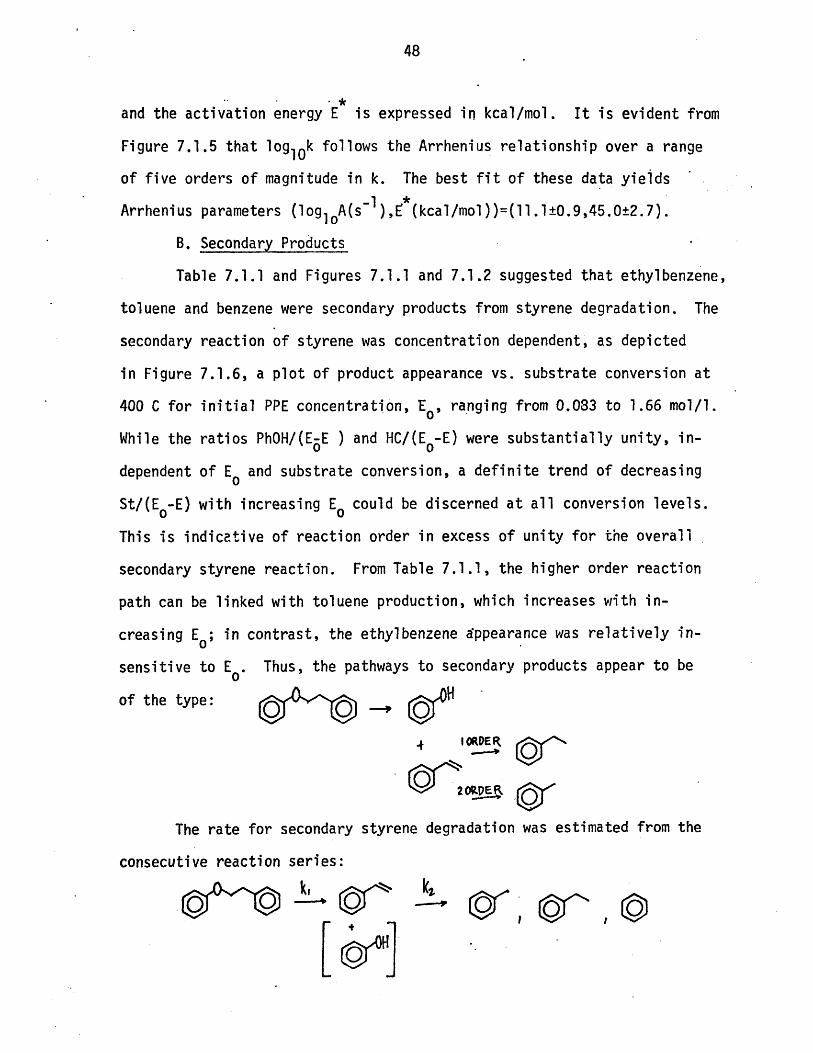
of the type:
The rate for secondary styrene degradation was estimated from the
consecutive reaction series:
ki 0 kz
+~p
49
1.4 PhOH St Q/c0 0 0 0.083@ 0.25
1.2 oI0 .7O 5.2- 0 0.839 ~ 1.66
1.0
.8 - oi 0
Q 0 0 * *0 oBO8 00- 0
.6 -O.083
0.25.4
.75
.2-
0.81.66
0
I I _____0 .2 .4 .6 .6 1.0
1-E/E 0 -- CONVERSI0N---
Figure 7.1.6 Product relationships in PPE pyrolysis, T=400 C.
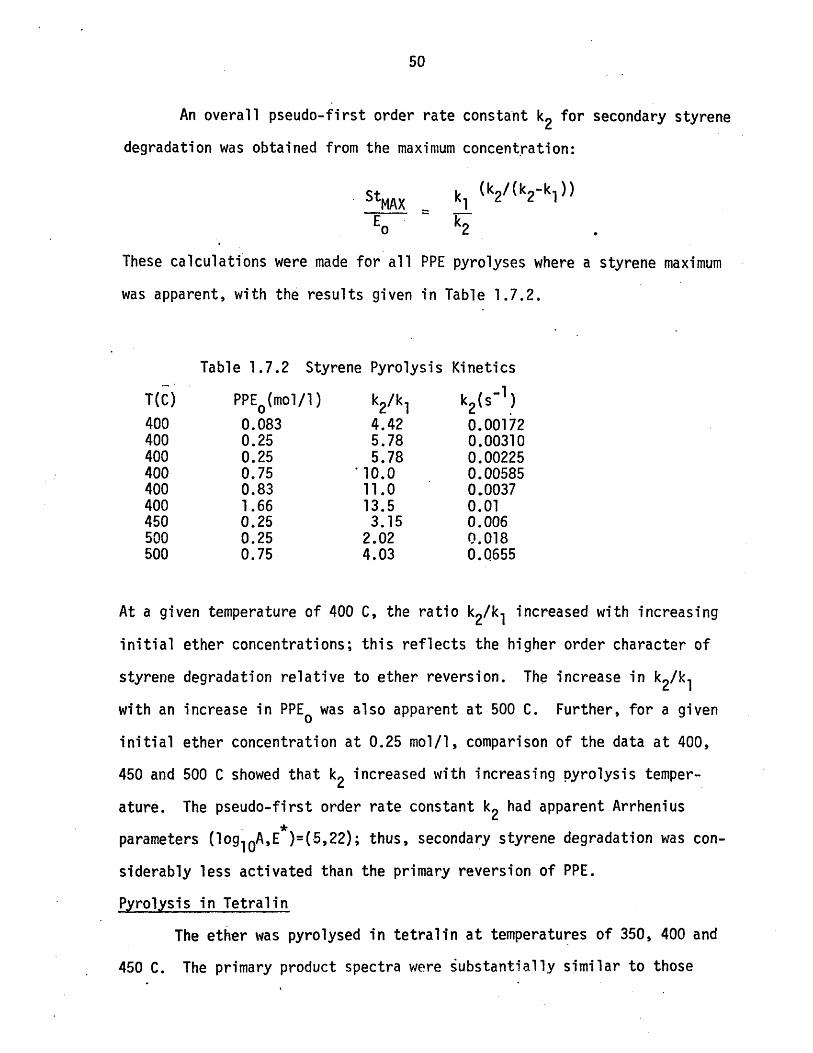
An overall pseudo-first order rate constant k2 for secondary styrene
degradation was obtained from the maximum concentration:
StMAX k1 (k2 /(k 2 -k 1))
Eo k2
These calculations were made for all PPE pyrolyses where a styrene maximum
was apparent, with the results given in Table 1.7.2.
Table 1.7.2 Styrene Pyrolysis Kinetics
T(C) PPE (mol/l) k2/k1 k2 ( )s-400 0.083 4.42 0.00172400 0.25 5.78 0.00310400 0.25 5.78 0.00225400 0.75 '10.0 0.00585400 0.83 11.0 0.0037400 1.66 13.5 0.01450 0.25 3.15 0.006500 0.25 2.02 0.018500 0.75 4.03 0.0655
At a given temperature of 400 C, the ratio k2/k1 increased with increasing
initial ether concentrations; this reflects the higher order character of
styrene degradation relative to ether reversion. The increase in k2/k1
with an increase in PPE o was also apparent at 500 C. Further, for a given
initial ether concentration at 0.25 mol/l, comparison of the data at 400,
450 and 500 C showed that k2 increased with increasing pyrolysis temper-
ature. The pseudo-first order rate constant k2 had apparent Arrhenius
parameters (loglOA,E*)=(5,22); thus, secondary styrene degradation was con-
siderably less activated than the primary reversion of PPE.
Pyrolysis in Tetralin
The ether was pyrolysed in tetralin at temperatures of 350, 400 and
450 C. The primary product spectra were substantially similar to those
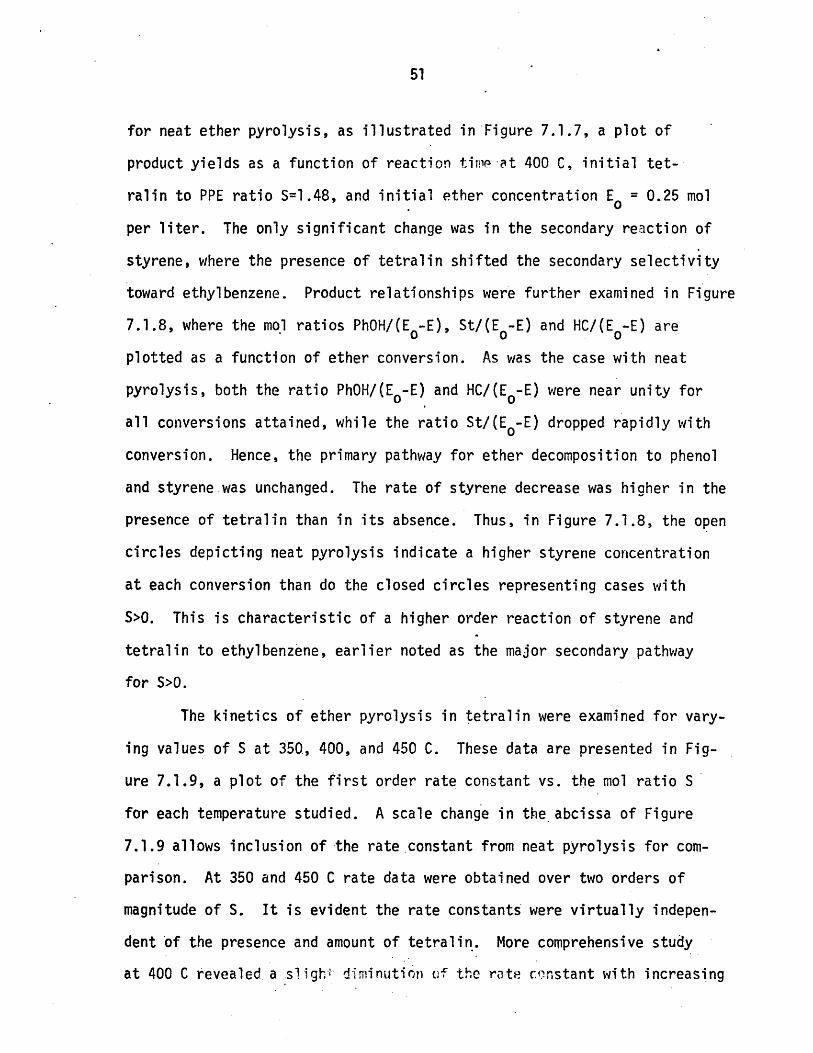
for neat ether pyrolysis, as illustrated in Figure 7.1.7, a plot of
product yields as a function of reaction tinm at 400 C, initial tet-
ralin to PPE ratio S=1.48, and initial ether concentration Eo = 0.25 mol
per liter. The only significant change was in the secondary reaction of
styrene, where the presence of tetralin shifted the secondary selectivity
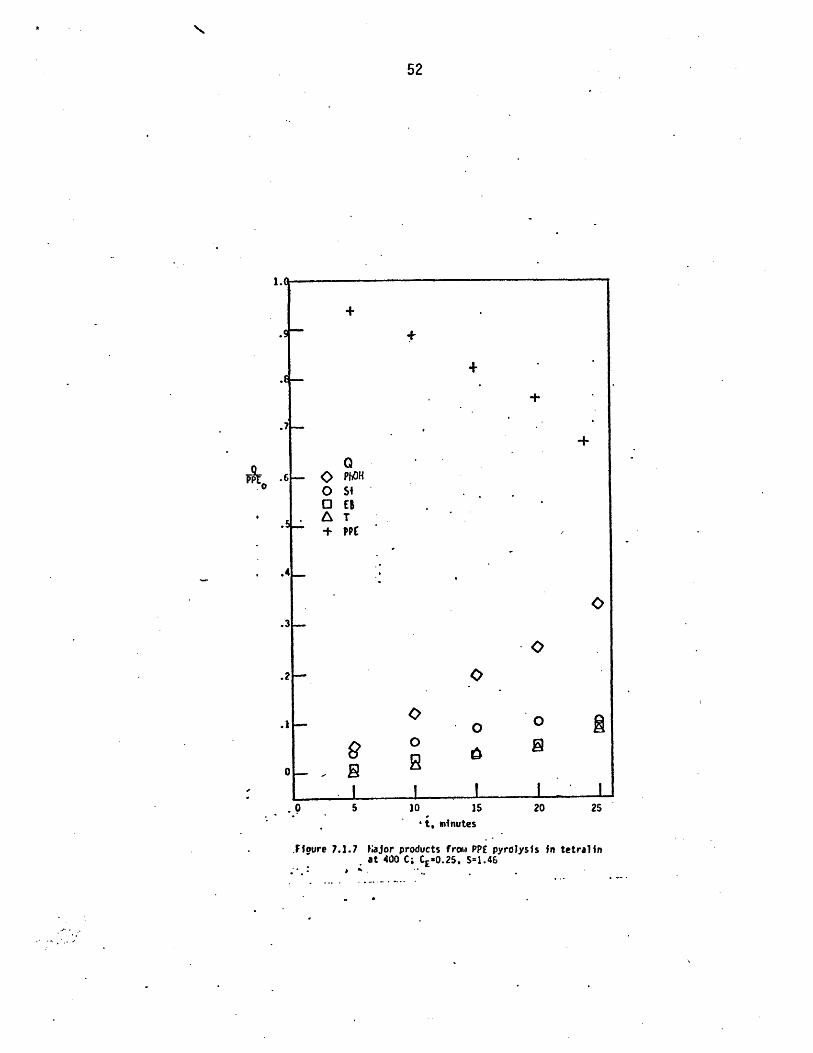
toward ethylbenzene. Product relationships were further examined in Figure
7.1.8, where the mol ratios PhOH/(E -E), St/(E -E) and HC/(E o-E) are
plotted as a function of ether conversion. As was the case with neat
pyrolysis, both the ratio PhOH/(E -E) and HC/(E -E) were near unity for
all conversions attained, while the ratio St/(E o-E) dropped rapidly with
conversion. Hence, the primary pathway for ether decomposition to phenol
and styrene was unchanged. The rate of styrene decrease was higher in the
presence of tetralin than in its absence. Thus, in Figure 7.1.8, the open
circles depicting neat pyrolysis indicate a higher styrene concentration
at each conversion than do the closed circles representing cases with
S>O. This is characteristic of a higher order reaction of styrene and
tetralin to ethylbenzene, earlier noted as the major secondary pathway
for S>O.
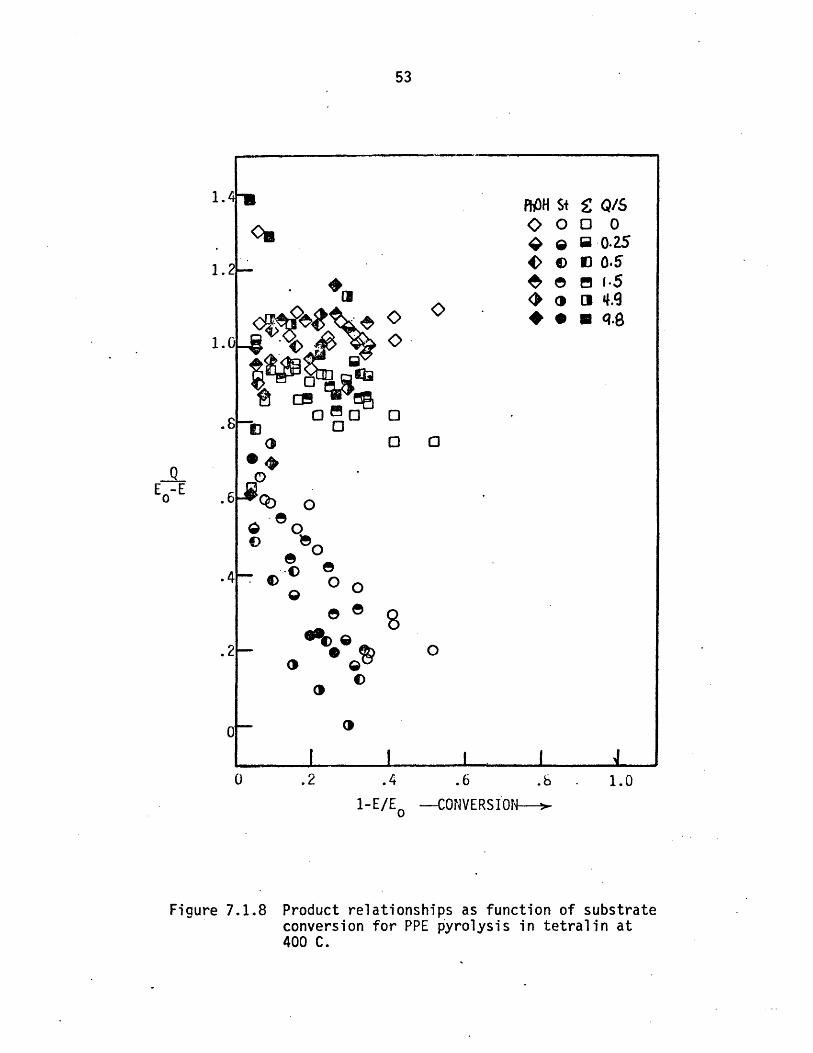
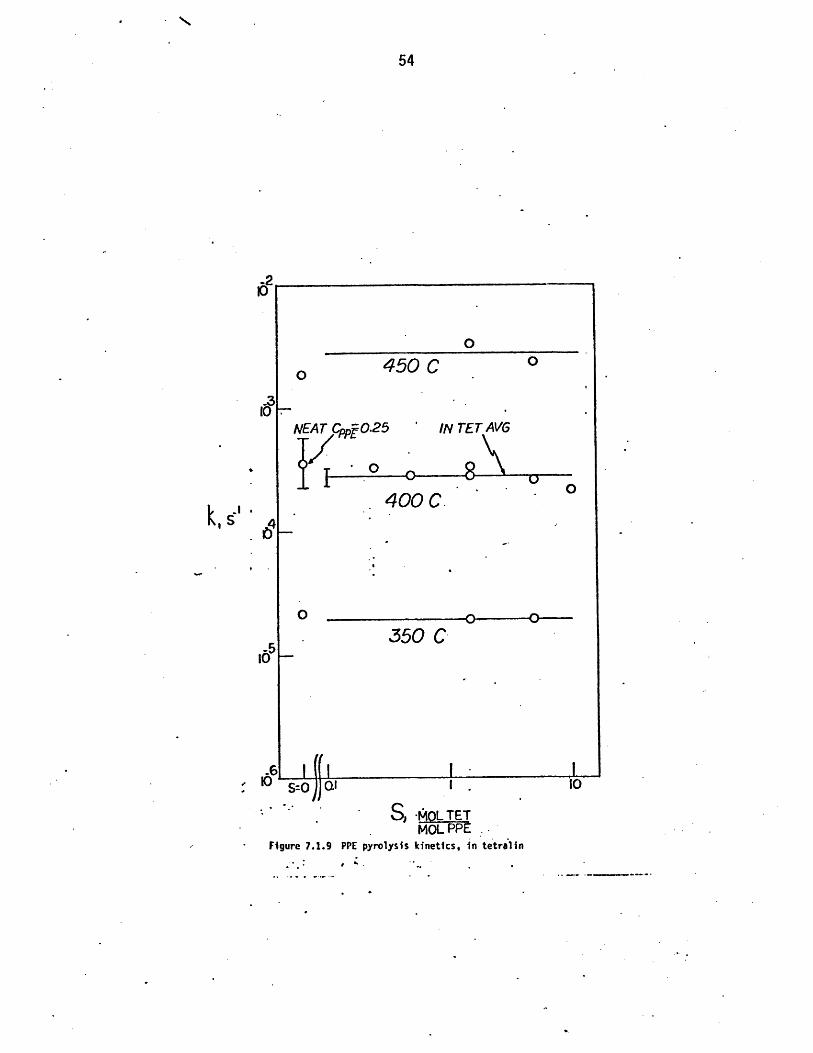
The kinetics of ether pyrolysis in tetralin were examined for vary-
ing values of S at 350, 400, and 450 C. These data are presented in Fig-
ure 7.1.9, a plot of the first order rate constant vs. the mol ratio S
for each temperature studied. A scale change in the abcissa of Figure
7.1.9 allows inclusion of the rate constant from neat pyrolysis for com-
parison. At 350 and 450 C rate data were obtained over two orders of
magnitude of S. It is evident the rate constants were virtually indepen-
dent of the presence and amount of tetralin. More comprehensive study
at 400 C revealed a s!igha diminution (f the rate constant with increasing
52
1.(
+
+
.7
0 SiD ED
. A T.5 PPC
.3-
1 00 0oo
.0 5 10 15 20 25
St, minutes
.Figure 7.1.7 tajor products fro, PPE pyrolysis in tetralinat 400 C; CE20.25 . S=1.48
I
1.4- OH St 9 Q/SOoD 0
e 0.25" @1 : e 0 0.51.2-
c ~ ,EI 4.9
1.04 0
OS O.0 c
o .6- b o0 Cm
0
O
.2 0
I I I I) .2 .4 .6 .6 1.0
1-E/E o ---CONVERSION--
Figure 7.1.8 Product relationships as function of substrateconversion for PPE pyrolysis in tetralin at400 C.
4
-5I0
.ro
0
0 450 C o
NEAT CppO.25 IN TET AVG
400 C. 0
0 O 0----
350 C
-MOL TETMOL PPE
Figure 7.1.9 PPE pyrolysis kinetics, in tetralin
kS
: " BOjJal
tetralin proportions, of the order of 0.2 log1 0 k units for the range S=O
to S=9.8. Statistical analyses of the neat and tetralin pyrolyses for all
S revealed that the difference in the means of each was. less than the
standard deviation of this difference. Further comparison of the neat and
in-tetralin ether pyrolyses was presented in the Arrhenius diagram
Figure 7.1.5. The dark circles representing data for pyrolysis in tetralin
were identical with the neat values.
In summary, PPE was pyrolysed both neat and in the presence of tet-
ralin. Neat ether pyrolysis resulted in the primary stoichiometric prod-
uction of phenol and styrene, with secondary degradation of the latter.
Overall ether pyrolysis was substantially first order, and was fit by
Arrhenius parameters (loglOA,E*)=(11.1,45.0). Secondary pyrolysis of
styrene was of reaction greater than unity, and proceeded with apparent
pseudo-first order Arrhenius parameters of (loglOA,E)=(5+2,22+3). Pyrol-
ysis in tetralin was similar to neat ether pyrolysis, the only significant
difference arising as an increased selectivity of secondary styrene con-
version to ethylbenzene. The kinetics of neat and in-tetralin pyrolyses
were identical.
1.7.2 Summary of Experimental Results
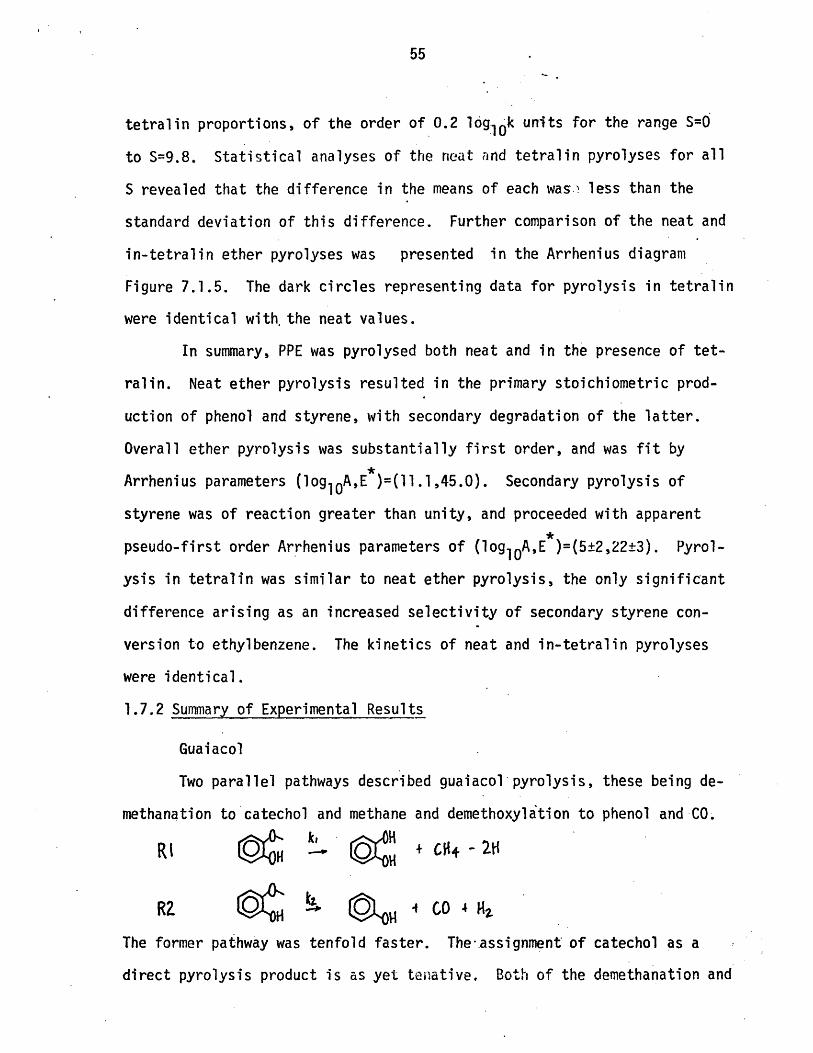
Guaiacol
Two parallel pathways described guaiacol pyrolysis, these being de-
methanation to catechol and methane and demethoxylation to phenol and CO.
RI + C9I4-4
The former pathway was tenfold faster. The-.assignment of catechol as a
direct pyrolysis product is as yet tenative. Both of the demethanation and
demethoxylation pathways were first order in substrate, with respective
Arrhenius parameters (loglOA,E )=(10.9±0.5,43.7±1.4) and (11.5±0.5,47.4±1.6).
Substituted Guaiacols:2,6-dimethoxyphenol(DMP), Isoeugenol, Vanillin
Pyrolyses of DMP, isoeugenol, and vanillin probed the respective
effects of electron donating, conjugative, and electron withdrawing sub-
stitution on guaiacol reactivity. The substrates decomposed by pathways
similar to Rl and R2 for guaiacol; vanillin underwent extensive decarbonyl-
ation as well. The kinetics of guaiacol demethanation and demethoxylation
were virtually unaffected by substitution.
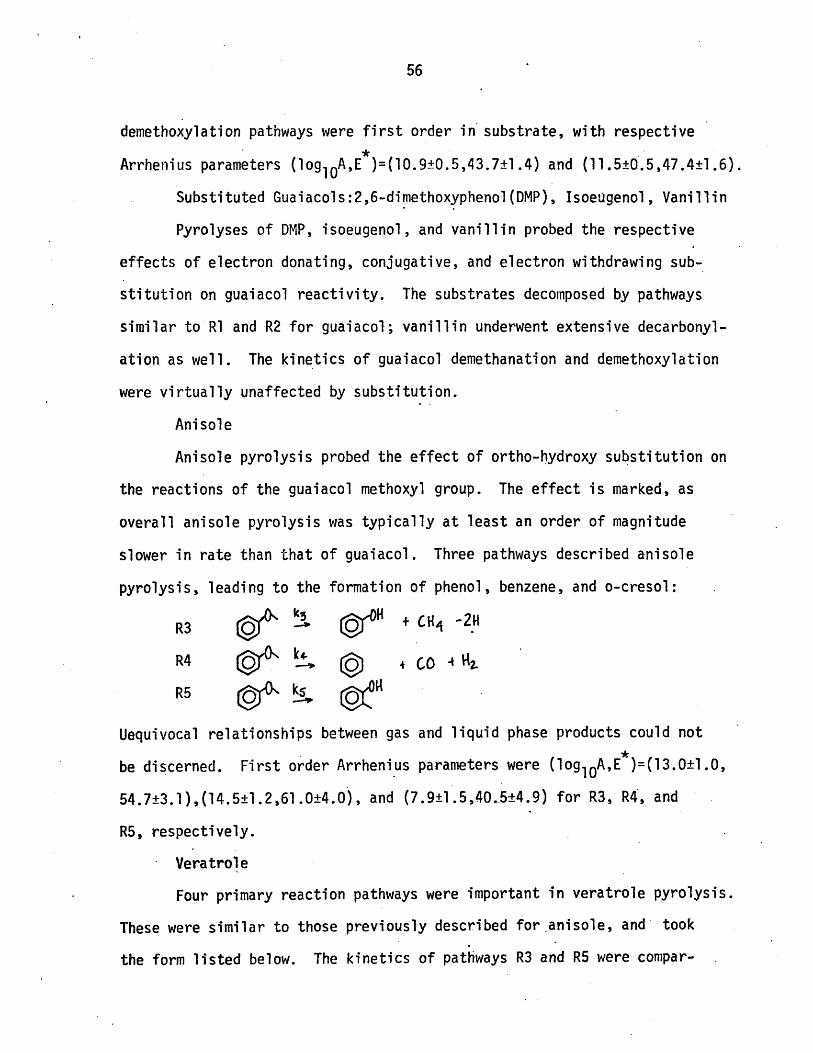
Anisole
Anisole pyrolysis probed the effect of ortho-hydroxy substitution on
the reactions of the guaiacol methoxyl group. The effect is marked, as
overall anisole pyrolysis was typically at least an order of magnitude
slower in rate than that of guaiacol. Three pathways described anisole
pyrolysis, leading to the formation of phenol, benzene, and o-cresol:
R3kj OH +CHq -2HR3 k +.
R5 k
Uequivocal relationships between gas and liquid phase products could not
be discerned. First order Arrhenius parameters were (loglOA,E)=(13.0±1.0,
54.7±3.1),(14.5+1.2,61.0±4.0), and (7.9±1.5,40.5+4.9) for R3, R4, and
R5, respectively.
Veratrole
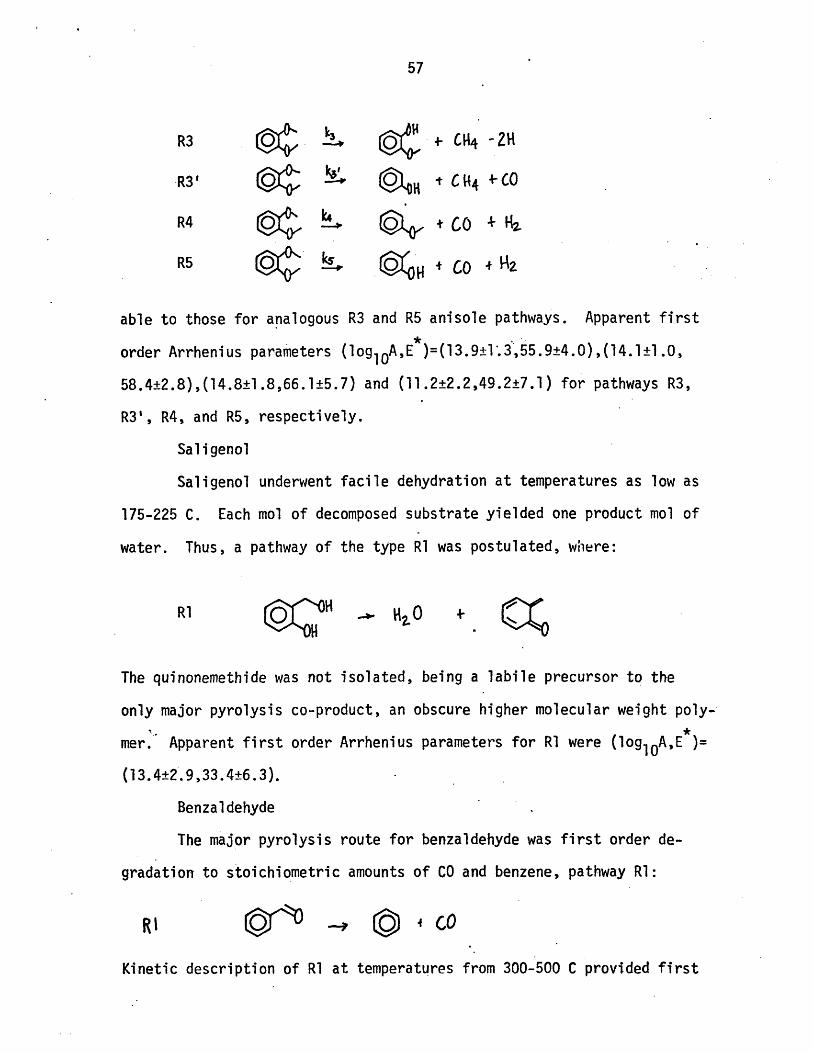
Four primary reaction pathways were important in veratrole pyrolysis.
These were similar to those previously described for.anisole, and took
the form listed below. The kinetics of pathways R3 and R5 were compar-
R3 -- C414 -ZH
R5 ks,-- -tCO -+ 1
able to those for analogous R3 and R5 anisole pathways. Apparent first
order Arrhenius parameters (loglOA,E*)=(13.9+1.3,55.9±4.0),(14.1+1.0,
58.4±2.8),(14.8±1.8,66.15.7) and (11.2±2.2,49.2±7.1) for pathways R3,
R3', R4, and R5, respectively.
Saligenol
Saligenol underwent facile dehydration at temperatures as low as
175-225 C. Each mol of decomposed substrate yielded one product mol of
water. Thus, a pathway of the type Rl was postulated, where:
R1 HO t
The quinonemethide was not isolated, being a labile precursor to the
only major pyrolysis co-product, an obscure higher molecular weight poly-
mer. Apparent first order Arrhenius parameters for Rl were (log10A,E)=
(13.4+2.9,33.4+6.3).
Benzaldehyde
The major pyrolysis route for benzaldehyde was first order de-
gradation to stoichiometric amounts of CO and benzene, pathway Rl:
Kinetic description of RI at temperatures from 300-500 C provided first
order Arrhenius parameters (loglOA,E )=(9.5±0.8,41.5±2.7).
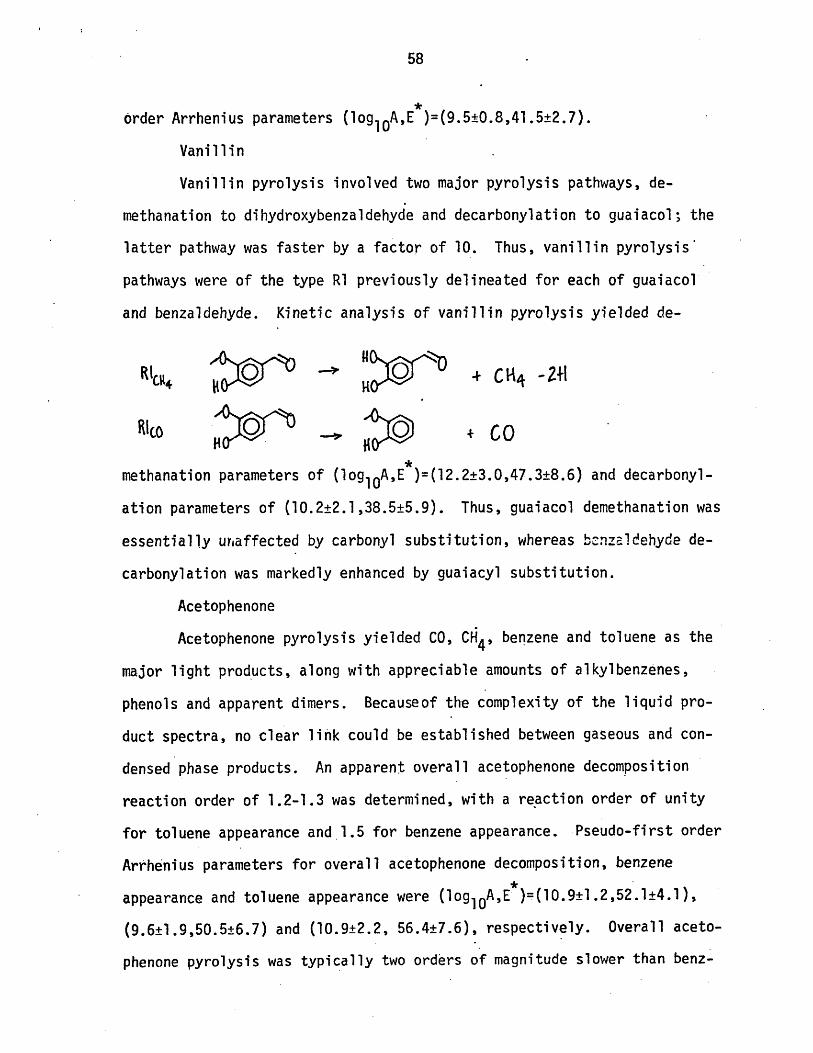
Vanillin
Vanillin pyrolysis involved two major pyrolysis pathways, de-
methanation to dihydroxybenzaldehyde and decarbonylation to guaiacol; the
latter pathway was faster by a factor of 10. Thus, vanillin pyrolysis
pathways were of the type Rl previously delineated for each of guaiacol
and benzaldehyde. Kinetic analysis of vanillin pyrolysis yielded de-
RlICK4 -' C~ 4- H -I- CH 4 -2'I
RC __ + CO
methanation parameters of (loglOA,E )=(12.2±3.0,47.3±8.6) and decarbonyl-
ation parameters of (10.2±2.1,38.5+5.9). Thus, guaiacol demethanation was
essentially uraffected by carbonyl substitution, whereas bCnzadehyde de-
carbonylation was markedly enhanced by guaiacyl substitution.
Acetophenone
Acetophenone pyrolysis yielded CO, CH4, benzene and toluene as the
major light products, along with appreciable amounts of alkylbenzenes,
phenols and apparent dimers. Becauseof the complexity of the liquid pro-
duct spectra, no clear link could be established between gaseous and con-
densed phase products. An apparent overall acetophenone decomposition
reaction order of 1.2-1.3 was determined, with a reaction order of unity
for toluene appearance and 1.5 for benzene appearance. Pseudo-first order
Arrhenius parameters for overall acetophenone decomposition, benzene
appearance and toluene appearance were (logl 0A,E )=(10.9+1.2,52.1+4.1),
(9.6±1.9,50.5±6.7) and (10.9+2.2, 56.4±7.6), respectively. Overall aceto-
phenone pyrolysis was typically two orders of magnitude slower than benz-
aldehyde pyrolysis for the temperature range studied here.
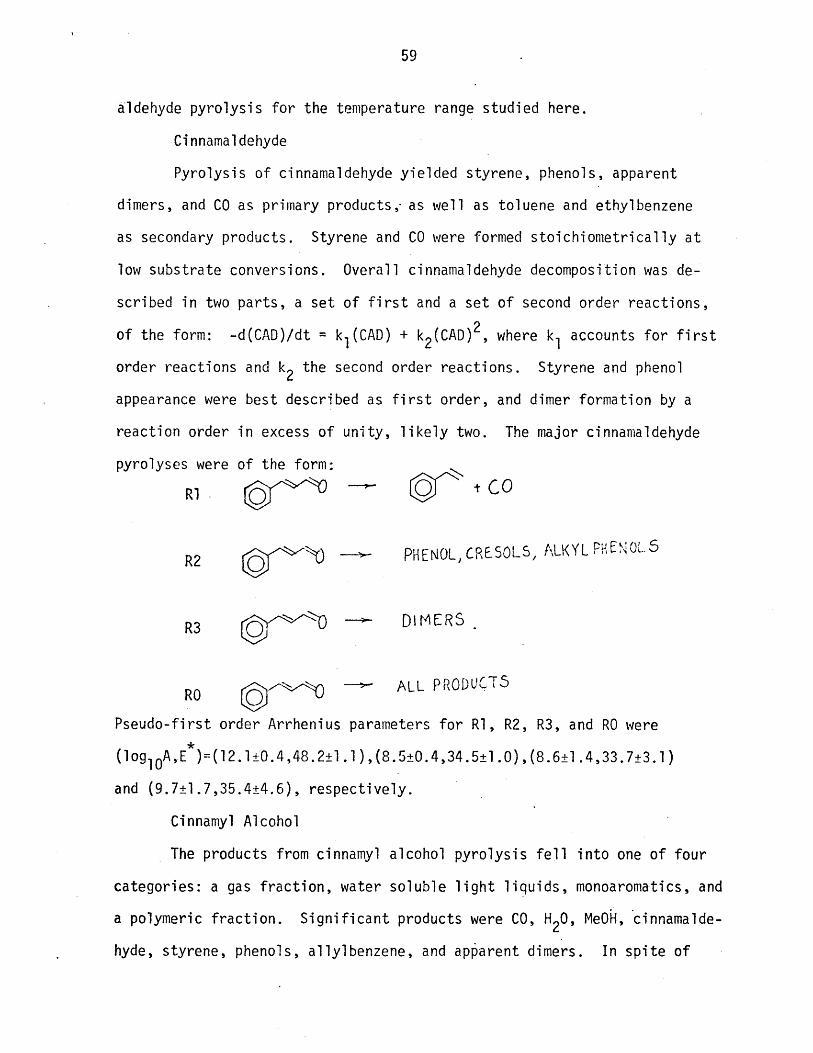
Cinnamaldehyde
Pyrolysis of cinnamaldehyde yielded styrene, phenols, apparent
dimers, and CO as primary products,- as well as toluene and ethylbenzene
as secondary products. Styrene and CO were formed stoichiometrically at
low substrate conversions. Overall cinnamaldehyde decomposition was de-
scribed in two parts, a set of first and a set of second order reactions,
of the form: -d(CAD)/dt = kl(CAD) + k2 (CAD) 2 , where k accounts for first
order reactions and k2 the second order reactions. Styrene and phenol
appearance were best described as first order, and dimer formation by a
reaction order in excess of unity, likely two. The major cinnamaldehyde
pyrolyses were of the form:
R1 Q tCO
R2 )0 PHENOL, CRESOLS, ALKYL PFENOL5
R3 Q) f DIMERS
RO ALL PRODUCTS
Pseudo-first order Arrhenius parameters for Rl, R2, R3, and RO were
(loglOA,E )=(12.l+0.4,48.2+1.l ),(8.5+0.4,34.5+1 .0),(8.6+1 .4,33.7+3.1)
and (9.7+1.7,35.4+4.6), respectively.
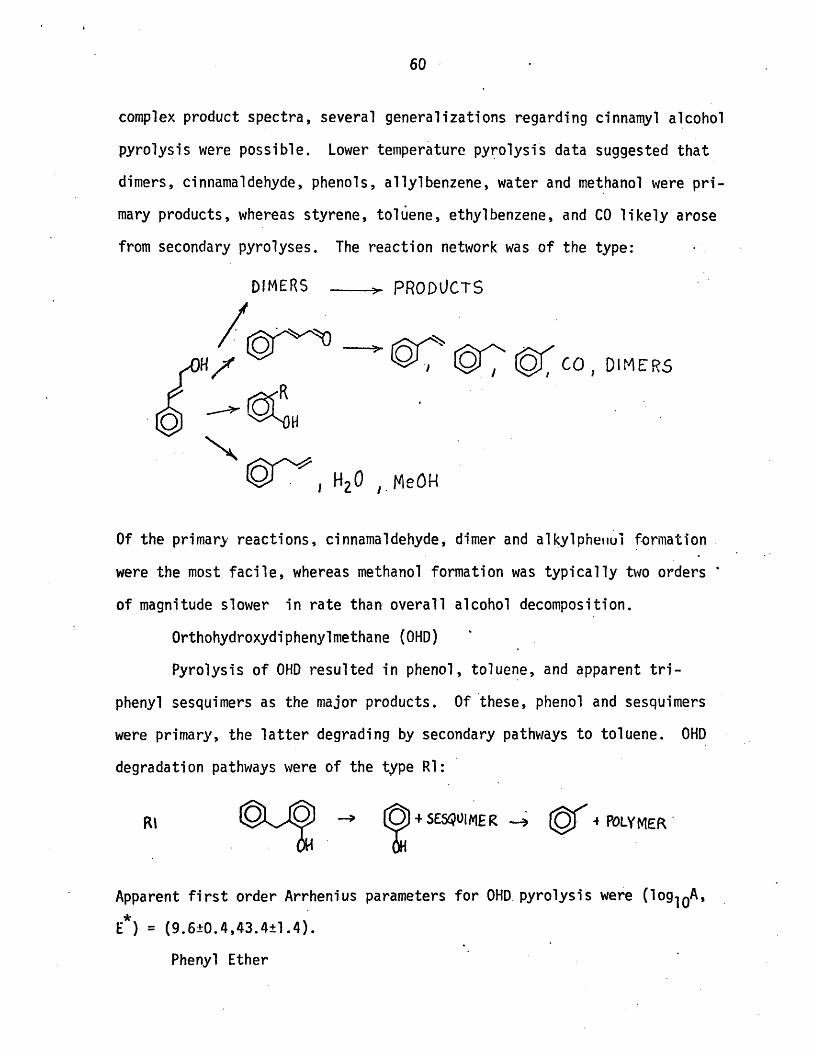
Cinnamyl Alcohol
The products from cinnamyl alcohol pyrolysis fell into one of four
categories: a gas fraction, water soluble light liquids, monoaromatics, and
a polymeric fraction. Significant products were CO, H20, MeOH, cinnamalde-
hyde, styrene, phenols, allylbenzene, and apparent dimers. In spite of
60
complex product spectra, several generalizations regarding cinnamyl alcohol
pyrolysis were possible. Lower temperature pyrolysis data suggested that
dimers, cinnamaldehyde, phenols, allylbenzene, water and methanol were pri-
mary products, whereas styrene, toluene, ethylbenzene, and CO likely arose
from secondary pyrolyses. The reaction network was of the type:
DIMERS -- PRODUCTS
0 , DIM E RS
/M H
H4zO , MeOR
Of the primary reactions, cinnamaldehyde, dimer and alkylphewlul formation
were the most facile, whereas methanol formation was typically two orders
of magnitude slower in rate than overall alcohol decomposition.
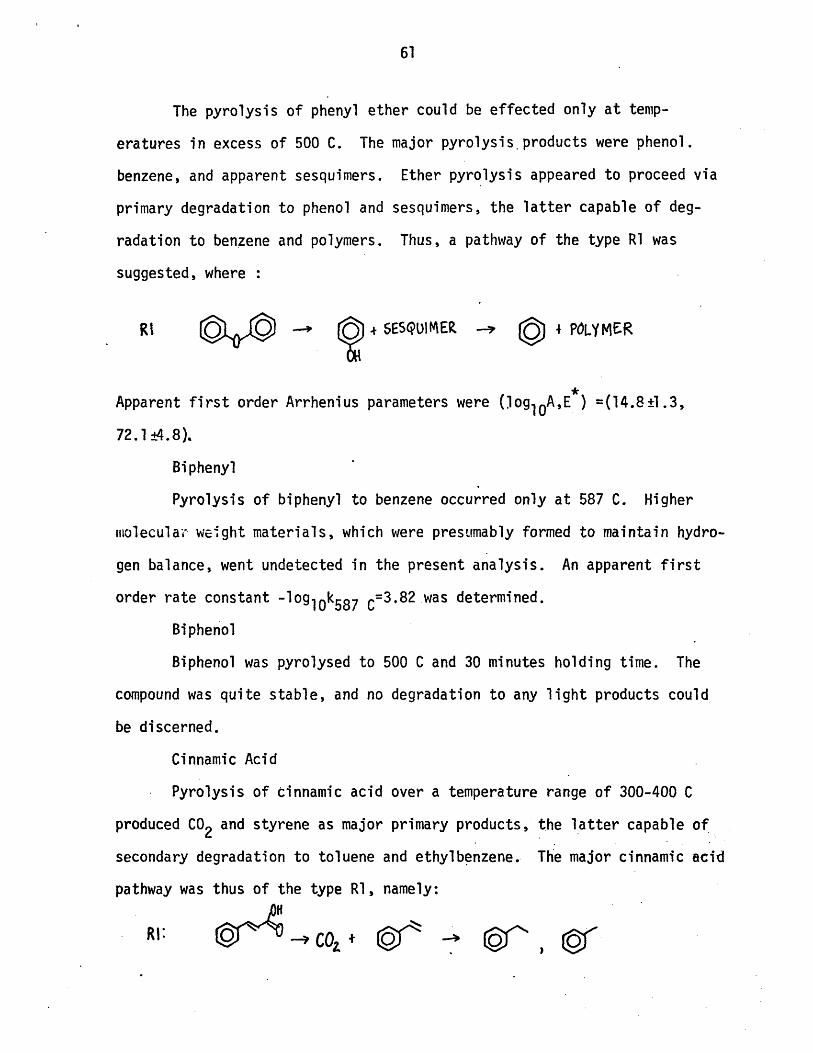
Orthohydroxydiphenylmethane (OHD)
Pyrolysis of OHD resulted in phenol, toluene, and apparent tri-
phenyl sesquimers as the major products. Of these, phenol and sesquimers
were primary, the latter degrading by secondary pathways to toluene. OHD
degradation pathways were of the type RI:
RI + SESQMUIE R - 4 POLYMER
Apparent first order Arrhenius parameters for OHD. pyrolysis were (logloA,
E ) = (9.6±0.4,43.4±1.4).
Phenyl Ether
The pyrolysis of phenyl ether could be effected only at temp-
eratures in excess of 500 C. The major pyrolysis.products were phenol.
benzene, and apparent sesquimers. Ether pyrolysis appeared to proceed via
primary degradation to phenol and sesquimers, the latter capable of deg-
radation to benzene and polymers. Thus, a pathway of the type Rl was
suggested, where :
Rt SESQUIER Z 4 POLYMER
Apparent first order Arrhenius parameters were (.og10A,E) =(14.8+1.3,
72.1 ±4.8).
Biphenyl
Pyrolysis of biphenyl to benzene occurred only at 587 C. Higher
molecula, weight materials, which were presumably formed to maintain hydro-
gen balance, went undetected in the present analysis. An apparent first
order rate constant -log 10k587 C=3.82 was determined.
Biphenol
Biphenol was pyrolysed to 500 C and 30 minutes holding time. The
compound was quite stable, and no degradation to any light products could
be discerned.
Cinnamic Acid
Pyrolysis of cinnamic acid over a temperature range of 300-400 C
produced CO2 and styrene as major primary products, the latter capable of
secondary degradation to toluene and ethylbenzene. The major cinnamic acid
pathway was thus of the type R1, namely:
RI: r -COZ
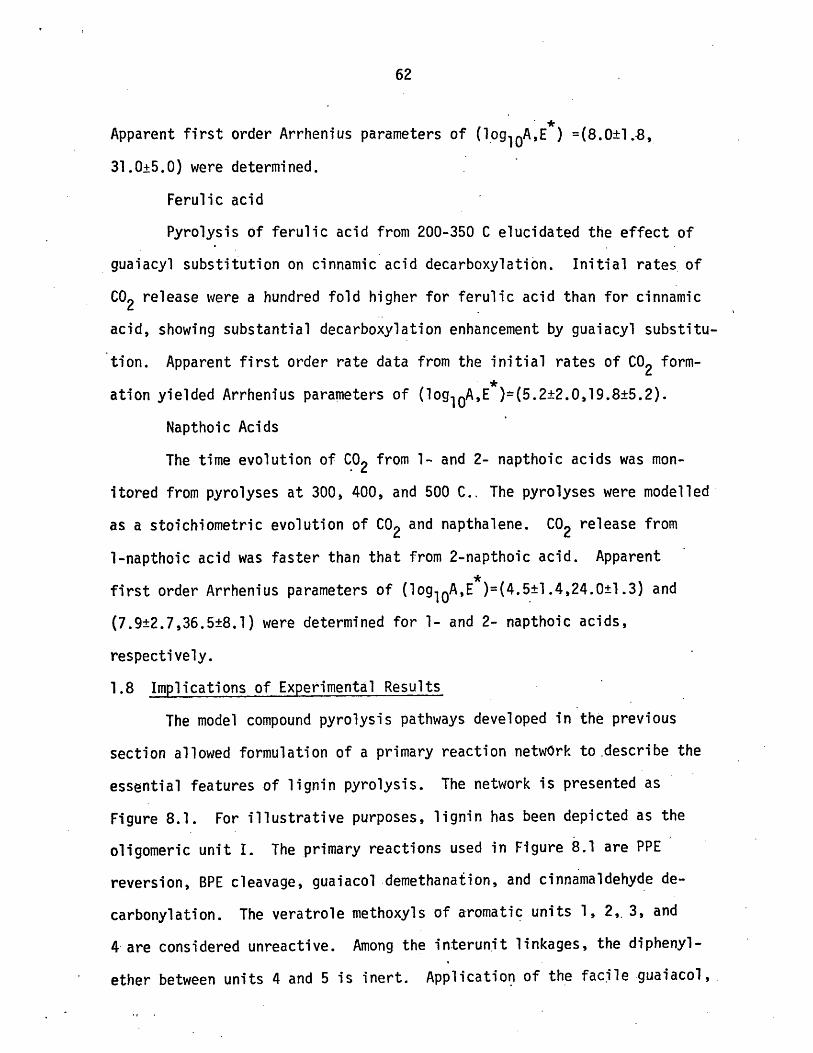
Apparent first order Arrhenius parameters of (loglOA,E) =(8.0±1.8,
31.0±5.0) were determined.
Ferulic acid
Pyrolysis of ferulic acid from 200-350 C elucidated the effect of
guaiacyl substitution on cinnamic acid decarboxylation. Initial rates of
CO2 release were a hundred fold higher for ferulic acid than for cinnamic
acid, showing substantial decarboxylation enhancement by guaiacyl substitu-
tion. Apparent first order rate data from the initial rates of CO2 form-
ation yielded Arrhenius parameters of (loglOA,E )=(5.2±2.0,19.8±5.2).
Napthoic Acids
The time evolution of CO2 from 1- and 2- napthoic acids was mon-
itored from pyrolyses at 300, 400, and 500 C.. The pyrolyses were modelled
as a stoichiometric evolution of CO2 and napthalene. CO2 release from
1-napthoic acid was faster than that from 2-napthoic acid. Apparent
first order Arrhenius parameters of (loglOA,E)=(4.51.4,24.0±1.3) and
(7.9±2.7,36.5±8.1) were determined for 1- and 2- napthoic acids,
respectively.
1.8 Implications of Experimental Results
The model compound pyrolysis pathways developed in the previous
section allowed formulation of a primary reaction network to .describe the
essential features of lignin pyrolysis. The network is presented as
Figure 8.1. For illustrative purposes, lignin has been depicted as the
oligomeric unit I. The primary reactions used in Figure 8.1 are PPE
reversion, BPE cleavage, guaiacol demethanaiion, and cinnamaldehyde de-
carbonylation. The veratrole methoxyls of aromatic units 1, 2,. 3, and
4 are considered unreactive. Among the interunit linkages, the diphenyl-
ether between units 4 and 5 is inert. Application of the facile guaiacol,
+CO
RIPPE OH IRIBPE R RISALR1GUA - R1GUA
-OH RICAD L.H RICALRISTY
MeMe O HfM
Me MeH
M Me
Me
H•+ CH+
Icurrent net cur net
CH4 0 0 4
CO 0 0 Co
H20 0 0 H20 0 0
H2 0 0 H2 0 0
Figure 8.1 Model pathway for lignin pyrolysis.
R" =,CH3 C2HR
.+CH 4 -i H
R +H20 RH2 RICAD -+COH+2 RIGUA
H H +CO
+CH4 ,2H) H +CH(-H) H 'H- H
MeM
cur netcur net CH4 0 4
CH4 3 4
CO 2 3CO 0 1
H20 1 1 H20 0 1
H, -I -1 H2 -1 -2
Figure 8.1 (cont)
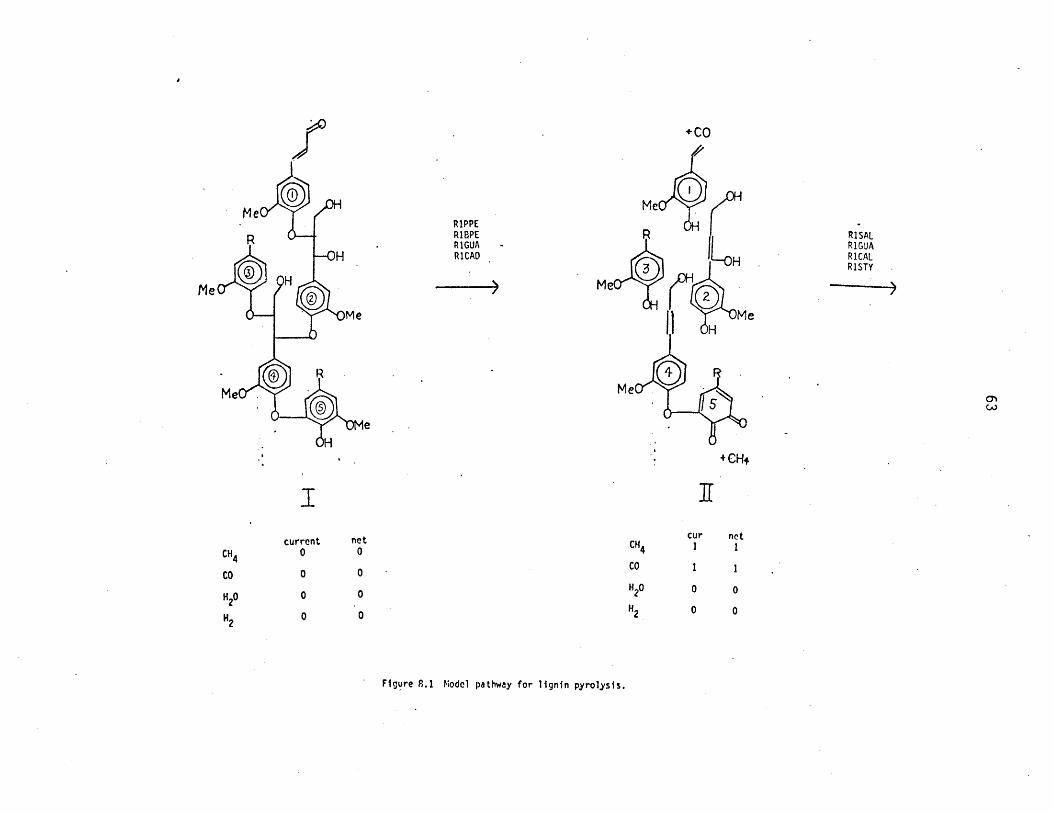
cinnamaldehyde, PPE, and BPE R1 pathways to structure I generates the
structures shown as set II. The cinnamaldehyde reaction of unit I released
CO and generated a styrene side chain. Reversion ofPPE andBPE links re-
sulted in guaiacol formation at units 1, 2, and 3, as well as a saligenol
moiety on unit 2 and a cinnamyl alcohol on unit 4. Demethanation resulted
in the formation of a diquinone at unit 5. The net release of gases and
water is tabulated in Figure 8.1; one mol each of CO and CH4 were formed
in transformation of the lignin depicted as structure I to set II. The
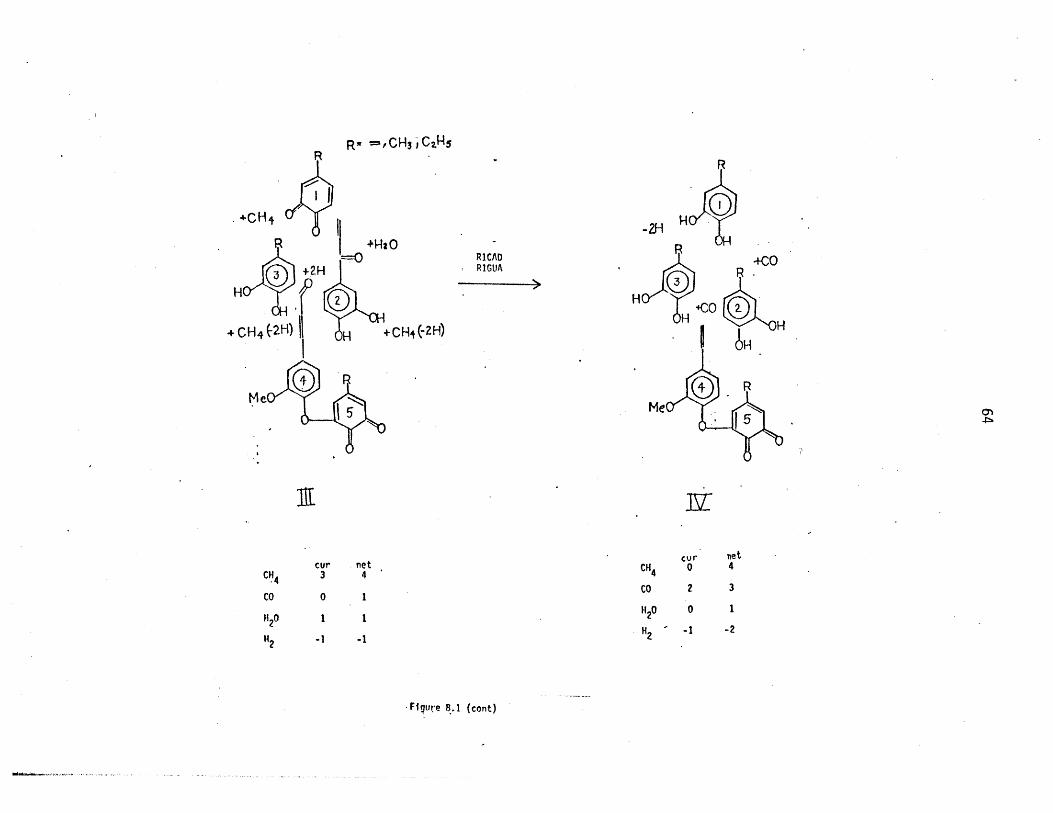
aromatics generated in set II are subject to further reactions, resulting
in the products shown as set III. With regard to set III, unit 1 depicts
guaiacyl demethanation as well as the degradation of styrene to toluene,
ethylbenzene, and benzene. The products from whole-lignin pyrolysis, then,
would be catechol, methylcatechol, and ethylcatechol precursors. Units
2 and 3 similarly depict guaiacyl demethanation, greatly facilitated by
ether reversion. Water arose from dehydration of the saligenol moiety of
unit 2, which generated the guaiacyl acrolein as well. Unit 4 depicts
cinnamyl alcohol dehydrogenation to cinnamaldehyde; it also illustrates
the relative stabilities of the phenyl ether link and thus of the assoc-
iated veratrole methoxyl. Further application of the same kinds of
reactions to set III generates the compounds of set IV, of which some
may still further react. However, the veratrole methoxyl of unit 4 is
relatively stable, and the diphenylether is essentially inert; both will
thus concentrate in the carbonaceous residue.
The structural moieties and possible reactions of Figure 8.1 depict
only a small number of the pathways involved in whole-lignin pyrolysis. A
more accurate description of lignin pyrolysis must incorporate more of the
structural details of the Freudenberg model as well as account for the
complex set of parallel and consecutive reactions likely important in
lignin pyrolyses. For this purpose, a lignin pyrolysis simulation model
was developed. This model combined the approach outlined in section 1.5
with the experimental model compound pyrolysis results. It possessed the
same logic as displayed in Figure 8.1, but was considerably extended in
scope.
1.9 Simulation Results
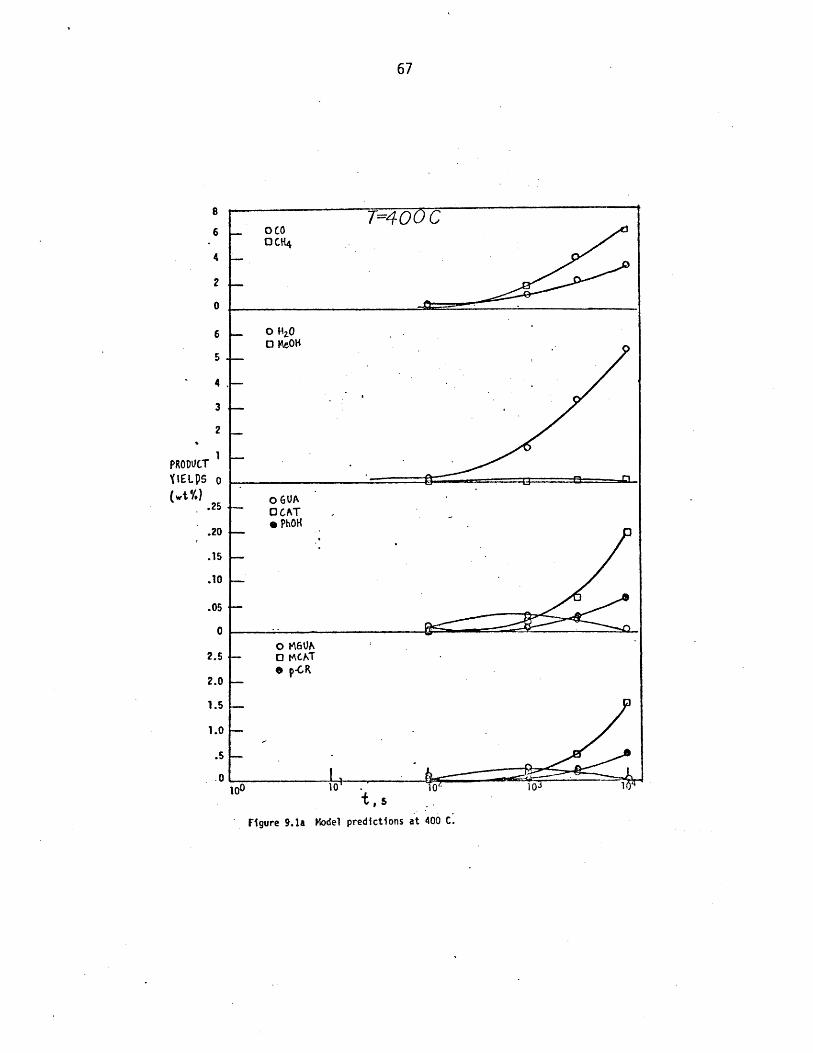
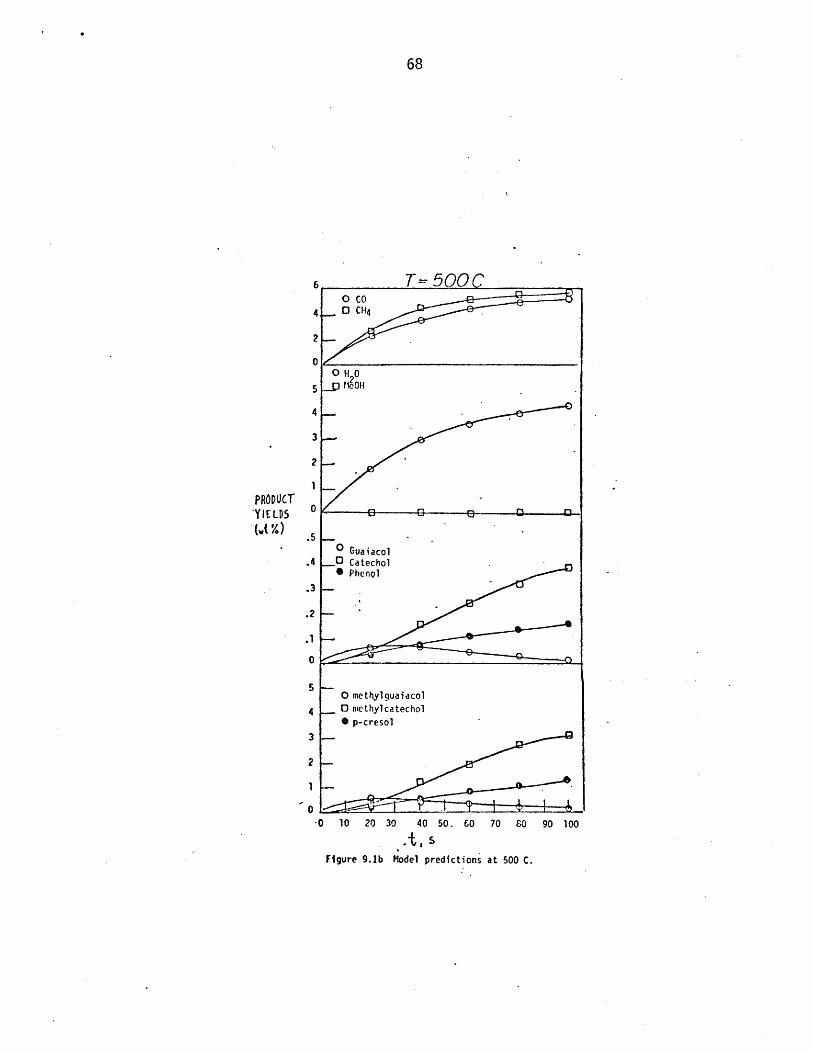
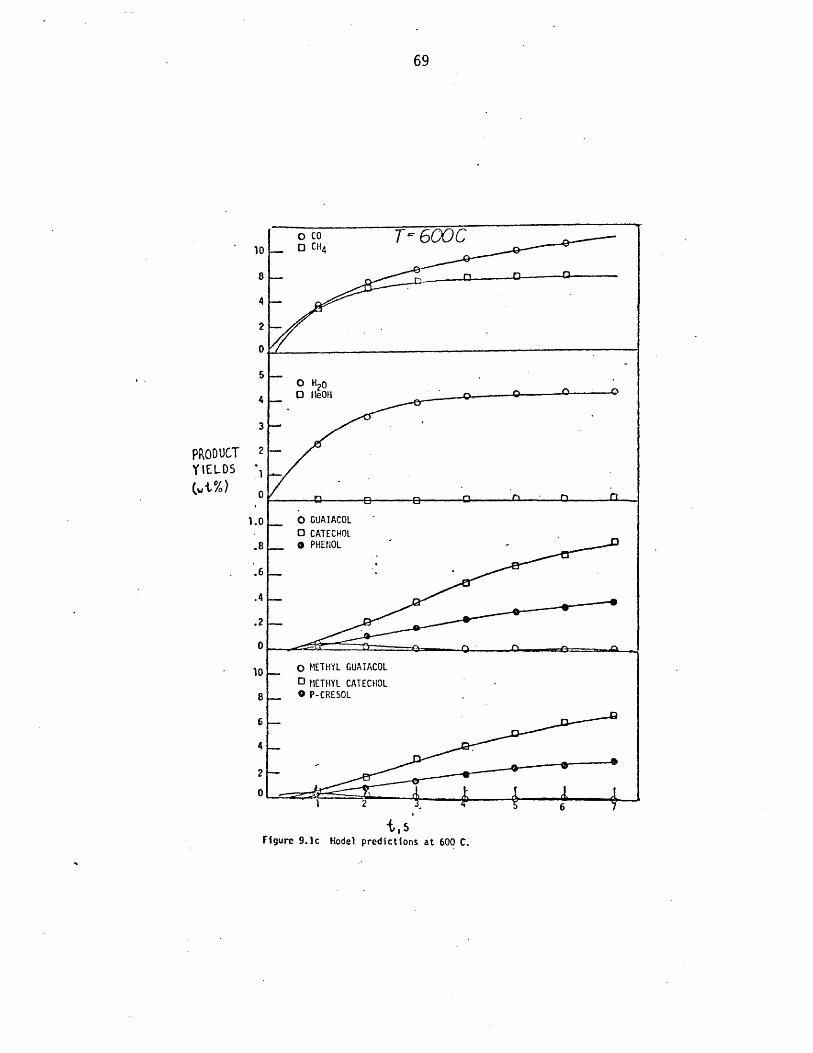
Spruce lignin pyrolysis was simulated at temperatures of 300, 400,
500, and 600 C, to holding times of 104 ,104, 102, and seven seconds, re-
spectively. Figures 9.1a, b, and c are graphical presentations of selected
product yields at each temperature studied. The present discussion will
consider the more important aspects of these simulation results, which
will be described in terms of the gas, light liquid, phenolic, and carbon-
aceous coke product fractions.
1.9.1 Gas Evolution
The model presently accounts for methane and carbon monoxide release.
CH4
Simulated pyrolysis to 104 s produced methane in yields of 0.05%
and 6.2% at 300 and 400 C, respectively. The greater yield at 400 C re-
flects not only guaiacol and veratrole activation, but also activation of
the prevalent PPE linkage. At 500 C and 100 s, the simulation predicted
a methane yield of 5.9%, whereas at 600 C and 7s, a yield of 6.1% was pre-
dicted. Thus, these increases in the pyrolysis temperature resulted in a
sharp decrease in the time required to reach a nominal yield of 6%. These
yields compare with a theoretical maximun of about 9%, obtained by assum-
ing each aromatic unit could contribute one methane mol.
CO
PRODUCTYIELPS
(wt .)
.20
.15
.10
.05
0
2.5
2.0
1.5
1.0
.5
.0
Figure 9.1a Model predictions at 400 C.
PRODUCTY IELDSm~ V.~)
-0 10 20 30 40 50. 60 70 80 90 100
igure 9.b Model predictions at 500 C.
Figure 9.Ib Model predictions at 500 C.
69
o co T- 600C10 0 CH4
8
4
2
0
5O H200 HeOH
3
PRODUCT 2YIELDS '
(t%) O
1.0 0 GUAIACOL0 CATECHOL
.8 0 PHENOL
.6
.4
.2
10 O METHYL GUAIACOL
0 METHYL CATECHOL8 * P-CRESOL
2 p
t,sFigure 9.lc Model predictions at 600 C.
Simulation to 104s at 300 and 400 C produced CO in yields of 0.037%
and 3,5%, respectively. In both cases, these were less than the correspond-
ing methane yield, yet initial rates of formation of CO at 400 C were fast-
er than those for methane as seen at short times in Figure 9.1a. This
early CO arises from the cinnamaldehyde side chains initially in lignin,
which decarbonylate rather easily. At longer times, ether reversions gen-
erate further carbonyl and guaiacol units, the former through rapid sal-
igenol dehydration. However, a large fraction of these carbonyls are of the
acrolein type, which decarbonylate slower than cinnamaldehydes. Hence, CO
release becomes slower than methane release as pyrolysis proceeds, the
ratio CH4/CO exceeding unity for modest conversions at 300 and 400 C. At
the highest temperature of 600 C, however, CO again exceeds CH4 as.seen in
Figure 9.1c, where the respective yields of CO and CH4 are 9% and 6% at 7s.
This occurs because CO producing pathways such as decarbonylation and de-
methoxylation are both more highly activated than the primary CH4 producing
pathway of guaiacyl demethanation. In short, the ratio CO/CH4 is predicted
to vary from greater than unity at low temperatures and low conversions, to
less than one at low to modest temperatures andmodest to long holding times,
and back to greater than unity at high temperatures. This behavior orig-
inates in the dual sites for CO release and the relative kinetics of car-
bonyl, ether, and guaiacyl pyrolyses.
1.9.2 Liquid Products
The present version of the model accounts for only two components
of the aqueous distillate, water and methanol. Simulation water formation
occurs predominantly through saligenol-type unit dehydrations. Cinnamyl
alcohol side chains provide less important precursors. Ultimate water
yields were rather modest, amounting to 0.05%, 5.3%, 4.4%, and 4.4% at
(300C, 104s),(400C, 104s), (500C, 102s) and (600C, 7s), respectively.
Thus, the water yields predicted by the simulation are about 1/3 of the
nominal 15+5% reported in experimental investigations. This discrepancy is
significant, and merits later discussion.
An ultimate methanol yield of only about 0.1% is predicted by the
simulation model. The single methanol forming pathway simulated is through
degradation of cinnamyl alcohol side chain units. These units are rather
rare in whole-lignin and the methanol forming pathway of this unit was it-
self relatively minor. Thus, the simulation model generally underpredicted
methanol yields of the order 0.28-1.5% reported in the literature.
1.9.3 Phenolic Products
The simulation predicts most of the thirty phenols reported in pre-
vious experimental pyrolyses; it also predicts several phenolic products
not hitherto reported in the literature. Overall, the product yields are
within the hand of yields reported in the literature. The simulation pre-
dictions will be discussed by phenol types.
Guaiacols
Guaiacols arise in lignin pyrolysis through degradations of both the
3-carbon side chain and etherified methoxyphenol substitutents. Thus the
products coniferaldehyde, guaiacylacrolein, eugenol, propylguaiacol,
vinylguaiacol, ethylguaiacol, methylguaiacol, and guaiacol represent var-
ious stages of 3-carbon chain degradation. Of these, coniferaldehyde
and guaiacylacrolein are the most primary products, degrading to vinyl-
guaiacols, which, in turn, yield methylguaiacols, ethylguaiacol, and
guaiacol upon further pyrolysis. These trends are reflected in the simu-
lation predictions. At 400C and 100s the ratios (coniferaldehyde:vinyl-
guaiacol:methylguaiacol:guaiacol) were (0.68: 0.13: 0.088: 0.011), whereas-
at 500s the proportions were (0.096:0.02:0,26:0.034) andat 104s (0.000128:
0.000218:0.03:0.0039). By 104 s, the data reflect not only 3-carbon
side chain degradation of the aldehyde, but also secondary pyrolysis of
guaiacols to catechols. Each guaiacol product is both formed and degraded
during pyrolysis, and therefore attains maximal proportions at some time.
Syringols (2,6-dimethoxyphenols)
With two exceptions, the reactions of syringol compounds directly
mimic those of guaiacol compounds. The more.important difference is the
reaction path degeneracy inherent in syringols, on account of the multiple
methoxyl substitution. The second exception involves lignification steric
effects, which prevent the formation of biphenyland phenylcoumaran links in
aromatic units arising from sinapyl alcohol monomers. However, the consec-
utive and parallel nature of -the reaction paths generating syringol prod-
ucts is substantially as described above for guaiacols.
Catechols
Rather substantial amounts of catechols are predicted by the sim-
ulation model, due to the relatively facile demethanation of guaiacol and
substituted guaiacols. The catechols are clearly secondary products,
favored at long holding times. These generalizations are reflected in the
data. At 400 C and 100 s, the proportions (catechol:methylcatechol:vinyl-
catechol), in weight percent, were (5x10⁻⁴:4x10⁻⁴:610-3), whereas for
pyrolysis to 104 s the yields were (0.2:1.6:0.012). At 500 C and 10 s
holding time the ratios were (0.02:0.15:0.16), changing to (0.38:3.03:0.19)
at 100 s. Finally at 600 C the proportions were (0.069:0.54:1.2).at 1 s
and (0.86:6.8:1.2) at 7s. Thus, the yields of catechol and methylcatechol
increased dramatically with increasing holding time at all temperatures.
Note that this contrasts with the corresponding guaiacol yields, which
reached maxima at short holding times and.decreased monotonically there-
after with increasing time.
Phenols
Phenols arise from two sources, namely, aromatic units initially
derived from incorporation of coumaryl alcohols during lignification, and
from the demethoxylation reactions of guaiacol and syringol units. The
statistical matching procedure demands that the phenol types be analogous
to the guaiacols and syringols. Thus, simple phenol, cresol, ethylphenol,
propylphenol, vinylphenol, allylphenol, coumaraldehyde, and hydroxyacrolein
all arise as products. The simulated yields of phenol (PhOH) and para-
cresols (pCR) were (PhOH,pCR)= ((0.00031, 0.0024), (0.067, 0.55), (0.16,
1.3), (0.39, 3.1)) at temperatures amd times of ((300C,10 4s), (400C,10 4s),
(500C,10 2s), and (600C,7s). The absolute yields of phenols increased with
increasing pyrolysis severity. the greater energy of activation for guai-
acol demethoxylation relative to demethylation shifts the higher temper-
ature selectivity toward phenols, even though absolute phenol yields were
still lower than those of the corresponding catechols.
Carbonaceous Residue
As depicted by the present model, the carbonaceous residue is com-
prised of all aromatic units involved in interunit bonding. It should be
characterized by higher concentrations of the refractory phenylether and
diphenylmethane linkages than the initial lignin. Further, its methoxyl
content should be markedly reduced relative to lignin due to demethanation
and demethoxylation of guaiacyl and veratryl units, Finally, catechol
and diquinone moieties should concentrate in the residue.
Carbonaceous residue formation can be interpreted in kinetic terms.
Most kinetic analyses of lignin pyrolysis focus upon substrate weight
loss, a reasonable operational definition of global lignin reactivity. In
the present simulation, single ring aromatic. units, light liquids, and
gases can be designated as volatile, and multiple ring aromatics as non-
volatile. If the latter group is considered to be 'unreacted lignin', the
model then provides a measure of lignin 'conversion'. Figure 9.2 is a
comparison between weight loss curves simulated in the present work and
the experimental weight loss curves of latridis and Gavalas 26. The ex-
perimental and simulated weight loss curves align best at 500 C, with a
slight simulation overprediction at 600 C and underprediction at 400 C;
overall agreement is within about +10% of the lignin.
1.10 Discussion
Two aspects of the present results merit discussion, namely the
mechanisms of the experimental model compound pyrolyses and the application
of the model pathways to simulate whole-lignin pyrolysis.
1.10.1 The Mechanism of Phenethyl Phenyl Ether (PPE) Pyrolysis
The relatively clean pyrolysis pf PPE to phenol and styrene, earlier
described in sectionl.7.1, suggested an overall pathway of the type R1:
R+
We attempt to interpret PPE pyrolysis in terms of both a free radical
chain mechanism and a pericyclic retroene mechanism.
For neat PPE pyrolysis, a Rice-Herzfeld type of radical chain
mechanism that yields the observed phenol and styrene products is:
I P' h PhO + h INITItTIO N
2 PhO 0 n Ph P PhOl + PphOv'/ PROPA6ATION
3 P'kp PhO* + Ph"
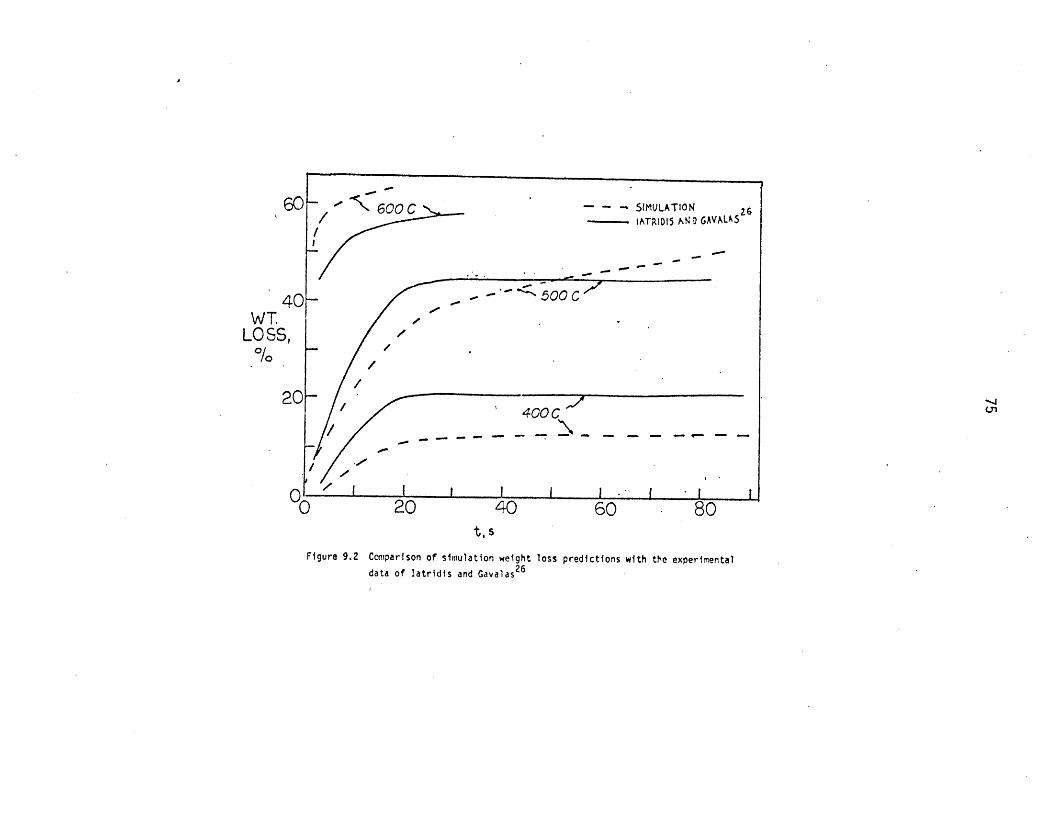
WT.LOSS,
20 -400 C
O 20 40 60 80t,s
Figure 9.2 Comparison of simulation weight loss predictions with the experimental
data of latridis and Gavalas 26
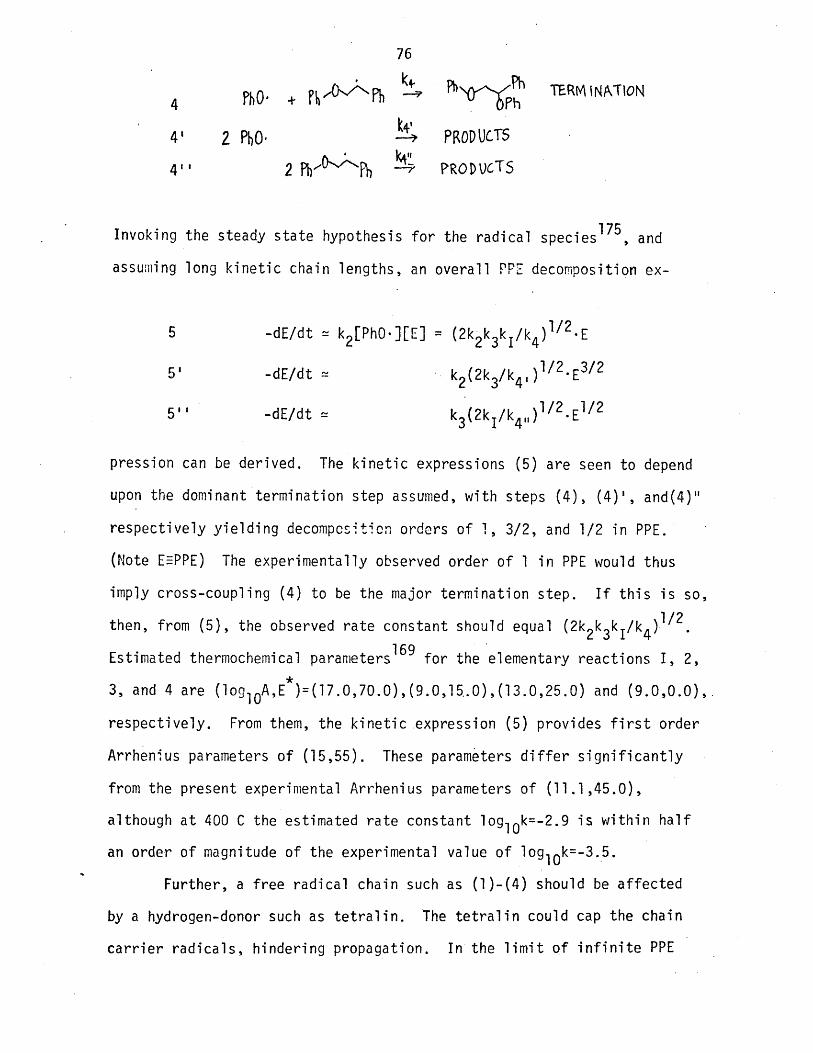
76
4 Ph:O +N p h TERM INATION
4' 2 PbO. PRODUCTS
4'' 2 P~ - PROD UCTS
Invoking the steady state hypothesis for the radical species 75 , and
assuming long kinetic chain lengths, an overall PPE decomposition ex-
5 -dE/dt = k2[PhO.][E] = (2k2k3k /k4)1/2.E
5' -dE/dt = k2(2k3/k4, )1/2E 3/2
5" -dE/dt = k3(2k /k4 ) 1/ 2 . E1/ 2
pression can be derived. The kinetic expressions (5) are seen to depend
upon the dominant termination step assumed, with steps (4), (4)', and(4)"
respectively yielding decompcsiticn orders of 1, 3/2, and 1/2 in PPE.
(Note EEPPE) The experimentally observed order of 1 in PPE would thus
imply cross-coupling (4) to be the major termination step. If this is so,
then, from (5), the observed rate constant should equal (2k2k3kI/k4)1 2
Estimated thermochemical parametersl69 for the elementary reactions I, 2,
3, and 4 are (log 10A,E*)=(17.0,70.0),(9.0,15.0),(13.0,25.0) and (9.0,0.0),
respectively. From them, the kinetic expression (5) provides first order
Arrhenius parameters of (15,55). These parameters differ significantly
from the present experimental Arrhenius parameters of (11.1,45.0),
although at 400 C the estimated rate constant log10k=-2.9 is within half
an order of magnitude of the experimental value of log10 k=-3.5.
Further, a free radical chain such as (l)-(4) should be affected
by a hydrogen-donor such as tetralin. The tetralin could cap the chain
carrier radicals, hindering propagation. In the limit of infinite PPE
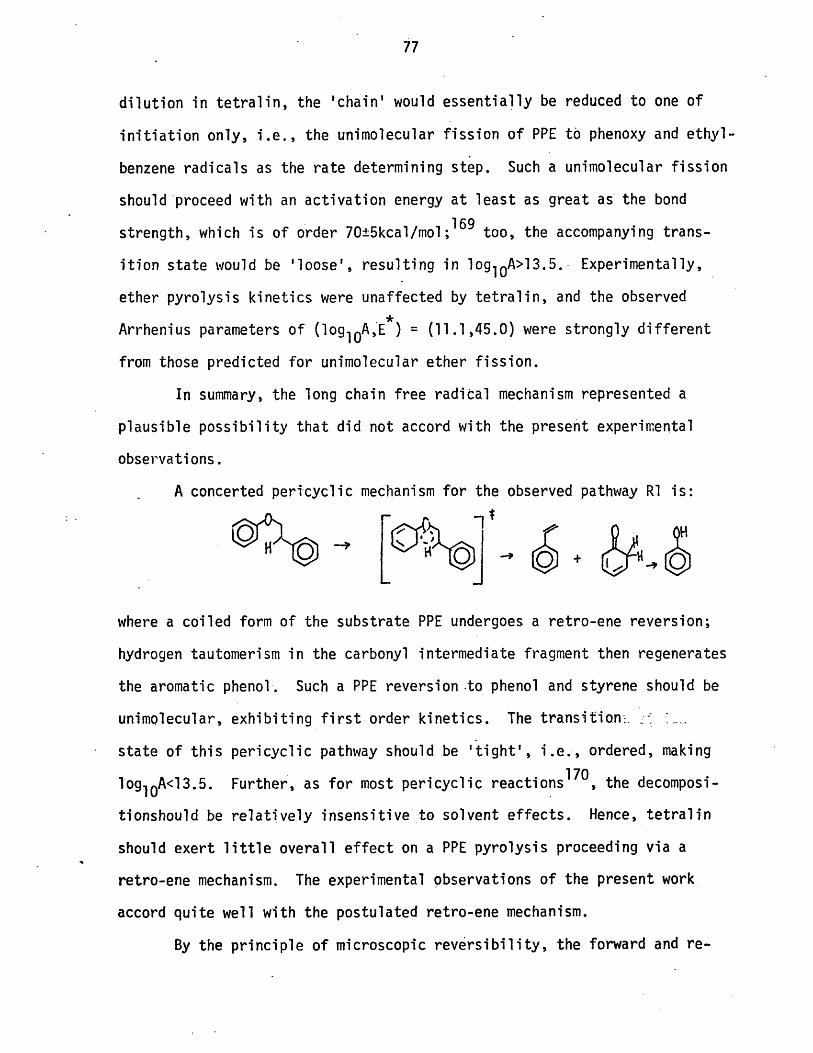
dilution in tetralin, the 'chain' would essentially be reduced to one of
initiation only, i.e., the unimolecular fission of PPE to phenoxy and ethyl-
benzene radicals as the rate determining step. Such a unimolecular fission
should proceed with an activation energy at least as great as the bond
strength, which is of order 70+5kcal/mol;169 too, the accompanying trans-
ition state would be 'loose', resulting in log1OA>13.5. Experimentally,
ether pyrolysis kinetics were unaffected by tetralin, and the observed
Arrhenius parameters of (loglOA,E*) = (11.1,45.0) were strongly different
from those predicted for unimolecular ether fission.
In summary, the long chain free radical mechanism represented a
plausible possibility that did not accord with the present experimental
observations.
A concerted pericyclic mechanism for the observed pathway Rl is:
_j
where a coiled form of the substrate PPE undergoes a retro-ene reversion;
hydrogen tautomerism in the carbonyl intermediate fragment then regenerates
the aromatic phenol. Such a PPE reversion .to phenol and styrene should be
unimolecular, exhibiting first order kinetics. The transition -.
state of this pericyclic pathway should be 'tight', i.e., ordered, making
log1OA<13.5. Further, as for most pericyclic reactions170, the decomposi-
tionshould be relatively insensitive to solvent effects. Hence, tetralin
should exert little overall effect on a PPE pyrolysis proceeding via a
retro-ene mechanism. The experimental observations of the present work
accord quite well with the postulated retro-ene mechanism.
By the principle of microscopic reversibility, the forward and re-
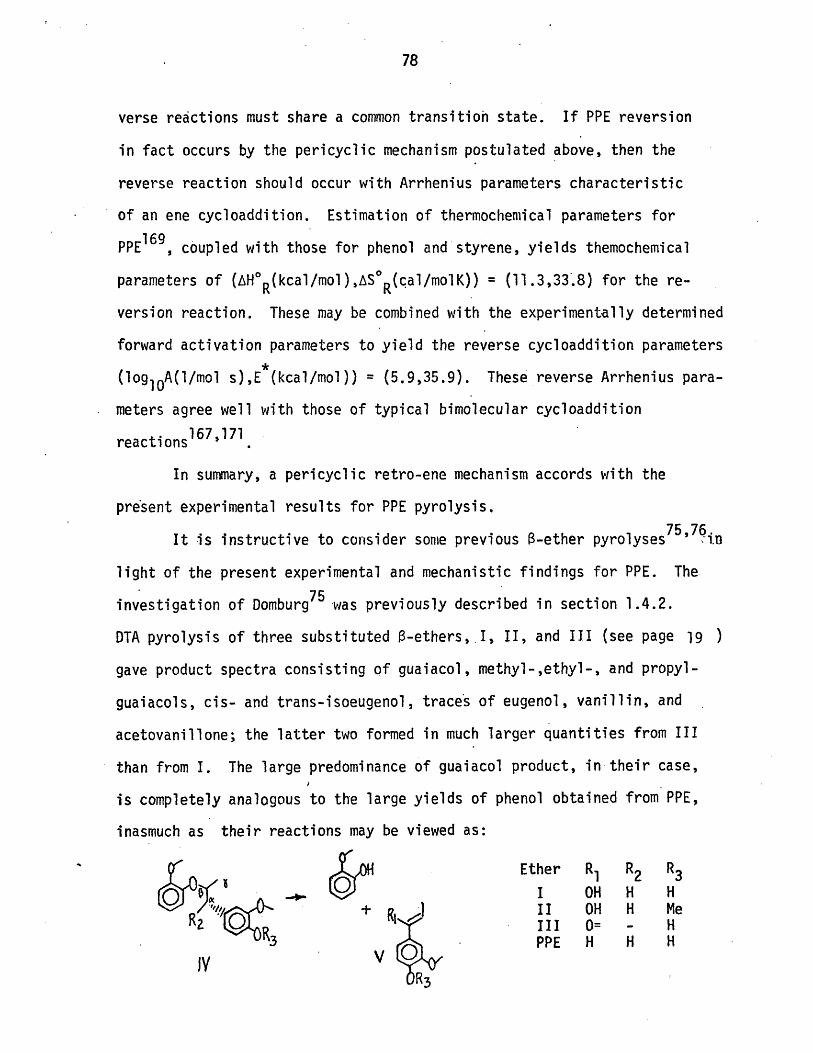
verse reactions must share a common transition state. If PPE reversion
in fact occurs by the pericyclic mechanism postulated above, then the
reverse reaction should occur with Arrhenius parameters characteristic
of an ene cycloaddition. Estimation of thermochemical parameters for
PPE1 6 9 , coupled with those for phenol and styrene, yields themochemical
parameters of (AHoR(kcal/mol),ASOR(cal/moIK)) = (11.3,33.8) for the re-
version reaction. These may be combined with the experimentally determined
forward activation parameters to yield the reverse cycloaddition parameters
(log 10A(l/mol s),E*(kcal/mol)) = (5.9,35.9). These reverse Arrhenius para-
meters agree well with those of typical bimolecular cycloaddition
reactions1675171
In summary, a pericyclic retro-ene mechanism accords with the
present experimental results for PPE pyrolysis.
75 76It is instructive to consider some previous B-ether pyrolyses 5-in
light of the present experimental and mechanistic findings for PPE. The
investigation of Domburg75 was previously described in section 1.4.2.
DTA pyrolysis of three substituted B-ethers, I, II, and III (see page 19 )
gave product spectra consisting of guaiacol, methyl-,ethyl-, and propyl-
guaiacols, cis- and trans-isoeugenol, traces of eugenol, vanillin, and
acetovanillone; the latter two formed in much larger quantities from III
than from I. The large predominance of guaiacol product, in their case,
is completely analogous to the large yields of phenol obtained from PPE,
inasmuch as their reactions may be viewed as:
H Ether R1 R2 R3A I OH H H
+±R, II OH H MeSefIII O= - H
3 PPE H H H
IV v ORR3
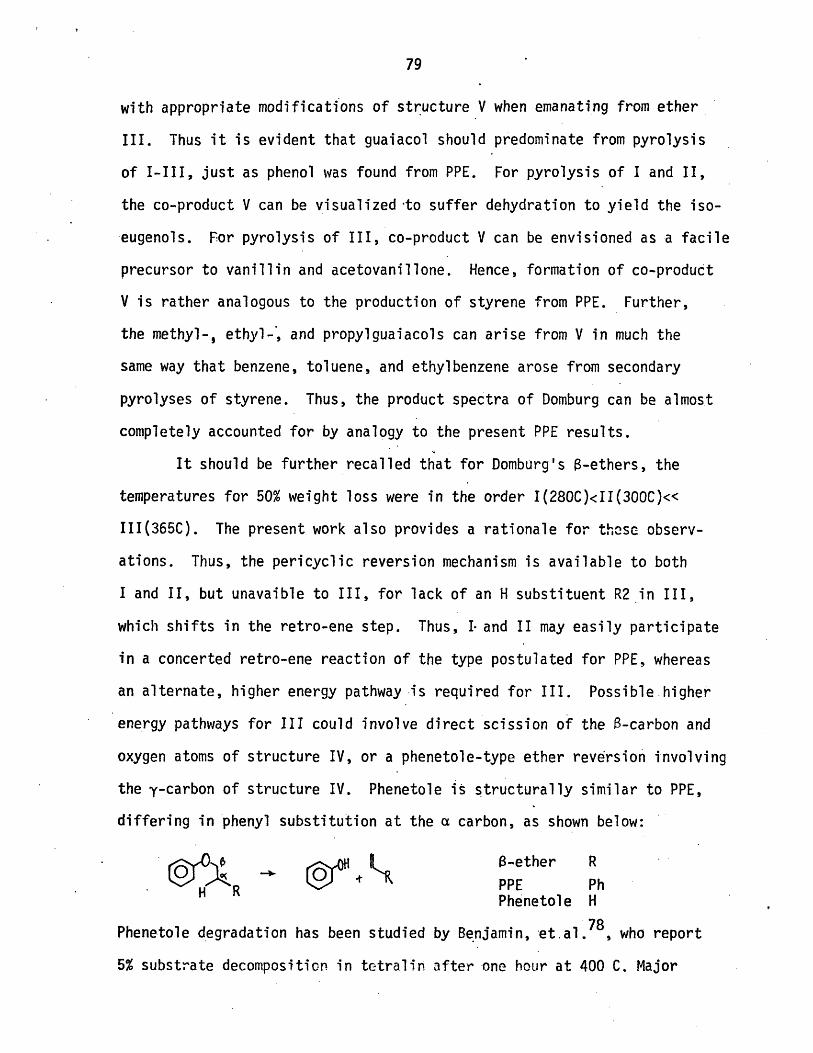
with appropriate modifications of structure V when emanating from ether
III. Thus it is evident that guaiacol should predominate from pyrolysis
of I-III, just as phenol was found from PPE. For pyrolysis of I and II,
the co-product V can be visualized to suffer dehydration to yield the iso-
eugenols. For pyrolysis of III, co-product V can be envisioned as a facile
precursor to vanillin and acetovanillone. Hence, formation of co-product
V is rather analogous to the production of styrene from PPE. Further,
the methyl-, ethyl-, and propylguaiacols can arise from V in much the
same way that benzene, toluene, and ethylbenzene arose from secondary
pyrolyses of styrene. Thus, the product spectra of Domburg can be almost
completely accounted for by analogy to the present PPE results.
It should be further recalled that for Domburg's a-ethers, the
temperatures for 50% weight loss were in the order I(280C)<II(300C)<<
III(365C). The present work also provides a rationale for thCse observ-
ations. Thus, the pericyclic reversion mechanism is available to both
I and II, but unavaible to III, for lack of an H substituent R2 in III,
which shifts in the retro-ene step. Thus, I. and II may easily participate
in a concerted retro-ene reaction of the type postulated for PPE, whereas
an alternate, higher energy pathway is required for III. Possible higher
energy pathways for III could involve direct scission of the B-carbon and
oxygen atoms of structure IV, or a phenetole-type ether reversion involving
the y-carbon of structure IV. Phenetole is structurally similar to PPE,
differing in phenyl substitution at the a carbon, as shown below:
O -ether RR PPE Ph
Phenetole H
Phenetole degradation has been studied by Benjamin, et.al. 78 , who report
5% substrate decomposition in tetralin after one hour at 400 C. Major
pyrolysis products included phenol, ethane, and ethylene. This conversion
corresponds to an apparent first order rate constant of og10k(s) =-4.85,
which is over an order of magnitude lower than that for PPE at the same
temperature. The a-phenyl substituent evidently enhances ether reversion
considerably. The data of Savinykh 76 described earlier in section 1.4.2,
also show that phenyl substitution enhances the pyrolysis of B-ethers.
1.10.2 Simulation of Lignin Pyrolysis
Discussion will begin with consideration of those literature cita-
tions which allow comparison with results of the present simulation. Over-
all yields of gas, liquid, phenolic and carbonaceous residue product frac-
tions quoted in section 1.9 will be compared both with the literature
yields and theoretical maximum limits. Individual product yields will
also be discussed.
The matrix in Table 10.2.1 depic.s items predicted by the present
simulation which can be compared with previous literature. In the rows
of this matrix, four major product fractions have been delineated in terms
of overall and constituent component yields; the carbonaceous residue
fraction subheading labled 'kinetics' concerns the time dependency of over-
all lignin pyrolysis. The matrix has six cdlumns, representing our model
predictions and five sets of literature references. The latter include
the collected reports of Table 4.1, the data of Iatridis and Gavalas26, of
Kirshbaum41, of Domburg39, and the DTA/DTG data of Domburg and Sergeeva Z9
In each matrix element, a plus indicates that information relevant to that
row was reported, whereas an 'X' implies that it was not. The present sim-
ulation provides entries for each row save CO2 yield. The overall gas
fraction is the sum of CO and CH4; these are by far the prevalent constit-
uents of the lignin off-gas. The aqueous distillate was composed of water
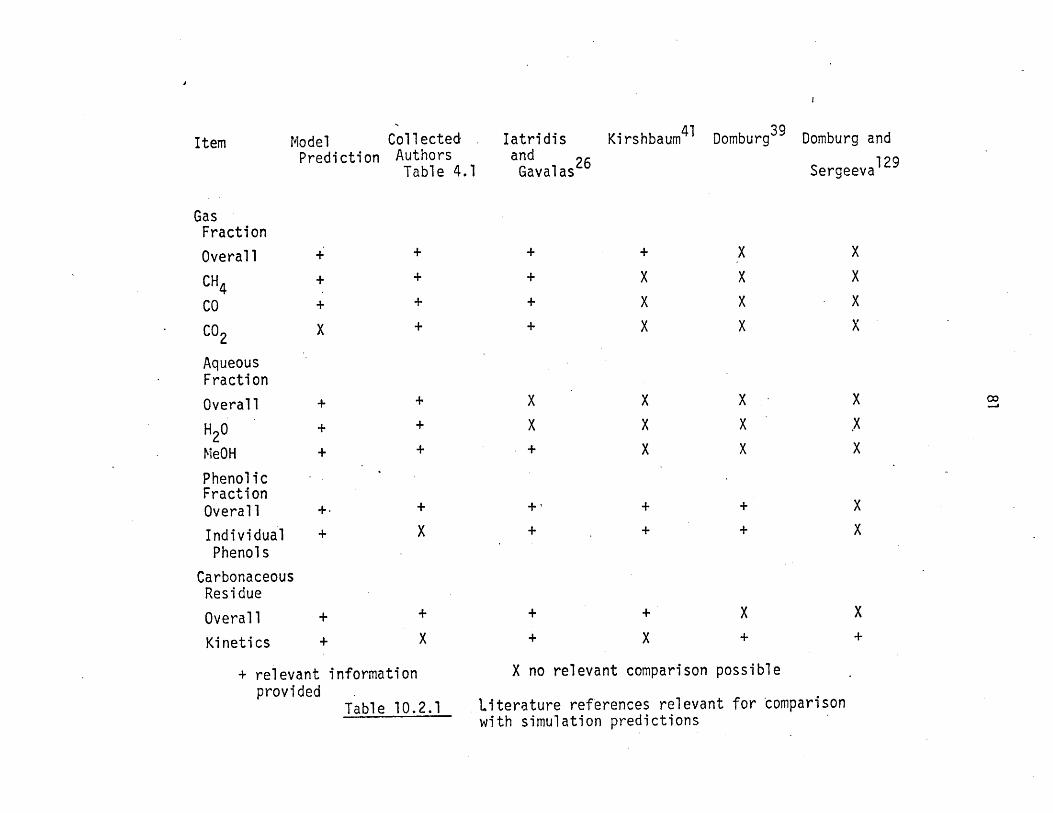
Item
GasFraction
Overall
CH4
CO
CO2
AqueousFraction
Overall
H20
MeOH
ModelPrediction
X
CollectedAuthorsTable 4.1
latridisandGavalas2
Kirshbaum4 1
Domburg3
Domburg and
Sergeeva129
PhenolicFractionOverall
IndividualPhenolls
CarbonaceousResidue
Overall
Kinetics
+ relevant informationprovided
Table 10.2.1
X no relevant comparison possible
Literature references relevant for comparisonwith simulation predictions
and methanol only; acetone, acetic acid and other minor liquid products
were not included in the simulation. The phenolic fraction was the molar
sum of all single ring phenols; this overall yield should correspond best
to the overall tar yield reported in pyrolysis experiments. Finally, the
carbonaceous residue fraction is composed of all multiple ring aromatic
units. The investigations collected in Table 4.1 provide detailed accounts
of gas and aqueous distillate yields, and overall tar and char yields.
Because detailed temperature-time information is lacking for many of these
investigations, entries in this column are best considered the asymptotic
,'ultimate', yields of destructive distillations. The data of latridis
and Gavalas 26 were obtained in a reactor designed to emphasize primary re-
actions, providing detailed temperature-time information and entries for
all save overall aqueous distillate yields and water yields. Kirshbaum41
provided overall gas, phenolics, and carbonaceous residue yields; detailed
phenolic product spectra were provided also. Detailed descriptions of
phenolic product spectra were also given by Domburg39. Finally, Domburg
and Sergeeval29 provide DTA/DTG weight loss information for lignin decomp-
osition.
A numerical summary of the product yields predicted by the simula-
tion and reported in the literature is presented as Table 10.2.2, a matrix
completely analogous to that in Table 10.2.1. The discussion to follow
considers each row of Table 10.2.2; note that all yields are in weight
percent of original lignin substrate.
Gas Fraction
The simulated overall gas fraction rose steadily with increasing
time and temperature and achieved a value of about 15% at 600 C. This
compares favorably with the data of Table 4.1, where gas yields ranged
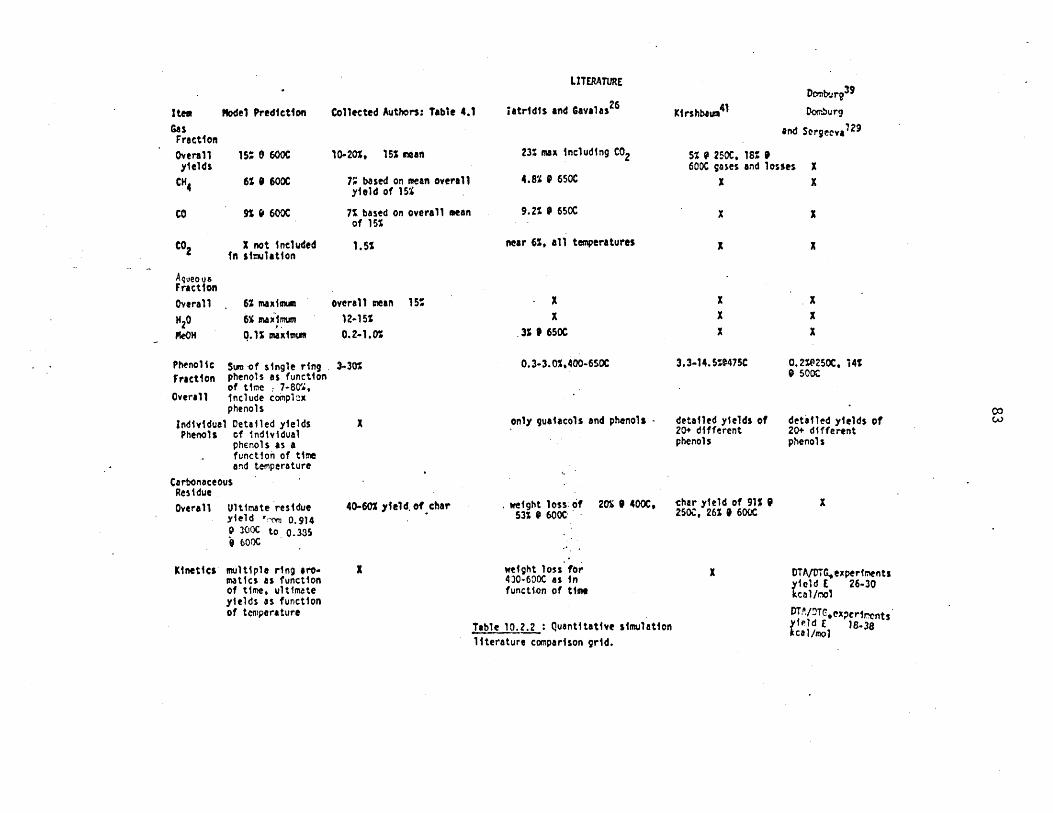
Item Model Prediction
GasFraction
Overallyields
CH4
5: 0 600C
6% 9 600C
X not includedin simulation
Collected Authors: Table 4.1
10-20%, 155 mean
7; based on mean overallyield of 15%
7% based on overall meanof 15%
1.5%
AqueousFraction
Overall 6% maximum overall mean 15%
6% maximum 12-15%
LITERATURE
latridis and Gavalas 26
23% max including CO2
4.8% 0 650C
Kirshbaum41
Do murg
and Sergeeva-29
5% @ 250C, 18% 9600C gases and losses
X
9.2% 9 650C
near 6%, all temperatures
X
0.1% maximum 0.2-1.0%
Phenolic SunI of single ring .Fraction phenols as function
of time : 7-8,Overall include complex
phenols
Individual Detailed yieldsPhenols of Individual
phenols as afunction of timeand temperature
CarbonaceousResidue
Overall Ultimate residueyield ?om 0.914O 300C to 0.335bsooc
Kinetics multiple ring aro-matics as functionof time, ultimateyields as functionof temperature
3-30% 0.3-3.0%,400-650C
only guaiacols and phenols -
40-60% yield. of char weight loss of53% @ 600C'
3.3-14. 5:475C
detailed yields of20+ differentphenols
0.2%0250C, 14t@ 500C
detailed yields of20+ differentphenols
20% 9 400C, char yield of 91% 9250C, 26% 0 600C
weight loss for430-600C as infunction of time
Table 10.2.2 : Quantitative simulation
literature comparison grid.
DTA/tGeperimentsoleld E 26-30
cal/mrl
DTA/DTG.exper1rentsleld E 18-38cal/mol
H20OAeOH .3% 9 650C
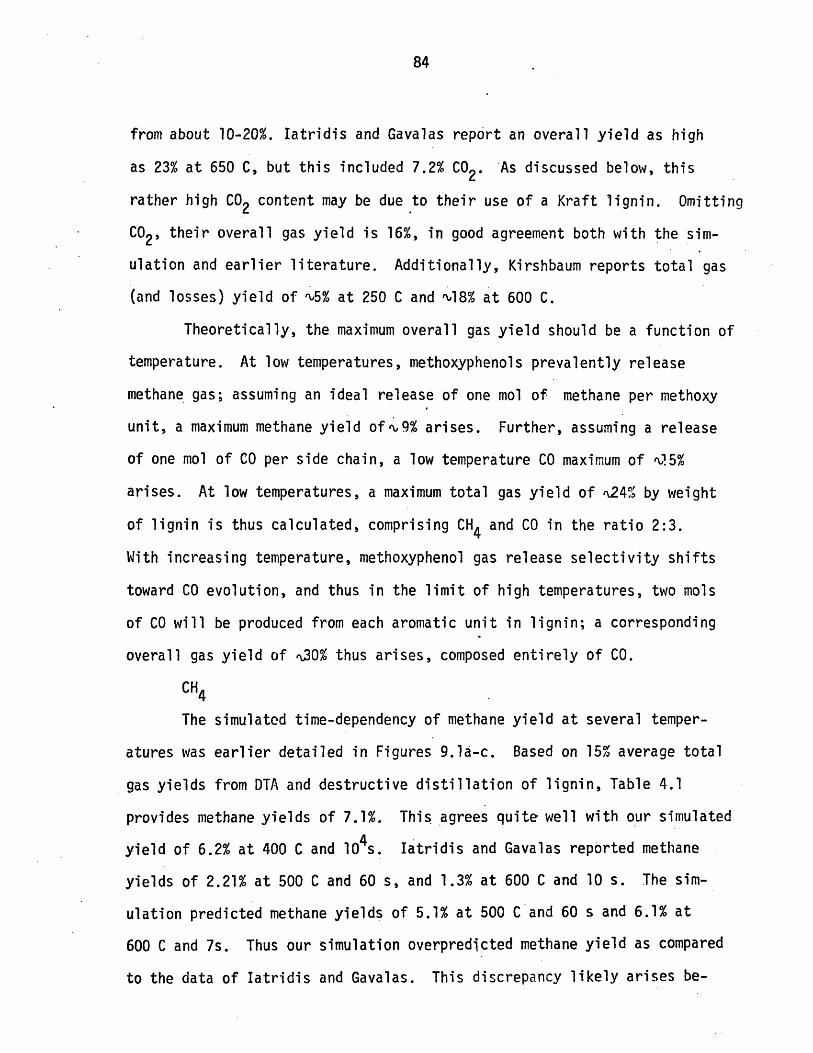
from about 10-20%. latridis and Gavalas report an overall yield as high
as 23% at 650 C, but this included 7.2% C02. As discussed below, this
rather high CO2 content may be due to their use of a Kraft lignin. Omitting
CO2, their overall gas yield is 16%, in good agreement both with the sim-
ulation and earlier literature. Additionally, Kirshbaum reports total gas
(and losses) yield of n,5% at 250 C and 18% at 600 C.
Theoretically, the maximum overall gas yield should be a function of
temperature. At low temperatures, methoxyphenols prevalently release
methane gas; assuming an ideal release of one mol of methane per methoxy
unit, a maximum methane yield of,9% arises. Further, assuming a release
of one mol of CO per side chain, a low temperature CO maximum of q?5%
arises. At low temperatures, a maximum total gas yield of '24% by weight
of lignin is thus calculated, comprising CH4 and CO in the ratio 2:3.
With increasing temperature, methoxyphenol gas release selectivity shifts
toward CO evolution, and thus in the limit of high temperatures, two mols
of CO will be produced from each aromatic unit in lignin; a corresponding
overall gas yield of ,30% thus arises, composed entirely of CO.
CH4
The simulated time-dependency of methane yield at several temper-
atures was earlier detailed in Figures 9.1a-c. Based on 15% average total
gas yields from DTA and destructive distillation of lignin, Table 4.1
provides methane yields of 7.1%. This agrees quite well with our simulated
yield of 6.2% at 400 C and 104s. Iatridis and Gavalas reported methane
yields of 2.21% at 500 C and 60 s, and 1.3% at 600 C and 10 s. The sim-
ulation predicted methane yields of 5.1% at 500 C and 60 s and 6.1% at
600 C and 7s. Thus our simulation overpredicted methane yield as compared
to the data of latridis and Gavalas. This discrepancy likely arises be-
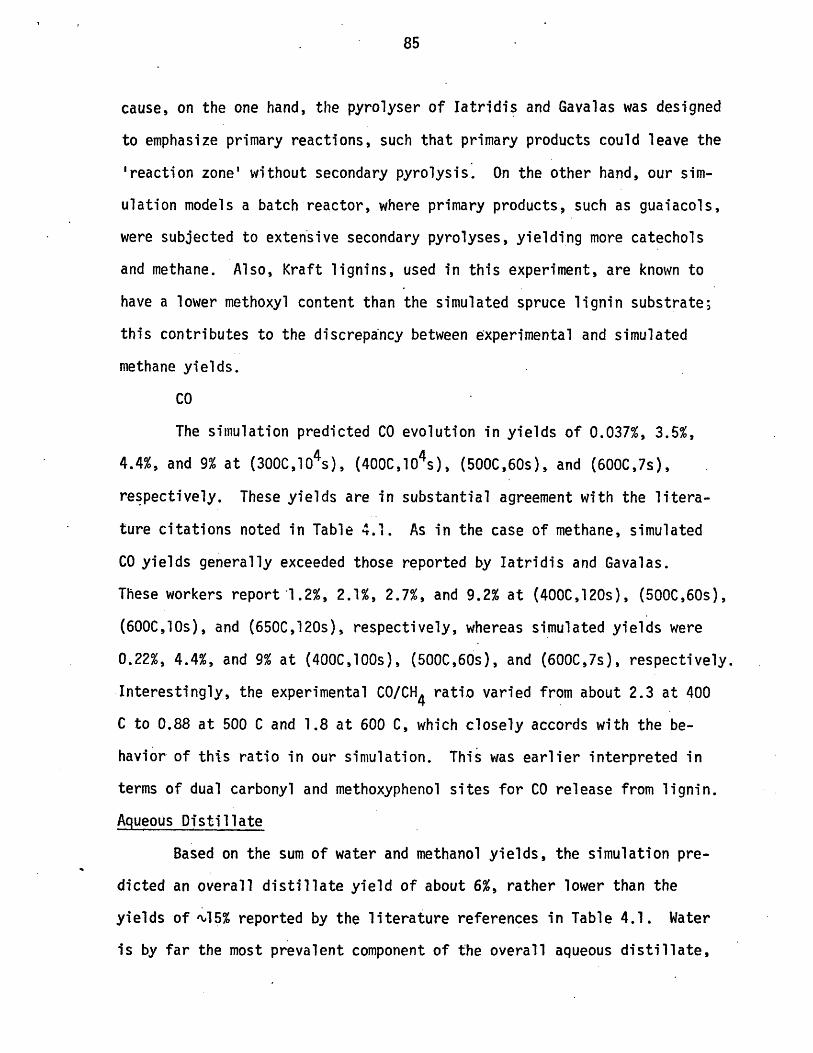
cause, on the one hand, the pyrolyser of latridis and Gavalas was designed
to emphasize primary reactions, such that primary products could leave the
'reaction zone' without secondary pyrolysis. On the other hand, our sim-
ulation models a batch reactor, where primary products, such as guaiacols,
were subjected to extensive secondary pyrolyses, yielding more catechols
and methane. Also, Kraft lignins, used in this experiment, are known to
have a lower methoxyl content than the simulated spruce lignin substrate;
this contributes to the discrepancy between experimental and simulated
methane yields.
CO
The simulation predicted CO evolution in yields of 0.037%, 3.5%,
4.4%, and 9% at (300C,104s), (400C,104s), (500C,60s), and (600C,7s),
respectively. These yields are in substantial agreement with the litera-
ture citations noted in Table 4.1. As in the case of methane, simulated
CO yields generally exceeded those reported by Iatridis and Gavalas.
These workers report 1l.2%, 2.1%, 2.7%, and 9.2% at (400C,120s), (500C,60s),
(600C,10s), and (650C,120s), respectively, whereas simulated yields were
0.22%, 4.4%, and 9% at (400C,100s), (500C,60s), and (600C,7s), respectively.
Interestingly, the experimental CO/CH4 ratio varied from about 2.3 at 400
C to 0.88 at 500 C and 1.8 at 600 C, which closely accords with the be-
havior of this ratio in our simulation. This was earlier interpreted in
terms of dual carbonyl and methoxyphenol sites for CO release from lignin.
Aqueous Distillate
Based on the sum of water and methanol yields, the simulation pre-
dicted an overall distillate yield of about 6%, rather lower than the
yields of '15% reported by the literature references in Table 4.1. Water
is by far the most prevalent component of the overall aqueous distillate,
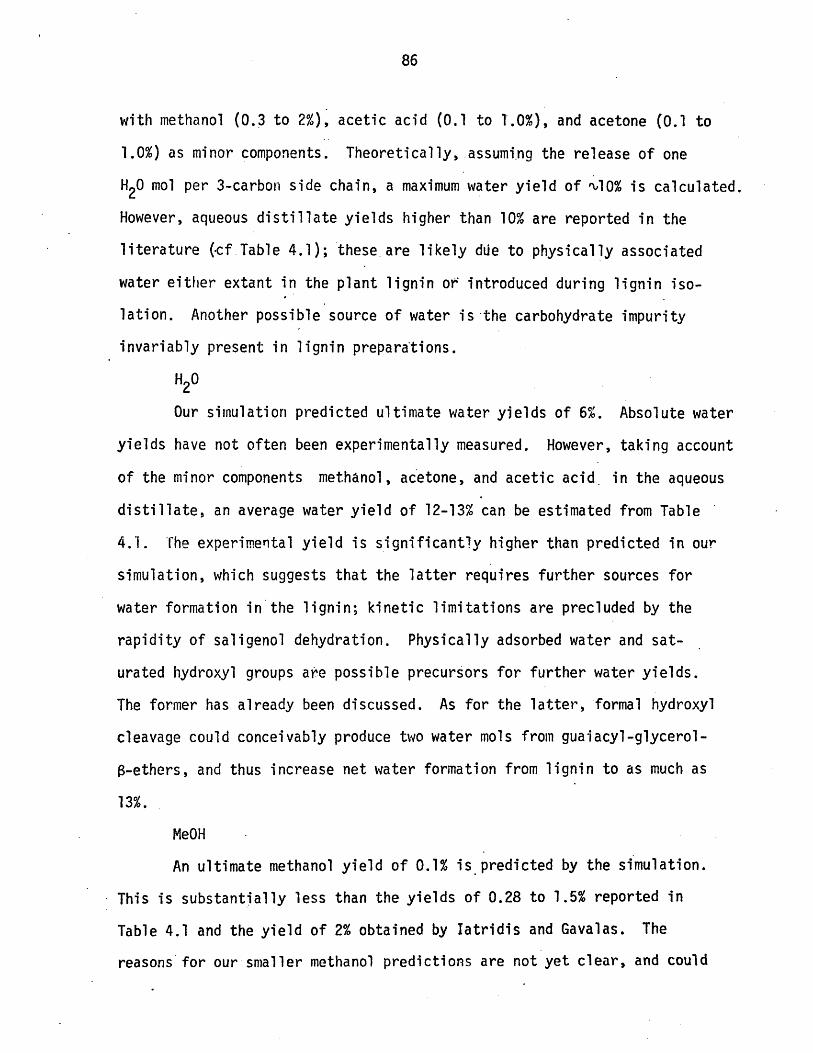
with methanol (0.3 to 2%), acetic acid (0.1 to 1.0%), and acetone (0.1 to
1.0%) as minor components. Theoretically,.assumi.ng the release of one
H20 mol per 3-carbon side chain, a maximum water yield of "10% is calculated.
However, aqueous distillate yields higher than 10% are reported in the
literature (.cf Table 4.1); these are likely due to physically associated
water either extant in the plant lignin or introduced during lignin iso-
lation. Another possible source of water is the carbohydrate impurity
invariably present in lignin preparations.
H20
Our simulation predicted ultimate water yields of 6%. Absolute water
yields have not often been experimentally measured. However, taking account
of the minor components methanol, acetone, and acetic acid in the aqueous
distillate, an average water yield of 12-13% can be estimated from Table
4.1. The experimental yield is significantly higher than predicted in our
simulation, which suggests that the latter requires further sources for
water formation in the lignin; kinetic limitations are precluded by the
rapidity of saligenol dehydration. Physically adsorbed water and sat-
urated hydroxyl groups are possible precursors for further water yields.
The former has already been discussed. As for the latter, formal hydroxyl
cleavage could conceivably produce two water mols from guaiacyl-glycerol-
B-ethers, and thus increase net water formation from lignin to as much as
13%.
MeOH
An ultimate methanol yield of 0.1% is predicted by the simulation.
This is substantially less than the yields of 0.28 to 1.5% reported in
Table 4.1 and the yield of 2% obtained by latridis and Gavalas. The
reasons for our smaller methanol predictions are not yet clear, and could
involve both kinetic limitations and alternative lignin pathways. With
regard to the former, the simulated pathway to methanol was through deg-
radation of cinnamyl alcohol side chains. This reaction was subject to
considerable experimental uncertainty and a greater rate constant would
increase the predicted selectivity to methanol. Alternative methanol
forming pathways, not delineated in the present model compound pyrolyses,
may well operate in whole-lignin pyrolysis. This is an area for further
experimental investigation. However the experimental results obtained here
and reported in the literature91'96 do indicate that methanol formation
from methoxyphenols, the obvious moieties for demethoxylation, is not
significant.
Phenolic Fraction
The predicted overall yield of single ring phenols ranged from 7-
80%. These represent lignin aromatic units that were transformed into sin-
gle ring aromatics during simulated pyrolysis. Included in this single
ring phenol yield are substantial amounts of complex phenols, such as
coniferaldehyde and guaiacyl vinyl ketone (or guaiacyl acrolein), which
are not often reported with single ring phenols in experimental pyrolyses.
Experimental overall phenolic fraction yields were 3 to 30% for Kirshbaum,
and 0.2 to 14% for Domburg. These were lower than the simulation for two
likely reasons. First, many complex phenols in the tar fraction were not
experimentally identified. It is cogent to note that tar yields in excess
of 50% have been reported71. Second, the simulation suppressed bimolecular
condensation and polymerization reactions which would have lowered the
yield of single ring phenols.
Individual Phenols
As noted earlier, the present simulation predicts most of the
thirty-odd phenols detected in the previous.experimental pyrolyses. The
accuracy of these individual phenol yield simulations is uncertain, on
account of the wide range of lignin types, isolation methods, and reactor
configurations employed in experimental studies. These provide a rather
generous band for comparison with model predictions. In most cases the
predicted and experimental yield data agreed to within a half-order of
magnitude. Larger deviations, such as those related to guaiacol, catechol
and syringol, could be reasonably explained by inherent differences be-
tween simulated and experimental conditions. In particular, it is note-
worthy that deviations between the present simulation and experiment were
no greater than deviations between individual experiments.
Carbonaceous Residue
The simulated carbonaceous residue yields of 91% at 300 C and 104s
and 40% at 600 C and 7s compare favorably with the literature. In Table
4.1, ultimate tar yields from destructive distillation were 40 to 60% of
lignin. Iatridis and Gavalas report weight losses of 20% and 53% at 400
and 600 C, respectively, corresponding to char yields of 80% and 47%.
Kirshbaum reports a char yield of 91% at 250 C and only 26% at 600 C. In
short, the present operational definition of residue as multiple ring
aromatics provides simulated carbonaceous residue yields that are in good
accord with the experimental literature.
Weight Loss Kinetics
The residue-forming kinetics implied by the time.variation of the
simulated yield of multiple ring aromatic units have earlier been compared
in Figure 9.2 with the data of latridis and Gavalas. The simulated weight
loss curves accorded well with the experimental weight loss curves, with
modest deviations at the lowest and highest temperatures. Furthermore,
these deviations can reasonably be attributed to differences between the
respective lignin substrates. latridis and Gavalas used a Douglas fir
precipitated Kraft lignin, whereas the present simulation was based on
Freudenberg's unperturbed "protolignin". Kraft pulping can alter the
chemical nature of lignin substantially. It results in increased internal
condensations, with the original reactive a- and s-ether linkages trans-
formed into less reactive diphenyl-methane, ethane, and ethylene linkages;
it also introduces carboxylic acid units into the lignin macromolecule.
The low temperature reactivity of a Kraft lignin might be expected to be
greater than its protolignin counterpart because of facile CO2 evolution
from the carboxylic acid units. At higher temperatures and conversions,
however, the reactivity of a Kraft lignin may well be lower than that of
the. protolignin since relatively refractory diphenylmethane, ethane and
ethylene units have replaced the original reactive a- and S-ethers. In the
light of these assertions it is interesting that latridis and Gavalas
report CO2 yields of 5.9% at 400 C and 120s, and 4.1% at 600c and 10s.
These suggest a constant number of easily decarboxylated acid sites in
their substrate. Further, these authors' reported weight loss of 20% at
400 C and 120s exceeds our simulated weight loss of 13% by an amount sub-
stantially equal to their CO2 yield. At 600 C and 10s the experimental
weight loss corrected for CO2 is n50%, somewhat lower than our simulated
value of 60% on account of the reduced reactivity of their Kraft lignin.
1.11 Summary and Conclusions
1. Theoretical analysis of Freudenberg's classical spruce lignin
structure permitted the selection of model chemical compounds that would
mimic the reactivity of lignin during its thermal degradation. Some of
the model compounds chosen, and their attributes relevant to lignoid
moieties, were: Phenethylphenylether (PPE) CT~' , for the prevalent
3-ether linkage: Guaiacol, (@ , for the aromatic methoxyphenol unit:
Cinnamaldehyde @.0 and Cinnamyl alcohol [ th , for the
propanoid side chain and saligenol, W H , for the hydroxy enol that
might form in lignin following B-ether reversion.
2. Experimental pyrolyses of each of 20 model compounds were under-
taken to determine hitherto unknown reaction pathways, kinetics, and act-
ivation parameters. The products from these 'model pyrolyses were closely
naloous to those observed in actual lignin thermolysis, including
methane (from guaiacol), carbon monoxide (from cinnamaldehyde), water (from
saligenol), methanol (from cinnamyl alcohol), and phenol (from PPE).
3. Mechanistic interpretations of pyrolysis pathways were possible in
at least five instances. For example, PPE reverted stoichiometrically to
phenol plus styrene as primary products; at 400 C the reaction was first
order in PPE over a twentyfold range of initial concentrations and un-
affected by tetralin dilution; at temperatures from 300 to 500 C, the
rate constant followed an Arrhenius relationship, with (log10A(s 1 ),E
(cal/mol)) = (11.0±0.9,45.0+2.7). These experimental data were well ration-
alized by a concerted, pericyclic retro-ene reaction mechanism. Similarly,
methane elimination from guaiacol, (loglOA,E )=(10.9,43.7), and water
elimination from saligenol, (13.4,33.4), could both be well interpreted as
concerted, pericyclic group transfers.
4. It appears that the molecular topology of lignin is well suited to.
the occurence of concerted pericyclic reactions, which have not hitherto
been mentioned in the lignin pyrolysis literature. Likely examples of
pericyclic pathways found in the present experiments included:
(i) Retroene reversion of Phenethylphenylether.
(ii) Group transfer demethanation of guaiacols and group transfer
dehydration of saligenol.
(iii) Sigmatropic methyl shifts in anisole and veratrole to o-cresol,
the latter with subsequent retroene release of CO and H2 . An
analogous hydrogen shift for guaiacol demethoxylation is likely.
(iv) Cheletropic extrusion of CO from benzaldehyde, vanillin, and
cinnamaldehyde, with calculated reverse carbonylation Arrhenius
parameters consistent with those of concerted cycloadditions.
(v) Diels-Alder cycloaddition reactions for cinnamaldelyde and
cinnamyl alcohol side chain units, of the type reported in the
literature for styrene and acrolein.
5. Mathematical simulation of whole-lignin pyrolyses, at 300 to 600 C
with holding times of 1 to 104 s,was achieved by combining a statistical
interpretation of lignin structure with experimental results of the present
model compound pyrolyses. The outcome of these simulations, expressed in
terms of product fractions as a percent of initial lignin, was:
(i) Gas Fraction: Simulated overall gas, methane, and CO yields
accorded with previous experimental lignin pyrolyses; respective ultimate
yields typically 15%, 6%, and 9% were in quantitative agreement with the
literature of Table 4.1. The simulated variation of (CH4/CO) ratio with
time and temperature further agreed with that recently reported by latridis.
and Gavalas26
(ii) Aqueous Fraction: Simulated water yields were typically about
half the reported experimental yields of 12%. Simulated methanol yields
were half an order of magnitude lower than the literature yields of 0.3-
1.5 %.
(iii) Phenolic Fraction: Simulated overall phenolic yields were
generally higher than the literature yields by a factor of two. The sim-
ulation accounted for more than thirty individual phenols reported in the
literature. Simulated yields of simple guaiacols, catechols, syringols,
and phenols, each nominally 2%, were within the band of values reported
in the literature.
(iv) Carbonaceous Residue: Simulated curves of weight loss versus
time at 400, 500, and 600 C were nearly coincident with the experimental
curves due to latridis and Gavalas26 for pyrolysis of a Kraft lignin. Also,
the modest disagreements between these curves, at both low and high
temperatures, were traced to structural differences between the respective
lignin substrates.
93
1.12.0 References
2. Energy Alternatives: A Comparative Analysis, Report preparedby Science and Public Policy Program a.t the University ofOklahoma, Stock i041-001-00025-4, U. S. Gov't Printing Office,Wash., D.C. (1975)
4. Freudenberg, K.; Neish, A. C., Constitution and Biosynthesisof Lignin, Springer-Verlag, New York (1968)
5. Harkin, J. M., in Battersby and Taylor, Oxidative Couplingof Phenols, Marcel-Dekker (1967)
19. Wenzyl, H.F.J., The Chemical Technology of Wood,AcademicPress, New York(1970)
23. Heuser, E. 1 Skioldebrand, C., Z. angew. Chem., I, 32, 41 (1919)
24a. Klason, P; Haindenstam, G.v.; Norlin, E., Z. angew Chem.,22, 1205 (1909)
b. Klason, P; Haindenstam, G.v.; Norlin, E., Z. angew Chem,23, 1522 (1910)
c. Klason, P; Haindenstam, G.v.; Norlin, E., ArkivKemi.Mineral, Geol., 3 no. 1 (1907)
d. Klason, P.; Haindenstam, G.v.; Norlin, E., ArkivKemi.SMineral. Geol., 3 no. 10 (1908)
25. Gladkova, N. Ya.; Sokolova, N. A.,; Levin, E. D., Khim. Ispol'zLignina, 434 (1974)
26. Iatridis, B. and Gavalas, G. R., Ind. Eng. Chem. Prod. Res.Dev., 18(2), 127 (1979)
27. Mikulich, S. M.; Mikulich, A. S., Svoistva Strukt. Gazov, Zhidk,Tverd. Tel, 52-65 (1975)
29. Goheen and Henderson in Allan, G. G.; Matilla, T., op. cit. 30
30. Allan, G. G.; Mattila, T., in Sarkanen, K. V. and Ludwig, C. H.,Lignins Occurrence, Formation, Structure and Reactions,Wiley Interscience, New York (1971)
31. Szelenyi, G., Gomory, A., Brennstoff-Chem. 9, 72 (1928)
32. Heuser, E.; Brotz, A., Papier-Fabrik., 23, Fest-und Ausland-Heft, 69 (1925)
34. Phillips, M., J. Am. Chem. Soc., 51,-2420 (1929)
Eng. Chem., 30, 1174 (1938)
38. Domburg, G. E.; et al., Khim, Drev. no. 5, 64 (1976)
39. Domburg, E. E., et al. Thermal Analysis of Lignin in ThermalAnalysis Vol. 3 Proc. 3rd ICTA Davos (1971) pp 327-40Burkhaeuser, Basel 1972
40. Panasyuk, L. V.; Travleeva, L. V,; Panasyuk, V. G., Khim.Drev. 1:301 (1968)
41. Kirshbaum, I. Z.; Domburg, G.Drev. no. 4, 96 (1976)
E., Sergeeva, V. N. Khim.
42. Kirshbaum, I. Z.; Do;nburg, G. E., Izv. Akad. NaukLatv.no. 2, 43 (1970)
43. Vorher, W.; Schweers, W.Polymer Symp) no. 28, 277
H. M., G. Appl. Polymer Sci.(1975)
44. Faix, 0.,; Schweers, W.; Holzforschung 29, no.
(Appl.
6,224 (1975)
48. Gillet, A
49. Panasyuk,11, no. 1
; Urlings, J., Chim & Ind.
V. G.; Maksimenko, N. S.,, 16-17 (1958)
(Paris), 68,
Gidroliz. iL
55 (1952)
esokhim. Prom.
52. Prosinski, S.Gaz. 15, no.
; Czechowski, Z.; Kielczewski, M., Koks. Smola.11, 322 (1970)
53. Hagglund, E., Arkiv. for Kemi, Min. och Geol., 7, 1
54. Phillips, M.; Goss, M. J., Ind. Eng. Chem.,.24, 1436 (1932)
55. Fisher, F., Schrader, H., Ges. Abhandl. Kenntnis Kohle,5, 106 (1922)
56. Tropsch, H., Ges. Abhandl. Kenntnis Kohle, 6, 293 .(1921)
57. Picteti, A.; Gaulis, M., Helv. Chim. Acta, 6, 627 (1923)
58. Fletcher, T. L.; Harris, E. E., Tappi, 35, 536 (1952)
59. Kurth, E. E.; Ervin, H. 0.; Kroll,,R. L., J. Am..Chem. Soc., 58,571 (1955)
60a. Shimaboto, T., et.(1950)
al., J. Japan Forestry Soc., 32, 43, 47, 75
b. Shimaboto, T.; Minami, K.; Kadama,34, 77 (1952)
T., J. Japan Forestry Soc.,
c. Shimaboto,,T.; Minami, K.; Sakai, H., J. Japan Forestry Soc.,33, 12 (1951)
55R
(1918)
35. Bridger, G. L., Ind.
1409, 1605 (1958)61. Panasyuk, V. G., Zhurn. prikl. Khim., 34,
62. Fletcher, T. L.; Harris, E. E., J. Am. Chem. Soc., 69, 3144
(1947)
63. Morozov. E. F., Gidroliz, Lesokhim. Prom. 23, no. 7, 15 (1970)
65. Gracheve, E.(1976)
V.; Levin, E. D. Izv. Vuz. Lesnoi. Zh. 19, no. 2,108
71. Da.iburg, G. E.;7, 51 (1971)
75. Domnburg, G. E.(1974)
76. Savinykh, V. I
Kirshbaums,. I.; Sergeeva, V. N.,
Thermal Analysis, 2 Proc.
et al., Khim. Drev., 5,
Khim. Drev.,
4th ICTA, Budapest
100 (1975)
77. Kislitsyn, A. N., et al., Khim Drev., 9,
78. Benjamin, B.
131 (1971)
M. et al., Fuel, 57, 270 (1978)
79. Kayima, Y., et al., ACS116 (1979)
Div. of Full Chem. preprints, 24 (2),
80. Miller,24 (3),
R. E.. and Stein, S.271 (1979)
E., ACS Div. of Full Chem. proprints,
81. Savinykh, V. I., et al., Khim. Drev., 3, 91
82. Ingold, K. V. and Lossing, F. P., Can. J. of Chem., 31, 30-41
91. Shaposhnikov, Uy. K.Drev., Ref. Inform.,
and Kosyukova, L.no. 3, 6-9 (1965)
V., Khim. Pererabotka
92. Kravchenko, M. I.; Kiprianov, A. I.; Korotov, S.Leningrad Lesotekh. Akad., 135 (2), 60-4 (1970)
93. Kiprianov, A. I. and KraZaved., Les Zh. 15 (5),
Ya; Nauch. Tr.
vchenko, M. I., Izv. Vyssh. Ucheb.p 121-5 (1972)
94. Kislitsyn, A. N. ; Rodionova, Z. M.; Savinykh,E.I.; Abakhumov, G. A., Sb. Tr., T sent. NauchInst. Lesokhim. Prom., no. 22, p 4-16 (1971)
V. I.; Il- Issled.
95. Friedlin, L. Kh; Balandin, A. A.; Nazarova, N. M.; Izvest.Nauk S.S.S.R., Otdel Khim. Nauk, no. 1, 102-9 (1949)
96.:Obolentsev, R. D., J. Gen. Chem.0
(U.S.S.R.) 16, 1959-70 (1946)
97. Kislitsyn, A. N., et al., Zh. Prikl.384 (1972)
Khim (Lenningrad) 45 (2),
(1976)
(1953)
1 'inn
Prockt.
Akad.
P
98. Smith, R. E. and Hinshelwood, C.A, 175, 131-142 (1940)
N., Proc. Roy. Soc., (London)
99. Domburg,59.(1971
G. E.; Sergeeva, V. N.; Zheibe, G. A.; Khim.)
100. Kislitsyn, A. N.; et.al., Khim. Drev., 9,
Drev., 7
125 (1971)
101. Sprengling, G.-R., J. Am. Chem. Soc., 74, 2937 (1952)
129. Domburg, G. E.; Sergeeva, V. N., J. Thermal, Anal. 1, 53 (1969)
164. Mademov, S. and D. N. Khydyrov, Zhurnal Obshchei1427 (1962)
167. Frey, H. M.,
Khimii, 32 (5),
and Walsh, R., Chem: Rev., 69 103 (1969)
169. Benson, S. W., Thermochemical kinetics, Wiley, New YorkBenson, S. W., et al., Chem. Rev., 69 279 (1969)
(1968)
170. Woodward, R. B. and Hoffmann, R., The Conservation of OrbitalSymmetry, Verlag Chimie, Academic Press, Germany (1971)
171. Mock, W. L. in Pericyclic Reactions Volume II, A. P. Marchandand R. E. Lehr, Editors, Academic Press, New York (1977)
175. Froment, G.and Design,
F. and K. B. Bischoff, Chemical Reactor AnalysisWiley, (1979)
178. Dulong, L., Markromol. Chem., 76,
179. Bjorkman, A, Nature, 174, 1057 (.159, 477 (1956)
119 (1964)
954); Svensk Papperstid,
180. Yu, K. C., S. B. Thesis, MIT, June, 1980
Work reported in this document was sponsored by the Department of Energy.This report was prepared as an account of work sponsored by the UnitedStates Government. Neither the United States nor the United StatesDepartment of Energy, nor any of their employees, makes any warranty,express or implied, or assumes any legal liability or responsibilityfor the accuracy, completeness, or usefulness of any information,apparatus, product or process disclosed or represents that its use wouldnot infringe privately owned rights.