Embed Size (px)
Citation preview

Joona Lahtinen
Thermolysis of plastic waste in bench-scale fluidized-bed reactor
Metropolia University of Applied Sciences
Bachelor of Engineering
Bio- and chemical engineering
Bachelor’s Thesis
29 January 2019
Abstract
Author Title Number of Pages Date
Joona Lahtinen Thermolysis of plastic waste in bench-scale fluidized-bed reac-tor 50 pages + 5 appendices 29 January 2019
Degree Bachelor of Engineering
Degree Programme Bio- and chemical engineering
Professional Major Chemical engineering
Instructors
Muhammad Qureshi, Research Scientist Timo Seuranen, Senior Lecturer
This thesis was commissioned by VTT Oy, which provides research and innovation services for domestic and international customers and partners. The goal of this Bachelor’s thesis was to study the thermolysis process of plastic waste, compile a review around it and exe-cute test runs with a thermolysis reactor. The review was divided in two parts: background section and the thermolysis of plastics section. Background section included the waste man-agement, current methods for managing the waste and the hierarchy around it. Thermolysis of plastics section reviewed more in depth the thermolysis of plastic waste, including the process reactors, factors affecting the product yield and distribution and finally current com-mercial technologies for the thermolysis. Plastic waste originate from multiple sources and have distinct compositions thus waste fractions behave differently in the thermolysis process. The gathered information and data from the test runs was the most significant objective for the project. All of the experiments were performed with a bench-scale (1kg/hr) fluidized-bed pyrolysis reactor. Total of three plastic waste samples were tested plus one with the pure polypropyl-ene as a reference run. Each of the feedstock was tested at three different temperatures. The products were collected as wax, oil, gas and char. The elemental composition of the wax and gas was analyzed in VTT’s laboratories. The results showed that in the thermolysis of plastic waste, the formation of liquid was non-existent and the product was mostly in the form of wax. When the temperature was de-creased, the total product yield rose. Also in lower temperatures, the formation of wax in-creased and the formation of non-condensable gases decreased. The best yield in thermol-ysis was achieved with the packaging plastic waste when the temperature was 575 °C, being almost 92 wt-%. This thesis provides gathered information package around the thermolysis of plastic waste. The literature part reviewed about the waste management and thermolysis of plastic. Exper-imental part presented the observations, challenges and data of the test runs and offers behavior of the thermolysis of plastic waste that can be used for further projects for improve-ments and modeling of the process.
Keywords thermolysis, pyrolysis, plastic waste

Tiivistelmä
Tekijä Otsikko Sivumäärä Aika
Joona Lahtinen Muovijätteen termolyysi ”bench-scale” kokoisella leijupetireaktorilla 50 sivua + 5 liitettä 29.1.2019
Tutkinto insinööri (AMK)
Tutkinto-ohjelma Bio- ja kemiantekniikan tutkinto-ohjelma
Ammatillinen pääaine Kemiantekniikka
Ohjaajat
Tohtori Muhammad Qureshi Lehtori Timo Seuranen
Tämän insinöörityön toimeksiantajana toimi VTT Oy, joka toimii moniteknologisena sovelta-vaa tutkimusta tekevänä tutkimuskeskuksena. Työn tarkoituksena oli tutkia muovijätteen termolyysiä kirjallisuus- sekä kokeelliselta poh-jalta. Kirjallisuusosio koostui kahdesta osasta: taustaa-kappaleesta sekä muovin termolyysi -kappaleesta. Taustaa-kappaleeseen sisältyi katselmus muovijätteen käsittelystä, käsittelyn metodeista ja hierarkiaa muovijätteen ympäriltä. Muovijätteen termolyysi -kappaleessa kä-siteltiin muovijätteen termolyysiä tarkemmin, sisällyttäen reaktorit, tuotteen saannot ja tuo-tejakaumat ja nykyisiä ison mittakaavan kaupallisia teknologioita. Muovien ja muovijätteiden käyttäytyminen vaihtelee termolyysiprosessissa ja jakeet sisältä-vät eri määriä ylimääräisiä materiaaleja, jotka vaikuttavat prosessiin ja tuotejakaumaan. Ke-rätty data ja tieto koeajoista oli merkittävin päämäärä projektin näkökulmasta. Jokainen koe suoritettiin ”bench-scale” kokoisella leijupeti pyrolyysireaktorilla. Kolme raaka-ainetta ja yksi referenssiajo ajettiin, kukin kolmessa eri lämpötilassa. Tuotetta kerättiin va-han, nesteen, kaasun ja tuhkan muodossa. Tuotteen alkuainemäärityksen analysoimiseksi käytettiin kaasukromatografia ja VTT:n laboratorion analyysimenetelmiä. Tulokset osoittavat, että muovin termolyysissä nestettä ei muodostu juurikaan ja päätuote ilmenee vahan muodossa. Kun lämpötilaa laskettiin, kokonaissaanto parani. Myöskin alem-missa prosessilämpötiloissa vahan kokonaissaanto parani ja lauhtumattomien kaasujen määrä väheni. Paras saanto (92 p-%) saavutettiin pakkausmuovinäytteellä, lämpötilan ol-lessa 575 °C. Tämä työ tarjoaa tietopaketin muovijätteen termolyysin ympäriltä. Kirjallisuusosio tarkaste-lee jätteen käsittelyä ja muovin termolyysiä. Kokeellinen osuus esittää havainnot, haasteet ja datan koeajoista ja tarjoaa trendin ja käyttäytymismallin pyrolyysille jota voitaisiin käyttää jatkoprojekteja varten mahdolliseen mallinnukseen ja kehitykseen.
Avainsanat termolyysi, pyrolyysi, muovijäte

Contents
List of Abbrevations
1 Introduction 1
2 Background 3
2.1 Plastic waste management 3
2.1.1 Plastic waste management globally 4
2.1.2 Plastic waste management in Europe 5
2.2 Current methods for managing the waste 6
2.2.1 Primary recycling 7
2.2.2 Mechanical recycling 7
2.2.3 Energy recovery 8
2.2.4 Thermo-chemical recycling 8
2.2.5 Land filling 9
2.3 Waste hierarchy 10
2.3.1 Waste hierarchy of plastics 10
3 Thermolysis of Plastics 11
3.1 Polymers 12
3.2 Thermolysis reactors 13
3.2.1 Fluidized-bed reactor (FBR) 13
3.2.2 Batch reactors 15
3.2.3 Fixed-bed reactors 15
3.2.4 Screw kiln reactor 16
3.3 Product yield 17
3.3.1 Effect of feed composition 17
3.3.2 Effect of the catalyst 18
3.4 Commercial technologies 20
3.4.1 RES Polyflow 20
3.4.2 Agilyx 20
3.4.3 Cynar Plc 20
3.4.4 Golden renewable energy 21
4 Experimental part 22

4.1 Introduction 22
4.2 Unit description 22
4.2.1 Feeding tank 23
4.2.2 Reactor 23
4.2.3 Condensing section 24
4.3 Procedure of the process 25
4.4 Plastic waste feedstock 25
4.5 Compiled results 29
4.6 Test results 30
4.6.1 Polypropylene reference run 31
4.6.2 Plastic Waste Sample 1 33
4.6.3 Plastic Waste Sample 2 35
4.6.4 Plastic Waste Sample 3 38
4.7 Inferences from the experimental work 40
4.8 Challenges of the experiments 42
5 Recommendations 43
5.1 Improvements 43
5.2 Possible applications 44
5.3 Co-feeding in refinery 45
6 Conclusion 46
References 48
Appendices
Appendix 1. Commercial PTF technology suppliers and specs
Appendix 2. Procedure for bench-scale fast-pyrolysis process (KILO, Plastic)
Appendix 3. Pressure changes under the grate in Plastic Waste Sample 1 experiments.
Appendix 4. Pressure changes under the grate in Plastic Waste Sample 2 experiments.
Appendix 5. Pressure changes under the grate in Plastic Waste Sample 3 experiments.
List of Abbreviations
MSW Municipal Solid Waste
PSW Plastic Solid Waste
PP Polypropylene
PE Polyethylene
PS Polystyrene
POs Polyolefins
PVC Polyvinyl chloride
PU Polyurethane
PET Polyethylene terephthalate
FBR Fluidized-bed Reactor
BFB Bubbling Fluidized-bed Reactor
HDPE High-density polypropylene
LDPE Low-density polypropylene
LPG Liquefied Petroleum Gas
FCC Fluid Catalytic Cracking
PTF Plastic to Fuels
ESP Electrostatic Precipitator
GC Gas Chromatograph

C&D Construction and Demolition
SRF Solid Recovered Fuel

1 (50)
1 Introduction
In the modern world, the consumption of plastic is growing rapidly and plastic is needed
more than ever. Every year, plastic is been produced around 400 million tons and the
growth has been accelerating for the last 50 years [1]. As a material, plastic is commonly
used by industries due to its fine qualities and properties: plastic is versatile, does not rot
or rust, is reusable and flexible, moisture resistant, strong, and relatively inexpensive.
Plastic can also be very resistant to chemicals, so it is suitable material for non-breakable
packages for dangerous solvents. Plastic can be used as a heat and electric insulator;
therefore, plastic is used in variety of electronic applications [2; 3]. It can be comfortably
said that plastic is an essential element for humankind.
On the other hand, plastic also contributes to the overall environmental burden: most of
the plastics use crude oil as a raw material which is a non-renewable resource. Around
four percent of world’s oil and gas production is used as a raw material of manufacturing
plastic [4]. Also, the globe is overburdened by plastic as a form of waste. Of all plastics
that are made globally, around nine percent is recycled, and the rest is disposed of in
landfills, eventually leaching to the ocean at some point [5]. Plastics are made of hydro-
carbon chains, but they often contain many additives such as antioxidants, colorants and
other stabilizers. These additives damage the environment when not disposed properly
[6]. The processing of plastic waste has been a topical subject for the last decades. While
plastic is recyclable, recycling of all plastics is a challenging task with the current tech-
nology. Only 15–20% of all plastic waste can be recycled efficiently with conventional
mechanical technologies [7]. In order for plastic to be recycled efficiently and economi-
cally, the waste should be as homogeneous as possible, meaning that it should be as
free as possible of any extraneous materials such as soil, dirt, aluminium foils, paper
labels and food remnants.
One potential solution for the processing of plastic waste could be pyrolysis (also referred
as thermolysis), where plastic waste is processed and formed into pyrolysis oil, which
could be further refined into liquid fuels and other chemicals. The basic principle of ther-
molysis is that the feedstock is fed to a reactor and heated in oxygen free environment.
Raw material can be any organic material such as wood, sod, plant, plastic, and rubber.
The feedstock is decomposed by heat into smaller molecules and condensed into liquid,
2 (50)
which is also called pyrolysis oil [8]. The objective of this thesis was to learn how plastic
waste as a feedstock behaves when thermally degraded through fast pyrolysis technol-
ogy.
This thesis consists of two parts: the literature part and the experimental part. In the
literature part plastic waste management and current methods for it is examined in Eu-
ropean and global scale, current methods for managing the plastic waste are being ex-
amined and one of the recycling methods, thermolysis of plastic, is being reviewed more
specifically. Below are listed the topics concerned in the thermolysis of plastic:
• The processes used, for example, a reactor.
• Parameters affecting the yield, for example, temperature, pressure, cata-lyst.
• Commercial technologies, for example, RES Polyflow, Agilyx.
In the experimental part, thermolysis of pure plastic samples and plastic waste was per-
formed. The objective was to carry out a parametric study of the operating conditions
and their impact on the product composition and yield. The report presents the descrip-
tion of the unit, the experimental procedure (startup, operation and shut down), the de-
tails of the measurements (temperature, feedstock, feed rate), laboratory test results,
inferences and the best conditions for the process, conclusion and recommendations.
This thesis was commissioned by VTT Oy, which provides research and innovation ser-
vices and information in for domestic and international customers and partners
3 (50)
2 Background
One of the properties of the plastics is that they have significantly long life. This makes
waste plastics a huge burden for the environment since. Around 50% of all manufactured
plastics are disposable, single time used applications like packages [9]. Every year, al-
most 5–13 million tons of plastics ends up in to the ocean [10]. Plastic waste manage-
ment is crucial in order to handle growing plastic waste. Many different recycling pro-
cesses and methods have been designed to tackle this problem.
One of the recycling methods that is used is thermolysis of plastics. This is a desired
method due to flexibility of the thermolysis process, which allows the processing of het-
erogeneous feedstock that does not require sorting or washing [7]. Thermolysis of plas-
tics has been studied in many different reactor configurations. For example, fast pyrolysis
is suitable for processes where high heating and heat transfer rates are needed [11].
2.1 Plastic waste management
Plastic waste can be sorted roughly into two categories: industrial waste and municipal
waste. These two groups form different sort of waste and are processed differently [3].
Industrial plastic waste is generated from plastic manufacturing industry and industries
that use them. Typically these plastics have well defined composition which makes this
waste fraction relatively easy to recycle [12]. Most of the plastic waste from municipal
solid waste (MSW) constitute packaging, construction, furniture and household ware,
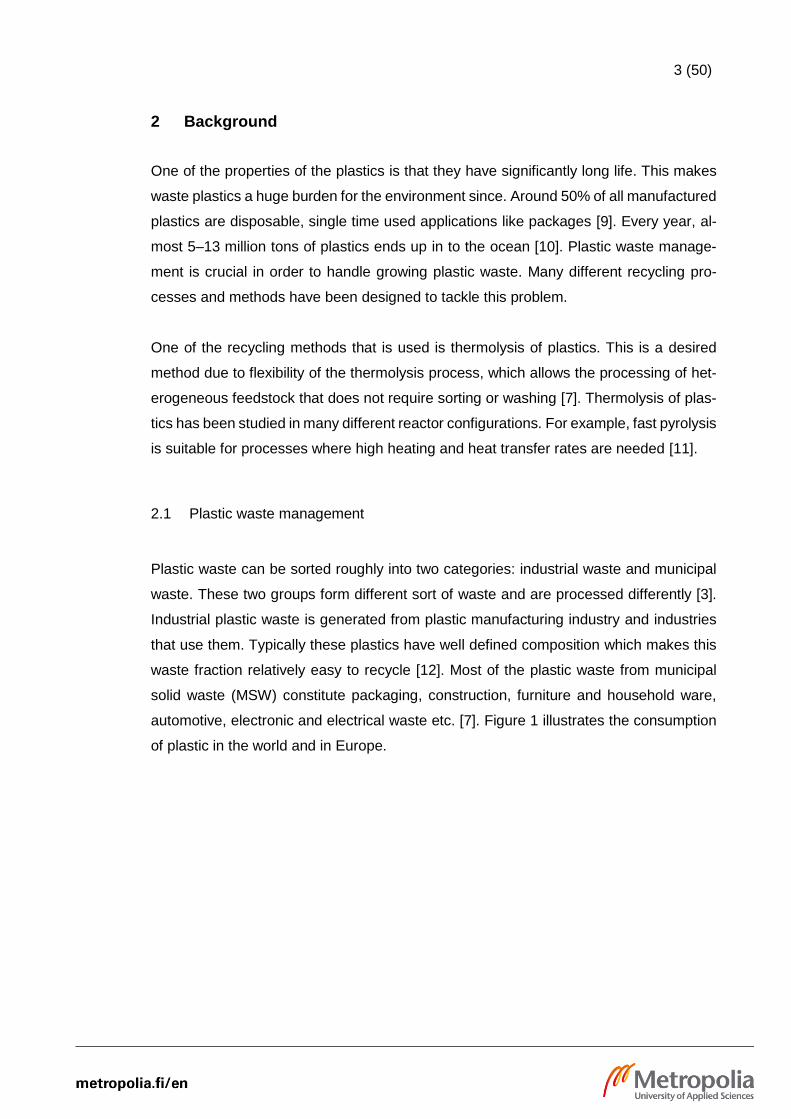
automotive, electronic and electrical waste etc. [7]. Figure 1 illustrates the consumption
of plastic in the world and in Europe.

4 (50)
Figure 1. Plastic production globally and in Europe from 1950 to 2016 [13].
2.1.1 Plastic waste management globally
An estimation shows that 2.5 billion MT of waste was generated from municipal waste
sources in 2010. That is over six-fold increase since 1975. Around 11% of this waste, or
270 million MT, is plastic waste. The production of plastic and the incineration of plastic
increases the CO2 amount globally by approximately 400 million tons. [10.]
Principally, the amount of generated plastic waste can be reduced in two ways: by re-
ducing the amount of mismanaged waste or by reducing waste generation and plastic
use. For example, if 20 top-ranked counties reduced the amount of mismanaged plastic
waste by 50%, the amount of mismanaged plastic waste would reduce by 41% globally
by 2025. On the other hand, if we took only 10 top-ranked counties, the amount would
fall only to 34%. If 75% reduction is desired globally, 85% waste management improve-
ment would be needed in 35 top-ranked counties. [14.]
0
50
100
150
200
250
300
350
400
1945 1955 1965 1975 1985 1995 2005 2015
Mill
ion m
etr
ic tons
Year
Plastic production globally and in Europe from 1950 to 2016
World Europe
5 (50)
2.1.2 Plastic waste management in Europe
Of the world’s total plastic consumption, Europe’s portion is around 19%. In 2016, almost
50 million tons of plastic waste were manufactured in Europe and 27.1 mt of post-con-
sumer plastic waste was collected [15]. Largest manufacturer inside Europe is Germany,
making around 24% of all Europe’s plastic, second is Italy (14%).
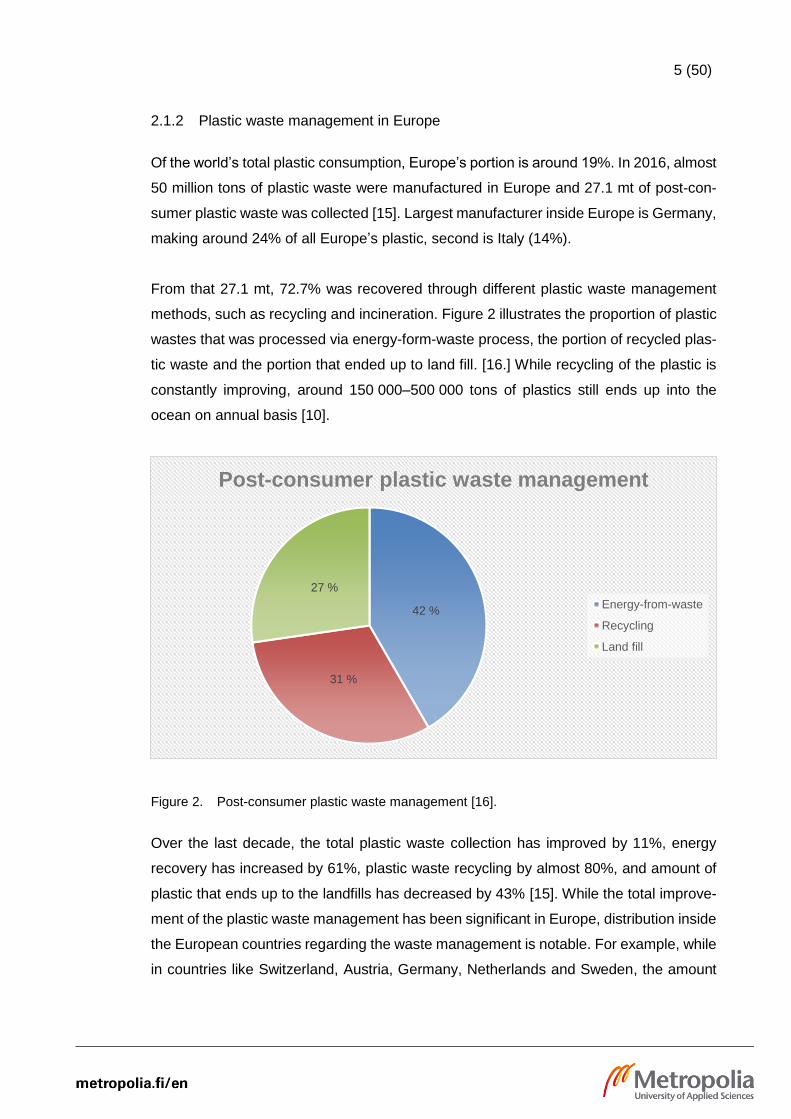
From that 27.1 mt, 72.7% was recovered through different plastic waste management
methods, such as recycling and incineration. Figure 2 illustrates the proportion of plastic
wastes that was processed via energy-form-waste process, the portion of recycled plas-
tic waste and the portion that ended up to land fill. [16.] While recycling of the plastic is
constantly improving, around 150 000–500 000 tons of plastics still ends up into the
ocean on annual basis [10].
Figure 2. Post-consumer plastic waste management [16].
Over the last decade, the total plastic waste collection has improved by 11%, energy
recovery has increased by 61%, plastic waste recycling by almost 80%, and amount of
plastic that ends up to the landfills has decreased by 43% [15]. While the total improve-
ment of the plastic waste management has been significant in Europe, distribution inside
the European countries regarding the waste management is notable. For example, while
in countries like Switzerland, Austria, Germany, Netherlands and Sweden, the amount
42 %
31 %
27 %
Post-consumer plastic waste management
Energy-from-waste
Recycling
Land fill
6 (50)
of plastic waste that ends up in to the landfills is non-existent, some countries like in
Malta, Greece, Cyprus, Bulgaria, the landfill is still the dominant management method.
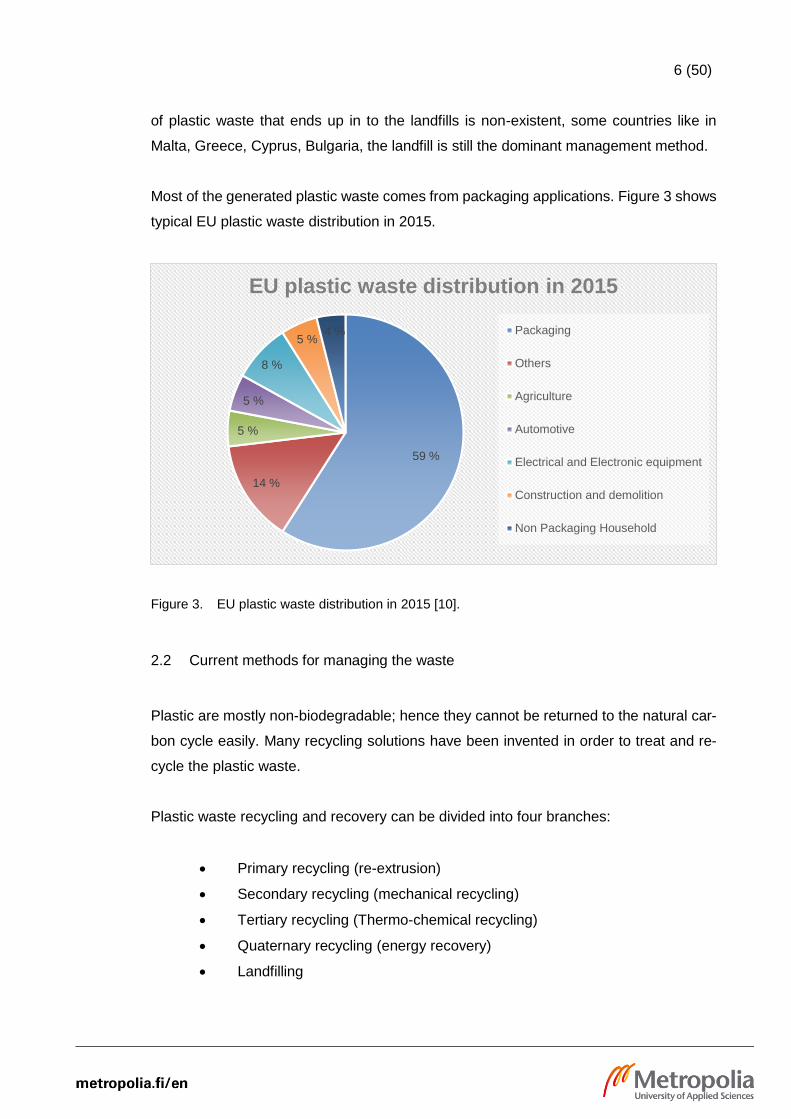
Most of the generated plastic waste comes from packaging applications. Figure 3 shows
typical EU plastic waste distribution in 2015.
Figure 3. EU plastic waste distribution in 2015 [10].
2.2 Current methods for managing the waste
Plastic are mostly non-biodegradable; hence they cannot be returned to the natural car-
bon cycle easily. Many recycling solutions have been invented in order to treat and re-
cycle the plastic waste.
Plastic waste recycling and recovery can be divided into four branches:
• Primary recycling (re-extrusion)
• Secondary recycling (mechanical recycling)
• Tertiary recycling (Thermo-chemical recycling)
• Quaternary recycling (energy recovery)
• Landfilling
59 %
14 %
5 %
5 %
8 %
5 %4 %
EU plastic waste distribution in 2015
Packaging
Others
Agriculture
Automotive
Electrical and Electronic equipment
Construction and demolition
Non Packaging Household

7 (50)
Chemical recycling and thermal recycling often are referred as thermo-chemical recy-
cling. It is a process where either the waste is thermally processed for example via ther-
molysis and reduced back to monomeric level in order to produce other chemicals or
chemically recycled, for example via depolymerization. [3.]
2.2.1 Primary recycling
Primary recycling is a recycling method where plastic solid waste (PSW) is sorted and
re-used in order to produce similar plastic products. This is a desired method since it
saves the environment and non-renewable natural resources. Re-using of plastic pro-
vides many advantages such as: conservation of fossil fuels, reduction of energy and
MSW and reduction of carbon-dioxide, nitrogen-oxides and sulphur-dioxide emissions.
One of the challenges of primary recycling is sorting of plastic waste. Sorting of plastic
bottles is a heavily automated technique but is not always applicable because of the
different shape and size of the bottles. One of the other sorting methods is density sort-
ing. As a method, it does not offer any major solution because many plastics are close
in density. One of the sorting method is called triboelectric separation. Basic principle is
that materials are rubbed to each other in order to create positive and negative charge,
which acts as a separation force in the process. PSW can also be separated and sorted
with acceleration technique. The accelerator delaminates PSW that is shredded and air
classification, sieving and electrostatic techniques are used to sort the material. Due to
this reason, primary recycling is often integrated into production line and is rarely aimed
for recyclers. [17.]
2.2.2 Mechanical recycling
Mechanical recycling or secondary recycling is a method that re-extrudes the plastic to
similar or different products with mechanical means. These include processes such as
separation of polymer types, decontamination, size reduction, re-melting and extrusion
into pellets. [18.] This is considered as a green operation of waste plastic recycling since
it conserves the natural resources. The challenges of the mechanical recycling are that
it reduces the cost efficiency and raises the energy consumption. The waste sorting effi-
ciency is a problem in this recycling process even though many sorting methods have
developed throughout the years. The most common sorting operations are X-ray fluo-
8 (50)
rescence, infrared and near infrared spectroscopy, electrostatics and flotation. The limi-
tation of the mechanical recycling of PSW is that it can be only used for the single poly-
olefin plastics such as PE (Polyethylene), PP (Polypropylene), PS (Polystyrene) etc. One
of the uses of mechanically recycled plastics are as a substitute for wood or concrete.
[3.]
2.2.3 Energy recovery
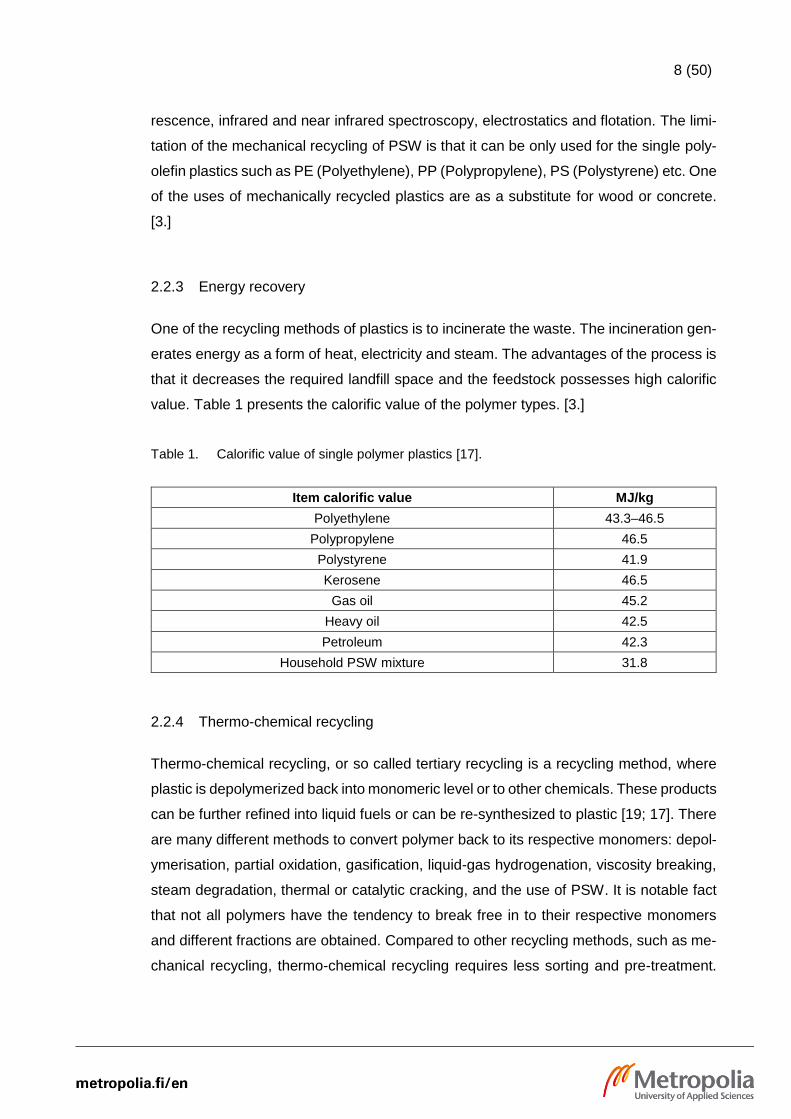
One of the recycling methods of plastics is to incinerate the waste. The incineration gen-
erates energy as a form of heat, electricity and steam. The advantages of the process is
that it decreases the required landfill space and the feedstock possesses high calorific
value. Table 1 presents the calorific value of the polymer types. [3.]
Table 1. Calorific value of single polymer plastics [17].
Item calorific value MJ/kg
Polyethylene 43.3–46.5
Polypropylene 46.5
Polystyrene 41.9
Kerosene 46.5
Gas oil 45.2
Heavy oil 42.5
Petroleum 42.3
Household PSW mixture 31.8
2.2.4 Thermo-chemical recycling
Thermo-chemical recycling, or so called tertiary recycling is a recycling method, where
plastic is depolymerized back into monomeric level or to other chemicals. These products
can be further refined into liquid fuels or can be re-synthesized to plastic [19; 17]. There
are many different methods to convert polymer back to its respective monomers: depol-
ymerisation, partial oxidation, gasification, liquid-gas hydrogenation, viscosity breaking,
steam degradation, thermal or catalytic cracking, and the use of PSW. It is notable fact
that not all polymers have the tendency to break free in to their respective monomers
and different fractions are obtained. Compared to other recycling methods, such as me-
chanical recycling, thermo-chemical recycling requires less sorting and pre-treatment.

9 (50)
The products from thermo-chemical cracking are yielded in a form of wax, liquid, gas and
char. [19.]
Gasification is a method where gas flow is used to gasify the feedstock in order to pro-
duce fuels or combustible gases. The advantage of using air compared to O2 as a gasi-
fication agent is the process is simple and the costs are reduced. [17.]
Partial oxidation is where the plastic is directly combusted and turned into hydrocarbon
products, such as synthesis gas. Although this is potential solution, since plastic has a
high calorific value, the problem is that partial oxidation creates noxious substances such
as NOx, sulfur oxides and dioxins. Wherein thermolysis, the waste is cracked into useful
chemicals and other compounds. [3.] Thermochemical conversion can be achieved by
thermal cracking and catalytic cracking or hydrocracking.
Thermolysis falls under thermo-chemical conversion techniques, where the feedstock is
heated in the absence of oxygen in an inert atmosphere. Thermolysis has many appli-
cations and operational differences that can be utilized, such as reactor type, presence
of catalyst, reaction time, temperature etc. and are in major role when deciding the end
product [2; 19].
2.2.5 Land filling
Land filling is the most used method to manage the accumulating plastic waste. This
method is undesirable since plastic biodegrades poorly and has high volume to weight
ratio. Because of this, according to current legislations, plastic waste to landfill must be
reduced by 35% from 1995 to 2020. Compared to incineration for example, where addi-
tion of disposal of the waste it provides energy, land filling does not offer any other ben-
efit. Therefore, landfilling as a process is being diminished over years and the goal is
that it would be removed from waste hierarchy. [3.]

10 (50)
2.3 Waste hierarchy
Waste hierarchy is the pyramid of desired options to manage waste. The basic principle
of this mindset is presented in Figure 4.
Figure 4. Pyramid of waste hierarchy [20].
Prevention means that materials would be used less and more sustainable materials and
products would be used. Reusing includes checking, cleaning, repairing, using spare
parts as such. Recycling turns the used component into new substance or product. En-
ergy recovery is a method where material is converted into energy. This includes incin-
eration for example. The last part is disposal where waste is disposed to some final re-
pository, such as landfill. [20.]
2.3.1 Waste hierarchy of plastics
From the point of view of plastic waste, the waste hierarchy follows the same path as
other wastes. Firstly, the prevention of plastics naturally reduces the amount of plastic
waste. It reduces significantly the environmental burden and conserves resources. Plas-
tic reusing is a challenging part and has been topical subject lately. While recycling of
plastic that forms from municipal and industrial sources is very tempting, the challenge
of recycling such plastic waste is that the waste is very heterogeneous and contami-
nated. All plastics are not suitable for recycling and can even damage the process. Also

11 (50)
the impurities in the feedstock interferences the process. The most recycled type of plas-
tics are plastic bottles. Recycling of plastic bottles can save up to 1–2 tons of CO2 per
ton recycled plastic. [20.]
Energy recovery and thermo-chemical recycling are the next steps in the waste hierar-
chy. This includes incineration, pyrolysis and gasification. Incineration is vastly used pro-
cess since plastic waste does not have to be cleaned before burning unlike in recycling.
Pyrolysis is also desired method, since plastic can be returned back to hydrocarbon
products and formed into liquid fuels or other chemicals. The last option is disposal of
plastic waste, resulting in the waste ending up in landfills. Technically, this is not included
into circular economy of plastics, since in the philosophy of ideal circular economy the
waste is not formed at all. [20.]
3 Thermolysis of Plastics
Thermolysis of plastic falls under thermo-chemical recycling in plastic waste manage-
ment. Plastic waste is treated as a raw material in order to produce more valuable prod-
ucts.
Thermolysis provides different products, as a form of non-condensable gas, wax and
liquid. Operating conditions that are used in the process has a significant effect on the
end product. The most relevant operating conditions are: temperature, residence time,
feedstock density, feedstock humidity and material parameters such as calorific value,
elementary composition and particle size. [8.]
In thermolysis, material is heated in the absence of oxygen and degraded back to mon-
omeric level. Thermolysis or pyrolysis can be executed either fast or slow. Fast thermol-
ysis differs from slow pyrolysis so that in fast pyrolysis the raw material is heated rapidly,
and the residence time is very small approximately 1-3 seconds. In pyrolysis the temper-
ature can range from 450 to 600 °C and can be executed without the catalyst (thermal
cracking) or with it (catalytic cracking). [21; 3.] The product that usually is formed are
lighter hydrocarbons, mainly inside gasoline spectrum but the product has also waxes
with high molecular weight hydrocarbons [22].
12 (50)
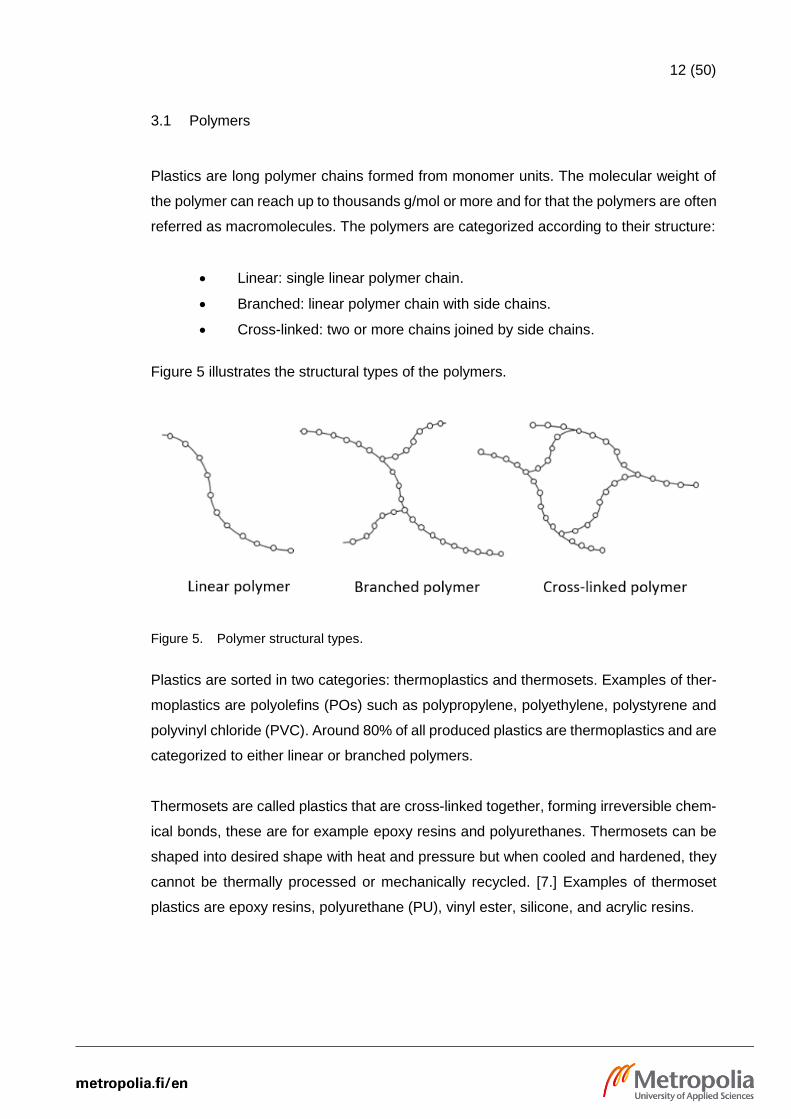
3.1 Polymers
Plastics are long polymer chains formed from monomer units. The molecular weight of
the polymer can reach up to thousands g/mol or more and for that the polymers are often
referred as macromolecules. The polymers are categorized according to their structure:
• Linear: single linear polymer chain.
• Branched: linear polymer chain with side chains.
• Cross-linked: two or more chains joined by side chains.
Figure 5 illustrates the structural types of the polymers.
Figure 5. Polymer structural types.
Plastics are sorted in two categories: thermoplastics and thermosets. Examples of ther-
moplastics are polyolefins (POs) such as polypropylene, polyethylene, polystyrene and
polyvinyl chloride (PVC). Around 80% of all produced plastics are thermoplastics and are
categorized to either linear or branched polymers.
Thermosets are called plastics that are cross-linked together, forming irreversible chem-
ical bonds, these are for example epoxy resins and polyurethanes. Thermosets can be
shaped into desired shape with heat and pressure but when cooled and hardened, they
cannot be thermally processed or mechanically recycled. [7.] Examples of thermoset
plastics are epoxy resins, polyurethane (PU), vinyl ester, silicone, and acrylic resins.
13 (50)
Polymers such as polypropylene, polyethylene and polystyrene behave differently than
polymers that contains extraneous elements. These kind of polymers are mostly pro-
cessed differently, some of which are listed below:
• Plastics that contain oxygen, such as polyethylene terephthalate (PET).
• Nitrogenated polymers, such as polyamides or nylons.
• Halogenated polymers such as PVC are usually processed differently [23].
3.2 Thermolysis reactors
The reactor is presumably the most important component of pyrolysis, although it only
takes about 15% of the total costs of the process [24]. The classification of the reactor
can be based on the following criteria:
• The final product targeted (oil, char, gas).
• Reactors model of operation (batch, continuous).
• Heating mechanism (direct, indirect, microwave).
• The heat source used (electric, gas heaters) [25].
The most used reactor types of pyrolysis are: fluidized bed, batch & semi-batch, fixed
bed and screw kiln [7].
3.2.1 Fluidized-bed reactor (FBR)
The principle of the fluidized-bed reactor is that the reactor is filled with a bed of solid
particles and constant flow of fluidization gas gives the bed a fluid-like state. The raw
material is fed into the reactor where the desired reaction takes place. The vapor resi-
dence time can be controlled by adjusting the fluidization flow rate inside the reactor.
The fluidized-bed reactor provides many advantages compared to other methods of gas-
solid contacting devices. The following benefits can be listed for fluidized-bed reactors:
14 (50)
• Fine mixing of solids, near isothermal condition.
• Heat and mass transfer between gas and solids are high.
• Good process flexibility, allows to utilize different fluidization agents, tem-perature and residence time.
• Maintenance time and costs are lower, allows more investments possibili-ties, making it easy to operate on large and small-scale systems.
There are many different fluidized-bed reactors on commercial level. When fluidization-
bed reactors are mentioned in literature, they are usually referred as dense-phase, lean-
phase and circulation systems, where the main focus lies in a dense-phase. [7.]
Bubbling fluidized-bed reactor (BFB)
One of the used dense-phase system is bubbling fluidized-bed reactor. It is commonly
favored due to the advantages it provides: it has a fairly simple construction and opera-
tion, the temperature control is easy and heat transfer is efficient. [3.] Fluidized-bed re-
actor has homogeneous temperature gradient and composition so it is very suitable for
pyrolysis of polymers [7].
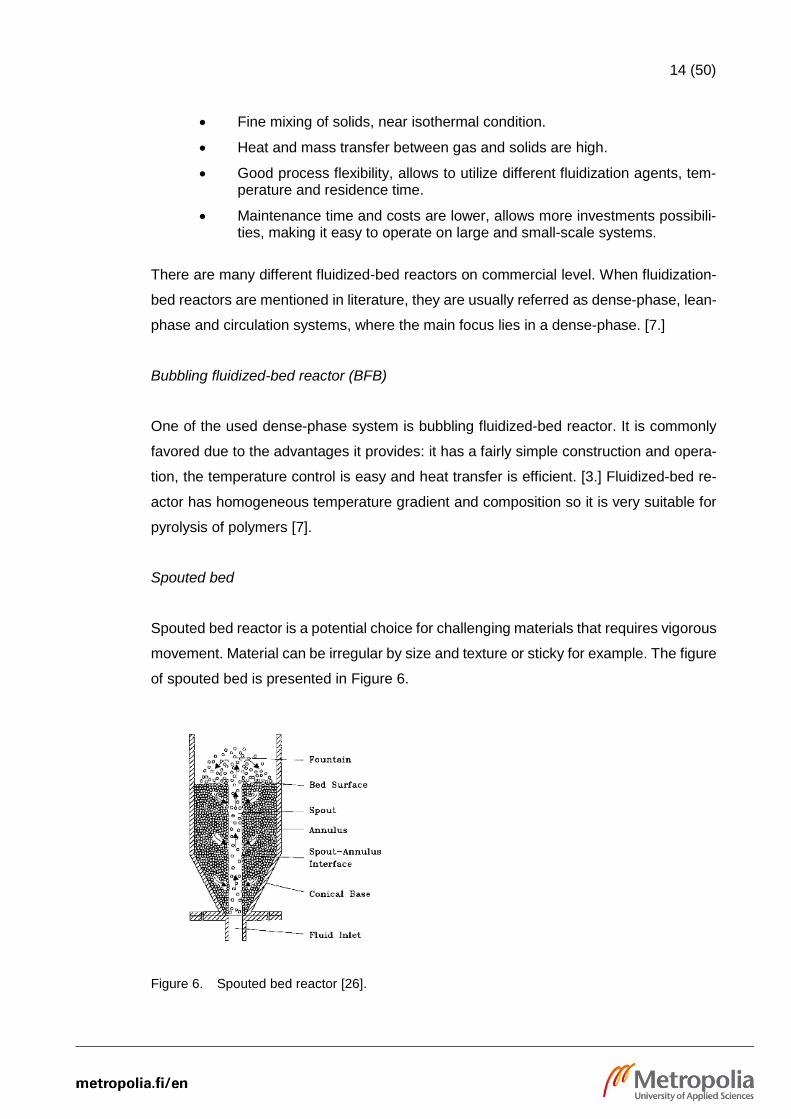
Spouted bed
Spouted bed reactor is a potential choice for challenging materials that requires vigorous
movement. Material can be irregular by size and texture or sticky for example. The figure
of spouted bed is presented in Figure 6.
Figure 6. Spouted bed reactor [26].

15 (50)
Basic principle is that the reactor has a shape of a cone. The feed proceeds from conical
base to the spout and moves on to the fountain, where it falls back to the annulus. This
circulation of feedstock is one of the most important properties of the spouted bed in
order to achieve the desired reaction [26].
3.2.2 Batch reactors
Batch reactor is a vessel, usually attached with a stirring device. The feedstock is loaded
to inside the reactor and sealed before the run. The reactor can be either batch or semi-
batch. In semi-batch reactor, continuous inert gas flow is going through the reactor con-
stantly. Usually nitrogen is used for this purpose. The nitrogen flow transports volatile
products away from the reactor. This removal starts secondary reactions of the primary
cracking products. Studies have shown that when HDPE (High-density polypropylene)
was tested as a feedstock in semi-batch reactor, the main product that was yielded was
olefins (>80%). When LDPE (Low-density polypropylene) was tested, the yield of olefins
dropped below 60% and also paraffins, aromatics and naphthenes was yielded. Figure
7 show the product fraction from HDPE and LDPE runs. [7.]
Figure 7. Product yield from semi-batch reactor a) HDPE; b) LDPE [7].
3.2.3 Fixed-bed reactors
Unlike in fluidized-bed technology, fixed-bed reactor is a reactor where the bed material
is mostly in static form and the catalyst motion is insignificant . Even though fixed bed is
very common and classical, the usage of it is rather complicating and challenging when
plastic waste is used as a feedstock.
16 (50)
One of the characteristic properties of plastic is that plastic has high viscosity and poor
thermal conductivity when melted and this can be problematic when loading the feed-
stock inside the reactor. In some processes molten plastic is fed from pressurized tank
through capillary tube into the reactor. Also, the most usual solution is to thermalize the
plastic before the fixed bed reactor. The feedstock is in gaseous or liquid form and can
be fed more easily. [7.]
3.2.4 Screw kiln reactor
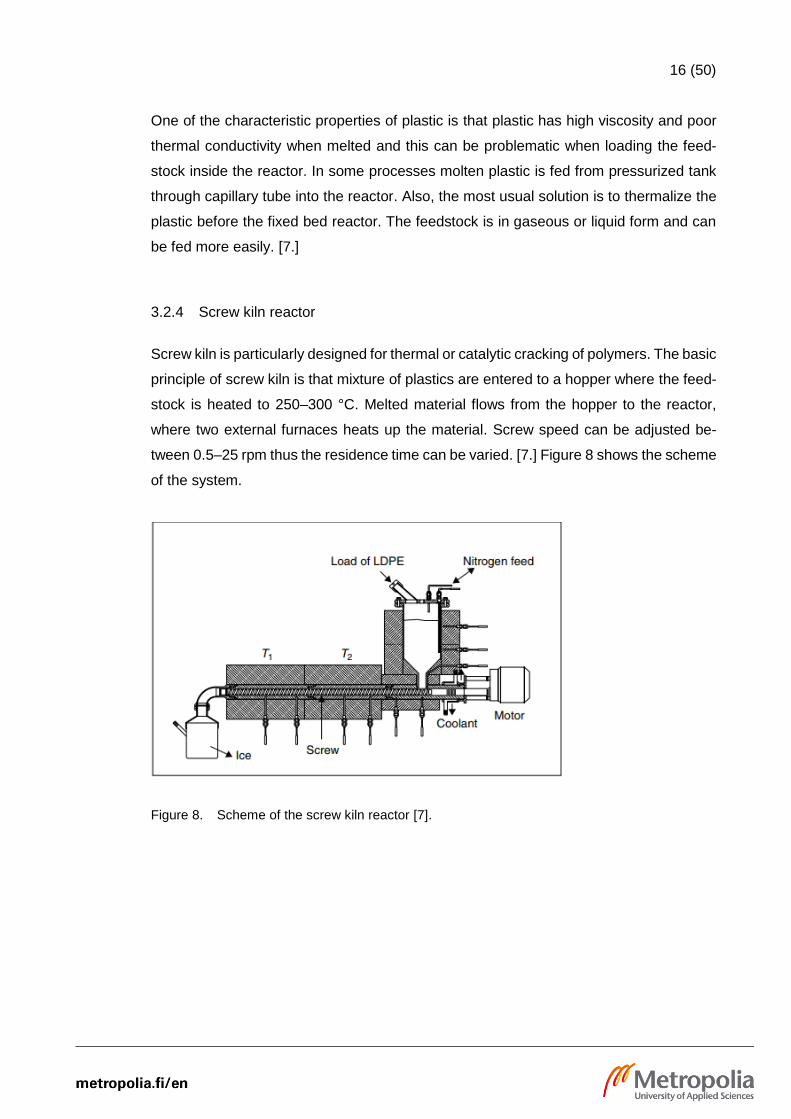
Screw kiln is particularly designed for thermal or catalytic cracking of polymers. The basic
principle of screw kiln is that mixture of plastics are entered to a hopper where the feed-
stock is heated to 250–300 °C. Melted material flows from the hopper to the reactor,
where two external furnaces heats up the material. Screw speed can be adjusted be-
tween 0.5–25 rpm thus the residence time can be varied. [7.] Figure 8 shows the scheme
of the system.
Figure 8. Scheme of the screw kiln reactor [7].

17 (50)
3.3 Product yield
Pyrolysis produces a wide spectrum of different products. The end product can contain
hundreds of different components, including paraffins, olefins and their isomers. Pyroly-
sis can also produce different fuels, such as petroleum gases, petrol, kerosene, diesel
and wax. Table 2 shows hydrocarbon spectrum in different fuels.
Table 2. Hydrocarbon spectrum in different fuels [13].
Fuel LPG* Petrol Kerosene Diesel Heavy fuel
oil
Hydrocarbon range
C3 to C4 C4 to C12 C12 to C15 C12 to C24 C12 to C70
*Liquefied Petroleum Gas
The basic mass balance of the pyrolysis process is presented in Figure 9.
Figure 9. Mass balance of simple process flow diagram of the pyrolysis [7].
3.3.1 Effect of feed composition
The feedstock composition for thermolysis has significant effect on the product distribu-
tion. Mainly can be said that the mixture of polyolefins depolymerize around same tem-
perature than their pure counterparts but with waste polyolefins the degradation may
occur at lower temperature. Experiments have shown that polyethylene decomposes
more rapidly when thermalized with PS. This is because of the radicals that forms during

18 (50)
the decomposition of polystyrene. When polyethylene is thermalized, the products typi-
cally are paraffins but if polypropylene or polystyrene is added, the amount of aromatic
and alkenic products are greatly grown. [3.] On the other hand, the cracking of the PS is
not affected with the presence of other polyolefins.
3.3.2 Effect of the catalyst
Studies have shown that the gas and liquid product yield is lower on thermal process
than catalytic process. Also the presence of petroleum residue in the process is proven
to increase the yield. One of the experiment set that was carried out compared four dif-
ferent catalyst:
• Hydrocracking catalyst, NiW–silica–alumina.
• ZSM-5 zeolite powder.
• Fluid catalytic cracking (FCC) catalyst, metal supported Y-zeolite.
• Hydroprocessing catalyst, NiMo-gamma-alumina. [6.]
With these experiments, PS showed almost complete conversion with PS/residue/cata-
lyst and PS/catalyst combinations. PP/residue/catalyst alternatively showed much higher
conversion, around 85.4–89.9%, compared to PP/catalyst conversion, 64.2–73.1%.
Plastics are rich in hydrogen and thus, have a high H/C ratio compared to heavy petro-
leum residue in which C/H ratio is higher. These co-processing reactions removes car-
bon as a form of coke, hence the H/C ratio is increased, and heavy residues are con-
verting into hydrogen containing a fraction which occurs in the form of liquid fuel oils. [6.]
Zeolite catalysts seems to yield better conversion than non-zeolite; hence, the catalyst
activity increases in polyolefin pyrolysis when the number of acid sites are raised [3].
One of the most important parameters affecting the yield and composition of the product
in pyrolysis is temperature and residence time [7].
The main product that forms from the catalytic pyrolysis were the hydrocarbons in gaso-
line range (C3–C15). The advantage of catalytic degradation is that the process produces
isoparaffins that have a high octane number. High octane number suggest high quality
19 (50)
fuel. Widely used catalysts in pyrolysis are for example Beta, USY, ZSM-11, REY, Mor-
denite and ZSM-5 [3]. The most relevant advantages of using catalyst in pyrolysis are
listed below:
• The reaction temperature is lowered; as a result, energy demand is re-duced.
• The cracking reaction is faster, residence time gets shorter and conse-quently reactor volumes required gets smaller.
• Desired products can be tailored with both choice of the catalyst and pro-cess conditions.
• When thermolyzing polyolefins, the main products are cyclic, branched and aromatic hydrocarbons, which has a positive impact when refining potential fuels.
• Catalyst reduces the content of undesired products such as chlorinated hy-drocarbons. [3.]
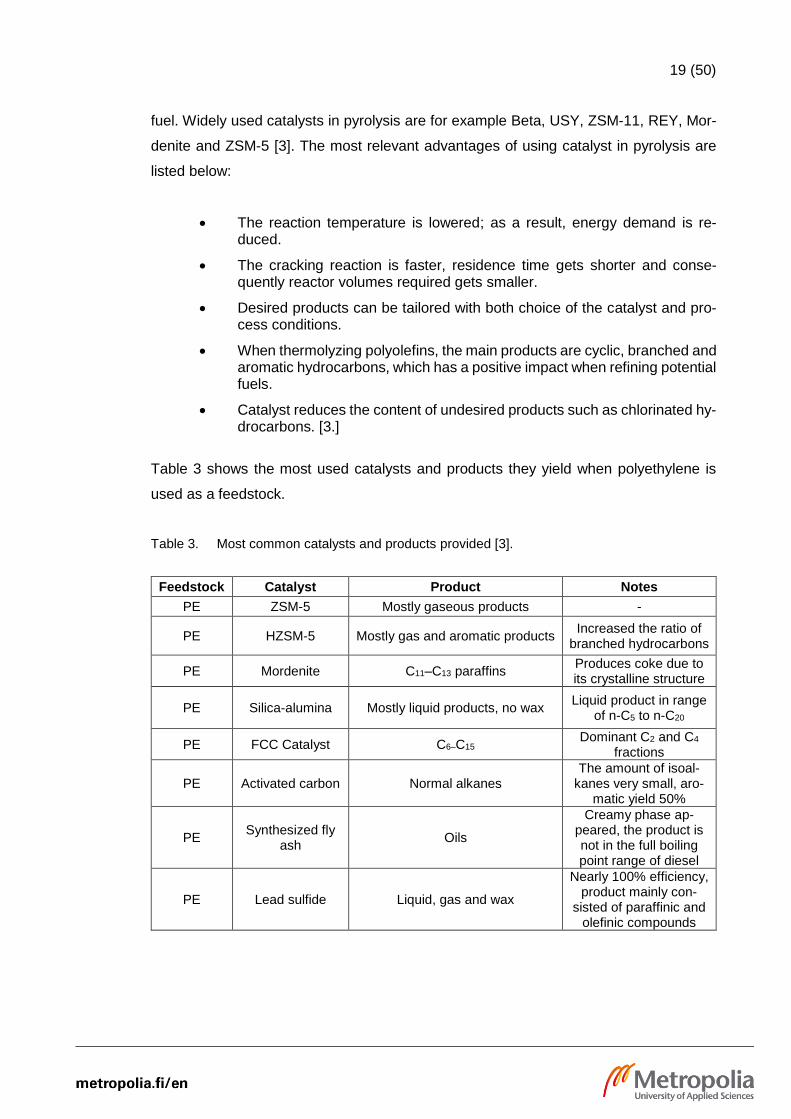
Table 3 shows the most used catalysts and products they yield when polyethylene is
used as a feedstock.
Table 3. Most common catalysts and products provided [3].
Feedstock Catalyst Product Notes
PE ZSM-5 Mostly gaseous products -
PE HZSM-5 Mostly gas and aromatic products Increased the ratio of
branched hydrocarbons
PE Mordenite C11–C13 paraffins Produces coke due to its crystalline structure
PE Silica-alumina Mostly liquid products, no wax Liquid product in range
of n-C5 to n-C20
PE FCC Catalyst C6–C15 Dominant C2 and C4
fractions
PE Activated carbon Normal alkanes The amount of isoal-
kanes very small, aro-matic yield 50%
PE Synthesized fly
ash Oils
Creamy phase ap-peared, the product is not in the full boiling point range of diesel
PE Lead sulfide Liquid, gas and wax
Nearly 100% efficiency, product mainly con-
sisted of paraffinic and olefinic compounds

20 (50)
3.4 Commercial technologies
Many companies have already started to use pyrolysis as a process for plastic waste
recycling in commercial scale. In 2011, 23 Plastic-to-Fuels (PTF) companies and 11 as-
sociated systems were identified [27; 28]. Table in Appendix 1 shows specifications of
six different technology supplier of PTF, what feedstock they are using and what products
they are providing.
3.4.1 RES Polyflow
RES Polyflow is an Ohio based US company manufacturing equipment, such as process
vessels which converts mixed plastic waste into fuels. The feed capacity of this technol-
ogy is around 60 tons of mixed polymer. If higher capacity is desired, multiple units can
be installed in parallel with shared feed. The products that RES Polyflow provides is a
light, sweet liquid with a high market price. For example, diesel oil, octane number en-
hancers and gasoline blend stocks can be yielded from RES Polyflow’s end-products.
[29.]
3.4.2 Agilyx
Agilyx is an energy company that initiated a pilot scale PTF operations in Tigard, OR,
USA in 2013. Agilyx has a continuous operations that uses thermal depolymerisation
with a batch feed. They do not pre-sort the feedstock nor pre-process the product.
Agilyx uses discrete polymers and mixed plastic waste as a feedstock and provides hy-
drocarbon products, aromatics, isoparaffins, naphthalenes, olefins, paraffins and waxes
and carbon solids. [27.]
3.4.3 Cynar Plc
Cynar Plc is a UK based company that recovers synthetic fuel from used plastic sources.
The company was founded in 2003 and as of 2016, Cynar Plc is in liquidation. Cynar
was the only company that operated their system outside of an enclosed building. Cynar
Plc signed a contract with Project Developer, Plastic Energy SL. This contract included
21 (50)
developing of 8 PTF factories in Spain and Portugal in addition to 15–20 PTF systems in
South America, Florida and the Caribbean. [27.]
3.4.4 Golden renewable energy
Golden renewable energy derives diesel from waste products using pyrolysis, operating
at Yonkers, NY, USA. They have licensed fully commercially facility process which pro-
vides multiple grades of end of life/non-recyclable plastics. The process design is mod-
ular, meaning that is does not require large floor space and is easy to implement. [30.]
Golden renewable energy uses thermal depolymerisation as a method with a continuous
feed as a feed process [27].
22 (50)
4 Experimental part
The experimental part was executed at VTT’s facilities in Bioruuki. Tests were carried
out with different plastics feedstock materials. Tests were executed in a 1kg/hr bench
scale fast pyrolysis unit based on fluidized-bed reactor technology (see chapter 3.2).
Products were analyzed at VTT’s laboratories in Otaniemi.
4.1 Introduction
The main objective was to test plastic mixtures as a feedstock at bench scale pyrolysis
process in order to study the behavior of the process at different conditions. Plastic is
challenging material as a feedstock, especially plastic waste due to its heterogeneous
composition. Plastic waste contains several different plastics and extraneous material
such as additives, paper, dirt etc. The process produces different products such as char,
wax, pyrolysis oil and pyrolytic gas, depending on the material used and experiment
conditions. The interest part was to test that by how changing the temperature affect the
total yield and the composition of the product. During the first run set, pure plastic was
tested as a reference material, with three different temperature. After that, three different
plastic waste samples was tested with three different temperatures each and long runs
(4 hr) was performed for each feedstock. Mass balance was checked from each run and
the samples were analyzed. Typical running time was three hours.
4.2 Unit description
The experimental unit in which experiments were carried out is bench-scale fast pyrolysis
based on fluidized-bed reactor technology with capacity of 1kg/hr (KILO). The unit in-
cludes the feeding tank, reactor, two cyclones, water cooler, electrostatic precipitator and
two dry ice coolers.
The schematic process diagram is presented in Figure 10.
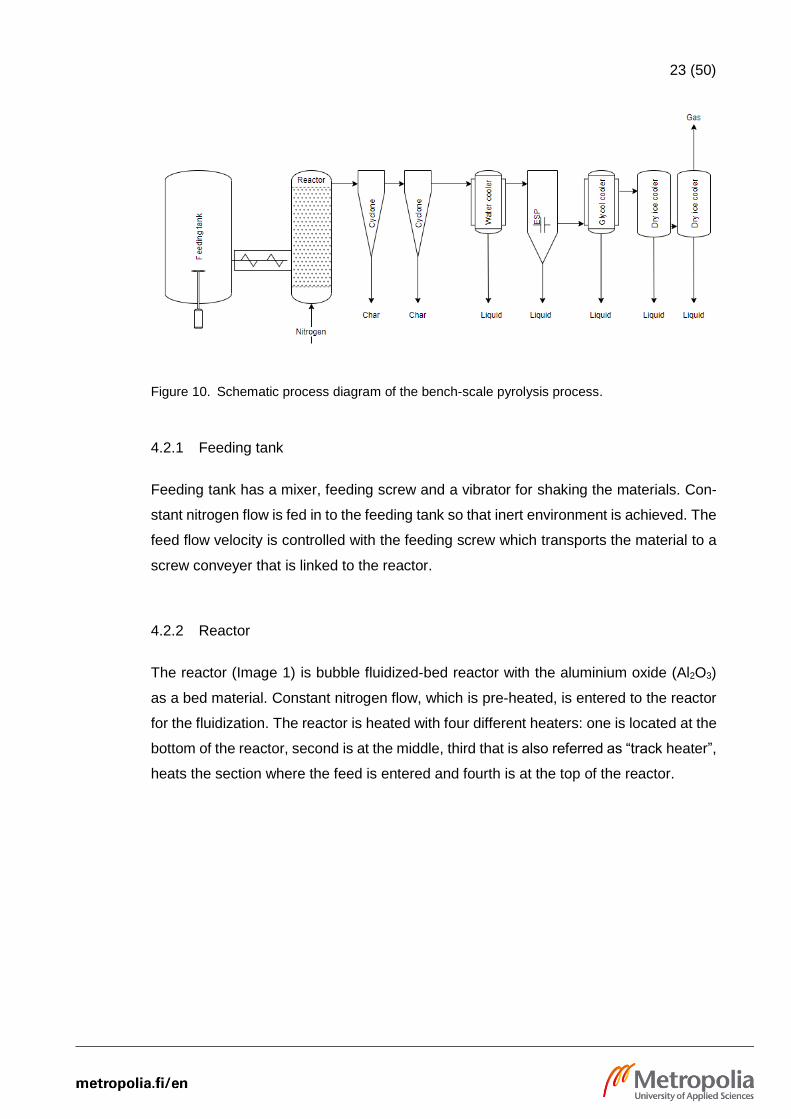
23 (50)
Figure 10. Schematic process diagram of the bench-scale pyrolysis process.
4.2.1 Feeding tank
Feeding tank has a mixer, feeding screw and a vibrator for shaking the materials. Con-
stant nitrogen flow is fed in to the feeding tank so that inert environment is achieved. The
feed flow velocity is controlled with the feeding screw which transports the material to a
screw conveyer that is linked to the reactor.
4.2.2 Reactor
The reactor (Image 1) is bubble fluidized-bed reactor with the aluminium oxide (Al2O3)
as a bed material. Constant nitrogen flow, which is pre-heated, is entered to the reactor
for the fluidization. The reactor is heated with four different heaters: one is located at the
bottom of the reactor, second is at the middle, third that is also referred as “track heater”,
heats the section where the feed is entered and fourth is at the top of the reactor.
24 (50)
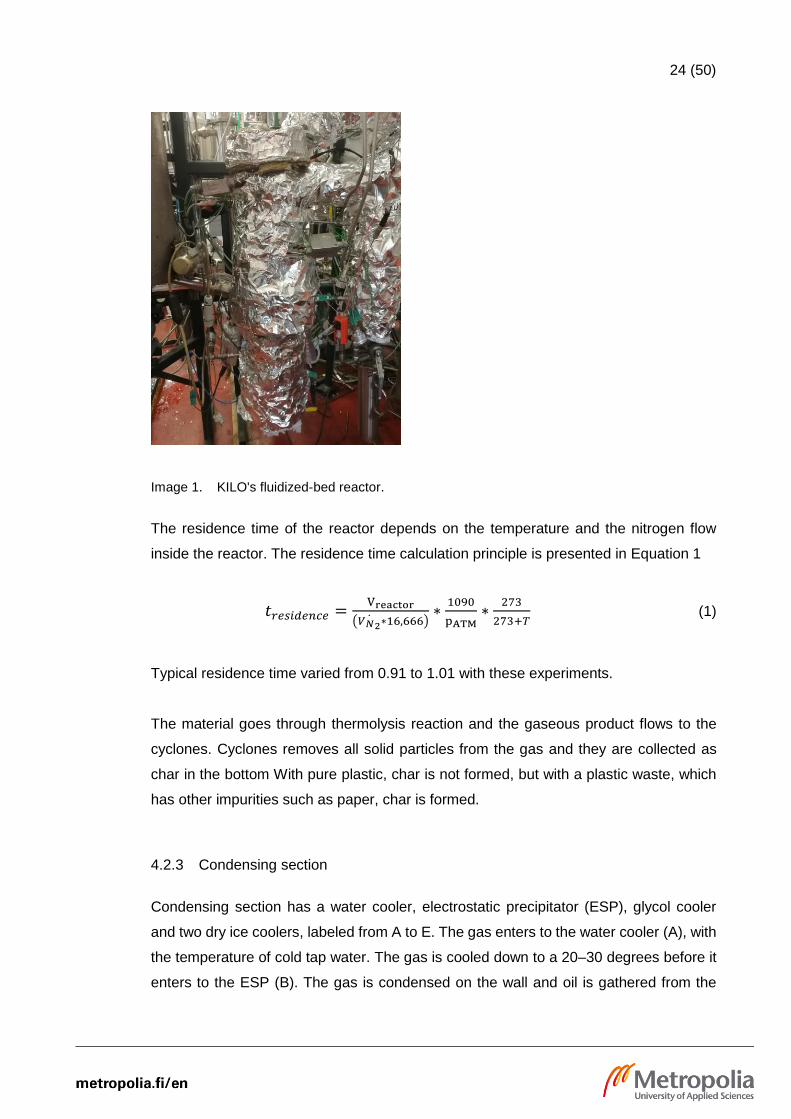
Image 1. KILO's fluidized-bed reactor.
The residence time of the reactor depends on the temperature and the nitrogen flow
inside the reactor. The residence time calculation principle is presented in Equation 1
𝑡𝑟𝑒𝑠𝑖𝑑𝑒𝑛𝑐𝑒 =Vreactor
(𝑉𝑁2̇ ∗16,666)
∗1090
pATM∗
273
273+𝑇 (1)
Typical residence time varied from 0.91 to 1.01 with these experiments.
The material goes through thermolysis reaction and the gaseous product flows to the
cyclones. Cyclones removes all solid particles from the gas and they are collected as
char in the bottom With pure plastic, char is not formed, but with a plastic waste, which
has other impurities such as paper, char is formed.
4.2.3 Condensing section
Condensing section has a water cooler, electrostatic precipitator (ESP), glycol cooler
and two dry ice coolers, labeled from A to E. The gas enters to the water cooler (A), with
the temperature of cold tap water. The gas is cooled down to a 20–30 degrees before it
enters to the ESP (B). The gas is condensed on the wall and oil is gathered from the
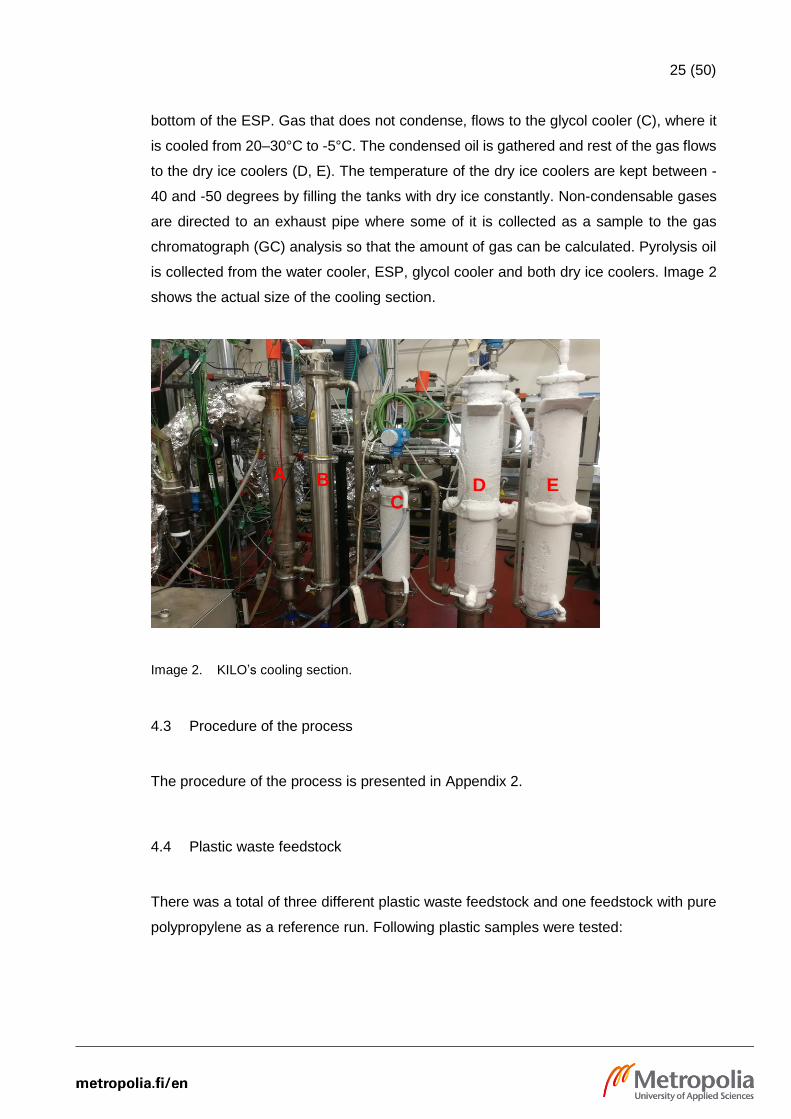
25 (50)
bottom of the ESP. Gas that does not condense, flows to the glycol cooler (C), where it
is cooled from 20–30°C to -5°C. The condensed oil is gathered and rest of the gas flows
to the dry ice coolers (D, E). The temperature of the dry ice coolers are kept between -
40 and -50 degrees by filling the tanks with dry ice constantly. Non-condensable gases
are directed to an exhaust pipe where some of it is collected as a sample to the gas
chromatograph (GC) analysis so that the amount of gas can be calculated. Pyrolysis oil
is collected from the water cooler, ESP, glycol cooler and both dry ice coolers. Image 2
shows the actual size of the cooling section.
Image 2. KILO’s cooling section.
4.3 Procedure of the process
The procedure of the process is presented in Appendix 2.
4.4 Plastic waste feedstock
There was a total of three different plastic waste feedstock and one feedstock with pure
polypropylene as a reference run. Following plastic samples were tested:
A B
C D E
26 (50)
• Polypropylene
• Plastic Waste Sample 1: C&D (Construction and demolition) and energy plastic waste
• Plastic Waste Sample 2: Plastic packaging waste
• Plastic Waste Sample 3: Reject from plastic recycling
Plastic Waste Sample 1
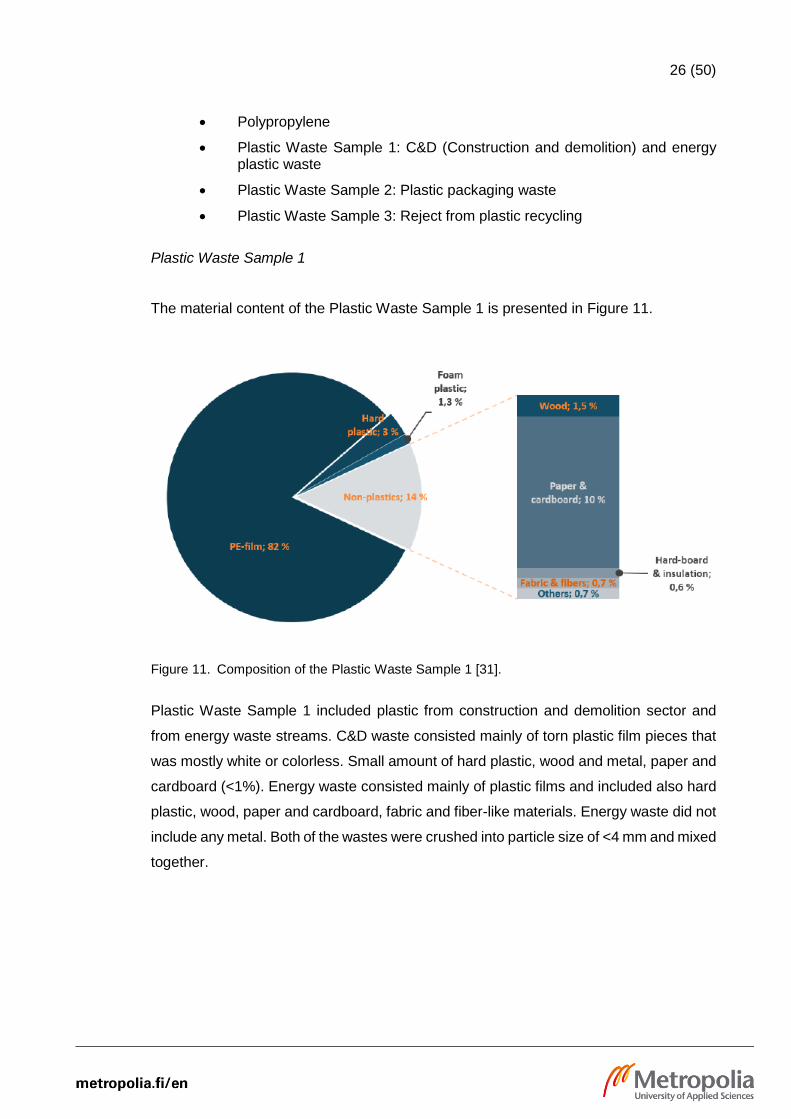
The material content of the Plastic Waste Sample 1 is presented in Figure 11.
Figure 11. Composition of the Plastic Waste Sample 1 [31].
Plastic Waste Sample 1 included plastic from construction and demolition sector and
from energy waste streams. C&D waste consisted mainly of torn plastic film pieces that
was mostly white or colorless. Small amount of hard plastic, wood and metal, paper and
cardboard (<1%). Energy waste consisted mainly of plastic films and included also hard
plastic, wood, paper and cardboard, fabric and fiber-like materials. Energy waste did not
include any metal. Both of the wastes were crushed into particle size of <4 mm and mixed
together.

27 (50)
Plastic Waste Sample 2
Plastic Waste Sample 2 consisted of whole plastic particles such as plastic bags, food
packaging, canisters, plastic bottles etc. Half of the samples were randomly picked and
mixed together. The sample was crushed into particle size of <4 mm. The composition
of the plastic sample is presented in Figure 12.
Figure 12. Composition of the Plastic Waste Sample 2 [31].
Plastic Waste Sample 3
Plastic Waste Sample 3 was a reject stream from SUM (Suomen Uusiomuovi Oy) recy-
cling process, also named SRF (Solid Recovered Fuel). Plastic waste consisted of
crushed plastic pieces, including film and hard plastics. Plastic was slightly dirty and
damp The plastic waste contained plastics that has gone through NIR identification such
as LDPE, PP, PET, HDPE, PS etc. and black plastics such as LD, PP and most portion
of the multi-layer plastics [32]. The samples were randomly picked, mixed together and
crushed into particle size of <4 mm. The composition of the plastic waste is presented in
Figure 13
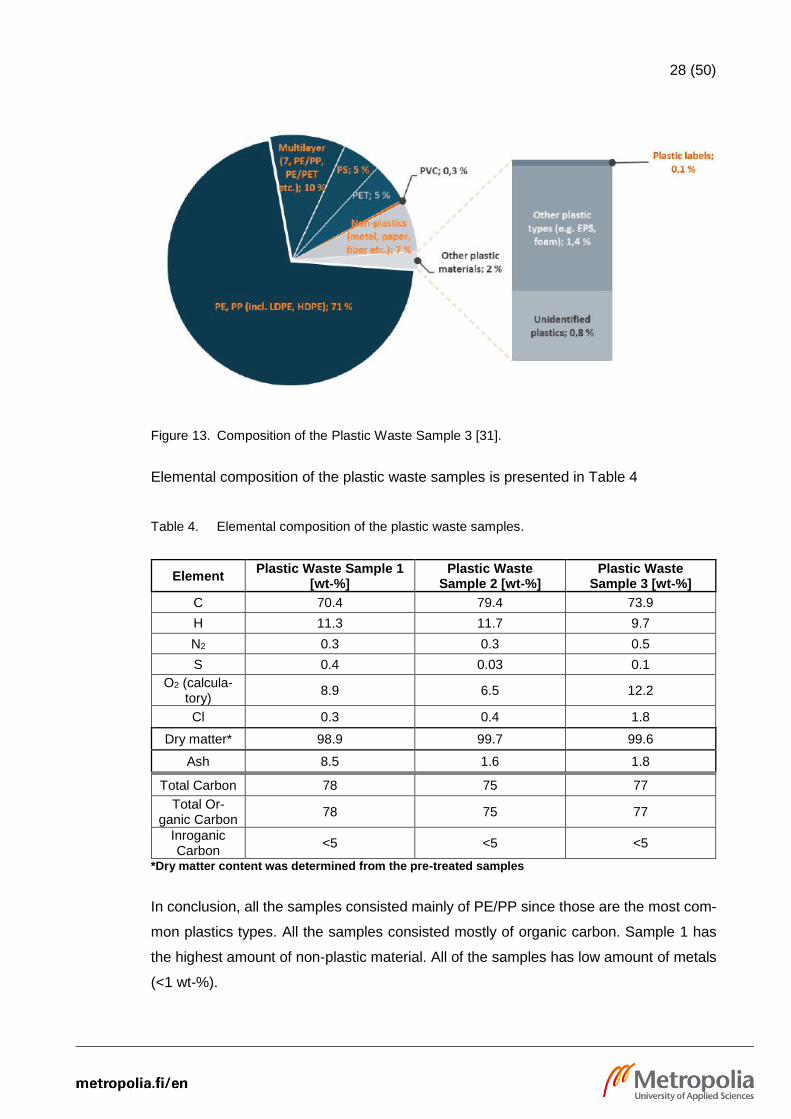
28 (50)
Figure 13. Composition of the Plastic Waste Sample 3 [31].
Elemental composition of the plastic waste samples is presented in Table 4
Table 4. Elemental composition of the plastic waste samples.
Element Plastic Waste Sample 1
[wt-%] Plastic Waste
Sample 2 [wt-%] Plastic Waste
Sample 3 [wt-%]
C 70.4 79.4 73.9
H 11.3 11.7 9.7
N2 0.3 0.3 0.5
S 0.4 0.03 0.1
O2 (calcula-tory)
8.9 6.5 12.2
Cl 0.3 0.4 1.8
Dry matter* 98.9 99.7 99.6
Ash 8.5 1.6 1.8
Total Carbon 78 75 77
Total Or-ganic Carbon
78 75 77
Inroganic Carbon
<5 <5 <5
*Dry matter content was determined from the pre-treated samples
In conclusion, all the samples consisted mainly of PE/PP since those are the most com-
mon plastics types. All the samples consisted mostly of organic carbon. Sample 1 has
the highest amount of non-plastic material. All of the samples has low amount of metals
(<1 wt-%).

29 (50)
4.5 Compiled results
Compiled results presents experimental conditions for each run. Also pressure changes
during the runs are presented in the appendix section. Feed rate was kept around 500
g/h with all of the feedstock used.
Total of five runs were carried out with polypropylene. Experiment with temperature of
625 °C was carried out twice, since the cooling system was modified so that the product
from glycol cooler would enter to the dry ice coolers simultaneously in order to reduce
the gas flow velocity inside the pipe. This was changed back to the original system in
Experiment 19. Experiments with polypropylene are presented in Table 5.
Table 5. PP test run conditions.
PP
Running number 1 2 3 4 7 23
Feed rate [g/h] 500 500 500 500 500 500
Amount of bed material [g] 300 300 300 300 300 500
Temperature [°C] 625 600 550 650 625 575
Time [h] 4.5 4.5 4.0 4.0 4.0 3.0
*Cooling system modified
First plastic waste sample that was tested was C&D plastic waste, referred from now on
as Plastic Waste Sample 1. Material content of the sample is presented in Figure 11 and
elemental composition in Table 4. Run conditions is presented in Table 6.
Table 6. Plastic Waste Sample 1 run conditions.
Plastic Waste Sample 1
Running number 5 6 8 21 22
Feed rate [g/h] 500 500 500 500 500
Amount of bed material [g] 300 300 300 300 500
Temperature [°C] 625 600 650 575 575
Time [h] 3.0 3.0 3.0 4.0 3.0
Pressure changes from under the grate during the experiments are presented in Appen-
dix 3.

30 (50)
Plastic Waste Sample 2 was carried out next. Material content of the sample is presented
in Figure 11 and run conditions in Table 7.
Table 7. Plastic Waste Sample 2 experiment conditions.
Plastic Waste Sample 2
Running number 9 10 11 12 13 14 15 20
Feed rate [g/h] 500 500 500 500 500 500 500 500
Amount of bed material [g] 300 300 300 300 300 500 500 500
Temperature [°C] 625 600 625 575 575 575 625 575
Time [h] 3.0 3.0 3.0 3.0 - 3.0 3.0 4.0
Experiments marked with red color were unsuccessful and are explained in section 3.8.
Pressure changes from under the grate during the experiments is presented in Appendix
4.
Final plastic waste sample was Plastic Waste Sample 3. Material content of the sample
is presented in Figure 11 and experiment conditions in Table 8.
Table 8. Plastic Waste Sample 3 experiment conditions.
Plastic Waste Sample 3
Running number 16 17 18 1
Feed rate [g/h] 500 500 500 500
Amount of bed material [g] 500 500 500 500
Temperature [°C] 575 600 625 575
Time [h] 3.0 3.0 3.0 4.0
Pressure changes under the from under the grate during the experiments are presented
in Appendix 5.
4.6 Test results
Test results are presented as a yield of the product, elemental composition of the wax,
heat of combustion of the wax and the composition of the gas analyzed in GS and in
laboratory.
31 (50)
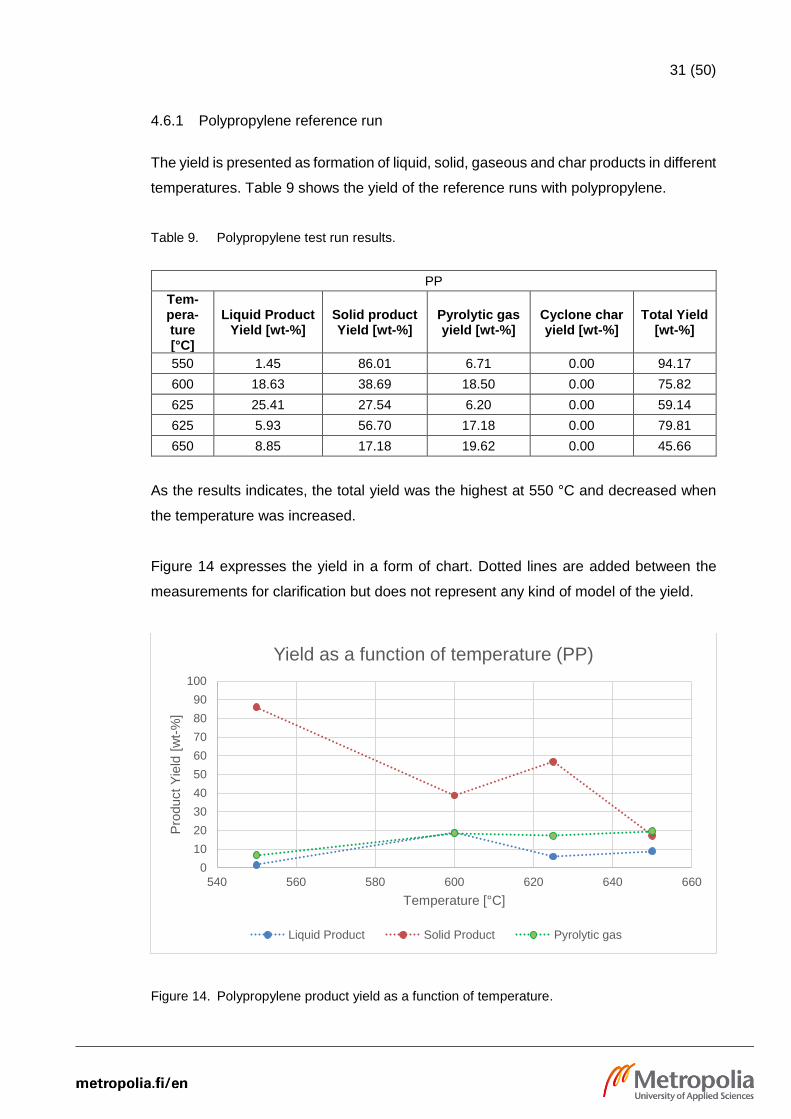
4.6.1 Polypropylene reference run
The yield is presented as formation of liquid, solid, gaseous and char products in different
temperatures. Table 9 shows the yield of the reference runs with polypropylene.
Table 9. Polypropylene test run results.
PP
Tem-pera-ture [°C]
Liquid Product Yield [wt-%]
Solid product Yield [wt-%]
Pyrolytic gas yield [wt-%]
Cyclone char yield [wt-%]
Total Yield [wt-%]
550 1.45 86.01 6.71 0.00 94.17
600 18.63 38.69 18.50 0.00 75.82
625 25.41 27.54 6.20 0.00 59.14
625 5.93 56.70 17.18 0.00 79.81
650 8.85 17.18 19.62 0.00 45.66
As the results indicates, the total yield was the highest at 550 °C and decreased when
the temperature was increased.
Figure 14 expresses the yield in a form of chart. Dotted lines are added between the
measurements for clarification but does not represent any kind of model of the yield.
Figure 14. Polypropylene product yield as a function of temperature.
0
10
20
30
40
50
60
70
80
90
100
540 560 580 600 620 640 660
Pro
duct
Yie
ld [
wt-
%]
Temperature [°C]
Yield as a function of temperature (PP)
Liquid Product Solid Product Pyrolytic gas
32 (50)
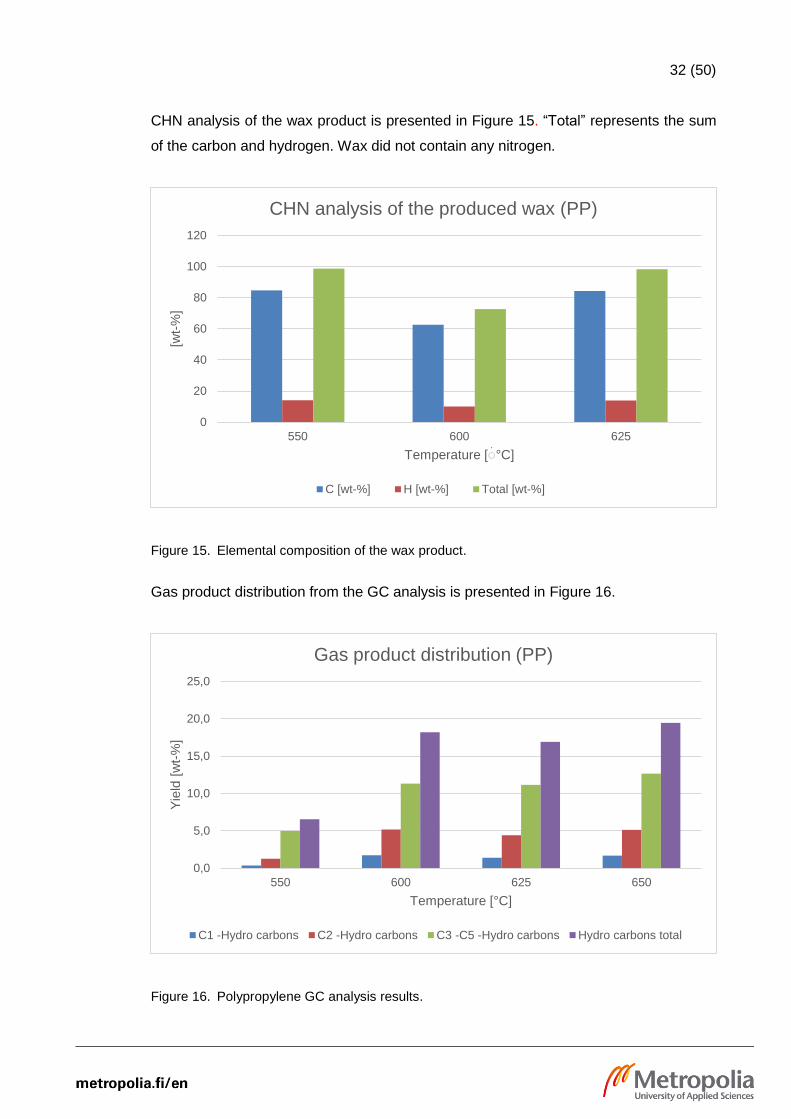
CHN analysis of the wax product is presented in Figure 15. “Total” represents the sum
of the carbon and hydrogen. Wax did not contain any nitrogen.
Figure 15. Elemental composition of the wax product.
Gas product distribution from the GC analysis is presented in Figure 16.
Figure 16. Polypropylene GC analysis results.
0
20
40
60
80
100
120
550 600 625
[wt-
%]
Temperature [ ׄ °C]
CHN analysis of the produced wax (PP)
C [wt-%] H [wt-%] Total [wt-%]
0,0
5,0
10,0
15,0
20,0
25,0
550 600 625 650
Yie
ld [
wt-
%]
Temperature [°C]
Gas product distribution (PP)
C1 -Hydro carbons C2 -Hydro carbons C3 -C5 -Hydro carbons Hydro carbons total
33 (50)
The amount of gas increased when the temperature was raised. Largest increase can
be seen between 550 and 600 °C. Between 600 and 650 °C the gas yield showed similar
results. This could indicate that the threshold of non-condensable gas formation stands
between 550 °C and 600 °C with this sample.
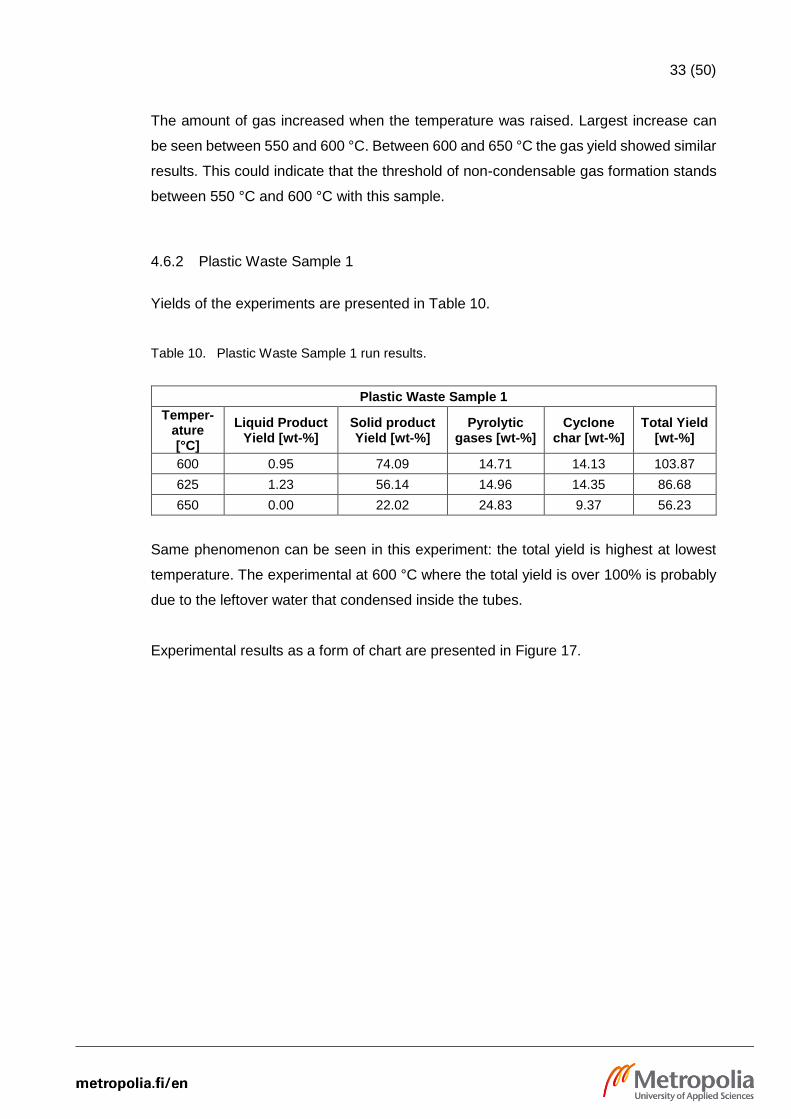
4.6.2 Plastic Waste Sample 1
Yields of the experiments are presented in Table 10.
Table 10. Plastic Waste Sample 1 run results.
Plastic Waste Sample 1
Temper-ature [°C]
Liquid Product Yield [wt-%]
Solid product Yield [wt-%]
Pyrolytic gases [wt-%]
Cyclone char [wt-%]
Total Yield [wt-%]
600 0.95 74.09 14.71 14.13 103.87
625 1.23 56.14 14.96 14.35 86.68
650 0.00 22.02 24.83 9.37 56.23
Same phenomenon can be seen in this experiment: the total yield is highest at lowest
temperature. The experimental at 600 °C where the total yield is over 100% is probably
due to the leftover water that condensed inside the tubes.
Experimental results as a form of chart are presented in Figure 17.

34 (50)
Figure 17. Plastic Waste Sample 1 product yield as a function of temperature.
CHN analysis of the wax product is presented in Figure 18.
Figure 18. CHN analysis of the wax product.
It can be seen from the Figure 18 that the elemental composition does not change be-
tween the experiments.
0
20
40
60
80
100
590 600 610 620 630 640 650 660
Pro
duct
Yie
ld [
wt-
%]
Temperature [°C]
Yield as a function of temperature (Plastic Waste Sample 1)
Liquid Product Solid Product Pyrolytic gas Char Total
0
10
20
30
40
50
60
70
80
90
100
600 625 650
[wt-
%]
Temperature [°C]
CHN analysis of the wax product (Plastic Waste Sample 1)
C [wt-%] H [wt-%] Total [wt-%]

35 (50)
Calorimetric and effective heat of combustion of the wax is presented in Table 11.
Table 11. Heat of combustion of the wax product.
Plastic Waste Sample 1
Temperature [°C] 600 625 650
Calorific heat of combustion [MJ/kg] 42.94 43.19 41.30
Effective heat of combustion [MJ/kg] 40.14 40.40 38.60
Gas product distribution from the GC analysis is presented in Figure 19.
Figure 19. Plastic Waste Sample 1 GC analysis results.
Figure 19 indicates that the composition of the gas is increased when the temperature is
raised.
4.6.3 Plastic Waste Sample 2
Yields of the experiments are presented in Table 12.
0,0
5,0
10,0
15,0
20,0
25,0
600 625 650
Yie
ld [
wt-
%]
Temperature [°C]
Gas product distribution (Plastic Waste Sample 1)
C1 -Hydro carbons C2 -Hydro carbons C3 -C5 -Hydro carbons Hydro carbons total

36 (50)
Table 12. Plastic Waste Sample 2 experiment results.
Plastic Waste Sample 2
Temper-ature [°C]
Liquid Product Yield [wt-%]
Solid product Yield [wt-%]
Pyrolytic gases [wt-%]
Cyclone char [wt-%]
Total Yield [wt-%]
575 0,00 72,50 11,58 7,65 91,73
600 0,00 65,89 13,63 3,55 83,06
625 0,00 60,91 18,76 4,44 84,10
Experimental results as a form of chart are presented in Figure 20.
Figure 20. Plastic Waste Sample 2 product yield as a function of temperature.
Yield of the products does not vary strongly between three temperatures. Total yield is
highest at 575 °C.
CHN analysis of the wax product is presented in Figure 21.
0
10
20
30
40
50
60
70
80
90
100
570 580 590 600 610 620 630
Pro
duct
Yie
ld [
wt-
%]
Temperature [°C]
Yield as a function of temperature (Plastic Waste Sample 2)
Liquid Product Solid Product Pyrolytic gas Char Total
37 (50)
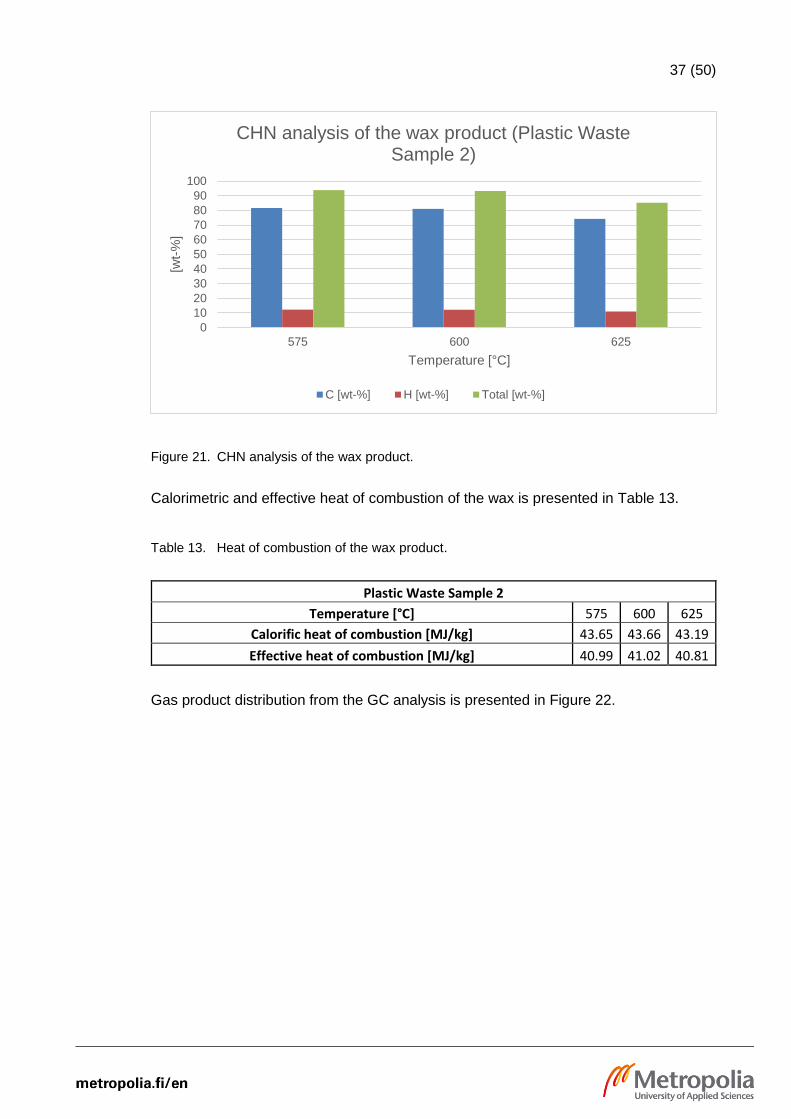
Figure 21. CHN analysis of the wax product.
Calorimetric and effective heat of combustion of the wax is presented in Table 13.
Table 13. Heat of combustion of the wax product.
Plastic Waste Sample 2
Temperature [°C] 575 600 625
Calorific heat of combustion [MJ/kg] 43.65 43.66 43.19
Effective heat of combustion [MJ/kg] 40.99 41.02 40.81
Gas product distribution from the GC analysis is presented in Figure 22.
0
10
20
30
40
50
60
70
80
90
100
575 600 625
[wt-
%]
Temperature [°C]
CHN analysis of the wax product (Plastic Waste Sample 2)
C [wt-%] H [wt-%] Total [wt-%]
38 (50)
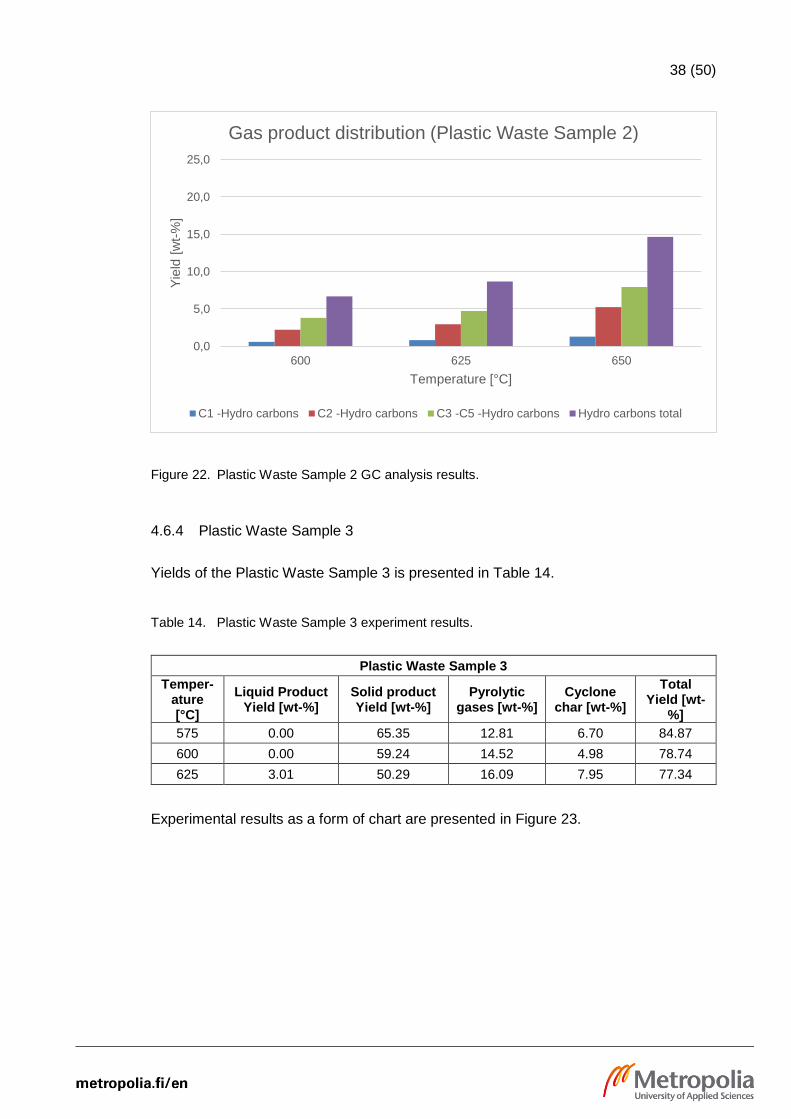
Figure 22. Plastic Waste Sample 2 GC analysis results.
4.6.4 Plastic Waste Sample 3
Yields of the Plastic Waste Sample 3 is presented in Table 14.
Table 14. Plastic Waste Sample 3 experiment results.
Plastic Waste Sample 3
Temper-ature [°C]
Liquid Product Yield [wt-%]
Solid product Yield [wt-%]
Pyrolytic gases [wt-%]
Cyclone char [wt-%]
Total Yield [wt-
%]
575 0.00 65.35 12.81 6.70 84.87
600 0.00 59.24 14.52 4.98 78.74
625 3.01 50.29 16.09 7.95 77.34
Experimental results as a form of chart are presented in Figure 23.
0,0
5,0
10,0
15,0
20,0
25,0
600 625 650
Yie
ld [
wt-
%]
Temperature [°C]
Gas product distribution (Plastic Waste Sample 2)
C1 -Hydro carbons C2 -Hydro carbons C3 -C5 -Hydro carbons Hydro carbons total

39 (50)
Figure 23. Plastic Waste Sample 3 product yield as a function of temperature.
Elemental composition of the wax product is presented in Figure 24.
Figure 24. Elemental composition of the wax product.
Calorimetric and effective heat of combustion of the wax is presented in Table 15.
0
10
20
30
40
50
60
70
80
90
100
570 580 590 600 610 620 630
Pro
duct
Yie
ld [
wt-
%]
Temperature [°C]
Yield as a function of temperature (Plastic Waste Sample 3)
Liquid Product Solid Product Pyrolytic gas Char Total yield
0
10
20
30
40
50
60
70
80
90
100
575 600 625
[wt-
%]
Temperature [ ׄ °C]
Elemental composition of the wax product (Plastic Waste Sample 3)
C [wt-%] H [wt-%] Total [wt-%]

40 (50)
Table 15. Heat of combustion of the wax product.
Plastic Waste Sample 3
Temperature [°C] 575 600 625
Calorific heat of combustion [MJ/kg] 42.14 40.86 41.91
Effective heat of combustion [MJ/kg] 39.77 38.70 39.69
Gas product distribution from the GC analysis is presented in Figure 25.
Figure 25. Plastic Waste Sample 3 GC analysis results.
4.7 Inferences from the experimental work
Results indicates that the total yield is better for each feedstock at lower temperature,
this indicates that some of the products may be escaping as a form of non-condensable
gas. The lowest temperatures that were experimented with plastic waste samples were
at 575 °C and the highest wax yield was achieved with Plastic Waste Sample 2.
The objective was to find the most optimal conditions for different sets of plastic waste in
the respect of product yield, mainly by adjusting the temperature in the process. The
initial objective was to find temperature where liquid product would be produced as much
0,0
5,0
10,0
15,0
20,0
25,0
575 600 625
Yie
ld [
wt-
%]
Temperature [°C]
Gas product distribution (Plastic Waste Sample 3)
C1 -Hydro carbons C2 -Hydro carbons C3 -C5 -Hydro carbons Hydro carbons total
41 (50)
as possible and on the same time minimizing the formation of non-condensable gases.
If the temperature is too low, the formation of wax increases. Wax clogs the pipes and
that way disturbs the process by increasing the pressure. Although the formation of wax
raises when the temperature is lowered, total yield increases since the wax is included
in the total yield and the formation of non-condensable gases decreases. After couple of
experiments, the objective changed as that the wax production became the main goal,
since the formation of liquid was non-existent with these three plastic waste feedstock
tested. One of reason for poor liquid production could be that the formation of the liquid
is usually enhanced with the presence of catalyst and this experiment set was carried
out in the absence of catalyst.
The experiments have shown that some of the products is lost during the experiment.
This can be because the condensable gas does not have enough time to condense in
the cooling section and escapes to exhaust pipeline. High thermolysis temperature
cracks the polymer into light hydrocarbons that have very low condensation temperature
point; thus, they do not condensate in the process.
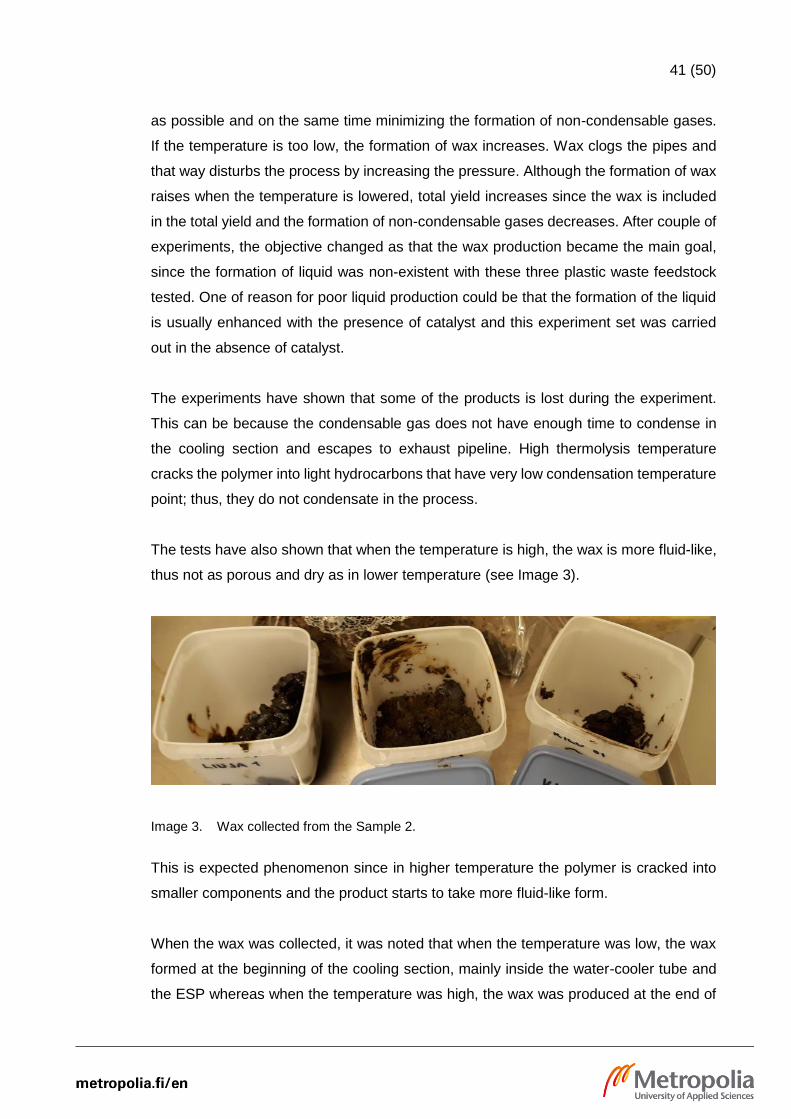
The tests have also shown that when the temperature is high, the wax is more fluid-like,
thus not as porous and dry as in lower temperature (see Image 3).
Image 3. Wax collected from the Sample 2.
This is expected phenomenon since in higher temperature the polymer is cracked into
smaller components and the product starts to take more fluid-like form.
When the wax was collected, it was noted that when the temperature was low, the wax
formed at the beginning of the cooling section, mainly inside the water-cooler tube and
the ESP whereas when the temperature was high, the wax was produced at the end of
42 (50)
the cooling section, mainly in to the glycol cooler and dry ice coolers. This indicates that
at the lower temperature high molecular weight waxes are produced that have lower
condensing temperature and vice versa.
The CHN analysis showed more or less the same results with each feedstock used.
Calorific and effective heat of combustion of the waxes that was analyzed showed similar
results as the literature [17].
4.8 Challenges of the experiments
Since the first experiment, it was noted that the ESP did not operate properly. The current
was not conducted through the ESP; as a result, the particles did not charge and the
separation did not occur. The ESP was removed from the tube after couple of experi-
ments.
During the experiments where Plastic Waste Sample 2 was tested, it was noted that the
temperature varied strongly. When pressure changes were examined, it was noted that
the rise of the temperature correlated with the pressure increase. This probably was from
the wax that clogged the pipes and that way raised the pressure inside the system. Pres-
sure increase reduces the feed rate and temperature starts to increase inside the reactor.
In addition, it has been noted that the plastic often melts on the screw conveyer during
the run and after a while detaches from the screw and falls to the reactor as big piece,
causing a sudden temperature reduction inside the reactor. It was also noticed that the
raw material formed an air lock inside the feeding tank and that way feed rate was not
constant. This may be due to the extraneous elements in the plastic waste such as paper.
During the Experiment 11, the temperature varied strongly throughout the run. Same
phenomenon occurred during the Run 12. After the Run 13, the cyclone heating element
broke down and the valve from pipeline going from the reactor to cooling section leaked.
The heating element and the valve was changed and the run was repeated. Unsuccess-
ful experiments where the temperature varied strongly could have been caused by the
thermo elements that the reactor has inside. If plastic melts on the meter, it shows strong
temperature increase in the. Also, it was clear that the amount of bed material affected
the temperature variation. In the Experiment 14, the amount of bed material was changed
from 300 g to 500 g and it was noticed that the amount of bed material had a significant
43 (50)
effect on the process: the temperature was much more stable throughout the experi-
ments.
The Experiment 21 was also marked with red color since it was noticed after the run that
glass wools was not installed inside the dry ice coolers and so the experiment had to be
repeated.
One of the challenges in the process was that the reactor is constantly being under heavy
heating and cooling operations, since the reactor requires burning in high temperature
after each experiment. This can encumber the components of the process, such as heat-
ing elements, thermometers, valves and seals. This also causes a stress to the electric
transformers and fuses and caused multiple breakdowns due to the electric power that
the heating elements required.
5 Recommendations
Recommendations section includes improvements and optimization for the process, pos-
sible applications and the possibility for co-feeding in refinery.
5.1 Improvements
Since the main produced product was in a form wax, the collection of the wax must be
improved. The wax creates a considerable problem inside the process, for example, it is
hard to collect and clean from the pipes. One of the solutions would be to install a tank
or container, where the wax could be collected more easily. The problem is that the lo-
cation of formed wax inside the system depends on the operation temperature and that
has to be taken into account when the location of the container is decided.
The formation of non-condensable gases is rather high in the process and the collection
of the gases is challenging. The increase of the residence time inside the cooling section
could decrease the amount of escaping gases. One of the possibilities could be to install
a pump to the dry ice coolers in order to create a reflux inside the system. This would
increase the residence time in the cooling section. The problem is that the pump can
only operate pure gases. The gas could also be collected with the activated carbon filter.

44 (50)
With thermal cracking the temperature is rather high, which increases the formation of
light hydrocarbon products which are challenging to condense and collect. One of the
recommendations could be to change the process into catalytic cracking. The presence
of catalyst lowers the required temperature and increases the yield of the liquid product
that is much easier for the collection and the maintenance of the process [3]. The pres-
ence of catalyst also narrows the product spectrum, which makes the formation of de-
sired product easier. This also would probably spare the components from breaking,
such as valves, thermometers and thermoelements that were constantly replaced.
5.2 Possible applications
Pyrolysis of plastic waste provides potential applications for many industrial processes.
Pyrolysis products could be used as a feedstock for refineries or as a fuel for factories
and plants. For example, Japan has studied pyrolysis of plastic since 1970 and has in-
tegrated the process into many industries. Table 16 presents the application of outputs
in the pyrolysis process. [7.]
Table 16. Applications of pyrolysis output [7].
Product Yield
[wt-%] Applications
Distilled light oil 20.2 Fuel for furnaces and incinerators in plant
Distilled light oil, re-mainder
11.0 Feedstock recycling in petroleum refinery plant
Distilled medium oil 4.5 Fuel for boiler in outside factory
Distilled heavy oil 21.0 Fuel for cogeneration in plant
Distilled heavy oil, re-mainder
5.5 Fuel for boiler in outside factory
Hydrochloric acid 1.0 Wastewater after neutralization
Pyrolysis residue 17.5 Supplementary fuel for outside sludge incinerator
Off gas 19.5 Burnt in incinerator and recovered as steam in the exhaust
gas boiler
The gas produced from the pyrolysis can be used for the gas engines, or in boiler appli-
cations without the requirement of the flue gas treatment. The formed char could be
further processed for the energy content of the carbon or exploited in the thermal pro-
cesses. Activated carbon could also manufactured from the char with steam process.
The liquid and wax formed from the thermolysis are rich in aromatics and can be used
as a feedstock after the post-treatment for fuel or petroleum processes. [33.]

45 (50)
5.3 Co-feeding in refinery
Plastic to liquid units have been studied for the co-processing of liquid fuel production.
The model would be integrated next to an oil refinery unit, wherein depending on the
process, the product could be used as a feedstock supply for the refinery. Thermal crack-
ing provides many different products depending on what operation conditions are used.
Table 17 presents the operation, product and the process where product could be utilized
Table 17. Co-feeding thermolysis in refineries [19].
Operation Product Supplier for
Low temperature cracking Wax Feedstock for a steam cracker
Thermolysis of POs in an in-ert-gas stream
Ethene, propene, bu-tadiene and other ole-
fins
Combined with steam cracker steam for joint processing
Thermolysis of POs using py-rolysis gas as the fluidizing
gas
High heat content gas, BTX-rich oils
Could be transported to refineries or petrochemical processing plants
Challenges for fuel refineries are that the gasoline that is processed has strict quality
criteria. Some examples are: resistance against autoignition (octane quality), environ-
mental acceptability, low toxicity, evaporation properties etc. Generally, it can be said
that when polyolefin are used as a feedstock in thermolysis, without the presence of
catalyst, it is not possible to produce a well-defined transport grade fuel. [19.] In addition,
thermolysis products require certain operations in order to be used as a feedstock for
refineries:
• Fractionation: The simplest operation for improving the pyrolysis product is the fractionation of the products. This operation limits the carbon range and thus increases the value of the product.
• Blending: Other operation for the pyrolysis product is the blending. For ex-ample, diesel fuels are very vulnerable to clouding, which causes clogging for engines. For the point of the engine, the cloud point, pour point and cold filter plugging point are the parameters that has to be taken into account.
• Hydrotreating: For the reduction of high concentrating olefins in the end product, hydrotreating is often required in the production and is broadly ap-plied in the oil refinery units.
• Dewaxing: Reduces the concentration of highly paraffinic oils from PE-rich feedstock. Catalytic dewaxing is economical choice which cracks the longer chain n-paraffins and reduces the diesel pour point. [19.]
46 (50)
In addition, of the listed operation, many additives are often required depending on the
requirements of the end product. Some examples of the additives are: detergents, metal
deactivators, ignition improvers, flow improvers, wax antisetting additives, cloud point
depressants etc. When diesel is produced from the pyrolysis oil, the end product is highly
unstable and repolymerizes in couple of days if no additives are added. Due to that,
some stabilization additives and antioxidants are required to restrain the polymerization
and oxidation of the end product. [19.]
6 Conclusion
In this Bachelor’s thesis, the objective was to study alternative recycling method, ther-
molysis for plastic waste. Whilst mechanical recycling is a viable waste management
method for plastic waste, it includes many limitations and challenges. For that, alternative
solutions must be considered for the ever-growing plastic consumption and feedstock
recycling offers a potential solution for the recycling of plastic.
In the background section, plastic waste management was reviewed from the European
level and from the global perspective. Current methods for managing the plastic waste
were examined. It is clear that the consumption of plastic continues to grow and so the
amount of plastic waste.
Plastic waste management methods can be categorized roughly into four sections: pri-
mary recycling, mechanical recycling, energy consumption and thermo-chemical recy-
cling. Thermolysis falls under thermo-chemical recycling and is a treatment where the
feedstock is heated in the oxygen free environment. Thermolysis is a tempting method
due to the fact that the feedstock requires very little sorting and pre-treatment. Pyrolysis
oil can be refined for example to other chemicals or fuel in the refinery. The end product
is defined by multiple parameters: the feedstock used, the reactor, the operational con-
ditions and the presence of catalyst.
In the experimental part, the thermolysis of plastic was executed with a bench-scale fast
pyrolysis based on fluidized bed reactor. Four different feedstock were tested each with
minimum of three different temperatures. First test was with pure PP, second was sample
from C&D and energy waste sector, third was from plastic packaging waste sector and
47 (50)
the last was from the reject from plastic recycling line. The main product from the exper-
iments was in a form of wax. When the temperature was higher, the main product was
at the beginning of the cooling section, indicating that the heavier components conden-
sate at the lower temperature. The challenge of the experiments was the wax. When the
wax accumulates into the pipelines, the pressure increases and the stability of the pro-
cess is disturbed and this must be taken into account if the process is scaled up. One
viable solution is to use the catalyst in the pyrolysis so that lower temperatures could be
used. This also gives the components, such as valves, thermometers a longer lifespan.
Many technical issues must be solved before the thermolysis of plastic waste can be
integrated to a large-scale process. The criteria of the automotive fuel is rather strict and
the feedstock used in refinery must pass those benchmarks.
Much research has been done regarding the thermolysis of plastic waste and a lot is
ongoing. A potential for plastic recycling lies with the thermolysis of plastic which has
many possibilities with the process and the products that can be further refined. Feed-
stock recycling is still rather small waste management method for the plastic waste but
has room to grow through optimization and improvements.
48 (50)
References
1 Darrin Qualman. 2017. Global plastics production, 1917 to 2050. Web-based document. <https://www.darrinqualman.com/global-plastics-production/>. Read 20.9.2018.
2 2010. American chemistry. American chemistry council. Online source. <https://web.archive.org/web/20100317004747/http://www.americanchemistry.com/s_plastics/doc.asp?CID=1571&DID=5972>. Read 20.9.2018.
3 A.K. Panda, R.K. Singh, D.K. Mishra. 2009. Thermolysis of waste plastics to liquid fuel. A suitable method for plastic waste management and manufacture of value added products–A world prospective. pp. 233–248.
4 C. L. Guern. 2018. When the mermaids dry: the great plastic tide. Web-based document. <http://plastic-pollution.org/>. Read 20.9.2018.
5 L. Parker. 2017. Here’s how much plastic trash is littering the earth. Web-based document. <https://news.nationalgeographic.com/2017/07/plastic-produced-recycling-waste-ocean-trash-debris-environment/>. Read 20.9.2018.
6 M. N. Siddiqui, H. H. Redhwi. 2009. Catalytic coprocessing of waste plastics and petroleum residue into liquid fuel oils. pp. 141–147.
7 J. Scheirs, W. Kaminsky. Feedstock Recycling and Pyrolysis of Waste Plastics: Converting Waste Plastics into Diesel and Other Fuels.
8 What is pyrolysis? Web-based material. <http://www.biogreen-energy.com/what-is-pyrolysis/>. Read 20.9.2018.
9 B. Mwanza, C. Mbohwa and A. Telukdarie. Strategies for the Recovery and Recycling of Plastic Solid Waste (PSW): A Focus on Plastic Manufacturing Companies. Procedia Manufacturing. pp. 686–693. 2018.
10 2018. Communication from the comission to the european parliament, the council, the european economic and social committee and the committee of the regions. Web-based document. <https://eur-lex.europa.eu/resource.html?uri=cellar:2df5d1d2-fac7-11e7-b8f5-01aa75ed71a1.0001.02/DOC_1&format=PDF>. Read 25.9.2018.
11 A. Bridgewater, D. Meier, D. Radlein. 1999. An overview of the fast pyrolysis of biomass. pp. 1479–1473.
12 A.G. Buekens, Huang. 1998. Catalytic plastics cracking for recovery of gasoline-range hydrocarbons from municipal plastic wastes. pp. 163–181

49 (50)
13 S. Farzan, D. Umair, F. Faisal, K. Zaid. 2018. Plastic Waste management.
14 J. R. Jambeck, R. Geyer, C. Wilcox, T. R. Siegler, M. Perryman, A. Andrady, R. Narayan, K. L. Law. 2015. Plastic waste inputs from land into the ocean. Online resource. <http://science.sciencemag.org/content/347/6223/768>. Read 25.9.2018.
15 2017. Plastics – the Facts 2017. PlasticsEurope. Brussels.
16 European plastic waste: Recycling overtakes landfill for the first time. Online re-source <https://www.plasticseurope.org/en/newsroom/press-releases/european-plastic-waste-recycling-overtakes-landfill-first-time>. Read 25.9.2018.
17 S. Al-Salem, P. Lettieri, J. Baeyens. 2009. Recycling and recovery routes of plastic solid waste (PSW): A review. Waste Management. pp. 2625–2643.
18 D. Lazarevic, E. Aoustin, N. Buclet, N. Brandt. 2010. Plastic waste management in the context of a European recycling society: Comparing results and uncertaintie in a life cycle perspective. Recources Conservation and Recycling. pp. 246–259.
19 Butler, E. Devlin, G. McDonnell, K. 2011. Waste polyolefins to liquid fuels via py-rolysis: Review of commercial state-of-the-art and recent laboratory research. Waste and Biomass Valorization. pp. 227–255.
20 2011. Applying the Waste Hierarchy: evidence summary. Department for Environment Foor & Rural Affairs. Online resource <https://assets.publishing.service.gov.uk/government/uploads/system/uploads/attachment_data/file/69404/pb13529-waste-hierarchy-summary.pdf>. Read 27.9.2018.
21 Fast pyrolysis. Biomass technology group. Online resource. <http://www.btg-world.com/en/rtd/technologies/fast-pyrolysis>. Read 25.9.2018.
22 Research scientist Muhammad Qureshi, VTT. Spoken information.
23 E. Sannita, B. Aliakbarian, A. A. Casazza. P. Perego, G. Busca. 2012. Medium temperature conversion of biomass and waster into liquid products: a review. Renewable and Sustainable Energy Reviews. pp. 6455–6475
24 A. V. Bridgwater. 2012. Review of fast pyrolysis of biomass and product upgrading. Biomass and bioenergy. pp. 68–94.
25 J. A. Garcia-Nunez, M. R. Pelaez-Samaniego, M. E. Garzia-Perez, I. Fonts, J. Abrego, R. J. M. Westerhof, M. Garcia-Perez. 2017. Historical Developments of Pyrolysis Reactors: A Review. ACS Publications.

50 (50)
26 M. Olazar, S. Alvarez, R. Aguado, M. San Jose. 2003. Spouted Bed Reactors. Chemical engineering technology. Weinheim. WILEY-VCH Verlag GmbH & Co. KGaA. pp. 845-852.
27 O. R. Alliance. 2005. 2015 Plastics-to-fuel project developer’s guide. Online resource. <https://www.oceanrecov.org/assets/files/Valuing_Plastic/2015-PTF-Project-Developers-Guide.pdf>. Read 25.9.2018.
28 2014. Converting Plastics to Oil. Polymer Solutions. Online resource. <https://www.polymersolutions.com/blog/converting-plastics-to-oil/>. Read 25.9.2018.
29 Technology. RES Polyflow. Online resource. <http://www.respolyflow.com/our-solutions/technology/>. 25.9.2018.
30 Transforming Waste Products into a Valuable Energy Resource. Golden Renewable Energy. Online recource. <https://www.goldenrenewable.com/>. Read 25.9.2018.
31 S. Jokinen. 2018. Characterization studies of feedstock samples.
32 H. Punkkinen. Email source. 2018.
33 S.M. Salem, P. Lettieri, Baeyens. J. 2009. The valorization of plastic solid waste (PSW) by primary to quaternary routes: From re-use to energy and chemicals. Progress in Energy and Combustion Science. pp. 103–129.

Appendix 1
1 (2)
Appendix 1. Commercial PTF technology suppliers and specs [27].
Table 18. PTF System inputs.
PTF System inputs
Technology Supplier Feedstock Requirements Accepted Feedstock
Sys-tem
Foot-print
Number of Em-ployees
Agilyx Cleaned. mostly dried and chipped shredded to a di-
mension of ¼'' -⅜''
Rigid and Film Plastics #2.4.5.6
17.000 ft2 buil-ding; 0.4
acre
31
Cynar PLC
Separation from non-tar-get plastics (PVC and
PET) and contaminants; Size <300mm
Rigid and Film Plastics #2.4.5.6
4.920 ft2
Sys-tem foot-print
10 Operators. 2 Admins
Golden Renewables
Feedtock must be cleaned; dried (no more than 5wt-% moisture);
Size: 0.5''
Rigid Plastics #3-7
5.000 ft2 buil-
ding 20
RES Polyflow Separation from conta-
minants
Rigid and Film Plastics #1-7. Carpet. Tire
Shreds
PET. PVC con-tami-nation thresh-old not speci-fied
32
Nexus fuels
Separation from non-tar-get plastics (PET and
PVC) and contaminants
Rigid and Film Plastics #2.4.5.6
Did not dis-
close
20
MK Aromatics Limited Separation from non-tar-
get plastics (PET and PVC) and contaminants
Rigid and Film Plastics #2.4.5.6
Did not dis-
close
Did not disclose
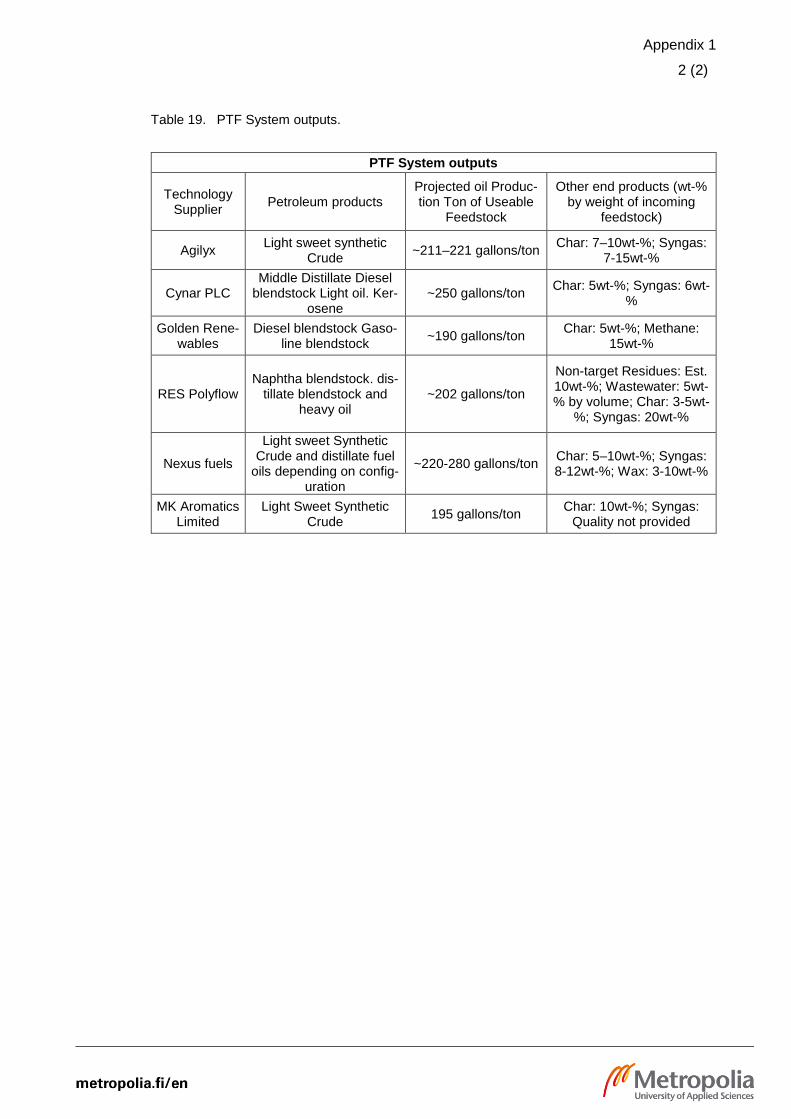
Appendix 1
2 (2)
Table 19. PTF System outputs.
PTF System outputs
Technology Supplier
Petroleum products Projected oil Produc-tion Ton of Useable
Feedstock
Other end products (wt-% by weight of incoming
feedstock)
Agilyx Light sweet synthetic
Crude ~211–221 gallons/ton
Char: 7–10wt-%; Syngas: 7-15wt-%
Cynar PLC Middle Distillate Diesel
blendstock Light oil. Ker-osene
~250 gallons/ton Char: 5wt-%; Syngas: 6wt-
%
Golden Rene-wables
Diesel blendstock Gaso-line blendstock
~190 gallons/ton Char: 5wt-%; Methane:
15wt-%
RES Polyflow Naphtha blendstock. dis-
tillate blendstock and heavy oil
~202 gallons/ton
Non-target Residues: Est. 10wt-%; Wastewater: 5wt-% by volume; Char: 3-5wt-
%; Syngas: 20wt-%
Nexus fuels
Light sweet Synthetic Crude and distillate fuel
oils depending on config-uration
~220-280 gallons/ton Char: 5–10wt-%; Syngas: 8-12wt-%; Wax: 3-10wt-%
MK Aromatics Limited
Light Sweet Synthetic Crude
195 gallons/ton Char: 10wt-%; Syngas:
Quality not provided

Appendix 2
1 (8)
Appendix 2. Procedure for bench-scale fast-pyrolysis process (KILO, Plastic)
Starting the process
- Start by weighting the raw material to a bucket and pour it to the feeding tank. Re-
member to weigh the bucket. Start up the glycol cooling device as early as possible
since it cools down rather slowly.
- Calibrate the correct frequency for the feeding screw (Image 4, (2)).
Image 4. Panel for the feeding- and pushing screw, 1: Screw conveyer frequency 2: Feeding screw frequency.
- The raw material is run through the feeding screw for 15 minutes with the approxi-
mated frequency and then weighted. The weight and the frequency are linear com-
paring to each other so the desired frequency can be calculated by that way. Adjust
the frequency correctly and check it by running the raw material again for 15 min
and then by weighting it. Use a bucket, put it on feeding tank’s hook, tare it and add
the material back to the feeding tank after running it.
- After the feeding screw frequency is calibrated, check whether the gas bag is
needed or not for the experiment. Next, the comparison gases are run through gas
1 2

Appendix 2
2 (8)
chromatograph (GC) (Image 5). The GC should be warmed approximately 10-15
minutes before the run. For plastic Run, 1, 3, 4 and 5 labeled comparison gas con-
tainers are run through GC. Remember to use the correct method when calibrating
the GC. The methods are named as: “KILO Kalibrointi_LV (number)”. Choose the
correct number for each sample.
Image 5. Gas chromatograph.
- Ready the raw material by weighting it, this marks the starting balance for the ex-
periment.
- Put acetone in to the cooling tanks (numbered as 4 and 5 in Image 6), around 0.5
liters for each tank. Acetone improves the heat transfer.
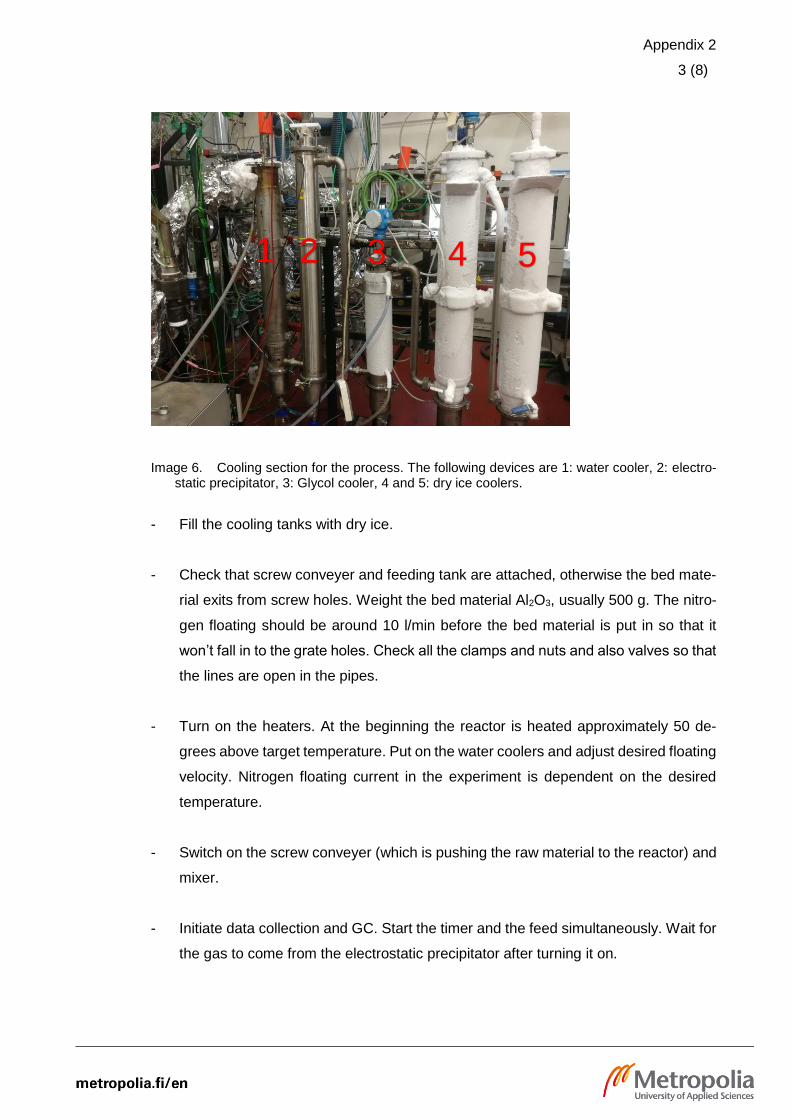
Appendix 2
3 (8)
Image 6. Cooling section for the process. The following devices are 1: water cooler, 2: electro-static precipitator, 3: Glycol cooler, 4 and 5: dry ice coolers.
- Fill the cooling tanks with dry ice.
- Check that screw conveyer and feeding tank are attached, otherwise the bed mate-
rial exits from screw holes. Weight the bed material Al2O3, usually 500 g. The nitro-
gen floating should be around 10 l/min before the bed material is put in so that it
won’t fall in to the grate holes. Check all the clamps and nuts and also valves so that
the lines are open in the pipes.
- Turn on the heaters. At the beginning the reactor is heated approximately 50 de-
grees above target temperature. Put on the water coolers and adjust desired floating
velocity. Nitrogen floating current in the experiment is dependent on the desired
temperature.
- Switch on the screw conveyer (which is pushing the raw material to the reactor) and
mixer.
- Initiate data collection and GC. Start the timer and the feed simultaneously. Wait for
the gas to come from the electrostatic precipitator after turning it on.
3 2 4 5 1
Appendix 2
4 (8)
- Always check that there is no smoke, leaks or unusual noises coming from the pro-
cess.
- Note that the cyclones does not have to be cleaned during the pure plastic run since
the plastic does not form any ash but when the plastic waste is ran, the cyclones
must be empties after around an hour from the start.
Operating the process
- During the short experiment run (usually 3 hours), the GC gas sample is taken twice.
With longer runs more samples may be taken.
- The temperature is adjusted mainly with the “1-KG Arinan laippa” controller 2 on the
panel (Red marked rectangle in Image 7).
Image 7. Temperature control panel.
Other controllers is used for fine-tuning the temperature in the process (Image 8).

Appendix 2
5 (8)
Image 8. Temperature control panel.
- Add steadily dry ice to cooling tanks so that they are always filled up. Every so often
open the sample valves.
Note: Sudden pressure increase could indicate to clogging that is formed from the wax.
Careful hitting with a hammer to the pipeline could unclog the pipes. Temperature rise
may refer that feedstock is not entering to reactor. If this happens, mix the feeding tank
with a stick or hit the container carefully with a hammer.
Shutting down the process
- Switch off the stopwatch, feeding screw and mixer.
- Turn off all the heaters. Glycol- and GC coolers and GC pump can be turned off at
this point.
- Let the screw conveyer be on couple of minutes before it is turning it off so that all
material is removed from the screw.
Appendix 2
6 (8)
- Wait for the GC to finish the cycle and stop the program. Turn off the GC pump. Put
GC to sleeping mode (GC detect off mode).
- Switch all the valves towards the combustion pipeline (Image 9) and close down the
valves that leads to the product line (Image 10).
Image 9. Combustion pipeline.
Image 10. Product pipeline valves.

Appendix 2
7 (8)
- Let the cooling water to cool down below 100 degrees before turning the taps off
(Image 11).
Image 11. Water cooler valves.
- Feeding tank can be detached now and the plug put to seal the entry. Start emptying
the feeding tank to a bucket. The feeding screw frequency can be raised to 50-60
Hz. Decrease the nitrogen flow rate to 10 l/min. Shut down data collect. Open all
sample valves.
Cleaning the process
Note: remember to the clean air masks during the entire cleaning process.
- Glass wools are weighted as soon as possible after the experiment. Remove lids
from the dry ice coolers and take off the glass wools. Bag the glass wools and weigh
them, remember to also weigh the bag.
- The screw conveyer is cleaned right after the detachment, when the plastic is still
warm. Peel off the melted plastic from the screw and use wire brush to clean all the
remainders from the screw. Remember to weigh the remainders for the mass bal-
ance.

Appendix 2
8 (8)
- Detach all the lids, sample collection vessels and sample bottles. Weigh the sample
collection vessels and bottles.
- Label plastic boxes correctly and collect all the wax from the vessels to a box.
- Clean all the collection vessels.
- Scrap all the remainder wax from the tubes to a bucked that is pre-weighted. Collect
the wax to a plastic box.
- Detach all the pipes, weigh them and clean.
- Drain the acetone from the dry ice coolers in to a bucket.
- Empty the cyclones, weigh them and bag them to a plastic box.
- When the feeding tank is emptied, vacuum the remainders to a bag, remember to
weigh the bag beforehand.
- When the reactor is cooled down, vacuum the bed material to a bag, remember to
weigh the bag. This is usually done the next day so that the reactor is not hot any-
more.
- When the bed material is vacuumed, start heating up the process. Put the air flow
on. Start with 20 l/min and when the heat is achieved, adjust the flow to the 40 l/min.
Let the burning continue for 15 min.
- Turn off the heaters and the air flow current.
- Reattach all the pipes, lids, vessels and bottles. Remember to weigh each and to
install the new glass wools before attaching the lids and vessels.
- The calibration of the GC can be done beforehand the next experiment.
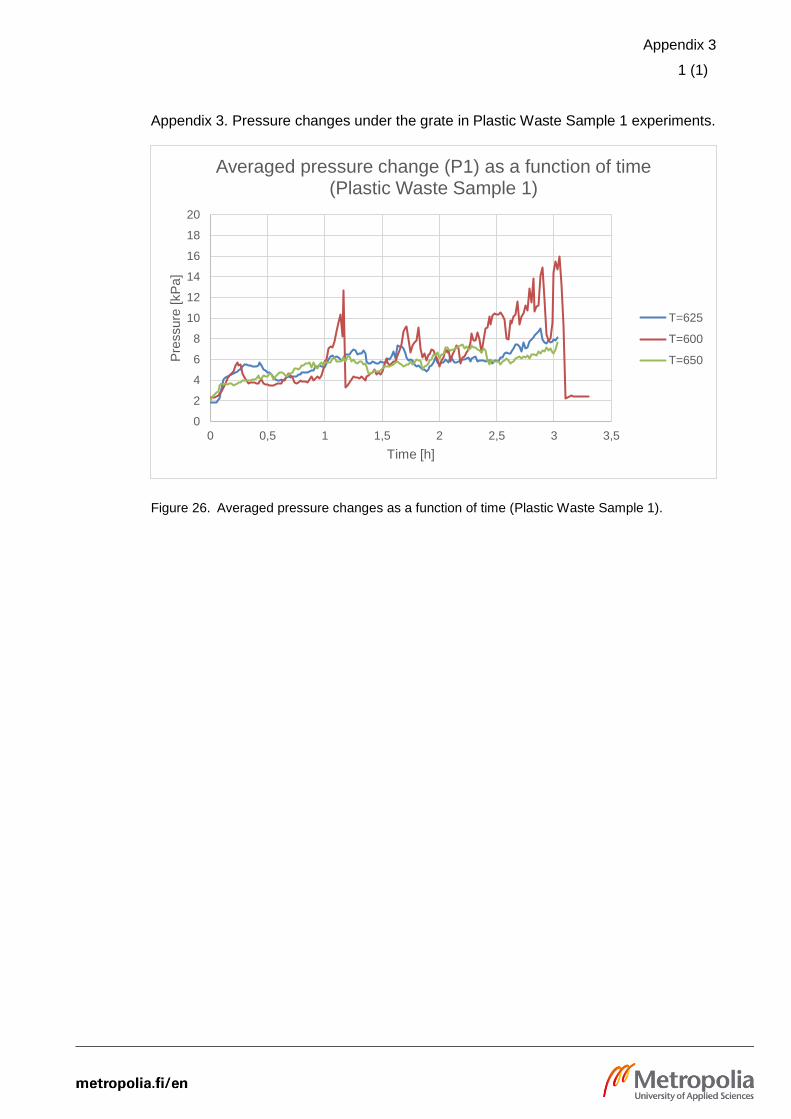
Appendix 3
1 (1)
Appendix 3. Pressure changes under the grate in Plastic Waste Sample 1 experiments.
Figure 26. Averaged pressure changes as a function of time (Plastic Waste Sample 1).
0
2
4
6
8
10
12
14
16
18
20
0 0,5 1 1,5 2 2,5 3 3,5
Pre
ssure
[kP
a]
Time [h]
Averaged pressure change (P1) as a function of time (Plastic Waste Sample 1)
T=625
T=600
T=650
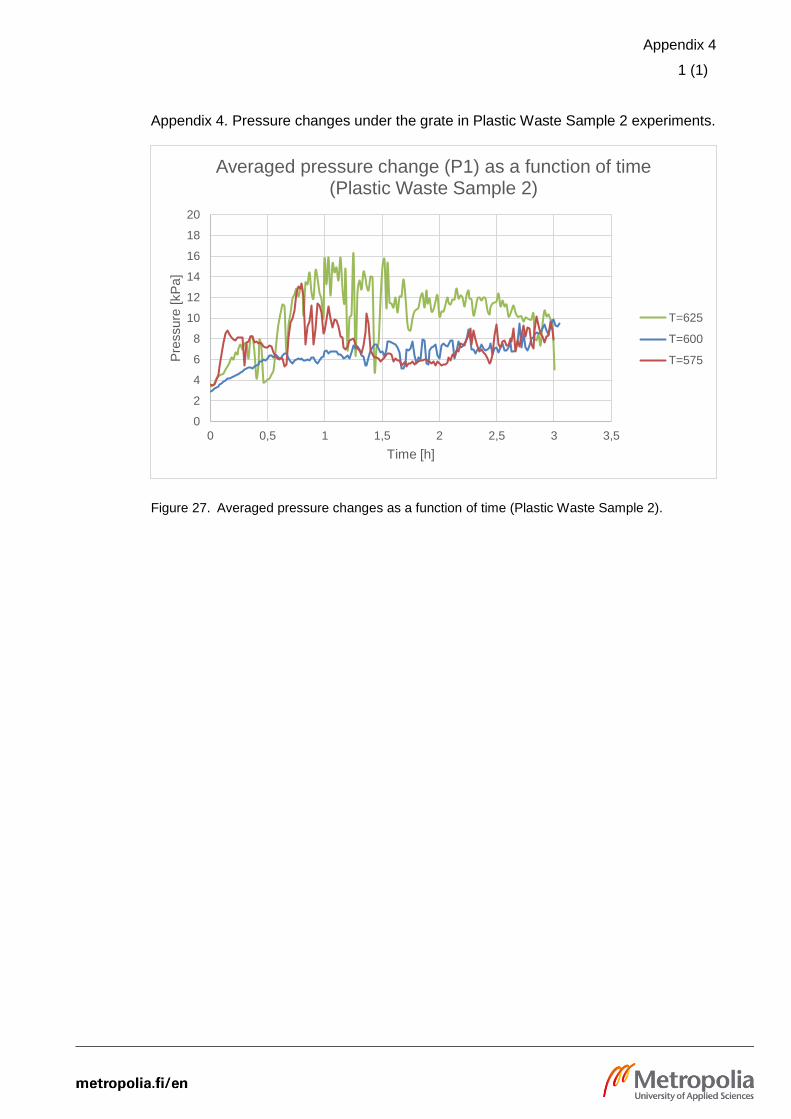
Appendix 4
1 (1)
Appendix 4. Pressure changes under the grate in Plastic Waste Sample 2 experiments.
Figure 27. Averaged pressure changes as a function of time (Plastic Waste Sample 2).
0
2
4
6
8
10
12
14
16
18
20
0 0,5 1 1,5 2 2,5 3 3,5
Pre
ssure
[kP
a]
Time [h]
Averaged pressure change (P1) as a function of time (Plastic Waste Sample 2)
T=625
T=600
T=575

Appendix 5
1 (1)
Appendix 5. Pressure changes under the grate in Plastic Waste Sample 3 experiments.
Figure 28. Averaged pressure changes as a function of time (Plastic Waste Sample 3).
0
2
4
6
8
10
12
14
16
18
20
0 0,5 1 1,5 2 2,5 3 3,5
Pre
ssure
[kP
a]
Time [h]
Averaged pressure change (P1) as a function of time (Plastic Waste Sample 3)
T=600
T=575
T=625