Embed Size (px)
Citation preview
Running head:
Lignin composition and structure in young and adult eucalypt plants
Corresponding author:
José C. del Río
Instituto de Recursos Naturales y Agrobiología de Sevilla (IRNAS), CSIC
PO Box 1052
E-41080 Seville, Spain
Phone: +34 954624711
Fax: +34 954624002
E-mail: [email protected]
Most appropriate journal research area:
Biochemical Processes and Macromolecular Structures
Plant Physiology Preview. Published on November 23, 2010, as DOI:10.1104/pp.110.167254
Copyright 2010 by the American Society of Plant Biologists
www.plantphysiol.orgon August 21, 2018 - Published by Downloaded from Copyright © 2010 American Society of Plant Biologists. All rights reserved.
2
Lignin composition and structure in young versus adult
Eucalyptus globulus plants
Jorge Rencoret1,3, Ana Gutiérrez1, Lidia Nieto2, J. Jiménez-Barbero2, Craig B. Faulds2,
Hoon Kim3, John Ralph3, Ángel T. Martínez2 and José C. del Río1
1 Instituto de Recursos Naturales y Agrobiología de Sevilla, Consejo Superior de
Investigaciones Científicas (CSIC), PO Box 1052, E-41080 Seville, Spain
2 Centro de Investigaciones Biológicas, Consejo Superior de Investigaciones Científicas
(CSIC), Ramiro de Maeztu 9, E-28040 Madrid, Spain
3 Departments of Biochemistry and Biological Systems Engineering, and the DOE Great
Lakes Bioenergy Research Center, University of Wisconsin, Madison, Wisconsin 53706,
USA
www.plantphysiol.orgon August 21, 2018 - Published by Downloaded from Copyright © 2010 American Society of Plant Biologists. All rights reserved.
3
Financial sources:
This study has been funded by the Spanish project AGL2005-01748, the CSIC projects
200640I039 and 201040E075, the EU-Projects BIORENEW (NMP2-CT-2006-026456),
WALLESTER (PIEF-GA-2009-235938) and LIGNODECO (KBBE-244362) and by the
DOE Great Lakes Bioenergy Research Center (DOE Office of Science BER DE-FC02-
07ER64494)
Corresponding author:
José C. del Río
E-mail: [email protected]
www.plantphysiol.orgon August 21, 2018 - Published by Downloaded from Copyright © 2010 American Society of Plant Biologists. All rights reserved.
4
Lignin changes during plant growth were investigated in a selected Eucalyptus globulus
clone. The lignin composition and structure were studied “in situ” by a new procedure
enabling the acquisition of 2D-NMR spectra on wood gels formed in the NMR tube, as well
as by analytical pyrolysis (Py-GC/MS). In addition, milled-wood lignins were isolated and
analyzed by 2D-NMR, Py-GC/MS, and thioacidolysis. The data indicated that p-
hydroxyphenyl (H) and guaiacyl (G) units are deposited at the earlier stages, whereas the
woods are enriched in syringyl (S) lignin during late lignification. Wood 2D-NMR showed
that β-O-4′ and resinol linkages were predominant in the eucalypt lignin, whereas other
substructures were present in much lower amounts. Interestingly, open β-1′ structures could
be detected in the isolated lignins. Phenylcoumarans and cinnamyl end-groups were depleted
with age, while spirodienone abundance increased, and the main substructures (β-O-4′ and
resinols) were scarcely modified. Thioacidolysis revealed a higher predominance of S units in
the ether-linked lignin than in the total lignin and, in agreement with NMR, also indicated that
resinols are the most important non-ether linkages. Dimer analysis showed that most of the
resinol-type structures comprised two S units (syringaresinol), the crossed G-S resinol
appearing as a minor substructure and pinoresinol being totally absent. Changes in
hemicelluloses were also shown by the 2D-NMR spectra of the wood gels, without
polysaccharide isolation. These include decreases of methyl galacturonosyl, arabinosyl and
galactosyl (anomeric) signals, assigned to pectin and related neutral polysaccharides, and
increases of xylosyl (which are ~50% acetylated) and 4-O-methylglucuronosyl signals.
Keywords: Eucalyptus globulus; Lignification; Milled-wood lignin (MWL); Pyrolysis-
GC/MS; 2D-NMR; HSQC; Gel-state NMR, Thioacidolysis; β-O-4′, β-β′ units.
www.plantphysiol.orgon August 21, 2018 - Published by Downloaded from Copyright © 2010 American Society of Plant Biologists. All rights reserved.
5
Plant cell-walls are composed mainly of three structural polymers, the carbohydrates
cellulose and hemicelluloses, and the aromatic polymer lignin. The lignin polymer provides
mechanical support to the plant. In addition, it waterproofs the cell-wall, enabling transport of
water and solutes through the vascular system, and plays a role in protecting plants against
pathogens. Lignin is a complex polymer synthesized mainly from three hydroxycinnamyl
alcohol differing in their degree of methoxylation: p-coumaryl, coniferyl and sinapyl alcohols
(Higuchi, 1997; Boerjan et al., 2003; Ralph et al., 2004a). Each of these monolignols gives
rise to a different type of lignin unit called H (p-hydroxyphenyl), G (guaiacyl) and S
(syringyl) units, respectively, when incorporated into the polymer. The amount and
composition of lignins vary among taxa, cell types, and individual cell-wall layers, and also
with environmental conditions. Softwood lignin consists almost exclusively of G-type lignin,
while hardwood lignin also consists of S units (H units being minor components). After their
synthesis, the lignin monomers are transported to the cell-wall, where they are polymerized in
a combinatorial fashion by free radical coupling mechanisms in a reaction mediated by
peroxidases and/or laccases, generating a variety of structures and linkages within the
polymer (Ralph et al., 2004a; Boerjan et al., 2003). Wood (secondary xylem) is produced
seasonally at the periphery of the trunk by the vascular cambium (Déjardin et al., 2010).
Lignin deposition is one of the final stages of xylem cell differentiation and mainly takes
place during secondary thickening of the cell-wall. Lignification starts in the middle lamella
and cell corners, and proceeds towards the lumen, filling up pores in the already deposited
polysaccharide network (Boerjan et al, 2003; Donaldson, 2001). The relative abundance of
the different linkages formed depends on the relative contribution of the particular monomers
to the polymerization process, as well as on steric hindrances and chemical interactions in the
growing wall. Therefore, the differences in timing of monolignol deposition, and the changes
in cell-wall ultrastructure during growth would regulate lignin composition and structure
during lignification.
A main challenge in elucidating the structure of lignins is in obtaining high yield isolation
from wood in a chemically unaltered form (and the same applies to hemicellulose
polysaccharides). Several lignin isolation procedures have been developed, but it is well
recognized that the different procedures, including the reference milled-wood lignin (MWL),
yield only a part of the native lignin in wood, and may not be representative of the whole
lignin. Indeed, it has also been demonstrated that MWL can undergo some structural
modifications during isolation, especially during the milling process, and often contains some
www.plantphysiol.orgon August 21, 2018 - Published by Downloaded from Copyright © 2010 American Society of Plant Biologists. All rights reserved.
6
amount of “contaminating” compounds (such as lignin-linked carbohydrates) (Fujimoto et
al., 2005; Hu et al., 2006; Guerra et al., 2006; Balakshin et al., 2008). Because lignin is
intimately interpenetrating the other major components (cellulose and hemicelluloses), it is
obvious that its truly native form can only be studied by analytical methods applicable
directly on the whole plant material. For this purpose, in this paper, the wood samples were
analyzed “in situ” by two-dimensional nuclear magnetic resonance (2D-NMR) spectroscopy
and pyrolysis-gas chromatography/mass spectrometry (Py-GC/MS). The use of these
techniques avoids isolation procedures which may lead to partial or modified polymer
extraction. For “in situ” NMR analyses, a recent approach has been developed that consists of
swelling finely ground plant material in deuterated dimethylsulfoxide (DMSO-d6) (Kim et al.,
2008; Rencoret et al., 2009) or DMSO-d6/pyridine-d5 (4:1) (Kim and Ralph, 2010) and
forming a gel directly in the NMR tube, which is readily amenable to NMR analysis. HSQC
(heteronuclear single quantum correlation) NMR of these gels has been shown to be an
efficient method for the rapid "in situ" analysis of lignin in plants, without the need of prior
isolation. The method requires only low amounts of sample and can be used for rapid
characterization of the major structural features of plant lignins (i.e. interunit linkages and
H:G:S composition), also providing information on the hemicellulose polysaccharides. Py-
GC/MS is another powerful tool for the “in situ” characterization of plant constituents,
especially lignin, (Ralph and Hatfield, 1991; Rodrigues et al., 1999; del Río et al, 2005;
Rencoret et al., 2007). Wood lignin is pyrolyzed to produce a mixture of relatively simple
phenols, which result from cleavage of ether and certain C-C linkages. These phenols retain
their substitution patterns from the lignin polymer, and it is thus possible to identify
compounds from the H, G and S lignin units.
The aim of this paper is to elucidate the changes produced in the composition and structure
of the lignin in eucalypt wood with maturation, and includes analyses of young plants and
adult trees. This knowledge is important not only for providing additional insight into the
mechanisms of lignin deposition, but also for the industrial processing of wood for pulp,
chemicals or biofuel production, as the lignin composition and structure greatly influence the
delignification reactions (González-Vila et al., 1999; del Río et al., 2005). For this purpose,
samples of Eucalyptus globulus wood from the same clone (to avoid genetic variations within
species) were collected at different stages of growth (1 month, 18 months and 9 years) and the
composition and structure of their lignins were thoroughly investigated. A combination of the
above-mentioned 2D-NMR and Py-GC/MS of whole wood samples was used for the “in situ”
study of lignin changes. In order to obtain further insights into their structures and compare
www.plantphysiol.orgon August 21, 2018 - Published by Downloaded from Copyright © 2010 American Society of Plant Biologists. All rights reserved.
7
with the results from the “in situ” analyses, MWL was also isolated from the different woods
and analyzed by NMR, pyrolysis, and thioacidolysis. As far as we know, this is the first report
describing “in situ” structural analyses of wood lignin during tree growth using a combination
of 2D-NMR and other techniques.
RESULTS AND DISCUSSION
After a general analysis of wood composition in E. globulus plants of different ages (young
and adult trees from a clonal plantation), the changes in lignin (and hemicellulose) during
growth were analyzed “in situ” by a combination Py-GC/MS and 2D-NMR of whole wood,
and the results were compared (and complemented) with those obtained from lignins (MWL)
isolated from the same samples.
Wood composition during eucalypt growth
The contents of the main wood constituents – i.e., acetone extractives, water-soluble
material, Klason lignin, acid-soluble lignin, crystalline cellulose, amorphous glucan, xylan,
arabinan, galactan, mannan, rhamnan, fucan, total uronic acids and ashes – in the selected E.
globulus clone at different stages of growth are summarized in Table 1. The total lignin
content (Klason lignin plus acid soluble lignin) increased during growth (from 16 % in the 1-
month-old sample to 25% in the 9-year-old wood) whereas the content of other constituents
(namely acetone extractives, water-soluble material and ashes) decreased with maturity.
Interestingly, there is also a great variation in the composition of polysaccharides (from
neutral sugar analysis) during maturation, with a depletion of arabinose, galactose and
mannose, and a progressive enrichment of xylose. The amount of crystalline cellulose has the
highest content (37%) after 18 months, while that of amorphous glucan was lower and
showed a progressive increase during growth. Finally, the uronic acids content was the
highest after 1 month (7%) and showed only a moderate decrease during growth. Variations
in the uronic acid nature during growth are discussed after the NMR analyses below.
Py-GC/MS of whole woods and their isolated lignins
Py-GC/MS, although not a fully quantitative technique, has been successfully used to
analyze the relative H:G:S composition of lignin in different hardwoods, including eucalypt
wood (del Río et al., 2005, Rodrigues et al., 1999, Yokoi et al., 1999, 2001; Rencoret et al.,
www.plantphysiol.orgon August 21, 2018 - Published by Downloaded from Copyright © 2010 American Society of Plant Biologists. All rights reserved.
8
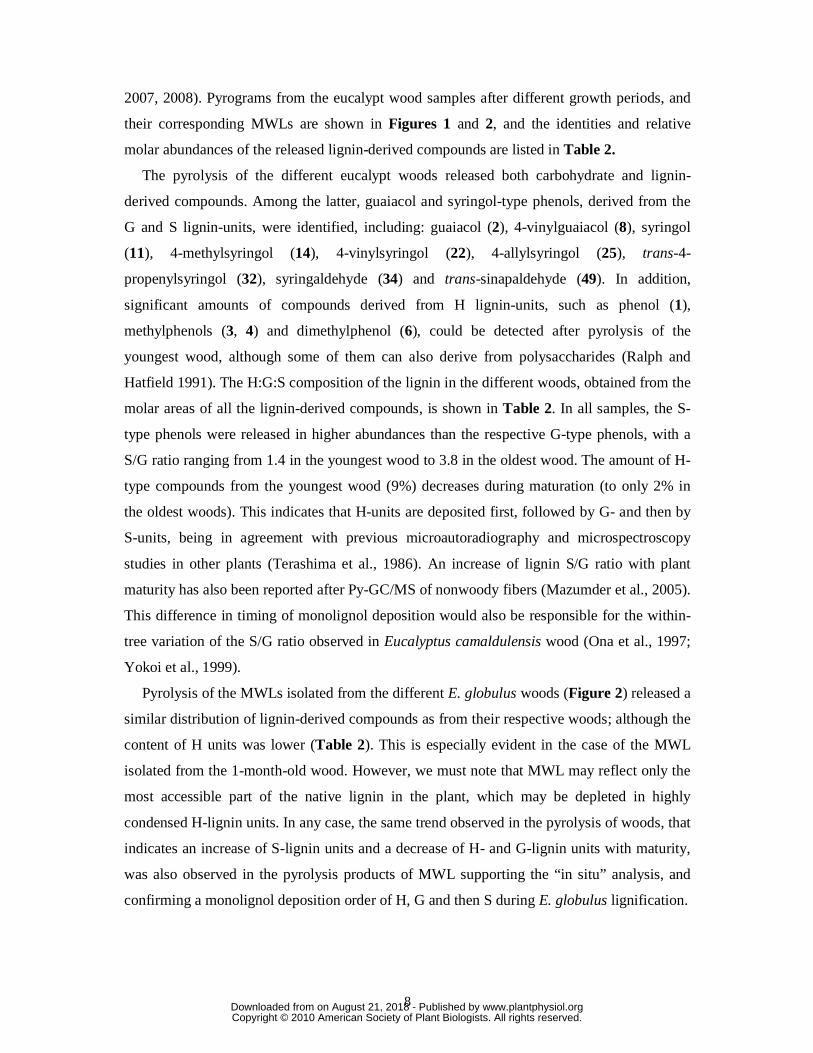
2007, 2008). Pyrograms from the eucalypt wood samples after different growth periods, and
their corresponding MWLs are shown in Figures 1 and 2, and the identities and relative
molar abundances of the released lignin-derived compounds are listed in Table 2.
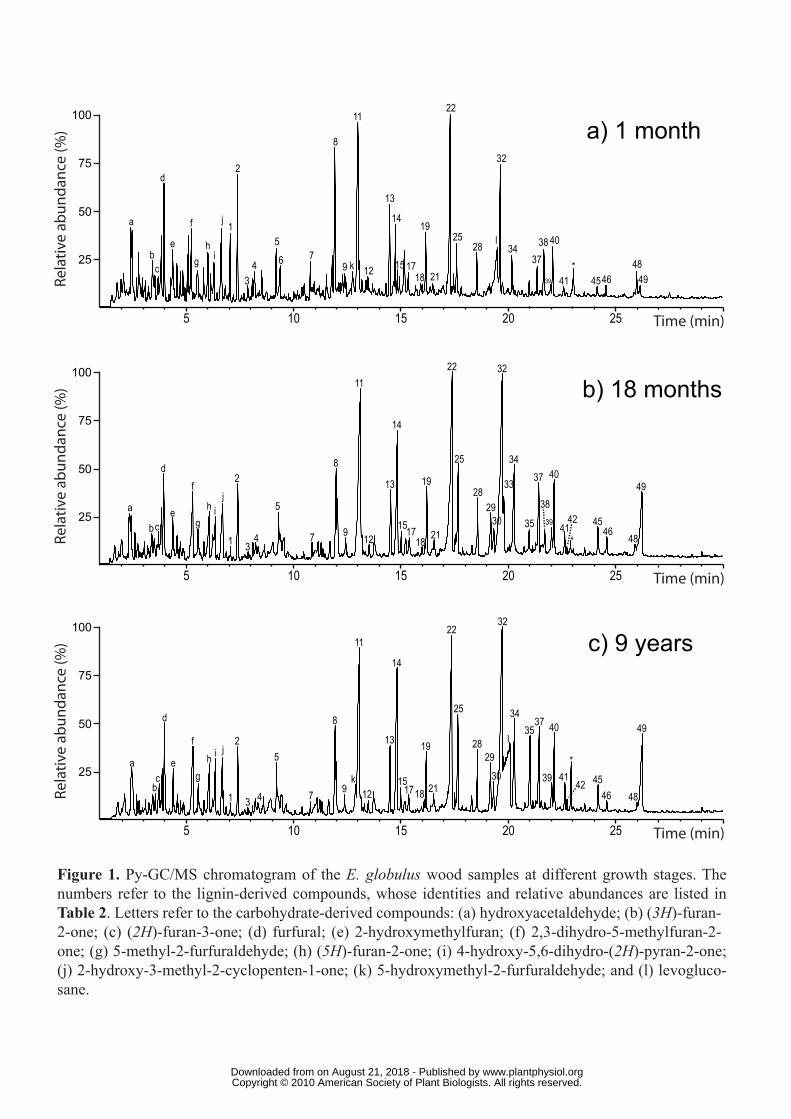
The pyrolysis of the different eucalypt woods released both carbohydrate and lignin-
derived compounds. Among the latter, guaiacol and syringol-type phenols, derived from the
G and S lignin-units, were identified, including: guaiacol (2), 4-vinylguaiacol (8), syringol
(11), 4-methylsyringol (14), 4-vinylsyringol (22), 4-allylsyringol (25), trans-4-
propenylsyringol (32), syringaldehyde (34) and trans-sinapaldehyde (49). In addition,
significant amounts of compounds derived from H lignin-units, such as phenol (1),
methylphenols (3, 4) and dimethylphenol (6), could be detected after pyrolysis of the
youngest wood, although some of them can also derive from polysaccharides (Ralph and
Hatfield 1991). The H:G:S composition of the lignin in the different woods, obtained from the
molar areas of all the lignin-derived compounds, is shown in Table 2. In all samples, the S-
type phenols were released in higher abundances than the respective G-type phenols, with a
S/G ratio ranging from 1.4 in the youngest wood to 3.8 in the oldest wood. The amount of H-
type compounds from the youngest wood (9%) decreases during maturation (to only 2% in
the oldest woods). This indicates that H-units are deposited first, followed by G- and then by
S-units, being in agreement with previous microautoradiography and microspectroscopy
studies in other plants (Terashima et al., 1986). An increase of lignin S/G ratio with plant
maturity has also been reported after Py-GC/MS of nonwoody fibers (Mazumder et al., 2005).
This difference in timing of monolignol deposition would also be responsible for the within-
tree variation of the S/G ratio observed in Eucalyptus camaldulensis wood (Ona et al., 1997;
Yokoi et al., 1999).
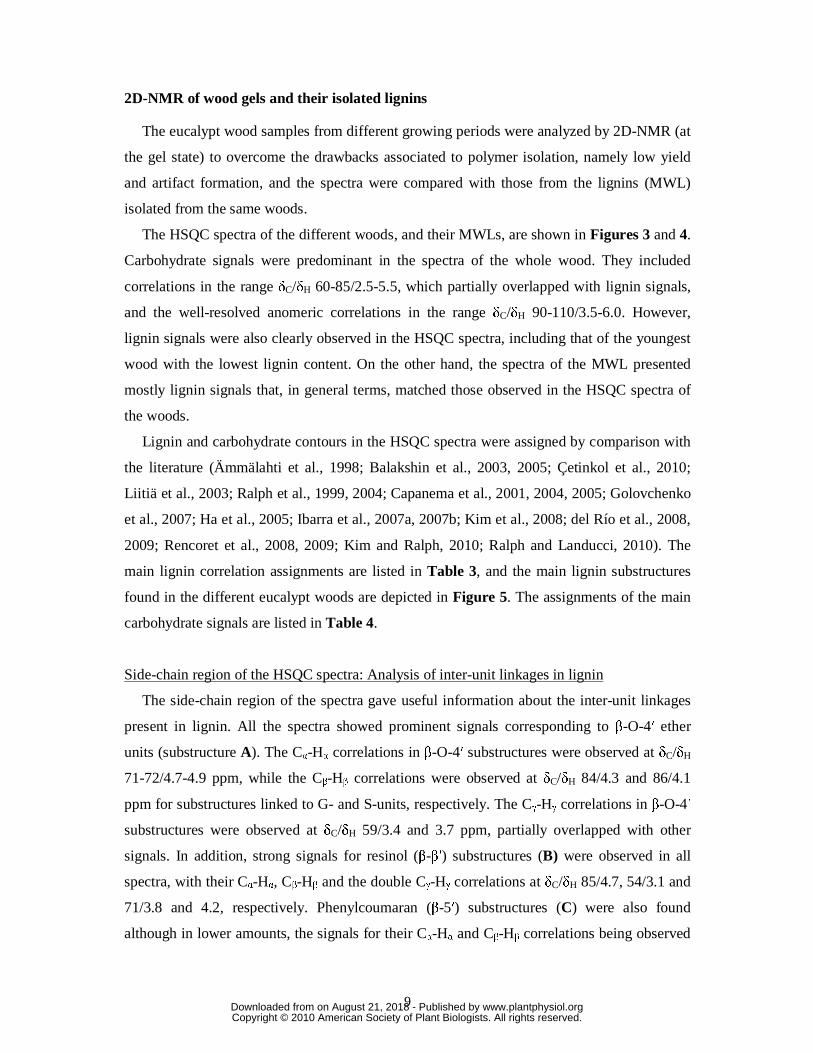
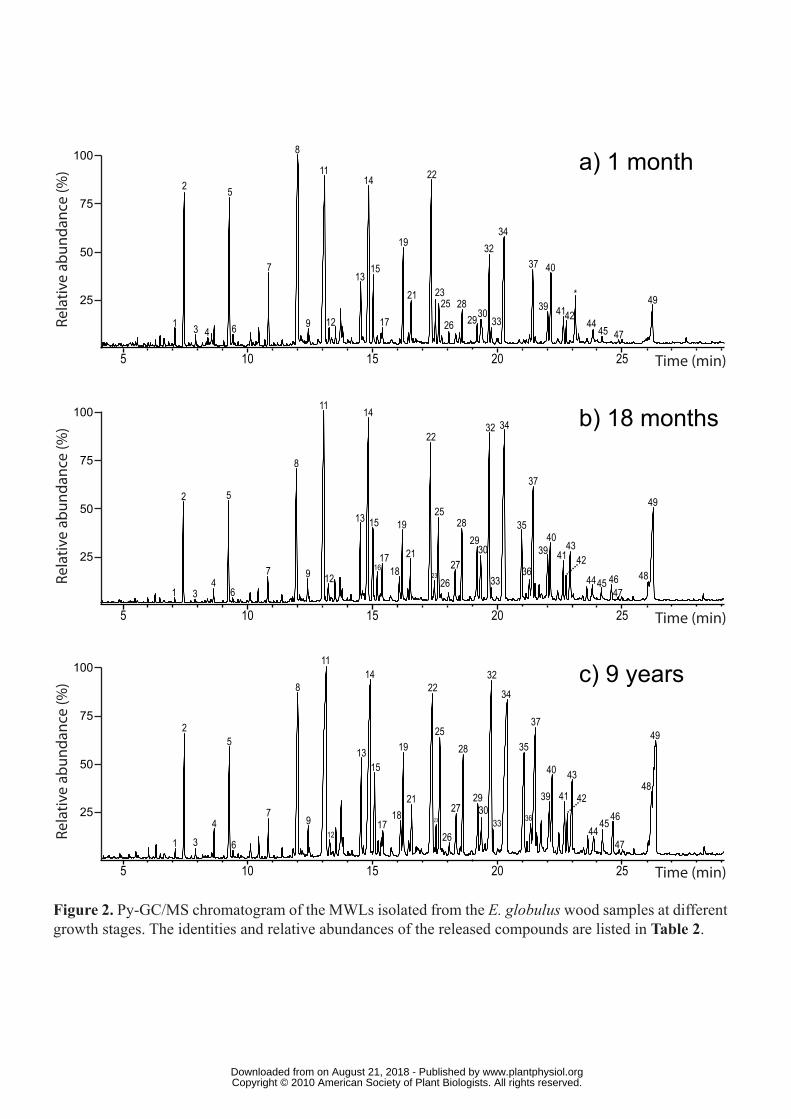
Pyrolysis of the MWLs isolated from the different E. globulus woods (Figure 2) released a
similar distribution of lignin-derived compounds as from their respective woods; although the
content of H units was lower (Table 2). This is especially evident in the case of the MWL
isolated from the 1-month-old wood. However, we must note that MWL may reflect only the
most accessible part of the native lignin in the plant, which may be depleted in highly
condensed H-lignin units. In any case, the same trend observed in the pyrolysis of woods, that
indicates an increase of S-lignin units and a decrease of H- and G-lignin units with maturity,
was also observed in the pyrolysis products of MWL supporting the “in situ” analysis, and
confirming a monolignol deposition order of H, G and then S during E. globulus lignification.
www.plantphysiol.orgon August 21, 2018 - Published by Downloaded from Copyright © 2010 American Society of Plant Biologists. All rights reserved.
9
2D-NMR of wood gels and their isolated lignins
The eucalypt wood samples from different growing periods were analyzed by 2D-NMR (at
the gel state) to overcome the drawbacks associated to polymer isolation, namely low yield
and artifact formation, and the spectra were compared with those from the lignins (MWL)
isolated from the same woods.
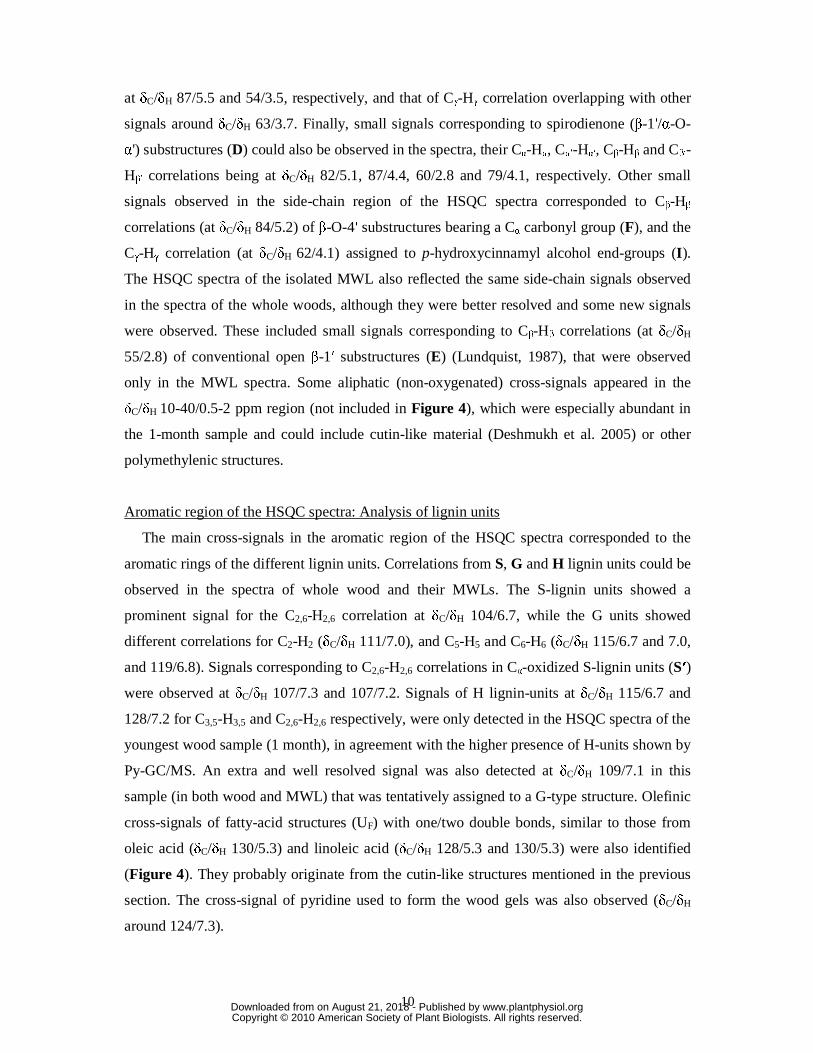
The HSQC spectra of the different woods, and their MWLs, are shown in Figures 3 and 4.
Carbohydrate signals were predominant in the spectra of the whole wood. They included
correlations in the range δC/δH 60-85/2.5-5.5, which partially overlapped with lignin signals,
and the well-resolved anomeric correlations in the range δC/δH 90-110/3.5-6.0. However,
lignin signals were also clearly observed in the HSQC spectra, including that of the youngest
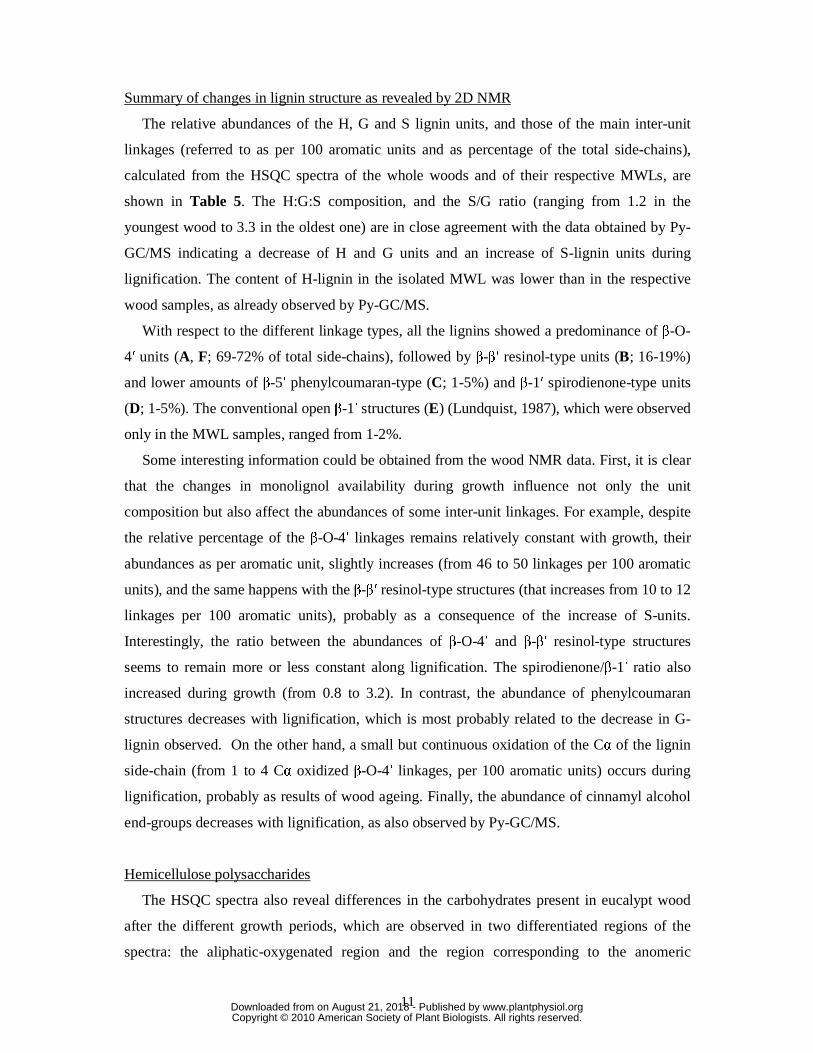
wood with the lowest lignin content. On the other hand, the spectra of the MWL presented
mostly lignin signals that, in general terms, matched those observed in the HSQC spectra of
the woods.
Lignin and carbohydrate contours in the HSQC spectra were assigned by comparison with
the literature (Ämmälahti et al., 1998; Balakshin et al., 2003, 2005; Çetinkol et al., 2010;
Liitiä et al., 2003; Ralph et al., 1999, 2004; Capanema et al., 2001, 2004, 2005; Golovchenko
et al., 2007; Ha et al., 2005; Ibarra et al., 2007a, 2007b; Kim et al., 2008; del Río et al., 2008,
2009; Rencoret et al., 2008, 2009; Kim and Ralph, 2010; Ralph and Landucci, 2010). The
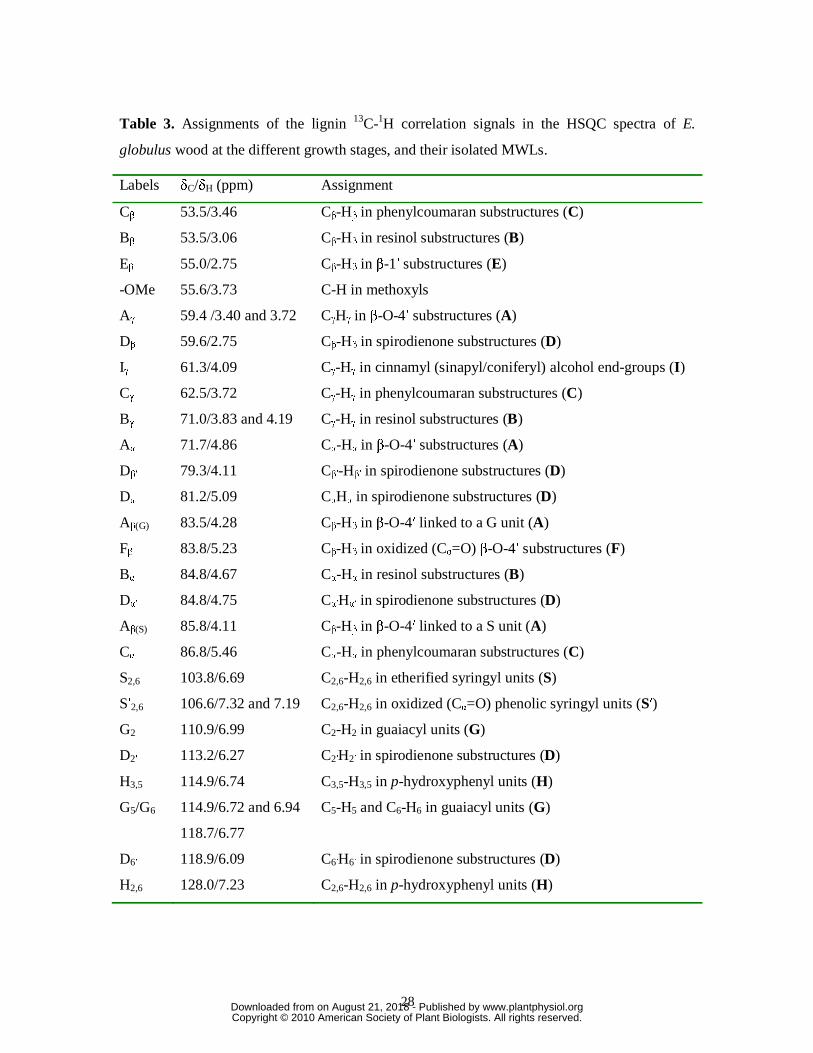
main lignin correlation assignments are listed in Table 3, and the main lignin substructures
found in the different eucalypt woods are depicted in Figure 5. The assignments of the main
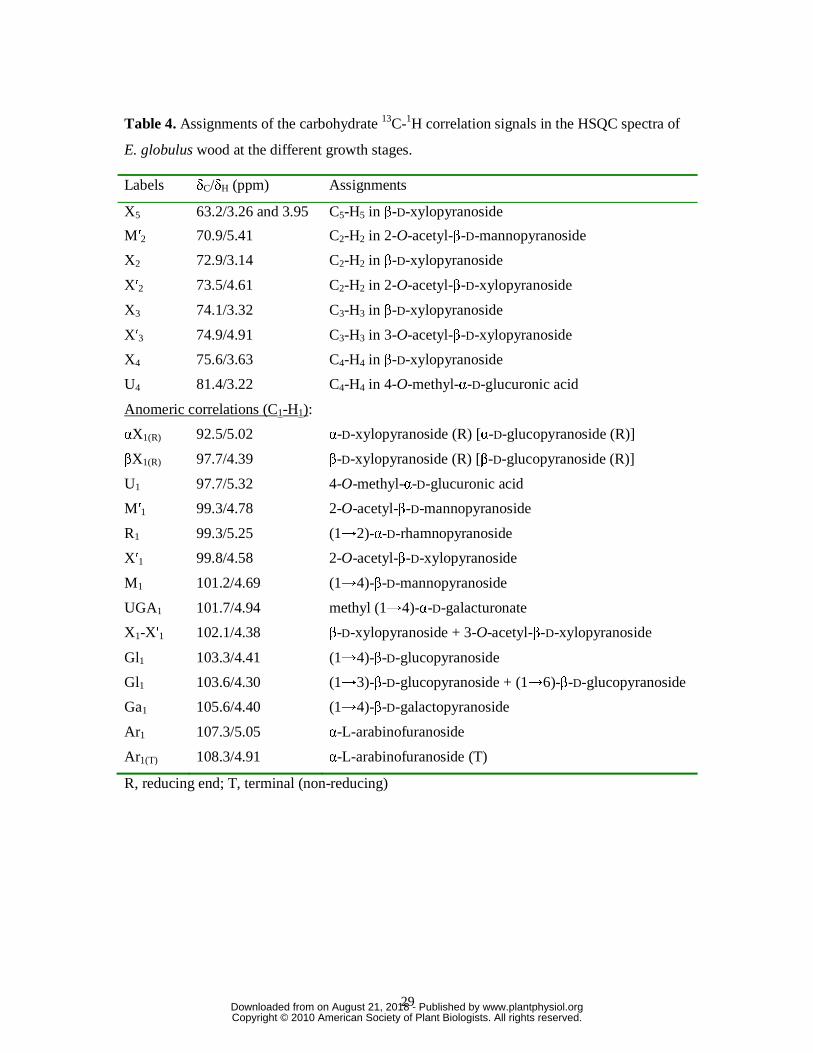
carbohydrate signals are listed in Table 4.
Side-chain region of the HSQC spectra: Analysis of inter-unit linkages in lignin
The side-chain region of the spectra gave useful information about the inter-unit linkages
present in lignin. All the spectra showed prominent signals corresponding to β-O-4′ ether
units (substructure A). The Cα-Hα correlations in β-O-4′ substructures were observed at δC/δH
71-72/4.7-4.9 ppm, while the Cβ-Hβ correlations were observed at δC/δH 84/4.3 and 86/4.1
ppm for substructures linked to G- and S-units, respectively. The Cγ-Hγ correlations in β-O-4′
substructures were observed at δC/δH 59/3.4 and 3.7 ppm, partially overlapped with other
signals. In addition, strong signals for resinol (β-β′) substructures (B) were observed in all
spectra, with their Cα-Hα, Cβ-Hβ and the double Cγ-Hγ correlations at δC/δH 85/4.7, 54/3.1 and
71/3.8 and 4.2, respectively. Phenylcoumaran (β-5′) substructures (C) were also found
although in lower amounts, the signals for their Cα-Hα and Cβ-Hβ correlations being observed
www.plantphysiol.orgon August 21, 2018 - Published by Downloaded from Copyright © 2010 American Society of Plant Biologists. All rights reserved.
10
at δC/δH 87/5.5 and 54/3.5, respectively, and that of Cγ-Hγ correlation overlapping with other
signals around δC/δH 63/3.7. Finally, small signals corresponding to spirodienone (β-1′/α-O-
α') substructures (D) could also be observed in the spectra, their Cα-Hα, Cα′-Hα′, Cβ-Hβ and Cβ′-
Hβ′ correlations being at δC/δH 82/5.1, 87/4.4, 60/2.8 and 79/4.1, respectively. Other small
signals observed in the side-chain region of the HSQC spectra corresponded to Cβ-Hβ
correlations (at δC/δH 84/5.2) of β-O-4′ substructures bearing a Cα carbonyl group (F), and the
Cγ-Hγ correlation (at δC/δH 62/4.1) assigned to p-hydroxycinnamyl alcohol end-groups (I).
The HSQC spectra of the isolated MWL also reflected the same side-chain signals observed
in the spectra of the whole woods, although they were better resolved and some new signals
were observed. These included small signals corresponding to Cβ-Hβ correlations (at δC/δH
55/2.8) of conventional open β-1′ substructures (E) (Lundquist, 1987), that were observed
only in the MWL spectra. Some aliphatic (non-oxygenated) cross-signals appeared in the
δC/δH 10-40/0.5-2 ppm region (not included in Figure 4), which were especially abundant in
the 1-month sample and could include cutin-like material (Deshmukh et al. 2005) or other
polymethylenic structures.
Aromatic region of the HSQC spectra: Analysis of lignin units
The main cross-signals in the aromatic region of the HSQC spectra corresponded to the
aromatic rings of the different lignin units. Correlations from S, G and H lignin units could be
observed in the spectra of whole wood and their MWLs. The S-lignin units showed a
prominent signal for the C2,6-H2,6 correlation at δC/δH 104/6.7, while the G units showed
different correlations for C2-H2 (δC/δH 111/7.0), and C5-H5 and C6-H6 (δC/δH 115/6.7 and 7.0,
and 119/6.8). Signals corresponding to C2,6-H2,6 correlations in Cα-oxidized S-lignin units (S′)
were observed at δC/δH 107/7.3 and 107/7.2. Signals of H lignin-units at δC/δH 115/6.7 and
128/7.2 for C3,5-H3,5 and C2,6-H2,6 respectively, were only detected in the HSQC spectra of the
youngest wood sample (1 month), in agreement with the higher presence of H-units shown by
Py-GC/MS. An extra and well resolved signal was also detected at δC/δH 109/7.1 in this
sample (in both wood and MWL) that was tentatively assigned to a G-type structure. Olefinic
cross-signals of fatty-acid structures (UF) with one/two double bonds, similar to those from
oleic acid (δC/δH 130/5.3) and linoleic acid (δC/δH 128/5.3 and 130/5.3) were also identified
(Figure 4). They probably originate from the cutin-like structures mentioned in the previous
section. The cross-signal of pyridine used to form the wood gels was also observed (δC/δH
around 124/7.3).
www.plantphysiol.orgon August 21, 2018 - Published by Downloaded from Copyright © 2010 American Society of Plant Biologists. All rights reserved.
11
Summary of changes in lignin structure as revealed by 2D NMR
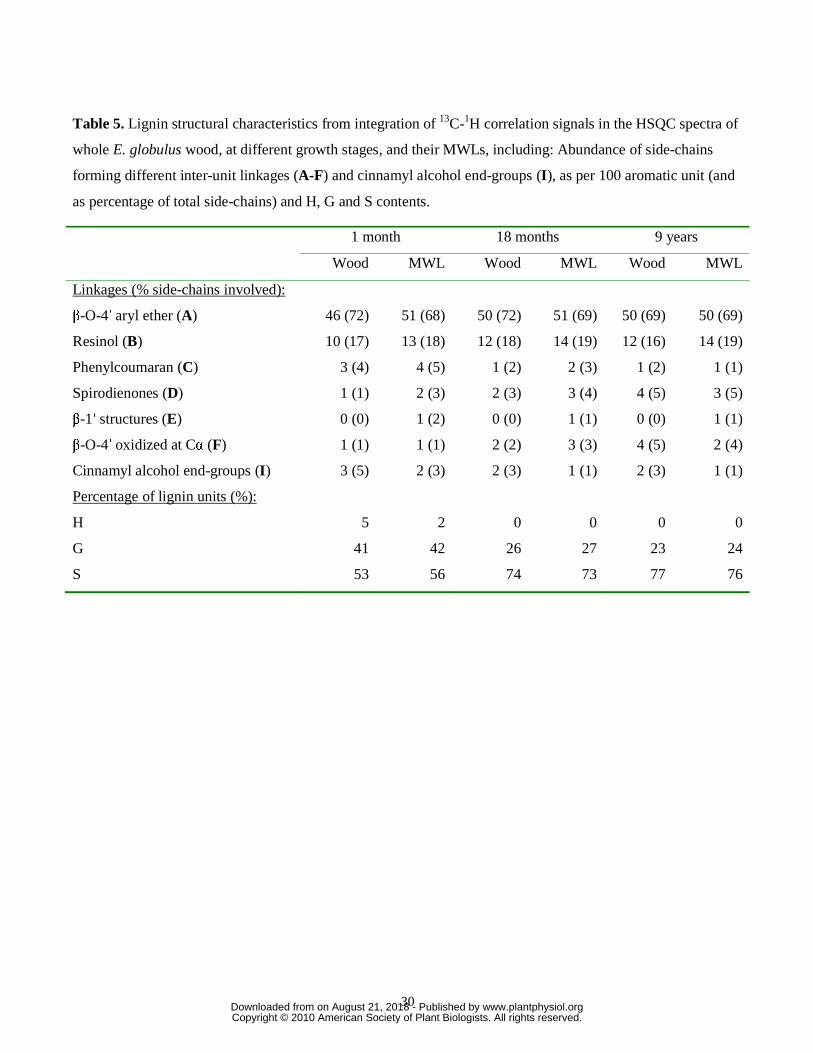
The relative abundances of the H, G and S lignin units, and those of the main inter-unit
linkages (referred to as per 100 aromatic units and as percentage of the total side-chains),
calculated from the HSQC spectra of the whole woods and of their respective MWLs, are
shown in Table 5. The H:G:S composition, and the S/G ratio (ranging from 1.2 in the
youngest wood to 3.3 in the oldest one) are in close agreement with the data obtained by Py-
GC/MS indicating a decrease of H and G units and an increase of S-lignin units during
lignification. The content of H-lignin in the isolated MWL was lower than in the respective
wood samples, as already observed by Py-GC/MS.
With respect to the different linkage types, all the lignins showed a predominance of β-O-
4′ units (A, F; 69-72% of total side-chains), followed by β-β′ resinol-type units (B; 16-19%)
and lower amounts of β-5′ phenylcoumaran-type (C; 1-5%) and β-1′ spirodienone-type units
(D; 1-5%). The conventional open β-1′ structures (E) (Lundquist, 1987), which were observed
only in the MWL samples, ranged from 1-2%.
Some interesting information could be obtained from the wood NMR data. First, it is clear
that the changes in monolignol availability during growth influence not only the unit
composition but also affect the abundances of some inter-unit linkages. For example, despite
the relative percentage of the β-O-4′ linkages remains relatively constant with growth, their
abundances as per aromatic unit, slightly increases (from 46 to 50 linkages per 100 aromatic
units), and the same happens with the β-β′ resinol-type structures (that increases from 10 to 12
linkages per 100 aromatic units), probably as a consequence of the increase of S-units.
Interestingly, the ratio between the abundances of β-O-4′ and β-β′ resinol-type structures
seems to remain more or less constant along lignification. The spirodienone/β-1′ ratio also
increased during growth (from 0.8 to 3.2). In contrast, the abundance of phenylcoumaran
structures decreases with lignification, which is most probably related to the decrease in G-
lignin observed. On the other hand, a small but continuous oxidation of the Cα of the lignin
side-chain (from 1 to 4 Cα oxidized β-O-4′ linkages, per 100 aromatic units) occurs during
lignification, probably as results of wood ageing. Finally, the abundance of cinnamyl alcohol
end-groups decreases with lignification, as also observed by Py-GC/MS.
Hemicellulose polysaccharides
The HSQC spectra also reveal differences in the carbohydrates present in eucalypt wood
after the different growth periods, which are observed in two differentiated regions of the
spectra: the aliphatic-oxygenated region and the region corresponding to the anomeric
www.plantphysiol.orgon August 21, 2018 - Published by Downloaded from Copyright © 2010 American Society of Plant Biologists. All rights reserved.
12
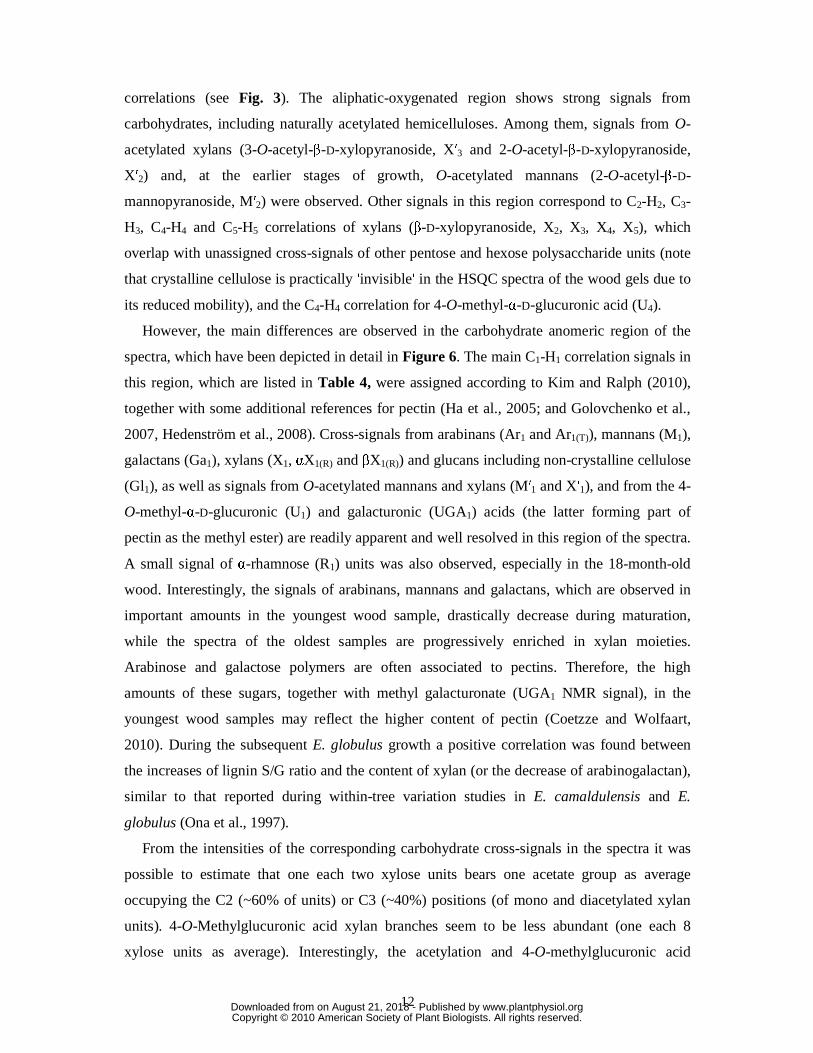
correlations (see Fig. 3). The aliphatic-oxygenated region shows strong signals from
carbohydrates, including naturally acetylated hemicelluloses. Among them, signals from O-
acetylated xylans (3-O-acetyl-β-D-xylopyranoside, X′3 and 2-O-acetyl-β-D-xylopyranoside,
X′2) and, at the earlier stages of growth, O-acetylated mannans (2-O-acetyl-β-D-
mannopyranoside, M′2) were observed. Other signals in this region correspond to C2-H2, C3-
H3, C4-H4 and C5-H5 correlations of xylans (β-D-xylopyranoside, X2, X3, X4, X5), which
overlap with unassigned cross-signals of other pentose and hexose polysaccharide units (note
that crystalline cellulose is practically ′invisible′ in the HSQC spectra of the wood gels due to
its reduced mobility), and the C4-H4 correlation for 4-O-methyl-α-D-glucuronic acid (U4).
However, the main differences are observed in the carbohydrate anomeric region of the
spectra, which have been depicted in detail in Figure 6. The main C1-H1 correlation signals in
this region, which are listed in Table 4, were assigned according to Kim and Ralph (2010),
together with some additional references for pectin (Ha et al., 2005; and Golovchenko et al.,
2007, Hedenström et al., 2008). Cross-signals from arabinans (Ar1 and Ar1(T)), mannans (M1),
galactans (Ga1), xylans (X1, αX1(R) and βX1(R)) and glucans including non-crystalline cellulose
(Gl1), as well as signals from O-acetylated mannans and xylans (M′1 and X′1), and from the 4-
O-methyl-α-D-glucuronic (U1) and galacturonic (UGA1) acids (the latter forming part of
pectin as the methyl ester) are readily apparent and well resolved in this region of the spectra.
A small signal of α-rhamnose (R1) units was also observed, especially in the 18-month-old
wood. Interestingly, the signals of arabinans, mannans and galactans, which are observed in
important amounts in the youngest wood sample, drastically decrease during maturation,
while the spectra of the oldest samples are progressively enriched in xylan moieties.
Arabinose and galactose polymers are often associated to pectins. Therefore, the high
amounts of these sugars, together with methyl galacturonate (UGA1 NMR signal), in the
youngest wood samples may reflect the higher content of pectin (Coetzze and Wolfaart,
2010). During the subsequent E. globulus growth a positive correlation was found between
the increases of lignin S/G ratio and the content of xylan (or the decrease of arabinogalactan),
similar to that reported during within-tree variation studies in E. camaldulensis and E.
globulus (Ona et al., 1997).
From the intensities of the corresponding carbohydrate cross-signals in the spectra it was
possible to estimate that one each two xylose units bears one acetate group as average
occupying the C2 (~60% of units) or C3 (~40%) positions (of mono and diacetylated xylan
units). 4-O-Methylglucuronic acid xylan branches seem to be less abundant (one each 8
xylose units as average). Interestingly, the acetylation and 4-O-methylglucuronic acid
www.plantphysiol.orgon August 21, 2018 - Published by Downloaded from Copyright © 2010 American Society of Plant Biologists. All rights reserved.
13
substitution degree in xylan remains constant during growth. These results basically agree
with studies on hemicelluloses (xylans and other polysaccharides) isolated from adult
eucalypt woods (Evtuguin et al., 2003; Lisboa et al., 2005; Shatalov et al., 1999). Additional
studies, required to complete the assignment of the HSQC cross-signals of carbohydrates in
the eucalypt wood gels, are outside the scope of the present paper. However, the “in situ”
analysis presented here provide a global picture on the composition of the hemicellulose
fraction in E. globulus wood and its variation during tree growth, without isolating the
individual polysaccharides.
Thioacidolysis of the isolated lignins
To obtain additional information about the units involved in different linkages of the lignin
structure, the MWLs isolated from the E. globulus woods at the different growth stages were
also studied by thioacidolysis. The degradation products were then subjected to a Raney-
nickel desulfurization and the products obtained were analyzed by GC/MS. The
chromatogram of the trimethylsilylated products of a representative eucalypt wood MWL
sample (from 1-month wood) is shown in Figure 7. The compounds were identified
according to previously reported mass spectra (Lapierre et al., 1991; Saito and Fukushima,
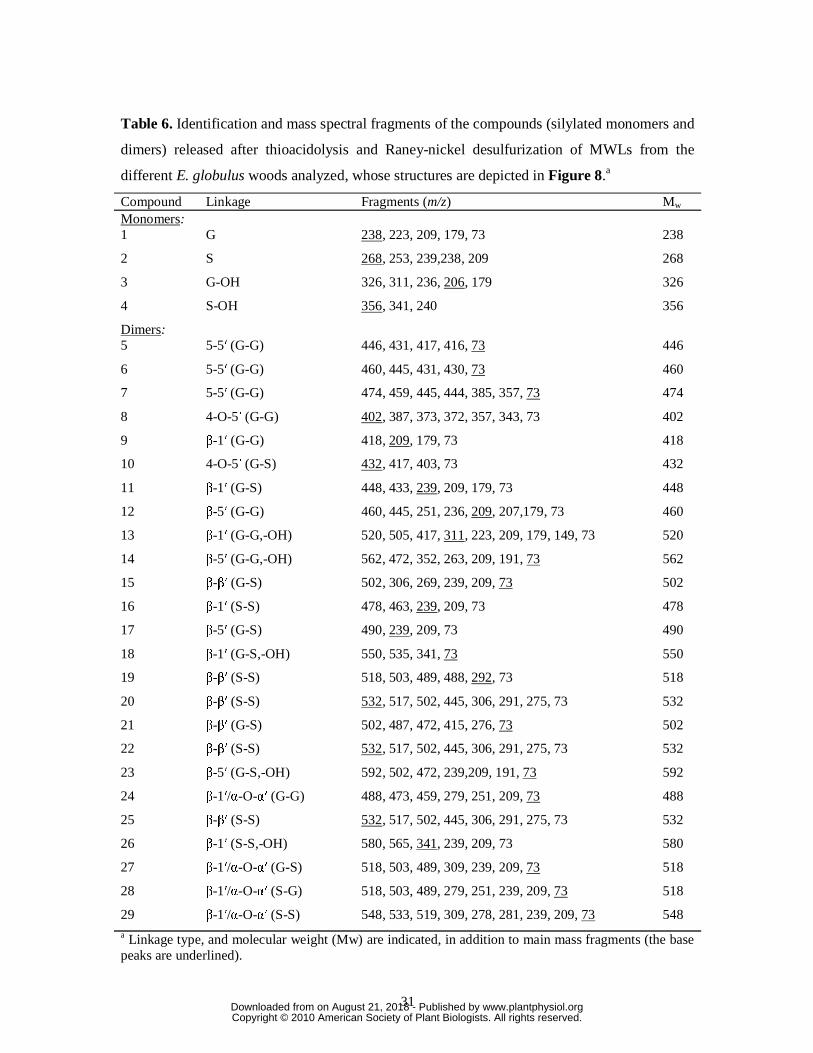
2005; Rencoret et al., 2008; del Río et al., 2009). The structures of the main compounds
identified are shown in Figure 8 and their mass spectral data are summarized in Table 6.
The yield of thioacidolysis monomers increased from the 1-month to the 9-year samples
(1450-2920 μmol/g). The low amounts of monomers released from the 1-month sample was
probably due to the presence of cutin-like material co-extracted or chemically-bound to the
lignin, as shown by NMR, whose presence was especially high in this MWL sample. The
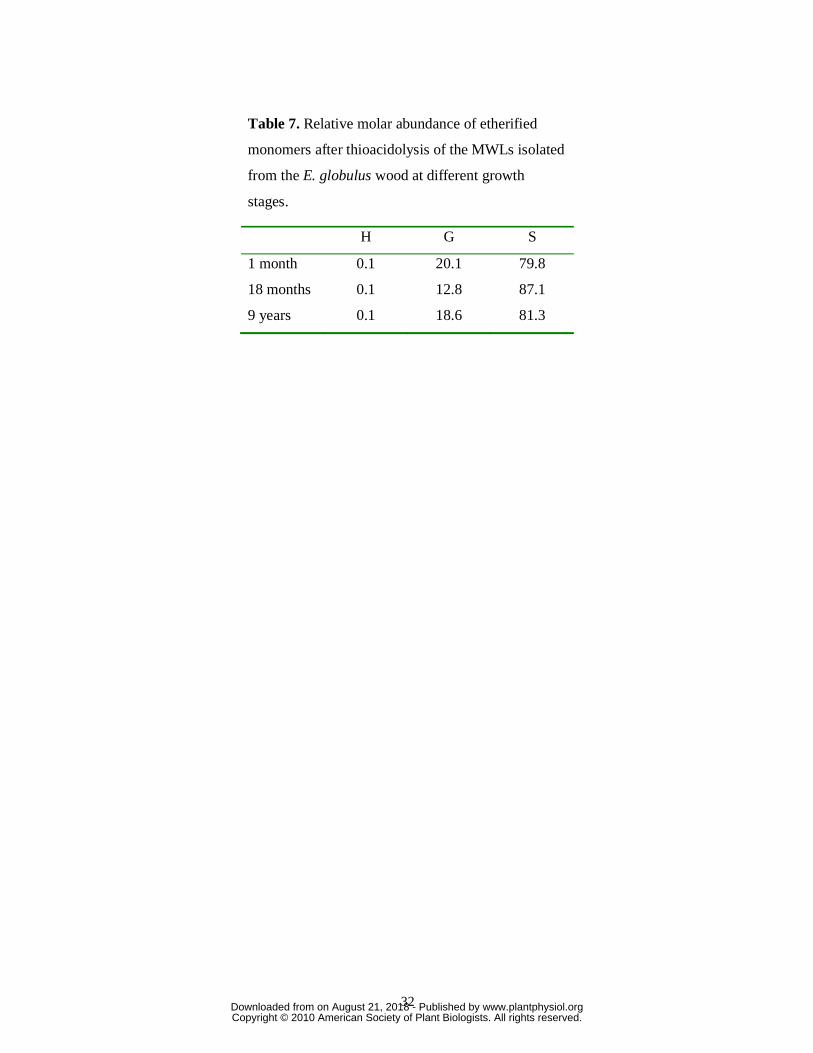
molar composition of the H, G, and S thioacidolysis monomers in the different MWLs is
provided in Table 7. It showed a predominance of S over G units in the etherified eucalypt
lignin, and the nearly-complete absence of H units. The abundances of S units in the
etherified lignin (over 80-87%) are higher than in the total lignin, as shown by NMR (56-
76%) and Py-GC/MS (55-75%) analyses, confirming that the ether-linked lignin is enriched
in S units. Possibly, because of this high abundance of S units in etherified lignin, no further
enrichment was observed in the lignins isolated during tree growth.
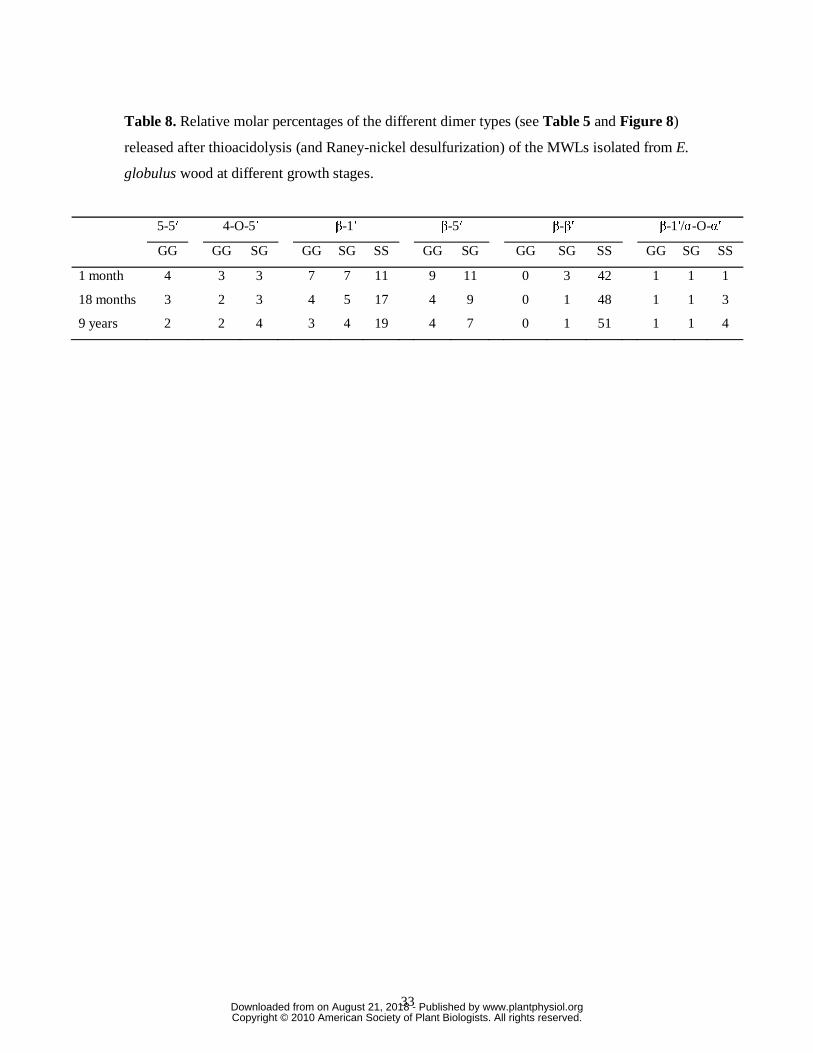
The dimers recovered after thioacidolysis provide information on the various carbon-
carbon and diaryl ether linkages, referred to as the “condensed” bonds (including 5-5′, 4-O-5′,
β-1′, β-5′ and β-β′) (Lapierre et al., 1991, 1995). The relative molar percentages of the
www.plantphysiol.orgon August 21, 2018 - Published by Downloaded from Copyright © 2010 American Society of Plant Biologists. All rights reserved.
14
different dimers released from the MWLs are shown in Table 8. The main dimers obtained
were of 5-5′ (dimers 5-7), 4-O-5′ (8 and 10), β-1′ (9, 11, 13, 16, 18 and 26), β-5′ (12, 14, 17
and 23), β-β′ tetralin (15, 19-22 and 25) and phenylisochroman (24, 27-29; including β-1′/α-
O-α′ bonds) types (Figure 8).
The compounds with β-β′ (tetralin) structures were the most prominent dimers released,
accounting from 39 to 52% of the total identified dimers. The high proportion of tetralin-type
dimers was in agreement with the high amounts of β-β′ resinol substructures observed by 2D-
NMR. Interestingly, the relative abundances of the tetralin dimers, with respect to the other
condensed structures, increase with lignification. More interestingly, most of the β-β′ dimers
released from the different eucalypt lignins were of syringaresinol type, pinoresinol being
completely absent, and the G-S resinol structure appearing only in trace amounts (Table 8).
The fact that β-β′ resinol structures are made almost exclusively of S units explains their
increase during lignification due to the parallel increase of S units. The relative abundances of
the β-1′ dimers were anomalously prominent (around 26% of the total dimeric structures) in
comparison with other lignins (Lapierre et al., 1995, Ralph et al., 2004a). Although the total
relative abundance of β-1′ dimers was not modified during maturation, the distribution among
the different dimeric structures changed, with an increase of structures having two S units, in
agreement with the parallel enrichment of S-lignin. The β-5′ dimers were also released in
important amounts from the different MWLs (ranging from 20 to 11% of total dimeric
structures) and, in agreement with the HSQC spectra, their abundances decrease with
maturation, paralleling the decrease of G units. The 5-5′ dimeric structures, which are
considered mostly as being degradation products of dibenzodioxocins, and which could not be
detected in the HSQC spectra, were found in very small amounts in all the samples (ranging
from 2 to 5% of all dimeric compounds), and their content also decreases with maturation,
paralleling the decrease of G units. Finally, some trimeric compounds were identified among
the thioacidolysis degradation products as being formed by addition to the β-β' tetralin dimers
previously described (compounds 20, 22 and 25) of a G lignin-unit linked by a 4-O-5' ether
bond (S-β-β'-S'-4'-O-5''-G'' trimers). Three isomers of this trimeric structure, which were
previously reported in eucalyptus wood (Rencoret et al., 2008) were detected, as also
occurred with the corresponding dimers, and their relative abundances also increases during
growth due to the progressive enrichment of S-lignin units.
www.plantphysiol.orgon August 21, 2018 - Published by Downloaded from Copyright © 2010 American Society of Plant Biologists. All rights reserved.
15
CONCLUSIONS
This study reports for the first time by “in situ” analyses how the composition and structure
of lignin and hemicelluloses in eucalypt (E. globulus) wood change during plant growth. This
was possible by the use of Py-GC/MS, which gives information about the H:G:S composition
of the lignin in woods, and by a very recent spectroscopic methodology that combines the
high resolution of 2D-NMR with spectra acquisition of the whole wood at the gel stage (by
“swelling” in d6-DMSO), thus enabling the simultaneous analysis of both types of polymers
without the problems often associated to isolation (such as low yield, structural modification
and presence of “contaminating” molecules).
The data obtained indicated that not only the lignin content increases with growth, but that
its composition changes with maturation, the order of monolignol deposition being H, G, and
then S at a late stage. The enrichment of S-lignin with respect to G and H-lignin during
lignification also affects the abundance of the different inter-unit linkages forming the lignin
structure. Thus, a decrease of β-5′ phenylcoumaran and 5-5′ biphenyl substructures, occurred
during lignification, paralleling the decrease in G units, and a small increase of β-O-4′ alkyl-
aryl ether substructures was produced, paralleling the enrichment of S units. β-O-4′ alkyl-aryl
ether are the major substructures in eucalypt lignin (69-72% of side-chains) together with β-β′
resinol substructures (16-19% of side-chains), which interestingly were almost exclusively of
the syringaresinol type. On the other hand, open β-1′ structures were detected in addition to
spirodienones, the abundance of the latter increasing during growth. Finally, a small but
continuous oxidation of the Cα of the lignin side-chain together with a decrease of cinnamyl
alcohol end-groups, was also observed as lignification proceeds.
Moreover, significant changes in hemicellulose during eucalypt growth were also shown
by the HSQC spectra of the wood gels, including increases of xylosyl (which appeared 50%
acetylated) and 4-O-methylglucuronosyl cross-signals, and strong decreases of those of
arabinosyl, galactosyl and methyl galacturonosyl units (the latter originating from pectin-like
polymers). Although more work is required for a complete assignment of all the
polysaccharide signals in the wood gels, the results obtained showed that not only changes in
lignin structure and composition but also the evolution of polysaccharides during plant
growth can be followed in situ (without time-consuming and problematic polymer isolation)
by the use of 2D-NMR in combination with other techniques.
www.plantphysiol.orgon August 21, 2018 - Published by Downloaded from Copyright © 2010 American Society of Plant Biologists. All rights reserved.
16
MATERIAL AND METHODS
E. globulus wood samples
Samples from a selected E. globulus clone (334-1-AR) at different stages of growth (1 month, 18
months and 9 years) were provided by ENCE pulp mill (Pontevedra, Spain) as representative of clonal
plantation trees used for paper pulp production. Whole stems of 1-month-old plants, and previously
debarked 18-month-old and 9-year-old eucalypt wood chips, were air-dried and milled using an IKA
cutting mill. The milled samples were successively extracted with acetone in a Soxhlet apparatus for 8
h, and then with hot water (3 h at 100 ºC). Klason lignin was estimated as the residue after sulfuric
acid hydrolysis of the pre-extracted material according to Tappi procedure T222 om-88 (Tappi, 2004).
The protein content in the Klason lignin was determined from the N content (Kjeldahl method) using a
6.25 factor (Darwill et al., 1980). The acid-soluble lignin was determined at 205 nm, after the
insoluble lignin was filtered off.
Monosaccharide composition of the above wood hydrolysate was determined using a Dionex
(Sunnyvale, CA) HPLC system ICS 3000 equipped with a Dionex AS autosampler, a GP40 gradient
pump, an anion exchange column (Dionex, CarboPac PA1) and an ED40 electrochemical detector,
and different monosaccharide standards. The total uronic acids in the hydrolysate were measured
colorimetrically at 520 nm (Blumenkrantz and Asboe-Hansen, 1973). The distribution of amorphous
(hemicelluloses) and crystalline (cellulose) glucan was calculated by treating the wood with a weak
acid, trifluoroacetic acid, and analyzing the hemicellulose sugars, as alditol acetates, by GC-MS with
inositol as internal standard (Albersheim et al., 1967). The residue was washed with the Updegraff
(1969) reagent, stripping of further hemicelluloses and amorphous glucan, totally hydrolyzed with
sulfuric acid (Selvendran and O’Neill, 1987) and glucose quantified by the anthrone assay. Ash
content was estimated as the residue after 6 h at 575 ºC. Two-three replicates were used for each
sample.
Milled-wood lignin isolation
The milled-wood lignins (MWLs) were obtained according to the classical procedure (Björkman
1956). Extractive-free ground wood (prepared as above) was finely ball-milled in a Retsch PM100
planetary mill (50 h at 300 rpm for 30 g of wood) using a 500 mL agate jar and agate ball bearings (20
x 20 mm). The milled wood was submitted to an extraction (4 × 24 h) with dioxane:water (9:1, v/v)
(5–10 mL solvent/g milled wood). The solution was centrifuged and the supernatant evaporated at
40 °C under reduced pressure. The residue obtained (raw MWL) was redissolved in acetic acid/water
9:1 (v/v) (20 mL solvent/g raw MWL). The solution was then precipitated into water and the residue
was separated by centrifugation, milled in an agate mortar and dissolved in 1,2-
dicloromethane:ethanol (1:2, v/v). The mixture was then centrifuged to eliminate the insoluble
www.plantphysiol.orgon August 21, 2018 - Published by Downloaded from Copyright © 2010 American Society of Plant Biologists. All rights reserved.
17
material. The resulting supernatant was precipitated into diethyl ether and the obtained residue was
separated by centrifugation. This residue was then resuspended in petroleum ether and centrifuged
again to obtain the purified MWL, which was dried under a current of N2. The final yields ranged from
10 to 15% based on the Klason lignin content of wood.
Py-GC/MS
Pyrolysis of the different woods and their MWL samples (approximately 100 μg) were performed
with a 2020 micro-furnace pyrolyzer (Frontier Laboratories Ltd.) connected to an Agilent 6890
GC/MS system equipped with a DB-1701 fused-silica capillary column (30 m x 0.25 mm i.d., 0.25 μm
film thickness) and an Agilent 5973 mass selective detector (EI at 70 eV). The pyrolysis was
performed at 500 ºC. The GC oven temperature was programmed from 50 ºC (1 min) to 100 ºC at 30
ºC min-1 and then to 290 ºC (10 min) at 6 ºC min-1. Helium was the carrier gas (1 ml min-1). The
compounds were identified by comparing their mass spectra with those of the Wiley and NIST
libraries and those reported in the literature (Faix et al., 1990, Ralph and Hatfield 1991). Peak molar
areas were calculated for the lignin-degradation products, the summed areas were normalized, and the
data for two repetitive analyses were averaged and expressed as percentages. No attempt was made to
calculate the response factor for every single compound released. However, for most of the lignin-
derived phenols, the response factors were nearly identical (Bocchini et al. 1997), with the exception
of vanillin, but this was a minor peak here.
2D-NMR spectroscopy
For the NMR of the whole wood, around 100 mg of finely divided (ball-milled) extractives-free
wood samples were swollen in DMSO-d6:pyridine-d5 (4:1, v/v), according to the method developed by
Kim and Ralph (2010). In the case of the MWL, around 40 mg of MWL were dissolved in 0.75 mL of
DMSO-d6.
2D-NMR HSQC spectra were recorded at 25 ºC on a Bruker AVANCE 500 MHz spectrometer
fitted with a cryogenically cooled 5 mm gradient probe with inverse geometry, using Bruker’s standard
pulse sequence ‘hsqcetgpsisp2.2’ (i.e., with adiabatic pulses). The spectral widths were 5000 and
25,154 Hz for the 1H and 13C dimensions, respectively. The number of collected complex points was
1000 for the 1H dimension (acquisition time, 200 ms), with a recycle delay (D1) of 500 ms. The
number of transients was 100, and 400 time increments were recorded in 13C dimension (for an F1
acquisition time of 8 ms). The 1JCH used was 145 Hz. Processing used typical matched Gaussian
apodization in 1H (F2) and a squared cosine-bell in 13C (F1). Prior to Fourier transformation, the data
matrices were zero-filled up to 1024 points in the 13C dimension. The central solvent peak was used as
an internal reference (δC/δH 39.5/2.49).
www.plantphysiol.orgon August 21, 2018 - Published by Downloaded from Copyright © 2010 American Society of Plant Biologists. All rights reserved.
18
A semiquantitative analysis of the integrals of the HSQC correlation contour intensities was
performed (Heikkinen et al., 2003; Ralph et al., 2006; Zhang and Gellerstedt, 2007). Integration was
performed separately for the different regions of the spectra. In the aliphatic oxygenated region, the
various inter-unit linkages were estimated from Cα-Hα correlations, except for structures E and F
described below where Cβ-Hβ correlations were used and structures I where Cγ-Hγ correlations were
used, and the relative abundance of side-chains involved in different substructures and terminal
structures were calculated (with respect to total side-chains). In the aromatic region, 13C-1H
correlations from the different lignin units were used to estimate the H-G-S composition and the S/G
ratio.
Thioacidolysis and Raney-nickel desulfurization
Thioacidolyses of 5 mg samples of MWL were performed as described by Rolando et al. (1992)
using 0.2 M BF3 etherate in dioxane/ethanethiol 8.75:l. The reactions products were extracted with
CH2C12, dried and concentrated. Two-hundred μL of the CH2Cl2 solution containing the thioacidolysis
products was desulfurized as described by Lapierre et al. (1991). GC/MS analyses were performed in a
Varian Star 3400 coupled to an ion-trap detector Varian Saturn 2000, using a DB-5HT fused-silica
capillary column from J&W Scientific (30 m x 0.25 mm i.d., 0.1 μm film thickness). The temperature
was programmed from 50 ºC to 110 ºC at 30 ºC min-1 and then to 320 ºC (13 min) at 6 ºC min-1. The
injector and transfer line were at 300 ºC; the injector was programmed from 120 ºC (0.1 min) to 380
ºC at 200 ºC min-1. Helium was the carrier gas (2 ml min-1) and octadecane was used as internal
standard. Dimer identification was based on previously reported mass spectra (Lapierre et al., 1991,
Saito and Fukushima 2005; Rencoret et al., 2008; del Río et al., 2009) and mass fragmentography.
ACKNOWLEDGEMENTS
Javier Romero (ENCE, Pontevedra, Spain) is acknowledged for providing the wood samples, Cliff
Foster (GLBRC MSU cell-wall analytical facility) for sugar and cellulose analysis, and Sasikumar
Elumalai (UW Biological Systems Engineering Dept.) for performing the uronic acids analyses. Jorge
Rencoret thanks the Spanish Ministry of Education for a postdoctoral fellowship
www.plantphysiol.orgon August 21, 2018 - Published by Downloaded from Copyright © 2010 American Society of Plant Biologists. All rights reserved.
19
LITERATURE CITED
Albersheim P, Nevins DJ, English PD, Karr A (1967) A method for the analysis of sugars in plant
cell-wall polysaccharides by gas-liquid chromatography. Carbohydr Res 5: 340-345.
Ämmälahti E, Brunow G, Bardet M, Robert D, Kilpeläinen I (1998) Identification of side-chain
structures in a poplar lignin using three-dimensional HMQC-HOHAHA NMR spectroscopy. J
Agric Food Chem 46: 5113-5117.
Balakshin MY, Capanema EA, Chen CL, Gracz HS (2003) Elucidation of the structures of residual
and dissolved pine kraft lignins using an HMQC NMR technique. J Agric Food Chem 51: 6116-
6127.
Balakshin MY, Capanema EA, Goldfarb B, Frampton J, Kadla JF (2005) NMR studies on Fraser
fir Abies fraseri (Pursh) Poir. lignins. Holzforschung 59: 488-496.
Balakshin MY, Capanema EA, Chang H-M (2008) Recent advances in the isolation and analysis of
lignins and lignin-carbohydrate complexes. In TQ Hu, ed, Characterization of Lignocellulosic
Materials, Blackwell Publishing Ltd., Oxford, UK, pp. 148-170.
Björkman A (1956) Studies on finely divided wood. Part I. Extraction of lignin with neutral solvents.
Sven Papperstidn 13: 477-485.
Blumenkrantz N, Asboe-Hansen G (1973) New method for quantitative determination of uronic
acids. Anal Biochem 54: 484-489.
Bocchini P, Galletti GC, Camarero S, Martínez AT (1997) Absolute quantitation of lignin
pyrolysis products using an internal standard. J Chromatogr A 773: 227-232.
Boerjan W, Ralph J, Baucher M (2003). Lignin biosynthesis. Annu Rev Plant Biol 54: 519-546.
Capanema EA, Balakshin MY, Chen CL, Gratzl JS, Gracz H (2001) Structural analysis of residual
and technical lignins by 1H-13C correlation 2D NMR-spectroscopy. Holzforschung 55: 302-308.
Capanema EA, Balakshin MY, Kadla JF (2004) A comprehensive approach for quantitative lignin
characterization by NMR spectroscopy. J Agric Food Chem 52: 1850-1860.
Capanema EA, Balakshin MY, Kadla JF (2005) Quantitative characterization of a hardwood milled
wood lignin by nuclear magnetic resonance spectroscopy. J Agric Food Chem 53: 9639-9649.
Çetinkol OP, Dibble DC, Cheng G, Kent MS, Knierim B, Auer M, Wemmer DE, Pelton JG,
Melnichenko YB, Ralph J, Simmons BA, Holmes BM (2010) Understanding the impact of ionic
liquid pretreatment on eucalyptus. Biofuels 1: 33-46.
Coetzze B, Wolfaart F (2010) Pectic monosaccarides and total pectin content of two Eucalyptus spp.
In 1st Symposium on Biotechnology Applied to Lignocelluloses-LignoBiotech-One, Reims, France.
Darwill A, McNeil M, Albersheim P, Delmer D (1980) The primary cell-walls of flowering plants.
In N Tolbert, ed, The Biochemistry of Plants, Academic Press, New York, pp. 91-162.
Déjardin A, Laurans F, Arnaud D, Breton C, Pilate G, Leplé JC (2010) Wood formation in
angiosperms. Comptes Rendus Biologies 333: 325-334.
www.plantphysiol.orgon August 21, 2018 - Published by Downloaded from Copyright © 2010 American Society of Plant Biologists. All rights reserved.
20
del Río JC, Gutiérrez A, Hernando M, Landín P, Romero J, Martínez AT (2005) Determining the
influence of eucalypt lignin composition in paper pulp yield using Py-GC/MS. J Anal Appl Pyrol
74: 110-115.
del Río JC, Rencoret J, Marques G, Gutiérrez A, Ibarra D, Santos JI, Jiménez-Barbero J,
Martínez AT (2008) Highly acylated (acetylated and/or p-coumaroylated) native lignins from
diverse herbaceous plants. J Agric Food Chem 56: 9525-9534.
del Río JC, Rencoret J, Marques G, Li J, Gellerstedt G, Jiménez-Barbero J, Martínez AT,
Gutiérrez A (2009) Structural characterization of the lignin from jute (Corchorus capsularis)
fibers. J Agric Food Chem 57: 10271-10281.
Deshmukh AP, Simpson AJ, Hadad CM, Hatcher PG (2005) Insights into the structure of cutin and
cutan from Agave americana leaf cuticle using HRMAS NMR spectroscopy. Org Geochem
36:1072-1085.
Donaldson LA (2001). Lignification and lignin topochemistry—an ultrastructural view.
Phytochemistry 57: 859–73.
Evtuguin DV, Tomás JL, Silva AMS, Pascoal Neto C (2003) Characterization of an acetylated
heteroxylans from Eucalyptus globulus Labill, Carbohydr Res 338: 597–607.
Faix O, Meier D, Fortmann I (1990) Thermal degradation products of wood. A collection of
electron-impact (EI) mass spectra of monomeric lignin derived products. Holz Roh-Werkstoff 48:
351-354.
Fujimoto A, Matsumoto Y, Chang H-M, Meshitsuka G (2005) Quantitative evaluation of milling
effects on lignin structure during the isolation process of milled wood lignin. J Wood Sci 51:89-91.
Golovchenko VV, Bushneva OA, Ovodova RG, Shashkov AS, Chizhov AO, Ovodov YS (2007)
Structural study of bergenan, a pectin from Bergenia crassifolia. Russian J Bioinorg Chem 33: 47-
56.
González-Vila FJ, Almendros G, del Río JC, Martín F, Gutiérrez A, Romero J (1999) Ease of
delignification assessment of different Eucalyptus wood species by pyrolysis (TMAH)-GC/MS and
CP/MAS 13C-NMR spectrometry. J Anal Appl Pyrol 49: 295-305.
Guerra A, Filpponen I, Lucia L, Saquing C, Baumberger S, Argyropoulos DS (2006) Toward a
better understanding of the lignin isolation process from wood. J Agric Food Chem 54:5939-5947.
Ha MA, Vietor JR, Jardine GD, Apperley DC, Jarvis MC (2005) Conformation and mobility of
the arabinan and galactan side-chains of pectin. Phytochemistry 66: 1817-1824.
Hedenström M, Wiklund S, Sundberg B, Edlund U (2008) Visualization and interpretation of
OPLS models based on 2D NMR data. Chemom Intell Lab Syst 92: 110-117.
Heikkinen S, Toikka MM, Karhunen PT, Kilpeläinen I (2003) A. Quantitative 2D HSQC (Q-
HSQC) via suppression of J-dependence of polarization transfer in NMR spectroscopy:
Application to wood lignin. J Am Chem Soc 125: 4362-4367.
Higuchi T (1997) Biochemistry and molecular biology of wood. London: Springer Verlag.
www.plantphysiol.orgon August 21, 2018 - Published by Downloaded from Copyright © 2010 American Society of Plant Biologists. All rights reserved.
21
Hu Z, Yeh T-F, Chang H-M, Jameel H (2006) Elucidation of the structure of cellulolytic enzyme
lignin. Holzforschung 60:389-397.
Ibarra D, Chávez MI, Rencoret J, del Río JC, Gutiérrez A, Romero J, Camarero S, Martinez
MJ, Jiménez-Barbero J, Martínez AT (2007a) Lignin modification during Eucalyptus globulus
kraft pulping followed by totally chlorine free bleaching: A two-dimensional nuclear magnetic
resonance, Fourier transform infrared, and pyrolysis-gas chromatography/mass spectrometry study.
J Agric Food Chem 55: 3477-3499.
Ibarra D, Chávez MI, Rencoret J, del Río JC, Gutiérrez A, Romero J, Camarero S, Martínez
MJ, Jimenez-Barbero J, Martínez AT (2007b) Structural modification of eucalypt pulp lignin in
a totally chlorine free bleaching sequence including a laccase-mediator stage. Holzforschung 61:
634-646.
Kim H, Ralph J, Akiyama T (2008) Solution-state 2D NMR of ball-milled plant cell-wall gels in
DMSO-d6. Bioenergy Res 1: 56-66.
Kim H, Ralph J (2010) Solution-state 2D NMR of ball-milled plant cell-wall gels in DMSO-
d6/pyridine-d5. Org Biomol Chem 8: 576-591.
Lapierre C, Pollet B, Monties B (1991) Thioacidolysis of spruce lignin: GC-MS analysis of the main
dimers recovered after Raney nickel desulphuration. Holzforschung 45: 61-68.
Lapierre C, Pollet B, Rolando C (1995) New insights into the molecular architecture of hardwood
lignins by chemical degradative methods. Res Chem Intermed 21: 397-412.
Liitiä TM, Maunu SL, Hortling B, Toikka M, Kilpeläinen I (2003) Analysis of technical lignins by
two- and three-dimensional NMR spectroscopy. J Agric Food Chem 51: 2136-2143.
Lisboa S, Evtuguin DV, Pascoal Neto C, Goodfellow B (2005). Isolation and structural
characterization of polysaccharides dissolved in Eucalyptus globulus kraft black liquors.
Carbohydr Pol 60: 77–85.
Lu F, Ralph J (2005) Novel β-β-structures in lignins incorporating acylated monolignols. Appita 233-
237.
Lundquist K (1987) On the occurrence of β-1 structures in lignin. J Wood Chem Technol 7: 179-185.
Mazumder BB, Nakgawa-izumi A, Kuroda K-i, Ohtani Y, Sameshima K (2005). Evaluation of the
harvesting time effects on kenaf bast lignin by pyrolysis-gas chromatography. Ind Crops & Prod
21: 17-24.
Ona T, Sonoda T, Ito K, Shibata M (1997) Relationship of lignin content, lignin monomeric
composition and hemicellulose composition in the same trunk sought by their within-tree variations
in Eucalyptus camaldulensis and E. globulus. Holzforschung 51: 396-404.
Peng JP, Lu FC, Ralph J (1999) The DFRC method for lignin analysis - Part 5 - Isochroman lignin
trimers from DFRC-degraded Pinus taeda. Phytochemistry 50: 659-666.
Ralph J, Hatfield RD (1991) Pyrolysis-GC-MS characterization of forage materials. J Agric Food
Chem 39: 1426-1437.
www.plantphysiol.orgon August 21, 2018 - Published by Downloaded from Copyright © 2010 American Society of Plant Biologists. All rights reserved.
22
Ralph J, Lundquist K, Brunow G, Lu F, Kim H, Schatz PF, Marita JM, Hatfield RD, Ralph SA,
Christensen JH, Boerjan W (2004a) Lignins: Natural polymers from oxidative coupling of 4-
hydroxyphenylpropanoids. Phytochem Rev 3: 29-60.
Ralph J, Marita JM, Ralph SA, Hatfield RD, Lu F, Ede RM, Peng J, Quideau S, Helm RF,
Grabber JH, Kim H, Jimenez-Monteon G, Zhang Y, Jung H-JG, Landucci LL, MacKay JJ,
Sederoff RR, Chapple C, Boudet AM (1999) Solution-state NMR of lignin. In Advances in
lignocellulosics characterization ( Argyropoulos, D.S., ed.). Atlanta: Tappi Press, pp. 55-108.
Ralph J, Peng JP, Lu FC (1998) Isochroman structures in lignin: a new β-1 pathway. Tetrahedron
Lett 39: 4963-4964.
Ralph SA, Ralph J, Landucci L (2004b) NMR Database of Lignin and Cell-wall Model Compounds.
US Forest Prod. Lab., One Gifford Pinchot Dr., Madison, WI 53705
(http://ars.usda.gov/Services/docs.htm?docid=10491) (accessed: July 2006).
Ralph J, Akiyama T, Kim H, Lu F, Schatz PF, Marita JM, Ralph SA, Reddy MSS, Chen F,
Dixon RA (2006) Effects of coumarate-3-hydroxylase downregulation on lignin structure. J Biol
Chem 281: 8843-8853.
Ralph J, Landucci LL (2010) NMR of Lignins. In Lignin and Lignans; Advances in Chemistry, C.
Heitner, D.R. Dimmel and J.A. Schmidt, Eds., CRC Press (Taylor & Francis Group), Boca Raton,
FL, pp. 137-234 (2010).
Rencoret J, Gutiérrez A, del Río, J.C. (2007) Lipid and lignin composition of woods from different
eucalypt species. Holzforschung 61: 165-174.
Rencoret J, Marques G, Gutiérrez A, Ibarra D, Li J, Gellerstedt G, Santos JI, Jiménez-Barbero
J, Martínez AT, del Río JC (2008) Structural characterization of milled wood lignin from
different eucalypt species. Holzforschung 62: 514-526.
Rencoret J, Marques G, Gutiérrez A, Nieto L, Santos JI, Jiménez-Barbero J, Martínez AT, del
Río JC (2009) HSQC-NMR analysis of lignin in woody (Eucalyptus globulus and Picea abies) and
non-woody (Agave sisalana) ball-milled plant materials at the gel state. Holzforschung 63: 691-
698.
Rodrigues J, Meier D, Faix O, Pereira H (1999) Determination of tree to tree variation in
syringyl/guaiacyl ratio of Eucalyptus globulus wood lignin by analytical pyrolysis. J Anal Appl
Pyrol 48: 121-128.
Rolando C, Monties B, Lapierre C (1992) Thioacidolysis. In Methods in Lignin Chemistry (Lin,
S.Y. and Dence, C.W., eds.). Berlin: Springer-Verlag, pp. 334-349.
Saito K, Fukushima K (2005) Distribution of lignin interunit bonds in the differentiating xylem of
compression and normal woods of Pinus thunbergii. J Wood Sci 51: 246-251.
Selvendran RR, O’Neill MA (1987) Isolation and analysis of cell-walls from plant material. In
Methods of Biochemical Analysis (David, G., ed.). John Wiley & Sons), pp. 25-153.
www.plantphysiol.orgon August 21, 2018 - Published by Downloaded from Copyright © 2010 American Society of Plant Biologists. All rights reserved.
23
Shatalov AA, Evtuguin DV, Pascoal Neto, C. (1999) (2-O-(-D-Galactopyranosyl-4-O-methyl-(-D-
glucurono)-D-xylan from Eucalyptus globulus Labill, Carbohydr Res 320: 93–100.
Tappi (2004) TAPPI Test Methods 2004-2005. Norcoss: TAPPI Press.
Terashima N, Fukushima K, Tsuchiya S (1986) Heterogeneity in formation of lignin. 7. An
autoradiographic study on the formation of guaiacyl and syringyl lignin in poplar. J Wood Chem
Technol 6: 495–504.
Terashima N, Fukushima K, He LF, Takabe K (1993). Comprehensive model of the lignified plant
cell-wall. In Forage Cell-wall Structure and Digestibility (Jung, H.G., Buxton, D.R., Hatfield, R.D.,
Ralph, J., eds.). Madison: ASACSSA-SSSA, pp. 247–70. 794.
Updergraff DM (1969) Semimicro determination of cellulose in biological materials. Anal Biochem
32: 420-424.
Yokoi H, Ishida Y, Ohtani H, Tsuge S, Sonoda T, Ona T (1999) Characterization of within-tree
variation of lignin components in Eucalyptus camaldulensis by pyrolysis-gas chromatography.
Analyst 124: 669-674.
Yokoi H, Nakase T, Ishida Y, Ohtani H, Tsuge S, Sonoda T, Ona T (2001) Discriminative analysis
of Eucalyptus camaldulensis grown from seeds of various origins based on lignin components
measured by pyrolysis-gas chromatography. J Anal Appl Pyrol 57: 145-152.
Zhang L, Gellerstedt G (2001) NMR observation of a new lignin structure, a spiro-dienone. Chem
Commun 24: 2744-2745.
Zhang LM, Gellerstedt G, Ralph J, Lu FC (2006) NMR studies on the occurrence of spirodienone
structures in lignins. J Wood Chem Technol 26: 65-79.
Zhang L, Gellerstedt G (2007). Quantitative 2D HSQC NMR determination of polymer structures by
selecting the suitable internal standard references. Magn Reson Chem 45: 37–45.
www.plantphysiol.orgon August 21, 2018 - Published by Downloaded from Copyright © 2010 American Society of Plant Biologists. All rights reserved.
24
FIGURE LEGENDS
Figure 1. Py-GC/MS chromatogram of the E. globulus wood samples at different growth
stages. The numbers refer to the lignin-derived compounds, whose identities and relative
abundances are listed in Table 2. Letters refer to the carbohydrate-derived compounds: (a)
hydroxyacetaldehyde; (b) (3H)-furan-2-one; (c) (2H)-furan-3-one; (d) furfural; (e) 2-
hydroxymethylfuran; (f) 2,3-dihydro-5-methylfuran-2-one; (g) 5-methyl-2-furfuraldehyde; (h)
(5H)-furan-2-one; (i) 4-hydroxy-5,6-dihydro-(2H)-pyran-2-one; (j) 2-hydroxy-3-methyl-2-
cyclopenten-1-one; (k) 5-hydroxymethyl-2-furfuraldehyde; and (l) levoglucosane.
Figure 2. Py-GC/MS chromatogram of the MWLs isolated from the E. globulus wood
samples at different growth stages. The identities and relative abundances of the released
compounds are listed in Table 2.
Figure 3. HSQC NMR spectra (δC/δH 45-135/2.5-8.0 ppm) of the E. globulus wood samples
at different growth stages, after forming a gel in DMSO-d6/pyridine-d5 (4:1). See Table 3 for
lignin signal assignment and Figure 5 for the main lignin structures identified. The
assignments of the carbohydrate signals are listed in Table 4.
Figure 4. HSQC NMR spectra (δC/δH 45-135/2.5-8.0 ppm) of the MWLs isolated from the E.
globulus wood samples at different growth stages. See Table 3 for lignin signal assignment
and Figure 5 for the main lignin structures identified. Olefinic cross-signals of unsaturated
fatty-acid structures (UF) were also identified.
Figure 5. Main substructures present in the E. globulus wood lignin during tree growth: A) β-
ether structure formed by β-O-4′ linkages; B) resinol structure including β-β′ linkages; C)
phenylcoumaran structure including β-5′ linkages; D) spirodienone structure including β-1′
linkages; E) open β-1′ structure; F) Cα-oxidized β-O-4′ structure; G) guaiacyl unit; I)
cinnamyl alcohol end-group; S) syringyl unit; and S′) oxidized syringyl unit bearing a
carbonyl at Cα.
Figure 6. Carbohydrate anomeric regions (δC/δH 90-110/3.5-6.0 ppm) of HSQC NMR spectra
of the E. globulus wood samples at different growth stages, after forming a gel in DMSO-
d6/pyridine-d5 (4:1). The assignments of the carbohydrate signals are listed in Table 4.
www.plantphysiol.orgon August 21, 2018 - Published by Downloaded from Copyright © 2010 American Society of Plant Biologists. All rights reserved.
25
Figure 7. Chromatogram of the thioacidolysis degradation products (after Raney nickel
desulfurization) of a representative MWL from E. globulus wood (at 1 month growth) as
trimethylsilyl derivatives. The numbers refer to the compounds (monomers and dimers) listed
in Table 6 and the corresponding chemical structures are shown in Figure 8. IS refers to
octadecane used as internal standard.
Figure 8. Structures of monomeric and main dimeric compounds obtained after thioacidolysis
and Raney-nickel desulfurization of the MWLs isolated from the E. globulus wood samples at
different growth stages. All mass spectral data of the compounds (as trimethylsilyl
derivatives) are listed in Table 6.
www.plantphysiol.orgon August 21, 2018 - Published by Downloaded from Copyright © 2010 American Society of Plant Biologists. All rights reserved.
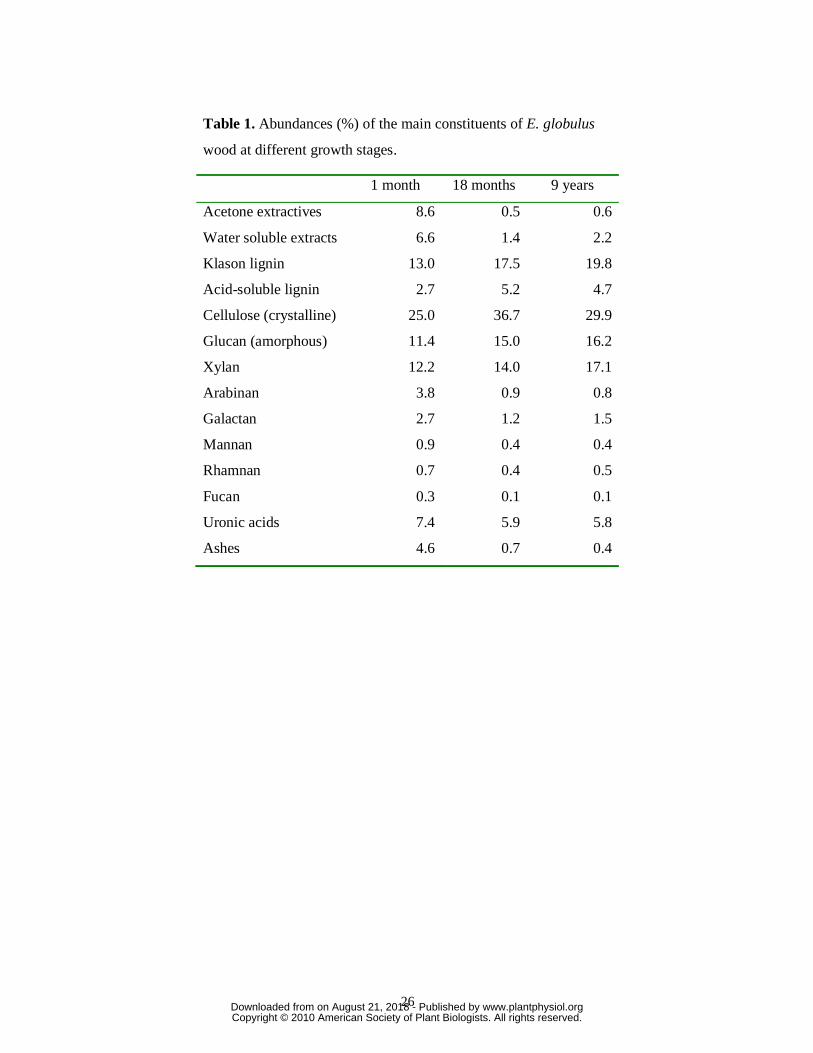
26
Table 1. Abundances (%) of the main constituents of E. globulus
wood at different growth stages.
1 month 18 months 9 years
Acetone extractives 8.6 0.5 0.6
Water soluble extracts 6.6 1.4 2.2
Klason lignin 13.0 17.5 19.8
Acid-soluble lignin 2.7 5.2 4.7
Cellulose (crystalline) 25.0 36.7 29.9
Glucan (amorphous) 11.4 15.0 16.2
Xylan 12.2 14.0 17.1
Arabinan 3.8 0.9 0.8
Galactan 2.7 1.2 1.5
Mannan 0.9 0.4 0.4
Rhamnan 0.7 0.4 0.5
Fucan 0.3 0.1 0.1
Uronic acids 7.4 5.9 5.8
Ashes 4.6 0.7 0.4
www.plantphysiol.orgon August 21, 2018 - Published by Downloaded from Copyright © 2010 American Society of Plant Biologists. All rights reserved.
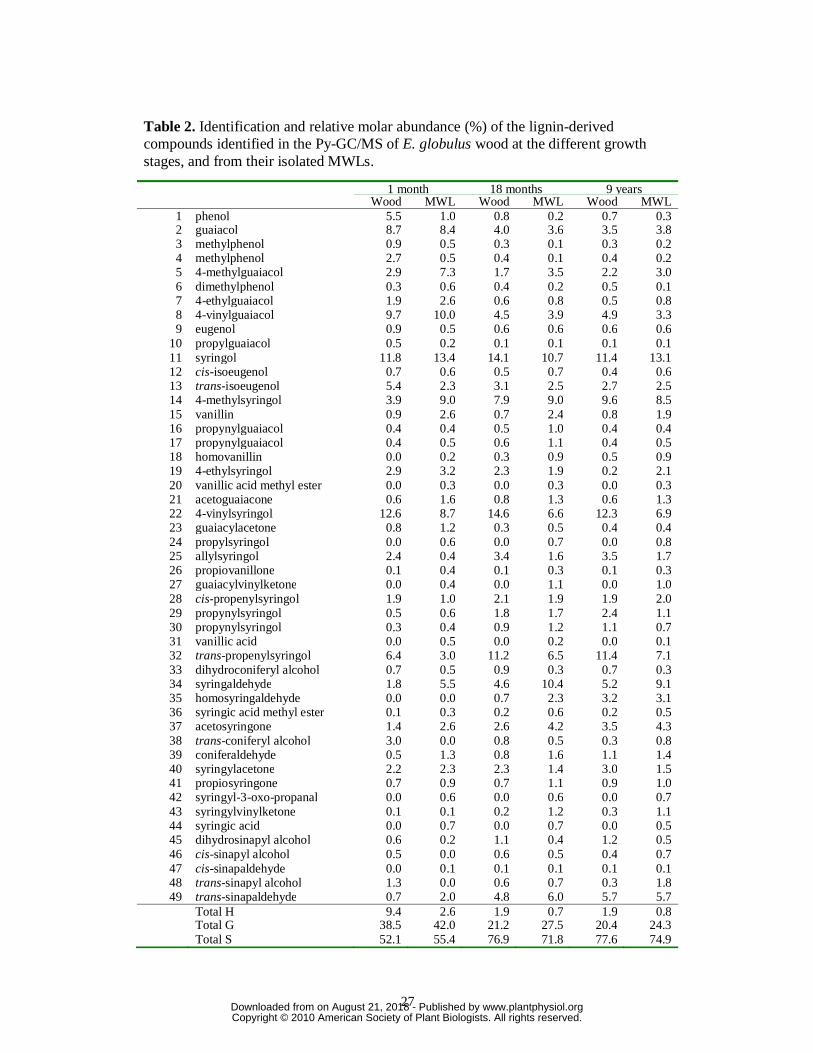
27
Table 2. Identification and relative molar abundance (%) of the lignin-derived compounds identified in the Py-GC/MS of E. globulus wood at the different growth stages, and from their isolated MWLs.
1 month 18 months 9 years Wood MWL Wood MWL Wood MWL
1 phenol 5.5 1.0 0.8 0.2 0.7 0.3 2 guaiacol 8.7 8.4 4.0 3.6 3.5 3.8 3 methylphenol 0.9 0.5 0.3 0.1 0.3 0.2 4 methylphenol 2.7 0.5 0.4 0.1 0.4 0.2 5 4-methylguaiacol 2.9 7.3 1.7 3.5 2.2 3.0 6 dimethylphenol 0.3 0.6 0.4 0.2 0.5 0.1 7 4-ethylguaiacol 1.9 2.6 0.6 0.8 0.5 0.8 8 4-vinylguaiacol 9.7 10.0 4.5 3.9 4.9 3.3 9 eugenol 0.9 0.5 0.6 0.6 0.6 0.6
10 propylguaiacol 0.5 0.2 0.1 0.1 0.1 0.1 11 syringol 11.8 13.4 14.1 10.7 11.4 13.1 12 cis-isoeugenol 0.7 0.6 0.5 0.7 0.4 0.6 13 trans-isoeugenol 5.4 2.3 3.1 2.5 2.7 2.5 14 4-methylsyringol 3.9 9.0 7.9 9.0 9.6 8.5 15 vanillin 0.9 2.6 0.7 2.4 0.8 1.9 16 propynylguaiacol 0.4 0.4 0.5 1.0 0.4 0.4 17 propynylguaiacol 0.4 0.5 0.6 1.1 0.4 0.5 18 homovanillin 0.0 0.2 0.3 0.9 0.5 0.9 19 4-ethylsyringol 2.9 3.2 2.3 1.9 0.2 2.1 20 vanillic acid methyl ester 0.0 0.3 0.0 0.3 0.0 0.3 21 acetoguaiacone 0.6 1.6 0.8 1.3 0.6 1.3 22 4-vinylsyringol 12.6 8.7 14.6 6.6 12.3 6.9 23 guaiacylacetone 0.8 1.2 0.3 0.5 0.4 0.4 24 propylsyringol 0.0 0.6 0.0 0.7 0.0 0.8 25 allylsyringol 2.4 0.4 3.4 1.6 3.5 1.7 26 propiovanillone 0.1 0.4 0.1 0.3 0.1 0.3 27 guaiacylvinylketone 0.0 0.4 0.0 1.1 0.0 1.0 28 cis-propenylsyringol 1.9 1.0 2.1 1.9 1.9 2.0 29 propynylsyringol 0.5 0.6 1.8 1.7 2.4 1.1 30 propynylsyringol 0.3 0.4 0.9 1.2 1.1 0.7 31 vanillic acid 0.0 0.5 0.0 0.2 0.0 0.1 32 trans-propenylsyringol 6.4 3.0 11.2 6.5 11.4 7.1 33 dihydroconiferyl alcohol 0.7 0.5 0.9 0.3 0.7 0.3 34 syringaldehyde 1.8 5.5 4.6 10.4 5.2 9.1 35 homosyringaldehyde 0.0 0.0 0.7 2.3 3.2 3.1 36 syringic acid methyl ester 0.1 0.3 0.2 0.6 0.2 0.5 37 acetosyringone 1.4 2.6 2.6 4.2 3.5 4.3 38 trans-coniferyl alcohol 3.0 0.0 0.8 0.5 0.3 0.8 39 coniferaldehyde 0.5 1.3 0.8 1.6 1.1 1.4 40 syringylacetone 2.2 2.3 2.3 1.4 3.0 1.5 41 propiosyringone 0.7 0.9 0.7 1.1 0.9 1.0 42 syringyl-3-oxo-propanal 0.0 0.6 0.0 0.6 0.0 0.7 43 syringylvinylketone 0.1 0.1 0.2 1.2 0.3 1.1 44 syringic acid 0.0 0.7 0.0 0.7 0.0 0.5 45 dihydrosinapyl alcohol 0.6 0.2 1.1 0.4 1.2 0.5 46 cis-sinapyl alcohol 0.5 0.0 0.6 0.5 0.4 0.7 47 cis-sinapaldehyde 0.0 0.1 0.1 0.1 0.1 0.1 48 trans-sinapyl alcohol 1.3 0.0 0.6 0.7 0.3 1.8 49 trans-sinapaldehyde 0.7 2.0 4.8 6.0 5.7 5.7
Total H 9.4 2.6 1.9 0.7 1.9 0.8 Total G 38.5 42.0 21.2 27.5 20.4 24.3 Total S 52.1 55.4 76.9 71.8 77.6 74.9
www.plantphysiol.orgon August 21, 2018 - Published by Downloaded from Copyright © 2010 American Society of Plant Biologists. All rights reserved.
28
Table 3. Assignments of the lignin 13C-1H correlation signals in the HSQC spectra of E.
globulus wood at the different growth stages, and their isolated MWLs.
Labels δC/δH (ppm) Assignment
Cβ 53.5/3.46 Cβ-Hβ in phenylcoumaran substructures (C)
Bβ 53.5/3.06 Cβ-Hβ in resinol substructures (B)
Eβ 55.0/2.75 Cβ-Hβ in β-1′ substructures (E)
-OMe 55.6/3.73 C-H in methoxyls
Aγ 59.4 /3.40 and 3.72 CγHγ in β-O-4′ substructures (A)
Dβ 59.6/2.75 Cβ-Hβ in spirodienone substructures (D)
Iγ 61.3/4.09 Cγ-Hγ in cinnamyl (sinapyl/coniferyl) alcohol end-groups (I)
Cγ 62.5/3.72 Cγ-Hγ in phenylcoumaran substructures (C)
Bγ 71.0/3.83 and 4.19 Cγ-Hγ in resinol substructures (B)
Aα 71.7/4.86 Cα-Hα in β-O-4′ substructures (A)
Dβ′ 79.3/4.11 Cβ′-Hβ′ in spirodienone substructures (D)
Dα 81.2/5.09 CαHα in spirodienone substructures (D)
Aβ(G) 83.5/4.28 Cβ-Hβ in β-O-4′ linked to a G unit (A)
Fβ 83.8/5.23 Cβ-Hβ in oxidized (Cα=O) β-O-4′ substructures (F)
Bα 84.8/4.67 Cα-Hα in resinol substructures (B)
Dα′ 84.8/4.75 Cα′Hα′ in spirodienone substructures (D)
Aβ(S) 85.8/4.11 Cβ-Hβ in β-O-4′ linked to a S unit (A)
Cα 86.8/5.46 Cα-Hα in phenylcoumaran substructures (C)
S2,6 103.8/6.69 C2,6-H2,6 in etherified syringyl units (S)
S′2,6 106.6/7.32 and 7.19 C2,6-H2,6 in oxidized (Cα=O) phenolic syringyl units (S′)
G2 110.9/6.99 C2-H2 in guaiacyl units (G)
D2′ 113.2/6.27 C2′H2′ in spirodienone substructures (D)
H3,5 114.9/6.74 C3,5-H3,5 in p-hydroxyphenyl units (H)
G5/G6 114.9/6.72 and 6.94
118.7/6.77
C5-H5 and C6-H6 in guaiacyl units (G)
D6′ 118.9/6.09 C6′H6′ in spirodienone substructures (D)
H2,6 128.0/7.23 C2,6-H2,6 in p-hydroxyphenyl units (H)
www.plantphysiol.orgon August 21, 2018 - Published by Downloaded from Copyright © 2010 American Society of Plant Biologists. All rights reserved.
29
Table 4. Assignments of the carbohydrate 13C-1H correlation signals in the HSQC spectra of
E. globulus wood at the different growth stages.
Labels δC/δH (ppm) Assignments
X5 63.2/3.26 and 3.95 C5-H5 in β-D-xylopyranoside
M′2 70.9/5.41 C2-H2 in 2-O-acetyl-β-D-mannopyranoside
X2 72.9/3.14 C2-H2 in β-D-xylopyranoside
X′2 73.5/4.61 C2-H2 in 2-O-acetyl-β-D-xylopyranoside
X3 74.1/3.32 C3-H3 in β-D-xylopyranoside
X′3 74.9/4.91 C3-H3 in 3-O-acetyl-β-D-xylopyranoside
X4 75.6/3.63 C4-H4 in β-D-xylopyranoside
U4 81.4/3.22 C4-H4 in 4-O-methyl-α-D-glucuronic acid
Anomeric correlations (C1-H1):
αX1(R) 92.5/5.02 α-D-xylopyranoside (R) [α-D-glucopyranoside (R)]
βX1(R) 97.7/4.39 β-D-xylopyranoside (R) [β-D-glucopyranoside (R)]
U1 97.7/5.32 4-O-methyl-α-D-glucuronic acid
M′1 99.3/4.78 2-O-acetyl-β-D-mannopyranoside
R1 99.3/5.25 (1→2)-α-D-rhamnopyranoside
X′1 99.8/4.58 2-O-acetyl-β-D-xylopyranoside
M1 101.2/4.69 (1→4)-β-D-mannopyranoside
UGA1 101.7/4.94 methyl (1→4)-α-D-galacturonate
X1-X′1 102.1/4.38 β-D-xylopyranoside + 3-O-acetyl-β-D-xylopyranoside
Gl1 103.3/4.41 (1→4)-β-D-glucopyranoside
Gl1 103.6/4.30 (1→3)-β-D-glucopyranoside + (1→6)-β-D-glucopyranoside
Ga1 105.6/4.40 (1→4)-β-D-galactopyranoside
Ar1 107.3/5.05 α-L-arabinofuranoside
Ar1(T) 108.3/4.91 α-L-arabinofuranoside (T)
R, reducing end; T, terminal (non-reducing)
www.plantphysiol.orgon August 21, 2018 - Published by Downloaded from Copyright © 2010 American Society of Plant Biologists. All rights reserved.
30
Table 5. Lignin structural characteristics from integration of 13C-1H correlation signals in the HSQC spectra of
whole E. globulus wood, at different growth stages, and their MWLs, including: Abundance of side-chains
forming different inter-unit linkages (A-F) and cinnamyl alcohol end-groups (I), as per 100 aromatic unit (and
as percentage of total side-chains) and H, G and S contents.
1 month 18 months 9 years
Wood MWL Wood MWL Wood MWL
Linkages (% side-chains involved):
β-O-4′ aryl ether (A) 46 (72) 51 (68) 50 (72) 51 (69) 50 (69) 50 (69)
Resinol (B) 10 (17) 13 (18) 12 (18) 14 (19) 12 (16) 14 (19)
Phenylcoumaran (C) 3 (4) 4 (5) 1 (2) 2 (3) 1 (2) 1 (1)
Spirodienones (D) 1 (1) 2 (3) 2 (3) 3 (4) 4 (5) 3 (5)
β-1′ structures (E) 0 (0) 1 (2) 0 (0) 1 (1) 0 (0) 1 (1)
β-O-4′ oxidized at Cα (F) 1 (1) 1 (1) 2 (2) 3 (3) 4 (5) 2 (4)
Cinnamyl alcohol end-groups (I) 3 (5) 2 (3) 2 (3) 1 (1) 2 (3) 1 (1)
Percentage of lignin units (%):
H 5 2 0 0 0 0
G 41 42 26 27 23 24
S 53 56 74 73 77 76
www.plantphysiol.orgon August 21, 2018 - Published by Downloaded from Copyright © 2010 American Society of Plant Biologists. All rights reserved.
31
Table 6. Identification and mass spectral fragments of the compounds (silylated monomers and
dimers) released after thioacidolysis and Raney-nickel desulfurization of MWLs from the
different E. globulus woods analyzed, whose structures are depicted in Figure 8.a
Compound Linkage Fragments (m/z) Mw Monomers: 1 G 238, 223, 209, 179, 73 238
2 S 268, 253, 239,238, 209 268
3 G-OH 326, 311, 236, 206, 179 326
4 S-OH 356, 341, 240 356
Dimers: 5 5-5′ (G-G) 446, 431, 417, 416, 73 446
6 5-5′ (G-G) 460, 445, 431, 430, 73 460
7 5-5′ (G-G) 474, 459, 445, 444, 385, 357, 73 474
8 4-O-5′ (G-G) 402, 387, 373, 372, 357, 343, 73 402
9 β-1′ (G-G) 418, 209, 179, 73 418
10 4-O-5′ (G-S) 432, 417, 403, 73 432
11 β-1′ (G-S) 448, 433, 239, 209, 179, 73 448
12 β-5′ (G-G) 460, 445, 251, 236, 209, 207,179, 73 460
13 β-1′ (G-G,-OH) 520, 505, 417, 311, 223, 209, 179, 149, 73 520
14 β-5′ (G-G,-OH) 562, 472, 352, 263, 209, 191, 73 562
15 β-β′ (G-S) 502, 306, 269, 239, 209, 73 502
16 β-1′ (S-S) 478, 463, 239, 209, 73 478
17 β-5′ (G-S) 490, 239, 209, 73 490
18 β-1′ (G-S,-OH) 550, 535, 341, 73 550
19 β-β′ (S-S) 518, 503, 489, 488, 292, 73 518
20 β-β′ (S-S) 532, 517, 502, 445, 306, 291, 275, 73 532
21 β-β′ (G-S) 502, 487, 472, 415, 276, 73 502
22 β-β′ (S-S) 532, 517, 502, 445, 306, 291, 275, 73 532
23 β-5′ (G-S,-OH) 592, 502, 472, 239,209, 191, 73 592
24 β-1′/α-O-α′ (G-G) 488, 473, 459, 279, 251, 209, 73 488
25 β-β′ (S-S) 532, 517, 502, 445, 306, 291, 275, 73 532
26 β-1′ (S-S,-OH) 580, 565, 341, 239, 209, 73 580
27 β-1′/α-O-α′ (G-S) 518, 503, 489, 309, 239, 209, 73 518
28 β-1′/α-O-α′ (S-G) 518, 503, 489, 279, 251, 239, 209, 73 518
29 β-1′/α-O-α′ (S-S) 548, 533, 519, 309, 278, 281, 239, 209, 73 548 a Linkage type, and molecular weight (Mw) are indicated, in addition to main mass fragments (the base peaks are underlined).
www.plantphysiol.orgon August 21, 2018 - Published by Downloaded from Copyright © 2010 American Society of Plant Biologists. All rights reserved.
32
Table 7. Relative molar abundance of etherified
monomers after thioacidolysis of the MWLs isolated
from the E. globulus wood at different growth
stages.
H G S
1 month 0.1 20.1 79.8
18 months 0.1 12.8 87.1
9 years 0.1 18.6 81.3
www.plantphysiol.orgon August 21, 2018 - Published by Downloaded from Copyright © 2010 American Society of Plant Biologists. All rights reserved.
33
Table 8. Relative molar percentages of the different dimer types (see Table 5 and Figure 8)
released after thioacidolysis (and Raney-nickel desulfurization) of the MWLs isolated from E.
globulus wood at different growth stages.
5-5′ 4-O-5′ β-1′ β-5′ β-β′ β-1′/α-O-α′
GG GG SG GG SG SS GG SG GG SG SS GG SG SS
1 month 4 3 3 7 7 11 9 11 0 3 42 1 1 1
18 months 3 2 3 4 5 17 4 9 0 1 48 1 1 3
9 years 2 2 4 3 4 19 4 7 0 1 51 1 1 4
www.plantphysiol.orgon August 21, 2018 - Published by Downloaded from Copyright © 2010 American Society of Plant Biologists. All rights reserved.
1
2
3 4
5 7
8
9
11
12
13
14
15 18
19
21
22
25 28
32
34 37
39
40
41 *
45 46 48
38
49
6 17
d
a
c b
e
f
g h
i
j
k
l
a) 1 month
b) 18 months
1
2
3 4
5
7
8
9
11
12
13
14
15 18
19
21
22
25
28 29
30
32
34
35
37
39
40
41 *
45 46 48
42 17
33
38 49
d
a
c b e
f
g h i
j
1
2
3 4
5
7
8
9
11
12
13
14
15 18
19
21
22
25
28 29
30
32
34 35
37
39
40
41 *
45 46 48
49
42 17
d
a c
b
e
f
g h i
j
k
l
c) 9 years
25
50
75
100
Rela
tive
abun
danc
e (%
)
5 10 15 20 25 Time (min)
25
50
75
100
Rela
tive
abun
danc
e (%
)
5 10 15 20 25 Time (min)
25
50
75
100
Rela
tive
abun
danc
e (%
)
5 10 15 20 25 Time (min)
Figure 1. Py-GC/MS chromatogram of the E. globulus wood samples at different growth stages. The numbers refer to the lignin-derived compounds, whose identities and relative abundances are listed in Table 2. Letters refer to the carbohydrate-derived compounds: (a) hydroxyacetaldehyde; (b) (3H)-furan-2-one; (c) (2H)-furan-3-one; (d) furfural; (e) 2-hydroxymethylfuran; (f) 2,3-dihydro-5-methylfuran-2-one; (g) 5-methyl-2-furfuraldehyde; (h) (5H)-furan-2-one; (i) 4-hydroxy-5,6-dihydro-(2H)-pyran-2-one; (j) 2-hydroxy-3-methyl-2-cyclopenten-1-one; (k) 5-hydroxymethyl-2-furfuraldehyde; and (l) levogluco-sane.
www.plantphysiol.orgon August 21, 2018 - Published by Downloaded from Copyright © 2010 American Society of Plant Biologists. All rights reserved.
1
2
3
5
4 6
7
8
9
11
12
13
14
15
17
19
21
22
23 25
26
28 29 30
32
33
34
37
39
40
41 42
*
44 45 47
49
1
2
3
5
4 6
7 9
11
12
13
14
15
17
19
21
22
23
25
26
28 29
30
32
33
34
37
39 40
41 42
44 45
49
8
16 18 27
35
36
43
46 47
48
1
2 5
4 7
9 12
13
14
15
17
19
21
22
23
25
26
28
29 30
32
33
34
37
39
40
41
43
44 45
49
8
18 27
35
36
42 46
47
48
3 6
11
a) 1 month
b) 18 months
c) 9 years
25
50
75
100
Rela
tive
abun
danc
e (%
)
5 10 15 20 25
25
50
75
100
Rela
tive
abun
danc
e (%
)
5 10 15 20 25
25
50
75
100
Rela
tive
abun
danc
e (%
)
5 10 15 20 25
Time (min)
Time (min)
Time (min)
Figure 2. Py-GC/MS chromatogram of the MWLs isolated from the E. globulus wood samples at different growth stages. The identities and relative abundances of the released compounds are listed in Table 2.
www.plantphysiol.orgon August 21, 2018 - Published by Downloaded from Copyright © 2010 American Society of Plant Biologists. All rights reserved.
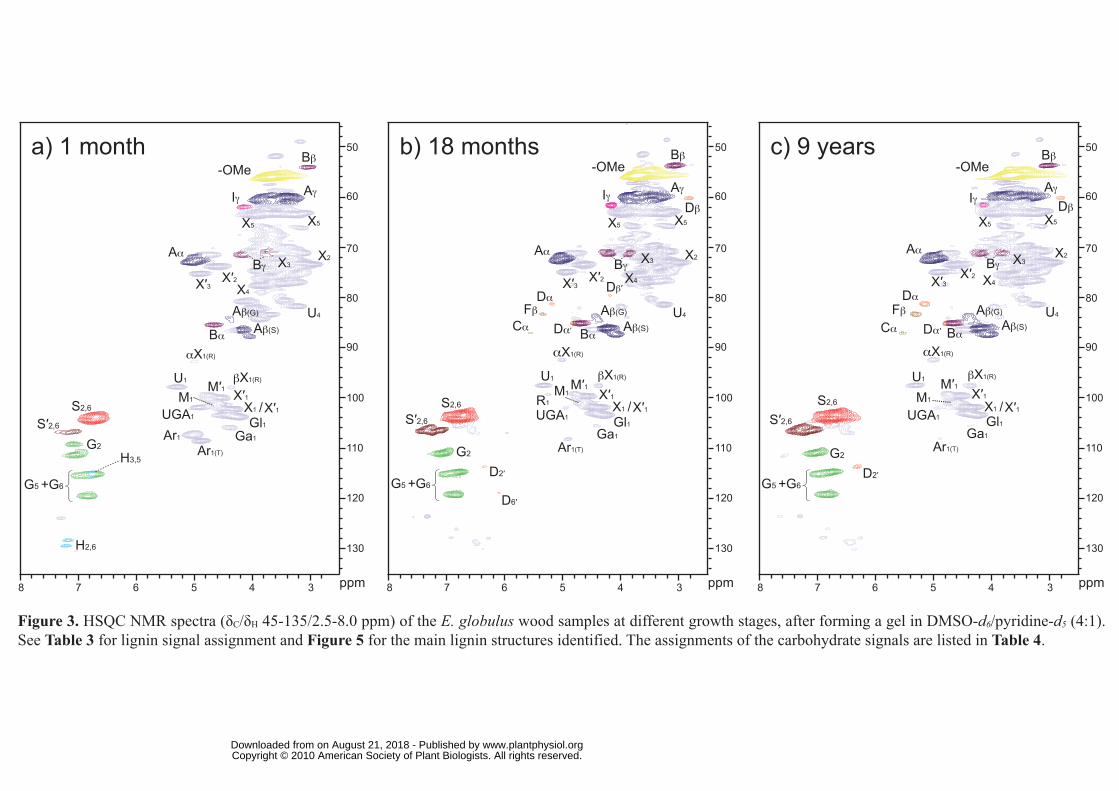
b) 18 months 50
60
70
80
90
100
110
120
130
7 6 5 4 38 ppm
S2,6
S′2,6
G2
D2′
D6′
Cα
FβDα
Bα
Aβ(G)
Aβ(S)
Dβ′
Dα′
Bγ
Bβ
Aα
AγIγDβ
X5 X5
X2X3
U4
X′3 X′2 X4
αX1(R)
U1 M′1X′1
Gl1Ga1
Ar1(T)
βX1(R)
-OMe
G5 +G6
UGA1X1 / X′1R1
M1
a) 1 month 50
60
70
80
90
100
110
120
130
7 6 5 4 38 ppm
S2,6
S′2,6
G2
Bα
Aβ(G)
Aβ(S)
Bγ
Bβ
Aα
AγIγ
H3,5
H2,6
X5 X5
X2X3
X′3 X′2X4
αX1(R)
U1 M′1βX1(R)
X′1
Gl1Ga1Ar1
Ar1(T)
-OMe
G5 +G6
UGA1X1 / X′1
U4
M1
c) 9 years 50
60
70
80
90
100
110
120
130
7 6 5 4 38 ppm
S2,6
S′2,6
G2
D2′
Cα
FβDα
Bα
Aβ(G)
Aβ(S)Dα′
Bγ
Bβ
Aα
AγIγ Dβ
X5 X5
X2X3
U4
X′3 X′2 X4
αX1(R)
U1 M′1X′1
Gl1Ga1
Ar1(T)
βX1(R)
-OMe
G5 +G6
UGA1X1 / X′1M1
Figure 3. HSQC NMR spectra (δC/δH 45-135/2.5-8.0 ppm) of the E. globulus wood samples at different growth stages, after forming a gel in DMSO-d6/pyridine-d5 (4:1). See Table 3 for lignin signal assignment and Figure 5 for the main lignin structures identified. The assignments of the carbohydrate signals are listed in Table 4.
www.plantphysiol.orgon August 21, 2018 - Published by Downloaded from Copyright © 2010 American Society of Plant Biologists. All rights reserved.
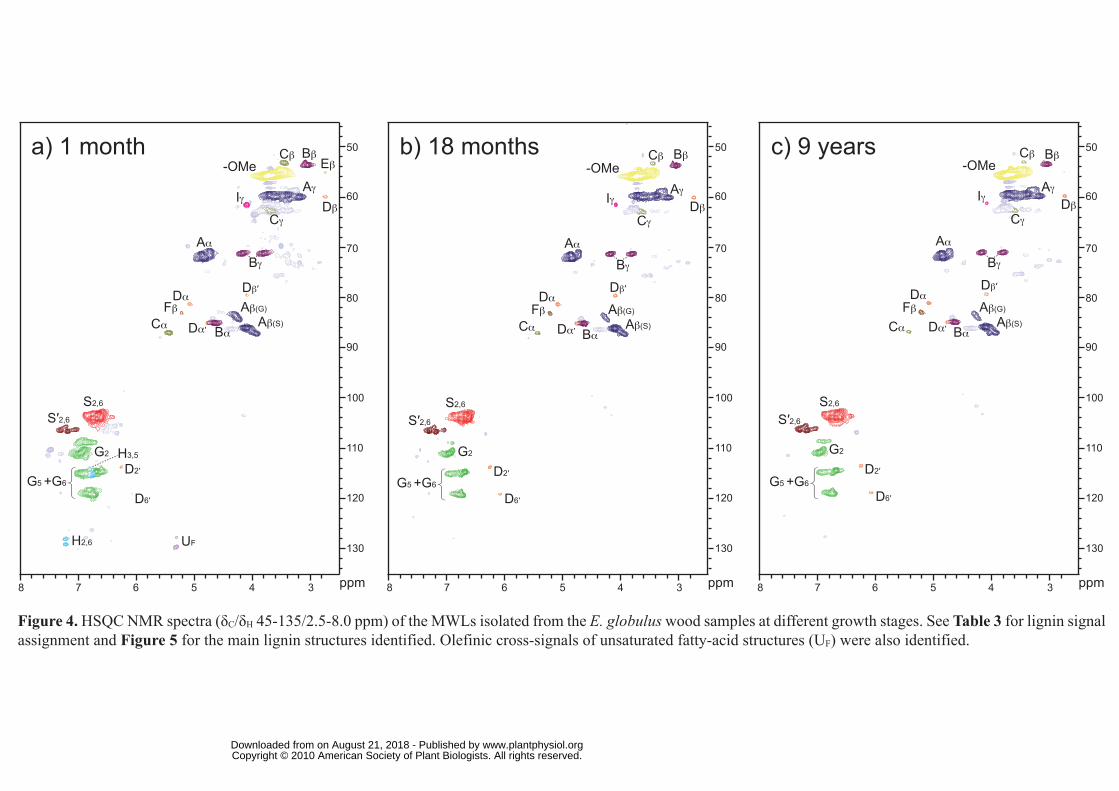
b) 18 months 50
60
70
80
90
100
110
120
130
7 6 5 4 38 ppm
Cα
S2,6
S′2,6
G2
FβDα
Bα
Aβ(G)
Aβ(S)
Dβ′
Dα′
Bγ
Bβ
Cγ
Cβ
Aα
AγIγ Dβ
D2′
D6′
-OMe
G5 +G6
c) 9 years 50
60
70
80
90
100
110
120
130
7 6 5 4 38 ppm
S2,6
S′2,6
G2
FβDα
Bα
Aβ(G)
Aβ(S)
Dβ′
Dα′
Bγ
Bβ
Cγ
Cβ
Aα
AγIγ Dβ
D2′
D6′
Cα
-OMe
G5 +G6
a) 1 month 50
60
70
80
90
100
110
120
130
7 6 5 4 38 ppm
S2,6
S′2,6
G2 H3,5
H2,6
Cα
FβDα
Bα
Aβ(G)
Aβ(S)
Dβ′
Dα′
Bγ
Bβ
Cγ
Cβ
Aα
AγIγ
Eβ
Dβ
D2′
D6′
-OMe
G5 +G6
UF
Figure 4. HSQC NMR spectra (δC/δH 45-135/2.5-8.0 ppm) of the MWLs isolated from the E. globulus wood samples at different growth stages. See Table 3 for lignin signal assignment and Figure 5 for the main lignin structures identified. Olefinic cross-signals of unsaturated fatty-acid structures (UF) were also identified.
www.plantphysiol.orgon August 21, 2018 - Published by Downloaded from Copyright © 2010 American Society of Plant Biologists. All rights reserved.
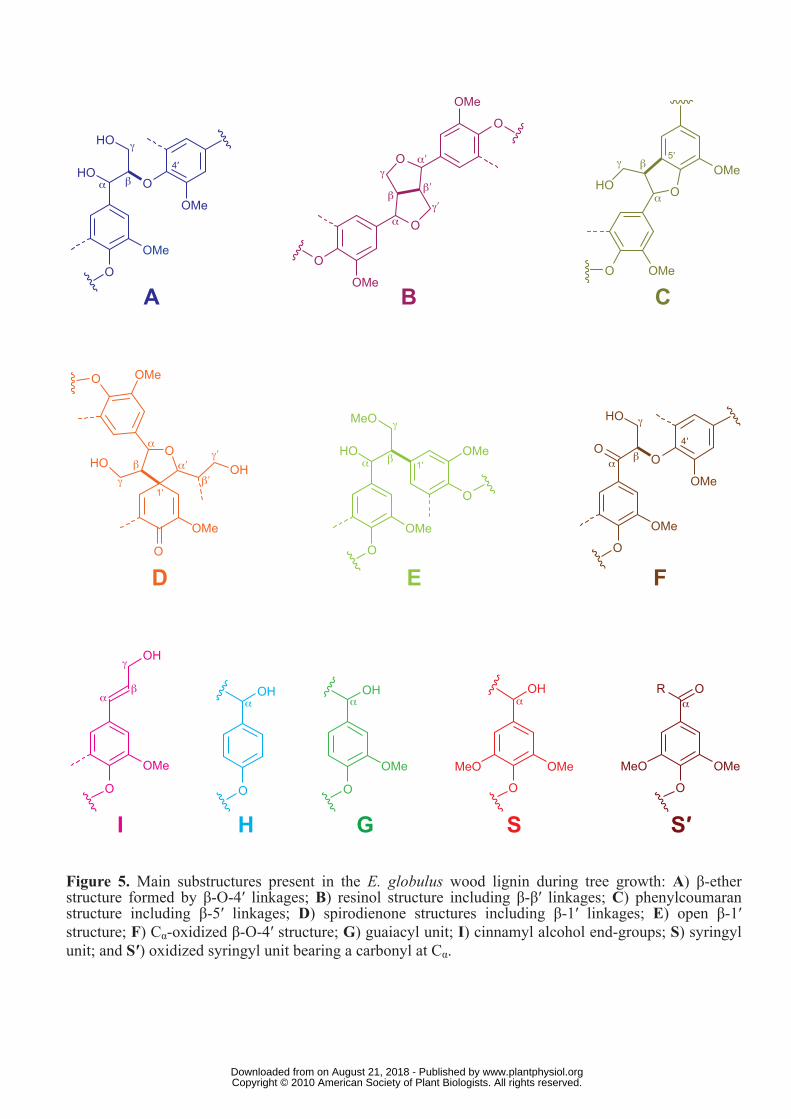
HOO
HO
OMe
OMe
O
α β
γ
4′
A
O
O
OMe
O
O
OMe
α
β
γαʹ
βʹ
γʹ
B
OHO
OMeO
OMe
α
βγ5′
C
O
OOHHO
OMeO
OMe
α
β
γ1′
αʹβʹ
γʹ
D
HO
MeO
OMe
O
OMe
O
α β
γ
1′
E
O
HO
O
O
OMe
OMeα
β
γ
4′
F
OH
O
OMe
αβ
γ
I
OH
O
α
H
OMe
O
OHα
G
O
OMe
OH
MeO
α
S
O
OMe
OR
MeO
α
S′
Figure 5. Main substructures present in the E. globulus wood lignin during tree growth: A) β-ether structure formed by β-O-4′ linkages; B) resinol structure including β-β′ linkages; C) phenylcoumaran structure including β-5′ linkages; D) spirodienone structures including β-1′ linkages; E) open β-1′ structure; F) Cα-oxidized β-O-4′ structure; G) guaiacyl unit; I) cinnamyl alcohol end-groups; S) syringyl unit; and S′) oxidized syringyl unit bearing a carbonyl at Cα.
www.plantphysiol.orgon August 21, 2018 - Published by Downloaded from Copyright © 2010 American Society of Plant Biologists. All rights reserved.
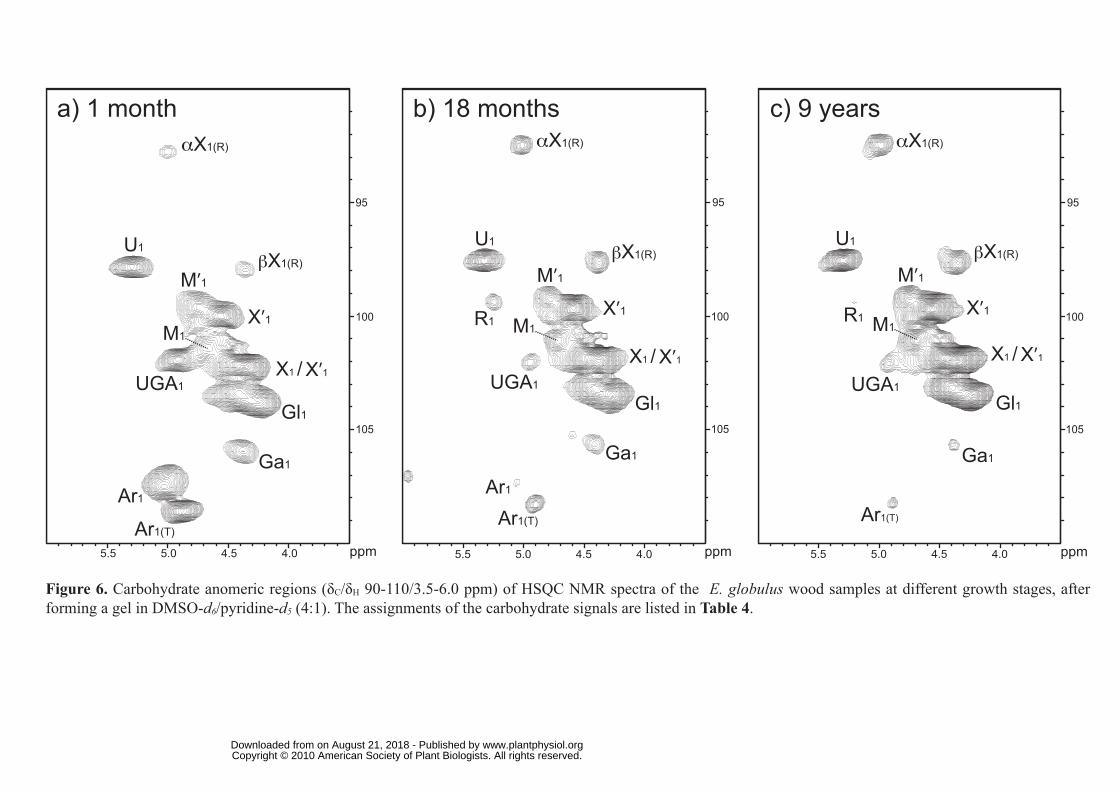
αX1(R)
U1
M’1βX1(R)
X’1
Gl1
Ga1
Ar1
Ar1(T)
a) 1 month
105
100
95
5.5 5.0 4.5 4.0 ppm
X1 / X’1UGA1
M1
αX1(R)
U1
M’1βX1(R)
X’1
Gl1
Ga1
Ar1(T)
c) 9 years
105
100
95
ppm 5.5 5.0 4.5 4.0
R1
X1 / X’1
UGA1
M1
b) 18 months
105
100
95
ppm 5.5 5.0 4.5 4.0
αX1(R)
U1
M’1βX1(R)
X’1
Gl1
Ga1
Ar1
Ar1(T)
R1
X1 / X’1UGA1
M1
Figure 6. Carbohydrate anomeric regions (δC/δH 90-110/3.5-6.0 ppm) of HSQC NMR spectra of the E. globulus wood samples at different growth stages, after forming a gel in DMSO-d6/pyridine-d5 (4:1). The assignments of the carbohydrate signals are listed in Table 4.
www.plantphysiol.orgon August 21, 2018 - Published by Downloaded from Copyright © 2010 American Society of Plant Biologists. All rights reserved.
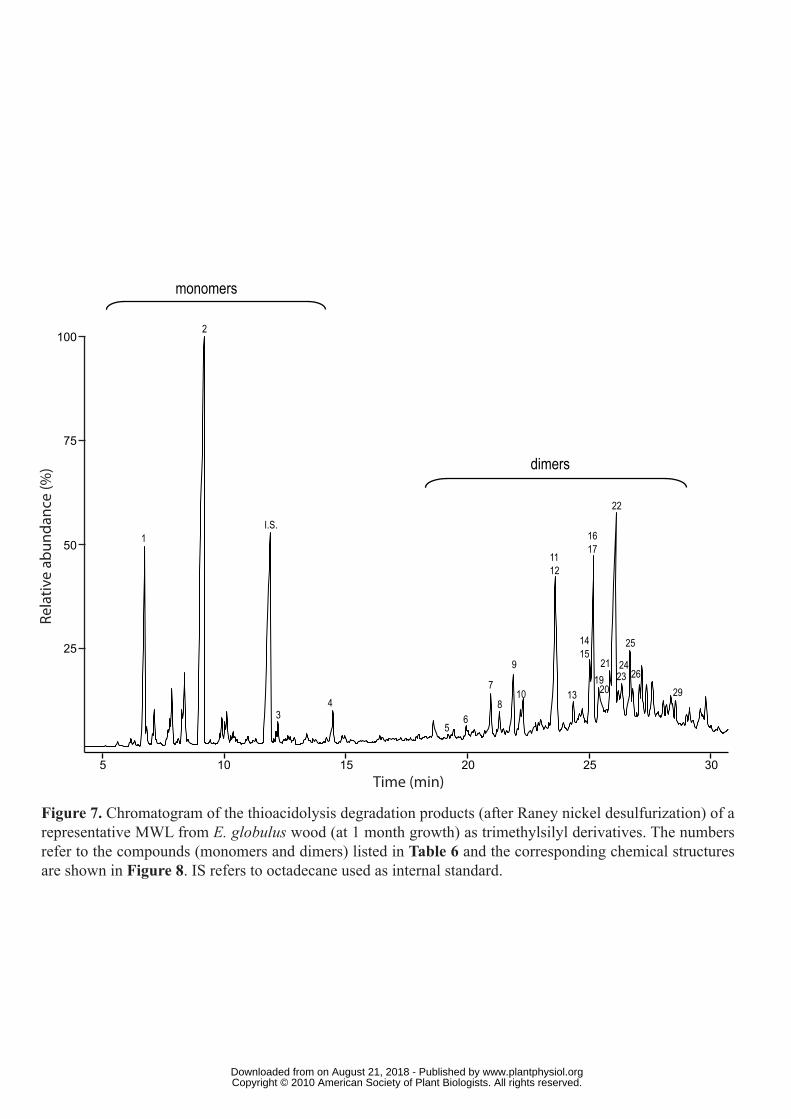
5 10 15 20 25 30
1
2
I.S.
3 4
5 6
7
8
9
10
11 12
13
14 15
16 17
22
21
20 19 23
24
25
26 29
monomers
dimers
25
50
75
100
Rela
tive
abun
danc
e (%
)
Time (min)
Figure 7. Chromatogram of the thioacidolysis degradation products (after Raney nickel desulfurization) of a representative MWL from E. globulus wood (at 1 month growth) as trimethylsilyl derivatives. The numbers refer to the compounds (monomers and dimers) listed in Table 6 and the corresponding chemical structures are shown in Figure 8. IS refers to octadecane used as internal standard.
www.plantphysiol.orgon August 21, 2018 - Published by Downloaded from Copyright © 2010 American Society of Plant Biologists. All rights reserved.
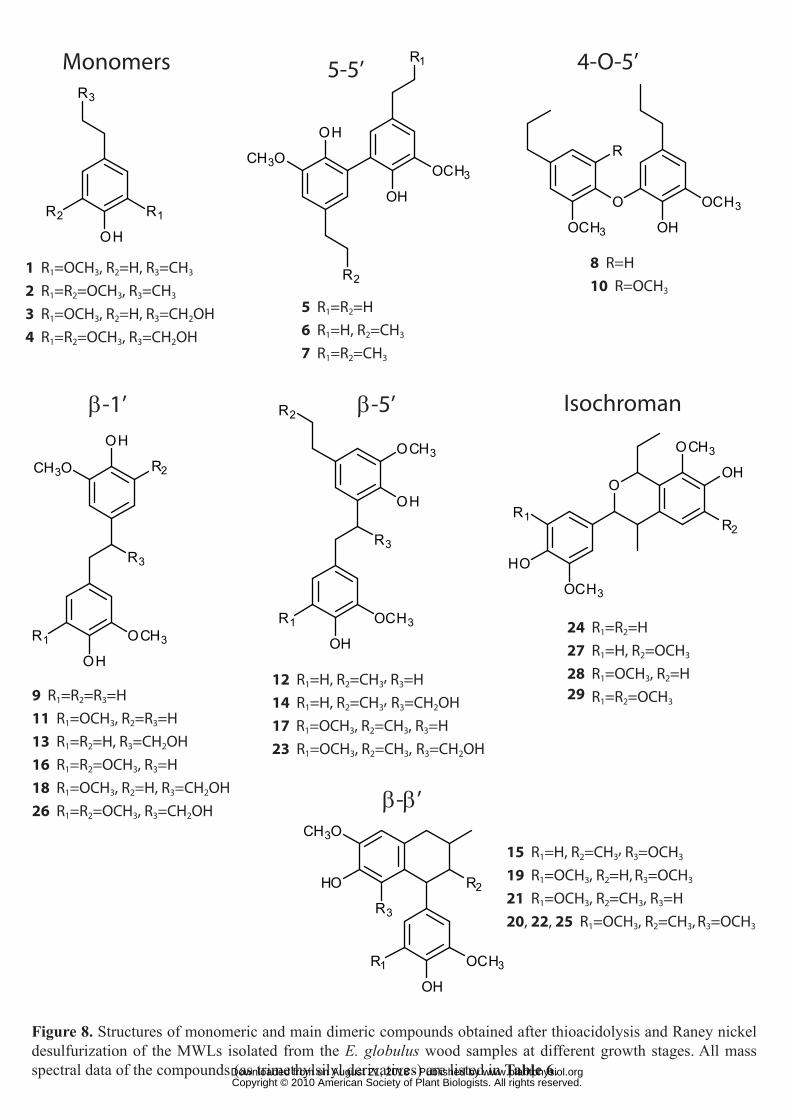
R3
OH
R1R2
1 R1=OCH3, R2=H, R3=CH3
2 R1=R2=OCH3, R3=CH3
3 R1=OCH3, R2=H, R3=CH2OH4 R1=R2=OCH3, R3=CH2OH
Monomers R1
OH
OCH3
OH
H3C O
R2
5 R1=R2=H6 R1=H, R2=CH3
7 R1=R2=CH3
5-5’
O
OCH3
R
OH
OCH3
8 R=H10 R=OCH3
4-O-5’
R3
OH
OCH3
OH
OCH3R1
R2
12 R1=H, R2=CH3, R3=H14 R1=H, R2=CH3, R3=CH2OH17 R1=OCH3, R2=CH3, R3=H23 R1=OCH3, R2=CH3, R3=CH2OH
β-5’
R3
OCH3
OH
R1
R2
OH
9 R1=R2=R3=H11 R1=OCH3, R2=R3=H13 R1=R2=H, R3=CH2OH16 R1=R2=OCH3, R3=H18 R1=OCH3, R2=H, R3=CH2OH 26 R1=R2=OCH3, R3=CH2OH
β-1’
O
OCH3
OH
R2
OCH3
HO
R1
24 R1=R2=H27 R1=H, R2=OCH3
28 R1=OCH3, R2=H
29 R1=R2=OCH3
Isochroman
HO
R3
R1
OH
OCH3
R2
15 R1=H, R2=CH3, R3=OCH3
19 R1=OCH3, R2=H, R3=OCH3
21 R1=OCH3, R2=CH3, R3=H20, 22, 25 R1=OCH3, R2=CH3, R3=OCH3
β-β’
Figure 8. Structures of monomeric and main dimeric compounds obtained after thioacidolysis and Raney nickel desulfurization of the MWLs isolated from the E. globulus wood samples at different growth stages. All mass spectral data of the compounds (as trimethylsilyl derivatives) are listed in Table 6.
H3C O
H3C O
www.plantphysiol.orgon August 21, 2018 - Published by Downloaded from Copyright © 2010 American Society of Plant Biologists. All rights reserved.