Embed Size (px)
Citation preview

Mercado de Capitales: Regulación e
Infraestructura de Transporte
TEMA: Avances en la Consolidación del
Mercado Integrado Latinoamericano (MILA)
Olver Bernal
Especialista Lider de Mercados Financieros
1

CONTENIDO
INTRODUCCION
DESARROLLO DEL MILA
FUTURO CORTO Y MEDIANO PLAZO
INTEGRACION FINANCIERA EN LA
CONCLUSION

Latin America compared with Europe and Asia
3
1. Argentina, Belize, Bolivia, Brazil, Chile, Colombia, Costa Rica, Ecuador, El Salvador, the Falkland Islands, Guatemala, Guiana, Honduras, Mexico, Nicaragua, Panama, Paraguay, Peru, Surinam, Uruguay and Venezuela. 2. Austria, Belgium, Bulgaria, Cyprus, Czech Republic, Denmark, Estonia, Finland, France, Germany, Greece, Hungary, Ireland, Italy, Latvia, Lithuania, Luxembourg, Malta, the Netherlands, Poland, Portugal, Rumania, Slovakia, Slovenia, Spain, Sweden and the United Kingdom. 3. Cambodia, North Korea, South Korea, China, Singapore, Philippines, Hong Kong, Indonesia, Laos, Macao, Malaysia, Myanmar, Thailand, Taiwan, Vietnam. 4. Nominal GDP in 2010 (US$ in PPP) 2. Actual growth between 2005 and 2010 (2005 prices) Source: EIU
•Total GDP3 of US$ 4.7
trillion
•21 countries
•2 main languages
–Spanish and
Portuguese
•548 million inhabitants
•20 million km2
•7 time zones
–UTC-2 - UTC-8
Latin America1 Europe (EU27)2 Expanded Southeast Asia3
•Total GDP4 of US$ 9.4
trillion
•15 countries
•More than a dozen
languages
•3.4 billion inhabitants
•14 million km2
•4 time zones
–UTC+5 - UTC+8
•Total GDP4 of US$ 16.3
trillion
•27 countries
•Dozens of languages
– 23 in the European
Union
•499 million inhabitants
•4.4 million km2
•6 time zones
–UTC - UTC+5
Increased complexity

Latam financial services market is small but has a great potential
4
...but growing
faster...
Value (US$ T, 2011) % of ww. 2006-2011 CAGR
1. Economist Intelligence Unit (from OECD data); EIU estimates based on partial data used where final data not available 2. World Federation of Exchanges members; North America includes NASDAQ OMX which includes Copenhagen, Helsinki, Iceland, Stockholm, Tallinn, Riga and Vilnius Stock Exchanges. Asia-Pacific total region excludes Osaka SE and NSE India to avoid double counting with Tokyo SE and Bombay SE, respectively 3. Investment Company Institute; does not include funds of funds; Middle East not tracked 4. Swiss Re Sigma research; 5. GDP based on EIU data for the countries analyzes for each of the four types of financial services Source: World Federation of Exchanges; Investment Company Institute; EIU; Swiss Re; BCG analysis
Market Cap.
(US$)2
Mutual fund AUM
(US$)3
Banking assets (US$)1
Insurance premium
(US$)4
Penetration over GDP (20115)
Latin America is still
a relatively small
market...
Latin Am. 2.2
EMEA 12.9
Asia - Pac 14.7
N. America 17.6 37%
31%
27%
5% 10%
-6%
4%
-4%
Latin Am. 1.1
EMEA 7.3
Asia - Pac 2.9
N. America 12.4 52%
12%
31%
5% 18%
-1%
4%
2%
68%
242%
164%
105% 16%
31%
50%
3% 20%
5%
15%
4%
Latin Am. 0.2
EMEA 1.8
Asia - Pac 1.4
North Am. 1.3 29%
30%
38%
3% 17%
3%
10%
1%
Latin Am. 3.5
EMEA 57.8
Asia - Pac. 34.0
N. America 17.7
3%
7%
7%
8%
41%
51%
70%
104%
26%
34%
15%
74%
...and with significant
potential going
forward
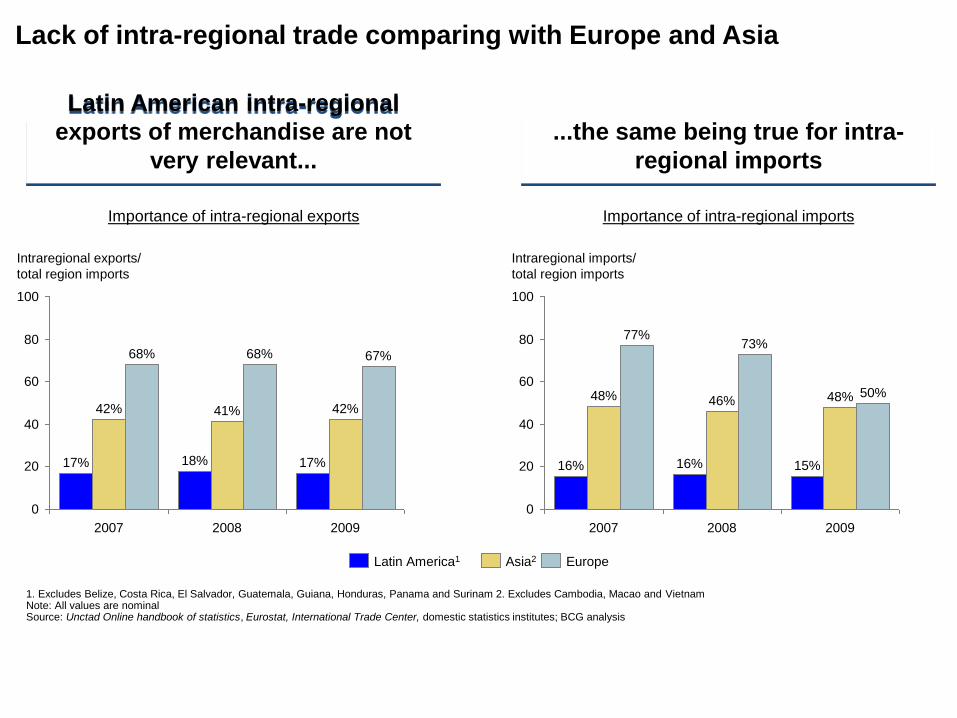
Latin American intra-regional
exports of merchandise are not
very relevant...
...the same being true for intra-
regional imports
Intraregional exports/
total region imports
2009
67%
42%
17%
2008
68%
41%
18%
2007
68%
42%
17%
80
60
100
40
0
20
Importance of intra-regional exports Importance of intra-regional imports
Europe Asia2 Latin America1
0
20
40
60
80
100
Intraregional imports/
total region imports
2009
50% 48%
15%
2008
73%
46%
16%
2007
77%
48%
16%
1. Excludes Belize, Costa Rica, El Salvador, Guatemala, Guiana, Honduras, Panama and Surinam 2. Excludes Cambodia, Macao and Vietnam Note: All values are nominal Source: Unctad Online handbook of statistics, Eurostat, International Trade Center, domestic statistics institutes; BCG analysis
Lack of intra-regional trade comparing with Europe and Asia

MILA: CAPITALIZATION BURSATIL
Agosto 2013
6
$269.689
$240.181
$120.914
43%
38%
19%
Chile
Colombia
Peru
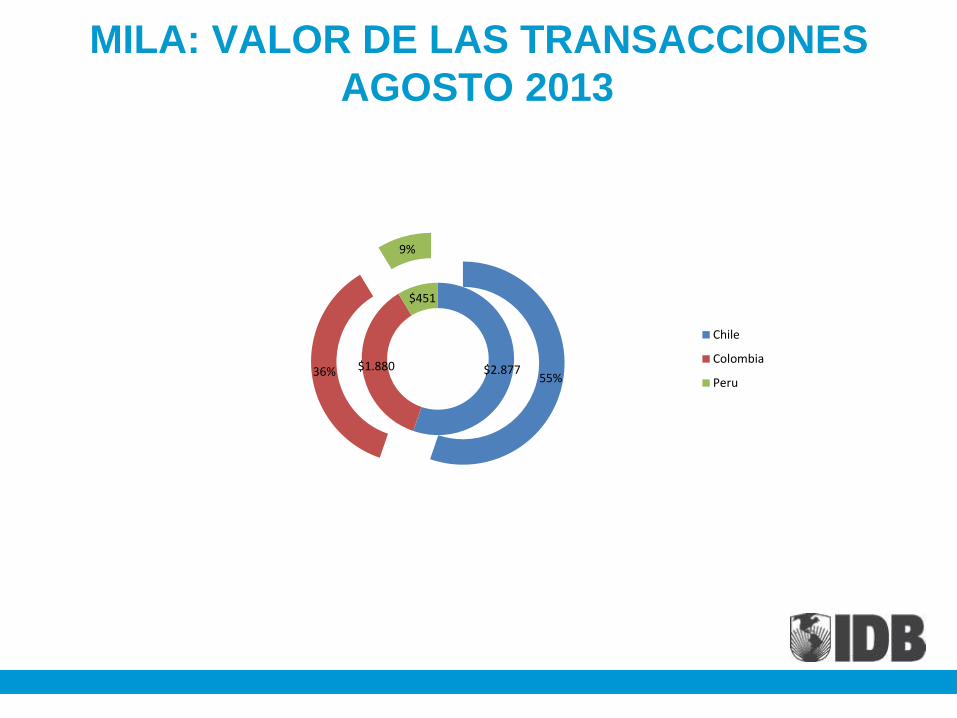
MILA: VALOR DE LAS TRANSACCIONES
AGOSTO 2013
$2.877 $1.880
$451
55% 36%
9%
Chile
Colombia
Peru

NUMERO DE EMISORES
AGOSTO 2013
-
50
100
150
200
250
Chile
Colombia
Peru
Number of Issuers
Number of Issuers
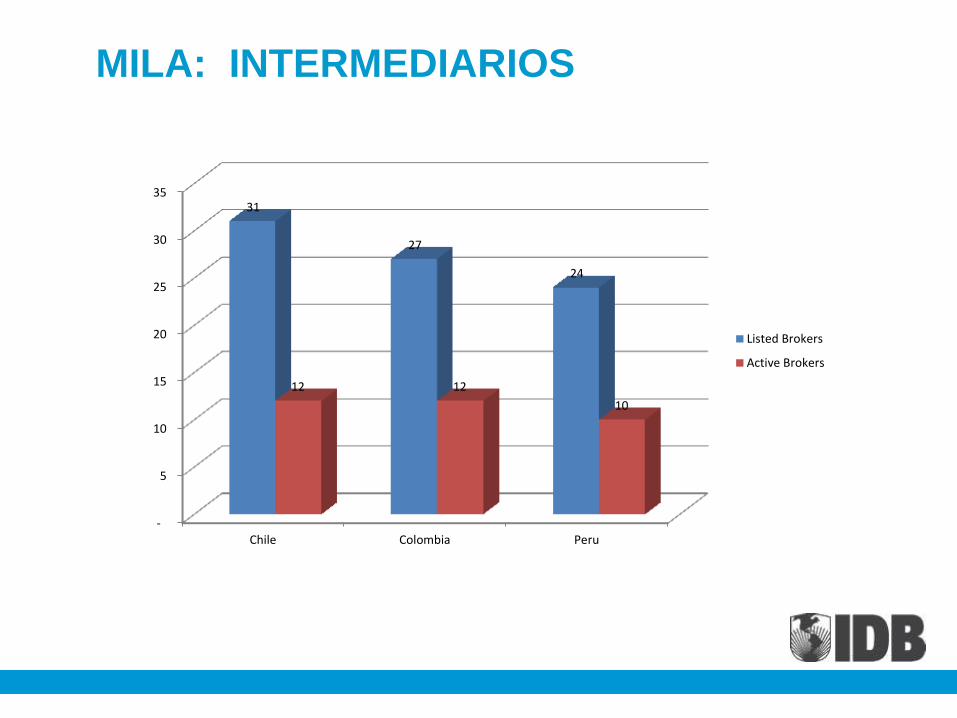
MILA: INTERMEDIARIOS
-
5
10
15
20
25
30
35
Chile Colombia Peru
31
27
24
12 12
10
Listed Brokers
Active Brokers

MILA: FONDOS MUTOS EN OPERACION
AGOSTO 2013
$-
$2.000.000
$4.000.000
$6.000.000
$8.000.000
$10.000.000
$12.000.000
CHILE
COLOMBIA
PERU

MILA: TRANSACCIONES AGREGADAS
HASTA AGOSTO 2013
$- $10.000.000 $20.000.000 $30.000.000 $40.000.000 $50.000.000 $60.000.000 $70.000.000 $80.000.000 $90.000.000
CHILE
COLOMBIA
PERU
$18.700.964
$11.832.096
$5.284.902
$193.983
$82.599.715
$10.258.932 PERU
COLOMBIA
CHILE

MILA: FUTURO
CORTO PLAZO – INGRESO DE MEXICO
– ARMONIZACION DEL MERCADO DE RENTA VARIABLE
– MODELO INTEGRADO DE SUPERVISION
MEDIANO PLAZO – AMPLIACION DEL MERCADO
– ARMONIZACION DEL MERCADO FINANCIERO
– INTEGRACION FINANCIERA
• TRATAMIENTO TRIBUTARIO
• MERCADO CAMBIARIO
• REGULACION FINANCIERA

INTEGRACION FINANCIERA EN LA
MILA
ALIANZA DEL PACIFICO
BRASIL

Dinamizar la integración regional un
objetivo de la agenda internacional Avance bancarización
Desarrollo del Mercado de Capitales
Impacto competitividad
Fortalecimiento seguridad financie
Promoción de la eficiencia
Y ante contagio de crisis, menor vulnerabilidad del sector via mayor
diversificacion

MUCHAS GRACIAS