Embed Size (px)
Citation preview
Mechanical properties at high strain rates
E. El-Magd
To cite this version:
E. El-Magd. Mechanical properties at high strain rates. Journal de Physique IV Colloque,1994, 04 (C8), pp.C8-149-C8-170. <10.1051/jp4:1994823>. <jpa-00253378>
HAL Id: jpa-00253378
https://hal.archives-ouvertes.fr/jpa-00253378
Submitted on 1 Jan 1994
HAL is a multi-disciplinary open accessarchive for the deposit and dissemination of sci-entific research documents, whether they are pub-lished or not. The documents may come fromteaching and research institutions in France orabroad, or from public or private research centers.
L’archive ouverte pluridisciplinaire HAL, estdestinee au depot et a la diffusion de documentsscientifiques de niveau recherche, publies ou non,emanant des etablissements d’enseignement et derecherche francais ou etrangers, des laboratoirespublics ou prives.
JOURNAL DE PHYSIQUE IV Colloque C8, supplement au Journal de Physique 111, Volume 4, septembre 1994
Mechanical properties at high strain rates
E. El-Magd
Aachen Technical University, Augustinerlach 4,52062 Aachcn, Gemany
Abstract In the range of high strain rates, the mechanical behaviour of materials is characterized by an increased strain rate sensitivity, by increasing effects of mass inertia forces and by the adiabatic character of the deformation process. For the relation between stress, strain and strain rate, empirical formulae are now mostly replaced by material laws based on structural mechanical models, whose parameters are to be determined by adequate systematic methods. Also special effects such as the influence of strain rate on the strain at the lower yield point of bcc-metals can be quantitatively described by simple models. The fracture mode and ductility are highly affected by the strain rate. The elongation at fracture can be increased due to the stabilising effect of the strain rate sensitivity similar to the super plastic behaviour. On the other hand, it can be reduced by the thermal induced instability, by the increasing sensitivity for internal notches and by the multiaxial stress state caused by inertia forces. The strain rate affects also the ductile fracture conditions as well as the transition temperature to clearage fracture.
Constitutive equations Under dynamic loading, high strain rate gradients are initiated in the material which are accompanied by a change in temperature due to the adiabatic character of high rate deformation processes. In order to estimate the mechanical behaviour under multiaxial dynamic loading, constitutive equations must be established, such that they are valid over wide ranges of strain rate and temperature. Overviews concerning the mechanical behaviour under high strain rates are represented e.g. in [l], [2]. In order to formulate the material properties, a viscoplastic behaviour is often assumed by using, for example, the Perzyna-equation [3]:
where p is the shear modulus, f is square root of the second invariant of the stress deviator Sij and F = ( f l l i ) - l is the relative difference between f and the shear flow stress K = O F / & The type of the function @ ( F ) is often estimated using simple rheological models assuming Qi ( F ) = F and leading to a linear relation of the type U = crF(c) + q i which is acceptable for metals only at strain rates > 103 S-*.
Article published online by EDP Sciences and available at http://dx.doi.org/10.1051/jp4:1994823
JOURNAL, DE PHYSIQUE IV
Empirical relations
Different empirical relations could be implemented in eq. (1). With cP (F) = exp (F/a)-l , the corresponding relation between stress and stress rate in the uniaxial case reads
a = [l + a In ( l + ;/a)]
and with 9 (F) = Film the empirical formula
is used. Both of the relations (2) and (3) were already introduced 1909 by Ludwik [4] considering the existence of a strain-rate dependent " internal friction". Different modified versions of these equations are still the most commonly used description for the influence of the strain rate on the flow stress at low strain rates.
The strain hardening function aF(e) can be formulated using the well-known empirical relations of Ludwik [5], Hollomon [6] or Swift [7]. The latter reads
UF = K(i, T ) (B + c)n . (4)
The influence of temperature on the flow stress is also described by different relations of the type
or according to [g] a = a0(&, i ) [l - (T/Tm)U]
with Tm as the absolute melting point of the material. On applying such empirical relations, the flow stress is usually represented by a = fl(6) f2(2) f3(T) as a product of three separate functions of strain, strain rate and tem- perature, which is a rough approximation especially in the case of moderate strain rates of i < 103s-l. However, the basic problem is that nearly all the parameters of these empirical equations can only be regarded as constants within relatively small ranges of E ,
i and T . In order to determine these functions, a great number of experiments are needed. Therefore, constitutive equations based on structure-mechanical models are gaining incre- asing interest as they can improve the description of the mechanical behaviour in wider ranges of strain rates and may, if carefully used, allow the extrapolation of determined relations.
Structure-mechanical models The macroscopic plastic strain rate of a metal results from the accumulation of sub- microscopic slip events caused by the dislocation motion in the time unit:
In this equation, the Burgers vector b and the Taylor-factor MT are constants for a given material whereas the mobile dislocation density Nm is mainly a function of strain. The relation between the dislocation velocity v and the stress was experimentally determined
for several materials [g]. It can be represented in the range of low stresses by a power law: v = v0 ( O / U ~ ) ~ . At very high stresses, the dislocation velocity approaches asymptotically the shear wave velocity c~ according to a = avU/,/l - (u/cT)? Another function v = CT exp (-Dla) which fulfils this condition was introduced by Gilman [g].
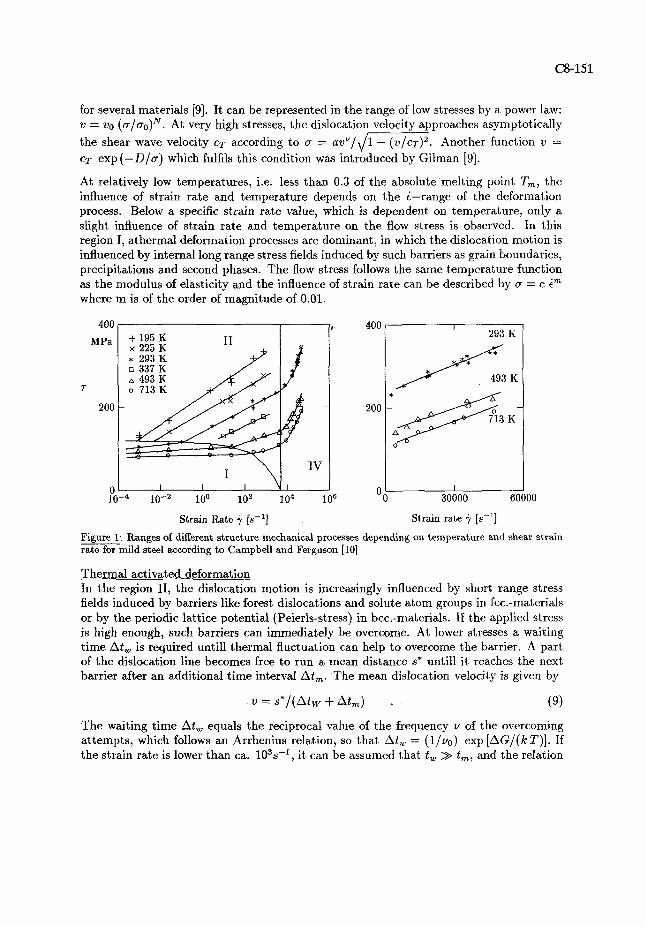
At relatively low temperatures, i.e. less than 0.3 of the absolute melting point T,, the influence of strain rate and temperature depends on the i-range of the deformation process. Below a specific strain rate value, which is dependent on temperature, only a slight influence of strain rate and temperature on the flow stress is observed. In this region I, athermal deformation processes are dominant, in which the dislocation motion is influenced by internal long range stress fields induced by such barriers as grain boundaries, precipitations and second phases. The flow stress follows the same temperature function as the modulus of elasticity and the influence of strain rate can be described by a = c im where m is of the order of magnitude of 0.01.
Strain Rate j [S-'] Strain rate j [S- ' ]
Figure 1: Ranges of different structure mechanical processes depending on temperature and shear strain rate for mild steel according to Campbell and Ferguson [l01
Thermal activated deformation In the region 11, the dislocation motion is increasingly influenced by short range stress fields induced by barriers like forest dislocations and solute at,om groups in fcc.-materials or by the periodic lattice potential (Peierls-stress) in bcc.-materials. If the applied stress is high enough, such barriers can immediately be overcome. At lower stresses a waiting time At, is required untill thermal fluctuation can help to overcome the barrier. A part of the dislocation line becomes free to run a mean distance S* untill it reaches the next barrier after an additional time interval At,. The mean dislocation velocity is given by
v = s*/(Atw + At,) . (9)
The waiting time At, equals the reciprocal value of the frequency v of the overcoming attempts, which follows an Arrhenius relation, so t,hat At, = (llvo) exp [AG/(k T ) ] . If the strain rate is lower than ca. 103s-l, it can be assumed that t, >> t,, and the relation
C8-152 JOURNAL DE PHYSIQUE IV
between strain rate and stress is then given by
i = &(E) exp -- [ ;;l where io = b N, v0 s*/MT. The activated free enthalpy AG depends on the difference U* = a - a, between the applied stress and the athermal stress according to AG = AGO - 1 V* do* so that
with V* = bl*s*/MT the reduced activation volume, which depends on the force- displacement function of the dislocation-barrier interaction. If this function is represented by a rectangle, V* is considered to be independent of stress. The relation between strain rate and stress is given by i = to(,) ~ X ~ [ - { A G ~ - V * ( U - ~ ~ ) ) / ( ~ T ) ] . A linear relationship would be expected between a and T in the form: U = aG(c) + [AGO - k T In (io/i)]/V*, which was found to be valid e.g. for pure $luminium [ l l]. For given stress and strain, the value of T In (io/i) is constant for all temperatures and also for all strain rate values between io exp[-AGo/(k T)] and io. This means that the increase of stress at constant strain with decreasing temperature or with increasing strain rate is the same, as long as the values of
AG = T In (ioli) (12) are equal in both cases. Because the activation volume and the athermal stress U are functions of strain, Kawata et al. [12], replaced V* by AGo/[o0(l + He)], whereas Lindholm [l11 applied V* = V: + b C @ . Other experimental investigations showed non-linear relations between a and AG (Figure 2) yielding a stress dependent activation volume. These non-linearities were described by Vohringer [13, 141 and by Kocks et. al. [l51 using:
AGO U-a, p i = io exp [-F {l - [----l } ]
a o - 0,
These equations are valid for the thermal activation region i o exp[-AGO/ (L T)] < i < io.
An alternative method to describe this non-linearity was introduced by Armstrong [16,17]. His analysis is based on the Petch relation for the temperature dependence of the lower yield point of mild steel. Petch [l81 proposed a linear relation between the width of the dislocation and the temperature of the form W = wo(1 + aT). The friction stress, here the Peierls-Nabarro stress, U,$, which is necessary to overcome the lattice potential field is then given by: a$ = A exp[-wo(l + ol T)]. Regarding the coupling between T and In i according to (12), Armstrong introduced the relation:
As an approximation, the thermal activated component of the stress was given by Krabiell
which means a linear relation, however, between log(o - ua) and T and which is fairly supported by experimental results on low-carbon steel (Figure 2-b).
AG = T ln(io/i) [10-20 J] Temperature T [K]
MPa
Figure 2: Flow stress a and thermal activated stress (a - a,) of Steel St E 47 at lower yield point or at a constant strain as a function of temperature T and strain rate E [l91
Lower yield point o 10+2s-1 loo S-l
+ 10-Is-' * 10-2s-1
Linear viscous behaviour At strain rates higher than some 103 S-' the stress is high enough, so that At, vanishes with respect to At, and damping effects dominate. The dislocation velocity yields [20]:
S* b v = - = -(T - 7.h)
At, B
and the flow stress can be represented by
a = oh(€) + v i
with = MTB/(~~N,) and o h as the stress required to overcome barriers without thermal assistance. It can be determined by extrapolation of the stress values to 6 = 0. An adequate discription of the flow behaviour in this high strain rate range can be given using the temperature function interoduced by Petch [l81 in the form:
a = [K (B + c)" + i] exp (- TIT,) (18)
considering that the stress o h is proportional to the square root fi of the forest disloca- tion density, whose rate of change d N f / & is assumed to follw a hyperbolic function with a finite initial value at E = 0. These assuptions lead a strain hardening function which is identical to the emperical relation introduced by Swift [7]
fi A continuous transition takes place, when the strain rate is increased from the thermal activation range (11) to the damping range (IV). This can be described in two different
C8-154 JOURNAL DE PHYSIQUE IV
ways: Regarding the dislocation velocity to be equal to v = s*/(At, + At,), the strain rate can be represented by:
where 5 is a function of strain. Alternatively, the continuous transition can be described by an additive approximation. The stress is regarded to be the sum of the athermal, the thermal activated and the drag stress. According to this approximation:
Determination of the parameters The determination of the parameters of eqs. (14) or (17) from experimental data is less difficult than the estimation of p, g, a:, A G ~ , ii of eq. (13). A systematic method for the determination of p, a; and q was introduced by Nojima [21]. Since the relation between log a* and log [l - (AG/AGo)'/q] should be linear according to eq. (13), he plotted this relation for different values of q - namely 1, 312 and 2 - and chose the value giving the best linear fit. The slope of the linear relation is equal to (l/p) and the log a*- axis intercept equals a:. Another systematic method was suggested by Vtihringer [22] according to which the activation volume V = kTdlni/da* is to be determined e.g. by strain rate jump tests as a function of U* and all other parameters can hence be determined by integrating V* da*. This method was successfully applied to experimental results of different steels at relatively low strain rate values [23]. As a modification of the Nojima and Vlihringer analyses, the following procedure can be proposed: At first the thermal activated stress component a* = a-[aao E(T)/E(To)] is calculated by subtracting the athermal component which is assumed to follow the temperature function of the modulus of elasticity E (Fig. 3a). The activation volume
dln i V = k T -
do*
is determined as a function of a* by numerical differentiation of the a* - In 2-relation (Fig. 3b). Comparing eqs. (11) and (13), the relation
can be deduced. The corresponding relation between the activation volume and the thermal part of the stress follows by differentiation with respect to a,*:
At very small values of a*, i.e. at higher temperatures and low 2 values, it can be assumed that
a* << a,' :

so that, in the case of a double-logarithmic representation, the slope of the In V - a* curve in the range of very small a* values can be considered being approximately equal to -(l - p) (Fig. 3b). With p thus being determined and with the relation V(a*), the following functions of a* can be determined:
According to eq.(23), Q and C are related by
In a double-logarithmic representation of Q as a function of (1 - C) (Fig. 3c), the slope is equal to (q - 1) and the extrapolation to C = 0 facilitates obtaining the value for (q AGolk) and hence AGO. The remaining parameter io can be determined according to VGhringer by extrapolation of the relation In l(AG) to AG = 0, where AG is determined for the different a*-values according to AGO - S V* do*.
Figure 3: Determination of the parameters of eq. (13) from impact torsion tests on cast iron GGV-30
Deformation with non-constant strain rate and Temperature A monotonic deformation process with constant strain rate and temperature can be des- cribed by equation (13) if the influence of strain on the athermal and the thermal activated components of the stress is taken into account by means of a suitable function such as in eq.(4). Assuming the applicability of a mechanical equation of state, the value of the stress at an arbitrary time point would only depend on the current values of strain, strain rate and temperature. A sudden change of strain rate from il to i 2 would lead to a cor- responding increase of stress to the value 02, which is also determined at the same strain in another experiment with a strain rate i2 constant from the beginning. The results of several investigations showed that this assumption is not valid. After each sudden change of i or T, a stress transient is observed. Depending on the previous deformation history,
(3-156 JOURNAL DE PHYSIQUE IV
the stress is at first either higher or lower than the expected value. With further defor- mation, the stress approaches the a(€)-curve expected for the new values of i and T. In order to describe these transients after strain rate or temperature jumps and specially in case of reversed loading, at least one parameter of eq.(13), eg. ao, must be considered as an internal material variable, whose incremental change with respect to strain (and not its absolute value) is dependent on the current deformation parameters This internal parameter represents the microstructural state and is determined by the integration of an evolution equation accounting for each structural change during the deformation process. Based on earlier studies [24], Follansbee and Kocks introduced a mechanical threshold stress model1 [25], according to which the flow stress is specified as a function of current values of the strain rate an temperature as well as of an internal state variable denoted the mechanical threshold stress b which represents the flow stress at T = 0 K. This internal variable is seperated in two cpmponents: an athermal component S, which is assumed to be independent of strain, and a thermal component St which is history dependent. The flow stress is represented by a = &, + (S - b,) f ( i , T). In the case of thermally activated flow, the stress yields
During deformation, b varies with strain due to dislocation accumulation and dynamic recovery. The differential variation depends on the current value of 8 according to d8lde = O0 [l - f (S)]. The evolution equation which fits well the experimental results is found to
In this equation, S, is the saturation value of S which depends on the curren values of strain rate and temperature according to
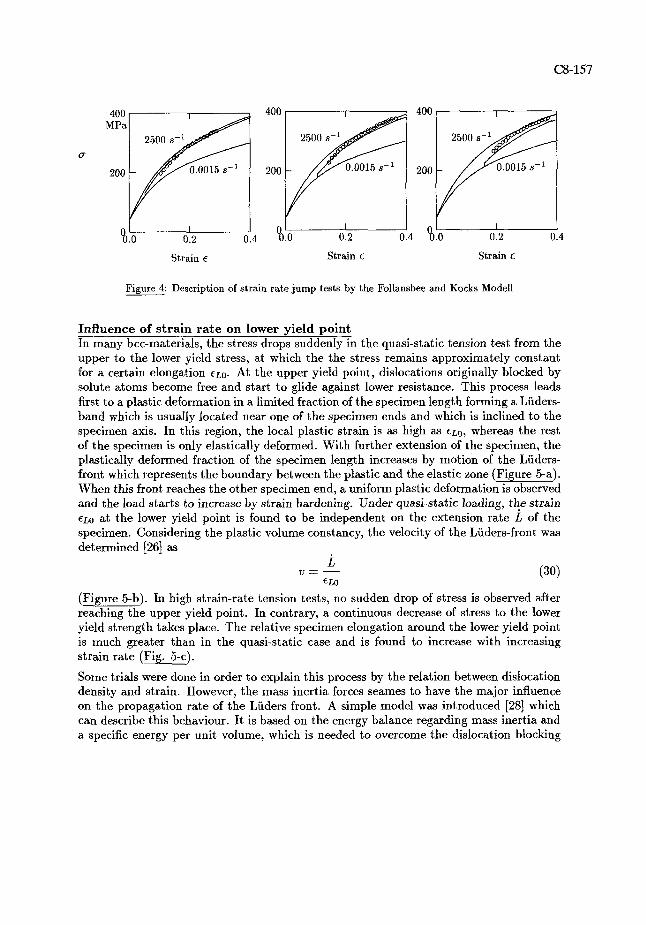
where bso, iso and A are constants. The initial hardening rate O0 is roughly C G120 and can be determined form experimental results as a function of the strain rate. If a specimen is deformed at a constant temperature with a constant strain rate 4, the threshold stress increases with strain according to eq.(28) approaching the corresponding saturation value SS1 given by eq.(29). After reaching a strain of €1 and a threshold stress of Sl, a strain rate jump to i2 leads at first to a relatively small change in the value of the flow stress according to eq.(27) with the same value &=S1 as far as no significant structural rearrangments take place during the short time of the strain rate jump. With further deformation, the threshold stress changes due to structure evolution and approaches a new saturation value SS2 which corresponds to the strain rate i2. The difference between the flow stress just after the strain rate jump and the flow stress determined in a test with a constant strain rate of i2 diminishes with increasing strain.
2500 S-'
U
200 0.0015 S-'
0 .0 0.2 0.4 0.0 0.2 0.4 0.0 0.2 0.4
Strain E Strain E Strain E
Figure 4: Description of strain rate jump tests by the Follansbee and Kocks Model1
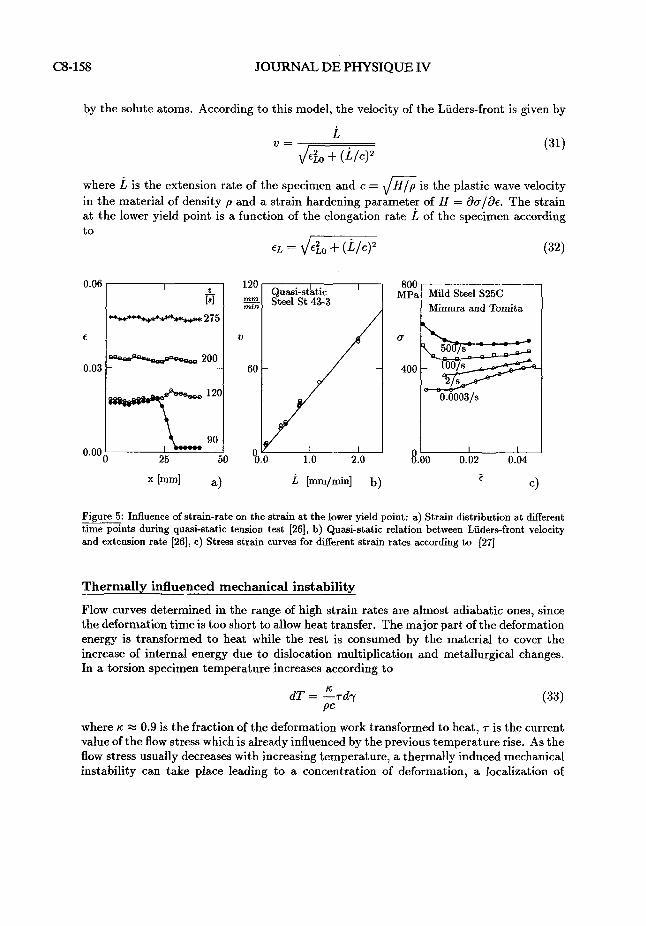
Influence of strain ra te on lower yield point In many bcc-materials, the stress drops suddenly in the quasi-static tension test from the upper to the lower yield stress, at which the the stress remains approximately constant for a certain elongation ELO. At the upper yield point, dislocations originally blocked by solute atoms become free and start to glide against lower resistance. This process leads first to a plastic deformation in a limited fraction of the specimen length forming a Luders- band which is usually located near one of the specimen ends and which is inclined to the specimen axis. In this region, the local plastic strain is as high as wo, whereas the rest of the specimen is only elastically deformed. With further extension of the specimen, the plastically deformed fraction of the specimen length increases by motion of the Luders- front which represents the boundary between the plastic and the elastic zone (Figure 5-a). When this front reaches the other specimen end, a uniform plastic deformation is observed and the load starts to increase by strain hardening. Under quasi-static loading, the strain ELO at the lower yield point is found to be independent on the extension rate L of the specimen. Considering the plastic volume constancy, the velocity of the Luders-front was determined [26] as
(Figure 5-b). In high strain-rate tension tests, no sudden drop of stress is observed after reaching the upper yield point. In contrary, a continuous decrease of stress to the lower yield strength takes place. The relative specimen elongation around the lower yield point is much greater than in the quasi-static case and is found to increase with increasing strain rate (Fig. 5-c).
Some trials were done in order to explain this process by the relation between dislocation density and strain. However, the mass inertia forces seames to have the major influence on the propagation rate of the Luders front. A simple model was introduced [28] which can describe this behaviour. It is based on the energy balance regarding mass inertia and a specific energy per unit volume, which is needed-to overcome the dislocation blocking
03-158 JOURNAL DE PHYSIQUE IV
by the solute atoms. According to this model, the velocity of the Liiders-front is given by
where L is the extension rate of the specimen and c = m is the plastic wave velocity in the material of density p and a strain hardening parameter of H = da/dc. The strain at the lower yield point is a function of the elongation rate L of the specimen according to
EL = 4- (32)
Mimura and Tomita
Figure 5: Influence of strain-rate on the strain at the lower yield point: a) Strain distribution at different time points during quasi-static tension test [26], b) Quasi-static relation between Liiders-front velocity and extension rate [26], c) Stress strain curves for different strain rates according to [27]
Thermallv influenced mechanical instabilitv
Flow curves determined in the range of high strain rates are almost adiabatic ones, since the deformation time is too short to allow heat transfer. The major part of the deformation energy is transformed to heat while the rest is consumed by the material to cover the increase of internal energy due to dislocation multiplication and metallurgical changes. In a torsion specimen temperature increases according to
where K M 0.9 is the fraction of the deformation work transformed to heat, T is the current value of the flow stress which is already influenced by the previous temperature rise. As the flow stress usually decreases with increasing temperature, a thermally induced mechanical instability can take place leading to a concentration of deformation, a localization of
heat and even to the formation of shear bands. An overview of different criteria for the thermally induced mechanical instability are presented in [29].
Adiabatic flow curve The adiabatic flow curve can be determined numerically for an arbitrary function 7iso(y, j, T) for the shear stress which has been determined in isothermal deformation tests. In order to obtain a closed-form analytical solution demonstrating the adiabatic flow behaviour, the simple stress-temperature relation T = ~;,,(y, j ) @(AT) can be used [30]-[31]. In this case, the change of temperature can simply be determined by separation of variables and integration: For example
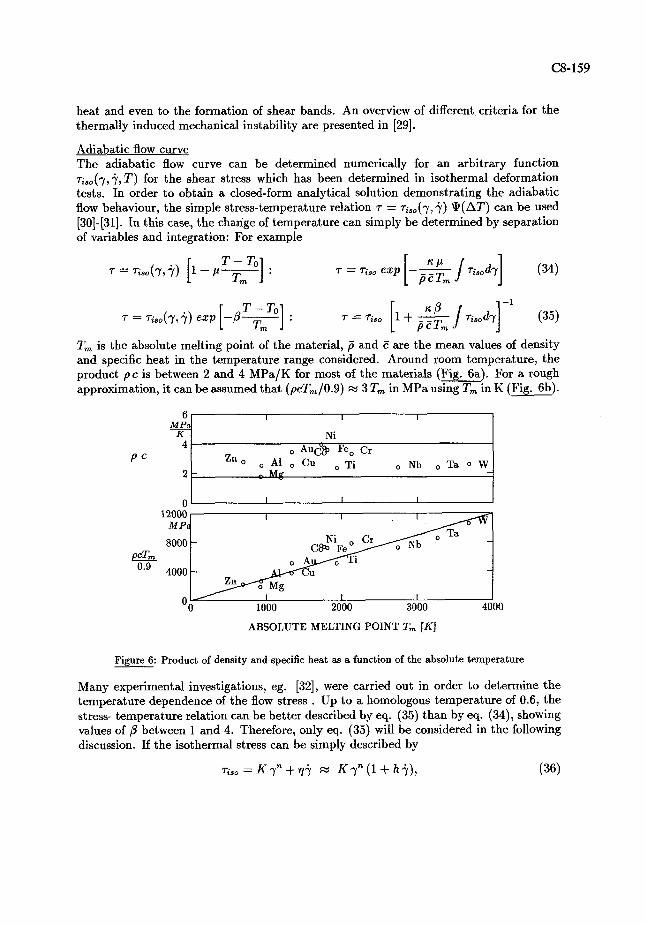
Tm is the absolute melting point of the material, p and c are the mean values of density and specific heat in the temperature range considered. Around room temperature, the product pc is between 2 and 4 MPa/K for most of the materials (Fig. 6a). For a rough approximation, it can be assumed that (p~T~lO.9) x 3 Tm in MPa using Tm in K (Fig. 6b).
ABSOLUTE MELTING POINT T,,, [K]
Figure 6: Product of density and specific heat as a function of the absolute temperature
Many experimental investigations, eg. [X], were carried out in order to determine the temperature dependence of the flow stress . Up to a homologous temperature of 0.6, the stress- temperature relation can be better described by eq. (35) than by eq. (34), showing values of p between 1 and 4. Therefore, only eq. (35) will be considered in the following discussion. If the isothermal stress can be simply described by
C8-160 JOURNAL DE PHYSIQUE IV
the flow stress determined in an adiabatic test is then given by
where
The parameter a can be considered as approximately constant represented by its mean value over the deformation process which is of the order of magnitude of 1 K/MPa. The flow curve shows a maximum at the critical shear strain of
Obviously, the influence of the strain rate on the adiabatic flow stress is reduced if the shear strain is increased so far as 7 = K yn h is also divided by [l+aKyl+n(l+ hj)/(l+n)] giving an apparent viscosity v*. If the adiabatic stress, determined at different values of strain, is plotted as a function of the strain rate, the relation ~ ( j ) remains approximately linear but the slope q* decreases with increasing strain y. For a given strain value y, the stress value TO determined by extrapolation of the ~(j)-relation to j = 0 is represented by
a 7 0 = K y n l + K yl+n] -l [ ( l + n)T,
(40)
with a maximal value of
Using the values of romaX and yoc determined from the experimental results, the parameters K and a can be estimated by
the remaining unknown parameter n can be determined by fitting the curve rO(y). The same equations can be applied for tension or compression tests, if T is replaced by the true stress a and y by the true strain c. The values of the parameter a determined by this method are often higher - in some cases by a factor greater than 5 - than 0.9 P / ( p c T,). The experimentally determined flow curve lies much lower than the expected adiabatic one.
MPa 2
400 - 1
200 -
T - ? K ? K
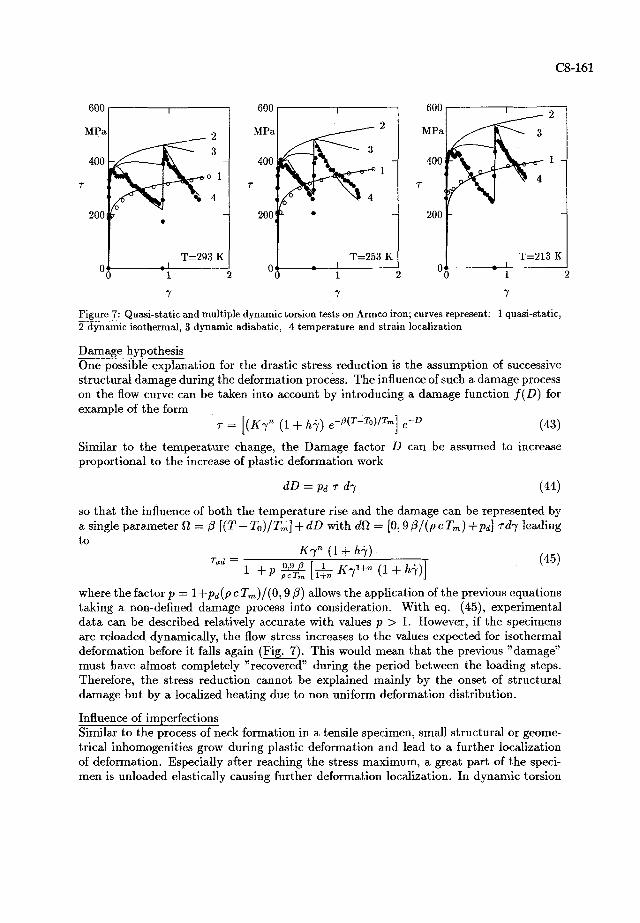
Figure 7: Quasi-static and multiple dynamic torsion tests on Armco iron; curves represent: 1 quasi-static, 2 dynamic isothermal, 3 dynamic adiabatic, 4 temperature and strain localization
Damage hypothesis One possible explanation for the drastic stress reduction is the assumption of successive structural damage during the deformation process. The influence of such a damage process on the flow curve can be taken into account by introducing a damage function f(D) for example of the form
T = [ ( ~ ~ n (1 + h?) e - ~ ( ~ - ~ o ) I ~ m ] ,-D (43)
Similar to the temperature change, the Damage factor D can be assumed to increase proportional to the increase of plastic deformation work
so that the influence of both the temperature rise and the damage can be represented by a single parameter R = ,B [(T - To)/T,] + dL) with d52 = [O, 9 @/(p c T,) +pd] rdy leading
Kyn (l + h?) r a d =
1 K71tn (1 + h?)] + P pcTm [l+n
where the factor p = l +pd(p c T,)/(O, 9 ,B) allows the application of the previous equations taking a non-defined damage process into consideration. With eq. (45), experimental data can be described relatively accurate with values p > 1. However, if the specimens are reloaded dynamically, the flow stress increases to the values expected for isothermal deformation before it falls again (Fig. 7). This would mean that the previous "damage" must have almost completely "recovered" during the period between the loading steps. Therefore, the stress reduction cannot be explained mainly by the onset of structural damage but by a localized heating due to non uniform deformation distribution.
Influence of imperfections Similar to the process of neck formation in a tensile specimen, small structural or geome- trical inhomogenities grow during plastic deformation and lead to a further localization of deformation. Especially after reaching the stress maximum, a great part of the speci- men is unloaded elastically causing further deformation localization. In dynamic torsion
(3-162 JOURNAL DE PHYSIQUE IV
tests, the deformation localization leads to a heat concentration and hence a higher local temperature rise. Coffey and Armstrong [33] introduced a global temperature localization factor which is the ratio of the total specimen volume V. to the volume V, of the plastic zone.
According to this assumption the parameter p in eq.(45) has to be understood as a tem- perature localization factor and not as a structural damage factor. The influence of inhomogenity on the strain distribution has been demonstrated by using a simple model [34] which represents the torsion specimen by two slices, a reference one and another slice with slight deviations in strength or dimensions. Furthermore, the deformation localiza- tion could be traced during the torsion test by observing the deformation of grid lines on the specimen suface by means of high-speed photography [35],[36]. For the numerical simulation, the initial wall thickness s or the radius r of the torsion specimen and the flow stress parameter K are assumed not to be exactly constant along the gauge length but to have small deviations from their nominal values.
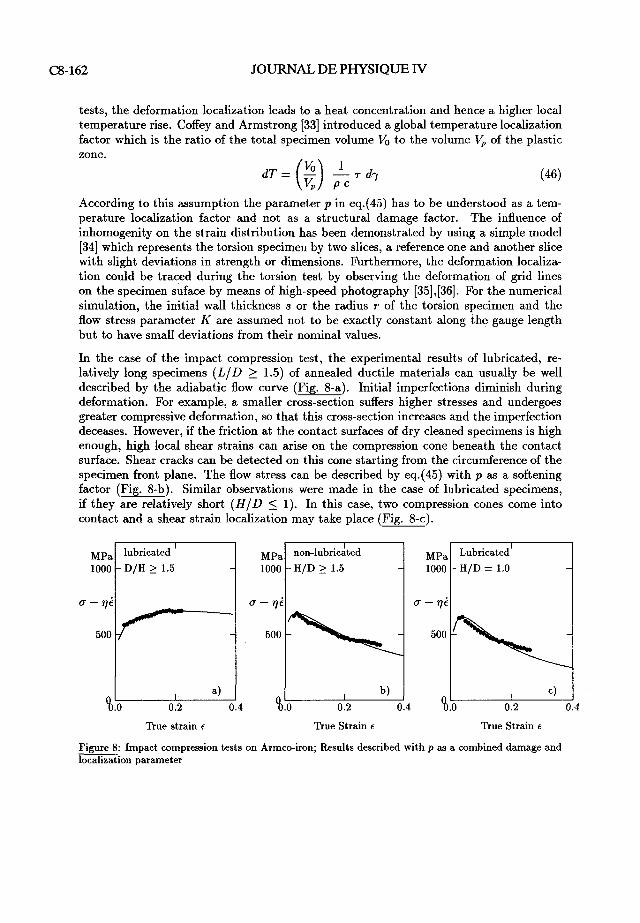
In the case of the impact compression test, the experimental results of lubricated, re- latively long specimens (LID > 1.5) of annealed ductile materials can usually be well described by the adiabatic flow curve (Fig. 8-a). Initial imperfections diminish during deformation. For example, a smaller cross-section suffers higher stresses and undergoes greater compressive deformation, so that this cross-section increases and the imperfection deceases. However, if the friction at the contact surfaces of dry cleaned specimens is high enough, high local shear strains can arise on the compression cone beneath the contact surface. Shear cracks can be detected on this cone starting from the circumference of the specimen front plane. The flow stress can be described by eq.(45) with p as a softening factor (Fig. 8-b). Similar observations were made in the case of lubricated specimens, if they a.re relatively short (HID 5 1). In this case, two compression cones come into contact and a shear strain localization may take place (Fig. 8-c).
True strain C True Strain C True Strain c
Figure 8: Impact compression tests on Armco-iron; Results described with p as a combined damage and localization parameter
~p~ non-1ubric;ted 1000 - H/D 2 1.5
a - p l i
500 -
I
~p~ l000
U - p l i
500
8 . 0 0.2 0.4 8 . 0 0.2 0.4 8.0 0.2
lubricated l - D/H 2 1.5 -
-
I a)
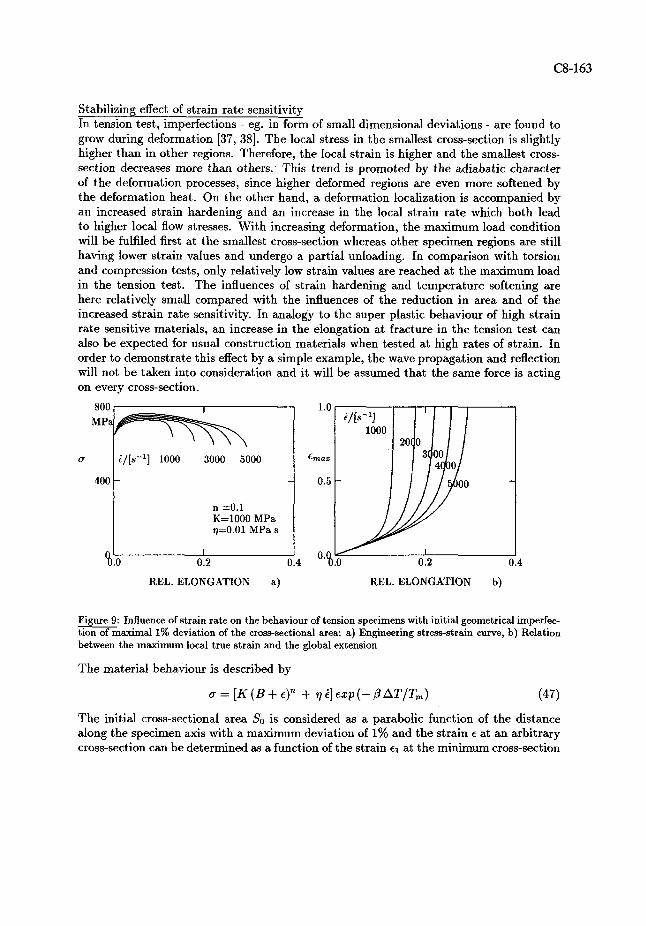
Stabilizing effect of strain rate sensitivity In tension test, imperfections - eg. in form of small dimensional deviations - are found to grow during deformation [37, 381. The local stress in the smallest cross-section is slightly higher than in other regions. Therefore, the local strain is higher and the smallest cross- section decreases more than others. This trend is promoted by the adiabatic character of the deformation processes, since higher deformed regions are even more softened by the deformation heat. On the other hand, a deformation localization is accompanied by an increased strain hardening and an increase in the local strain rate which both lead to higher local flow stresses. With increasing deformation, the maximum load condition will be fulfiled first at the smallest cross-section whereas other specimen regions are still having lower strain values and undergo a partial unloading. In comparison with torsion and compression tests, only relatively low strain values are reached at the maximum load in the tension test. The influences of strain hardening and temperature softening are here relatively small compared with the influences of the reduction in area and of the increased strain rate sensitivity. In analogy to the super plastic behaviour of high strain rate sensitive materials, an increase in the elongation at fracture in the tension test can also be expected for usual construction materials when tested at high rates of strain. In order to demonstrate this effect by a simple example, the wave propagation and reflection will not be taken into consideration and it will be assumed that the same force is acting on every cross-section.
n =0.1 K=1000 MPa I q=0.01 MPa s I
REL. ELONGATION a) REL. ELONGATION b)
Figure 9: Influence of strain rate on the behaviour of tension specimens with initial geometrical imperfec- tion of maximal 1% deviation of the cross-sectional area: a) Engineering stress-strain curve, b) RRlation between the maximum local true strain and the global extension
The material behaviour is described by
a = [K ( B + c)" + r] i] e x p (- ,B ATIT,) (47)
The initial cross-sectional area So is considered as a parabolic function of the distance along the specimen axis with a maximum deviation of 1% and the strain c at an arbitrary cross-section can be determined as a function of the strain cl at the minimum cross-section
C8-164 JOURNAL DE PHYSIQUE IV
by a numerical evaluation of the relation
with a* = a/T,. Additionally, the elastic unloading of lower deformed regions after reaching the maximum load has to be considered. The total extension of the specimen is calculated by integrating exp(~) - 1 over the specimen length. If an upper limit for the maximum local stain is considered as a failure criterion, the relative elongation at fracture increases with increasing strain rate.
Ductile fracture Ductile fracture usually starts at material regions of high local strain and triaxiality. Nu- merical methods such &S FEM facilitates the-predeter&nation of such zones. Also under high rates of strain, ductile fracture occurs due to nucleation, growth and coalescence of micro-cavities. In a basic study on the growth of cavities by plastic deformation of the surrounding material, McClintock et al. 1391 deduced a closed-form analytical solution for the rate-of-growth of cylindrical cavities of elliptical cross-section with the semi-axes a and b in a strain-hardening material which is:
where R = (a + b)/2 is the mean cross-sectional radius and a, and ab are the normal stresses in the direction of the ellipse axes. Rice and Tracy [40] deduced a closed form solution for the rate-of-change of the mean radius of a void in an ideal plastic material as a function of the current value of the radius and of the ratio between the mean stress and the effective stress
8 = const . :
Hancock and Mackenzie [41] showed that if the failure strain is assumed to be inversely proportional to the relative cavity growth rate (dln R l d ~ ) , the strain at fracture can be deduced from the Rice and Tracy criterion and be expressed as
where E, is the effective strain before void nucleation. A more detailed analysis was presented in [42] and [43], in which the rate-of-change of the volume fraction of voids, is considered as the sum of three different contributions: 1) the growth of existing voids, which is proportional to (1 - f ) and to the current local strain rate, 2) the nucleation of new voids depending on the effective strain rate in the matrix and 3) the nucleation of new voids which is proportional to the rate of change of the mean stress U,. In addition, a flow criterion for progressively cavitating ductile materials is applied. The volume fraction f of inclusions in the material has a great influence on the fracture strain. Experimental results of Marini et al. [44] showed that the factor 0.28 of eq. (50) should be replaced by higher values according to the volume fraction of inclusions. In
[41], the local plastic strain which leads to coalescence of cavities was found to be highly influenced by f . Using special treatments for ferritic steels, different residual sulpher- concentrations were realized by Holland, Halim and Dahl [45, 461 which were found to affect the fracture strain (Fig. 10a). These results were described by the modified relation:
where instead of the factor 3/2 a parameter P is introduced with values ranging between 5 and 23. The degree of purity had a drastic influence on E,, which was affirmed by the investigation of further materials and treatments (Fig. lob).
Figure 10: Influence of sulpher content in steel on: a) the local effective strain at fracture as a function of ratio of mean stress to flow stress [45] and b) the fracture strain for high multiaxiality as a function of the true strain in the neck zone of unnotched specimens [46], (Z = reduction of area at fracture)
Because of its simplicity, eq. (52) is also applied to the range of high strain rates after introducing correction factors considering the influences of strain rate and temperature, for example by Johnson and Cook [g] as
with io = Is-' and Tm the absolute melting point. As a,/@, i and T change during deformation, it is assumed that fracture starts when a damage parameter D = ~ ( A C / E ~ ) reaches the value of 1. According to this relation, the fracture strain should increase with strain rates for positive D4-values which were determined in [g] on relatively blunt notches leading to um/a-values smaller than 1.3. In this case, the increase of ~f with i may at least be partially related to the stabilizing effect of the increasing strain-rate sensitivity which hinders the neck formation in tension tests. Through computational and experimental investigations of differently sharp notches, Barton et al. [47] showed that in the case of copper (Fig. l l a ) no significant influence of the strain rate on the failure strain exists. On the other hand, the failure strain of Remco iron decreased as the strain rate was increased. For this material a negative value was determined for the Parameter D4. If this result is discussed in terms of the Hancock-Makenzie-condition eq. (51), it means
(3-166 JOURNAL DE PHYSIQUE IV
that the nucleation strain E, is dependent on the strain rate. This can be explained by assuming that the nucleation process can also be controlled by the stress, which increases with the increasing strain rate. The relations discussed above were developed for quasi-static loading without special consideration of the influence of high strain rates. Curran et al. [48] studied the cavitation arising in metallic specimens subjected to impact loading in the plate impact test. At the midplane of the specimen, high tensile stresses are induced. By varying impact velocity and geometry, the amplitude and the duration of the tensile stress peak can be changed. In the case of 1145-Aluminium, ellipsoidal voids were formed, while micro-cracks were observed in Armco iron. These cavities were measured, classified according to size and counted. The so determined size distribution could be described well by
N = No esp(-R/Rl) (54)
where N is the number of cavities with radius R while No and RI are constants. This distribution is also well known as a suitable description for creep cavitation at high tem- peratures [49, 501. According to the results of [48], this function does not change by varying the stress peak or the duration, It can be shown that, in this case, the rate of growth of voids is given by the relation Ntot/Ntot = R/R1 , where Ntot is the total number of cavities in the volume regarded. From this relation, two conclusions can be deduced: 1) The rate of size growth R is proportional to the relative void initiation rate, and 2) The rate R of growth is independent of the current value R of the size and hence small voids are growing with the same rate as large ones. This second conclusion can hardly be understood by the simple plasticity models discussed above which indicate that R is proportional to R for given stresses, strains and strain rates. However, the assumption of a constant RI is only an approximation. It can be assumed that RI changes slightly with load duration and that R/R x cNtOt/Ntot. In the case of creep, numerical computations showed a similar distribution of the inter-crystalline crack size, when the crack initiation is assumed to be controlled only by the local equivalent creep strain [50]. For a non-hardening but strain-rate sensitive material, the rate-of-growth of a spherical void at the centre of a metallic sphere which is subjected to a hydrostatic tension a,, the rate of radius increase is given in analogy to [51] by:
If the flow stress at very high strain rates can be described by a = ~i with neglection of the athermal and the thermal activated stress components, the rate-of-growth can be written as
A similar relation was introduced by [52] and [53] which reads R / R = (a, - U H ) / ( ~ v), where a~ is the threshold stress for the void growth. If om/a is constant, then ef -6% is inversely proprtional to it. However, this ratio changes during deformation depending on the initial geometry and the parameters of the material law. Therefore, a representative value of u,/a can be considered in combination with a proportionality factor, which depends on material parameters, i and T:
- o Remco-Iron quasi-static 3 * -
o 0.2m/s n 10 m/s * * brittle 0.2 m/s *
brittle 10 m/s * O
0 1 2
Figure 11: Local effective strain at fracture of notched specimens as function of the ratio of mean stress to effective stress for different elongation rates [47]
Transition to brittle fracture With strain rate and multiaxiality increasing, the local stress peaks become so high that they can reach the microscopic cleavage fracture strength oj of the material. Brittle fracture is expected, when the local value of the maximum principal stress exceeds aJ over a characteristic distance X, which depends on the microstructure of the material [54].
TEMPERATURE TEMPERATURE TEMPERATURE
Figure 12: The transition temperature shift due to an increase in multiaxiality M = U,/*, prestrain c and strain rate 1
The transient temperature Tt from ductile to brittle fracture is shifted to higher values due to the increase of the maximum normal stress and can reach the current local temperature during the deformation process causing transition to brittle fracture. The influence of the multiaxiality M = U,/@ on the maximum normal stress can be demonstrated by the simple case of proportional stresses with two equal principal stresses: 011 = = a 01. With the mean stress U, = (1 + 2a) Q113 and the effective stress a = (1 - a) 01, the maximum normal stress follows by eliminating a :
(33-168 JOURNAL DE PHYSIQUE IV
If in this case the brittle fracture condition is simply assumed to be oj - a1 = 0 and the microscopic cleavage strength oj can be considered as proportional to the modulus of elasticity E (T ) , the transition temperature Tt from brittle to ductile fracture can be determined by the intersection of the functions aj(T) and a ( T ) for given values of multiaxiality M, prestrain E and strain rate i. A variation of these parameters results in a shift of the transition temperature which is determined by
However, this equation seems to overestimate the transition temperature shift. Therefore, a procedure for the determination of the effect of the loading rate on the transition temperature, which describes the experimental results more accurately, was introduced by Falk and Dahl [55, 561. This procedure needs only a single value zl for the transition temperature at a known loading rate and the relation between flow stress, strain rate and temperature determined eg. in tension tests. According to their analysis, the transition temperature for another strain rate is determined by the intersection of the function m(T) and Ttl+ A T / ( d m l d T ) ~ , ~ where m = dlna/dlni determined for different temperatures by differentiating the material law for thermal activated flow. According to this method, the transition temperature shift can be expressed by:
v 'increased from .O1 or .02 to 3600 mm/s
A 15NiCuMoNb5 o st-52-3-CaSi o StE 885
Temperature [K] Yield stress [MPa] [mm/sl
Figure 13: Influence of deformation rate and strength on the transition temperature shift: a) J-Integral- Temperature curves for Steel 15 NiCuMoNb 5, b) Transion temperature shift as a function of yield strength c) measured and calculated values for the transition temperature as a function of the machine ram velocity v, [55, 561
References [l] CAMPBELL, J.D.: Dynamic plasticity of metals, Springer Verlag, Wien, NY, 1972
[2] HARDING, J.: in Chiem, C.Y.; H.D. Kunze and L.W. Meyer (ed.): Impact loading and dynamic behaviour of materials, DGM-Informationsgese11., Oberursel, Germany, 1988
[3] PERZYNA, P.: Quart. Appl. Math. 20(1963) pp.321-332
[4] LUDWIK, P,: Phys. Z., lO.Jg., NO. 12(1909), pp.411-417
[5] LUDWIK, P.: Elemente der technologischen Mechanik, Springer-Verlag, Berlin (1909)
[6] HOLLOMON J .H.: Trans. AIME 126(1945) pp. 268-290
[7] SWIFT, M.W.: J . Mech. Phys. Solid l(1952) pp. 1-18
[8] JOHNSON, G.R. and W.H. COOK: Eng. Fract. Mech. 21(1985),pp. 31-48
191 GILMAN, J.J.: New York McGraw Hill, 1969
[l01 CAMPBELL, J.D. and FERGUSON, W.G.: Phil. Mag., Vol. 21, 1970, pp. 63-82
Ill] LINDHOLM, U.S.: in: Mechanical Behaviour of Materials under Dynamic Loads (Ed. U.S. Lindholm), Springer-Verlag, Berlin (1968)
[l21 KAWATA, K., HASHIMOTO, S. and KUROKAWA, K.: in: High Velocity Deformation of Solids (Ed. K. Kawata and J. Shioiri), Springer-Verlag, New York (1978)
[l31 VOHRINGER, 0.: Habilitations-Schrift, TH Karlsruhe, 1972
[l41 MACHERAUCH, E. and VOHRINGER, 0.: Z. Werkstofftechnik 9(1978) pp. 370-391
[l51 K o c ~ s , U.F., A.S. ARGON and M.F. ASHBY: "Thermodynamics and Kinetics of Slip", Pergamon Press, NY 1975
1161 ARMSTRONG, R.W.: Acta Met. 15(1967) pp.667-668
[l71 ZERILLI, F.J. and ARMSTRONG, R.W.: J. Appl. Phys. 61(1987) pp. 1816-1825
[l81 PETCH, N.J.: Phil. Mag. 8(1958) pp. 1089-1097
[l91 KRABIELL, A.: Dr.-Ing. Diss. RWTH Aachen, 1982
[20] KUMAR, A.; HAUSER, F.E. and DORN, J.E.: Acta met. 16(1968), pp. 1189-1197
1211 NOJIMA, T.: in: "Impact loading and dynamic behaviour of materials", ed. Chiem, C.Y., M.D. Kunze and L.W. Meyer, DGM-Informationsgesellschaft Oberursel, Germany, 1988, pp. 357-368
1221 VOHRINGER, 0.: in: "Gefiige und mechanische Eigenschaften", DGM-Informationsgesellschaft Oberursel, Germany, 1990
[23] BURGAHN, F.: Dr.-1ng.-Dissertation, University Karlsruhe (TH), 1991
[24] MECKING, H. and K o c ~ s , U.F.: Acta met. 29(1981), pp. 1865-1875
[25] FOLLANSBEE, P.S. and K o c ~ s , U.F.: Acta met. 36(1988)1, pp. 81-93
[26] EL-MAGD, E. and K. JAGER: Archiv Eisenhiittenwesen 55(1984) pp. 487-491
1271 MIMURA, K. and Y. TOMITA J . de Physique,colloque C3,Voll,Okt. 1991, C3-813-820
[28] WEISSHAUPT, H.: to be published
[29] DORMEVAL, R.: in Blazynski (ed.): Materials at high strain rates, Elsevier applied science, London, NY, 1988, pp. 47-70
[30] TROOST, A. and EL-SCHENNAWI, A.: Mech. Res. Comm. 1(1974), pp. 331-334
C8-170 JOURNAL DE PHYSIQUE IV
[31] TROOST, A. and EL-SCHENNAWI, A.: Arch. Eisenhuttenwes. 46(1975)11, pp. 729-733
[32] DOEGE, E.; H. MEYER-NOLKEMPER and I. SAEED: Hanser Verlag, Munchen, 1986
[33] COFFEY, C.S. and ARMSTRONG, R.W.: in Meyers, M.A. and L.E. Morr (ed.) Shock Waves and high-strain rate Phenomena in Metals, Plenum Press NY, 1981, pp.313-324
[34] SEMIATIN, S.L., M.R. STAKER AND J.J. JONES: Acta Met. 32(1984) pp. 1347-1354
[35] GIOVANOLA, J.H.: in Chiem, C.Y.; H.-D. Kunze and L.W. Meyer (ed.): Impact Loading and Dynamic Behaviour of Materials, DGM-Inform.-Verlag, Oberursel, Germany, 1988
[36] CHO, K.M., S. LEE, R. NUTT and J. DUFFY: Acta Met. 41(1993) 923-932
[37] EL-MAGD, E.: Materialpriif. 15(1973)pp. 90-95
[38] EL-MAGD, E.: Archiv Eisenhuttenwesen 45(1974)pp.83-89
[39] MCCLINTOCK, F.A.: J.appl.Mech. 35(1968)pp.363.
[40] RICE, J.R. and D.M. TRACY: J . Mech. Phys. Solids, 17(1969)pp. 201-217
[41] HANCOCK, J.W. and A.C. MACKENZIE: J. Mech. Phys. Solids, 24(1976)pp. 147-169
[42] NEEDLEMAN, A. and V. TVERGAARD: J. Mech. Phys. Solids 32(1984)pp. 461-490
[43] TVERGAARD, V. and A. NEEDLEMAN: J . Mech. Phys. Solids 34(1986)pp. 213-241
[44] MARINI, B; F. MUDRY and PINEAU: Eng. Fract. Mech. 22(1985), pp. 989-996
[45] HOLLAND, D.; A. HALIM and W. DAHL: Steel research (1990), pp. 504-506
[46] HALIM, M.A.M.: Dr.-Ing. Dissertation,, RWTH Aachen 1989
[47] BARTON, D.C.; J .L. STURGES; M.S. MIRZA and P . CHURCH: Journal de Physique IV, Colloque C3-931, suppl. au J . de Physique 111, Vol. 1, Oct. 1991
[48] CURRAN, D.R.; L. SEAMAN and SHOCKEY: in Meyers, M.A. and L.E. Morr (ed.) Shock Waves and high-strain rate Phenomena in Metals, Plenum Press NY, 1981, pp.129-165
[49] EL-MAGD, E.: Archiv Eisenhuttenwesen 48(1977)pp. 617-620
[50] EL-MAGD, E.; H.W. WALKENHORST and P. FRERES: Proc. 3rd. Int. Conf. on Creep and Fracture of engineering Materials and structures, (eds.) B. Wilshire and R.W. Evans, The Institut of Metals, London 1993, pp.99-108
[51] EL-MAGD, E. and K. JAGER: Archiv Eisenhuttenwesen 55(1984)pp. 223-227
[52] SEAMAN, L.; D.R. CURRAN and D.A. SHOCKEY: J . Appl. Phys. 47(1976)pp.4814-4826
[53] STEVENS,A.L.; L.DAVISON and W.E. WARREN: in: Sih, G.C.(ed.): "Dynamic crack propagation", Noordhoff publishing, 1973
1541 RITCHIE,R.O.; J .F. KNOTT and R. RICE: J . Mech. Phys. Solids 21(1973),pp.395-410
[55] FALK, J . and W. DAHL: J. de Physique IV, C3-613, suppl. au J . de Physique 111, Vol. 1, Oct. 1991
[56] FALK, J . Dr.-Ing. Dissertation, RWTH Aachen 1992