Embed Size (px)
DESCRIPTION
Dynamic Behaviour of Concrete
Citation preview
International Journal of Impact Engineering 25 (2001) 869–886
Dynamic behavior of concrete at high strain rates andpressures: I. experimental characterization
D.L. Grote, S.W. Park1, M. Zhou*
The George W. Woodruff School of Mechanical Engineering, Georgia Institute of Technology, Atlanta,
GA 30332-0405, USA
Received 1 June 1999; received in revised form 16 October 1999; accepted 6 April 2001
Abstract
Understanding the behavior of concrete and mortar at very high strain rates is of critical importance in arange of applications. Under highly dynamic conditions, the strain-rate dependence of material responseand high levels of hydrostatic pressure cause the material behavior to be significantly different from what isobserved under quasistatic conditions. The behavior of concrete and mortar at strain rates of the order of104 s@1 and pressures up to 1.5GPa are studied experimentally. The mortar analyzed has the samecomposition and processing conditions as the matrix phase in the concrete, allowing the effect of concretemicrostructure to be delineated. The focus is on the effects of loading rate, hydrostatic pressure andmicrostructural heterogeneity on the load-carrying capacities of the materials. This experimentalinvestigation uses split Hopkinson pressure bar (SHPB) and plate impact to achieve a range of loadingrate and hydrostatic pressure. The SHPB experiments involve strain rates between 250 and 1700 s@1
without lateral confinement and the plate impact experiments subject the materials to deformation at strainrates of the order of 104 s@1 with confining pressures of 1–1.5GPa. Experiments indicate that the load-carrying capacities of the concrete and mortar increase significantly with strain rate and hydrostaticpressure. The compressive flow stress of mortar at a strain rate of 1700 s@1 is approximately four times itsquasistatic strength. Under the conditions of plate impact involving impact velocities of approximately330ms@1, the average flow stress is 1.7GPa for the concrete and 1.3GPa for the mortar. In contrast, thecorresponding unconfined quasistatic compressive strengths are only 30 and 46MPa, respectively. Due tothe composite microstructure of concrete, deformation and stresses are nonuniform in the specimens. Theeffects of material inhomogeneity on the measurements during the impact experiments are analyzed using afour-beam VISAR laser interferometer system. r 2001 Elsevier Science Ltd. All rights reserved.
Keywords: Concrete; Dynamic behavior; High strain rate; Hydrostatic pressure; Plate impact; Split Hopkinson
pressure bar
*Corresponding author. Tel.: +1-404-894-3294; fax: +1-404-894-0186.E-mail address: [email protected] (M. Zhou).
1Currently, US Federal Highway Administration, TFHRC/HRDI/PSI, 6300 Georgetown Pike, McLean, VA 22101.
0734-743X/01/$ - see front matter r 2001 Elsevier Science Ltd. All rights reserved.
PII: S 0 7 3 4 - 7 4 3 X ( 0 1 ) 0 0 0 2 0 - 3
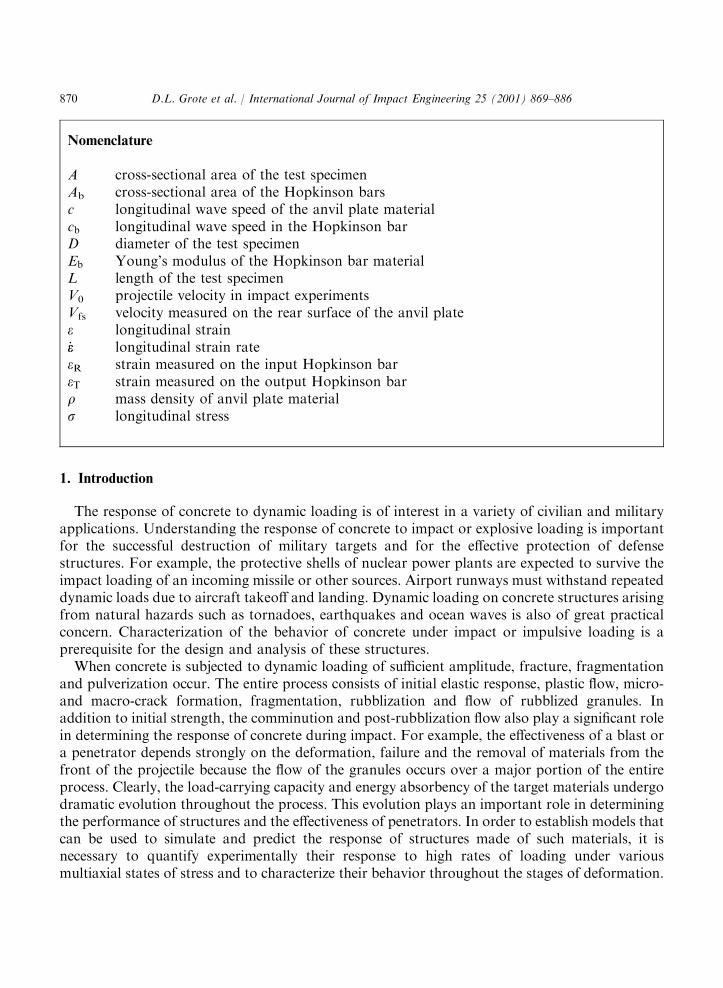
1. Introduction
The response of concrete to dynamic loading is of interest in a variety of civilian and militaryapplications. Understanding the response of concrete to impact or explosive loading is importantfor the successful destruction of military targets and for the effective protection of defensestructures. For example, the protective shells of nuclear power plants are expected to survive theimpact loading of an incoming missile or other sources. Airport runways must withstand repeateddynamic loads due to aircraft takeoff and landing. Dynamic loading on concrete structures arisingfrom natural hazards such as tornadoes, earthquakes and ocean waves is also of great practicalconcern. Characterization of the behavior of concrete under impact or impulsive loading is aprerequisite for the design and analysis of these structures.When concrete is subjected to dynamic loading of sufficient amplitude, fracture, fragmentation
and pulverization occur. The entire process consists of initial elastic response, plastic flow, micro-and macro-crack formation, fragmentation, rubblization and flow of rubblized granules. Inaddition to initial strength, the comminution and post-rubblization flow also play a significant rolein determining the response of concrete during impact. For example, the effectiveness of a blast ora penetrator depends strongly on the deformation, failure and the removal of materials from thefront of the projectile because the flow of the granules occurs over a major portion of the entireprocess. Clearly, the load-carrying capacity and energy absorbency of the target materials undergodramatic evolution throughout the process. This evolution plays an important role in determiningthe performance of structures and the effectiveness of penetrators. In order to establish models thatcan be used to simulate and predict the response of structures made of such materials, it isnecessary to quantify experimentally their response to high rates of loading under variousmultiaxial states of stress and to characterize their behavior throughout the stages of deformation.
Nomenclature
A cross-sectional area of the test specimenAb cross-sectional area of the Hopkinson barsc longitudinal wave speed of the anvil plate materialcb longitudinal wave speed in the Hopkinson barD diameter of the test specimenEb Young’s modulus of the Hopkinson bar materialL length of the test specimenV0 projectile velocity in impact experimentsVfs velocity measured on the rear surface of the anvil platee longitudinal strain’ee longitudinal strain rateeR strain measured on the input Hopkinson bareT strain measured on the output Hopkinson barr mass density of anvil plate materials longitudinal stress
D.L. Grote et al. / International Journal of Impact Engineering 25 (2001) 869–886870
The mechanical behavior of concrete has been found to depend on strain rate over a wide rangeof conditions [1–19]. The range of strain rate studied is usually dictated by the type of loadingdevices employed. For instance, Bresler and Bertero [17] and Takeda and Tachikawa [18] usedhydraulic testing machines to load specimens at strain rates up to 1 s@1. Hughes and Gregory[14], Watstein [15] and Hughes and Watson [19] used a drop-weight impactor to achieve strainrates on the order of 10 s@1. Ross et al. [1–3] and Malvern et al. [10] used a split Hopkinsonpressure bar and obtained deformation rates of the order of 10–103 s@1. These investigationsconcerned only strain rates under 103 s@1. Furthermore, the conditions do not involve the highhydrostatic pressures that exist in impact and penetration. Partly because of the absence ofhydrostatic pressure, these experiments simulate only the early stages of deformation and failuresuch as fracture and fragmentation but do not simulate the post-fracture processes ofpulverization and granular flow. The rate dependence is stronger at higher strain rates. Forexample, the Hopkinson bar experiments of Ross et al. [1–3] showed that there is a sharp upturnin the strength of concrete in the strain rate region of 10–103 s@1. Deformation and failure ofconcrete structures subjected to impact or penetration have also been studied [20–24]. Dancygierand Yankelevsky [25] and Dancygier [26] found that high strength concrete is much more effectivein resisting impact loading than normal strength concrete. Kipp et al. [27] reported an averagedynamic spall strength of 30MPa at impact velocities of 30–220ms@1 for two different concreteformulations. Kennedy [28] and Barr [29] have provided guidelines for the design and analysis ofconcrete structures accounting for enhanced dynamic failure resistance.Two of the most important factors influencing the behavior of concrete under dynamic
conditions are strain-rate sensitivity and pressure dependence. Despite the work reported, there isstill a lack of data and understanding for conditions involving very high strain rates andhigh hydrostatic pressures. The currently available data concern only strain rates up to 103 s@1
and pressures up to several hundred MPa. In order to obtain realistic characterizations anddevelop constitutive models for the materials in applications such as impact, penetration andblast, experimental data for conditions beyond what has been analyzed are needed. This needmotivated the current study. This study is aimed at producing data for the extreme conditions notyet fully simulated in laboratory or analyzed in modeling. The approach is to use plate impact andsplit Hopkinson bar experiments to generate strain rates over the range of 102–104 s@1 andpressures of up to 1.5GPa. These conditions more closely simulate those found in actualpenetration and explosion. For comparison purposes, quasistatic experiments are also conducted.Since the evolution of microstructure greatly changes the behavior of concrete as deformationprogresses, the experiments emphasize time-resolved analysis of the changes in the load-carryingcapacities of the materials. To this end, laser interferometry and high-speed digital oscilloscopesare used to obtain deformation and stress histories in the materials. The experimental dataobtained are used to calibrate the constitutive model employed in numerical simulations presentedin Park et al. [30]. Finite element simulations reported in the companion paper focus on thedynamic load-carrying and energy-absorbing capabilities of concrete under the conditions of theplate impact experiments discussed in this paper. The numerical simulations use a micro-mechanical model of the concrete microstructure and explicitly account for the arbitrary two-phase microstructural morphology of the concrete. The effects of individual phase properties,phase distributions and phase volume fraction on the dynamic behavior of concrete arequantitatively analyzed.
D.L. Grote et al. / International Journal of Impact Engineering 25 (2001) 869–886 871
2. Materials
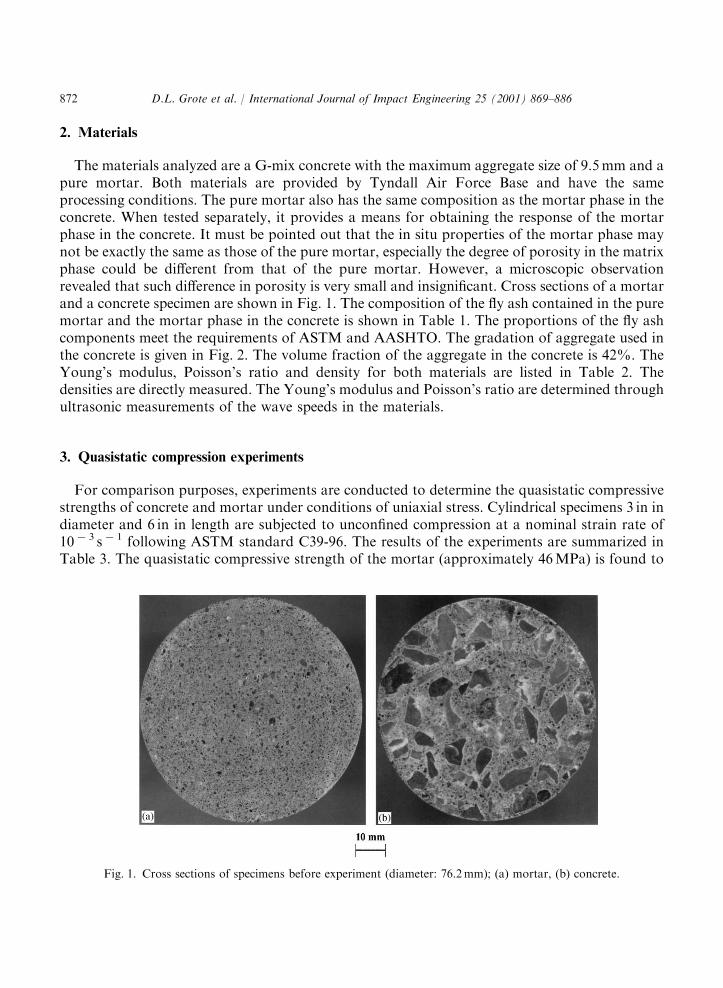
The materials analyzed are a G-mix concrete with the maximum aggregate size of 9.5mm and apure mortar. Both materials are provided by Tyndall Air Force Base and have the sameprocessing conditions. The pure mortar also has the same composition as the mortar phase in theconcrete. When tested separately, it provides a means for obtaining the response of the mortarphase in the concrete. It must be pointed out that the in situ properties of the mortar phase maynot be exactly the same as those of the pure mortar, especially the degree of porosity in the matrixphase could be different from that of the pure mortar. However, a microscopic observationrevealed that such difference in porosity is very small and insignificant. Cross sections of a mortarand a concrete specimen are shown in Fig. 1. The composition of the fly ash contained in the puremortar and the mortar phase in the concrete is shown in Table 1. The proportions of the fly ashcomponents meet the requirements of ASTM and AASHTO. The gradation of aggregate used inthe concrete is given in Fig. 2. The volume fraction of the aggregate in the concrete is 42%. TheYoung’s modulus, Poisson’s ratio and density for both materials are listed in Table 2. Thedensities are directly measured. The Young’s modulus and Poisson’s ratio are determined throughultrasonic measurements of the wave speeds in the materials.
3. Quasistatic compression experiments
For comparison purposes, experiments are conducted to determine the quasistatic compressivestrengths of concrete and mortar under conditions of uniaxial stress. Cylindrical specimens 3 in indiameter and 6 in in length are subjected to unconfined compression at a nominal strain rate of10@3 s@1 following ASTM standard C39-96. The results of the experiments are summarized inTable 3. The quasistatic compressive strength of the mortar (approximately 46MPa) is found to
Fig. 1. Cross sections of specimens before experiment (diameter: 76.2mm); (a) mortar, (b) concrete.
D.L. Grote et al. / International Journal of Impact Engineering 25 (2001) 869–886872
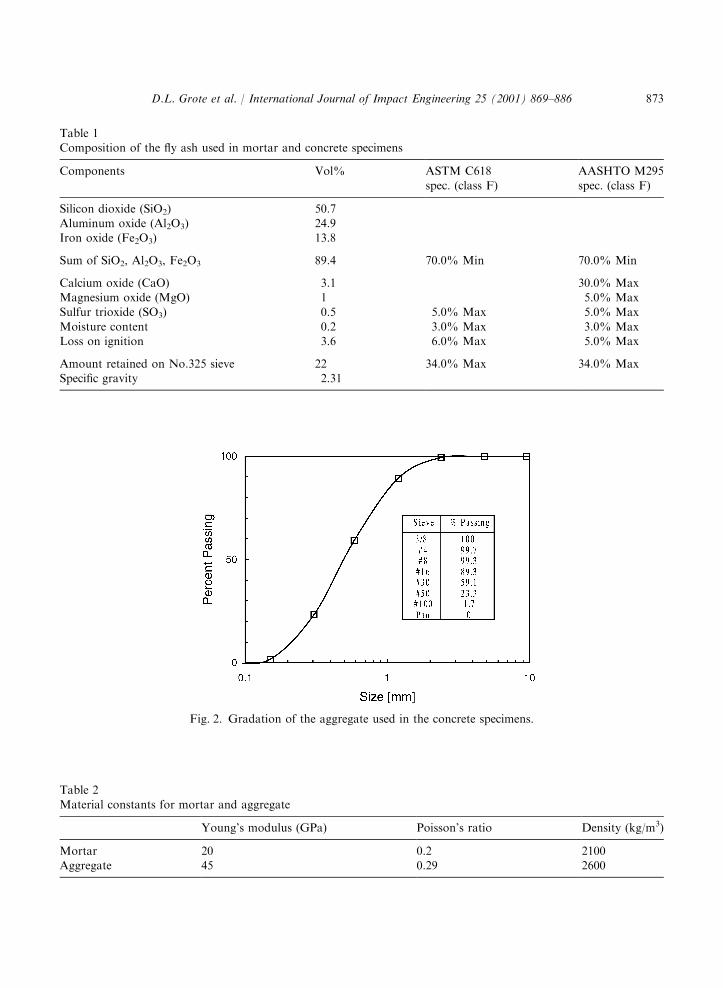
Table 1Composition of the fly ash used in mortar and concrete specimens
Components Vol% ASTM C618spec. (class F)
AASHTO M295spec. (class F)
Silicon dioxide (SiO2) 50.7Aluminum oxide (Al2O3) 24.9Iron oxide (Fe2O3) 13.8
Sum of SiO2, Al2O3, Fe2O3 89.4 70.0% Min 70.0% Min
Calcium oxide (CaO) 3.1 30.0% MaxMagnesium oxide (MgO) 1 5.0% MaxSulfur trioxide (SO3) 0.5 5.0% Max 5.0% Max
Moisture content 0.2 3.0% Max 3.0% MaxLoss on ignition 3.6 6.0% Max 5.0% Max
Amount retained on No.325 sieve 22 34.0% Max 34.0% MaxSpecific gravity 2.31
Fig. 2. Gradation of the aggregate used in the concrete specimens.
Table 2
Material constants for mortar and aggregate
Young’s modulus (GPa) Poisson’s ratio Density (kg/m3)
Mortar 20 0.2 2100Aggregate 45 0.29 2600
D.L. Grote et al. / International Journal of Impact Engineering 25 (2001) 869–886 873
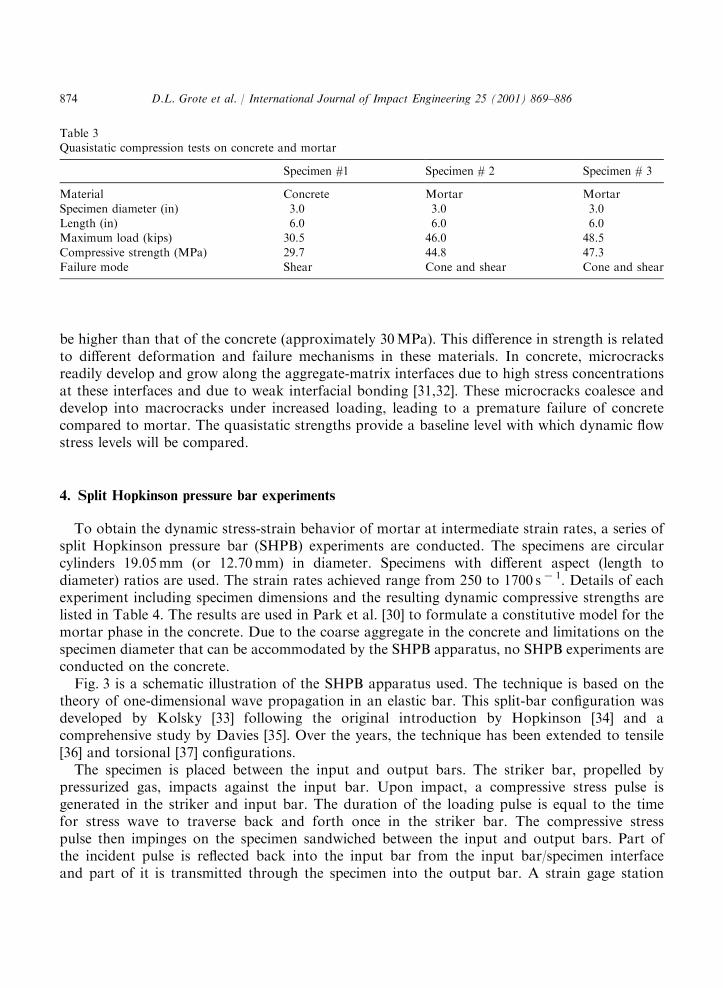
be higher than that of the concrete (approximately 30MPa). This difference in strength is relatedto different deformation and failure mechanisms in these materials. In concrete, microcracksreadily develop and grow along the aggregate-matrix interfaces due to high stress concentrationsat these interfaces and due to weak interfacial bonding [31,32]. These microcracks coalesce anddevelop into macrocracks under increased loading, leading to a premature failure of concretecompared to mortar. The quasistatic strengths provide a baseline level with which dynamic flowstress levels will be compared.
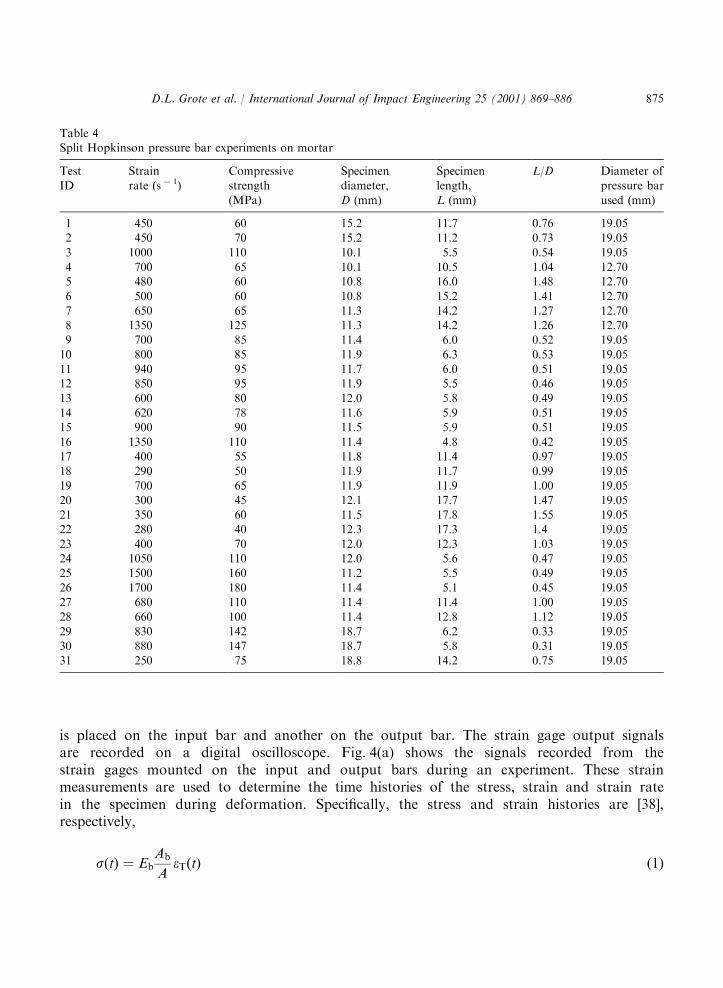
4. Split Hopkinson pressure bar experiments
To obtain the dynamic stress-strain behavior of mortar at intermediate strain rates, a series ofsplit Hopkinson pressure bar (SHPB) experiments are conducted. The specimens are circularcylinders 19.05mm (or 12.70mm) in diameter. Specimens with different aspect (length todiameter) ratios are used. The strain rates achieved range from 250 to 1700 s@1. Details of eachexperiment including specimen dimensions and the resulting dynamic compressive strengths arelisted in Table 4. The results are used in Park et al. [30] to formulate a constitutive model for themortar phase in the concrete. Due to the coarse aggregate in the concrete and limitations on thespecimen diameter that can be accommodated by the SHPB apparatus, no SHPB experiments areconducted on the concrete.Fig. 3 is a schematic illustration of the SHPB apparatus used. The technique is based on the
theory of one-dimensional wave propagation in an elastic bar. This split-bar configuration wasdeveloped by Kolsky [33] following the original introduction by Hopkinson [34] and acomprehensive study by Davies [35]. Over the years, the technique has been extended to tensile[36] and torsional [37] configurations.The specimen is placed between the input and output bars. The striker bar, propelled by
pressurized gas, impacts against the input bar. Upon impact, a compressive stress pulse isgenerated in the striker and input bar. The duration of the loading pulse is equal to the timefor stress wave to traverse back and forth once in the striker bar. The compressive stresspulse then impinges on the specimen sandwiched between the input and output bars. Part ofthe incident pulse is reflected back into the input bar from the input bar/specimen interfaceand part of it is transmitted through the specimen into the output bar. A strain gage station
Table 3Quasistatic compression tests on concrete and mortar
Specimen #1 Specimen # 2 Specimen # 3
Material Concrete Mortar Mortar
Specimen diameter (in) 3.0 3.0 3.0Length (in) 6.0 6.0 6.0Maximum load (kips) 30.5 46.0 48.5
Compressive strength (MPa) 29.7 44.8 47.3Failure mode Shear Cone and shear Cone and shear
D.L. Grote et al. / International Journal of Impact Engineering 25 (2001) 869–886874
is placed on the input bar and another on the output bar. The strain gage output signalsare recorded on a digital oscilloscope. Fig. 4(a) shows the signals recorded from thestrain gages mounted on the input and output bars during an experiment. These strainmeasurements are used to determine the time histories of the stress, strain and strain ratein the specimen during deformation. Specifically, the stress and strain histories are [38],respectively,
sðtÞ ¼ EbAb
AeTðtÞ ð1Þ
Table 4Split Hopkinson pressure bar experiments on mortar
TestID
Strainrate (s@1)
Compressivestrength
(MPa)
Specimendiameter,
D (mm)
Specimenlength,
L (mm)
L/D Diameter ofpressure bar
used (mm)
1 450 60 15.2 11.7 0.76 19.052 450 70 15.2 11.2 0.73 19.05
3 1000 110 10.1 5.5 0.54 19.054 700 65 10.1 10.5 1.04 12.705 480 60 10.8 16.0 1.48 12.70
6 500 60 10.8 15.2 1.41 12.707 650 65 11.3 14.2 1.27 12.708 1350 125 11.3 14.2 1.26 12.709 700 85 11.4 6.0 0.52 19.05
10 800 85 11.9 6.3 0.53 19.0511 940 95 11.7 6.0 0.51 19.0512 850 95 11.9 5.5 0.46 19.05
13 600 80 12.0 5.8 0.49 19.0514 620 78 11.6 5.9 0.51 19.0515 900 90 11.5 5.9 0.51 19.05
16 1350 110 11.4 4.8 0.42 19.0517 400 55 11.8 11.4 0.97 19.0518 290 50 11.9 11.7 0.99 19.05
19 700 65 11.9 11.9 1.00 19.0520 300 45 12.1 17.7 1.47 19.0521 350 60 11.5 17.8 1.55 19.0522 280 40 12.3 17.3 1.4 19.05
23 400 70 12.0 12.3 1.03 19.0524 1050 110 12.0 5.6 0.47 19.0525 1500 160 11.2 5.5 0.49 19.05
26 1700 180 11.4 5.1 0.45 19.0527 680 110 11.4 11.4 1.00 19.0528 660 100 11.4 12.8 1.12 19.05
29 830 142 18.7 6.2 0.33 19.0530 880 147 18.7 5.8 0.31 19.0531 250 75 18.8 14.2 0.75 19.05
D.L. Grote et al. / International Journal of Impact Engineering 25 (2001) 869–886 875
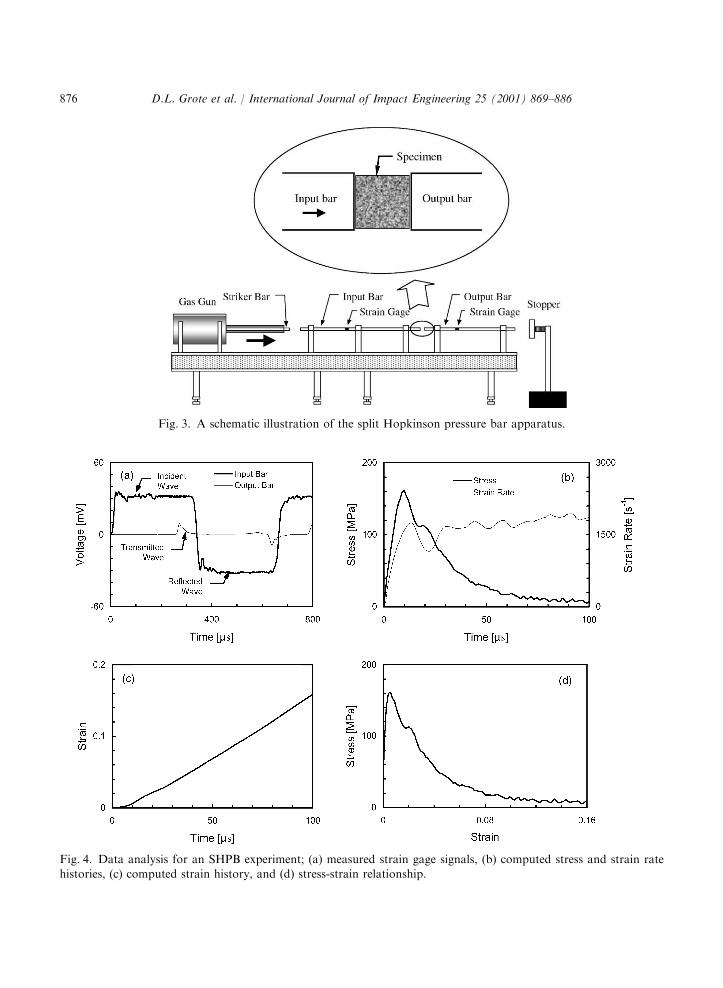
Fig. 3. A schematic illustration of the split Hopkinson pressure bar apparatus.
Fig. 4. Data analysis for an SHPB experiment; (a) measured strain gage signals, (b) computed stress and strain rate
histories, (c) computed strain history, and (d) stress-strain relationship.
D.L. Grote et al. / International Journal of Impact Engineering 25 (2001) 869–886876
and
’eeðtÞ ¼@2cb
LeRðtÞ; ð2Þ
where eT and eR denote the amplitudes of the transmitted and reflected strain pulses. Eb, Ab and cbdenote the Young’s modulus, cross-sectional area and longitudinal wave speed of the bars, and Aand L are the cross-sectional area and length of the specimen, respectively. The expression for thestrain rate in (2) may be integrated with respect to time to give the strain, i.e.,
eðtÞ ¼@2cb
L
Z t
0
eRðtÞdt: ð3Þ
Fig. 4(b) shows the stress and strain rate histories obtained from the reflected and transmittedstrain histories shown in Fig. 4(a). The strain rate is not constant throughout the period in generaldue to the dynamic nature of the experiment. An average strain rate is calculated and used for theduration of loading. The average strain rate for the test shown in Fig. 4 is 1500 s@1. The strainhistory computed according to (3) is shown in Fig. 4(c). The history of stress in Fig. 4(b) and thehistory of strain in Fig. 4(c) combine to yield the stress-strain relation shown in Fig. 4(d).In a SHPB test, the specimen must be short enough for a uniform state of stress along the length
of the specimen to be rapidly achieved during loading. Five to ten wave reverberations within thespecimen are normally required [39]. On the other hand, when very short specimens are used,friction between the specimen ends and the bars can play a significant role and lead to an apparentincrease in strength [40]. The diameter of the specimen also needs to be small relative to thewavelength of the applied load pulse for the one-dimensional wave theory to be valid without thecomplication of Pochhammer-Chree radial oscillations. Accounting for these restrictions,specimens with length ðLÞ ranging from 4.8 to 18.8mm and diameter ðDÞ ranging from 5.1 to15.2mm are used in the experiments. These specimens have aspect ratios ðL=DÞ between 0.31 and
1.55, see Table 4. Davies and Hunter [41] suggested that the optimum aspect ratio be L=D ¼ffiffiffiffiffi34 n
q,
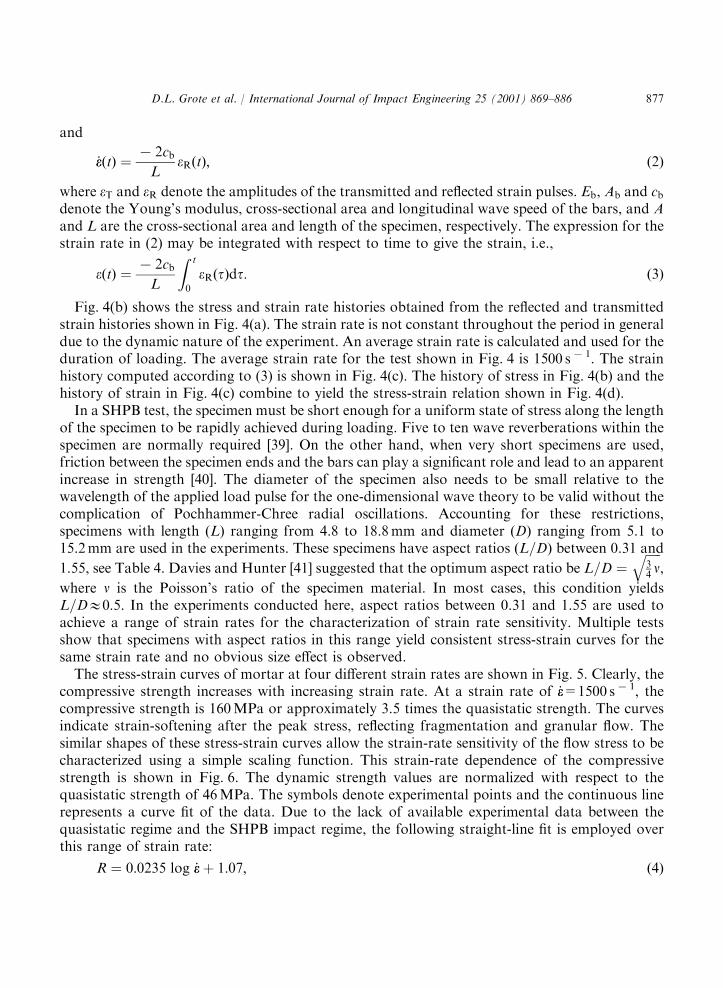
where n is the Poisson’s ratio of the specimen material. In most cases, this condition yieldsL=DE0:5. In the experiments conducted here, aspect ratios between 0.31 and 1.55 are used toachieve a range of strain rates for the characterization of strain rate sensitivity. Multiple testsshow that specimens with aspect ratios in this range yield consistent stress-strain curves for thesame strain rate and no obvious size effect is observed.The stress-strain curves of mortar at four different strain rates are shown in Fig. 5. Clearly, the
compressive strength increases with increasing strain rate. At a strain rate of ’ee=1500 s@1, thecompressive strength is 160MPa or approximately 3.5 times the quasistatic strength. The curvesindicate strain-softening after the peak stress, reflecting fragmentation and granular flow. Thesimilar shapes of these stress-strain curves allow the strain-rate sensitivity of the flow stress to becharacterized using a simple scaling function. This strain-rate dependence of the compressivestrength is shown in Fig. 6. The dynamic strength values are normalized with respect to thequasistatic strength of 46MPa. The symbols denote experimental points and the continuous linerepresents a curve fit of the data. Due to the lack of available experimental data between thequasistatic regime and the SHPB impact regime, the following straight-line fit is employed overthis range of strain rate:
R ¼ 0:0235 log ’eeþ 1:07; ð4Þ
D.L. Grote et al. / International Journal of Impact Engineering 25 (2001) 869–886 877
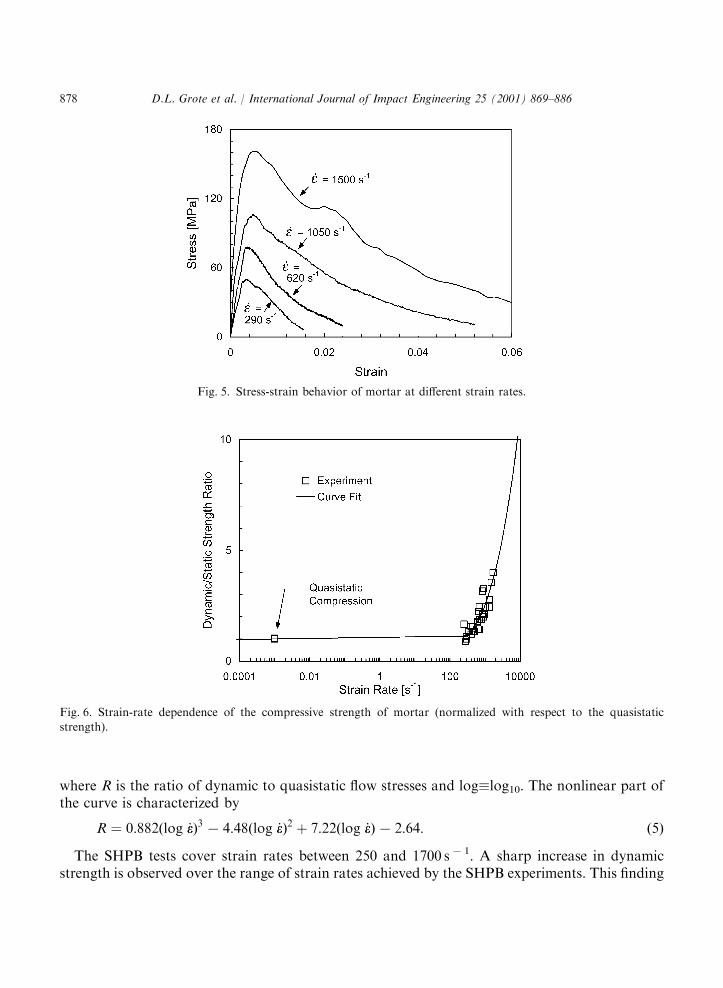
where R is the ratio of dynamic to quasistatic flow stresses and log�log10. The nonlinear part ofthe curve is characterized by
R ¼ 0:882ðlog ’eeÞ3@4:48ðlog ’eeÞ2 þ 7:22ðlog ’eeÞ@2:64: ð5Þ
The SHPB tests cover strain rates between 250 and 1700 s@1. A sharp increase in dynamicstrength is observed over the range of strain rates achieved by the SHPB experiments. This finding
Fig. 5. Stress-strain behavior of mortar at different strain rates.
Fig. 6. Strain-rate dependence of the compressive strength of mortar (normalized with respect to the quasistatic
strength).
D.L. Grote et al. / International Journal of Impact Engineering 25 (2001) 869–886878
is consistent with the results reported by Ross and coworkers [2]. Different formulas have beenproposed for the characterisation of the rate-sensitivity of the compressive strength of concrete.For example, CEB [42] suggested formulas for representing a slow increase in strength for strainrates up to 30 s@1 and a rapid increase for strain rates greater than 30 s@1. Fig. 6 shows anextrapolated behavior beyond the strain rate of 1700 s@1. This characterization is used in thenumerical simulations discussed in Park et al. [30].The strain at which the maximum compressive stress occurs is an important parameter in the
characterization of material behavior. There have been differing reports as to how this strainvaries with strain rate. Watstein [15], Takeda and Tachikawa [43], and Kvirikadze [44] havereported that this strain increases with increasing strain rate. On the other hand, Hatano andTsutsumi [45], Cowell [46] found that it remains essentially constant while Hughes and Watson[19], Dilger et al. [47], and Dhir and Sangha [48] have reported that it decreases with strain rate.The contradictory findings can partly be attributed to the inconsistency among the methods ofloading and associated errors. For example, Watstein [15] reported that the strain at maximumstress decreases with strain rate when tests are conducted using a hydraulic machine while itincreases with strain rate when the specimens are loaded with a drop-hammer. Fig. 5 appears toindicate that the strain at maximum stress increases slightly with increasing strain rate. However,the amount of increase is very small and may well be within the range of experimental error. In thenumerical simulations reported in Park et al. [30], this strain is assumed to remain constant atdifferent strain rates.
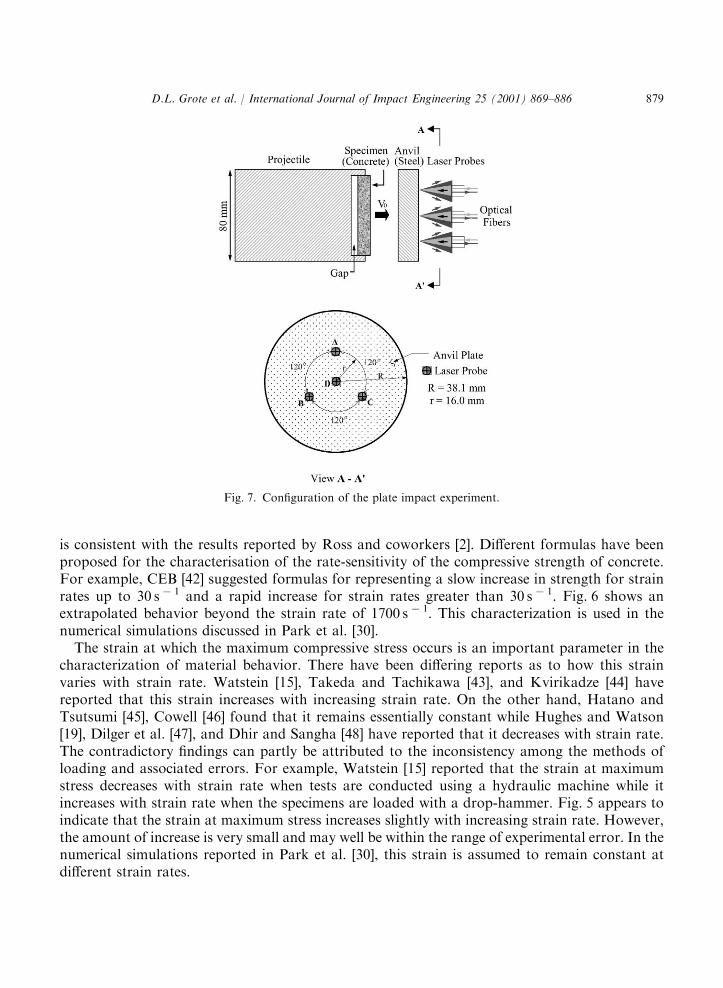
Fig. 7. Configuration of the plate impact experiment.
D.L. Grote et al. / International Journal of Impact Engineering 25 (2001) 869–886 879
5. Plate impact experiments
Plate impact provides a unique means to generate extremely high strain rates and high pressuresunder well-controlled conditions. In this study, normal impact experiments are conducted oncircular disks of concrete and mortar to characterize their dynamic stress-carrying capacities.Average strain rates achieved are of the order of 104 s@1. Since attention is focused on the timeperiod before cylindrical unloading waves arrive at the center of the impacted specimen, thecentral region remains in a state of nominally uniaxial strain due to lateral inertial confinement.Confining pressures in the experiments conducted are of the order of 1–1.5GPa.A schematic illustration of the impact configuration is shown in Fig. 7. The specimens are
76.2mm in diameter and 10mm in thickness. The end surfaces are lapped flat and the actualthickness is within 0.0254mm of 10mm. The specimen is placed at the front of the projectileassembly. A gap between the disk specimen and the projectile tube is provided to allow a traction-free end condition for the back surface of the specimen during the impact process. The specimenimpacts against an anvil plate made of hardened Hampden tool steel. The target steel is heat-treated to have a hardness of approximately 65 on the Rockwell C scale and has a thickness of13.5mm. The projectile is propelled by pressurized helium gas. The impact occurs in a vacuumchamber located at the muzzle end of a gas gun. The velocity of the projectile V0 is measuredimmediately prior to impact using wire pins.Upon impact, compressive stress waves are generated in both the specimen and the anvil plate.
These waves propagate from the impact face toward the rear surface of the specimen and the rearsurface of the anvil plate. Upon arriving at the rear free surfaces, these compressive waves arereflected as tensile waves. The reflected tensile waves then interfere destructively with the on-goingincident compressive waves, reducing the compressive stresses in the specimen. The normalparticle velocities at four points on the rear surface of the anvil plate are measured using a VISAR(Velocity Interferometer System for Any Reflector) laser interferometer system with an accuracyof 72ms@1. The four simultaneous measurements are made using four independent laser probesarranged as shown in Fig. 7. One probe (D) is focused at the center and the other three (A, B, andC) are focused on three points on a circle around the center. The latter probes are evenly spacedon the circle and are at a distance of 16mm from the specimen center. The simultaneousmeasurements of velocities at different locations provide an opportunity for analyzing theheterogeneous deformation in the specimen. The interference signals from the laser inter-ferometers are detected by photodiodes and recorded on a Tektronix TDS 784A digitaloscilloscope with sampling rates of up to 4 billion samples per second.The time-distance diagram shown in Fig. 8 indicates schematically how the waves propagate in
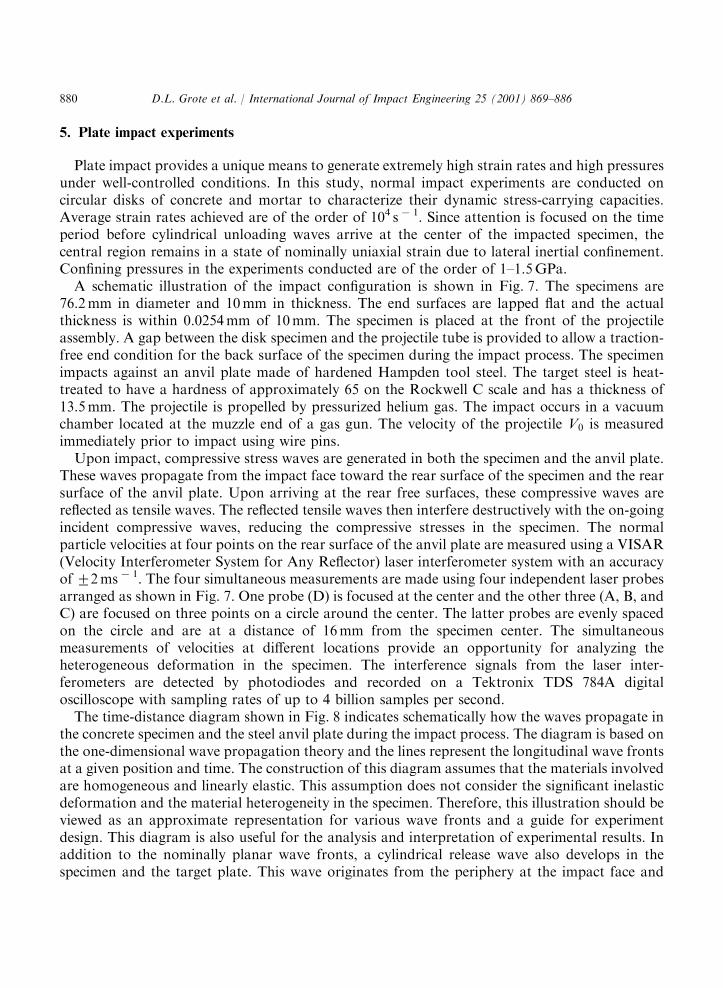
the concrete specimen and the steel anvil plate during the impact process. The diagram is based onthe one-dimensional wave propagation theory and the lines represent the longitudinal wave frontsat a given position and time. The construction of this diagram assumes that the materials involvedare homogeneous and linearly elastic. This assumption does not consider the significant inelasticdeformation and the material heterogeneity in the specimen. Therefore, this illustration should beviewed as an approximate representation for various wave fronts and a guide for experimentdesign. This diagram is also useful for the analysis and interpretation of experimental results. Inaddition to the nominally planar wave fronts, a cylindrical release wave also develops in thespecimen and the target plate. This wave originates from the periphery at the impact face and
D.L. Grote et al. / International Journal of Impact Engineering 25 (2001) 869–886880
propagates toward the center of the plates. This wave disrupts the well-characterized andnominally one-dimensional nature of the loading waves. In the analysis and discussion, attention isfocused on the part of the experiment before this unloading wave arrives at the rear surface of thetarget plate ðt7Þ. The useful window for data analysis for the velocity profiles recorded on the rearsurface is therefore t72t1 which is approximately 6.38ms for the experimental configuration used.The experiment is designed such that the target steel plate remains elastic throughout the
impact process. Although the stress and velocity at the impact face are not uniform due to theinhomogeneous specimen properties, elastic wave propagation in the target plate allows the stressand velocity to become more uniform as they approach the rear surface of the target plate. Thiswave propagation process can be used as a mechanism for obtaining an average measure for thestress history at the impact face. According to the one-dimensional elastic wave theory, thisaverage stress is related to the free surface particle velocity through [49].
sðtÞ ¼1
2rcVfsðtÞ; ð6Þ
where s, Vfs, r and c are, respectively, the average longitudinal stress at the specimen/targetinterface, particle velocity at the rear surface of the target, mass density and longitudinal wavespeed of the anvil material. Eq. (6) allows the history of the longitudinal stress carried by thespecimen to be inferred from the velocity history measured at the rear surface of the anvil plate.
Fig. 8. Time-distance diagram for the plate impact experiment based on linear elastic material behavior.
D.L. Grote et al. / International Journal of Impact Engineering 25 (2001) 869–886 881
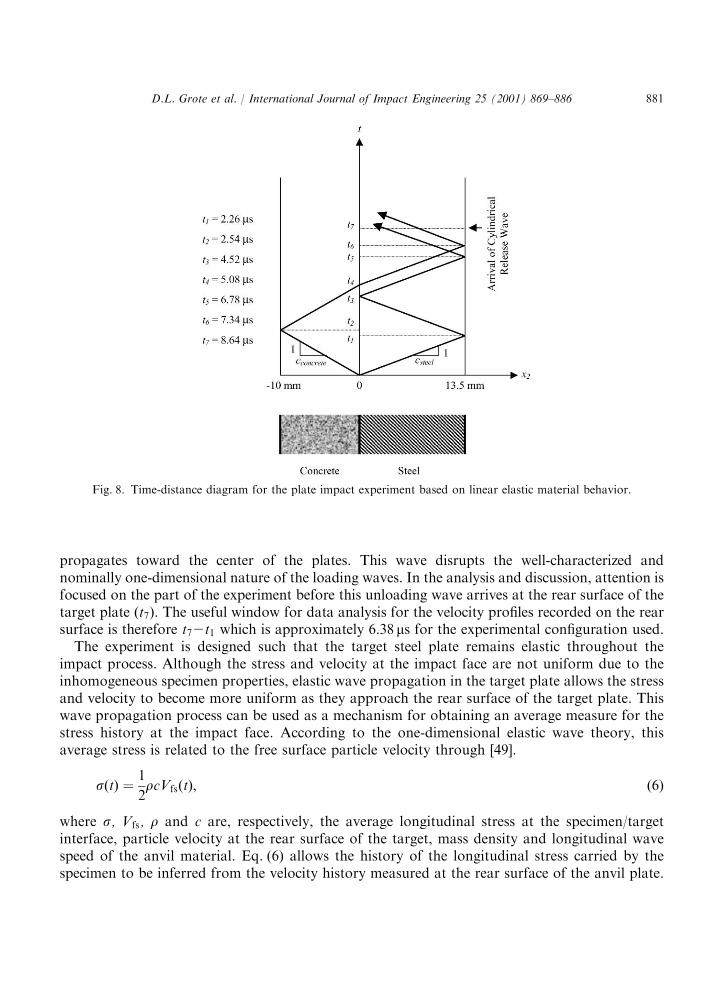
Impact experiments conducted on mortar and concrete involve projectile velocities between 277and 330ms@1. First, the effect of material heterogeneity on the velocity measurement is analyzed.Fig. 9 shows the free surface velocity histories measured at four different locations (as indicated inFig. 7) on the rear surface of the anvil plate during an impact experiment on concrete. The impactvelocity is 277ms@1. The corresponding average stresses interpreted from (6) are shown on thesecondary vertical axis. The profiles show that the velocity begins to increase when thecompressive wave arrives at the rear surface of the anvil plate at approximately 2.2ms afterimpact. The average value of the free surface velocity remains essentially constant until the wavereflected from the specimen/anvil interface arrives at the free surface of the anvil plate. The suddenincrease in velocity at tD6:8ms coincides with t5 in Fig. 8. The four independent measurementsshow variations from each other. While the oscillations are not coordinated, the average valuesfor the duration of interest between t1 (2.2 ms) and t5 (6.8 ms) are quite consistent. Specifically, theaverage velocity before the arrival of the reloading wave is approximately 58ms@1 and thecorresponding average stress is approximately 1.2GPa. Furthermore, the level of oscillation is thesame for all four profiles or approximately 20ms@1 in terms of the velocity. It appears that any ofthe four curves can appropriately represent the response of the specimen, as long as the focus is onthe average stress and the associated oscillation is accepted. The growing deviation of the centerprofile from the off-center profiles beginning at 8.7 ms coincides with the arrival of the cylindricalunloading wave at the outer probes (t7 in Fig. 8). The part of the profiles beyond t5 (6.8ms) is notused to make interpretations concerning the load-carrying capacities of the specimen materials.Based on the results of Fig. 9, the velocity profiles at the center of specimens are used to analyze
the load-carrying capacities of concrete and mortar at different impact velocities. The profilesfrom two experiments with the same impact velocity of V0 ¼ 290ms@1, one on mortar and theother on concrete, are shown in Fig. 10(a). The results of two other experiments with an impactvelocity of V0 ¼ 330ms@1 are shown in Fig. 10(b). The profiles for the concrete exhibit morepronounced oscillations than those for mortar, reflecting the higher level of material heterogeneity
Fig. 9. Velocity profiles measured at different locations on the rear surface of the anvil plate (see Fig. 7 for probelocations) and the corresponding average stress in the concrete specimen interpreted according to (6).
D.L. Grote et al. / International Journal of Impact Engineering 25 (2001) 869–886882
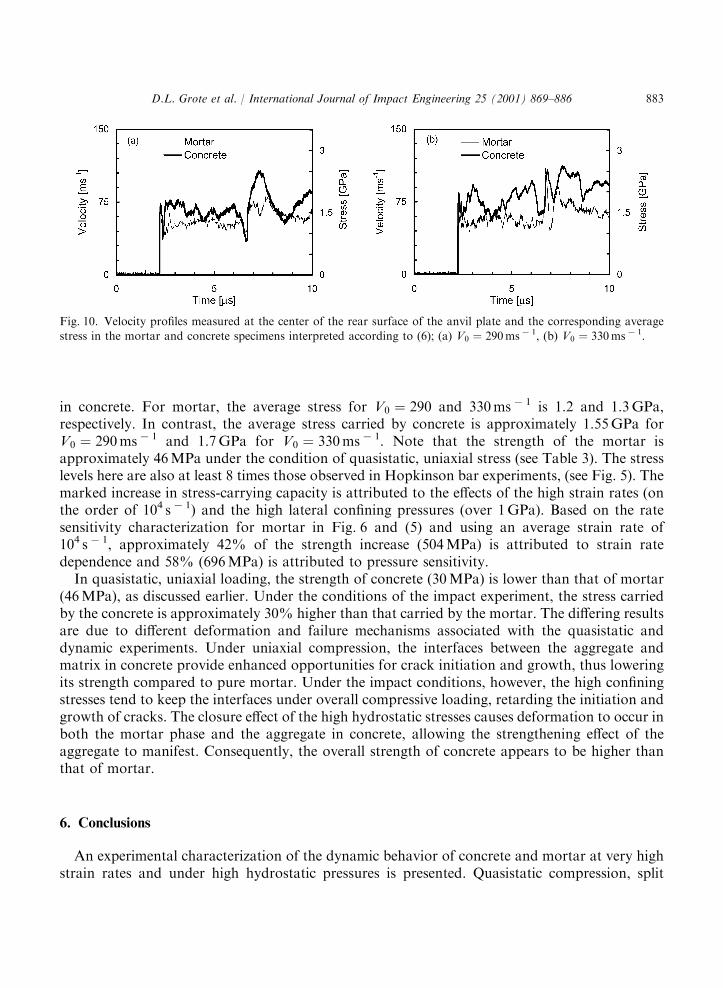
in concrete. For mortar, the average stress for V0 ¼ 290 and 330ms@1 is 1.2 and 1.3GPa,respectively. In contrast, the average stress carried by concrete is approximately 1.55GPa forV0 ¼ 290ms@1 and 1.7GPa for V0 ¼ 330ms@1. Note that the strength of the mortar isapproximately 46MPa under the condition of quasistatic, uniaxial stress (see Table 3). The stresslevels here are also at least 8 times those observed in Hopkinson bar experiments, (see Fig. 5). Themarked increase in stress-carrying capacity is attributed to the effects of the high strain rates (onthe order of 104 s@1) and the high lateral confining pressures (over 1GPa). Based on the ratesensitivity characterization for mortar in Fig. 6 and (5) and using an average strain rate of104 s@1, approximately 42% of the strength increase (504MPa) is attributed to strain ratedependence and 58% (696MPa) is attributed to pressure sensitivity.In quasistatic, uniaxial loading, the strength of concrete (30MPa) is lower than that of mortar
(46MPa), as discussed earlier. Under the conditions of the impact experiment, the stress carriedby the concrete is approximately 30% higher than that carried by the mortar. The differing resultsare due to different deformation and failure mechanisms associated with the quasistatic anddynamic experiments. Under uniaxial compression, the interfaces between the aggregate andmatrix in concrete provide enhanced opportunities for crack initiation and growth, thus loweringits strength compared to pure mortar. Under the impact conditions, however, the high confiningstresses tend to keep the interfaces under overall compressive loading, retarding the initiation andgrowth of cracks. The closure effect of the high hydrostatic stresses causes deformation to occur inboth the mortar phase and the aggregate in concrete, allowing the strengthening effect of theaggregate to manifest. Consequently, the overall strength of concrete appears to be higher thanthat of mortar.
6. Conclusions
An experimental characterization of the dynamic behavior of concrete and mortar at very highstrain rates and under high hydrostatic pressures is presented. Quasistatic compression, split
Fig. 10. Velocity profiles measured at the center of the rear surface of the anvil plate and the corresponding average
stress in the mortar and concrete specimens interpreted according to (6); (a) V0 ¼ 290ms@1, (b) V0 ¼ 330ms@1.
D.L. Grote et al. / International Journal of Impact Engineering 25 (2001) 869–886 883
Hopkinson pressure bar and plate impact experiments are used, involving strain rates from 10@3
to 104 s@1 and confining pressures from 0 to 1.5GPa.Experiments show that the behavior of mortar is significantly rate-sensitive in the strain-rate
range of 10@3–1700 s@1. The rate dependence is weaker for strain rates below 400 [email protected] stronger rate dependence is observed for strain rates above this transition rate. Theexperiments also show that the shape of the stress-strain curves at different rates are similar toeach other and allow the strain-softening behavior of mortar to be characterized using a simplescaling function.Under the conditions of plate impact, significantly higher stresses are carried by concrete and
mortar than what is observed for the materials under conditions of quasistatic, uniaxialcompression. The average flow stress of 1.7GPa for the concrete and 1.3GPa for the mortar wasobserved during experiments at an impact velocity of 330ms@1 inducing strain rates on the order of104 s@1 and hydrostatic pressures over 1GPa. The marked increases in stress-carrying capacitiesunder plate impact conditions are attributed to the effects of strain-rate hardening and the strongpressure-dependence of the response of the materials. Based on the results of quasistatic uniaxialcompression and plate impact experiments on mortar, approximately 42% of the strengthenhancement is due to rate sensitivity and 58% is attributed to the effect of hydrostatic pressure.The average stress carried by concrete in plate impact experiments is approximately 30% higher
than that of mortar, indicating the hardening effects of aggregate in concrete under impactloading. In contrast, the strength of concrete is found to be lower than that of pure mortar underconditions of quasistatic, uniaxial stress. The differing trends reflect the effects of differentdeformation and failure mechanisms in concrete under the quasistatic and impact loading. Thekey is the presence or lack of hydrostatic pressure. Under conditions of uniaxial stress, theinterfaces between the aggregate and mortar in concrete provide enhanced opportunities for crackinitiation and growth, limiting the strength of the overall composite. Under the conditions of theimpact experiments, the closure effect of attendant hydrostatic pressure cause deformation tooccur in the aggregate as well as in the mortar matrix, allowing the aggregate to act asreinforcement without inducing early failure in the form of interphase crack development.Due to the material heterogeneity inherent in the concrete and mortar specimens, the stress and
deformation are nonuniform in general. The plate impact configuration used provides a means withwhich an average measure for the stress carried by the materials under dynamic conditions can beobtained experimentally. Experiments show that point measurements taken on the rear surface ofthe target plate are individually indicative of the average stress history in the specimens analyzed.The data obtained herein allows a constitutive relation for the response of concrete and mortar
to be formulated for the strain rate regime of 10@3–104 s@1 and the pressure regime of 0–1.5GPa. This relation is discussed and used by Park et al. [30] as part of a micromechanical modeldescribing the dynamic behavior of concrete. A series of fully dynamic finite element simulationsare carried out there to outline the effects of microstructure and phase volume fractions on theoverall response.
Acknowledgements
This research is sponsored by the US Air Force Office of Scientific Research under grantsF49620-97-10055, F49620-97-1-0415 and F08671-98009587. We would like to thank Dr. J. Porter
D.L. Grote et al. / International Journal of Impact Engineering 25 (2001) 869–886884
at the Tyndall AFB for providing the materials used in the experiments. We would also like tothank Prof. L. L. Jacobs at Georgia Tech for performing the ultrasonic wave speed measurementson the materials.
References
[1] Ross CA, Thompson PY, Tedesco JW. Split-Hopkinson pressure-bar tests on concrete and mortar in tension and
compression. ACI Mater J 1989;86(5):475–81.[2] Ross CA, Tedesco JW, Kuennen ST. Effects of strain rate on concrete strength. ACI Mater J 1995;92(1):
37–47.
[3] Ross CA, Jerome DM, Tedesco JW, Hughes ML. Moisture and strain rate effects on concrete strength. ACI MaterJ 1996;94:293–300.
[4] Tedesco JW, Ross CA, Kuennen ST. Experimental and numerical analysis of high-strain rate splitting-tensile tests.
ACI Mater J 1993;90:162–9.[5] Bazant ZP, Gu WH, Faber KT. Softening reversal and other effects of a change in loading rate on fracture of
concrete. ACI Mater J 1995;92(1):3–9.[6] Yon JH, Hawkins NM, Kobayashi AS. Strain-rate sensitivity of concrete mechanical properties. ACI Mater
J 1992;89(2):146–53.[7] Takeda J-I. Strain rate effects on concrete and reinforcements, and their contributions to structures: In: Mindess S,
Shah SP, editors. Cement-based composites: strain rate effects on fracture. Pittsburgh, PA, Materials Research
Society, 1985. p. 15–20.[8] Shah SP. Concrete and fiber reinforced concrete subject to impact loading. In: Mindess S, Shah SP, editors.
Cement-based composites: strain rate effects on fracture. Materials Research Society, 1985. p. 181–201.
[9] Soroushian P, Choi K-B, Fu G. Tensile strength of concrete at different strain rates. In: Mindess S, Shah SP,editors. Cement-based composites: strain rate effects on fracture. Materials Research Society, 1985. p. 87–92.
[10] Malvern LE, Jenkins DA, Tang T, Ross CA. Dynamic compressive testing of concrete. Proceedings of Second
Symposium on the Interaction of Non-Nuclear Munitions with Structures. Florida: U.S. Dept. of Defense, 1985.p. 194–9.
[11] Bischoff PH, Perry SH. Compressive strain rate effects of concrete. In: Mindess S, Shah SP, editors. Cement-basedcomposites: strain rate effects on fracture. Materials Research Society, 1985. p. 151–65.
[12] Bischoff PH, Perry SH. Compressive behaviour of concrete at high strain rates. RIELM Mater Struct 1991;24:425–50.
[13] John R, Shah SP. Effects of high strength and rate of loading on fracture parameters of concrete. Proceedings of
SEM-RILEM International Conference Fracture. Concrete and Rock, 1987. p. 35–52.[14] Hughes BP, Gregory R. Concrete subjected to high rates of loading in compression. Mag Concr Res
1972;24(78):25–36.
[15] Watstein D. Effect of straining rate on the compressive strength and elastic properties of concrete. ACIJ 1953;49(8):729–44.
[16] Oh BH. Behavior of concrete under dynamic tensile loads. ACI Mater J 1987;84:8–13.[17] Bresler B, Bertero VV. Influence of high strain rate and cyclic loading of unconfined and confined concrete in
compression. Proceedings of Second Canadian Conference on Earthquake Engineering. Hamilton, Ontario, 1975.p. 1–13.
[18] Takeda J, Tachikawa H. The mechanical properties of several kinds of concrete at compressive, tensile, and
flexural tests in high rates of loading. Trans Architect Inst Jpn 1962;77:1–6.[19] Hughes BP, Watson AJ. Compressive strength and ultimate strain of concrete under impact loading. Mag Concr
Res 1978;30(105):189–99.
[20] Chang WS. Impact of solid missiles on concrete barriers. ASCE J Struct Div 1981;107(2):257.[21] Haldar A, Hamieh H. Local effects of solid missiles on concrete structures. ASCE J Struct Div 1984;110(5):948.[22] Nickell RE, Rashid YR, Kurkchubasche IR. Low-velocity impact of missiles on reinforced concrete structures.
J Pressure Vessel Technol 1991;113:127–32.
D.L. Grote et al. / International Journal of Impact Engineering 25 (2001) 869–886 885
[23] Shirai K, Ito C, Onuma H. Numerical studies of impact on reinforced concrete beam of hard missile. Nucl Eng Des
1994;150:483–9.[24] Yankelevsky DZ. Local response of concrete slabs to low velocity missile impact. Int J Impact Eng 1997;19(4):331–43.[25] Dancygier AN, Yankelevsky DZ. High strength concrete response to hard projectile impact. Int J Impact Eng
1996;18(6):583–99.[26] Dancygier AN. Rear face damage of normal and high-strength concrete elements caused by hard projectile impact.
ACI Struct J 1998;95(3):291–304.
[27] Kipp ME, Chhabildas LC, Reinhart WD. Elastic shock response and spall strength of concrete. In: Schmidt SC,Dandekar DP, Forbes JW, editors. Proceedings of Tenth American Physical Society Topical Conference on ShockCompression of Condensed Matter. Amherst, Massachusetts, July 27–August 1, 1997. p. 557–60.
[28] Kennedy RP. A review of procedures for the analysis and design of concrete structures to resist missile impacteffects. Nucl Eng Des 1976;37:183–203.
[29] Barr P. Guidelines for the design, assessment of concrete structures subjected to impact. London: UK AtomicEnergy Authority, HMSO, 1990.
[30] Park SW, Xia Q, Zhou M. Dynamic behavior of concrete at high strain rates and pressures: part II. Numericalsimulation. Int. J. Impact Eng 2001;25(9):887–910.
[31] Chen W-F, Saleeb AF. Constitutive equations for engineering materials. New York: Wiley, 1982.
[32] Shah SP, Swartz SE, Ouyang C. Fracture mechanics of concrete. New York: Wiley, 1995.[33] Kolsky H. An investigation of the mechanical properties of materials at very high rates of loading. Proc Phys Soc
1949;B62:676–700.
[34] Hopkinson B. A method of measuring the pressure in the deformation of high explosives or by the impact ofbullets. Philos Trans R Soc 1914;A213:437–52.
[35] Davies RM. A critical study of the Hopkinson pressure bar. Philos Trans R Soc London 1948;A240:375–457.
[36] Harding J, Wood ED, Campbell JD. Tensile testing of material at impact rates of strain. J Mech Eng Sci1960;2:88–96.
[37] Baker WW, Yew CH. Strain rate effects in the propagation of torsional plastic waves. J Appl Mech 1966;33:917–23.[38] Lindholm US. Some experiments with the split Hopkinson pressure bar. J Mech Phys Solids 1964;12:317–35.
[39] Lindholm US. High strain rate tests. In: Bunshah RF, editor. Measurement of mechanical properties, vol. V, Part1. New York: Interscience, 1971. p. 199.
[40] Bertholf LD, Karnes CH. Two-dimensional analysis of the split Hopkinson pressure bar system. J Mech Phys
Solids 1975;23(1):1–19.[41] Davies EDH, Hunter SC. The dynamic compression testing of solids by the method of the split Hopkinson
pressure bar. J Mech Phys Solids 1963;11:155.
[42] CEB., Concrete structures under impact and impulsive loading. Bulletin d’Information No. 187, Comit!ee Euro-International du B!eeton, Lausanne, France, 1988.
[43] Takeda J, Tachikawa H. Deformation and fracture of concrete subjected to dynamic load. Proceedings ofInternational Conference on Mechanical Behavior of Materials. Kyoto, Japan, 1971. p. 267–77.
[44] Kvirikadze OP. Determination of the ultimate strength and modulus of deformation of concrete at different ratesof loading. Proceedings of RILEM International Symposium on Testing In-Situ Concrete Structures. Budapest,1977. p. 109–17.
[45] Hatano T, Tsutsumi H. Dynamical compressive deformation and failure of concrete under earthquake load.Proceedings of Second World Conference on Earthquake Engineering. Tokyo: Science Council of Japan, 1960. p.1963–78.
[46] Cowell WL. Dynamic properties of plain Portland cement concrete, Technical Report No. R447, US Naval CivilEngineering Laboratory, Port Hueneme, CA, 1966.
[47] Dilger WH, Koch R, Kowalczyk R. Ductility of plain and confined concrete under different strain rates. ACI J
1984;81(1):73–81.[48] Dhir RK, Sangha CM. Study of the relationships between time, strength, deformation and fracture of plain
concrete. Mag Concr Res 1972;24(81):197–208.[49] Clifton RJ, Klopp RW. Pressure-shear plate impact testing. In: Boyer HE, Gall TL, editors. Metal’s handbook.
9th ed., vol. 8. Metals Park: American Society of Metals, 1985. p. 230–9.
D.L. Grote et al. / International Journal of Impact Engineering 25 (2001) 869–886886