Embed Size (px)
Citation preview
Maternal Child & Adolescent Health Community Health Needs Assessment
2013-2014
June 2014
• Needs Assessment Due
May 2015 • 5-Year Action Plan Due
2015-2020
• Implementation
2
Title V Maternal and Child Health Block Grant
• Title V is the only federal funding which allows health departments to develop programs based upon local needs.
• Every five years a comprehensive statewide needs assessment must be conducted to determine what those needs are.
• California decentralizes the statewide process by having each local jurisdiction conduct a needs assessment
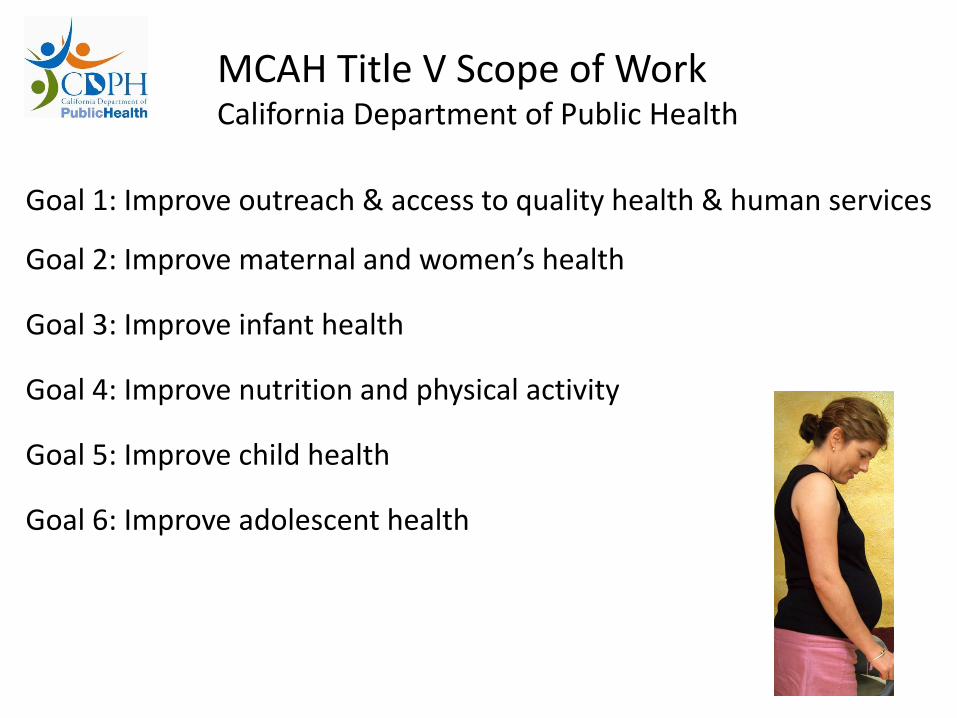
MCAH Title V Scope of Work California Department of Public Health
Goal 1: Improve outreach & access to quality health & human services
Goal 2: Improve maternal and women’s health
Goal 3: Improve infant health
Goal 4: Improve nutrition and physical activity
Goal 5: Improve child health
Goal 6: Improve adolescent health
4
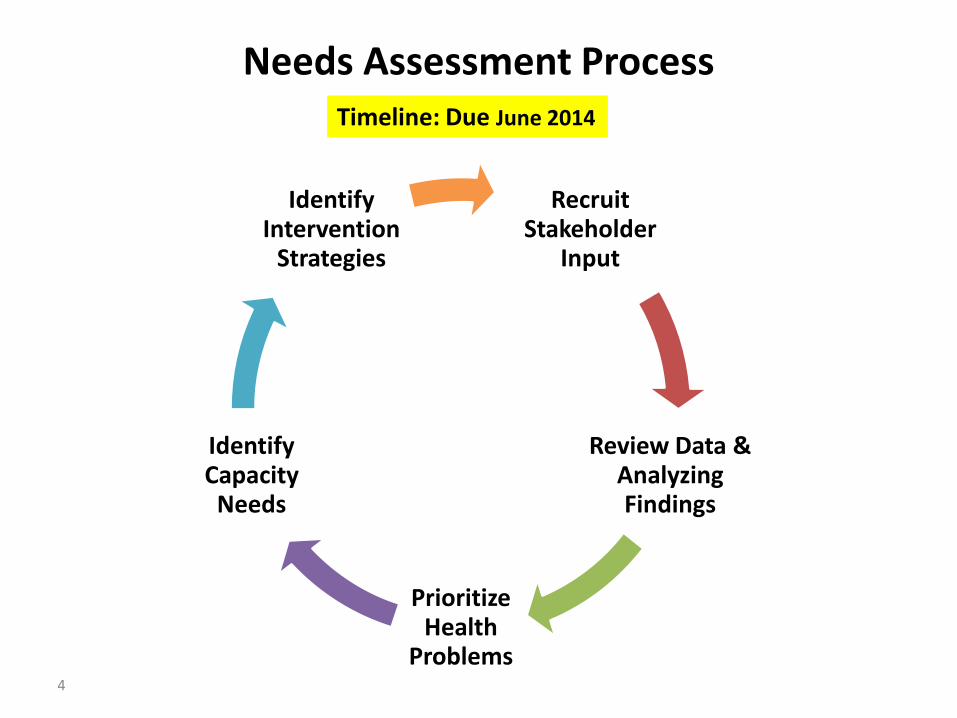
Needs Assessment Process
Recruit Stakeholder
Input
Review Data & Analyzing Findings
Prioritize Health
Problems
Identify Capacity
Needs
Identify Intervention
Strategies
Timeline: Due June 2014
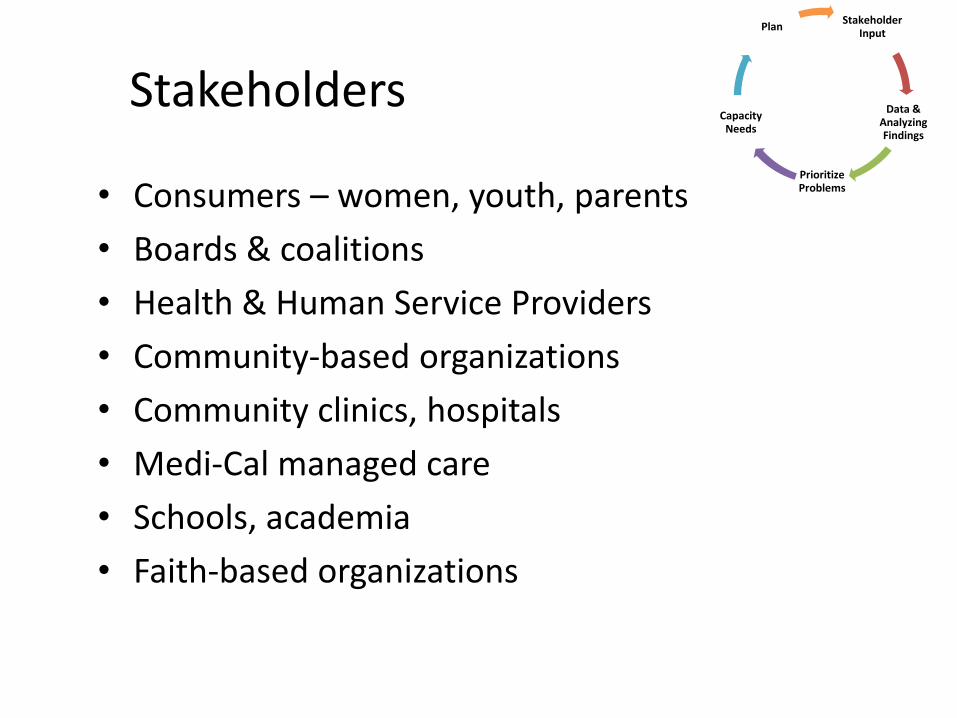
Stakeholders
• Consumers – women, youth, parents
• Boards & coalitions
• Health & Human Service Providers
• Community-based organizations
• Community clinics, hospitals
• Medi-Cal managed care
• Schools, academia
• Faith-based organizations
Stakeholder Input
Data & Analyzing Findings
Prioritize Problems
Capacity Needs
Plan
Data
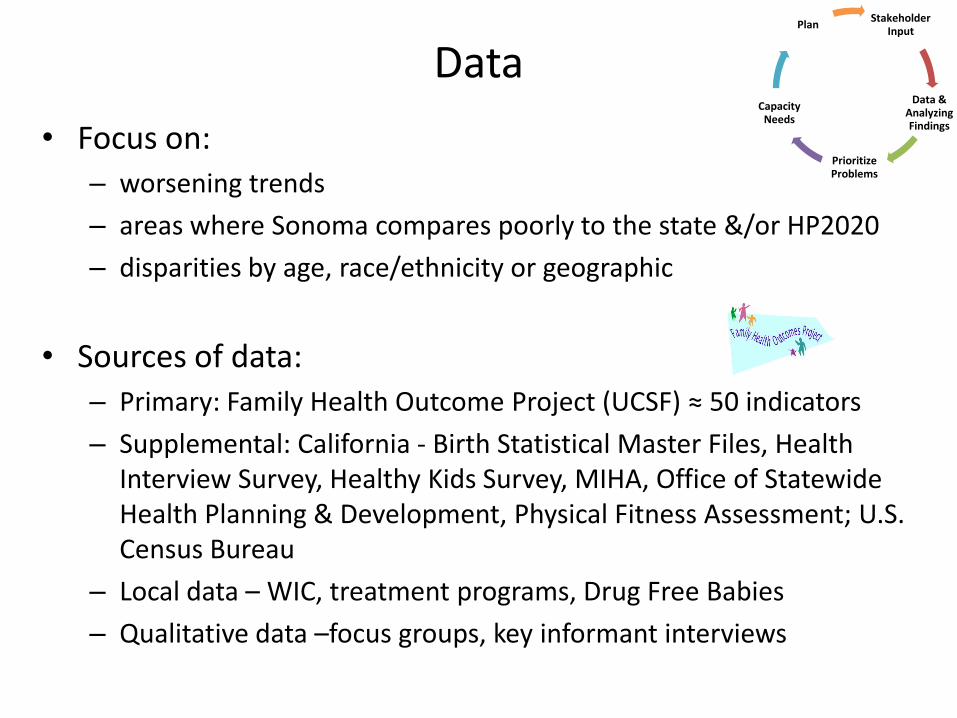
• Focus on:
– worsening trends
– areas where Sonoma compares poorly to the state &/or HP2020
– disparities by age, race/ethnicity or geographic
• Sources of data:
– Primary: Family Health Outcome Project (UCSF) ≈ 50 indicators
– Supplemental: California - Birth Statistical Master Files, Health Interview Survey, Healthy Kids Survey, MIHA, Office of Statewide Health Planning & Development, Physical Fitness Assessment; U.S. Census Bureau
– Local data – WIC, treatment programs, Drug Free Babies
– Qualitative data –focus groups, key informant interviews
Stakeholder Input
Data & Analyzing Findings
Prioritize Problems
Capacity Needs
Plan
How do we Prioritize Problems?
Consider:
• numbers affected & disparities by age, race/ethnicity, geography
• seriousness of issue & impact downstream
• economic impact of addressing vs. not addressing
• are there ways to measure progress
• is there “community will” to address the problem
• are there best practices & resources exist to address
• does MCAH’s have a unique ability to impact &/or would partnering significantly increase effectiveness
Stakeholder
Input
Data & Analyzi
ng Finding
s Prioritize
Problems
Capacity
Needs
Plan
Capacity Assessment
Identify resources needed to address problems in our community
May include: Staff training, best practice information, more data
Stakeholder Input
Data & Analyzing Findings
Prioritize Problems
Capacity Needs
Plan
Preliminary Review of Sonoma Data
Areas of Concern for 2014:
• poverty and self sufficiency indicators
• substance use – tobacco, alcohol, marijuana, prescription drug, NAS
• mental health
• overweight & obesity
• entry to early prenatal care
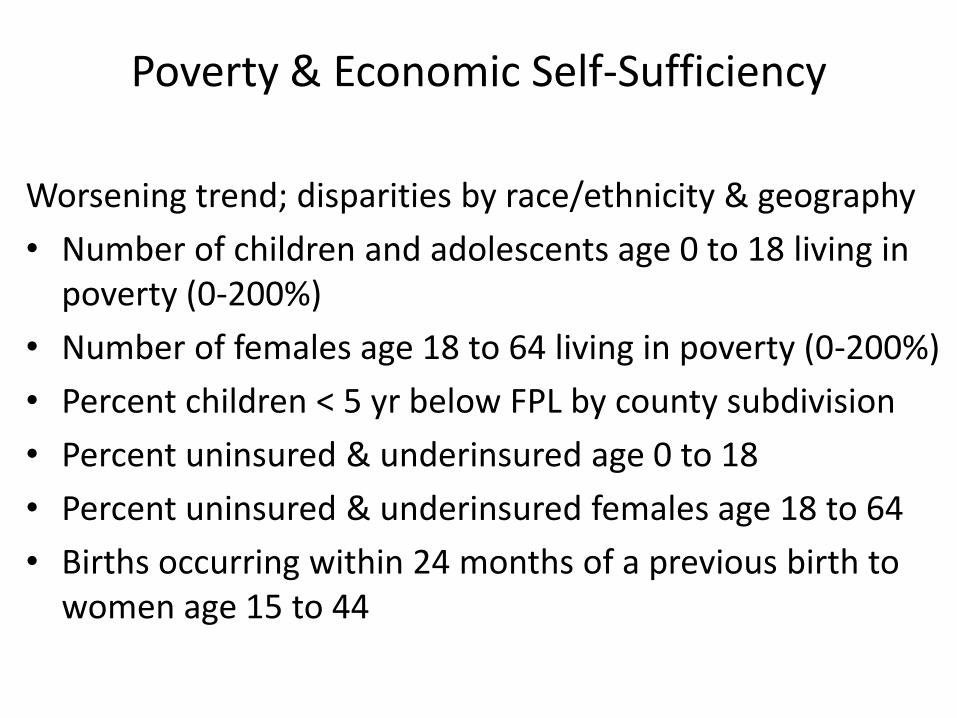
Poverty & Economic Self-Sufficiency
Worsening trend; disparities by race/ethnicity & geography
• Number of children and adolescents age 0 to 18 living in poverty (0-200%)
• Number of females age 18 to 64 living in poverty (0-200%)
• Percent children < 5 yr below FPL by county subdivision
• Percent uninsured & underinsured age 0 to 18
• Percent uninsured & underinsured females age 18 to 64
• Births occurring within 24 months of a previous birth to women age 15 to 44
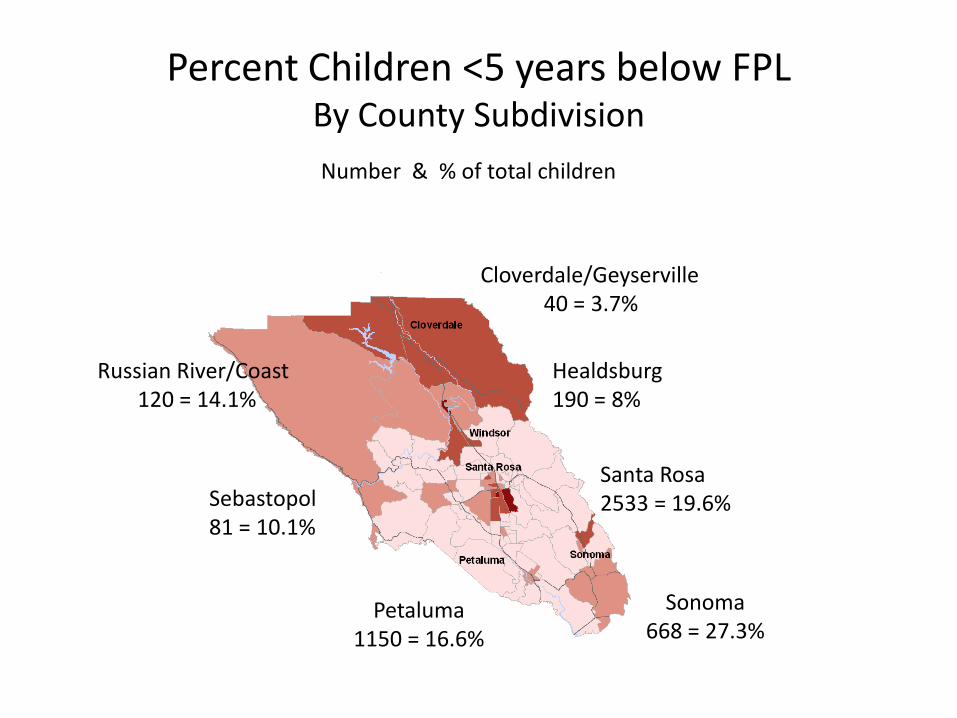
Percent Children <5 years below FPL By County Subdivision
Sonoma 668 = 27.3%
Cloverdale/Geyserville 40 = 3.7%
Santa Rosa 2533 = 19.6%
Petaluma 1150 = 16.6%
Russian River/Coast 120 = 14.1%
Sebastopol 81 = 10.1%
Healdsburg 190 = 8%
Number & % of total children
There are evidence-based strategies that our community can use to help increase economic self sufficiency among families.
1 2 3 4 5
0% 0% 0%0%0%
1. Strongly Agree
2. Agree
3. Neutral
4. Disagree
5. Strongly Disagree
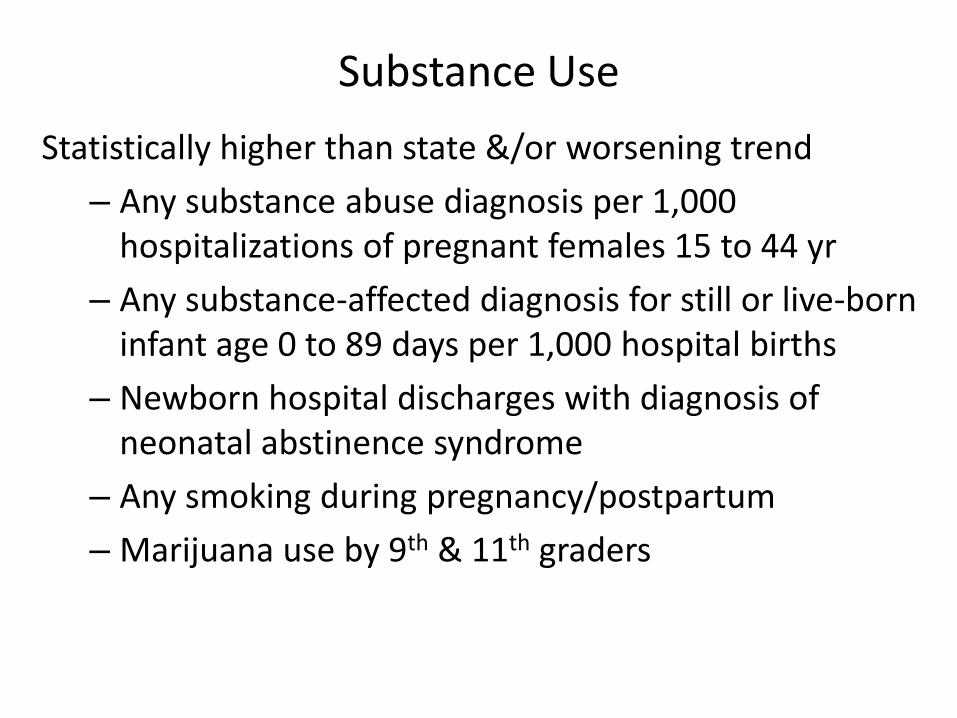
Substance Use
Statistically higher than state &/or worsening trend
– Any substance abuse diagnosis per 1,000 hospitalizations of pregnant females 15 to 44 yr
– Any substance-affected diagnosis for still or live-born infant age 0 to 89 days per 1,000 hospital births
– Newborn hospital discharges with diagnosis of neonatal abstinence syndrome
– Any smoking during pregnancy/postpartum
– Marijuana use by 9th & 11th graders
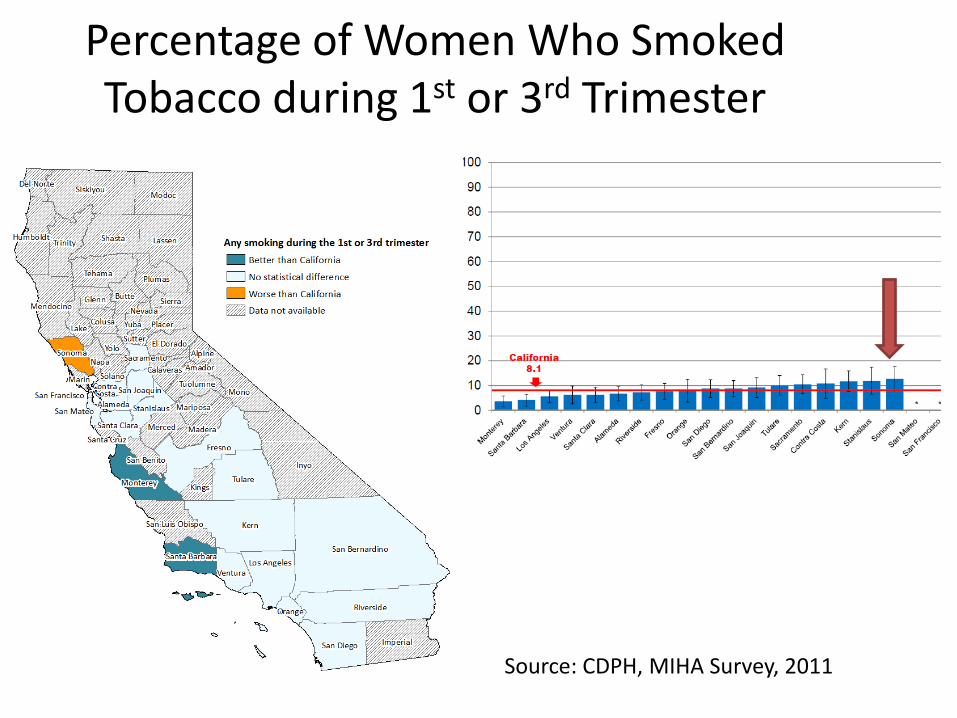
Percentage of Women Who Smoked Tobacco during 1st or 3rd Trimester
Source: CDPH, MIHA Survey, 2011
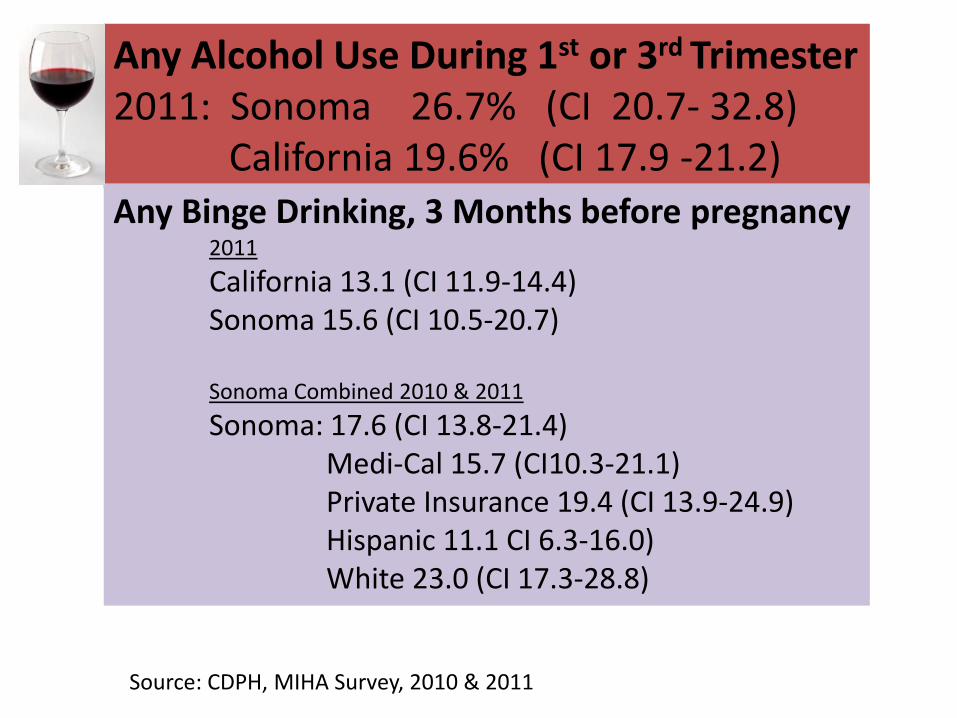
Any Alcohol Use During 1st or 3rd Trimester 2011: Sonoma 26.7% (CI 20.7- 32.8) California 19.6% (CI 17.9 -21.2)
Source: CDPH, MIHA Survey, 2010 & 2011
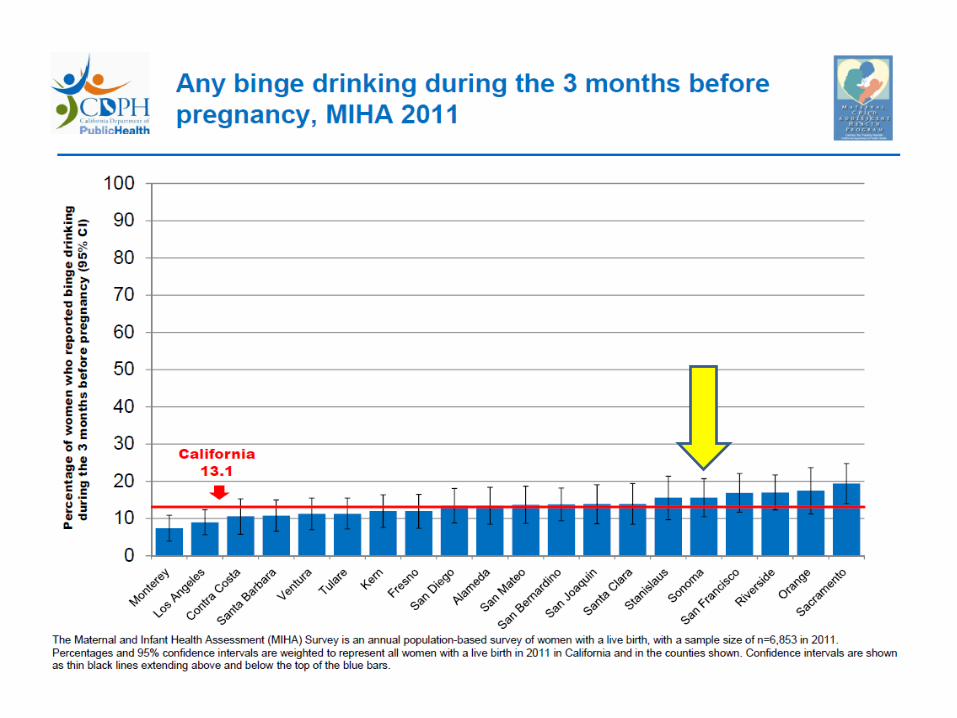
Any Binge Drinking, 3 Months before pregnancy 2011
California 13.1 (CI 11.9-14.4) Sonoma 15.6 (CI 10.5-20.7) Sonoma Combined 2010 & 2011
Sonoma: 17.6 (CI 13.8-21.4) Medi-Cal 15.7 (CI10.3-21.1) Private Insurance 19.4 (CI 13.9-24.9) Hispanic 11.1 CI 6.3-16.0) White 23.0 (CI 17.3-28.8)
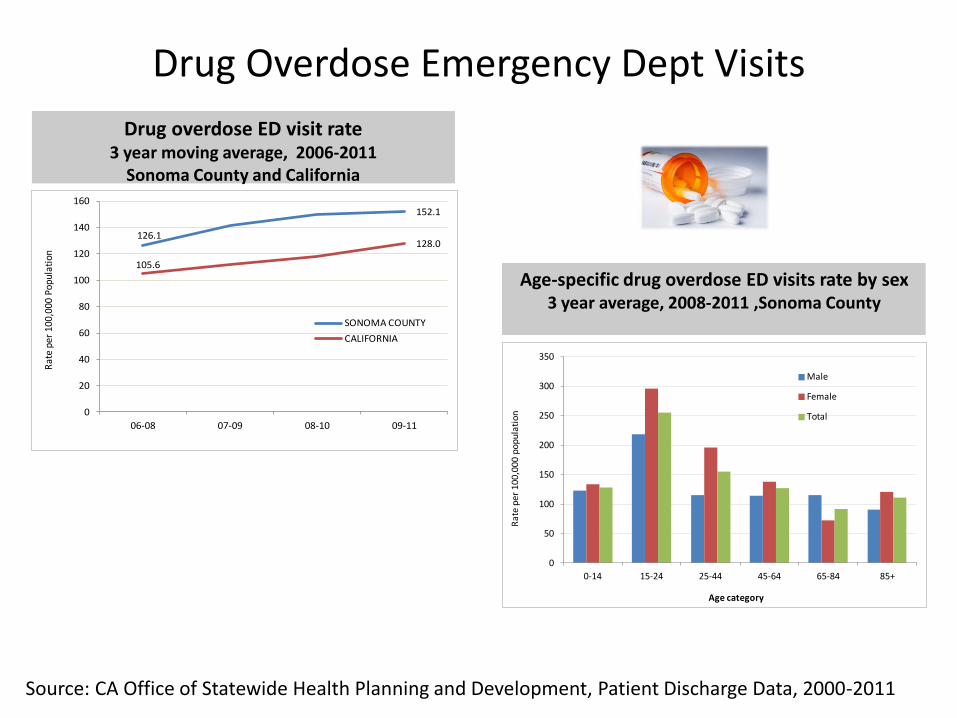
Drug Overdose Emergency Dept Visits
126.1
152.1
105.6
128.0
0
20
40
60
80
100
120
140
160
06-08 07-09 08-10 09-11
Rat
e pe
r 10
0,00
0 Po
pula
tion
SONOMA COUNTY
CALIFORNIA
Drug overdose ED visit rate 3 year moving average, 2006-2011
Sonoma County and California
Age-specific drug overdose ED visits rate by sex 3 year average, 2008-2011 ,Sonoma County
0
50
100
150
200
250
300
350
0-14 15-24 25-44 45-64 65-84 85+
Ra
te p
er
10
0,0
00
po
pu
lati
on
Age category
Male
Female
Total
Source: CA Office of Statewide Health Planning and Development, Patient Discharge Data, 2000-2011
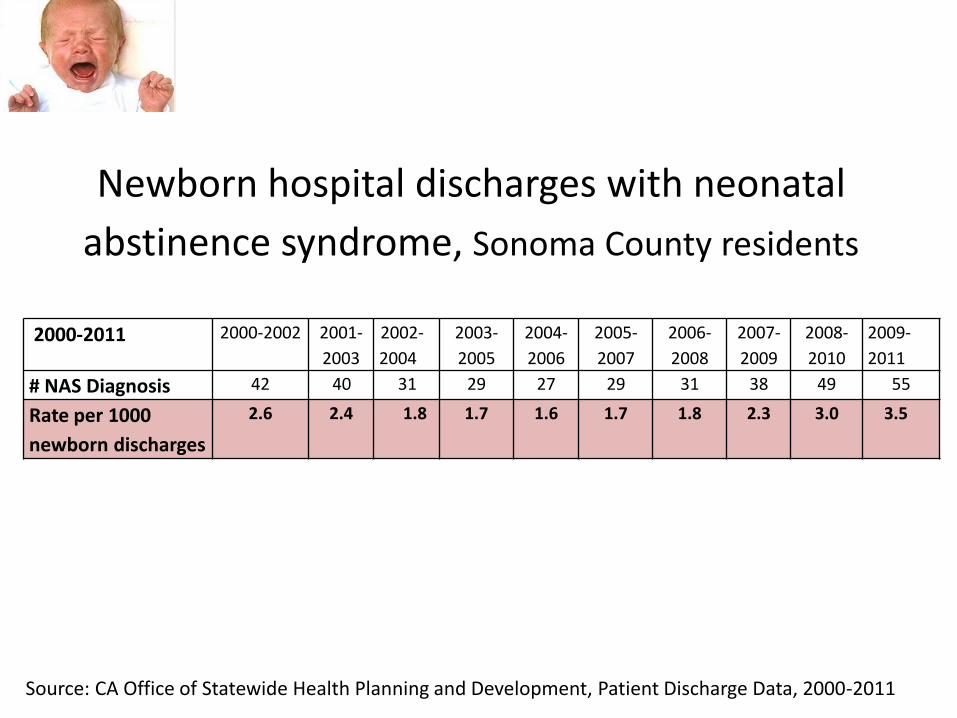
Newborn hospital discharges with neonatal
abstinence syndrome, Sonoma County residents
2000-2011 2000-2002 2001-
2003
2002-
2004
2003-
2005
2004-
2006
2005-
2007
2006-
2008
2007-
2009
2008-
2010
2009-
2011
# NAS Diagnosis 42 40 31 29 27 29 31 38 49 55
Rate per 1000
newborn discharges
2.6 2.4 1.8 1.7 1.6 1.7 1.8 2.3 3.0 3.5
Source: CA Office of Statewide Health Planning and Development, Patient Discharge Data, 2000-2011
Which substance do you think is most important for MCAH to address in our next 5 year plan?
1 2 3 4
0% 0%0%0%
1. Marijuana use
2. Risky alcohol use
3. Tobacco use
4. Prescription drug
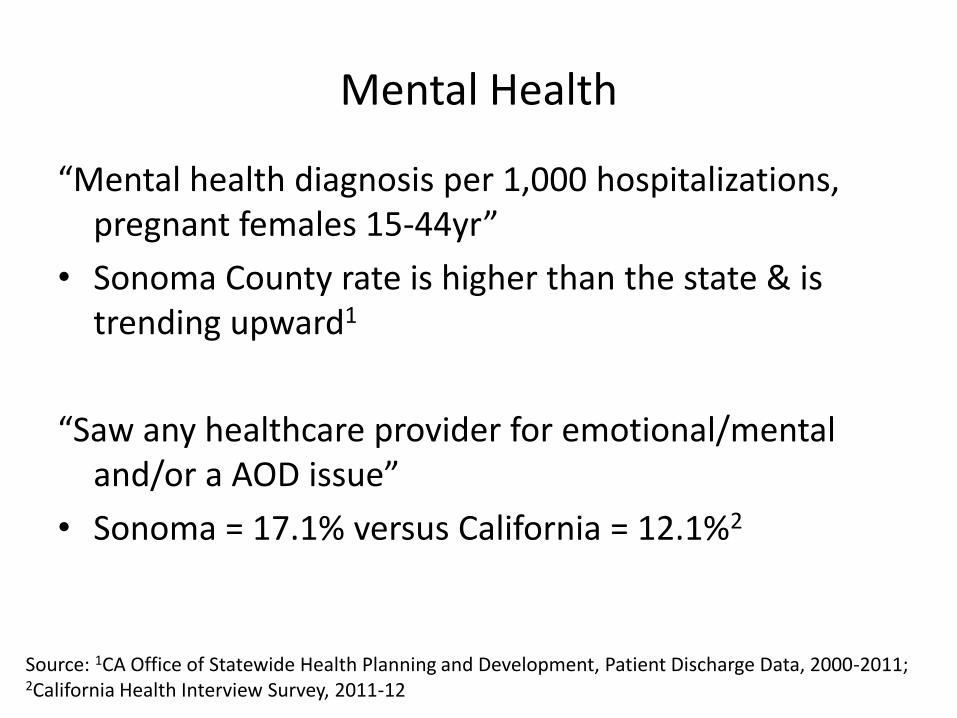
Mental Health
“Mental health diagnosis per 1,000 hospitalizations, pregnant females 15-44yr”
• Sonoma County rate is higher than the state & is trending upward1
“Saw any healthcare provider for emotional/mental and/or a AOD issue”
• Sonoma = 17.1% versus California = 12.1%2
Source: 1CA Office of Statewide Health Planning and Development, Patient Discharge Data, 2000-2011; 2California Health Interview Survey, 2011-12
On a scale of 1 to 5, do you agree that addressing mood disorders among women of reproductive age will help reduce perinatal substance use?
1 2 3 4 5
0% 0% 0%0%0%
1. Strongly Agree
2. Agree
3. Neutral
4. Disagree
5. Strongly Disagree
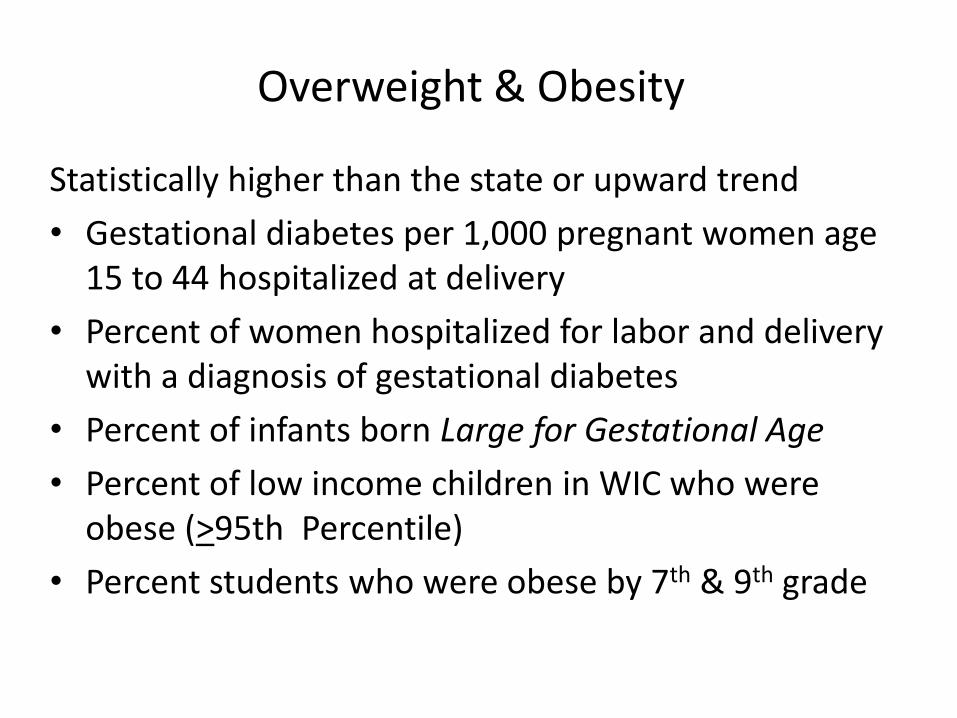
Overweight & Obesity
Statistically higher than the state or upward trend
• Gestational diabetes per 1,000 pregnant women age 15 to 44 hospitalized at delivery
• Percent of women hospitalized for labor and delivery with a diagnosis of gestational diabetes
• Percent of infants born Large for Gestational Age
• Percent of low income children in WIC who were obese (>95th Percentile)
• Percent students who were obese by 7th & 9th grade
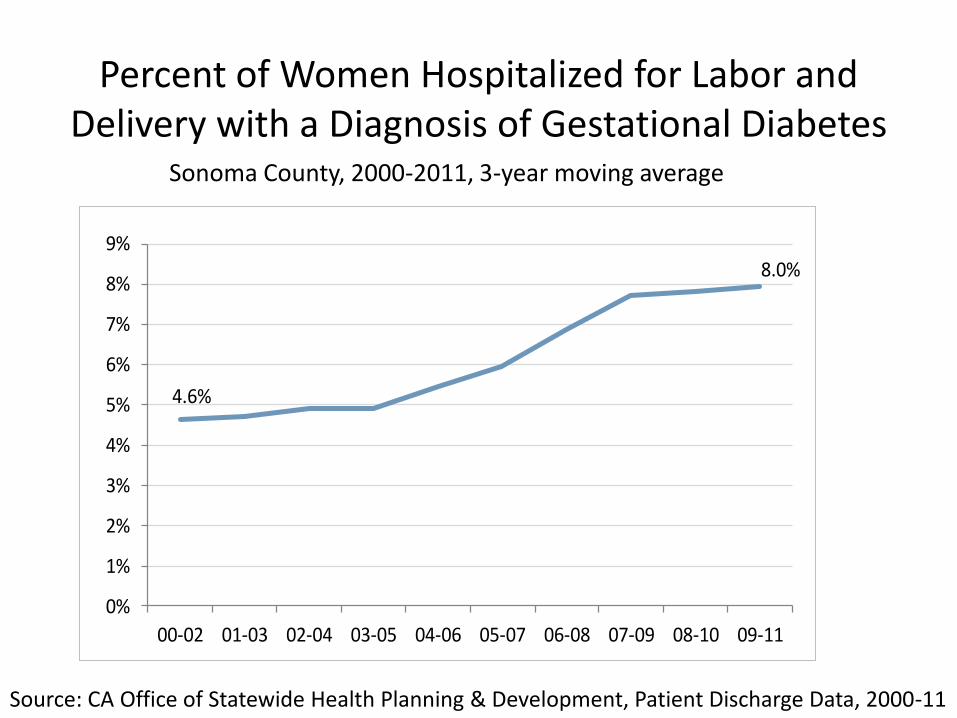
Percent of Women Hospitalized for Labor and Delivery with a Diagnosis of Gestational Diabetes
Sonoma County, 2000-2011, 3-year moving average
4.6%
8.0%
0%
1%
2%
3%
4%
5%
6%
7%
8%
9%
00-02 01-03 02-04 03-05 04-06 05-07 06-08 07-09 08-10 09-11
Source: CA Office of Statewide Health Planning & Development, Patient Discharge Data, 2000-11
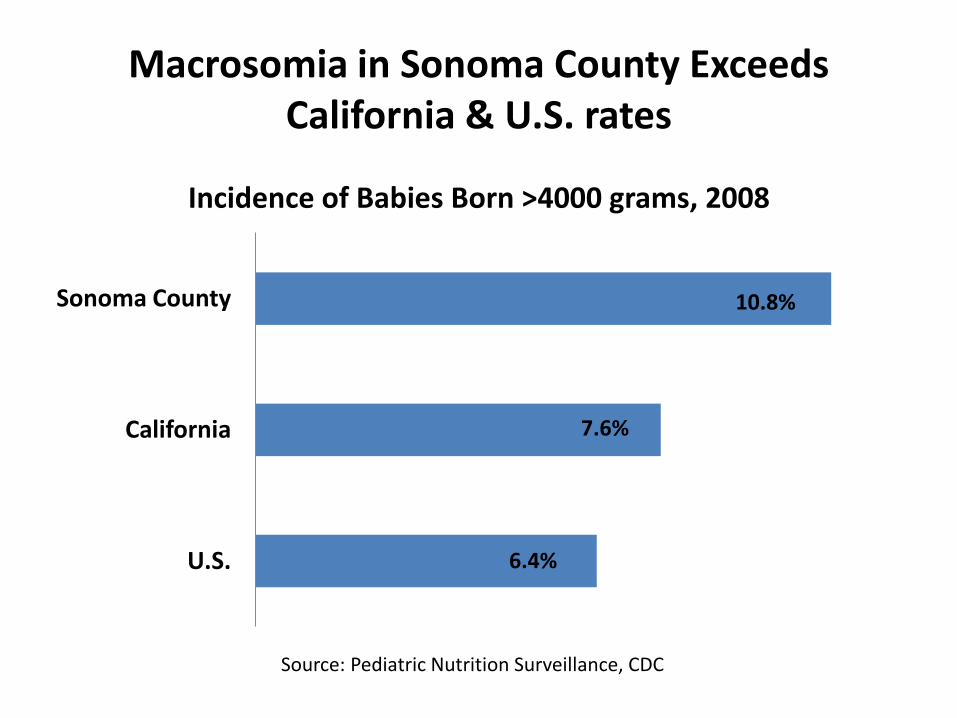
Macrosomia in Sonoma County Exceeds California & U.S. rates
Source: Pediatric Nutrition Surveillance, CDC
6.4%
7.6%
10.8%
U.S.
California
Sonoma County
Incidence of Babies Born >4000 grams, 2008
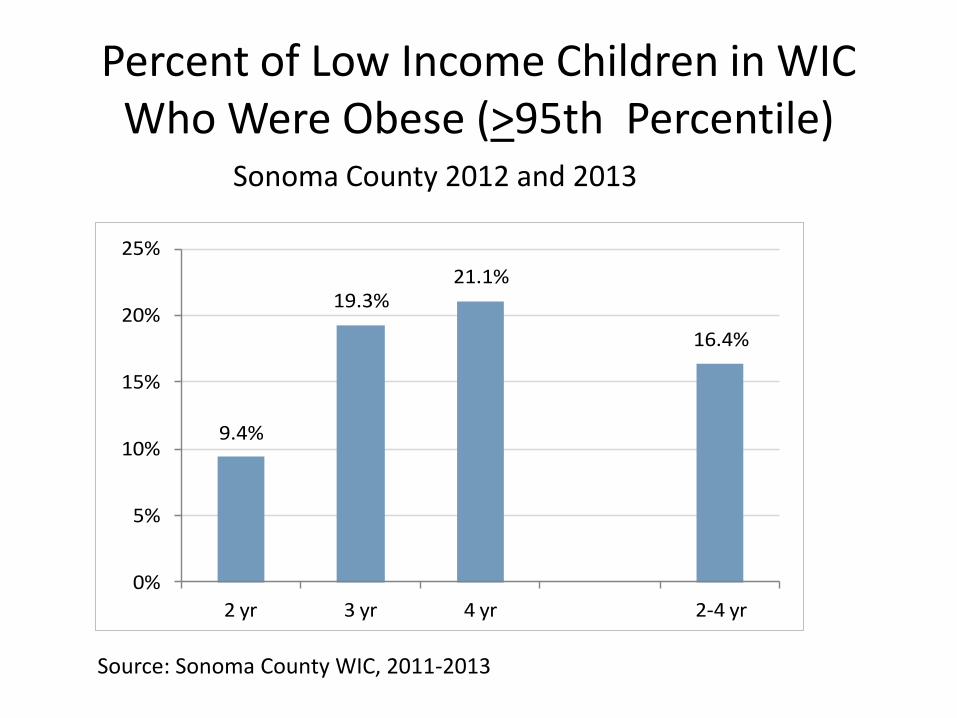
Percent of Low Income Children in WIC Who Were Obese (>95th Percentile)
Sonoma County 2012 and 2013
9.4%
19.3%21.1%
16.4%
0%
5%
10%
15%
20%
25%
2 yr 3 yr 4 yr 2-4 yr
Source: Sonoma County WIC, 2011-2013
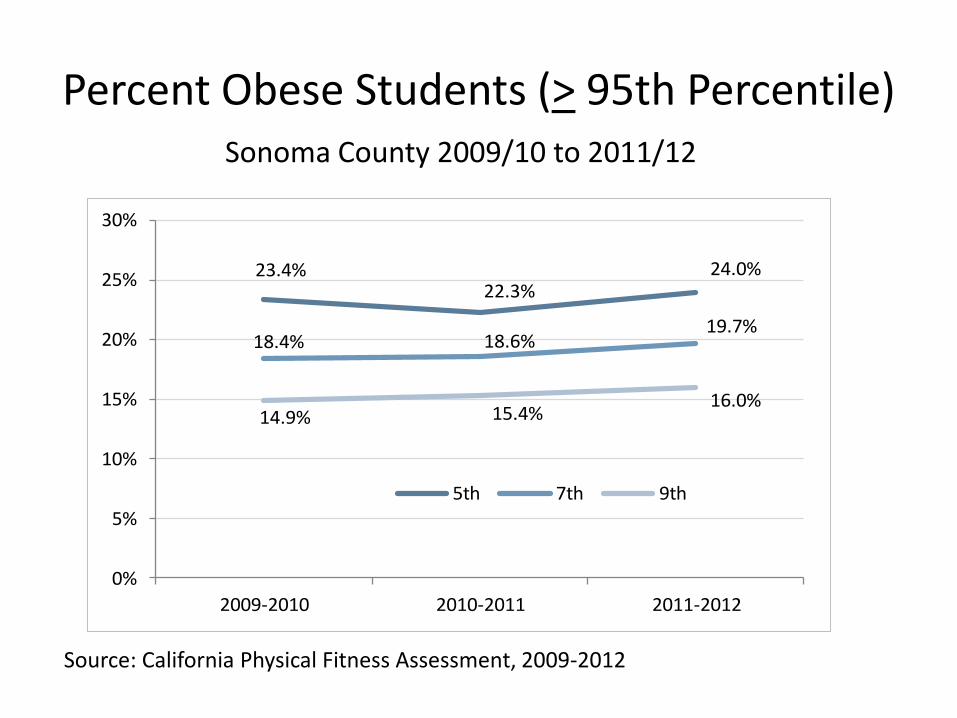
Percent Obese Students (> 95th Percentile) Sonoma County 2009/10 to 2011/12
23.4%22.3%
24.0%
18.4% 18.6%19.7%
14.9% 15.4%16.0%
0%
5%
10%
15%
20%
25%
30%
2009-2010 2010-2011 2011-2012
5th 7th 9th
Source: California Physical Fitness Assessment, 2009-2012
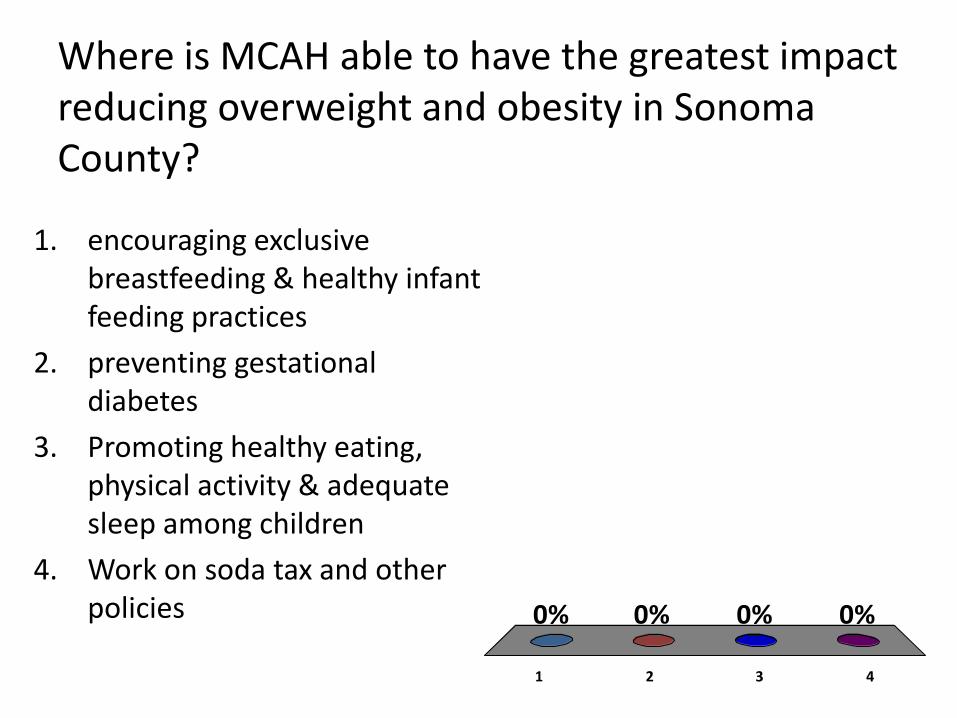
Where is MCAH able to have the greatest impact reducing overweight and obesity in Sonoma County?
1 2 3 4
0% 0%0%0%
1. encouraging exclusive breastfeeding & healthy infant feeding practices
2. preventing gestational diabetes
3. Promoting healthy eating, physical activity & adequate sleep among children
4. Work on soda tax and other policies
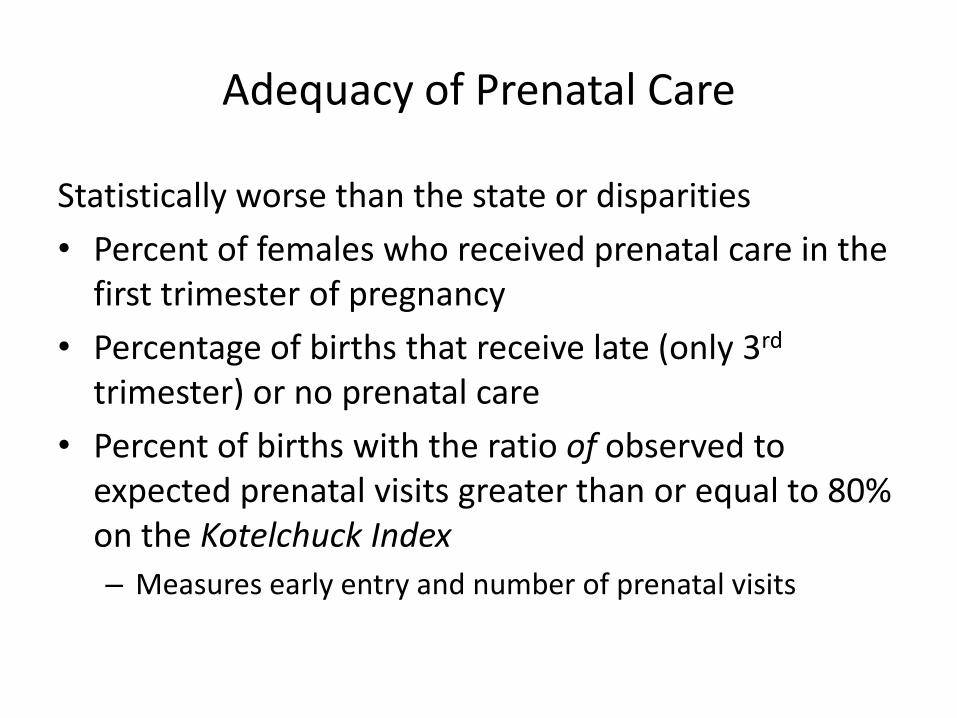
Adequacy of Prenatal Care
Statistically worse than the state or disparities
• Percent of females who received prenatal care in the first trimester of pregnancy
• Percentage of births that receive late (only 3rd trimester) or no prenatal care
• Percent of births with the ratio of observed to expected prenatal visits greater than or equal to 80% on the Kotelchuck Index
– Measures early entry and number of prenatal visits
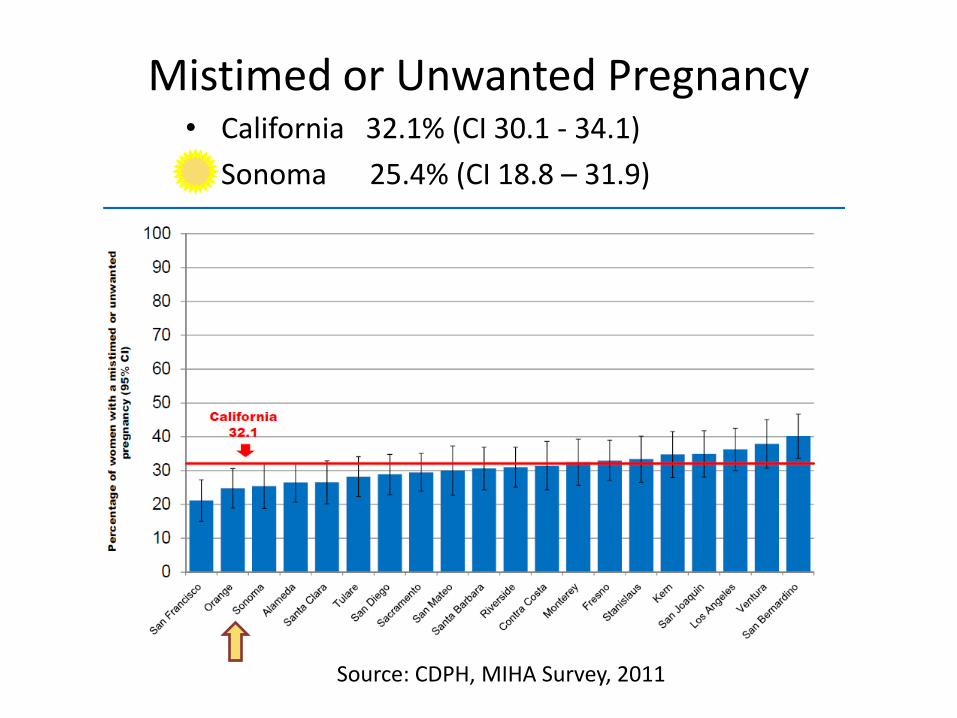
Mistimed or Unwanted Pregnancy • California 32.1% (CI 30.1 - 34.1)
• Sonoma 25.4% (CI 18.8 – 31.9)
Source: CDPH, MIHA Survey, 2011
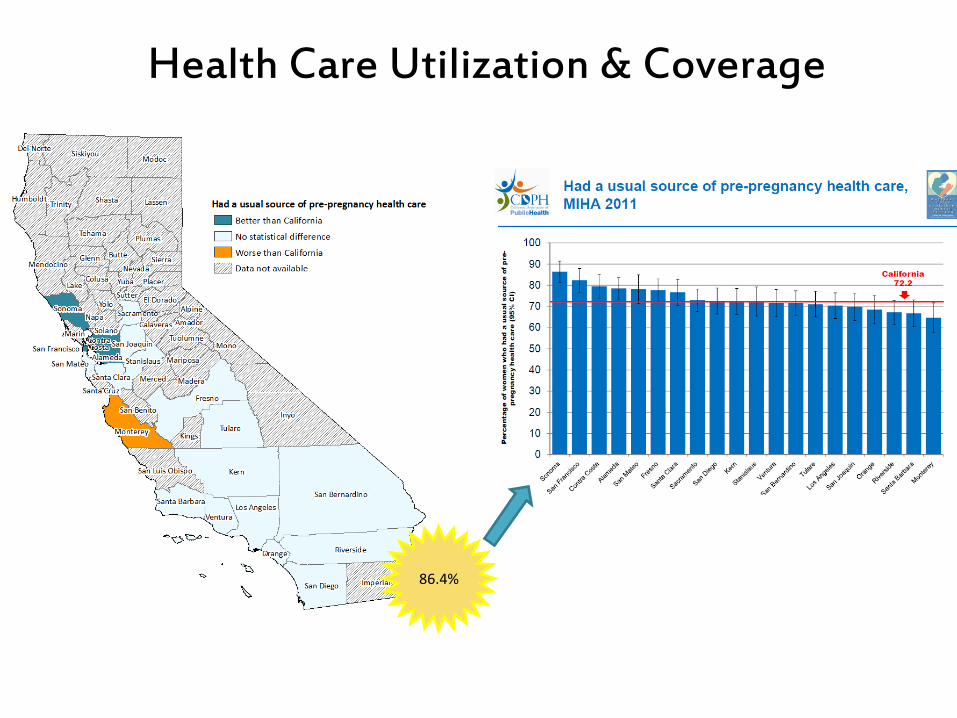
Health Care Utilization & Coverage
86.4%
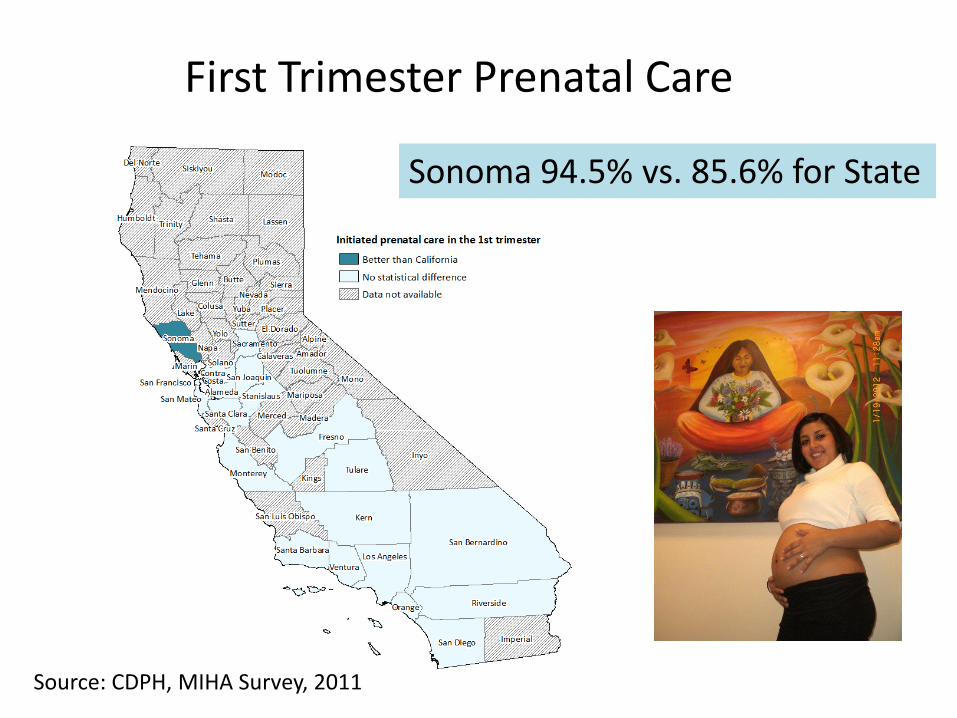
First Trimester Prenatal Care
Sonoma 94.5% vs. 85.6% for State
Source: CDPH, MIHA Survey, 2011
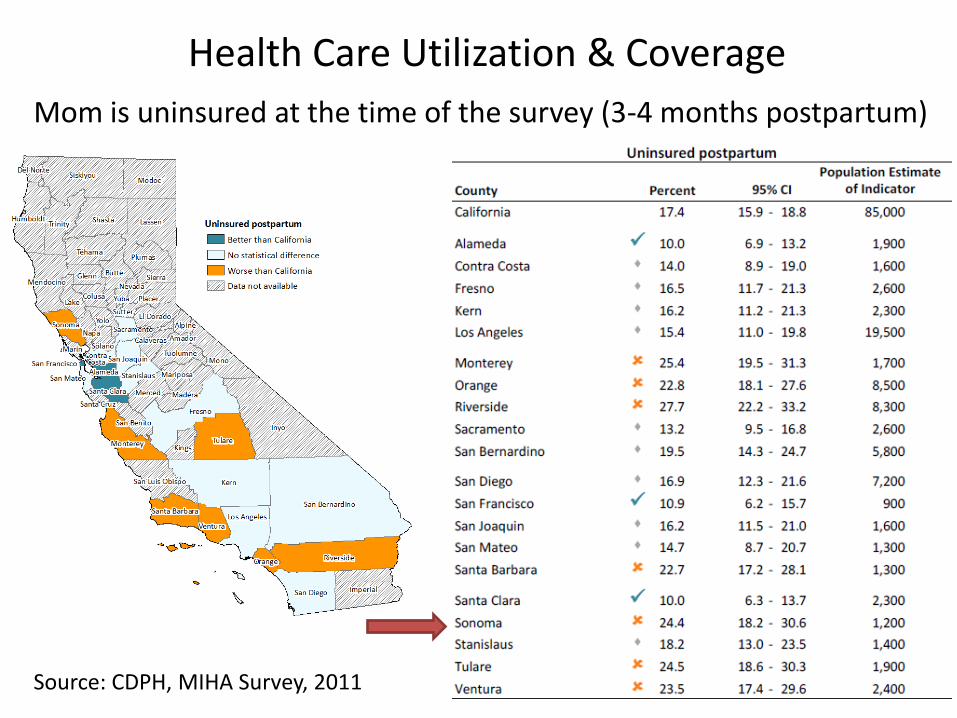
Health Care Utilization & Coverage
Mom is uninsured at the time of the survey (3-4 months postpartum)
Source: CDPH, MIHA Survey, 2011
The most important reason women don’t receive early prenatal care in Sonoma County is because…
1 2 3
0% 0%0%
1. They don’t know it is important
2. They lack health insurance
3. It is difficult to get an appointment
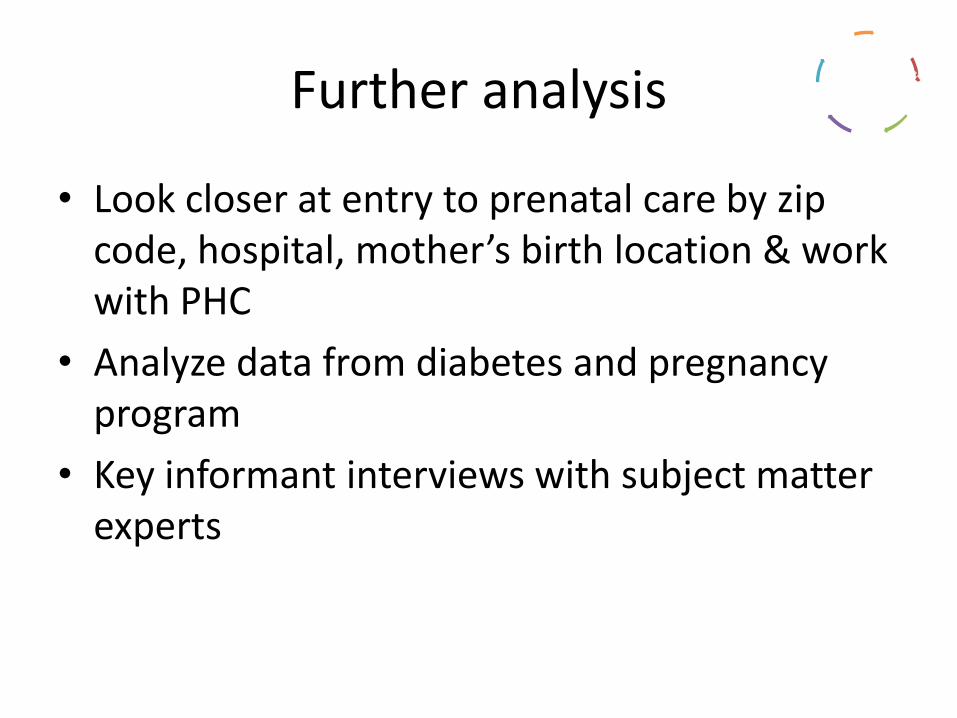
Further analysis
• Look closer at entry to prenatal care by zip code, hospital, mother’s birth location & work with PHC
• Analyze data from diabetes and pregnancy program
• Key informant interviews with subject matter experts
Stakeholder
Input
Data & Analyzi
ng Finding
s Prioritize
Problems
Capacity
Needs
Plan
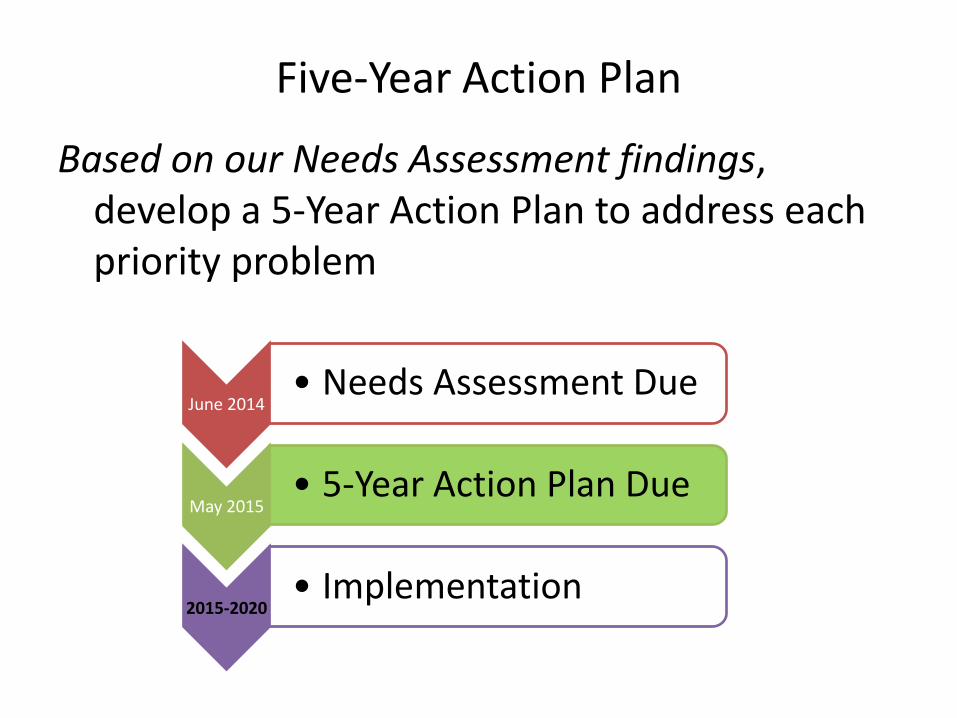
Five-Year Action Plan
Based on our Needs Assessment findings, develop a 5-Year Action Plan to address each priority problem
June 2014 • Needs Assessment Due
May 2015 • 5-Year Action Plan Due
2015-2020 • Implementation