Embed Size (px)
Citation preview

1
TH
IS IS
AN
UN
CO
NT
RO
LL
ED
DO
CU
ME
NT
, T
HE
RE
AD
ER
MU
ST
CO
NF
IRM
IT
S V
AL
IDIT
Y B
EF
OR
E U
SE
TH
IS IS
AN
UN
CO
NT
RO
LL
ED
DO
CU
ME
NT
, T
HE
RE
AD
ER
MU
ST
CO
NF
IRM
IT
S V
AL
IDIT
Y B
EF
OR
E U
SE
LCN FUND TIER 1 CLOSE DOWN REPORT SMART HOOKY
DECEMBER 2013

2
TH
IS IS
AN
UN
CO
NT
RO
LL
ED
DO
CU
ME
NT
, T
HE
RE
AD
ER
MU
ST
CO
NF
IRM
IT
S V
AL
IDIT
Y B
EF
OR
E U
SE
TH
IS IS
AN
UN
CO
NT
RO
LL
ED
DO
CU
ME
NT
, T
HE
RE
AD
ER
MU
ST
CO
NF
IRM
IT
S V
AL
IDIT
Y B
EF
OR
E U
SE
WESTERN POWER DISTRIBUTION (WPD) IN CONFIDENCE
Neither WPD, nor any person acting on its behalf, makes any warranty, express or implied, with respect to the use of any
information, method or process disclosed in this document or that such use may not infringe the rights of any third party or
assumes any liabilities with respect to the use of, or for damage resulting in any way from the use of, any information,
apparatus, method or process disclosed in the document.
Telephone +44 (0) 1332 827446
Fax +44 (0) 115 902 4001
E-mail [email protected]
© Western Power Distribution 2013
No part of this publication may be reproduced, stored in a retrieval system or transmitted, in any form or by any means
electronic, mechanical, photocopying, recording or otherwise, without the written permission of the Future Networks Manager,
Western Power Distribution, Herald Way, Pegasus Business Park, Castle Donington. DE74 2TU

3
TH
IS IS
AN
UN
CO
NT
RO
LL
ED
DO
CU
ME
NT
, T
HE
RE
AD
ER
MU
ST
CO
NF
IRM
IT
S V
AL
IDIT
Y B
EF
OR
E U
SE
TH
IS IS
AN
UN
CO
NT
RO
LL
ED
DO
CU
ME
NT
, T
HE
RE
AD
ER
MU
ST
CO
NF
IRM
IT
S V
AL
IDIT
Y B
EF
OR
E U
SE
Contents
1. Executive Summary ......................................................................................................... 5
Project Overview .......................................................................................................... 5 1.1.
Scope ........................................................................................................................... 5 1.2.
Outcomes Of The Project And Key Learning ................................................................... 5 1.3.
Conclusions And Future Work ....................................................................................... 5 1.4.
2. Project Overview ............................................................................................................. 6
3. Details Of The Work Carried Out ...................................................................................... 7
Project Participants ....................................................................................................... 7 3.1.
Substation Monitoring Solution..................................................................................... 7 3.2.
Customer Energy Monitoring ...................................................................................... 12 3.3.
Telecommunications And System Configuration .......................................................... 15 3.4.
Site Commissioning ..................................................................................................... 17 3.5.
Data Management ...................................................................................................... 17 3.6.
Customer Engagement ................................................................................................ 19 3.7.
Data Display Capabilities ............................................................................................. 22 3.8.
Knowledge Dissemination ........................................................................................... 24 3.9.
4. The Outcomes Of The Project ......................................................................................... 26
Substation Monitoring ................................................................................................ 26 4.1.
Smart Node Performance ............................................................................................ 29 4.2.
Plc Performance ......................................................................................................... 31 4.3.
Radio Backhaul ........................................................................................................... 33 4.4.
Customer Engagement And Incentives......................................................................... 34 4.5.
Website ...................................................................................................................... 34 4.6.
Knowledge Dissemination ........................................................................................... 35 4.7.
5. Performance Compared With Project Aims, Objectives And Success Criteria ................... 36
4
TH
IS IS
AN
UN
CO
NT
RO
LL
ED
DO
CU
ME
NT
, T
HE
RE
AD
ER
MU
ST
CO
NF
IRM
IT
S V
AL
IDIT
Y B
EF
OR
E U
SE
TH
IS IS
AN
UN
CO
NT
RO
LL
ED
DO
CU
ME
NT
, T
HE
RE
AD
ER
MU
ST
CO
NF
IRM
IT
S V
AL
IDIT
Y B
EF
OR
E U
SE
6. Required Modifications To The Planned Approach During The Project............................. 40
7. Significant Variance In Expected Costs And Benefits ....................................................... 41
8. Lessons Learnt For Future Projects ................................................................................. 43
Substation Monitoring ................................................................................................ 43 8.1.
Customer Energy Monitoring ...................................................................................... 43 8.2.
Communications ......................................................................................................... 44 8.3.
Customer Engagement ................................................................................................ 44 8.4.
Knowledge Dissemination ........................................................................................... 45 8.5.
9. Planned Implementation ............................................................................................... 46
10. Facilitate Replication ................................................................................................... 47
Appendix A – Smart Hooky Final Report - NEF .................................................................... 49
Appendix B - Technical Insert For Ofgem LCNF Report – AND Technology............................ 77
Appendix C – Project Change Mandates ............................................................................. 91

5
TH
IS IS
AN
UN
CO
NT
RO
LL
ED
DO
CU
ME
NT
, T
HE
RE
AD
ER
MU
ST
CO
NF
IRM
IT
S V
AL
IDIT
Y B
EF
OR
E U
SE
TH
IS IS
AN
UN
CO
NT
RO
LL
ED
DO
CU
ME
NT
, T
HE
RE
AD
ER
MU
ST
CO
NF
IRM
IT
S V
AL
IDIT
Y B
EF
OR
E U
SE
1. Executive Summary
Project Overview 1.1.Hook Norton is a dynamic rural community in Oxfordshire with around 2,500 residents and 800 properties. In 2009 the village was awarded £400k from DECC’s Low Carbon Communities programme to help its residents ‘decarbonise’. Hook Norton, like many rural villages represents a unique challenge when it comes to carbon reduction because success can only be achieved via a high level of engagement with the local community.
One of the key challenges faced by communities, such as Hook Norton is lack of visibility of energy usage at a personal and community level. Through the Smart Hooky project this has been achieved through a combination of substation and consumer energy monitoring.
Scope 1.2.The project has explored customer engagement and incentive programmes alongside community wide energy monitoring. From a technology perspective, the project deployed a Power Line Carrier (PLC) communications network at scale within the low voltage (LV) network, illustrating its potential capabilities for enabling smart grid end point measurement and data aggregation. An in-house designed substation monitoring solution was also developed utilising off-the-shelf components with a trial UHF radio backhaul system to gather information on the performance of the LV network.
Outcomes of the project and key learning 1.3.Since the project started in 2011, substation monitoring has been installed in 11 substations with 46 load monitoring nodes installed in customer premises. Radio communications have been established between the substations and the WPD communications network allowing data to be backhauled into the control system. Data has been exported from the WPD Enmac system via a FTP link to the National Energy Foundation every 15 minutes where it is in turn published on the customer portal. Power line carrier communications have been successfully used between customer nodes, and distribution substations. Learning from the project has been shared at a number of events, including knowledge dissemination events with local residents and wider industry in Hook Norton.
Conclusions and future work 1.4.Smart Hooky was one of the first Low Carbon Networks Fund projects, designed in 2010 and registered the following year.It has highlighted the need for good data storage within monitoring solutions and the need for simple and replicable installation practices. We have been able to demonstrate that PLC communication can work on UK LV networks with an average success rate of 70-75%. The backhaul communications solution used for this scheme was also a success with reliability in excess of 95%. From a customer engagement perspective, a wide range of recruitment techniques were trialled, although overall customer participation in the trial was lower than expected.
Given the pace of technology development, any future substation monitoring installed by WPD will be based on off the shelf solutions. A wider deployment of UHF radio will be used to support additional applications within WPD.

6
TH
IS IS
AN
UN
CO
NT
RO
LL
ED
DO
CU
ME
NT
, T
HE
RE
AD
ER
MU
ST
CO
NF
IRM
IT
S V
AL
IDIT
Y B
EF
OR
E U
SE
TH
IS IS
AN
UN
CO
NT
RO
LL
ED
DO
CU
ME
NT
, T
HE
RE
AD
ER
MU
ST
CO
NF
IRM
IT
S V
AL
IDIT
Y B
EF
OR
E U
SE
2. Project Overview
The following table outlines the project objectives as laid out in the registration proforma.
Project Title Hook Norton Low Carbon Community Smart Grid
Project Background
Hook Norton is a dynamic rural community in Oxfordshire with around 2,500 residents and 800 properties. Last year, the village was awarded £400k from DECC’s Low Carbon Communities programme to help its residents ‘decarbonise’. Thanks to the Hook Norton Low Carbon group and the limited company which they have set up, the money has been spent on a variety of different projects which, over time, will return money back into the community. Initiatives undertaken to date include home retrofits (£5 to £40k interest free loans), a school makeover (including a 17.5kW PV installation) and a small automatic metering deployment. Plans are now underway to obtain planning consent and funding for a community wind turbine (330kW) to the North East of the village. Hook Norton, like many rural villages represents a unique challenge when it comes to carbon reduction because success can only be achieved via a high level of engagement with the local community. Given the fantastic work that has already gone on in Hook Norton, Western Power Distribution aims to develop a range of tools and techniques that can be used to support the low carbon transition within rural communities.
Scope and objectives
• To develop and explore customer engagement and incentive programmes. This aspect will include a small scale domestic demand response trial. • To develop community data measurement and display capabilities (e.g. to ascertain the total electricity consumption of the village by installing measurement devices at various locations. Subsequently, to provide this and other relevant information back to the local community via a web portal/customer interface (which if successful, could then be used for other villages)) • To deploy Power Line Communications (PLC) technology at scale within the low voltage (LV) network, illustrating its potential capabilities for enabling smart grid end point measurement and data aggregation. • To test an ‘off the shelf’ asset monitoring solution for HV/LV pole-mounted and ground-mounted substations. • To test and demonstrate a miniature smart grid telecommunications network (with multiple technologies) that will enable both local and remote network visibility • To explore the changes that could be made to a network control system for enabling simple forms of Low Voltage (LV) network monitoring and management
Success criteria Accelerates the development of a low carbon energy sector
Has the potential to deliver net benefits to existing and/or future
customers
Has a Direct Impact on the operation of a DNO’s Distribution System
Generates new knowledge that can be shared amongst all
Focuses on network Solutions that are at the trialling stage
Does not lead to unnecessary duplication

7
TH
IS IS
AN
UN
CO
NT
RO
LL
ED
DO
CU
ME
NT
, T
HE
RE
AD
ER
MU
ST
CO
NF
IRM
IT
S V
AL
IDIT
Y B
EF
OR
E U
SE
TH
IS IS
AN
UN
CO
NT
RO
LL
ED
DO
CU
ME
NT
, T
HE
RE
AD
ER
MU
ST
CO
NF
IRM
IT
S V
AL
IDIT
Y B
EF
OR
E U
SE
3. Details of the work carried out
The electricity supply for Hook Norton is delivered through a mix of overhead and ground mounted distribution substations. One of the key aims for the project was to identify and trial methods for monitoring the low voltage network to provide improved information detailing the energy consumption of the village. This was undertaken through a combination of monitoring at substations and energy consumption readings at domestic properties, via smart nodes. Power Line Carrier (PLC) communications have also been trialled on this project to provide the last mile communications between domestic properties and substations. The gathered consumption data was passed on to customers for their own information via an online portal provided by the National Energy Foundation (NEF).
Project Participants 3.1.
Western Power Distribution has worked with a number of partners on the Smart Hooky project.
The National Energy Foundation (NEF) is an independent education charity with a long standing relationship with Hook Norton and has supported many of the low carbon activities in the village. They were appointed to lead the community engagement and knowledge transfer elements of the trial.
AND Technology is an independent company specialising in research & development solutions for industry. They have previously supported the creation of the smart node and hub through an IFI project utilising the Renesas PLC solution. AND’s role within the project has been to support the technology development, on site commissioning and technical reporting. Renesas have continued their involvement, supporting the PLC solution.
Substation Monitoring Solution 3.2.
To create village wide energy monitoring, measurement of electrical load was required at a number of points on the distribution network. To achieve this, it was decided to monitor the load on cables as they left 11 distribution substations across the village. This data was then aggregated to produce total load at each site and then for the whole village.
The map below shows Hook Norton with the areas fed by each substation overlaid.

8
TH
IS IS
AN
UN
CO
NT
RO
LL
ED
DO
CU
ME
NT
, T
HE
RE
AD
ER
MU
ST
CO
NF
IRM
IT
S V
AL
IDIT
Y B
EF
OR
E U
SE
TH
IS IS
AN
UN
CO
NT
RO
LL
ED
DO
CU
ME
NT
, T
HE
RE
AD
ER
MU
ST
CO
NF
IRM
IT
S V
AL
IDIT
Y B
EF
OR
E U
SE
Map of Hook Norton with substation boundary areas overlaid
The following table outlines the requirements for each site. The substations in the village range from pole mounted transformers with a single LV feeder, up to a ground mounted site with four LV ways. This has meant that the substation monitoring solution developed had to be suitably flexible to account for the range of variations found across the trial area. All of the substations in Hook Norton are outdoors requiring monitoring apparatus to be sited in weatherproof cabinets. For pole mounted sites, a modified communications cabinet has been utilised, and GRP pillars and meter boxes for ground mounted sites. The following table details the range of variations across the sites in the village.
Substation Name LV Ways OH / UG Site Size (kVA) Customers Smart Hub Housing
Bourne Lane 3 UG 500 166 Yes GRP
East End 2 UG 315 126 Yes Meter Box
Station Rd 3 UG 500 66 Yes GRP
Southside 2 UG 200 69 No Meter Box
Southrop 2 OH 200 69 Yes Pole Cab
Crofts Lane 1 OH 315 15 No Pole Cab
Scotland End 2 UG 200 29 No GRP
Hook Norton 4 UG 100 94 No GRP
Netting Street 1 OH 200 40 No Pole Cab
The Bourne 2 OH 200 91 No Pole Cab
Down End 1 OH 200 66 No Pole Cab
At four sites, additional smart hubs were added. These were essentially data concentrators that allowed load readings from domestic properties to be collected and passed to the communications medium.

9
TH
IS IS
AN
UN
CO
NT
RO
LL
ED
DO
CU
ME
NT
, T
HE
RE
AD
ER
MU
ST
CO
NF
IRM
IT
S V
AL
IDIT
Y B
EF
OR
E U
SE
TH
IS IS
AN
UN
CO
NT
RO
LL
ED
DO
CU
ME
NT
, T
HE
RE
AD
ER
MU
ST
CO
NF
IRM
IT
S V
AL
IDIT
Y B
EF
OR
E U
SE
3.2.1. Monitoring Layout
Each substation monitor was constructed from a range of off-the-shelf products including
Rogowski coils for current measurement (3 for each LV feeder)
A Haysys Rogowski coil interface to convert the current signal for each LV Feeder
A Schneider PM9 Power meters to consolidate and display measurement information
for each LV feeder.
A Schneider Talus T4E RTU to process readings and package data for transmission
A Radius 221e UHF radio to backhaul the data to the WPD control centre
12v power supply with battery backup
The components were all powered through a 3 phase power supply which in turn fed a 12v transformer and battery charger for the lower power items. From ground mounted sites this was achieved by jointing a new 3 phase supply onto existing mains cables in the ground. The whole solution was protected through a bank of RCD switches mounted in the cabinet. All devices were connected using small wiring that was installed by an electrical contractor. The three phase supply was also utilised as a source for voltage readings as a proxy for direct measurement on the LV busbar.

10
TH
IS IS
AN
UN
CO
NT
RO
LL
ED
DO
CU
ME
NT
, T
HE
RE
AD
ER
MU
ST
CO
NF
IRM
IT
S V
AL
IDIT
Y B
EF
OR
E U
SE
TH
IS IS
AN
UN
CO
NT
RO
LL
ED
DO
CU
ME
NT
, T
HE
RE
AD
ER
MU
ST
CO
NF
IRM
IT
S V
AL
IDIT
Y B
EF
OR
E U
SE
3.2.2. Rogowski Coil Current Measurement
Rogowski coils were chosen for this project to measure current passing through each cable core. At the time of the project design, these had not been used extensively for substation monitoring, but were chosen due to their flexibility and ability to be installed around cables without the need for an interruption of supply. This was in contrast with other methods of monitoring previously deployed such as split core CTs around the substation busbars, which required de-energisation of the LV busbars for installation. For each LV feeder, a Rogowski coil was installed around each individual phases to allow detailed current monitoring. The Rogowski coils were terminated into the Haysys Rogowski interface units by bringing the tails from the coils through ducting into the external cabinets.
Rogowski coils around LV cable cores
3.2.3. Monitoring Housings and Construction
For the underground sites a combination of different housings has been utilised. For larger sites a GRP cabinet has been installed to house all the monitoring equipment. At East End and Southside substations, two large meter boxes were added due to space constraints.
Meter boxes and GRP housings used for installing ground mounted monitoring
11
TH
IS IS
AN
UN
CO
NT
RO
LL
ED
DO
CU
ME
NT
, T
HE
RE
AD
ER
MU
ST
CO
NF
IRM
IT
S V
AL
IDIT
Y B
EF
OR
E U
SE
TH
IS IS
AN
UN
CO
NT
RO
LL
ED
DO
CU
ME
NT
, T
HE
RE
AD
ER
MU
ST
CO
NF
IRM
IT
S V
AL
IDIT
Y B
EF
OR
E U
SE
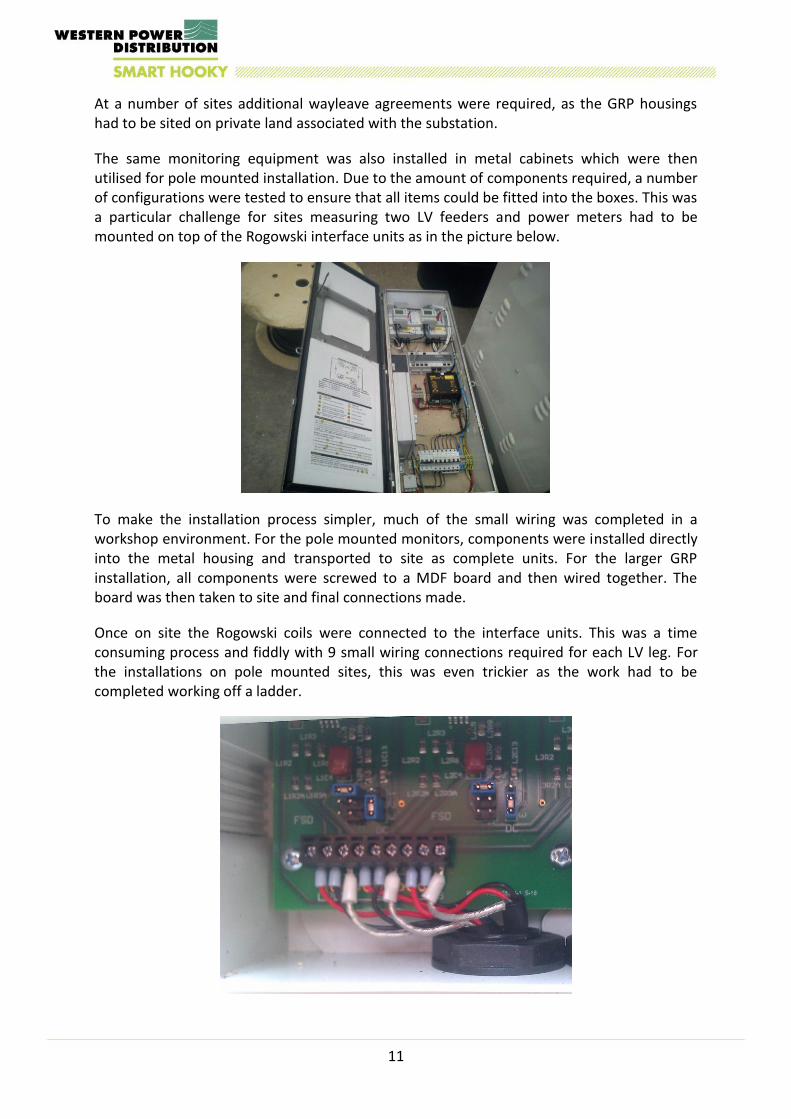
At a number of sites additional wayleave agreements were required, as the GRP housings had to be sited on private land associated with the substation.
The same monitoring equipment was also installed in metal cabinets which were then utilised for pole mounted installation. Due to the amount of components required, a number of configurations were tested to ensure that all items could be fitted into the boxes. This was a particular challenge for sites measuring two LV feeders and power meters had to be mounted on top of the Rogowski interface units as in the picture below.
To make the installation process simpler, much of the small wiring was completed in a workshop environment. For the pole mounted monitors, components were installed directly into the metal housing and transported to site as complete units. For the larger GRP installation, all components were screwed to a MDF board and then wired together. The board was then taken to site and final connections made.
Once on site the Rogowski coils were connected to the interface units. This was a time consuming process and fiddly with 9 small wiring connections required for each LV leg. For the installations on pole mounted sites, this was even trickier as the work had to be completed working off a ladder.

12
TH
IS IS
AN
UN
CO
NT
RO
LL
ED
DO
CU
ME
NT
, T
HE
RE
AD
ER
MU
ST
CO
NF
IRM
IT
S V
AL
IDIT
Y B
EF
OR
E U
SE
TH
IS IS
AN
UN
CO
NT
RO
LL
ED
DO
CU
ME
NT
, T
HE
RE
AD
ER
MU
ST
CO
NF
IRM
IT
S V
AL
IDIT
Y B
EF
OR
E U
SE
Final connections were made to power the devices and commissioned for usage.
For each site that was monitored, current data was measured for each phase for each LV leg along with the incoming three phase voltage at 15 minute intervals. In total data was received from 17 LV legs, a total of 51 individual phases. Parameters collected included
Current,
Frequency
Voltage (of the incoming supply)
Active Power
Reactive Power.
This allowed other parameters such as neutral current and power factor to be calculated.
At the Hook Norton and Scotland End substations, monitoring could not be commissioned. This was down to a combination of hardware faults, poor communications signal and installation issues.
Customer Energy Monitoring 3.3.
In combination with the substation monitor, a domestic energy measurement system was created by AND technology and deployed within the village. The initial development work for this system was funded through the Innovation Funding Initiative (IFI). It featured a Smart Node installed at the customers meter point, which made current readings. Data from the node was transmitted via Power Line Carrier (PLC) communications, back to a Smart Hub data concentrator sited with the monitoring solution in the substation.
3.3.1. Smart Nodes
Smart Nodes were installed across 4 substation zones at 46 domestic properties via a spare way at the cut-out position. These allowed total household current to be measured via a clip on CT attached around a live conductor. Installation was completed by WPD’s Smart Metering team, with appointments scheduled with customers through NEF. A dual pole isolator switch was also installed to allow easy isolation. Installations took approximately 30 minutes at internal meter positions and external meter boxes.

13
TH
IS IS
AN
UN
CO
NT
RO
LL
ED
DO
CU
ME
NT
, T
HE
RE
AD
ER
MU
ST
CO
NF
IRM
IT
S V
AL
IDIT
Y B
EF
OR
E U
SE
TH
IS IS
AN
UN
CO
NT
RO
LL
ED
DO
CU
ME
NT
, T
HE
RE
AD
ER
MU
ST
CO
NF
IRM
IT
S V
AL
IDIT
Y B
EF
OR
E U
SE
Smart Node with power lead and CT (left) and installed in outside meter box with dual pole isolator switch (Right)
Prior to installation works, a sample of properties in the village were surveyed to ensure nodes could be fitted. At a number of meter positions, space constraints meant that installations could not be completed.
The smart node contained a Power Line Carrier (PLC) communications module capable of returning data gathered to the substation along the mains cables. As with all equipment on this project, the nodes utilised the DNP3 protocol.
The use of a clip on CT was chosen as a compromise position between cost and accuracy. A number of devices were tested by AND Technology and the chosen component provided a good level of accuracy. On site testing was used to verify the current at the meter point matched that recorded and sent to the smart hub.

14
TH
IS IS
AN
UN
CO
NT
RO
LL
ED
DO
CU
ME
NT
, T
HE
RE
AD
ER
MU
ST
CO
NF
IRM
IT
S V
AL
IDIT
Y B
EF
OR
E U
SE
TH
IS IS
AN
UN
CO
NT
RO
LL
ED
DO
CU
ME
NT
, T
HE
RE
AD
ER
MU
ST
CO
NF
IRM
IT
S V
AL
IDIT
Y B
EF
OR
E U
SE
In a number of instances, a recent meter change had occurred and the meter tails upgraded to 25mm2 conductors. In these instances the CT could not fully clamp around the cable and a tie wrap was employed to secure the CT. This was shown to have a limited effect on the overall accuracy of the device.
Each smart node was configured to collect consumption information at 15 minute intervals and data sent to the smart hub at the substation via the PLC communications. This was done by analysing the power usage and incrementing a counter, much in the way an electricity meter function. Every 15 minutes, the incremental reading was updated allowing a load profile to be generated.
The PLC system used with this project was based around a narrowband solution to maximise the potential of messages being correctly transmitted. The data packets generated by the nodes were particularly small, which again suited the application of narrowband PLC.
Each node installed included the Renesas PLC chip, meaning that any node could act as a repeater. This essentially allowed remote nodes towards the end of feeders to send messages through nodes nearer the smart hub. In practice, nodes automatically configured themselves once connected to the network to send messages through nearer neighbours with a high level of success. Further information regarding this element of the project can be found in Appendix B
Data from the smart nodes was made available to each customer through individual accounts on the Smart Hooky website. However the quality of the data available to customers was particularly variable due to the inconsistent nature of the power line carrier.

15
TH
IS IS
AN
UN
CO
NT
RO
LL
ED
DO
CU
ME
NT
, T
HE
RE
AD
ER
MU
ST
CO
NF
IRM
IT
S V
AL
IDIT
Y B
EF
OR
E U
SE
TH
IS IS
AN
UN
CO
NT
RO
LL
ED
DO
CU
ME
NT
, T
HE
RE
AD
ER
MU
ST
CO
NF
IRM
IT
S V
AL
IDIT
Y B
EF
OR
E U
SE
Details of the processes used for customer engagement and recruitment can be found in section 3.7.
3.3.2. Smart Hubs
The Smart Hub data concentrator was designed to gather data from smart nodes, and pass it on to the Talus T4E RTU to be sent to the head end systems. These units were been installed in three ground mounted substations and one pole mounted site where there was the highest concentration of interested customers. To create the PLC connection the Smart Hub
was connected to via a 3 phase commando socket to the mains. This allowed PLC signals to propagate down the mains cable, onto the busbars and out through the LV network.
Smart Hub with commando socket attachment
.
Telecommunications and System Configuration 3.4.
The backhaul data solution used for this project was delivered through a Radius PDR221 UHF radio system, now distributed by Netcontrol. This system allowed a direct Ethernet feed from the Schneider RTU and was also capable of transmitting data in the DNP3 protocol. A base station was installed at an existing WPD radio site 3km from Hook Norton at Whichford Hill.

16
TH
IS IS
AN
UN
CO
NT
RO
LL
ED
DO
CU
ME
NT
, T
HE
RE
AD
ER
MU
ST
CO
NF
IRM
IT
S V
AL
IDIT
Y B
EF
OR
E U
SE
TH
IS IS
AN
UN
CO
NT
RO
LL
ED
DO
CU
ME
NT
, T
HE
RE
AD
ER
MU
ST
CO
NF
IRM
IT
S V
AL
IDIT
Y B
EF
OR
E U
SE
At each substation a spider aerial mounted on an external bracket was installed.
The UHF radios were licensed for 454.55 mhz. running at 9600 baud. During configuration the radios were set up to make sure they have a receive level of -80db or better, as we found due to the terrain and foliage the receive signal strength varied during the course of the year and this seemed to be the optimal value. To achieve this level of performance a number of sites including the base station have had to be run at 5 watts which is the maximum output for the PDR221 radios.
The table below shows the levels transmit (Tx) level set for each site along with its receive (Rx)level.
Radio
Site Name Sys addr
Net addr
Radio Type Tx
(dbm) Tx
(Watts)
Rx (dbm)
Whichford Hill 1 1 Master +37dB 5 Watts
1 3
1 5
1 7
1 9
Netting Street 1 17 Slave with Delay for Repeater
+37dB 5 Watts -75
Crofts Lane 1 19 Slave with Delay for Repeater
+37dB 5 Watts -82
Southrop 1 21 Slave from Repeater +37dB 5 Watts -65
Down End 1 23 Slave and Repeater +37dB 5 Watts -77
Southside 1 25 Slave with Delay for Repeater
+37dB 5 Watts -96
The Bourne 1 27 Slave with Delay for Repeater
+33dB 2 Watts -62
Bourne lane 1 29 Slave with Delay for Repeater
+33dB 2 Watts -79
East End 1 31 Slave with Delay for Repeater
+33dB 2 Watts -81
Station Road 1 33 Slave with Delay for Repeater
+33dB 2 Watts -82

17
TH
IS IS
AN
UN
CO
NT
RO
LL
ED
DO
CU
ME
NT
, T
HE
RE
AD
ER
MU
ST
CO
NF
IRM
IT
S V
AL
IDIT
Y B
EF
OR
E U
SE
TH
IS IS
AN
UN
CO
NT
RO
LL
ED
DO
CU
ME
NT
, T
HE
RE
AD
ER
MU
ST
CO
NF
IRM
IT
S V
AL
IDIT
Y B
EF
OR
E U
SE
Site surveys were carried out to establish signal strength and initial installations completed at East End, Bourne Lane and Station Road. However, following a site survey at Southrop it became apparent that there was no direct line of site to Whichford Hill. This was primarily due to the substation being sited in a hollow and surrounded by tall trees. To overcome this issue, the radio at Down End was used as a repeater and the signal from Southrop relayed on to Whichford Hill. This required a reconfirmation of all the radios already commissioned allowing the repeater functionality to be trialled. A similar issue with Scotland End was also experience with no direct line of site. However due to additional hardware issues with the substation monitor, the radio link with the Bourne was never established.
The original testing and installation at site was carried out with the radio system using IP communications. A further development period was required when the IP based system could not be configured into the WPD Enmac network. This was primarily driven by security concerns and a serial RS232 solution was successfully configured and implemented.
Site Commissioning 3.5.
Due to the number of individual components at each substation site (Rogowski coil interfaces, RTUs, power meters, radios etc), considerable effort was required to get all the devices to talk to each other. It was decided at an early stage of the project to use the DNP3 protocol. Although all devices were capable of communicating via DNP3, configuration work was required to ensure the correct data points were created and then passed through the various devices. This included several days’ worth of lab based work testing the DNP3 protocol through a mocked up installation.
DNP3 configuration was not a core skill widely held within WPD, and required a number of specialists to learn how to configure each site. This process was time consuming and often required interventions from manufactures to overcome obstacles. AND technology produced DNP3 mapping for the nodes and hubs. Additional input was then required by Schneider to map points onto the RTU and power meters. Further work was also undertaken to trouble shoot communication issues between the individual components.
From a commissioning perspective, the communications required specialist skills to set up. WPD were able to utilise Surf telecom, WPD’s in house communications company. In many cases the configuration and testing of each site took several hours due to line of sight issues with the communications and complexities associated with the monitoring set up.
The method used for gaining current readings relied on data being relayed to a Schneider PM9c power meter. For each site additional configuration was required to set CT ratios, communications rates and input channels for every power meter. While not particularly time consuming, this process added another layer of configuration adding to the overall commissioning time. To simplify this process, a commissioning guide was created which allowed installations to be completed by local line teams for the pole mounted sites.
Data Management 3.6.
The below diagram outlines the end to end system architecture applied in Smart Hooky.

18
TH
IS IS
AN
UN
CO
NT
RO
LL
ED
DO
CU
ME
NT
, T
HE
RE
AD
ER
MU
ST
CO
NF
IRM
IT
S V
AL
IDIT
Y B
EF
OR
E U
SE
TH
IS IS
AN
UN
CO
NT
RO
LL
ED
DO
CU
ME
NT
, T
HE
RE
AD
ER
MU
ST
CO
NF
IRM
IT
S V
AL
IDIT
Y B
EF
OR
E U
SE
Smart nodes installed at 46 domestic properties across the village and communicated via narrowband Power Line Carrier (PLC) to a Smart Hub situated at a distribution substation. Additional data substation data was measured via Rogowski coil units, measuring the 3 phase current on the LV feeders.
Readings were fed through a Rogowski coil interface unit and then onto a series of power meters. All data from the smart hub and power meters was consolidated in DNP3 format at the RTU and transmitted through the UHF radio system to the local radio tower at Whichford Hill. The data passed into the WPD network to a trial specific ENMAC control system which was being used as a data collector. Customer consumption data and substation data was packaged in an XML file at 15 minute resolution and passed to NEF via a FTP link. The data was then processed by NEF and was made available for viewing on the web portal by individual customers using a secure login.
As well as data being passed to NEF, node and substation data was displayed in the Enmac test system, to allow live visibility of the LV network. XML files were archived at 15 minute intervals.
Example of data display in Enmac
Further analysis of the data was undertaken using Excel, the results of which can be found in section 4.

19
TH
IS IS
AN
UN
CO
NT
RO
LL
ED
DO
CU
ME
NT
, T
HE
RE
AD
ER
MU
ST
CO
NF
IRM
IT
S V
AL
IDIT
Y B
EF
OR
E U
SE
TH
IS IS
AN
UN
CO
NT
RO
LL
ED
DO
CU
ME
NT
, T
HE
RE
AD
ER
MU
ST
CO
NF
IRM
IT
S V
AL
IDIT
Y B
EF
OR
E U
SE
Customer Engagement 3.7.
This section outlines the customer engagement aspects of this Smart Hooky project. Further
details can also be found in Appendix A produced by the National Energy Foundation (NEF).
The National Energy Foundation was appointed to work alongside the Hook Norton Low
Carbon Club (HNLC) to lead on the consumer engagement part of the project. Specifically,
NEF’s role was to:
Recruit residents willing to participate in the trial by having a smart node installed;
the target was to get 150 nodes installed in clustered areas in the village;
Organise the installation of the nodes with WPD;
Engage with the residents to encourage a change of behaviour depending on the
data received;
Communicate with the residents on the progress and findings of the project;
Develop all communication materials needed for the engagement part of the project,
i.e. leaflets, posters, blogs, newsletters, press releases, etc.;
Develop the online customer interface for residents to logon to view the total village
electricity consumption and individual data for those selected in the trial.
To support the project, Smart Hooky branding was developed in keeping with the feel of the village, along with leaflets and posters to explain the project objectives and support customer recruitment for the installation of smart nodes.

20
TH
IS IS
AN
UN
CO
NT
RO
LL
ED
DO
CU
ME
NT
, T
HE
RE
AD
ER
MU
ST
CO
NF
IRM
IT
S V
AL
IDIT
Y B
EF
OR
E U
SE
TH
IS IS
AN
UN
CO
NT
RO
LL
ED
DO
CU
ME
NT
, T
HE
RE
AD
ER
MU
ST
CO
NF
IRM
IT
S V
AL
IDIT
Y B
EF
OR
E U
SE
3.7.1. Customer Recruitment
One main reason to select Hook Norton for trialling this new technology was because the village was already very active in terms of lowering their carbon footprint, headed by a dynamic group of people who set up the Hook Norton Low Carbon Club to lead on all initiatives.
Due to HNLCs previous engagement with the community, the project benefited from a ‘warm’ audience to talk and engage onto the Smart Hooky project. Initial presentation of the project at a HNLC meeting resulted in 38 residents expressing interest. Further publicity was created through the local newsletter, leaflets placed in the local library and shops and a stall at the Crossroad music festival.
A number of methods were utilised to register interest including a postal form attached to the leaflet and a dedicated web address.
By the end of September 2011, we had gathered interest from 70 residents across the village
as follows (38 of which were members of HNLC):
24 through the newsletter
25 at the cross road event
21 through HNLC meeting
For the PLC function of the Smart Node to work, it needed to be associated with a Smart Hub. In addition, it was important to achieve density to be able to test the repeater functionality. Therefore it was decided to focus the PLC trial activity on four sites.
Sub-stations Interested residents
Total residents
% Interest Selected
East End 15 126 12% Yes
Southrop 12 67 18% Yes
Bourne Lane 12 166 7% Yes
Southside 9 66 14% No
Hook Norton 7
No
Station Road 4 62 6% Yes
Other 5 substations 11
Total 70
The four substations with the most interest were East End, Southrop, Bourne Lane and
Southside. However, due to its ease of access and some work already underway to install
equipment, Station Road was favoured for the installation of a smart hub. This meant not
installing hub and node equipment at Southside as a result. The four chosen substations
(shaded in orange on the map below) had a total interest from 43 residents.

21
TH
IS IS
AN
UN
CO
NT
RO
LL
ED
DO
CU
ME
NT
, T
HE
RE
AD
ER
MU
ST
CO
NF
IRM
IT
S V
AL
IDIT
Y B
EF
OR
E U
SE
TH
IS IS
AN
UN
CO
NT
RO
LL
ED
DO
CU
ME
NT
, T
HE
RE
AD
ER
MU
ST
CO
NF
IRM
IT
S V
AL
IDIT
Y B
EF
OR
E U
SE
Further recruitment was undertaken in the specific substation areas using a range of methods. These included;
Door-to-door knocking
Leaflets/Posters
Newsletter
Incentives through further prizes
News/blogs and press releases
The door-to-door approach was very time consuming resulting in an average of 5 customers
signed up in 2 hours of door knocking. This process however did provide an opportunity for
customers to ask a few more questions about the project before they signed up.
In order to encourage residents to sign up for the trial, we promoted a prize draw offering
the following prizes to three residents who were picked at random:
Prize Value
1st Prize Eurostar voucher £150
2nd Prize Restaurant vouchers £70
3rd Prize Village shop vouchers £30
By March 2012 a total of 65 residents in the target substations had signed up for the project, broken down as follows.
• 46 installations completed (roughly 1/3 of target)
• 7 could not be completed due to lack of space for the equipment
• 12 installations left to do

22
TH
IS IS
AN
UN
CO
NT
RO
LL
ED
DO
CU
ME
NT
, T
HE
RE
AD
ER
MU
ST
CO
NF
IRM
IT
S V
AL
IDIT
Y B
EF
OR
E U
SE
TH
IS IS
AN
UN
CO
NT
RO
LL
ED
DO
CU
ME
NT
, T
HE
RE
AD
ER
MU
ST
CO
NF
IRM
IT
S V
AL
IDIT
Y B
EF
OR
E U
SE
The remaining 12 installation were not completed, due to a mix of technical issues and lack
of confirmation from the customer regarding project participation.
A final wave of customer recruitment was planned towards the end of the project, along with a village wide energy event. With the customer node data, gaps in the data set did not allow for reliable 15 minute resolution load profiles to be produced for each customer. Given difficulties in recruiting the first 70 interested participants, it was anticipated to be too stretching to achieve a further 100 installations. While improved density of nodes would have inherently improved data quality, the lack of data storage was an issue that could not be circumvented. Given that nodes close to the substation failed to communicate 100% of the time highlighted this further and additional recruitment plans were cancelled.
3.7.2. Customer Workshops
In March 2013 workshops were run by WPD and NEF for local residents to coincide with the launch of the community website. The purpose of the evenings was to allow project participants to find out more about the project, and discuss some of the issues around reducing energy use. The events were attended by 20 project participants and included brainstorming sessions associated with energy reduction and moving peak load.
Customer workshop at Hook Norton Brewery Visitors Centre
Data Display Capabilities 3.8.
During the project, initial system designs were reconsidered to ensure delivery complied with WPDs IT policies. As a result responsibility for delivering the web portal element of the project was moved to NEF.

23
TH
IS IS
AN
UN
CO
NT
RO
LL
ED
DO
CU
ME
NT
, T
HE
RE
AD
ER
MU
ST
CO
NF
IRM
IT
S V
AL
IDIT
Y B
EF
OR
E U
SE
TH
IS IS
AN
UN
CO
NT
RO
LL
ED
DO
CU
ME
NT
, T
HE
RE
AD
ER
MU
ST
CO
NF
IRM
IT
S V
AL
IDIT
Y B
EF
OR
E U
SE
NEF established www.smart-hooky.net and setup the framework of the website based on the Drupal7 CMS, ready for further development. Drupal required a MySQL database for its own use, within which new tables were added with fields to store incoming values from transmitted XML files. A customised Drupal module was written in PHP for the project. This handled two major areas relevant to the project success; importing readings from XML files and rendering data as charts. This was later moved over to a virtual server with greater resources to allow for larger MySQL databases to store more data.
After trialling several potential charting libraries (Google API, Dygraphs, PChart and finally Fusion Charts), the website was established using the Fusion Charts package. This was due largely to performance and ease of use, but also due to the many available charting formats.
Illustration of a possible graph highlighting peak consumption in the village
The website and went live with substation data in November 2012. Further testing was undertaken with a number of project participants in January 2013. Following sucessful trials, the full portal went live in March 2013, with user name and password details given to individual project members.
Comparison:With last day: + 5% L
With last week: + 1% K
With last month: - 0.5% KK
With last quarter: - 4% J
Current usage: 3567 kWh
Day Month Year Select:
Time
kWh
kWh kWh/house
Total Village Electricity Consumption
Peak consumption

24
TH
IS IS
AN
UN
CO
NT
RO
LL
ED
DO
CU
ME
NT
, T
HE
RE
AD
ER
MU
ST
CO
NF
IRM
IT
S V
AL
IDIT
Y B
EF
OR
E U
SE
TH
IS IS
AN
UN
CO
NT
RO
LL
ED
DO
CU
ME
NT
, T
HE
RE
AD
ER
MU
ST
CO
NF
IRM
IT
S V
AL
IDIT
Y B
EF
OR
E U
SE
Screen grab of final Smart Hooky website
Knowledge Dissemination 3.9.
The information gained from the Smart Hooky project has been shared at a number of forums including the 2012 Low Carbon Network Fund Conference. At this event a keynote presentation was given by a Tin Lunnell, a Hook Norton resident and project participant. Additional learning was also shared at the conference in 2013. In February 2013 an event was run at Hook Norton Brewery to showcase the findings from the project and allow delegates to view actual installations. The event was attended by about 20 people including representatives from energy charities, universities and 4 other network operators.
The morning featured presentation from all project partners, followed by a site visit and workshops in the afternoon.
The workshops aimed at gaining insight into a number of key questions for this project, and others schemes of a similar nature including customer engagement, incentives and energy reduction techniques.

25
TH
IS IS
AN
UN
CO
NT
RO
LL
ED
DO
CU
ME
NT
, T
HE
RE
AD
ER
MU
ST
CO
NF
IRM
IT
S V
AL
IDIT
Y B
EF
OR
E U
SE
TH
IS IS
AN
UN
CO
NT
RO
LL
ED
DO
CU
ME
NT
, T
HE
RE
AD
ER
MU
ST
CO
NF
IRM
IT
S V
AL
IDIT
Y B
EF
OR
E U
SE

26
TH
IS IS
AN
UN
CO
NT
RO
LL
ED
DO
CU
ME
NT
, T
HE
RE
AD
ER
MU
ST
CO
NF
IRM
IT
S V
AL
IDIT
Y B
EF
OR
E U
SE
TH
IS IS
AN
UN
CO
NT
RO
LL
ED
DO
CU
ME
NT
, T
HE
RE
AD
ER
MU
ST
CO
NF
IRM
IT
S V
AL
IDIT
Y B
EF
OR
E U
SE
4. The Outcomes of the Project
This section outlines the findings from substation monitoring, PLC trials and customer engagement. Further information can be found relating to the customer interactions and PLC in the appendices prepared by NEF and AND technology attached at the end of the document.
Substation Monitoring 4.1.
4.1.1. Hardware Performance and Maintenance
This project has been able to demonstrate that a substation monitor can be developed using off-the-shelf products. At the time of the project design, Rogowski coils had not had extensive use for LV current monitoring applications on UK networks. Utilising them within this trial has demonstrated a positive application of the technology as part of an accurate and fit for purpose monitoring solution. Since the project started, many new substation monitoring solutions have been developed by third parties and widely deploy Rogowski technology.
While the data being returned from the monitors has provided vastly improved network visibility, there have been a number of performance issues from the hardware that have required further investigation and on-site rectification. In some cases sites had to be visited multiple times to rectify problems.
To protect the installations, a number of RCD devices were used on the small wiring. In a number of circumstances, these were very sensitive and tripped cutting the power to the monitor. On one occasion, three sites tripped at the same time, leading us to the conclusion that a transient fault on the network had occurred causing the RCDs to operate. This led to a high number of site revisits to rectify problems and reset devices. This was a particular issue with overhead mounted sites where overhead line teams were required to reset the devices.
The design of the monitoring did not include any elements of data storage. As a result, any temporary loss of communications resulted in lost data packets. This has led to a number of gaps in the data sets for both substation monitoring and contributed to the incomplete data from customer nodes.
Utilising a number of components has resulted in installation problems that led to onsite troubleshooting work. This included wiring errors that were made in the workshop configuration resulting in the monitoring solution not functioning. At one site a fault was found on all 4 Rogowski coil interfaces where all units would not power up. It is thought an error in commissioning may be to blame resulting in the failure of the unit’s power supplies.
At the Hook Norton and Scotland End substations, monitoring could not ultimately be commissioned. This was down to a combination of hardware faults, poor communications signal and installation issues.

27
TH
IS IS
AN
UN
CO
NT
RO
LL
ED
DO
CU
ME
NT
, T
HE
RE
AD
ER
MU
ST
CO
NF
IRM
IT
S V
AL
IDIT
Y B
EF
OR
E U
SE
TH
IS IS
AN
UN
CO
NT
RO
LL
ED
DO
CU
ME
NT
, T
HE
RE
AD
ER
MU
ST
CO
NF
IRM
IT
S V
AL
IDIT
Y B
EF
OR
E U
SE
4.1.2. Substation Data Analysis
The substation monitoring utilised for this trial has provided a good data set of current and voltage data for the Hook Norton network. However, due to the recent advances in substation monitoring, power quality, harmonic analysis and the setting of alarm thresholds are now common place measurements on up-to-date systems, allowing a deeper analysis of network conditions.
Due to the way the data is collected, each LV feeder has produced over 10,000 data points per year for current alone. This has highlighted the need for further analytical tools to help assess the data and identify anomalous situations. For the purpose of this trial, data analysis has been undertaken manually using techniques through data bases and Excel.
On the whole the monitoring has demonstrated that given the present load conditions, the network is very lightly loaded with spare capacity in the system. For a number of sites there is over 1 years’ worth of data, which gives a high degree of confidence when assessing the network. The following load profile curves summarise the duration of loads on a specific substation. The red line represents the overall capacity of the specific substation.
0
100
200
300
400
500
600
0% 20% 40% 60% 80% 100%
Load
kV
A
% Time
Load Duration Curve - Bourne Lane
Load
Capacity

28
TH
IS IS
AN
UN
CO
NT
RO
LL
ED
DO
CU
ME
NT
, T
HE
RE
AD
ER
MU
ST
CO
NF
IRM
IT
S V
AL
IDIT
Y B
EF
OR
E U
SE
TH
IS IS
AN
UN
CO
NT
RO
LL
ED
DO
CU
ME
NT
, T
HE
RE
AD
ER
MU
ST
CO
NF
IRM
IT
S V
AL
IDIT
Y B
EF
OR
E U
SE
While this data may not highlight any particular issues on site, it demonstrates clearly the available capacity in the system across Hook Norton. We have been able to evaluate the load across the village with a greater level of clarity and this will be extremely useful when evaluating any further loads or other detailed network planning.
0
50
100
150
200
250
300
350
0% 20% 40% 60% 80% 100%
Load
kV
A
% Time
Load Duration Curve - East End
Load
Capacity
0
50
100
150
200
250
0% 20% 40% 60% 80% 100%
Load
kV
A
% Time
Load Duration Curve - Netting Street
Load
Capacity

29
TH
IS IS
AN
UN
CO
NT
RO
LL
ED
DO
CU
ME
NT
, T
HE
RE
AD
ER
MU
ST
CO
NF
IRM
IT
S V
AL
IDIT
Y B
EF
OR
E U
SE
TH
IS IS
AN
UN
CO
NT
RO
LL
ED
DO
CU
ME
NT
, T
HE
RE
AD
ER
MU
ST
CO
NF
IRM
IT
S V
AL
IDIT
Y B
EF
OR
E U
SE
Smart Node Performance 4.2.
Smart Nodes were installed at 48 properties around the village associated with 4 substations. Initially it was anticipated that about 150 nodes would be installed but customer take up was not as high as expected.
Substation Name OH / UG Site Hub Total
Customers Installed
Nodes % Of
Customers
Bourne Lane UG Yes 166 17 10.2%
East End UG Yes 126 21 16.7%
Station Rd UG Yes 66 2 3.0%
Southrop OH Yes 69 8 11.5%
Below is an example of some of the data collected from a customer node associated with an electrically heated bungalow. The load profile as expected with peaks during early morning and evening. Additional load spikes can also be observed on Sunday 27th at lunchtime.
However the load profile goes flat around midnight on 30th October and remains so for a 24 hour period. This was due to signals from the node not being returned to the head end control system. This was most likely due to a loss of PLC communications.
4.2.1. Smart Node Design
Operating the nodes for several months has highlighted a number of short falls in the overall design of the smart nodes. Firstly, as with the substation monitors, no data storage was included. Subsequently if data failed to reach the head end, the packet was lost, resulting in missing data in the load profile above.
There are a number of properties in Hook Norton that have installed photo voltaic (PV) panels. The nodes utilised a simple current transformer (CT) to measure the load flowing
0.00
1.00
2.00
3.00
4.00
5.00
27
/10
00
:00
27
/10
06
:00
27
/10
12
:00
27
/10
18
:00
28
/10
00
:00
28
/10
06
:00
28
/10
12
:00
28
/10
18
:00
29
/10
00
:00
29
/10
06
:00
29
/10
12
:00
29
/10
18
:00
30
/10
00
:00
30
/10
06
:00
30
/10
12
:00
30
/10
18
:00
31
/10
00
:00
Load
(kW
)
Node Load Profile

30
TH
IS IS
AN
UN
CO
NT
RO
LL
ED
DO
CU
ME
NT
, T
HE
RE
AD
ER
MU
ST
CO
NF
IRM
IT
S V
AL
IDIT
Y B
EF
OR
E U
SE
TH
IS IS
AN
UN
CO
NT
RO
LL
ED
DO
CU
ME
NT
, T
HE
RE
AD
ER
MU
ST
CO
NF
IRM
IT
S V
AL
IDIT
Y B
EF
OR
E U
SE
through the cable. However these were not capable of detecting the direction of the power flow. As a result, data exported from PV panels was shown as a load making any financial estimates of energy costs over inflated.
Since the project was started, additional requirements for voltage information on the network have emerged. With additional electrical loads and export from embedded generation, modelling and managing the system voltages is expected to get more challenging. Voltage measurement was not included in the node design but could be easily added with any future iteration.
4.2.2. Data Quality Checks
While undertaking data quality checks, a number of load readings were identified which appeared extremely low and at other premises, extremely high. In both scenarios, visits were made to customer premises and checked with portable monitoring equipment. These checks provided a high level of confidence in the data being returned from the nodes.
At one property the internal wiring was particularly complex with more than one consumer unit in place. The CT could not be fitted around the enlarged meter tails and as another cable was identified. However it was later discovered that this cable did not carry all the power for the property as current readings returned did not match expectations.
Another property yielded exceptionally high readings indicating a significant amount of loads was being drawn. Following further investigation it was found that the high load was due to the installation of a heat pump. In addition the property also benefitted from PV panels. From the data being collected by the node, it was possible to see that the heat pump was running for significant periods of time. The chart below compares the load profile with a more moderate energy usage.
0.00
1.00
2.00
3.00
4.00
5.00
6.00
7.00
8.00
10
/10
00
:00
10
/10
03
:00
10
/10
06
:00
10
/10
09
:00
10
/10
12
:00
10
/10
15
:00
10
/10
18
:00
10
/10
21
:00
11
/10
00
:00
Heat Pump and PV Moderate Load Profile

31
TH
IS IS
AN
UN
CO
NT
RO
LL
ED
DO
CU
ME
NT
, T
HE
RE
AD
ER
MU
ST
CO
NF
IRM
IT
S V
AL
IDIT
Y B
EF
OR
E U
SE
TH
IS IS
AN
UN
CO
NT
RO
LL
ED
DO
CU
ME
NT
, T
HE
RE
AD
ER
MU
ST
CO
NF
IRM
IT
S V
AL
IDIT
Y B
EF
OR
E U
SE
As can be seen, the heat pump is running at about 3.5kW during the night. It would appear that the load continues but is masked by some of the output from the PV panels during the day. This pattern of overall power usage falling in the afternoon can be seen across a number of days, suggesting that the solar panels are working at their best in late afternoon.
PLC Performance 4.3.
4.3.1. Message Transmission Success
As has already been outlined, not all the customer load data packages from smart nodes were successfully received back at the WPD control system. In a small number of cases the radio back haul dropped out causing messages to be lost, although this occurred less than 5% of the time. There are a number of factors that could cause these problems to occur including loss of backhaul communications, application issues between the hub and the RTU or a failure of the PLC communications.
In some circumstances this can be attributed to the distances between the node and the substation. If no additional nodes were connected to that phase of the feeder, it may have proved too far for the message to be sent. However, even some of the better performing nodes did not achieve 100% data transmission rates.
On average nodes successfully transmitted data between 50% and 75% of the time. The following chart demonstrates the success rate of transmission for the time of day for 31 nodes averaged across a month (October 2013). This has been plotted against the average load profile for the associated substations for the same time period.
It would appear that there is a direct correlation between the load on the network and the rate of successful data transmission through PLC.
0
50
100
150
200
250
300
350
40%
45%
50%
55%
60%
65%
70%
75%
80%
00
:00
:00
03
:00
:00
06
:00
:00
09
:00
:00
12
:00
:00
15
:00
:00
18
:00
:00
21
:00
:00
00
:00
:00
No
de
Dat
a R
ece
ive
d %
Node Data Received % and Average Load Profile (kW) Success (%)
Load (kW)

32
TH
IS IS
AN
UN
CO
NT
RO
LL
ED
DO
CU
ME
NT
, T
HE
RE
AD
ER
MU
ST
CO
NF
IRM
IT
S V
AL
IDIT
Y B
EF
OR
E U
SE
TH
IS IS
AN
UN
CO
NT
RO
LL
ED
DO
CU
ME
NT
, T
HE
RE
AD
ER
MU
ST
CO
NF
IRM
IT
S V
AL
IDIT
Y B
EF
OR
E U
SE
Issues of intermittent data transmission could be mitigated with the addition of some form of data storage with the node and some form of confirmation message that the data packet has been received. In the absence of the return message, the packet could be sent again until successfully transferred.
4.3.2. PLC Performance Conclusions
It is quite difficult to separate out the PLC performance as an individual element from the end to end solution as many factors affect the overall system operation, such as the performance of the hub, RTU and backhaul comms. However is true to say that PLC performance can be considered as one of the main variables, especially as there is a variability between messages received from different nodes at the same time.
The nodes at East End and Bourne Lane represented the densest deployment of nodes in Hook Norton with 38 nodes installed within a customer base of 286; a 13% deployment.
Whilst data was being sent every 15 minutes, for many applications, such as smart metering, data would need transferring at much lower frequencies. Of the 38 nodes installed on these two sites, 75% of them managed to return a message at least once every day. Generally speaking the rate of successful data transfers diminished towards the end of feeder although this was skewed by nodes acting as repeaters. In areas with a high density of nodes, the rates of data transfer increased. The following plot shows a cluster of properties with nodes associated with the Bourne Lane Substation.

33
TH
IS IS
AN
UN
CO
NT
RO
LL
ED
DO
CU
ME
NT
, T
HE
RE
AD
ER
MU
ST
CO
NF
IRM
IT
S V
AL
IDIT
Y B
EF
OR
E U
SE
TH
IS IS
AN
UN
CO
NT
RO
LL
ED
DO
CU
ME
NT
, T
HE
RE
AD
ER
MU
ST
CO
NF
IRM
IT
S V
AL
IDIT
Y B
EF
OR
E U
SE
For East End the data is less conclusive although there is a cluster that can be observed in the South West of the area where all nodes failed to communicate throughout the month. It should be recognised that some of these nodes did connect and send messages during the trial but not the same regularity as nearer nodes.
In summary, the PLC seemed to perform well given the limited deployment across the village. For business as usual applications, data storage could bridge some of the intermittent communication losses experienced in this trial. The success rate of 50-75% rises when looking at 1 successful message per day to about 75% for most nodes which would be suitable for many applications. It is difficult to quantify how many further nodes would have been required to significantly improve performance further. However if nodes could have been placed strategically across all three phases, it is anticipated that many of the poorer communication links would have been improved. Initial calculations suggest an addition 20% would have been required based on 3 more nodes per feeder. More details of the PLC performance can be found in Appendix B
Radio Backhaul 4.4.
The radio system has performed well with a high level of reliability. Analysis has shown a few periods of time when the signal appeared to drop out and data transmission ceased. However many of these periods can be attributed to work on the radio system which will have temporarily interrupted the signals.
Initial configuration and commissioning of the radio at each site was a time-consuming process. This was improved through the use of pre-site survey and experience as the

34
TH
IS IS
AN
UN
CO
NT
RO
LL
ED
DO
CU
ME
NT
, T
HE
RE
AD
ER
MU
ST
CO
NF
IRM
IT
S V
AL
IDIT
Y B
EF
OR
E U
SE
TH
IS IS
AN
UN
CO
NT
RO
LL
ED
DO
CU
ME
NT
, T
HE
RE
AD
ER
MU
ST
CO
NF
IRM
IT
S V
AL
IDIT
Y B
EF
OR
E U
SE
telecoms team became more familiar with the equipment. However, this knowledge was not transferred to local line teams allowing them to configure new installations. Instead, communications specialists attended each new install to support commissioning.
There were issues at a number of sites regarding signal strength, which could be improved by using the PDR 121 version of the radio. The PDR 121 has improved hop/relay capability possibly allowing connections to inaccessible sites.
Customer Engagement and Incentives 4.5.
Initially it was anticipated that 150 customers would be recruited to take part in the project. The hypothesis was that this would have allowed for an extremely dense installation of customer nodes, and therefore robust PLC communications system. This would have occurred due to a large number of nodes on the system able to acts as repeaters improving signal propagation and reliability.
From the site surveys it became apparent that the target of 150 installations would be extremely challenging as 1 in 6 of the sites inspected could not have the nodes installed due to lack of space. This finding was very important as it meant that to get 150 nodes installed it was likely that the project would need to recruit at least 175 interested residents amongst the 421 residents within the 4 selected areas. This represented more than 41% of the population. This was an extremely challenging task considering that, whilst the village overall is very proactive in engaging with green issues, a large proportion of the village has elderly people who do not necessarily want to be involved in such trials.
A number of delays in the development of an end to end data solution may also have contributed to a reduced recruitment for the project. It is thought that being able to demonstrate a working solution to customers would have aided further recruitment, allowing the benefits of participation to be demonstrated.
Website 4.6.
The live website provided the functionality that was required for the project; display live and historic data for customer nodes, substations and the village as a whole. However during the initial testing of the website, it became apparent that incomplete data sets would reduce the sites overall usefulness. For example, where node data was missing, the system was not able to complete the appropriate load profile. Instead the load would drop to zero and then increase in a spike when a reading was received. Although the data contained accurate information on total load, the missing data points made it difficult to read and at some times misleading. It also meant that any specific customer actions to reduce demand would be invisible within missing data points. We have no direct evidence to suggest that customer behaviours and energy usage was altered as a result of this project. However the presence of the website and publicity associated with the project will increased awareness in the village of energy related issues.

35
TH
IS IS
AN
UN
CO
NT
RO
LL
ED
DO
CU
ME
NT
, T
HE
RE
AD
ER
MU
ST
CO
NF
IRM
IT
S V
AL
IDIT
Y B
EF
OR
E U
SE
TH
IS IS
AN
UN
CO
NT
RO
LL
ED
DO
CU
ME
NT
, T
HE
RE
AD
ER
MU
ST
CO
NF
IRM
IT
S V
AL
IDIT
Y B
EF
OR
E U
SE
Knowledge Dissemination 4.7.
The workshops aimed at gaining insight into a number of key questions for this project, and others schemes of a similar nature. Below is a summary of the discussion questions and the responses deemed to be the most important by the participants.
What are the benefits for customers taking part in trials (like Hook Norton)?
o Financial benefit through reduced bulls.
o Help protect the environment and future supply.
o Improved education around how to be energy efficient
What actions could project participants take to reduce consumption?
o Management of devices on standby
o Scheduling of loads
o Improve knowledge of demand of individual appliances.
What are the most effective communication channels to engage project participant?
o Alerts – to email, text, website portals
o In person
o Smart phone / tablet apps
o Websites

36
TH
IS IS
AN
UN
CO
NT
RO
LL
ED
DO
CU
ME
NT
, T
HE
RE
AD
ER
MU
ST
CO
NF
IRM
IT
S V
AL
IDIT
Y B
EF
OR
E U
SE
TH
IS IS
AN
UN
CO
NT
RO
LL
ED
DO
CU
ME
NT
, T
HE
RE
AD
ER
MU
ST
CO
NF
IRM
IT
S V
AL
IDIT
Y B
EF
OR
E U
SE
5. Performance compared with Project aims, objectives and success criteria
In the initial project registration a number of project objectives and success criteria where outlined. This section will examine the project performance against these aims.
Objective 1: To develop and explore customer engagement and incentive programmes. This aspect will include a small scale domestic demand response trial.
The project has explored many different customer engagement techniques including a web presence, email campaigns, face to face interaction, leaflets, posters and use of village newsletters. Incentives have also been successfully offered in the form of a prize draw, along with a demonstration of benefits for project participation. Anecdotal evidence has suggested that the prize draw did encourage some customers to sign up to the programme, but most made their decisions based on other factors, such as an interest in energy matters. Hook Norton represents a particularly engaged community, yet rates of uptake have been significantly lower than expected. Further information about the successes and issues around customer engagement can be found in Appendix A.
A number of activities were originally planned around domestic demand response whereby customer would have been asked to alter their energy usage and retrospective investigation would have looked for the effects in the data. However, due to the issues with data inconsistency, it was decided not to pursue this work as the data would have provided inconclusive results.
Objective 2: To develop community data measurement and display capabilities (e.g. to ascertain the total electricity consumption of the village by installing measurement devices at various locations. Subsequently, to provide this and other relevant information back to the local community via a web portal/customer interface (which if successful, could then be used for other villages))
Community data measurement and display capabilities have been developed through the successful monitoring of distribution substations across the village. The live web portal has been developed allowing customers to see loads on the network along with individual customer load profile data. The model used for this website could be exported to use with other such community level monitoring projects subject to appropriate data sources.
Objective 3: To deploy Power Line Communications (PLC) technology at scale within the low voltage (LV) network, illustrating its potential capabilities for enabling smart grid end point measurement and data aggregation.
The Power Line Communications element of the project has been demonstrated through the installation of 4 hubs and 48 nodes. It was hoped that approximately 150 nodes would be deployed but this has been limited by a lack of customer uptake. Measurement of the current at end points through the nodes was shown to work well with data being returned via the PLC last mile communications. Data aggregation at the substation has not been achieved as a more centralised approach has been proposed. However, none of the nodes communicated with 100% reliability. On

37
TH
IS IS
AN
UN
CO
NT
RO
LL
ED
DO
CU
ME
NT
, T
HE
RE
AD
ER
MU
ST
CO
NF
IRM
IT
S V
AL
IDIT
Y B
EF
OR
E U
SE
TH
IS IS
AN
UN
CO
NT
RO
LL
ED
DO
CU
ME
NT
, T
HE
RE
AD
ER
MU
ST
CO
NF
IRM
IT
S V
AL
IDIT
Y B
EF
OR
E U
SE
average the PLC solution worked between 55% and 75% of the time depending on node location, rising to over 80% if considering successful communication on a daily level.
Objective 4: To test and compare a variety of ‘off the shelf’ asset monitoring solutions for HV/LV pole-mounted and ground-mounted substations. The quality of the products will be assessed, alongside the installation methods.
As one of the first LCNF projects started, Smart Hooky pioneered community level energy measurement through deployment of substation monitoring. This project has successfully deployed a blend of off-the-shelf product to deliver a fit for purpose substation monitoring solution. The specification and learning from this project have gone on to identify potential improvements in monitoring solutions that have intern led to further iterations in third party equipment. This is also demonstrated the successful deployment of Rogowski coil technology, which up to this stage, had limited UK network deployment. Following this project, Rogowski coil technology has become more prevalent in the current generation of third party substation monitors on the market. This project has also helped inform further specification and procurement decision.
From an installation perspective, a large number of lessons have been learnt from the on-site fitting and commissioning elements of this scheme, that have supported further monitoring deployments on additional projects.
Objective 5: To test and demonstrate a miniature smart grid telecommunications network (with multiple technologies) that will enable both local and remote network visibility
Smart Hooky project has demonstrated an at scale PLC solution with a reliable UHF radio backhaul installation. The solution has demonstrated greater visibility of LV network performance within the village providing both control system visibility and also through the www.smart-hooky.net
Objective 6: To explore the changes that could be made to a network control system for enabling simple forms of Low Voltage (LV) network monitoring and management
For this project a trial ENMAC based solution was developed providing live visibility of the LV network in a control centre application. This data has also been captured and stored to allow historic analysis of the network performance. It is envisaged that this will support assessing any future network investments and connections.
Success criteria 1: Accelerates the development of a low carbon energy sector • A framework for engaging with communities about their low-carbon aspirations • Information technology tools that can be then used in other communities
The improved visibility of the network will give greater confidence to the connection of additional loads and generation on the network. Through this project we have been able to deliver a range of engagements with the local community, from presence at local events, workshops with the project participants, and a presence throughout the village with a wide range of publicity.

38
TH
IS IS
AN
UN
CO
NT
RO
LL
ED
DO
CU
ME
NT
, T
HE
RE
AD
ER
MU
ST
CO
NF
IRM
IT
S V
AL
IDIT
Y B
EF
OR
E U
SE
TH
IS IS
AN
UN
CO
NT
RO
LL
ED
DO
CU
ME
NT
, T
HE
RE
AD
ER
MU
ST
CO
NF
IRM
IT
S V
AL
IDIT
Y B
EF
OR
E U
SE
Additional visibility has been created through the web portal (www.smart-hooky.net) given greater awareness of energy issues to the residents utilising the tool. It is anticipated that this IT framework will be adopted for further projects where network data is to be published for local groups. This includes a proven technology for gathering data, processing through corporate systems and exporting to a third party in a secure way.
Success criteria 2: Has the potential to deliver net benefits to existing and/or future customers
Ability to accommodate new technologies in the knowledge that the networks
are not being adversely impacted
Will accelerate the carbon reduction in this particular community (and
subsequent ones)
When Smart Hooky was developed, WPD had limited experience of substation monitoring at community level. This project has developed a legacy which will help inform future monitoring works and network wide analysis. It has also had influence in the rapid development of third party substation monitors. The specifications WPD is utilising for further monitoring is based on many of the lessons learnt from this scheme.
The success of the monitoring has also delivered a high level of confidence in the performance of the network and its capacity to absorb additional technology as it comes on line. We are therefore in a strong position to evaluate the connection of low carbon technologies as they are adopted across the community as part of the on-going carbon reduction plans of the village.
Success criteria 3: Has a Direct Impact on the operation of a DNO’s Distribution System
The project will explore the benefits of added intelligence in HV and LV
networks
Will explore PLC technology for smarter LV grids
Small scale demand side management trial to be initiated
Continuous measurement of network performance has created greater visibility of the assets in Hook Norton. Such data has helped assess the current state of the network and will support any future network investment decisions.
The trials utilising PLC have shown that this is a viable method for last mile communications across the network, subject to a suitable density of nodes.
One area that was not completed in the project was a small scale demand side management trial. This was primarily due to inconsistencies in the network data brought about through lack of data storage. This is something that is now fundamental in all monitoring solutions applied in further projects.
Success criteria 4: Generates new knowledge that can be shared amongst all
Possible reduction in longer-term capital spend on rural communities
Greater understanding of future network design requirements for rural areas

39
TH
IS IS
AN
UN
CO
NT
RO
LL
ED
DO
CU
ME
NT
, T
HE
RE
AD
ER
MU
ST
CO
NF
IRM
IT
S V
AL
IDIT
Y B
EF
OR
E U
SE
TH
IS IS
AN
UN
CO
NT
RO
LL
ED
DO
CU
ME
NT
, T
HE
RE
AD
ER
MU
ST
CO
NF
IRM
IT
S V
AL
IDIT
Y B
EF
OR
E U
SE
A range of tools and techniques that can be applied for rural areas.
Greater visibility of the network performance will lead to better informed asset management decisions. Ultimately this will manifest itself in supporting planning decisions and ensuring that efficient application of capital reinforcement can be made when required. Initial lessons have been learnt about the resilience of this rural network and we will seek to apply the learning to other similar areas.
The approach taken for substation monitoring in this project can be applied to other network areas, in both rural and urban environments. While the technology itself may not prove fully applicable for further replication, the principles gained from this project will prove vital for additional deployments.
Information from this project has been shared at a number of forums including the LCNF conferences in 2012 and 2013. An additional industry knowledge dissemination event was run in February 2013 in Hook Norton. Further learning from the project was also shared at a WPD Substation Monitoring event held in Leicester in June 2013
Success criteria 5: Focuses on network Solutions that are at the trialling stage
At-scale UK demonstration of Power Line Communications (PLC) technology in
an LV distribution network.
Demonstration of a smart grid telecommunications network ‘access layer’
The PLC network applied in Hook Norton has included the installation of 49 smart nodes across 4 substations and has demonstrated the successful transmission of data from remote extents of the LV network. The development of the smart hub and node was undertaken through the Innovation Funding Initiative, and has been taken on with this project to a full demonstration. This has been supported by the successful application of addition backhaul communications allowing data to be returned to the WPD control system.
Substation monitoring was also at the trailing stage and has now been demonstrated as a viable option for improving network visibility.
Success criteria 6: Does not lead to unnecessary duplication
There are no UK based projects that meet the same objectives as the Smart Hooky scheme.

40
TH
IS IS
AN
UN
CO
NT
RO
LL
ED
DO
CU
ME
NT
, T
HE
RE
AD
ER
MU
ST
CO
NF
IRM
IT
S V
AL
IDIT
Y B
EF
OR
E U
SE
TH
IS IS
AN
UN
CO
NT
RO
LL
ED
DO
CU
ME
NT
, T
HE
RE
AD
ER
MU
ST
CO
NF
IRM
IT
S V
AL
IDIT
Y B
EF
OR
E U
SE
6. Required modifications to the planned approach during the Project
A number of modifications were made to the approach of the project during the duration of the project. As part of the project governance, internal change mandates were completed. These can be found in Appendix C. A formal change notification was submitted to Ofgem in September 2012.
Amendments were made to the data architecture of the project to ensure that the scheme complied with WPDs IT and security policies. As a result the publication of customer and load data to www.smart-hooky.net was delayed by several months. To ensure all project learning was captured in the close out report, the project was extended for an additional 15 months.
An additional modification was made, removing the comparison of off-the-shelf monitoring solutions from the project. The project delivered a robust measurement system utilising a range of off-the-shelf components. It was deemed that the most efficient use of resources on this project was to concentrate on delivering one working solution on this project, rather than developing multiple solutions across the village. Further work to compare wider application on the market has recently been completed within the LV Current Sensor Evaluation project.
Issues with data consistency led to the removal of the small scale demand response trial from the project scope. This was primarily due to the lack of confidence that changes in customer behaviour could have been accurately identified and reported on. We will continue to work with the community outside of this project to support any further initiatives where possible.
Initially it was hoped that up to 150 nodes would be installed across the village. Due to poor levels of customer sign up, only a third of this number was achieved. This has had an effect on the project learning, particularly around the required density of PLC nodes to provide a robust last mile communications network. However, engineering judgement has been applied to the learning and it is now considered that an additional 20% of nodes, if placed correctly, would have had a significant impact on the overall PLC performance.
Two substation sites, Hook Norton and Scotland End, did not have the substation monitoring commissioned due to equipment and communications issues. As these sites were not directly involved in customer engagement, this has little effect on the overall learning for the project. From a substation monitoring perspective, learning has been accrued from the other sites in terms of installation practices. It is therefore considered that this decision was not a the detriment of the project’s overall objectives.

41
TH
IS IS
AN
UN
CO
NT
RO
LL
ED
DO
CU
ME
NT
, T
HE
RE
AD
ER
MU
ST
CO
NF
IRM
IT
S V
AL
IDIT
Y B
EF
OR
E U
SE
TH
IS IS
AN
UN
CO
NT
RO
LL
ED
DO
CU
ME
NT
, T
HE
RE
AD
ER
MU
ST
CO
NF
IRM
IT
S V
AL
IDIT
Y B
EF
OR
E U
SE
7. Significant variance in expected costs and benefits
Project Budget 7.1.
Initially the budget for the project was set at £350,000 but reassessed and set to £344,000 to reflect the removal of the substation monitoring comparison works. The following table outlines the main spend elements on the scheme.
Item Cost
AND – Node and Hub Development £ 131,041.26
NEF – Customer Engagement & Website £ 107,788.75
Installation and Project Management £ 107,569.57
Equipment and Software £ 44,275.75
Other £ 1,173.34
Total £ 391,348.66
Budget £ 344,000.00
Overspend £ 47,348.66
As can be seen from the table, the project has overspent by just over £47,000. There have been a number of factors that have contributed to this. These include;
Increased IT Development Costs
Moving of website development from internal development and hosting to third
party.
Additional on-site support
Project extension leading to additional project management and web site support
Initially it was envisaged that the website development would be delivered in house. A review of the IT project elements resulted in the responsibility for the website moved to NEF. This introduced additional cost into the project for development and maintenance of the website. Additional IT project costs were incurred due to a number of delays into the scheme, ultimately resulting in the project being extended for an additional 15 months. Further cost of £3-4k.would have been incurred had Scotland End and Hook Norton substations been commissioned with the monitoring solution. As the key learning associated with these installations had already been gathered, it was deemed that this represented additional unrequired expenditure. With the project extension, further project management, customer engagement and website support was required. A number of sites experienced commissioning issues requiring further on-site support.

42
TH
IS IS
AN
UN
CO
NT
RO
LL
ED
DO
CU
ME
NT
, T
HE
RE
AD
ER
MU
ST
CO
NF
IRM
IT
S V
AL
IDIT
Y B
EF
OR
E U
SE
TH
IS IS
AN
UN
CO
NT
RO
LL
ED
DO
CU
ME
NT
, T
HE
RE
AD
ER
MU
ST
CO
NF
IRM
IT
S V
AL
IDIT
Y B
EF
OR
E U
SE
Project Benefits 7.2.
This project has broadly delivered the expected level of benefits in line with the project objectives. In particular, Smart Hooky has had a significant influence over the specification and procurement of substation monitoring equipment for a number of further LCNF projects within WPD. Further lessons regarding customer engagement and recruitment are now being applied to additional schemes and supporting the development of new projects.
The PLC trails have been able to demonstrate that it is a viable method for last mile communications within a UK LV network context. Further benefit and confidence could have been gained through the installation of more nodes. However engineering judgement has been applied to the results, and concluded that with further nodes and data storage, it is a viable solution.

43
TH
IS IS
AN
UN
CO
NT
RO
LL
ED
DO
CU
ME
NT
, T
HE
RE
AD
ER
MU
ST
CO
NF
IRM
IT
S V
AL
IDIT
Y B
EF
OR
E U
SE
TH
IS IS
AN
UN
CO
NT
RO
LL
ED
DO
CU
ME
NT
, T
HE
RE
AD
ER
MU
ST
CO
NF
IRM
IT
S V
AL
IDIT
Y B
EF
OR
E U
SE
8. Lessons learnt for future Projects
Substation Monitoring 8.1.
The substation monitoring solution developed for Smart Hooky has provided a robust system of current and voltage measurement. The rollout within this project has played a significant role in informing WPDs requirements for additional deployments. It has also been used to advice third party manufacturers as to network operators requirements in this area. Subsequently the pace of these developments has ultimately meant that the more advanced stand-alone systems are now available at the same price point.
As a result of this project, a number of key technical specifications have been identified
Size – Not all sites have the space to install standalone GRP housings. Smaller IP rated
cabinets are therefore required.
Integration – A significant amount of time was required to integrate the individual
elements of the monitor and write and update the firmware for each element. This
can be mitigated with an integrated solution.
Commissioning – All-in-one solutions speed up and de-skill the installation and
commissioning process.
Reliability – Due to a number of factors, the RCD trip switches were prone to
operation rendering the solution unreliable. More robust system protection is
required
Data Storage – Data storage is an essential element that ensures that data is not lost
should the communications medium prove unreliable.
In particular the project has demonstrated the successful application of Rogowski coils in a live operational environment, bringing additional flexibility in sites with close cable cores and congested LV pillars. This is technology that has already been deployed on further projects
A number of issues were identified on site that proved challenging to rectify in the field. To overcome this, it is recommended that new equipment should undergo a process of factory acceptance.
Many of the techniques used in this project drew on core skills within the business. For example the power was supplied via a dedicated three phases supply. While this met the project requirements, alternative power solutions have now been developed including modified fuse carrier handle and busbar clamps.
Customer Energy Monitoring 8.2.
While the performance of the smart nodes has been extremely positive, there have been a number of factors that have been identified that would improve a deployment in future scenarios. During the early stages of node installation it was decided to concentrate on installing nodes in customers premises with outdoor meter boxes. This ensured that if further work was required to update firmware, access to the node could be made with
44
TH
IS IS
AN
UN
CO
NT
RO
LL
ED
DO
CU
ME
NT
, T
HE
RE
AD
ER
MU
ST
CO
NF
IRM
IT
S V
AL
IDIT
Y B
EF
OR
E U
SE
TH
IS IS
AN
UN
CO
NT
RO
LL
ED
DO
CU
ME
NT
, T
HE
RE
AD
ER
MU
ST
CO
NF
IRM
IT
S V
AL
IDIT
Y B
EF
OR
E U
SE
minimal disruption to the customer. Further work could be undertaken to assess the form factor of the smart nodes and even look to include it as part of an enhanced cut-out / cut-out fuse. This would significantly reduce the space required and remove the need for external wiring to a clip on CT.
At a number of sites the meter positions were too congested to allow installation. This was due to a number of factors including off-peak time switches, FITs meters and other ancillary equipment. This could be an issue with the deployment of smart meters as it is envisaged they will have a larger footprint than existing meters.
Any future customer energy monitoring should include data storage to mitigate for communication losses. The design employed on this project would also have benefited from a larger CT to fit around 25mm2 meter tails. Also, with installations at sites with PV generation, it is important to identify when power is being exported to the network. It is also recommended that voltage is measured and recorded.
It is envisaged that much of the data and functionality of the smart nodes will be available from smart meters, which are due to be deployed between 2015 and 2020.
Communications 8.3.
Narrowband Power Line Carrier has provided a good medium for last mile communications, and demonstrated daily message reliability of over 80%. This could be increased with a more dense installation of PLC nodes. It was observed that PLC reliability improved with increased network loads.
The UHF radio deployment provided a robust backhaul solution and has also informed future communication choices for wider applications. It is recommended that for any future installations, each radio is set up with repeater functionality enable to increase flexibility. Signal strength surveys should be conducted prior to deployment to reduce further site visits.
Customer Engagement 8.4.
The recruitment of customers in the village yielded smaller numbers than was initially anticipated. This was of particular note given the engaged nature of the community in Hook Norton. The lack of certainty as to when data would be available was, in some cases, a factor that hindered recruitment. The use of incentives such as the prize draw proved popular although it is not thought that this was the deciding factor in involvement for many.
While a selection of recruitment techniques was employed, face to face engagement led to the greatest level of success. While it is recognised that this may not be practicable in all projects, the use of local groups and advocates may enhance customer engagement.
Further information on the learning associated with customer engagement can be found in Appendix A prepared by NEF.

45
TH
IS IS
AN
UN
CO
NT
RO
LL
ED
DO
CU
ME
NT
, T
HE
RE
AD
ER
MU
ST
CO
NF
IRM
IT
S V
AL
IDIT
Y B
EF
OR
E U
SE
TH
IS IS
AN
UN
CO
NT
RO
LL
ED
DO
CU
ME
NT
, T
HE
RE
AD
ER
MU
ST
CO
NF
IRM
IT
S V
AL
IDIT
Y B
EF
OR
E U
SE
Knowledge Dissemination 8.5.
The knowledge dissemination session run in Hook Norton for industry proved to be a successful event with positive feedback received from delegates. Elements of the day have been applied to further events organised for other projects. This has included the use of a neutral and interesting venue, a mix of presentations and an opportunity to view actual project equipment.

46
TH
IS IS
AN
UN
CO
NT
RO
LL
ED
DO
CU
ME
NT
, T
HE
RE
AD
ER
MU
ST
CO
NF
IRM
IT
S V
AL
IDIT
Y B
EF
OR
E U
SE
TH
IS IS
AN
UN
CO
NT
RO
LL
ED
DO
CU
ME
NT
, T
HE
RE
AD
ER
MU
ST
CO
NF
IRM
IT
S V
AL
IDIT
Y B
EF
OR
E U
SE
9. Planned implementation
There are a number of areas within this project that will be implemented for further work.
Substation monitoring has provided improved network visibility which will support local network operations and planning activity. It is envisaged that monitoring shall play a vital role in future network management. At present monitoring will continue to form an integral part of trial projects, moving into more business as usual as the costs reduce and additional business applications emerge.
The use of Rogowski coils will be used in future monitoring solutions where congestion means other sensor types cannot be deployed.
The FTP link between Enmac and NEF proved to be a reliable and safe method of data transfer to a third party. We are currently looking into how this will be applied for further community based projects were data required transferring to outside organisations. This includes the application of the Smart-Hooky.net website tool.
The National Energy Foundation provided valuable expertise in delivering the customer engagement elements of the project, along with the website development. We are currently investigating how the website application could be utilised for further projects. In addition, we will look to maintain the links with NEF for potential future schemes.
The equipment developed by AND technology met the defined scope and was delivered within budget and on time. On-site support was essential in achieving the project objectives and any further development work was delivered within agreed timescales. We are looking to how WPD can continue to work with AND in developing future products for network applications. However at this time we have no direct plans to apply the PLC technology, smart nodes and hub further.
There are outline plans to utilise Radius radios to replace the existing communications to all of the existing secondary automation sites in the Midlands area as per the South West and Wales. Where the Hook Norton project used the PDR221 version which allows only one hop within a system, the new automation system will use the Netlink PDR121 which allows multiple hops within a system.

47
TH
IS IS
AN
UN
CO
NT
RO
LL
ED
DO
CU
ME
NT
, T
HE
RE
AD
ER
MU
ST
CO
NF
IRM
IT
S V
AL
IDIT
Y B
EF
OR
E U
SE
TH
IS IS
AN
UN
CO
NT
RO
LL
ED
DO
CU
ME
NT
, T
HE
RE
AD
ER
MU
ST
CO
NF
IRM
IT
S V
AL
IDIT
Y B
EF
OR
E U
SE
10. Facilitate Replication
Knowledge Required 10.1.
The knowledge required to implement a platform which supports community energy monitoring is outlined below:
Electrical network topology and connectivity
Electrical network asset information
Geographic asset locations
Physical terrain and relief mapping
Communication topology
Data flows and requirements
DNP3 protocol configuration
Products/Services Required 10.2.
As well as general project management and installation resources at the disposal of a distribution network operation, there are a number of separate products and services that have been identified by this project as being to deliver this functionality. This section outlines these requirements:
Overhead LV monitoring
Underground LV monitoring
Allocated licensed spectrum
Licenced UHF radios
Unlicensed UHF radios
Power Line Carrier Nodes
Power Line Carrier Data Concentrator
Real-time data polling system
Data storage capability
Data export capability
DNP3 configuration tools
Customer engagement capability
Project IPR 10.3.
This project integrated a number of existing products and services as outlined in section 14.2 to enable successful delivery against the project criteria. Whilst there was no foreground IPR generated, there have been a number of learning outcomes developed and disseminated across the wider business and other projects. Lessons learnt from this project have already helped form the WPD requirements for LV substation monitoring as used in the LV Current Sensors project, FALCON and the Community Energy Action project. Aspects of the customer engagement activity have also support the ECHO project in the recruitment process.
48
TH
IS IS
AN
UN
CO
NT
RO
LL
ED
DO
CU
ME
NT
, T
HE
RE
AD
ER
MU
ST
CO
NF
IRM
IT
S V
AL
IDIT
Y B
EF
OR
E U
SE
TH
IS IS
AN
UN
CO
NT
RO
LL
ED
DO
CU
ME
NT
, T
HE
RE
AD
ER
MU
ST
CO
NF
IRM
IT
S V
AL
IDIT
Y B
EF
OR
E U
SE
Appendix A outlines the approaches taken regarding customer interaction by NEF report. Appendix B provides further information as to the technical aspects of the smart hub and node designs. There is additional information as to the application of the DNP3 protocol in this section.
Technical documents relating to the installation and configuration of the substation monitors and radio backhaul systems are available on request. This project has been reported on during both the 2012 and 2013 Low Carbon Network Fund Conferences. Design documents and specifications for the equipment developed for this project are available on request from [email protected].
Points of Contact 10.4.
Further details on replicating the project can be made available from the following points of contact:
Steven Burns, Western Power Distribution, Pegasus Business Park, East Midlands Airport, Castle Donington, Derbyshire, DE74 2TU. [email protected]
Future Networks Team, Western Power Distribution, Pegasus Business Park, East Midlands Airport, Castle Donington, Derbyshire, DE74 2TU. [email protected]

Smart Hooky – Final Report
Date: 31 January 2014
49
Appendix A – Smart Hooky Final Report - NEF
TH
IS IS
AN
UN
CO
NT
RO
LL
ED
DO
CU
ME
NT
, T
HE
RE
AD
ER
MU
ST
CO
NF
IRM
IT
S V
AL
IDIT
Y B
EF
OR
E U
SE
Hook Norton Low Carbon Community Smart Grid
Smart Hooky
Final report - November 2013
11. Appendix A – Smart Hooky Final Report - NEF
National Energy Foundation
The National Energy Centre
Davy Avenue
Knowlhill
Milton Keynes
MK5 8NG
Tel: 01908-665555
www.nef.org.uk
Improving the use of energy in buildings

Smart Hooky – Final Report
Date: 31 January 2014
50
Appendix A – Smart Hooky Final Report - NEF
TH
IS IS
AN
UN
CO
NT
RO
LL
ED
DO
CU
ME
NT
, T
HE
RE
AD
ER
MU
ST
CO
NF
IRM
IT
S V
AL
IDIT
Y B
EF
OR
E U
SE
CONTENTS
MAIN REPORT
1 Summary
2 Introduction
3 Details of the different phases of engagement
4 Successes and issues
5 Lessons learnt
6 Conclusions
7 Annex 1: outcome of workshops

Smart Hooky – Final Report
Date: 31 January 2014
51
Appendix A – Smart Hooky Final Report - NEF
TH
IS IS
AN
UN
CO
NT
RO
LL
ED
DO
CU
ME
NT
, T
HE
RE
AD
ER
MU
ST
CO
NF
IRM
IT
S V
AL
IDIT
Y B
EF
OR
E U
SE
SUMMARY
The project was conducted by a partnership of technical experts (Western Power Distribution, AND
and Renesas), supported by the National Energy Foundation, a charitable organisation and Hook
Norton Low Carbon club, a local group providing support to its residents to help them reduce their
carbon footprint and save money.
The main objective of this project was to test new technology to help residents view their electricity
consumption on a near real time basis and test how the technology, alongside an engagement
strategy, would help residents to shift their consumption of electricity essentially during peak time of
consumption to reduce overall demand on the grid.
In total, 70 participants expressed their interest in the project and 48 nodes were installed into the
properties within the selected areas. Residents were able to view their data on an online platform.
In Section 2 of the document, we present an introduction of the project together with a background
and a timeline of all the engagement activities carried out by NEF in correlation with the
advancement in the technology.
Section 3 details the engagement part of the project through the 3 different phases:
Phase 1: Selection of the participants (from May 2011 to March 2012 – 11 months) – This
part essentially details the strategy for registering interest from the residents and selecting
the four targeted areas.
Phase 2: Communication with the participants (from April 2012 to March 2013 – 12 months)
– During this phase, we review the development of the website and our communication
strategy to encourage participants to view their data through the web portal.
Phase 3: Engagement with the participants (from April 2013 to October 2013 – 7 months) –
Finally the last phase covers the engagement strategy with the participants which explores
how the residents could use the data they receive through the tool to modify their behaviour
to shift their consumption of electricity.
In Section 4, we summarise the successes and issues experienced in the project, specifically in terms
of the recruitment strategy, the general communication with the participants, the data itself, the
overall project management team and the development of the website.
In Section 5 we have collated all the lessons learnt in the project to benefit future work of a similar
nature, and finally, in Section 6 we draw together a summary of conclusions from the project.

Smart Hooky – Final Report
Date: 31 January 2014
52
Appendix A – Smart Hooky Final Report - NEF
TH
IS IS
AN
UN
CO
NT
RO
LL
ED
DO
CU
ME
NT
, T
HE
RE
AD
ER
MU
ST
CO
NF
IRM
IT
S V
AL
IDIT
Y B
EF
OR
E U
SE
INTRODUCTION
2.1 Background to the project
Hook Norton is a rural community in Oxfordshire with around 2,500 residents and 800 properties,
with no access to the gas network. The village has a very active group called the Hook Norton Low
Carbon Club (HNLC), which provides support to its residents to help them reduce their carbon
footprint and save money. HNLC has benefited from funding from DECC through the Low Carbon
Communities programme, which helped to fund numerous carbon saving initiatives.
Due to its high level of engagement, Hook Norton was chosen to participate in Western Power
Distribution’s project to test a range of monitoring equipment that would help residents shift their
electricity consumption during times of peak consumption.
2.2 Issues the project sought to tackle
With the exception of a handful of renewable installations and properties heated through oil
burners, the village of Hook Norton relies entirely on the electricity network for its power and, more
significantly, for its heating needs. In the coming years, with the expected in increase in the use of
lower carbon forms of heating including heat pumps, along with greater uptake of electric vehicles
and the growth in new housing, the demand on electricity supplies is predicted to increase. The
electricity infrastructure in some areas may not be sufficient to satisfy the electricity demand. This
will be a particular issue at peak times of electricity use, which typically fall between 4pm and 7pm in
residential areas. This would very likely result in residents experiencing power cuts, and may
shorten the life of the network equipment in place which is put under greater pressure.
The options available to the Distribution Network Operators (DNOs) are:
Reinforce the grid, which could be very costly.
Reduce the overall electricity demand from customers, or
Tackle electricity consumption at peak times.
Whilst reducing the overall electricity demand of the village would partly solve the issue, this project
looked specifically at how to engage with the residents using technology that informs them about
peak time consumption and eventually encourages customers to shift their electricity consumption
to times where the demand on the grid is less.
2.3 Objectives of the engagement part of the project
The National Energy Foundation was appointed to work alongside the Hook Norton Low Carbon Club
to lead on the consumer engagement part of the project. Specifically, NEF’s role was to:
Recruit residents willing to participate in the trial, the target was to get 150 nodes installed in
clustered areas in the village;
Organise the installation of the nodes with WPD;

Smart Hooky – Final Report
Date: 31 January 2014
53
Appendix A – Smart Hooky Final Report - NEF
TH
IS IS
AN
UN
CO
NT
RO
LL
ED
DO
CU
ME
NT
, T
HE
RE
AD
ER
MU
ST
CO
NF
IRM
IT
S V
AL
IDIT
Y B
EF
OR
E U
SE
Engage with the residents to encourage a change of behaviour depending on the data
received;
Communicate with the residents on the progress and findings of the project;
Develop all communication materials needed for the engagement part of the project, i.e.
leaflets, posters, blogs, newsletters, press releases, etc.;
Develop the online customer interface for residents to logon to view the total village
electricity consumption and individual data for those selected in the trial.
2.4 Timeline of engagement
This timeline shows the level and frequency of the engagement process with the residents in
correlation with the advancement in the technology through the different phases of the project. We
will refer to this timeline in various parts of this report.
Technologyinstallation Engagement
May-11 Branding,Registrationofinterest:HNLC,leaflet,newsletter
Jun-11
Jul-11 Furtherrecruitment:Musicevent,leaflet,poster,newsletter
Aug-11
Selectionof4substations Sep-11 Requestconsentforinstallations
Oct-11 Surveys
Nov-11
Dec-11 Prizes
1stphaseofinstallation Jan-12 News/blog,furtherrecruitment
2ndphaseofinstallation Feb-12 News/blog
3rdphaseofinstallation Mar-12 PR
Apr-12
May-12
Lastfewinstallation Jun-12
Jul-12
Aug-12
Sep-12
Oct-12
Nov-12
Dec-12
Jan-13 Updateallparticipant,selectionfortriallingthewebsite
Sitevisits Feb-13
Mar-13
Apr-13 Projectupdate-Aprilforvillagenewslettertopromotewebsite
May-13
Jun-13
Jul-13
Aug-13
Decisionthattechnicalissuescouldnotbesolved Sep-13
Oct-13 Finale-mailtosummarisefindingandendproject
30nodesapparentlyworkingokand
18nodesnotworking.
NEFreviewdataandidentifydata
problemsfromallnodes
Datafromnodesand6substationsbeingreceivedfromWPD.NEFdevelopscripttoreadXMLdata
importsandcreatedatabase,webportalaccess,
userprofilesandsubstationgraphs.
Pilotlaunchofwebsiteandloginfor7participants.Fulllaunchof
websiteandlogininMarchwithtwocommunitymeetings
ProjectupdateinJuneforvillagenewsletter;lettertoparticipants
aboutsuccessoftheirnodes
Preparationofwebsiteandpromotionalmaterialforvillageenergy
savingdaySept/Oct-CancelledinlateSeptduetoPLCdataproblems
fromsubstations
PhaseIII:Engagemen
tPhaseI:Recruitment
PhaseII:C
ommunication
Gap
GapinNEFworkwithHNresidentsResultofthedecisionnottorecruitfurtherresidentsun lwehadconfidencethetechnicalissuescouldberesolvedtoavoidbuildingexpecta onsand
disappointmentfromthenewpar cpants.

Smart Hooky – Final Report
Date: 31 January 2014
54
Appendix A – Smart Hooky Final Report - NEF
TH
IS IS
AN
UN
CO
NT
RO
LL
ED
DO
CU
ME
NT
, T
HE
RE
AD
ER
MU
ST
CO
NF
IRM
IT
S V
AL
IDIT
Y B
EF
OR
E U
SE
DETAILS OF THE DIFFERENT PHASES OF ENGAGEMENT
The project was divided into three main phases as laid out in the previous timeline:
Phase 1: Selection of the participants
Duration: 11 months (from May 2011 to March 2012)
During this first phase, the objective was to gather residents’ interest in the project, select the areas
where we would install the nodes for testing and proceed to installation.
Phase 2: Communication with the participants
Duration: 12 months (from April 2012 to March 2013)
During this second phase, the aim was to provide the collected data to the participants, check that
the data provided was in line with the consumers’ personal consumption. We also aimed to have
another phase of installation to boost the number of nodes within the selected areas.
Phase 3: Engagement with the participants
Duration: 7 months (from April 2013 to October 2013)
Finally, during this last phase, the intention was to engage with the residents to find out how much
the technology alongside a targeted campaign could have an effect on their behaviour to change
electricity consumption patterns.
3.1 Phase I: Selection of the participants
Development of the brand and marketing materials
To make the project appealing to the residents, we wanted it to have its own specific branding with a
local feel to it whilst also showing credibility through all the partners involved, either local, charitable
or technical.
Hooky is a word often used to refer to something that comes from
Hook Norton. A beer for example has been christened the Old
Hooky with the two ‘Os’ interrelated.
So we created a branding for the project around this already
established design adding the word smart to refer to the smart
grid technology and a strap line that briefly outlined the project.
In line with the logo, we also developed marketing materials such as leaflets and posters to explain
the objectives of the project to the residents:

Smart Hooky – Final Report
Date: 31 January 2014
55
Appendix A – Smart Hooky Final Report - NEF
TH
IS IS
AN
UN
CO
NT
RO
LL
ED
DO
CU
ME
NT
, T
HE
RE
AD
ER
MU
ST
CO
NF
IRM
IT
S V
AL
IDIT
Y B
EF
OR
E U
SE
Picture 1: Leaflet and poster
Gathering residents’ interest and selection of four substations
One main reason to select Hook Norton for trialling this new technology was because the village was
already very active in terms of lowering their carbon footprint, headed by a dynamic group of people
who set up the Hook Norton Low Carbon Club to lead on all initiatives. Thanks to this active group,
the village was awarded £400k from DECC’s Low Carbon Communities programme to help its
residents ‘decarbonise’ through initiatives like home retrofits (£5 to £40k interest free loans), a
school makeover (including a 17.5kW PV installation) and a small automatic metering deployment.
Due to HNLCs previous engagement with the community, the project benefited from a ‘warm’
audience to talk and engage onto the Smart Hooky project.
The project was first presented at one of the HNLC meetings. At this stage, the aim was to gather
interest from the residents to take part in the project. Straight away we got 38 people interested
from the HNLC membership. In addition, we publicised the project through the local newsletter. We
also created leaflets, which provided an explanation about the project and which included a
registration form. These were inserted within the newsletters as an add-on.
In addition, leaflets were also placed in the local library and shops and handed out at the Crossroad
music festival in July. Matching posters were created for the HNLC meetings and also displayed at the
local shops alongside the leaflets.
Registering interest could be done by completing the form on the leaflet and sending it back by post
or handing it over to a member of the HNLC committee member. Alternatively residents could
register online via a dedicated web address.

Smart Hooky – Final Report
Date: 31 January 2014
56
Appendix A – Smart Hooky Final Report - NEF
TH
IS IS
AN
UN
CO
NT
RO
LL
ED
DO
CU
ME
NT
, T
HE
RE
AD
ER
MU
ST
CO
NF
IRM
IT
S V
AL
IDIT
Y B
EF
OR
E U
SE
By the end of September 2011, we had gathered interest from 70 residents across the village as
follows (38 of which were members of HNLC):
24 through the newsletter
25 at the cross road event where we were actively taking names (not simply distributing the
leaflets, we also had a stand with the HNLC)
21 through HNLC meeting
The technology required the installations to occur in clustered areas. With 70 interested residents
across the village, this was enough to proceed with the selection of the main four areas (substations)
with the most interest, which would take part in the project. The substations with the most interest
were as follows:
Sub-stations Interested residents
Total residents
% Interest Selected
East End 15 126 12% Yes
Southrop 12 67 18% Yes
Bourne Lane 12 166 7% Yes
Southside 9 66 14% No
Hook Norton 7
No
Station Road 4 62 6% Yes
Other 6 substations 11
Total 70
The four substations with the most interest were East End, Southrop, Bourne Lane and Southside.
However, due to its ease of access and some work already underway to install equipment, Station
Road was favoured to install the equipment. This meant dropping Southside as a result. The four
chosen substations (shaded in orange on the map below) had a total interest from 43 residents.

Smart Hooky – Final Report
Date: 31 January 2014
57
Appendix A – Smart Hooky Final Report - NEF
TH
IS IS
AN
UN
CO
NT
RO
LL
ED
DO
CU
ME
NT
, T
HE
RE
AD
ER
MU
ST
CO
NF
IRM
IT
S V
AL
IDIT
Y B
EF
OR
E U
SE
Picture 2: The selected four substations (in orange) with a total of 43 interested residents.
To avoid disappointment, the residents from the areas not selected were offered to take part in a
different energy saving initiative run by Oxford University.
Request of consent and surveys
Following the selection of the four areas where residents would be trialling the technology, we
decided to survey some properties to check whether the nodes could be fitted properly within the
meter boxes. In total 24 properties were surveyed during October 2011. Essentially this helped us to
identify that some properties would not be able to have the nodes installed due to lack of space. This
happened to 4 properties, ie one in six properties. This finding was very important as it meant that to
get 150 nodes installed we were likely to need at least 175 interested residents amongst the 421
residents within the 4 selected areas, which is more than 41% of the population. This was an
extremely challenging task considering that, whilst the village overall is very proactive in engaging
with green issues, a large proportion of the village has elderly people who do not necessarily want to
be involved in such trials, especially where the ‘what’s in it for me’ benefits are not totally clear.
In parallel to carrying out the surveys, we had to ask the interested participants for formal consent to
have a node installed in their meter box and installations were scheduled for January 2012. During
further recruitment, we were automatically asking for consent up front.
Prizes, installations and further recruitment

Smart Hooky – Final Report
Date: 31 January 2014
58
Appendix A – Smart Hooky Final Report - NEF
TH
IS IS
AN
UN
CO
NT
RO
LL
ED
DO
CU
ME
NT
, T
HE
RE
AD
ER
MU
ST
CO
NF
IRM
IT
S V
AL
IDIT
Y B
EF
OR
E U
SE
In order to encourage residents to sign up for the trial, we promoted a prize draw and in December
we offered the following prizes to three residents who were picked at random:
Prize Value
1st Prize Eurostar voucher £150
2nd Prize Restaurant vouchers £70
3rd Prize Village shop vouchers £30
The first phase of installations started in January 2012 and carried on into February and March
without any major issues. At the same time, we continued with promoting the project and recruiting
participants through the following:
Door-to-door knocking
Leaflets/Posters
Newsletter
Incentives through further prizes
News/blogs and press releases
We promoted the project further in the local newsletter and published blogs to update the residents
about the project on the HNLC website. As an incentive we were also offering further prizes to all
new participants.
The door-to-door approach was very time consuming, however it was a successful way to get
residents to sign up straight away for the trial and schedule the installation at the same time. Often,
residents heard about the project, were interested but didn’t get the chance to express their
interest.
That way, they were enrolled on the spot and others had the opportunity to ask a few more
questions about the project before they signed up. On average we were getting about 5 signed up in
2 hours of door knocking.
At the end of March 2012, we had an additional of 22 residents wanting to take part in the project
bringing the total to 65 participants as follows:
- 46 installations completed (roughly 1/3 of target)
- 7 could not be completed due to lack of space for the equipment
- 12 installations left to do/confirm participation
3.2 Phase II: Community Engagement, use of data
In June 2012, a couple more installations were completed from the residents who were previously
interested, bringing the total installations to 48. Another four were unable to proceed due to lack of

Smart Hooky – Final Report
Date: 31 January 2014
59
Appendix A – Smart Hooky Final Report - NEF
TH
IS IS
AN
UN
CO
NT
RO
LL
ED
DO
CU
ME
NT
, T
HE
RE
AD
ER
MU
ST
CO
NF
IRM
IT
S V
AL
IDIT
Y B
EF
OR
E U
SE
space for the equipment. At that stage, we had another seven potential installations bringing the
total to 66.
Picture 3. Installations to date
Whilst we were ready to engage with more residents, the issues with data transmission put a halt to
any further recruitment. Various technical issues had been found relating to the operation of the
equipment which reduced confidence in the data and we felt it was difficult to recruit any more
participants without being able to show to the residents what data they would see and interact with.
With the first part of the project, we reached almost 1/3 of our target, mostly from people identified
as ‘pioneers’. In order for us to triple this number, clear benefits to the residents needed to be
promoted which was not possible without the data coming through to the web platform.
Website Development – www.smarthooky.net
The website development was originally the responsibility of E.ON/Central Networks. When WPD
bought Central Networks, following the acquisition, IT development was temporally delayed as the
project was re-assessed and aligned with WPD’s IT policy. It was subsequently agreed to utilise NEF’s

Smart Hooky – Final Report
Date: 31 January 2014
60
Appendix A – Smart Hooky Final Report - NEF
TH
IS IS
AN
UN
CO
NT
RO
LL
ED
DO
CU
ME
NT
, T
HE
RE
AD
ER
MU
ST
CO
NF
IRM
IT
S V
AL
IDIT
Y B
EF
OR
E U
SE
internal IT expertise to develop a web platform displaying the consumption data gathered by WPD
from the nodes and substations.
In October 2011, the website development was initiated by NEF to create the platform (shell) and
assess how the data would be transferred to the live server and which add-on tool would be most
appropriate for communicating the information simply and graphically to the residents, see Picture 4
below.
Picture 4: Illustration of data transfer process
We then set about creating new domain-names for the website and setup the framework of the website based on the Drupal7 CMS, ready for further development. Drupal already requires a MySQL database for its own use, within which we were able to add two new tables with fields to store incoming values from transmitted XML files. A customised Drupal module was written in PHP for the project. This handled two major areas relevant to the project success; importing readings from XML files and rendering data as charts. We later moved the entire developed solution over to a new virtual server with greater resources to allow for larger MySQL databases to store more data.
After trialling several potential charting libraries (Google API, Dygraphs, PChart and finally Fusion Charts), we eventually settled upon the latter. This was due largely to performance and ease of use, but also due to the many available charting formats.
WPD server
XML files every 15 mins
15 min Node readings
Database
Users
data
Users
FTP received by NEF
Script read
Website user profiles including graphs showing electricity consumption over time.

Smart Hooky – Final Report
Date: 31 January 2014
61
Appendix A – Smart Hooky Final Report - NEF
TH
IS IS
AN
UN
CO
NT
RO
LL
ED
DO
CU
ME
NT
, T
HE
RE
AD
ER
MU
ST
CO
NF
IRM
IT
S V
AL
IDIT
Y B
EF
OR
E U
SE
Picture 5: Illustration of a possible graph highlighting peak consumption in the village
A critical aspect of consumer charts was to ensure that there was restricted access to consumer chart data. This was achieved by integrating new fields into standard Drupal user profiles (eg node DSN#) to establish a link to the stored data, which also stores the DSN numbers. We also added several other fields to the user profile to allow consumers to supply additional details about their properties (number of rooms, heating type, loft-insulation depth etc.)
Data collection and analysis
Finally, in November 2012, after eight months of various technical issues, we had access to the
residents’ data, which we started to analyse
and link to the live server.
In order to trial the information provided on
the website, we decided to test the online
tool with a few participants first. In January
2013, we contacted all participants of the
project to give them an update and ask for
volunteers to test the data and provide
feedback. In February, the website was
launched and seven residents were
provided with login access to view their
personal data and feedback on the tool
itself and how it could be used to engage
with the residents and encourage
behaviour change.
Launch of website to all participants
In March 2013, we organised two community events to launch the website to all participants, explain
about the next phase of the project where there would be a more pro-active participation from the
residents and recruit further participation.
Comparison:With last day: + 5% L
With last week: + 1% K
With last month: - 0.5% KK
With last quarter: - 4% J
Current usage: 3567 kWh
Day Month Year Select:
Time
kWh
kWh kWh/house
Total Village Electricity Consumption
Peak consumption
Picture 6: Screen shot of typical website graphics

Smart Hooky – Final Report
Date: 31 January 2014
62
Appendix A – Smart Hooky Final Report - NEF
TH
IS IS
AN
UN
CO
NT
RO
LL
ED
DO
CU
ME
NT
, T
HE
RE
AD
ER
MU
ST
CO
NF
IRM
IT
S V
AL
IDIT
Y B
EF
OR
E U
SE
We felt it was important to meet up with all participants face to face to re-gain their interest in the
project, explain the technical challenges we faced and how they were able to use the data. In total,
about 20 residents attended the workshop, which was less than half of the total residents who had
signed up to the programme. We felt the low number was partly due to the drop in interest in the
project, since there had been no resident activity for a period of time. In general, only residents who
were very keen to see how new technology could help the village energy consumption attended.
As part as the community events, we held two workshops to engage with the participants. During the
first workshop, we asked participants to identify specific actions they could do at home in order to;
- Reduce consumption
- Reduce peak consumption
- Shift peak consumption
They also brainstormed how they could use the tool to help them with the above. The answers were
compiled at the second community event, where we asked the residents to vote for the actions they
were likely or definitely to do at peak time or all the time.
Picture 7: Actions
The outcomes of the workshops are in Annex 1. Whilst the exercise was very interesting, we felt that
it was difficult to draw major conclusions as there was not enough participation and we could not
therefore identify specific patterns of behaviour.
However, we noted that there were not as many votes for doing actions at peak time in comparison
to all the time. This shows that residents either didn't understand the purpose or found it too

Smart Hooky – Final Report
Date: 31 January 2014
63
Appendix A – Smart Hooky Final Report - NEF
TH
IS IS
AN
UN
CO
NT
RO
LL
ED
DO
CU
ME
NT
, T
HE
RE
AD
ER
MU
ST
CO
NF
IRM
IT
S V
AL
IDIT
Y B
EF
OR
E U
SE
complicated to change a habit specifically at peak time. This is very understandable as it is much
easier to change and adopt a new behaviour all the time rather than during a specific window of time
(say 7 to 9 am and 5 to 7 pm) and this is probably where technology can help best.
Further recruitment
A new recruitment phase was planned as we were aiming for another 100 installations, mostly by
promoting the project through similar methods as in Phase 1. However, further issues were found
within the residents’ data. Essentially the nodes weren’t communicating consistently resulting in
gaps in the data, which resulted in the online graphs showing large peaks or very low consumption.
Some residents had more reliable data, whilst others had very unreliable data including some
residents who had no data. As we couldn’t not promise to potential new participants whether they
would be able to see their data or not, and because there was no specific benefit for having more
nodes on the network from the perspective of trialling the technology, we decided that we would not
install any more nodes but instead engage with the existing participants.
3.3 Phase III: Community Engagement, active response to data received
By May 2013, six of the eleven substations had been fitted with monitoring and communication equipment and were relaying 15 minute data totals. Later in the month WPD brought Southside and Crofts lane substations on-line.
Substation Number Customers Monitored Status
11035 East End 07110350002 127 Monitored
11036 Southside 07110360008 69 Monitored
1771 Hook Norton 07017710002 94 Comms to commission 15/5
1804 Bourne La. 07018040000 166 Monitored
34117 Station Rd. 07341170000 67 Monitored
34174 Scotland End 07341740000 29 Comms to commission 15/5
88668 The Bourne 00886687012 92 Monitored
88719 Crofts La. 00887197019 15 Comms issue
88726 Down End 00887267017 66 Comms Issue
88851 Brewery La. 00888517017 20 No Monitor
88864 Knitting St. 00888647018 41 Monitored
89003 Southrop 00890037019 69 Comms to commission 15/5
Grand Total 855 Picture 8: Substation status
We were still concerned about the accuracy of the data being transmitted so in June we carried out a detailed review looking at the charts on the web and also the 'hard' data over a 31 day period. We were aware that the required number of daily readings should be 96 (ie 15 minute readings over a 24hr period). In fact we were receiving less than that with the best being 90% data accuracy.

Smart Hooky – Final Report
Date: 31 January 2014
64
Appendix A – Smart Hooky Final Report - NEF
TH
IS IS
AN
UN
CO
NT
RO
LL
ED
DO
CU
ME
NT
, T
HE
RE
AD
ER
MU
ST
CO
NF
IRM
IT
S V
AL
IDIT
Y B
EF
OR
E U
SE
In green: 25 nodes that appear to work OK (accuracy of data varies between 76% and 90%)
In purple: 2 nodes that appear to show accuracy between 89% and 90% but need to be verified as data may be wrong.
In yellow: 3 nodes where data accuracy was between 78% and 87% but with very high peaks.
In blue: 7 nodes with partial data (from 2% to 56%)
In red: 10 nodes with no data at all.
Picture 9: Node communication status
Throughout the summer, PLC issues continued resulting in lost data for all the participants with some nodes not connecting at all.
WPD sought to investigate the problems and concluded that the data accuracy issues were due to a number of issues, namely:
a general failure rate on the radio backhaul meaning a loss of between 5-8% of data depending on the site, with some sites having higher losses
loss of even more data due to a failure of the PLC communication system.
no data storage in the nodes, or in the substation monitors , so once data is lost it cannot be retrieved.
In view of the problems, in late summer 2013 it was agreed that any further engagement work should focus only on the substation data as this was proving to be relatively accurate and reliable. NEF developed an engagement plan to invite village residents to view the website to see how much electricity was being consumed and its cost, both at village level and substation level (Picture 10 below).
We created a supplementary postcode to Substation lookup tool using data supplied by WPD to enable visitors to easily locate which substation providing their energy. It was recognised that it might not be obvious to interested residents which substation supplied their electricity, so this tool neatly allowed searching by postcode, or even any section of the consumers address.

Smart Hooky – Final Report
Date: 31 January 2014
65
Appendix A – Smart Hooky Final Report - NEF
TH
IS IS
AN
UN
CO
NT
RO
LL
ED
DO
CU
ME
NT
, T
HE
RE
AD
ER
MU
ST
CO
NF
IRM
IT
S V
AL
IDIT
Y B
EF
OR
E U
SE
Picture 10: Substation electricity consumption and cost graph
An engagement event for September/October 2013 was developed called ‘Energy Saving Saturday’. The idea was to challenge residents to switch from energy use at peak times to off peak times, and to reduce their energy consumption overall. The incentive was a £10 donation from the Smart Hooky project to the village school for each £1 of electricity saved by the whole village against an ‘average’ Saturday usage.
Picture 11: Village Newsletter pages showing Energy Saving Saturday

Smart Hooky – Final Report
Date: 31 January 2014
66
Appendix A – Smart Hooky Final Report - NEF
TH
IS IS
AN
UN
CO
NT
RO
LL
ED
DO
CU
ME
NT
, T
HE
RE
AD
ER
MU
ST
CO
NF
IRM
IT
S V
AL
IDIT
Y B
EF
OR
E U
SE
Picture 12: Smart Hooky website: Energy Saving Saturday
Unfortunately, despite attempts by WPD to maintain the substation data reliability, there were unexpected problems with data communications from four of the substations. The decision was taken to abandon the engagement activity in September 2013, so the event did not take place as planned.

Smart Hooky – Final Report
Date: 31 January 2014
67
Appendix A – Smart Hooky Final Report - NEF
TH
IS IS
AN
UN
CO
NT
RO
LL
ED
DO
CU
ME
NT
, T
HE
RE
AD
ER
MU
ST
CO
NF
IRM
IT
S V
AL
IDIT
Y B
EF
OR
E U
SE
SUCCESSES AND ISSUES
4.1 Recruitment
Successes: We benefited from targeting an audience who were already engaged to a certain degree
through the Hook Norton Low Carbon Club and all the initiatives the Club was promoting within the
village. More than half of interested residents were members of the HNLC Club.
The village is also a very close community, very caring and fond of their village and the future of their
village. So any initiative that would involve the welfare of the village, would be welcomed by the
residents.
Issues: As we were trialling the technology on four selected areas, the wider community engagement
was limited making the recruitment process more difficult. Word of mouth, peer pressure,
promotion through the groups and clubs didn’t work as well as if the initiative covered the whole
village.
Also some people on the edge of the substations didn’t know in which sub-station they belonged to
and whether they could take part or not in the trial. Some may have assumed they were not eligible
to be included on the programme.
4.2 Communication with participants
Successes: Communication with the residents participating in the programme was done though
various means: e-mail (mass and individuals), news items on HNLC website, face-to-face at HNLC
meetings and some by phone. As long as the project was advancing well, we kept the residents
interested and engaged by inviting them to the meetings, replying to e-mails and talking to the HNLC
representatives in the village. Also being able to meet face-to-face with potential participants and
answer their queries added a lot of credibility and trust to the project.
Issues: Due to the problems with the data, there were very large gaps in communication where we
couldn’t say anything to the participants other than to apologise and say that we were experiencing
technical issues. To a certain degree, this was expected. However, after months of technical issues, it
was very disheartening for the few residents who were still actively engaged with the project.
It has been also noted that some customers were confused around the benefit they would receive
from participating and that we needed to provide better clarity around the question ‘what’s in it for
me?’
4.3 Data
Successes: For those residents who had good data, we presented their energy consumption in easy
to understand charts. The users could view their data in many different ways and could choose those
that were most meaningful to them. For example they could view their energy consumption per day,

Smart Hooky – Final Report
Date: 31 January 2014
68
Appendix A – Smart Hooky Final Report - NEF
TH
IS IS
AN
UN
CO
NT
RO
LL
ED
DO
CU
ME
NT
, T
HE
RE
AD
ER
MU
ST
CO
NF
IRM
IT
S V
AL
IDIT
Y B
EF
OR
E U
SE
per week, month or all to date and aggregated in 15min slots, hours, days, weeks or months as
preferred. They were also able to compare with the average data of the other participants.
Issues: There were a number of issues from a data/website perspective which are detailed below:
No memory on node to store readings, consequently the equipment couldn’t resend upon
connection failure & later service connection.
No line fault tolerance
Could not detect line or transmission errors
No local reading store meant that readings were lost & replaced by new
values
3Phase problem exacerbates 1-300m limit of PLC
Hops between nodes were possible to cover long distances – but only if on
the same phase and within PLC max reliable distance.
Monitoring could not differentiate between consumption and production, so a net gain
produced by solar panels would still be perceived as an energy draw from the network.
Therefore, hubs didn’t always add new readings to WPD’s readings data store;
Resulting in the readings data store not always having the latest readings
BUT every 15 minutes all node readings were packaged into an XML file and
FTP’d to NEF, regardless of whether they have already been sent or not
From NEF’s perspective, we could see 96 XML files being transmitted each
day and assumed therefore that this represented a complete set of readings
for all connected properties.
Each XML file contained an entry for each node.
However, it was difficult to spot that in cases of line failure, the readings
were the same as previously sent readings.
The import script on the WWW server ran every 5 minutes to check for
incoming XML files, parsing their data into the database.
However, by design, a duplicate entry check prevents identical node
readings being added for the same node, date+time & readings…
Finally, there was a slight difference between the date used for the readings
– for consumer data, the value used was that set against the node data.
However for substation data, the date+time used was from the creation of
the XML file itself.
This subtle difference meant that, for substations, even when the readings
were identical, their values were still entered into the database, since the
date+time value had moved on to that from the next XML file.
This ultimately led to the missing data issue being highlighted from visible
‘flat-lines’ in the charted substation data. Investigations into why similar flat-

Smart Hooky – Final Report
Date: 31 January 2014
69
Appendix A – Smart Hooky Final Report - NEF
TH
IS IS
AN
UN
CO
NT
RO
LL
ED
DO
CU
ME
NT
, T
HE
RE
AD
ER
MU
ST
CO
NF
IRM
IT
S V
AL
IDIT
Y B
EF
OR
E U
SE
lines were not seen in consumer charts led to the discovery of missing
readings in the database.
Initially confusing (the readings in the XML files all added up to 96/day [every
15 minutes = 4*24]), a custom query to count the number of readings per
day per node led to the realisation that missing readings were widespread –
even amongst nodes previously considered to be producing realistic
readings.
Evidence / User Engagement
Looking back, one of the early adoption testers had raised the issue that
daily averages for his property did not match the readings obtained by his
own, in-house meter, whose readings were much higher than those
indicated by Charts from our dataset. After initial engagement, the
discrepancy could not be resolved satisfactorily and the property was added
to the list to be investigated.
Production of spreadsheets to count readings each day, grouped by node, ordered by node
and date. Node ordering showed that even the best properties rarely sent back over 90
readings a day, with the ‘average best’ being much lower, around 80. Alarmingly, many
other properties sent back much less, down to zero readings per day. Ordering by date+time
revealed odd periods when all readings would slump a little before raising again.
This led to the final conclusion that there were factors influencing data transmission en masse
across the whole village in addition to more localised transmission failures of individual nodes.
4.4 Website traffic
Issues: Recognising that HN is a small village of around 850+ residents, NEF never imagined a large web audience from the outset. One or two daily visits per member dropping to 1 or 2 per week being more realistic with the passing of time as members became accustomed to their energy data.
The nature of the site at conception was of a closed, members-only site; due to the need for consumer data confidentiality. Phase1 village engagement recruited around 50 members, of which around 10 were invited to participate in an initial ‘pre-launch’ testing period. At this point in time, the project team was aware that certain nodes were not transmitting data, but did not then know the full scale of the problem.
The launch events in mid-March were intended to provide all members with their login details, explaining that only around 30 had any data worthy of useful analysis. Member activity at this period peaked, but can be seen to be well below par compared to early expectation. As detailed elsewhere in this report, it became increasingly evident following the user engagements that the data problem was considerably more widespread than anticipated. As it transpired, even previously established ‘good’ nodes were, in fact, missing around 10% of the daily readings; with the rest missing even more.

Smart Hooky – Final Report
Date: 31 January 2014
70
Appendix A – Smart Hooky Final Report - NEF
TH
IS IS
AN
UN
CO
NT
RO
LL
ED
DO
CU
ME
NT
, T
HE
RE
AD
ER
MU
ST
CO
NF
IRM
IT
S V
AL
IDIT
Y B
EF
OR
E U
SE
Our focus changed herein from that of further member engagement and data presentation to that of investigating the underlying issues behind the missing data (see Data Issues above for more information).
Perhaps not surprisingly, daily visits fell into decline from a reasonably promising start, rarely reaching double figures, which even then tended to be around the pre-planned launch events or newsletters.
4.5 Project management
Successes: The project benefitted from having a strong management group headed by technical
experts and supported by a charitable organisation and a local group. This combination provided the
best partnership to provide credibility of the project and engage with the residents at various levels
(technical, local, not for profit).
Issues: In June 2011, Central Networks was bought by Western Power Distribution. This meant that
there were changes in management which we had to accommodate and which slowed down the
project. For example the website development wasn’t supported by WPD and was therefore passed
onto NEF.
05
10152025303540
Total Unique Visitors by Week

Smart Hooky – Final Report
Date: 31 January 2014
71
Appendix A – Smart Hooky Final Report - NEF
TH
IS IS
AN
UN
CO
NT
RO
LL
ED
DO
CU
ME
NT
, T
HE
RE
AD
ER
MU
ST
CO
NF
IRM
IT
S V
AL
IDIT
Y B
EF
OR
E U
SE
LESSONS LEARNT
One of the main lessons we learnt from this project is about communication and how important it is
to communicate clearly the possible outcomes of the project to the residents. At no point during the
initial stages of the project had we anticipated that the technology would not work or not work
properly enough for us to engage with the participants. So we did not have a Plan B in case we could
not use the technology. As a result, although the participants knew the project was a trial, we
created expectations (several times) with the participants but could not meet them. This resulted in
the participants loosing trust in the project and this experience may have a detrimental effect on all
other projects of this nature for the village.
The other lessons learnt from an engagement point of view are as follows:
Choose a ‘warm’ audience, already pro-active in the issues the project will tackle.
Participants to a programme will be more proactive if there is a sense of belonging within
the group (it could be geographical like a village, but also about common interest, such a
sport or religion).
When a project is a trial, ensure the participants are aware the technology may not work in
which case, ensure there is a ‘plan B’.
Communication needs to be consistent, as people will loose trust in the programme and
drop out.
Interest in any new projects always fades after the first few months of excitement; this is
where the project managers need to have some incentives and fun engagement strategies
to keep people’s interest.
It’s important to have a ‘presence’ in the targeted area; champions/supporters (whether
within a defined entity like HNLC or not) that are at ground level and that can talk to their
peers.
Similarly, having outside technical and non-technical speakers who can make contact
individually with the participants either by phone or even better face-to-face gives a sense
of trust to the residents.
Highlight the not for profit aspect of the project and participants.
Lessons learnt from a Data/IT perspective
Challenge of data size & irregular reading timestamps
Readings taken every 15 minutes, across a number of sources, quickly add up to a sizeable amount.
Eg, across even a small sample size of 30 sources adds around 86,000 new database records every

Smart Hooky – Final Report
Date: 31 January 2014
72
Appendix A – Smart Hooky Final Report - NEF
TH
IS IS
AN
UN
CO
NT
RO
LL
ED
DO
CU
ME
NT
, T
HE
RE
AD
ER
MU
ST
CO
NF
IRM
IT
S V
AL
IDIT
Y B
EF
OR
E U
SE
month. Querying such a large dataset takes time – which is further slowed by the need to order and
group by ‘un-even’ dates & times.
For example, readings have exact date+time stamps stored – but these present challenges when
grouping by node or across nodes resulting in slower, complex queries. So although one node may
produce data at intervals of 9:00, 9:15, 9:30, 9:45, 10:00; another could easily be out of sync by
several minutes – 9:09, 9:24, 9:39, 9:54, 10:09. To make comparisons possible, readings had to be
grouped into 4 time ‘buckets’ every hour – eg first 15 minutes, 2nd 15 minutes and so on.
Confusingly, this meant that, for example, any reading of 9:14 would be compared not with the 9:15
set of readings, but the 9:00 readings!
Custom code takes time to write
An early development oversight led to the belief that existing Drupal modules could be utilised, or re-
used with readily available chart packages handling manipulating and presenting the data without
resorting to hand-coding custom routines. Many problems emerged and were overcame to bring
the site to a stage where readings stored in separate database tables were available for Drupal code
to use, without being merged in with other Drupal centric datasets. The final approach taken was
the production of a custom Drupal module to handle the data importing and later chart production,
all with tailored PHP code.
Backup strategies for mitigating circumstances
Successful data transmission assumes there will be problems at each point in the chain, and it is the
method of resolution that determines overall resilience and reliability. Retrospectively, it’s easy to
see that, with so many stages in the pipeline between nodes and the final charts on the web portal,
reliable transmission should be paramount. However the enthusiasm of partners in the trial
encouraged a pioneering ‘forge ahead’ mentality. The fact that this was a trial meant that many
encountered problems were new to partners and indeed background industries as a whole. There
weren’t backup strategies in many cases because it was a big enough challenge getting equipment
and technologies to work in the first place, let alone available resources to develop alternative
solutions for contingency. Similarly, individual components tested well in isolation under good
conditions.
Critical learning from the project would see future trials undertake end-to-end, group testing under
adverse conditions to aid the establishment of suitable backup strategies to cope with discovered
issues and problems. How could this tool be used further?
The tool developed is based upon a solid, modern CMS system (Drupal7), with use of a major
charting package (Flash Fusion Charts). The site itself; along with related readings database, is
hosted upon a good quality virtual server, with plenty of room for growth. The domain names of
smart-hooky.net, smart-hooky.org.uk and smart-hooky.co.uk are currently valid to 5th October 2015.
After disabling consumer chart views, the site still presents incoming data from several substations,
however, as has been detailed, the data flow is neither complete or can be fully trusted, hence
current charts are merely indicative in the loosest sense of portraying actual overall village energy
consumption.

Smart Hooky – Final Report
Date: 31 January 2014
73
Appendix A – Smart Hooky Final Report - NEF
TH
IS IS
AN
UN
CO
NT
RO
LL
ED
DO
CU
ME
NT
, T
HE
RE
AD
ER
MU
ST
CO
NF
IRM
IT
S V
AL
IDIT
Y B
EF
OR
E U
SE
However, if the issues behind the data problem were solved, with many of the identified lessons
learned being considered and addressed, there is no reason to doubt that the tool can still be used to
present collected data in useful and interesting ways.

Smart Hooky – Final Report
Date: 31 January 2014
74
Appendix A – Smart Hooky Final Report - NEF
TH
IS IS
AN
UN
CO
NT
RO
LL
ED
DO
CU
ME
NT
, T
HE
RE
AD
ER
MU
ST
CO
NF
IRM
IT
S V
AL
IDIT
Y B
EF
OR
E U
SE
CONCLUSIONS
Customer engagement
In terms of the recruitment process, we used various techniques to gather interest. These are summarised below with how successful each technique was:
Technique used Success/Issues Rating
E-mail to HNLC members by
the Club and presentations at
meetings
The fact that we had an active group on site facilitated
greatly the registration of interest.
*****
Taking names at event
proactively + referral
The face to face interaction of getting people to register
their interest plus asking “do you know anyone here who
would be interested” then approaching those people with a
‘referral’ was very successful to get names.
****
Door to door knocking This technique takes time but similarly with the above,
when people are face to face with someone, they are more
likely to listen, understand and then take action.
***
Leaflets drop off This provided background information to the residents
about the project. These worked well in conjunction with
the HNLC meetings.
***
Article in the newsletter
Blogs on the websites
This was useful to keep all the residents of the village
informed about the project but not necessarily to recruit
new participants.
**
PR in the press
This essentially provided credibility and status of the
project but didn’t necessarily help to recruit participants.
*
Facebook, forums Updates on social media websites helped to invite
residents to the HNLC meetings to hear about the project
not to recruit directly.
Prizes It’s difficult to say how much the prizes helped to recruit
participants as an incentive. However, it provides good
‘stories’ to publish and keep in touch with the participants.
For phase 1, the pro-active approaches or through already engaged groups are by far the most successful ways to recruit participants. In the first instance, people were just expressing their interest, not signing up to the project. When we asked the interested participants to sign up, we had only a few who did not reply. We believe this is because we were in constant communication with the residents and kept them informed about the project, so by the time we asked them to sign up, no one was reluctant.
In phase 2, we were trying to get people to sign up directly. Retrospectively, this is more difficult than to just gather interest because it doesn’t give residents a chance to reflect about the project. However, it could also have been caused by the fact that we couldn’t demonstrate to them what they could do with the data since we had issues with the technology.
In phase 3, we were going to recruit further participants through word of mouth by contacting various groups within the village (church, schools, sports and hobby clubs, etc.), which we believe would have worked well provided we could demonstrate clear benefits of the programme for the

Smart Hooky – Final Report
Date: 31 January 2014
75
Appendix A – Smart Hooky Final Report - NEF
TH
IS IS
AN
UN
CO
NT
RO
LL
ED
DO
CU
ME
NT
, T
HE
RE
AD
ER
MU
ST
CO
NF
IRM
IT
S V
AL
IDIT
Y B
EF
OR
E U
SE
residents through the data on the web portal. The only issue here would have been to target residents within the four selected areas.
The main barriers to get further participation were two-fold:
- The four targeted areas limited the promotional and engagement activities.
- The ‘what’s in it for me’ factor was not strong enough, since we had no product to demonstrate the benefits of the technology.
If a similar project was to be carried out again, we would have developed another way to engage with the community should the equipment fail to provide us with the data we needed.
Our main lesson in this project is how constant communication is critical to keeping participants interested and involved in the project.
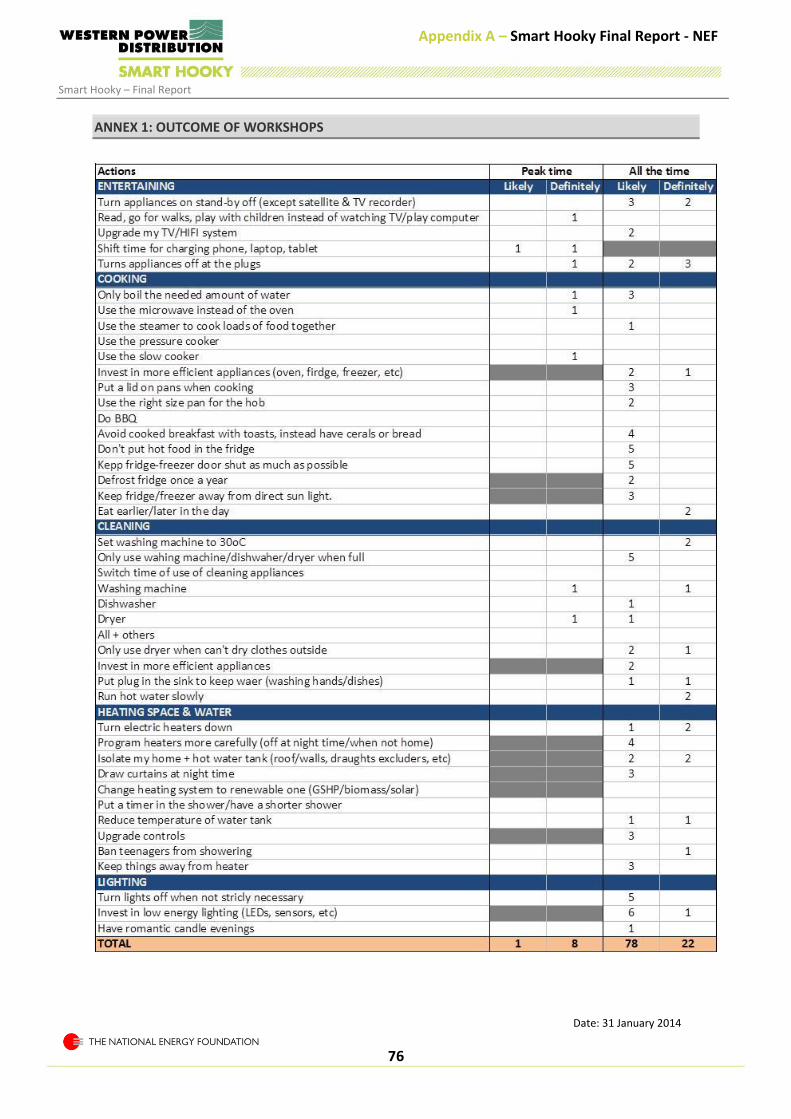
Smart Hooky – Final Report
Date: 31 January 2014
76
Appendix A – Smart Hooky Final Report - NEF
TH
IS IS
AN
UN
CO
NT
RO
LL
ED
DO
CU
ME
NT
, T
HE
RE
AD
ER
MU
ST
CO
NF
IRM
IT
S V
AL
IDIT
Y B
EF
OR
E U
SE
ANNEX 1: OUTCOME OF WORKSHOPS

[© AND Technology Research Ltd || www.andtr.com || January 2014]
77
Appendix B – Technical Insert – AND Technology
TH
IS IS
AN
UN
CO
NT
RO
LL
ED
DO
CU
ME
NT
, T
HE
RE
AD
ER
MU
ST
CO
NF
IRM
IT
S V
AL
IDIT
Y B
EF
OR
E U
SE
12. Appendix B - Technical Insert for Ofgem LCNF Report – AND Technology
Technical Insert for Ofgem LCNF Report
‘Smart Hooky’trial
History
Smart Hooky - Tech Insert For Ofgem LCNF Report - Issue 3
December 2013
□ Section ‘1.2 | Analysis findings - key points’ added.
□ Section ‘5 | Node anomalies’ added.
□ Section ‘2.1 | DNP3 interface’ added.
□ Section ‘2 | Network coverage’ updated.
□ Section ‘1.1 | Analysis view-point’ added.
Smart Hooky - Tech Insert For Ofgem LCNF Report - Issue 2
May 2012
□ Section ‘6 | Future’.
□ Scope plot added of message being received by the Station Road Smart Hub in section ‘4 | Quality of service’.
□ Scope plot added of message being sent from the Station Road Smart Hub in section ‘4 | Quality of service’.
Smart Hooky - Tech Insert For Ofgem LCNF Report - Issue 1
May 2012
□ First issue.
Contents
1 | Introduction .................................................................................................................
1.1 | Analysis view-point ..................................................................................................
1.2 | Analysis findings - key points ..................................................................................
2 | Network coverage .....................................................................................................
2.1 | DNP3 interface.........................................................................................................
3 | Network topology & configuration ...........................................................................
4 | Quality of service ........................................................................................................
5 | Node anomalies .........................................................................................................
5.1 | Investigated .............................................................................................................
5.2 | Ongoing ....................................................................................................................
6 | Future ...........................................................................................................................

[© AND Technology Research Ltd || www.andtr.com || January 2014]
78
Appendix B – Technical Insert – AND Technology
TH
IS IS
AN
UN
CO
NT
RO
LL
ED
DO
CU
ME
NT
, T
HE
RE
AD
ER
MU
ST
CO
NF
IRM
IT
S V
AL
IDIT
Y B
EF
OR
E U
SE
1 | Introduction
The ‘Smart Hooky’ Smart Hubs & Nodes are built upon technology from AND Technology
Research (AND) & communicate via narrowband Power Line Communication (PLC),
employing Differential Code Shift Keying (DCSK) modulation. DCSK is designed to cope with
characteristic power line phenomena, such as spectral distortion, harmonic interference,
attenuation, etc. & has proven to be robust in field trials outside of the UK.
To relay data back to Western Power Distribution (WPD) & National Energy Foundation (NEF),
the Smart Hubs have an RJ45 Ethernet socket which is used to serve data back via the
backhaul communications link using Distributed Network Protocol 3 (DNP3).
1.1 | Analysis view-point
ANDs role in the initiative was to support WPD with the “At-scale Power Line Communication”
aim of the project. Therefore the findings in this technical insert are based upon data &
measurements taken directly in-the-field from deployed Smart Node & Hub equipment.
Figure 1 below illustrates a typical installation & where data/measurements were taken.
Figure 1 | Overview of PLC network & areas where AND accessed data & measurements
While remotely logged information provided by WPD & NEF has been considered, this data
will have travelled through the substations’ Remote Terminal Unit (RTU), Radio Communication
modems & various backhaul SCADA /database systems before reaching WPD/NEF. As such it
Smart Hubs (located in
substations) were
accessed on-site using
laptop PC
Smart Hubs (located in
properties) were accessed
on-site using laptop PC
Portable
Oscilloscope used
to measure QoS

[© AND Technology Research Ltd || www.andtr.com || January 2014]
79
Appendix B – Technical Insert – AND Technology
TH
IS IS
AN
UN
CO
NT
RO
LL
ED
DO
CU
ME
NT
, T
HE
RE
AD
ER
MU
ST
CO
NF
IRM
IT
S V
AL
IDIT
Y B
EF
OR
E U
SE
is therefore subject to the individual processing/handling characteristics of each of these
types of system.
1.2 | Analysis findings - key points
Detailed in this section are the findings by AND to date:
i. Of the 39 nodes installed into East End, Station Road or Bourne Lane ‘Smart Zones’ 36
achieved full bi-directional communication with their associating Smart Hub [see
section ‘2 | Network coverage’].
ii. Robust & reliable, point-to point, bi-directional communications was achieved over a
distance of 275 meters utilising the village’s Low Voltage electrical network [see
section ‘2 | Network coverage’].
iii. The smart hub successfully communicated back to WPD’s SCADA (Supervisory Control
And Data Acquisition)-based backhaul communication systems using DNP3 [see
section ‘2.1 | DNP3 interface’].
iv. The smart hub & nodes installed had automatically reconfigured themselves for
optimum communication quality, while trying to maintain lowest network traffic levels
[see section ‘3 | Network topology & configuration’].
v. The PLC technology was able operate comfortably on the existing LV electrical
network infrastructure powered by East End, Station Road or Bourne Lane substations
& that the noise floor generated by the existing electrical supply equipment does not
impede the operation of the Smart Hub & Nodes [see section ‘4 | Quality of service’].
vi. The smart hub & nodes have been seen to self-heal when either new Smart Nodes
have been added to the network or when an improved communications path had
been identified [see section ‘4 | Quality of service’].
vii. The hub was able to detect an Imposter node when it was added to the PLC network
[see section ‘4 | Quality of service’].
viii. An assembly defect in one of the nodes, was remotely identified & fixed on-site [see
section ‘5.1 | Investigated’].
ix. Data received remotely from two nodes that appeared to indicate two separate
houses had incorrect higher than expected & lower than expected current
consumption was in fact correct [see section ‘5.1 | Investigated’].
x. 3 nodes have never established communication with their respective hubs. In two of
the cases this believed to be a result of being beyond the PLC signal distance of
another node or the Hub. AND have recommended further testing & possible
installation of additional nodes or repeaters [see section ‘5.2 | Ongoing’].
xi. Data received remotely from Hook Norton & logged by WPD/NEF shows varying
success rates for node data being received correctly. While some of this data
corresponds to what has been recorded in the field by AND, other anomalies, that
have been attributed to PLC communications issues appear to in fact be as a result of
backhaul configuration & equipment & not PLC performance [see section ‘5.2 |
Ongoing’].

[© AND Technology Research Ltd || www.andtr.com || January 2014]
80
Appendix B – Technical Insert – AND Technology
TH
IS IS
AN
UN
CO
NT
RO
LL
ED
DO
CU
ME
NT
, T
HE
RE
AD
ER
MU
ST
CO
NF
IRM
IT
S V
AL
IDIT
Y B
EF
OR
E U
SE
2 | Network coverage
Initially Smart Hubs were fitted to the East End, Station Road & Bourne Lane Substations, while
Smart Nodes were installed into volunteer property’s that are supplied by one of these
substations.
Of the 39 nodes installed into properties connected to either the; East End, Station Road or
Bourne Lane substations, 36 achieved full bi-directional communication with their associating
Smart Hub.
Smart Zone Nodes Installed Communicating Not communicating
East End
21
19
13138
13159
Station Road
1
1
N/A
Bourne Lane
17
16
13121
Note: 40 node installations had actually taken place. However, it was later discovered the property where node
13120 was installed did not have a direct electrical connection to a Smart Hub-enabled substation in the Station
Road smart zone - the candidate property is believed to be connected to an entirely different substation altogether.
In addition robust & reliable, point-to point, bi-directional communications was achieved
over a distance of 275 meters utilising the village’s Low Voltage electrical network & the
Smart Hub (installed in the East End Substation) & Smart Node (installed in a residential
property served by the East End substation) PLC communications equipment. However, as
later sections of this report describe, point-to-point distance performance is not necessarily
critical to the system’s operation as the Smart Hub & Node system deploys dynamic network
technology.
A fourth batch of 8 nodes was also installed in Southrop ‘Smart Zone’, which were later joined
by a Hub that was installed onto the Southrop pole-mounted transformer. Unfortunately AND
did not have access to the Southrop Smart Hub to verify the number of nodes successful
achieving bi-directional communication with this unit.
2.1 | DNP3 interface
To enable the Smart Hubs to communicate back to WPD, the Hubs are fitted with an RJ45
port that outputs data, received/generated by the Hub, in DNP3 (Distributed Network
Protocol) format; this data can then be directly fed into WPD’s SCADA (Supervisory Control
And Data Acquisition)-based backhaul communication systems.
A simple ‘Data Definition’ document was defined by AND, detailing the Hub outputs & inputs,
so that WPD’s backhaul communication systems could be configured to connect to the
Hubs. This later grew to include a DNP Input/Output (I/O) map & a Schneider RTU DNP I/O
map in order to accommodate the backhaul communication architecture that had been
selected.

[© AND Technology Research Ltd || www.andtr.com || January 2014]
81
Appendix B – Technical Insert – AND Technology
TH
IS IS
AN
UN
CO
NT
RO
LL
ED
DO
CU
ME
NT
, T
HE
RE
AD
ER
MU
ST
CO
NF
IRM
IT
S V
AL
IDIT
Y B
EF
OR
E U
SE
Both I/O maps are used to reference each input & output for up to 64 nodes to unique
addresses, this allowed the Schneider RTU to collate data from the hub & other assets being
monitored at the Substation & send it to the radio modem ready for transmission into WPD’s
backhaul systems.
Figure 2 | Screen shot of the DNP I/O map (left) & the DNP I/O map for the Schneider RTU from the ‘2286 Data
Definition Smart Hooky Trial’ document.
3 | Network topology & configuration
Each network (or Smart Zone) with a Smart Hub fitted at the Substation was configured with a
Tree network topology – whereby the Smart Hub is the central root node (the top level of the
hierarchy) & the Smart Nodes (installed in properties with an electrical connection to the
substation) are connected via a point-to-point link to appropriate levels below that (see
‘Figure 3’).
I.
II.
III.
IV.
V.
VI.
VII.
VIII.
IX.
X.
XI.
XII.
XIII.
XIV.
XV.
XVI.
XVII.
XVIII.
XIX.
Figure 3 | Network topology showing Smart Nodes connected to Smart Hub at different levels
Smart Hub
0x0001
Smart Node
0x0101
Smart Node
0x0103
Smart Node
0x0202
Smart Node
0x0102
Smart Node
0x0201
Level 0
Level 1
Level 2

[© AND Technology Research Ltd || www.andtr.com || January 2014]
82
Appendix B – Technical Insert – AND Technology
TH
IS IS
AN
UN
CO
NT
RO
LL
ED
DO
CU
ME
NT
, T
HE
RE
AD
ER
MU
ST
CO
NF
IRM
IT
S V
AL
IDIT
Y B
EF
OR
E U
SE
The networking layer technology deployed in both the Smart Hub & Node enabled the East
End, Station Road & Bourne Lane networks to self-form, thus no on-site manual configuration
of the network was required.
From trials & on-site testing, it was demonstrated that the installed systems had automatically
configured themselves for optimum communication quality, while trying to maintain lowest
network traffic levels. This was seen in terms of both being able to communicate bi-
directionally with all of the installed Smart Nodes on the network & also by the automatically
assigned network addresses - indicating network configuration level.
Figure 4 below shows data being reported back from a 4th network level Smart node, after
receiving an ‘Instantaneous Reading’ command from the Smart Hub.
Figure 4 | East End Terminal Emulation Application log highlighting a 4th network level (0x0401) Smart node (13166)
sending back data after receiving a command [18/05/2012]
[Note: UTC time not configured. Voltage & Power factor assumed, not currently being measured]
Figure 5 below shows how individual Smart Nodes have automatically been assigned network
address & levels according to their location on the Low Voltage (LV) electrical network & the
optimum communication quality path back to the Smart Hub installed in the East End
Substation.
Note: Only some of the nodes installed in the East End Smart Zone have been mapped onto
the WPD network map in order to highlight likely communication paths between the Smart
Node & Smart Hub.

[© AND Technology Research Ltd || www.andtr.com || Page 83 of 93 || January 2014]
Appendix B – Technical Insert – AND Technology
Figure 5 | East End Smart Node location & network address assignment according to location on LV network & optimum communications path back to the Smart Hub
Level 4
Smart Node 13166
Network address 0x0401
[18/05/2012]
Level 3
Smart Node 13152
Network address 0x0301
[18/05/2012]
Level 2
Smart Node 13164
Network address 0x0204
[18/05/2012]
Level 1
Smart Node 13139
Network address 0x0108
[18/05/2012]
Level 1
Smart Node 13127
Network address 0x0104
[18/05/2012]
Level 1
Smart Node 13146
Network address 0x0105
[18/05/2012]
Level 2
Smart Node 13105
Network address 0x0201
[18/05/2012]
Substation

[© AND Technology Research Ltd || www.andtr.com || Page 84 of 93 || January 2014]
84
Appendix B – Technical Insert – AND Technology
TH
IS IS
AN
UN
CO
NT
RO
LL
ED
DO
CU
ME
NT
, T
HE
RE
AD
ER
MU
ST
CO
NF
IRM
IT
S V
AL
IDIT
Y B
EF
OR
E U
SE
During the various on-site tests, as anticipated, the networks at each of the Substation sites
reconfigured as new Smart nodes were added. This was recorded in the different network
address being assigned to existing nodes on different visits to Hook Norton.
4 | Quality of service
As discussed earlier in the report, from the trial it can be seen that bi-directional
communication between the Smart Hub & all installed Smart Nodes (connected by the
electrical LV network to Smart Hub-enabled Substations) is reliably being achieved.
From on-site trials & testing it was seen that the system is able to operate comfortably on the
existing LV electrical network infrastructure powered by East End, Station Road or Bourne
Lane substations & that the noise floor generated by the existing electrical supply equipment
does not impede the operation of the Smart Hub & Nodes (see ‘Figures 6 - 14’).
Figure 6 | Scope plot of the electrical noise floor at the East End Substation [15/03/2012]
Figure 7 | Scope plot of a message being sent (Tx) from the East End Smart Hub [15/03/2012]

[© AND Technology Research Ltd || www.andtr.com || Page 85 of 93 || January 2014]
85
Appendix B – Technical Insert – AND Technology
TH
IS IS
AN
UN
CO
NT
RO
LL
ED
DO
CU
ME
NT
, T
HE
RE
AD
ER
MU
ST
CO
NF
IRM
IT
S V
AL
IDIT
Y B
EF
OR
E U
SE
Figure 8 | Scope plot of a message being received (Rx) by the East End Smart Hub from a Test Smart Node
[15/03/2012]
Figure 9 | Scope plot of the electrical noise floor at the Bourne Lane Substation [15/03/2012]

[© AND Technology Research Ltd || www.andtr.com || Page 86 of 93 || January 2014]
86
Appendix B – Technical Insert – AND Technology
TH
IS IS
AN
UN
CO
NT
RO
LL
ED
DO
CU
ME
NT
, T
HE
RE
AD
ER
MU
ST
CO
NF
IRM
IT
S V
AL
IDIT
Y B
EF
OR
E U
SE
Figure 10 | Scope plot of a message being sent (Tx) from the Bourne Lane Smart Hub [15/03/2012]
Figure 11 | Scope plot of a message being received (Rx) by the Bourne Lane Smart Hub from Smart Node 13169
installed in a property [15/03/2012]

[© AND Technology Research Ltd || www.andtr.com || Page 87 of 93 || January 2014]
87
Appendix B – Technical Insert – AND Technology
TH
IS IS
AN
UN
CO
NT
RO
LL
ED
DO
CU
ME
NT
, T
HE
RE
AD
ER
MU
ST
CO
NF
IRM
IT
S V
AL
IDIT
Y B
EF
OR
E U
SE
Figure 12 | Scope plot of the electrical noise floor at the Station Road Substation [15/03/2012]
Figure 13 | Scope plot of a message being sent (Tx) from the Station Road Smart Hub [15/03/2012]

[© AND Technology Research Ltd || www.andtr.com || Page 88 of 93 || January 2014]
88
Appendix B – Technical Insert – AND Technology
TH
IS IS
AN
UN
CO
NT
RO
LL
ED
DO
CU
ME
NT
, T
HE
RE
AD
ER
MU
ST
CO
NF
IRM
IT
S V
AL
IDIT
Y B
EF
OR
E U
SE
Figure 14 | Scope plot of a message being received (Rx) by the Station Road Smart Hub from a Test Smart Node
[15/03/2012]
In-built functionality within the Smart Hub & Nodes also enabled individual line quality checks
to be made between the Hub & specific Smart Nodes. During testing, no packets were seen
to be dropped in both directions.
The networks in each of the Smart Zones have been seen to self-heal when either new Smart
Nodes have been added to the network or when an improved communications path has
been identified by the system & the nodes have changed the network address/configuration
accordingly.
To aid in security & maintain QoS within the network, each of the Smart Node’s has a unique
ID assigned to it. Therefore when a cloned Node was added to the network with a
duplicated Smart Node ID to an existing node already installed on the network, the Smart
Hub correctly detected & identified the Clone node as an imposter (see ‘Figure 15’).
Figure 15 | Station Road Terminal Emulation Application log highlighting detection of an imposter node on the
network.
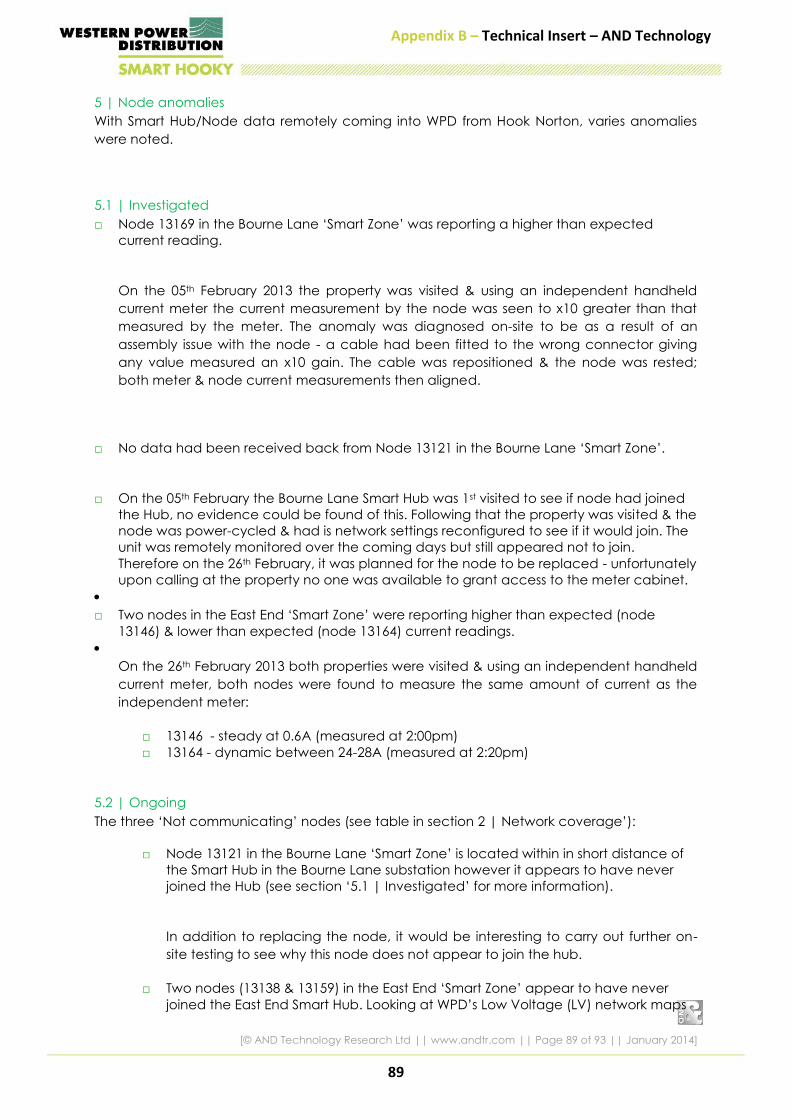
[© AND Technology Research Ltd || www.andtr.com || Page 89 of 93 || January 2014]
89
Appendix B – Technical Insert – AND Technology
TH
IS IS
AN
UN
CO
NT
RO
LL
ED
DO
CU
ME
NT
, T
HE
RE
AD
ER
MU
ST
CO
NF
IRM
IT
S V
AL
IDIT
Y B
EF
OR
E U
SE
5 | Node anomalies
With Smart Hub/Node data remotely coming into WPD from Hook Norton, varies anomalies
were noted.
5.1 | Investigated
□ Node 13169 in the Bourne Lane ‘Smart Zone’ was reporting a higher than expected
current reading.
On the 05th February 2013 the property was visited & using an independent handheld
current meter the current measurement by the node was seen to x10 greater than that
measured by the meter. The anomaly was diagnosed on-site to be as a result of an
assembly issue with the node - a cable had been fitted to the wrong connector giving
any value measured an x10 gain. The cable was repositioned & the node was rested;
both meter & node current measurements then aligned.
□ No data had been received back from Node 13121 in the Bourne Lane ‘Smart Zone’.
□ On the 05th February the Bourne Lane Smart Hub was 1st visited to see if node had joined
the Hub, no evidence could be found of this. Following that the property was visited & the
node was power-cycled & had is network settings reconfigured to see if it would join. The
unit was remotely monitored over the coming days but still appeared not to join.
Therefore on the 26th February, it was planned for the node to be replaced - unfortunately
upon calling at the property no one was available to grant access to the meter cabinet.
□ Two nodes in the East End ‘Smart Zone’ were reporting higher than expected (node
13146) & lower than expected (node 13164) current readings.
On the 26th February 2013 both properties were visited & using an independent handheld
current meter, both nodes were found to measure the same amount of current as the
independent meter:
□ 13146 - steady at 0.6A (measured at 2:00pm)
□ 13164 - dynamic between 24-28A (measured at 2:20pm)
5.2 | Ongoing
The three ‘Not communicating’ nodes (see table in section 2 | Network coverage’):
□ Node 13121 in the Bourne Lane ‘Smart Zone’ is located within in short distance of
the Smart Hub in the Bourne Lane substation however it appears to have never
joined the Hub (see section ‘5.1 | Investigated’ for more information).
In addition to replacing the node, it would be interesting to carry out further on-
site testing to see why this node does not appear to join the hub.
□ Two nodes (13138 & 13159) in the East End ‘Smart Zone’ appear to have never
joined the East End Smart Hub. Looking at WPD’s Low Voltage (LV) network maps

[© AND Technology Research Ltd || www.andtr.com || Page 90 of 93 || January 2014]
90
Appendix B – Technical Insert – AND Technology
TH
IS IS
AN
UN
CO
NT
RO
LL
ED
DO
CU
ME
NT
, T
HE
RE
AD
ER
MU
ST
CO
NF
IRM
IT
S V
AL
IDIT
Y B
EF
OR
E U
SE
of the area, this could be a result of the nodes being beyond the PLC signal
distance of another node or the Hub.
AND recommended that adding more nodes or repeaters to the Smart Zone
could rectify the issue, however, before committing to that it would be sensible to
carrying out some PLC signal tests between the affected nodes & hub.
Unfortunately there has not been an opportunity to carry out this further
investigation.
□ Remotely received data from Hook Norton, logged by WPD/NEF, appears to show data
successfully received from nodes varies. While the majority of nodes appear to have an
80%+ success rate the remainder are below this.
Until recently this has been attributed to PLC communications issue, however from a
recent preliminary review of this data by AND some of these data anomalies could in fact
be as a result of the backhaul configuration & equipment.
AND would therefore recommend, possibly in a new phase of work, further analysis of this
data alongside collection of data in the field.
6 | Future
The technology ‘blocks’ from AND, that the Smart Hub & Nodes are based upon, are being
developed to include new features & functionality to enable further integration into the Smart
Grid/Electrical Asset Monitoring fields & to provide increased quality of service & demand
management monitoring capabilities.
Along with these extra capabilities & increased functionality, additional data security features
are being added.

91
Appendix C – Change Mandates
TH
IS IS
AN
UN
CO
NT
RO
LL
ED
DO
CU
ME
NT
, T
HE
RE
AD
ER
MU
ST
CO
NF
IRM
IT
S V
AL
IDIT
Y B
EF
OR
E U
SE
13. Appendix C – Project Change Mandates

92
Appendix C – Change Mandates
TH
IS IS
AN
UN
CO
NT
RO
LL
ED
DO
CU
ME
NT
, T
HE
RE
AD
ER
MU
ST
CO
NF
IRM
IT
S V
AL
IDIT
Y B
EF
OR
E U
SE
.

93
Appendix C – Change Mandates
TH
IS IS
AN
UN
CO
NT
RO
LL
ED
DO
CU
ME
NT
, T
HE
RE
AD
ER
MU
ST
CO
NF
IRM
IT
S V
AL
IDIT
Y B
EF
OR
E U
SE