Embed Size (px)
Citation preview
205
Name Date Partners
Lab 12 - MICROWAVE AND LIGHT
INTERFERENCE
OBJECTIVES
• To understand the wave nature of light
• To see how electromagnetic waves can produce standing waves
• To observe light interference due to single and multiple slits
• To investigate holography OVERVIEW
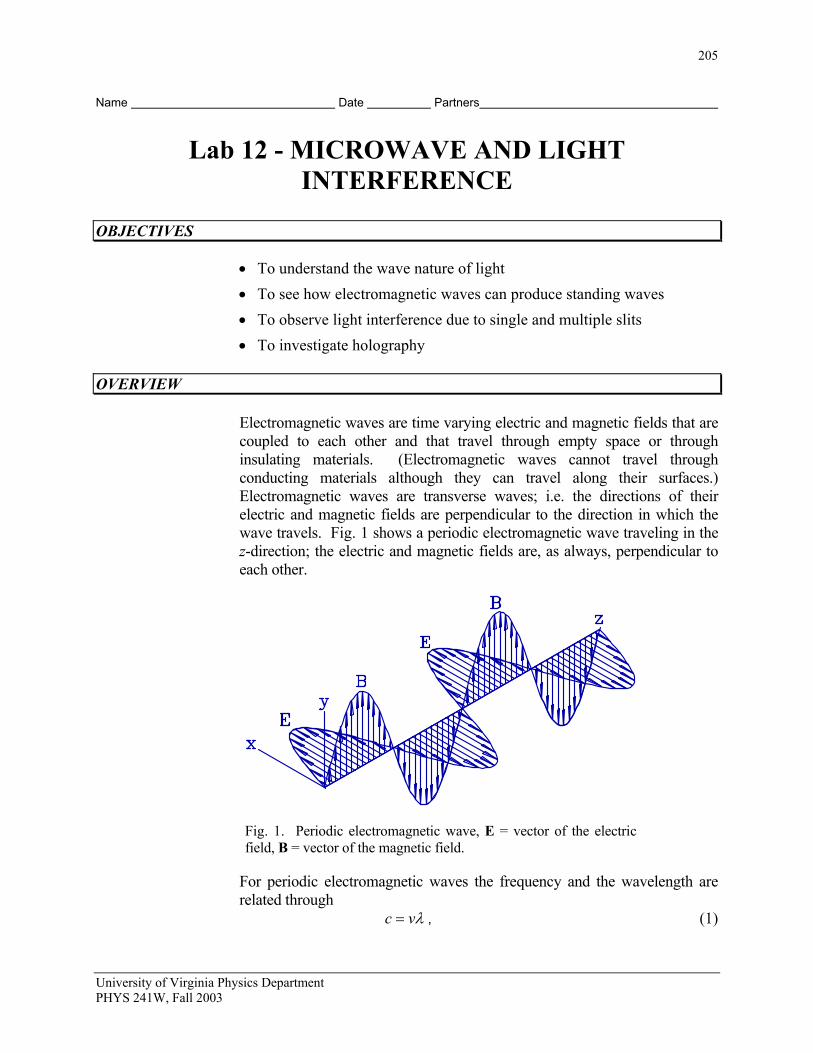
Electromagnetic waves are time varying electric and magnetic fields that are coupled to each other and that travel through empty space or through insulating materials. (Electromagnetic waves cannot travel through conducting materials although they can travel along their surfaces.) Electromagnetic waves are transverse waves; i.e. the directions of their electric and magnetic fields are perpendicular to the direction in which the wave travels. Fig. 1 shows a periodic electromagnetic wave traveling in the z-direction; the electric and magnetic fields are, as always, perpendicular to each other.
Fig. 1. Periodic electromagnetic wave, E = vector of the electric field, B = vector of the magnetic field.
For periodic electromagnetic waves the frequency and the wavelength are related through
λvc = , (1)
University of Virginia Physics Department PHYS 241W, Fall 2003
206 Lab 12 - Microwave and Light Interference
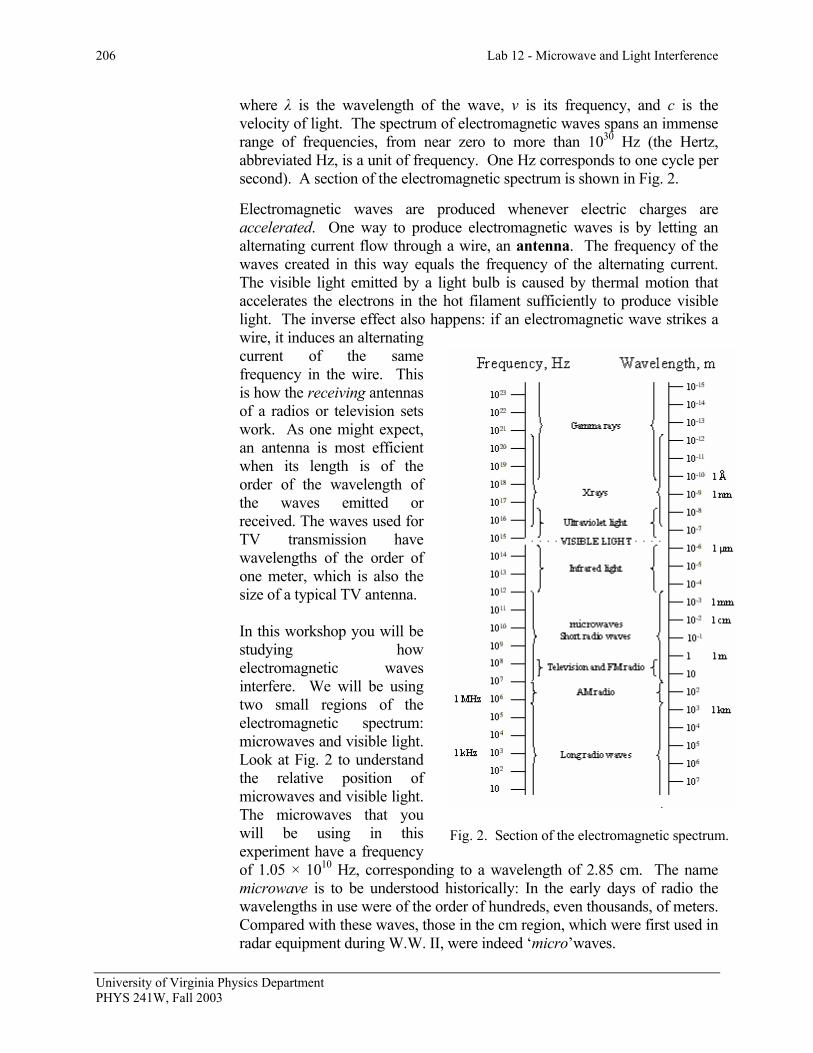
where λ is the wavelength of the wave, v is its frequency, and c is the velocity of light. The spectrum of electromagnetic waves spans an immense range of frequencies, from near zero to more than 1030 Hz (the Hertz, abbreviated Hz, is a unit of frequency. One Hz corresponds to one cycle per second). A section of the electromagnetic spectrum is shown in Fig. 2. Electromagnetic waves are produced whenever electric charges are accelerated. One way to produce electromagnetic waves is by letting an alternating current flow through a wire, an antenna. The frequency of the waves created in this way equals the frequency of the alternating current. The visible light emitted by a light bulb is caused by thermal motion that accelerates the electrons in the hot filament sufficiently to produce visible light. The inverse effect also happens: if an electromagnetic wave strikes a wire, it induces an alternating current of the same frequency in the wire. This is how the receiving antennas of a radios or television sets work. As one might expect, an antenna is most efficient when its length is of the order of the wavelength of the waves emitted or received. The waves used for TV transmission have wavelengths of the order of one meter, which is also the size of a typical TV antenna. In this workshop you will be studying how electromagnetic waves interfere. We will be using two small regions of the electromagnetic spectrum: microwaves and visible light. Look at Fig. 2 to understand the relative position of microwaves and visible light. The microwaves that you will be using in this experiment have a frequency of 1.05 × 10¹⁰ Hz, correspondimicrowave is to be understoodwavelengths in use were of the oCompared with these waves, thoradar equipment during W.W. II
University of Virginia Physics Department PHYS 241W, Fall 2003
Fig. 2. Section of the electromagnetic spectrum.
ng to a wavelength of 2.85 cm. The name historically: In the early days of radio the rder of hundreds, even thousands, of meters. se in the cm region, which were first used in , were indeed ‘micro’waves.
Lab 12 - Microwave and Light Interference 207
We will begin in Investigation 1 to familiarize you with both the production and detection of microwaves. We are already familiar with them from our microwave ovens found in kitchens, dorm rooms, and offices everywhere. In Investigation 2 we will study standing waves, which occur surprisingly often, especially in musical instruments. In Investigation 3 we shall look at interference effects of microwaves. In Investigation 4 we study interference visible light. Finally, if time permits, we will look at holograms in Investigation 5.
INVESTIGATION 1: POLARIZATION OF MICROWAVES
For this investigation, you will need the following:
• PASCO Gunn diode microwave transmitter
• PASCO microwave probe
• Thornton amplifier-power supply
• Thornton six-range DC meter
• Goniometer, various component holders
• Meter stick or tape measure, plastic ruler
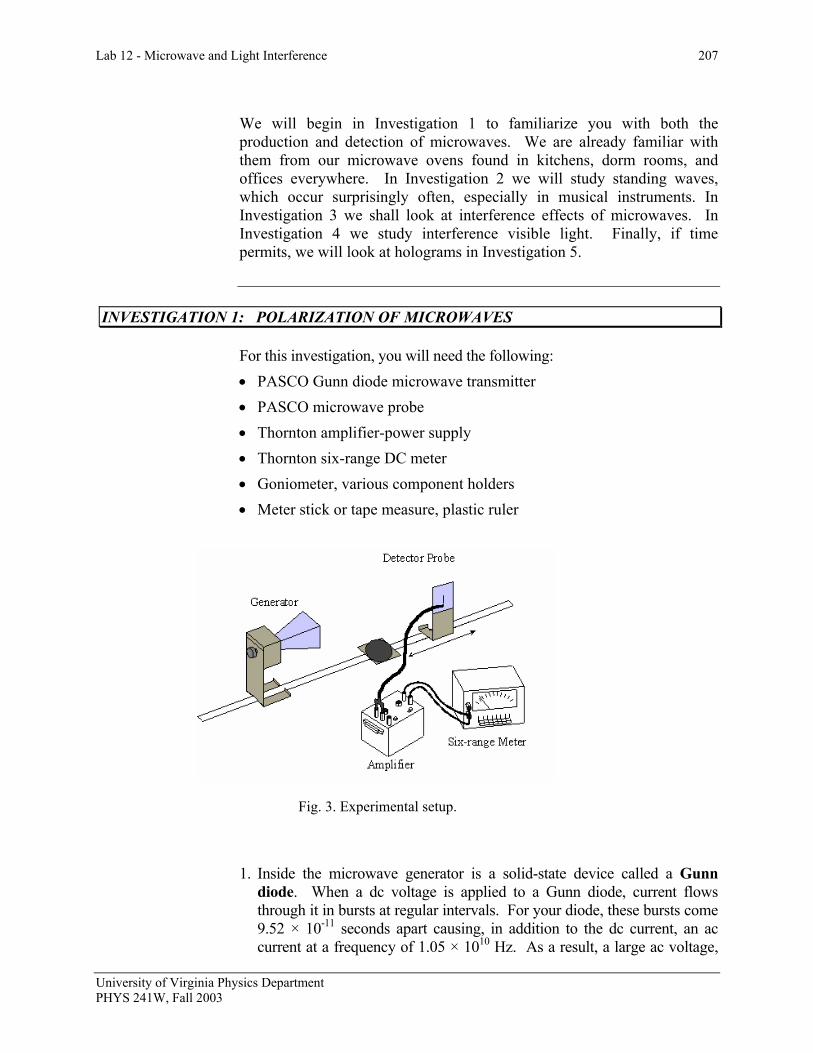
Fig. 3. Experimental setup.
1. Inside the microwave generator is a solid-state device called a Gunn diode. When a dc voltage is applied to a Gunn diode, current flows through it in bursts at regular intervals. For your diode, these bursts come 9.52 × 10⁻¹¹ seconds apart causing, in addition to the dc current, an ac current at a frequency of 1.05 × 10¹⁰ Hz. As a result, a large ac voltage,
University of Virginia Physics Department PHYS 241W, Fall 2003
208 Lab 12 - Microwave and Light Interference
oscillating at this frequency, is present across the diode, and a wave is radiated from the horn-like device of the generator. The electric field of this wave oscillates in the vertical direction when the knob on the back is at 0º, parallel to the Gunn diode. The polarization of an electromagnetic wave is determined by the direction of the electric vector. The magnetic field encircles the current in the Gunn diode and so emanates in the orientation perpendicular to the electric field (see Fig. 1). At 0º the electric field will be vertical, and the magnetic field horizontal. Turn on the generator by plugging the AC adapter wire into the generator and then plug the adapter into an AC outlet.
2. Locate the microwave detector probe (see Fig. 3), a rectangular piece of
circuit board (and attached cord) to which a detector diode is soldered. Notice the solder line which extends beyond the ends of the diode and which acts as an antenna.
Question 1-1: If the antenna is placed in the vertical direction as shown in Figure 3, in what direction should the electric field be directed to maximize the signal received by the antenna (and diode)?
The antenna is designed to be equal to the length of two wavelengths, i.e. 5.7 cm. When the electric field of the microwave strikes it, an ac voltage at a frequency 1.05 × 10¹⁰ Hz is induced across the diode.
3. The amplitude of the DC signal from the detector diode is generally quite
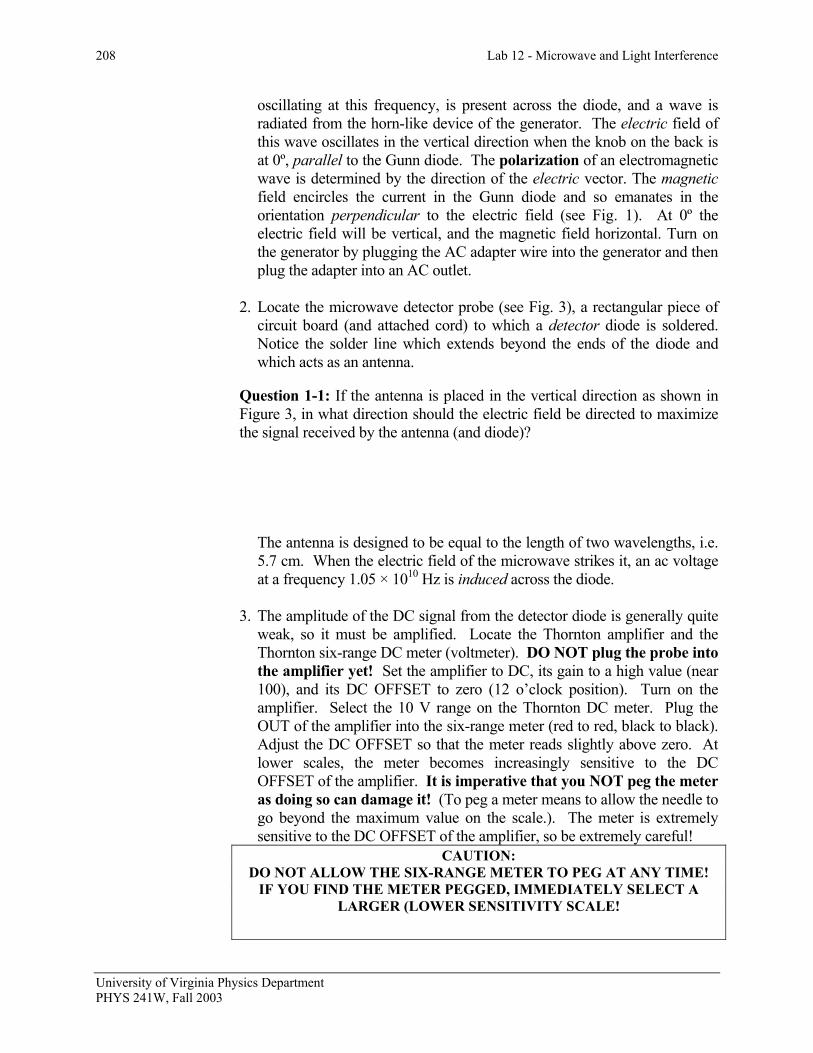
weak, so it must be amplified. Locate the Thornton amplifier and the Thornton six-range DC meter (voltmeter). DO NOT plug the probe into the amplifier yet! Set the amplifier to DC, its gain to a high value (near 100), and its DC OFFSET to zero (12 o’clock position). Turn on the amplifier. Select the 10 V range on the Thornton DC meter. Plug the OUT of the amplifier into the six-range meter (red to red, black to black). Adjust the DC OFFSET so that the meter reads slightly above zero. At lower scales, the meter becomes increasingly sensitive to the DC OFFSET of the amplifier. It is imperative that you NOT peg the meter as doing so can damage it! (To peg a meter means to allow the needle to go beyond the maximum value on the scale.). The meter is extremely sensitive to the DC OFFSET of the amplifier, so be extremely careful!
CAUTION: DO NOT ALLOW THE SIX-RANGE METER TO PEG AT ANY TIME!
IF YOU FIND THE METER PEGGED, IMMEDIATELY SELECT A LARGER (LOWER SENSITIVITY SCALE!
University of Virginia Physics Department PHYS 241W, Fall 2003
Lab 12 - Microwave and Light Interference 209
Start measurements with the six-range meter set to the 10V scale. Decrease as necessary. 4. Using a BNC-to-banana adapter, plug the probe into the IN of the
amplifier. One of the arms of the BNC-to-banana adapter has a tab, which indicates it should be plugged into the ground (black) terminal. Position the diode at about 50 cm from the front of the microwave generator’s horn and oriented vertically, as shown in Fig. 3. Make sure the orientation of the generator is 0º. (Look near the knob.)
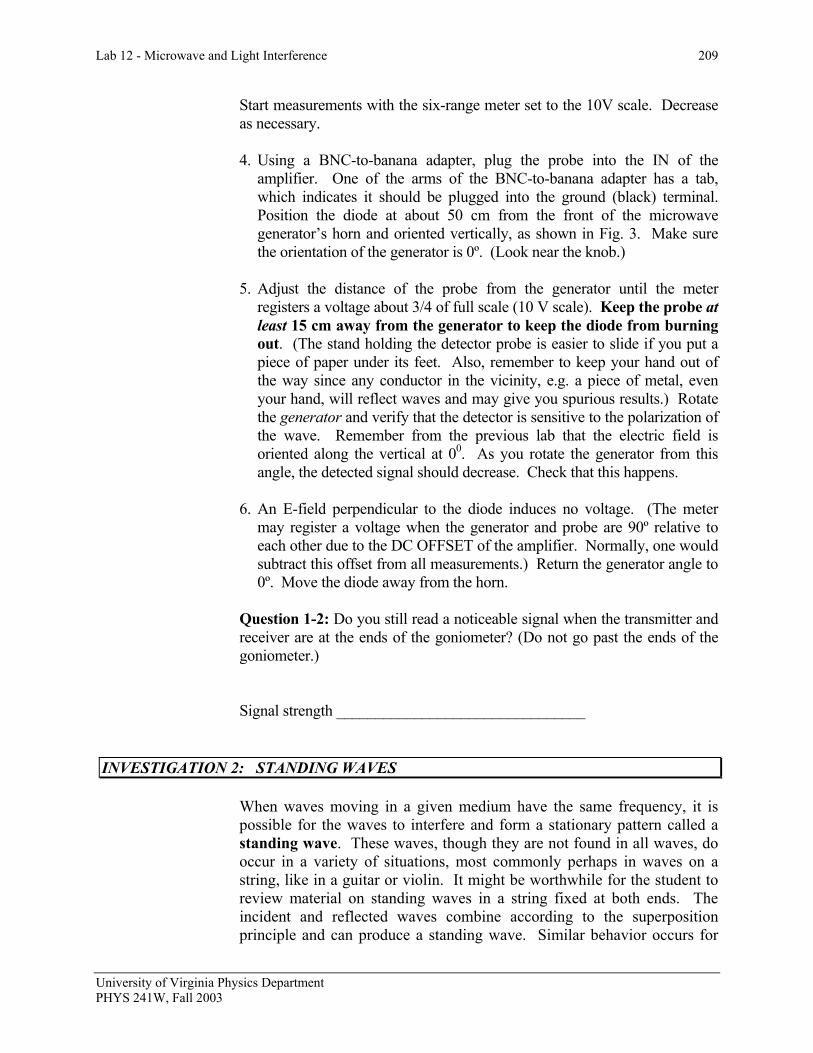
5. Adjust the distance of the probe from the generator until the meter
registers a voltage about 3/4 of full scale (10 V scale). Keep the probe at least 15 cm away from the generator to keep the diode from burning out. (The stand holding the detector probe is easier to slide if you put a piece of paper under its feet. Also, remember to keep your hand out of the way since any conductor in the vicinity, e.g. a piece of metal, even your hand, will reflect waves and may give you spurious results.) Rotate the generator and verify that the detector is sensitive to the polarization of the wave. Remember from the previous lab that the electric field is oriented along the vertical at 00. As you rotate the generator from this angle, the detected signal should decrease. Check that this happens.
6. An E-field perpendicular to the diode induces no voltage. (The meter
may register a voltage when the generator and probe are 90º relative to each other due to the DC OFFSET of the amplifier. Normally, one would subtract this offset from all measurements.) Return the generator angle to 0º. Move the diode away from the horn.
Question 1-2: Do you still read a noticeable signal when the transmitter and receiver are at the ends of the goniometer? (Do not go past the ends of the goniometer.) Signal strength ________________________________
INVESTIGATION 2: STANDING WAVES
When waves moving in a given medium have the same frequency, it is possible for the waves to interfere and form a stationary pattern called a standing wave. These waves, though they are not found in all waves, do occur in a variety of situations, most commonly perhaps in waves on a string, like in a guitar or violin. It might be worthwhile for the student to review material on standing waves in a string fixed at both ends. The incident and reflected waves combine according to the superposition principle and can produce a standing wave. Similar behavior occurs for
University of Virginia Physics Department PHYS 241W, Fall 2003
210 Lab 12 - Microwave and Light Interference
electromagnetic waves, but what is waving is, of course, much different. It is not so easy to imagine something physical waving, because in the case of electromagnetic waves, it is the electric (and magnetic) fields that are oscillating, and no medium is required. Electromagnetic waves travel most easily in a vacuum. The study of electromagnetic radiation propagation and reflection from metal plates is beyond the scope of our course, but suffice it to say that when the electric field reaches a metal plate, it will induce a large current in the metal. This current will then reradiate an electric field of its own, i.e. the reflected electric field. The reradiated field must exactly cancel the incoming field within the metal, for any finite electric field would produce an infinite current within the zero resistance of the metal. The reradiated or reflected electric field will therefore have the same frequency and wavelength of the incident electric field. At certain distances along the path, the two fields will constructively interfere and produce a maximum signal in the detector probe, while at other locations they will destructively interfere and produce a minimum signal. This will occur, for example, between the detector and reflector in Fig. 4, which we will next investigate. The incoming field from the generator will be reflected from the metal plate and subsequently interfere with the incident wave. Certain positions of the reflector will therefore cause maximum and minimum voltages in the detector probe. We can use the positions of these maxima and minima to determine the wavelength of the electromagnetic field. It is useful to keep in mind the case of the taut string at both ends, although the physical process taking place is quite different with electromagnetic fields.
For this investigation, you will need the following materials: • PASCO Gunn diode microwave transmitter
• PASCO microwave modulator
• PASCO microwave probe
• Thornton amplifier-power supply
• Thornton six-range DC meter
• Metal reflector plate
• Goniometer
• Component holders
• Meter stick or tape measure, plastic ruler
University of Virginia Physics Department PHYS 241W, Fall 2003

Lab 12 - Microwave and Light Interference 211
Fig. 4. Reflector placed by the probe detector.
Prediction 2-1: If we place a reflector behind the detector probe, the microwave should be reflected back towards the generator. What do you think will happen to the original wave and the reflected wave? What are the conditions to produce a maximum constructive standing wave? What are the conditions to produce a minimum? 7. Move the generator and detector back to the 50 cm position. Place a
reflector (solid flat piece of metal) behind the detector probe, as shown in Fig. 4. This will produce a standing wave between the generator and the reflector. Making sure to keep the probe at least 50 cm from the generator, slide the probe along the leg of the goniometer, and notice there are positions of maxima and minima signal strength. Slide the detector probe along the goniometer, no more than a cm or two, until you determine a maximum signal. Then slide the reflector, again no more than a cm or two, until you obtain another maximum signal strength. Continue making slight adjustments to the detector probe and reflector until the meter reading is as high as possible, but not pegging on the 10 V scale. If this occurs, move the generator back further away.
8. Now find a node (minimum) of the standing wave pattern by slightly
moving the probe until the meter reading is a minimum. We want to determine the wavelength of the standing wave, so only relative distances between maxima and/or minima are relevant. In this case, it is easiest to use the goniometer scale and measure the distance using the probe base and goniometer scale. Record the position of the probe below:
University of Virginia Physics Department PHYS 241W, Fall 2003
212 Lab 12 - Microwave and Light Interference
Initial probe position at minimum: ____________________ 9. While watching the meter, slide the probe along the goniometer until the
probe has passed through at least 10 antinodes (maxima) and returned to a node. Be sure to count the number of antinodes that were traversed. Record the number of antinodes traversed and the new probe position.
Antinodes traversed: ______ Final probe position at minimum: ________
Question 2-1: What are the analogies with the nodes and antinodes found here and for the standing waves found from an oscillating string fixed at both ends (guitar). Sketch a picture. Question 2-2: What is the distance in terms of the wavelength between adjacent antinodes (maxima)? Question 2-3: What is the wavelength you deduce from your data?
Wavelength of standing wave: ________________________
Question 2-4: Using this experimental wavelength value, determine the frequency of the wave. Is this consistent with your apparatus? If not, please explain.
Wave frequency: ____________
10. Turn off the amplifier before proceeding.
INVESTIGATION 3: FURTHER EXAMPLES OF INTERFERENCE
To further observe interference with microwaves, you will need the following: • PASCO Gunn diode microwave transmitter
University of Virginia Physics Department PHYS 241W, Fall 2003

Lab 12 - Microwave and Light Interference 213
• PASCO microwave receiver
• Goniometer
• Double slit hood
• Meter stick or tape measure, plastic ruler
Locate the microwave receiver. Just inside the horn of the receiver is a detector diode much like the one on the microwave probe. In addition, there is some circuitry, which amplifies the signals received by the diode and outputs this amplified signal to a d’Arsonval meter and to an external output. The amplification, or alternatively its inverse the sensitivity (also labeled METER MULTIPLIER), is controlled via two knobs. The VARIABLE SENSITIVITY knob allows for fine adjustment. As you turn up the sensitivity (from 30 to 1), the signal is amplified more and more. It is imperative that you NOT peg the meter as doing so can damage it! If you find the meter pegged, immediately turn down the sensitivity and/or move the receiver away from the microwave generator!
Receiver
Generator
Fig. 5. Microwave generator and receiver arrangement.
CAUTION: DO NOT ALLOW THE RECEIVER’S METER TO PEG AT ANY TIME!
1. Replace the detector probe and reflector with the receiver, as shown in
Fig. 5. Set the knob on the back of the receiver to 0º. Starting with the meter multiplier on 30, adjust the sensitivity to obtain a signal near 0.5 on the meter. If you cannot achieve this with a sensitivity of 10 or 3, move the receiver closer to the generator.
2. Rotate the receiver and verify that it is sensitive to the polarization of the
wave. The maximum signal should be obtained when both are at 00.
University of Virginia Physics Department PHYS 241W, Fall 2003
214 Lab 12 - Microwave and Light Interference
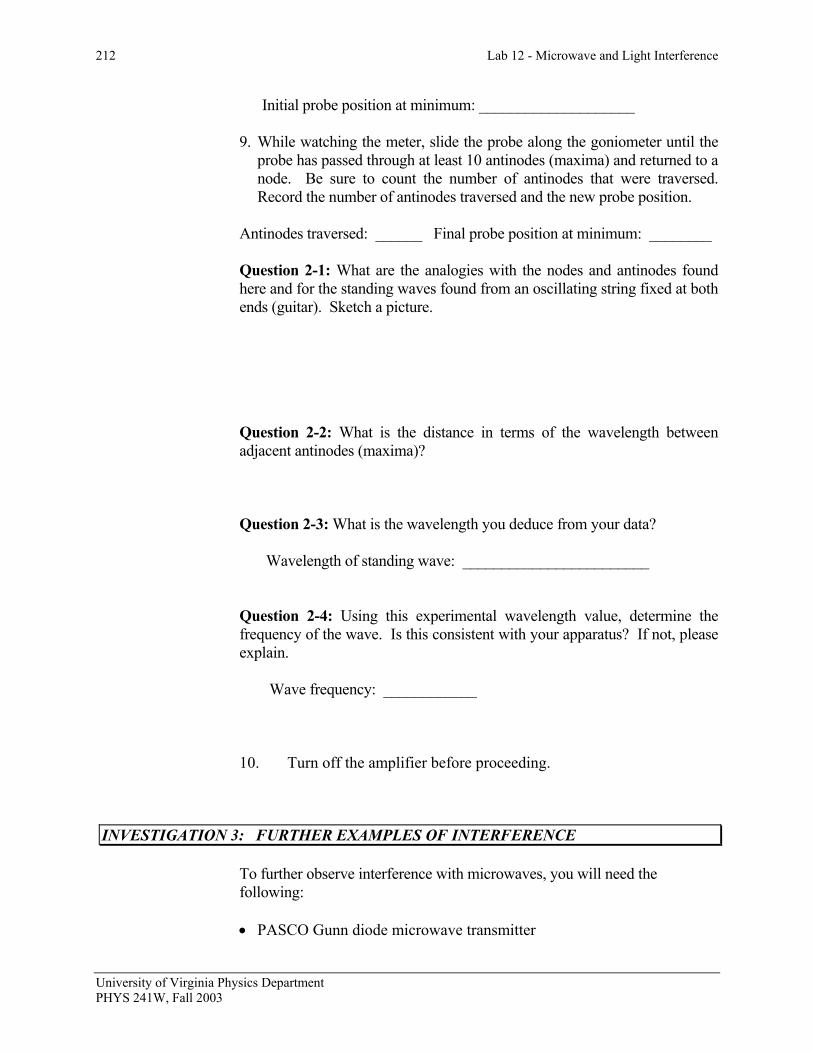
Activity 3-1: Two Slit Interference 1. Slide the double slit hood over the generator’s horn, creating two
coherent microwave sources as shown in Fig. 6.
d
Microwavegenerator
θ
θ
x = d sin θ
Horn
Double slit hood
Receiver
Fig. 6. Interference from the two slit hood.
2. Place the generator on the main arm of the goniometer such that the hood lies directly over the goniometer’s hinge (at the center of the circle). Place the receiver on the goniometer’s shorter arm so that the horns are about 25 cm apart. The signal amplitude that the receiver will detect depends on the phase of the microwaves when they reach the receiver probe. To a good approximation, if θsindx = is equal to an integral number of wavelengths nλ, then the microwaves from the two slits will interfere constructively and you will see a maximum register on the meter. Likewise, if θsind is equal to a half-integral number of wavelengths ( )λ2
1−n , the meter will register a minimum.
constructive interference: sinn dλ θ=
destructive interference: 1( ) sin2
n dλ θ− =
d = distance between centers of slits (double slit hood):__________
3. Set the receiver to 00. Adjust the horn around 00 to obtain a maxima signal. Then move the horn receiver to greater angles and note further maxima and minima. You will need to increase the sensitivity to find the minima accurately. However, reduce the sensitivity as you move away from the minima so that you do not peg the meter! You should be able to locate two minima and one other maximum on each side of the central maximum, but just look on one side of the central maximum (0º). (Hint: It is easier to slide the receiver if you place a sheet of paper under its feet.)
University of Virginia Physics Department PHYS 241W, Fall 2003
Lab 12 - Microwave and Light Interference 215
Angles of maxima: _____________ ______________ Angles of minima: _____________ ______________
4. Use your data for the first non-central maxima to find the wavelength.
Show your calculations below.
Wavelength value: _________________ 5. Use your data for the first minima to find the wavelength. Show your
calculations below. Wavelength value: __________________ Question 3-1: How do your values compare with the microwave wavelength? Discuss any errors/uncertainties.
6. Unplug the DC power supply from the receptacle and turn off the receiver.
INVESTIGATION 4: INTERFERENCE WITH A HE-NE LASER
In this investigation, you will look at different ways of observing interference, whether it is from single slits of varying sizes or from multiple slits. Please read Appendix J: Lasers before you come to lab.
OVERVIEW In an earlier experiment you studied various interference phenomena with electromagnetic waves whose wavelength λ was approximately 3 cm (microwaves). In this experiment you will study similar phenomena with visible light, which we call light waves. Light waves are also
University of Virginia Physics Department PHYS 241W, Fall 2003
216 Lab 12 - Microwave and Light Interference
electromagnetic waves but with a much shorter wavelength, ( cm). The theory of electromagnetic waves is above the level of this course, but all the phenomena that you will observe can be described quite accurately with a simple theoretical model dating back to Christian Huygens (1629 –1695). This model applies to wave phenomena in general and does not make any reference to the electromagnetic nature of light.
51074 −×−≈λ
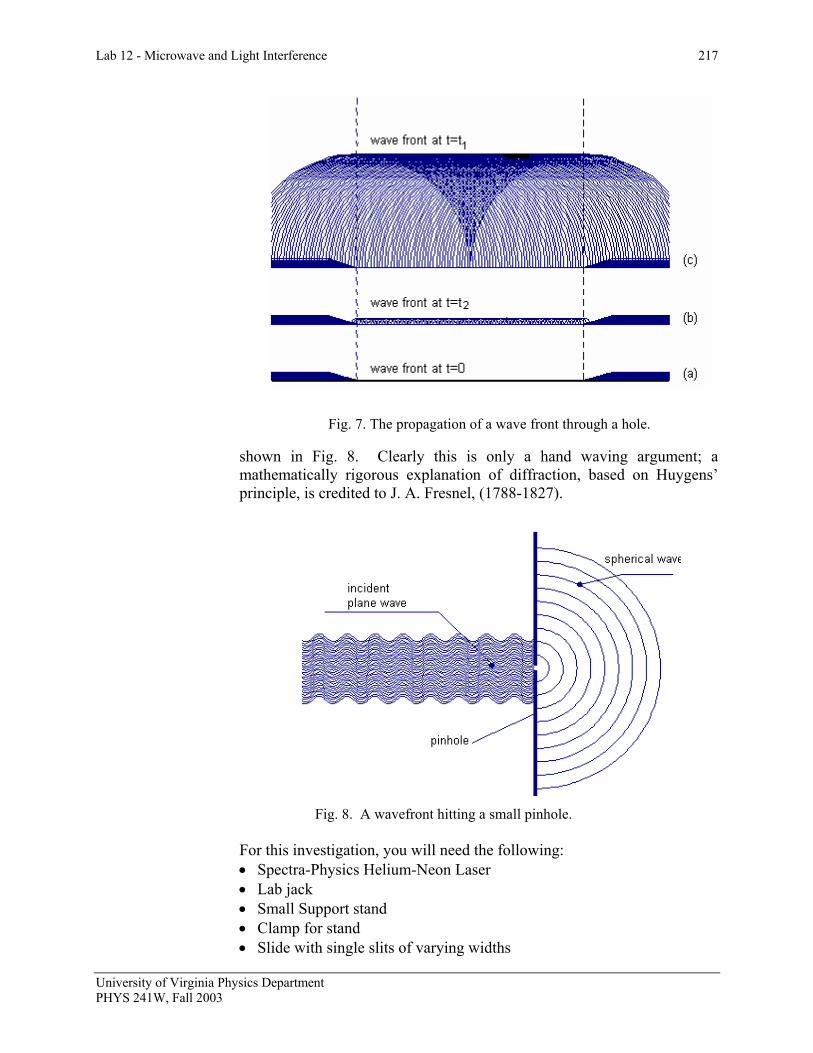
The experiments that you will do are similar to the ones first performed by Thomas Young (~ 1800) to demonstrate the wave nature of light. What was a difficult experiment in Young’s time becomes quite easy with modern light sources, especially lasers. The electromagnetic nature of light was not recognized until 1865, when James Clerk Maxwell showed theoretically that electro-magnetic waves could exist, thus making it plausible that light waves were such waves. Until that time light was thought to be some sort of mechanical wave, akin to sound, propagating in an ether that permeated all space. Huygens’ Principle states that every point of a wave front can be thought of as the origin of spherical waves. This seems to be contradicted by experience: How can a laser emit a pencil beam? Would the light not spread out immediately? We investigate this question with a gedanken (thought) experiment: Let a plane wave be incident on a screen that has a hole cut into it. Imagine that at the time 0=t the wave front, coming from below, has just reached the hole as shown in Fig. 7a. An instant later, at t the spherical wavelets that were, according to Huygens, created at every point of this wave front have begun to spread, as in Fig 7b. Later yet at , shown in Fig 7c, we find that the wavelets have spread considerably; but, in a central region as wide as the slit, they have formed a new wave front propagating in the same direction as the old one. This reasoning can be repeated point by point in space and time as needed.
1t=
2tt =
As a result, one will see by and large what one would have expected: a ray of light of the width of the slit, propagating in the original direction. Only on very close observation will one see that a small amount of light has leaked around the corner to regions where according to a ray model it should not be. The larger the hole, the smaller will be the fraction of the light that leaks around the corner, a process called diffraction. Largeness is a relative term - large with respect to what? The only measure of length that is appropriate for this problem is the wavelength of the incident light: When the size of the hole is large compared to the wavelength only a small part of all the light will find its way around the edge, most of it will be in the central beam. Only if the size of the hole is small compared to the wavelength will one find that the light spreads out spherically, as
University of Virginia Physics Department PHYS 241W, Fall 2003
Lab 12 - Microwave and Light Interference 217
Fig. 7. The propagation of a wave front through a hole.
shown in Fig. 8. Clearly this is only a hand waving argument; a mathematically rigorous explanation of diffraction, based on Huygens’ principle, is credited to J. A. Fresnel, (1788-1827).
For this • Spect• Lab ja• Small• Clamp• Slide
University of Virginia Physics DeparPHYS 241W, Fall 2003
Fig. 8. A wavefront hitting a small pinhole.
investigation, you will need the following: ra-Physics Helium-Neon Laser ck Support stand for stand
with single slits of varying widths
tment
218 Lab 12 - Microwave and Light Interference
• Slide with multiple slits • Diffraction grating slide • Board placed on table to observe patterns • 3-m tape
THE SINGLE SLIT
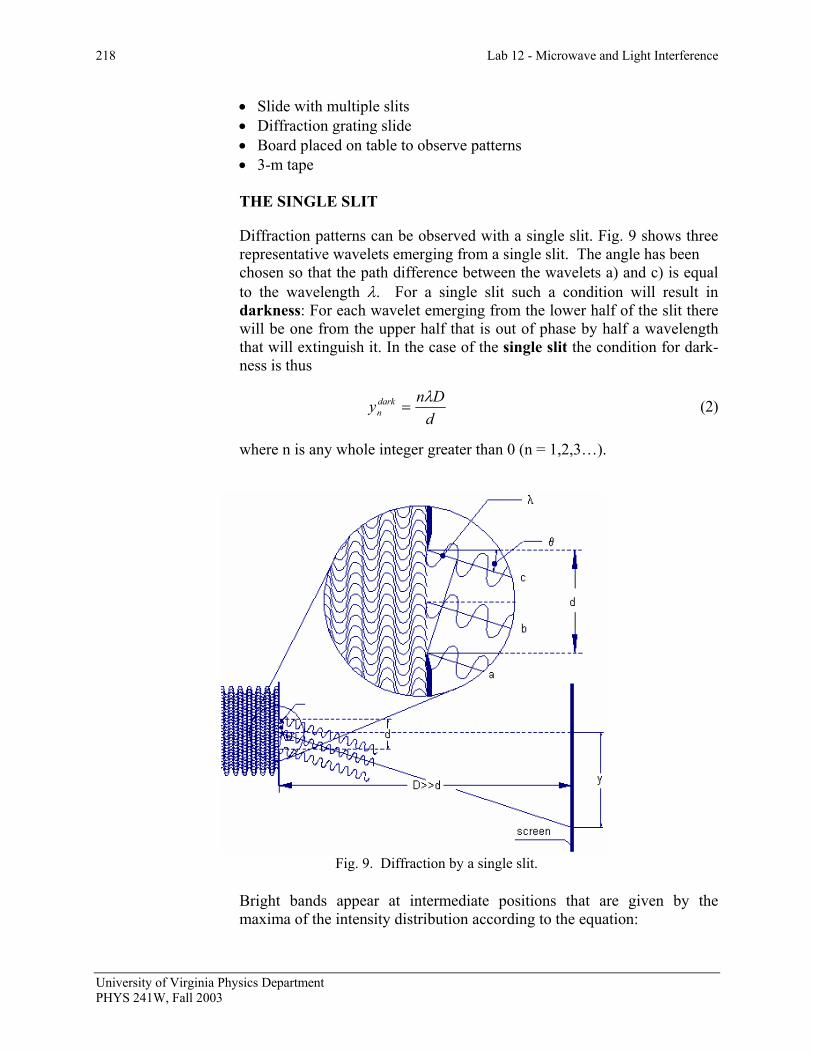
Diffraction patterns can be observed with a single slit. Fig. 9 shows three representative wavelets emerging from a single slit. The angle has been chosen so that the path difference between the wavelets a) and c) is equal to the wavelength λ. For a single slit such a condition will result in darkness: For each wavelet emerging from the lower half of the slit there will be one from the upper half that is out of phase by half a wavelength that will extinguish it. In the case of the single slit the condition for dark-ness is thus
dDny dark
nλ
= (2) where n is any whole integer greater than 0 (n = 1,2,3…).
Fig. 9. Diffraction by a single slit.
Bright bands appear at intermediate positions that are given by the maxima of the intensity distribution according to the equation:
University of Virginia Physics Department PHYS 241W, Fall 2003
Lab 12 - Microwave and Light Interference 219
2
2
0
sin
sinsin)(
Θ
Θ
Θ
λπ
λπ
d
d
I=I . (3)
Activity 4-1: Single Slit Interference
CAUTION: THE LASER BEAM IS VERY INTENSE. DO NOT LOOK DIRECTLY INTO IT! DO NOT LOOK AT A REFLECTION OF THE BEAM FROM A METALLIC SURFACE.
1. Aim the laser at white paper placed on the board approximately 1 m
away, and turn it on. Note the brightness of the spot on the screen. The parallel beam of light is only a few millimeters in diameter.
2. Clamp the slide holder containing the single slit slide in the support
stand so that the slits are horizontal. Place the slit close to the laser. 3. Use the lab jack to adjust the height of the laser so that the beam passes
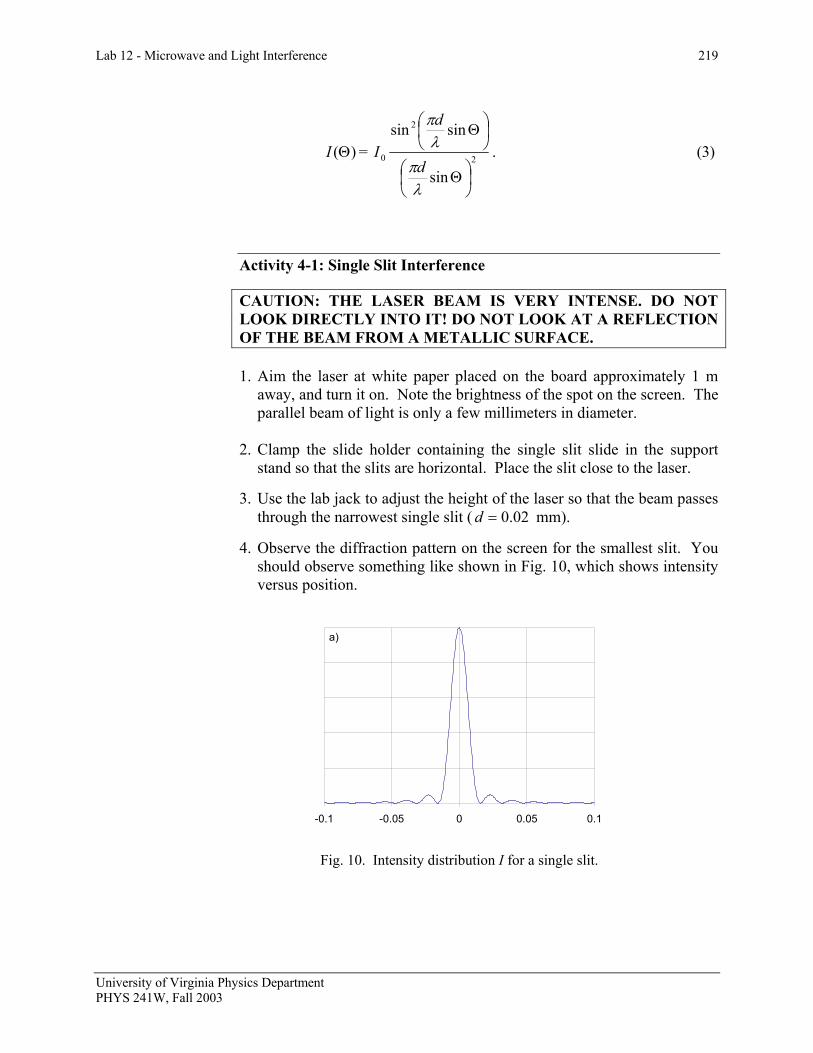
through the narrowest single slit ( 02.0=d mm). 4. Observe the diffraction pattern on the screen for the smallest slit. You
should observe something like shown in Fig. 10, which shows intensity versus position.
-0.1 -0.05 0 0.05 0.1
a)
Fig. 10. Intensity distribution I for a single slit.
University of Virginia Physics Department PHYS 241W, Fall 2003
220 Lab 12 - Microwave and Light Interference
Question 4-1: What do you observe? Approximately how wide are the light bands? Can you explain this in terms of Fig. 10?
5. Measure the distance D from the slit slide to the screen.
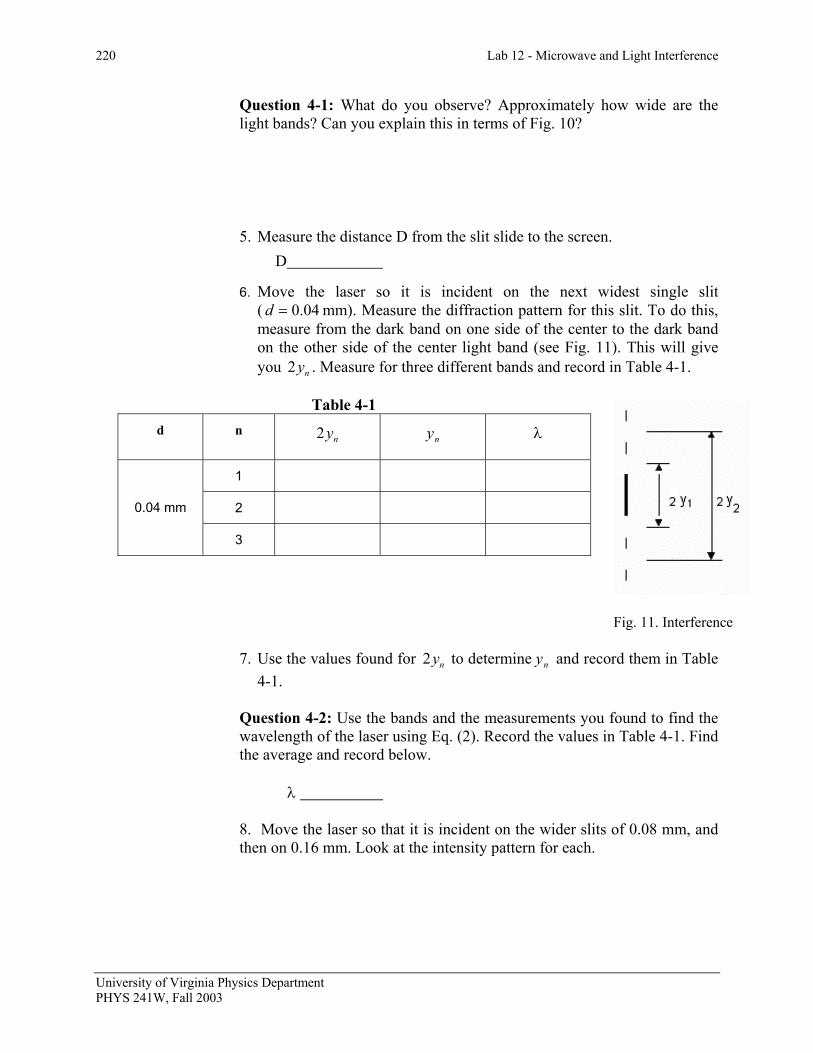
D 6. Move the laser so it is incident on the next widest single slit
( mm). Measure the diffraction pattern for this slit. To do this, measure from the dark band on one side of the center to the dark band on the other side of the center light band (see Fig. 11). This will give you . Measure for three different bands and record in Table 4-1.
04.0=d
2 ny
Table 4-1 d n 2 ny ny λ
1
2 0.04 mm
3
7. Use the values found for to determine and reco4-1.
2 ny ny
Question 4-2: Use the bands and the measurements youwavelength of the laser using Eq. (2). Record the values ithe average and record below. λ 8. Move the laser so that it is incident on the wider slitsthen on 0.16 mm. Look at the intensity pattern for each.
University of Virginia Physics Department PHYS 241W, Fall 2003
Fig. 11. Interference
rd them in Table
found to find the n Table 4-1. Find
of 0.08 mm, and
Lab 12 - Microwave and Light Interference 221
Question 4-3: What can you qualitatively say about how the diffraction pattern changes as the slit width goes from smaller to larger?
Question 4-4: Why do you think that the bands would get larger or smaller (depending on your answer to Question 4-3)? Why would the bands get closer together or further apart (also depending on your previous answer)?
THE DOUBLE SLIT
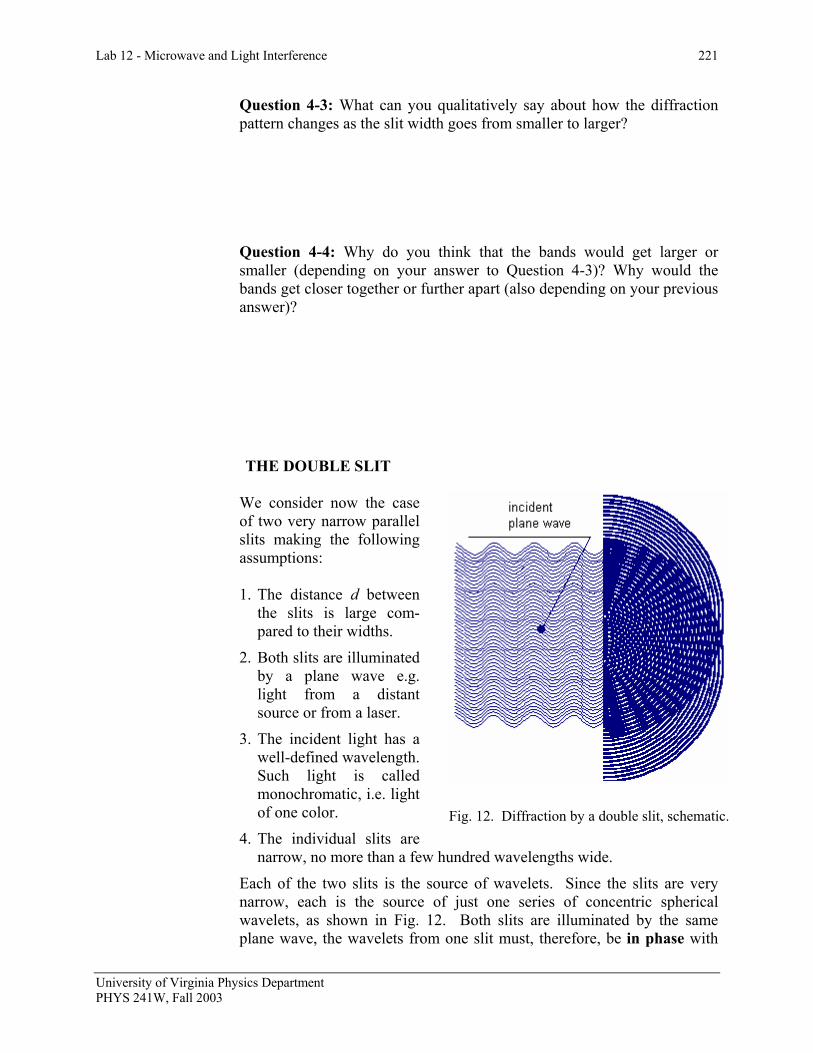
Fig. 12. Diffraction by a double slit, schematic.
We consider now the case of two very narrow parallel slits making the following assumptions: 1. The distance d between
the slits is large com-pared to their widths.
2. Both slits are illuminated by a plane wave e.g. light from a distant source or from a laser.
3. The incident light has a well-defined wavelength. Such light is called monochromatic, i.e. light of one color.
4. The individual slits are narrow, no more than a few hundred wavelengths wide.
Each of the two slits is the source of wavelets. Since the slits are very narrow, each is the source of just one series of concentric spherical wavelets, as shown in Fig. 12. Both slits are illuminated by the same plane wave, the wavelets from one slit must, therefore, be in phase with
University of Virginia Physics Department PHYS 241W, Fall 2003

222 Lab 12 - Microwave and Light Interference
those from the other. Let the black rings in Fig. 12 indicate the positions of positive ½ waves (maxima) at a certain moment in time. In certain directions one sees black “rays” emanating from a point half way between the slits. In these directions the waves from the two slits will overlap and add (constructive interference). In the directions in between the black “rays” positive half waves (black) will coincide with negative half waves (white) and the waves from the two slits will extinguish each other (destructive interference). Fig. 13 gives an example of destructive interference: At the angle θ shown in the figure, the waves from the two slits are out of step by a half wave-length. Clearly, destructive interference will also result in all those directions for which the waves from the two slits are out of step by an odd number of half wavelengths. In those directions in which the distances traveled by the two waves differs by an even number of half wavelengths the interference will be constructive.
Fig. 13. Diffraction by a double slit, with details.
On a screen intercepting the light, one will therefore see alternating light and dark bands. From the positions of these bands it is easy to determine the wavelength of the light. From Fig. 13 we find
sin = 2dλθ (4)
University of Virginia Physics Department PHYS 241W, Fall 2003
Lab 12 - Microwave and Light Interference 223
where d is the distance between the slits and λ is the wavelength. We can also note that
sin y = D
θ (5)
where y is the distance of the first dark band from the center line and D is the distance from the slit to the screen. From this we can obtain the wavelength:
D2yd=λ (6)
Convince yourself that this can be generalized to
,...3,2,1, =n1)D-(2ndy2
= nλ (7)
where y1, y2, y3, etc. are the distances of the first, second, third, etc. dark band from the centerline.
Activity 4-2: Multiple Slit Interference Prediction 4-1: How do you think the slit pattern will change if you switch the single-slit slide with a slide that has two slits, if at all? How will this be related to the single slit pattern? (Hint: think of the double slit as two single slits next to each other. How will they interact?) Prediction 4-2: As the number of slits is increased past two, how do you think the interference pattern will change? (Hint: How can three slits be construed as a combination of double slits overlapping?) What impact do you think this will have on the slit pattern? 1. Replace the single slit slide with the multiple slit slide.
2. Make the laser light incident upon the double slit with the slide close to the laser.
University of Virginia Physics Department PHYS 241W, Fall 2003
224 Lab 12 - Microwave and Light Interference
Question 4-5: How is this pattern different from the single slit pattern?
3. Move the laser so it is incident on the three, four and then the five slit patterns. Observe the spectra closely each time.
Question 4-6: Was your Prediction 4-2 correct? If not, explain. List differences you did not expect. 4. Put the double slit back in and make sure the white sheet is on the
board. With a pencil or pen, mark a line slightly off to the side the position of the central ray. Then mark a point right on the first four dark spots above and below the central ray position. It may be easiest to take the white paper off the board to measure the positions between the dark spots above and below the critical rays. Mark on your diagram where the distances 2y1, 2y2, and 2y3 actually are. Measure them and write them down below.
2y1___________________________ 2y2___________________________ 2y3___________________________ 5. Use the measurements in step 4 to calculate the wavelength. Perhaps
calculate λ using all three experimental values and compare them. λ Question 4-7: How well does your calculated value agree with the wavelength of the laser (632.8 nm)? Which orders should give the best results? Did you try several orders?
University of Virginia Physics Department PHYS 241W, Fall 2003
Lab 12 - Microwave and Light Interference 225
THE DIFFRACTION GRATING
Adding more slits of the same widths and with the same slit to slit dis-tances will not change the positions of the light and dark bands but will make the light bands narrower and brighter. In diffraction gratings this is carried to extremes: many thousands of lines are scratched into a piece of glass or a mirror surface, giving the same effect as many thousands of slits. The “slit” to “slit” distance d is usually made very small so that for a given wavelength λ the distances yn from the bright bands to the center become very large. At the same time, the thickness of the bands of monochromatic light become narrow lines, resulting in spectral lines. This enables one to measure wavelengths very accurately with such gratings. The order m specifies the order of the principal maxima, and m = 0 for the central beam at a scattering angle θ = 0. The first bright spot on either side of the central maxima would be m = 1 scattered at angle θ1; the next spot would be m = 2 scattered at angle θ2 and so forth. It is therefore quite easy to calculate the wavelength of light using a diffraction grating. The wavelength is given by the equation
m (8) sinm dλ θ=D is the distance from the diffraction grating to the screen, and the first maximum (m = 1) is observed at an angle θ1 from the central ray. Then ym is the distance on the screen from the central ray to the maxima corresponding to order m. Then
tan mm
yD
θ = (9)
By using the two previous equations we can calculate the wavelength. Eq. (9) can be used to find mθ , and then that value plugged into Eq. (8). Activity 4-3: The Diffraction Grating In this activity, you will use the diffraction grating to calculate the wavelength of the light. 1. Find the slide that contains the diffraction grating. Printed on the slide
should be the number of lines per millimeter (N). Record this value and then determine the distance d between adjacent slits 1/N. N d
University of Virginia Physics Department PHYS 241W, Fall 2003
226 Lab 12 - Microwave and Light Interference
2. Measure the distance D between the diffraction grating and the screen very precisely. It should be about 15-20 cm, to allow for the band separations to be as large as possible while still being on the screen.
D
3. Shine the light from the laser through the diffraction grating and ensure
that you can measure the maxima. You probably will have to look at the first order, because the others will be off the screen. It may help to turn the grating and screen horizontal to make these measurements. Measure and record the distance from the center of one maxima to the same maxima on the other side of the central ray. Write down the order you used and the distance measured.
Order m Distance between bright spots on either side of central spot
4. Note that the measurement you just recorded is 2ym. 5. Use the data that you have to calculate the wavelength of the light.
λ
Question 4-8: How well does your measured value for the He-Ne laser wavelength agree with the accepted value? Does this appear to be the best of your measurements? Explain why or why not? What do you think may have been the cause of any of your errors?
University of Virginia Physics Department PHYS 241W, Fall 2003
Lab 12 - Microwave and Light Interference 227
If you have time, try to do the following Investigation: INVESTIGATION 5: HOLOGRAMS
HOLOGRAPHY
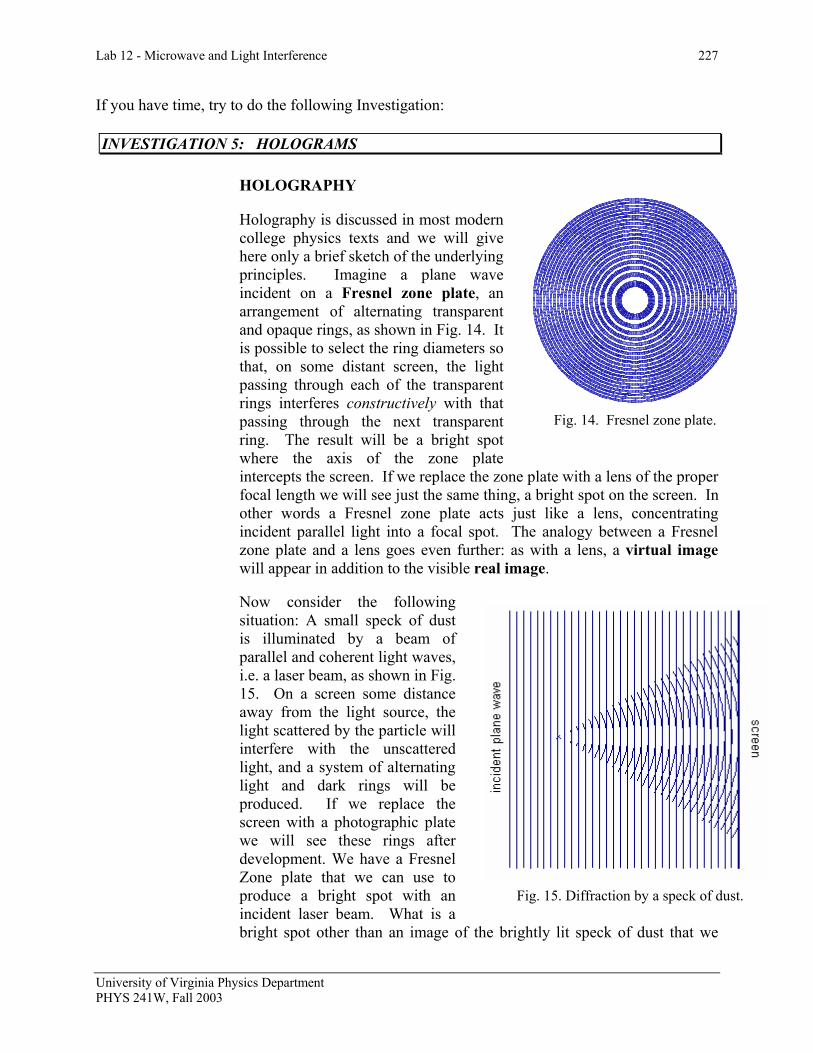
Holography is discussed in most modern college physics texts and we will give here only a brief sketch of the underlying principles. Imagine a plane wave incident on a Fresnel zone plate, an arrangement of alternating transparent and opaque rings, as shown in Fig. 14. It is possible to select the ring diameters so that, on some distant screen, the light passing through each of the transparent rings interferes constructively with that passing through the next transparent ring. The result will be a bright spot where the axis of the zone plate intercepts the screen. If we replace the zone plate with a lens of the proper focal length we will see just the same thing, a bright spot on the screen. In other words a Fresnel zone plate acts just like a lens, concentrating incident parallel light into a focal spot. The analogy between a Fresnel zone plate and a lens goes even further: as with a lens, a virtual image will appear in addition to the visible real image.
Fig. 14. Fresnel zone plate.
Now consider the following situation: A small speck of dust is illuminated by a beam of parallel and coherent light waves, i.e. a laser beam, as shown in Fig. 15. On a screen some distance away from the light source, the light scattered by the particle will interfere with the unscattered light, and a system of alternating light and dark rings will be produced. If we replace the screen with a photographic plate we will see these rings after development. We have a Fresnel Zone plate that we can use to produce a bright spot with an incident laser beam. What is a bright spot other than an image of the brightly lit speck of dust that we
Fig. 15. Diffraction by a speck of dust.
University of Virginia Physics Department PHYS 241W, Fall 2003
228 Lab 12 - Microwave and Light Interference
University of Virginia Physics Department PHYS 241W, Fall 2003
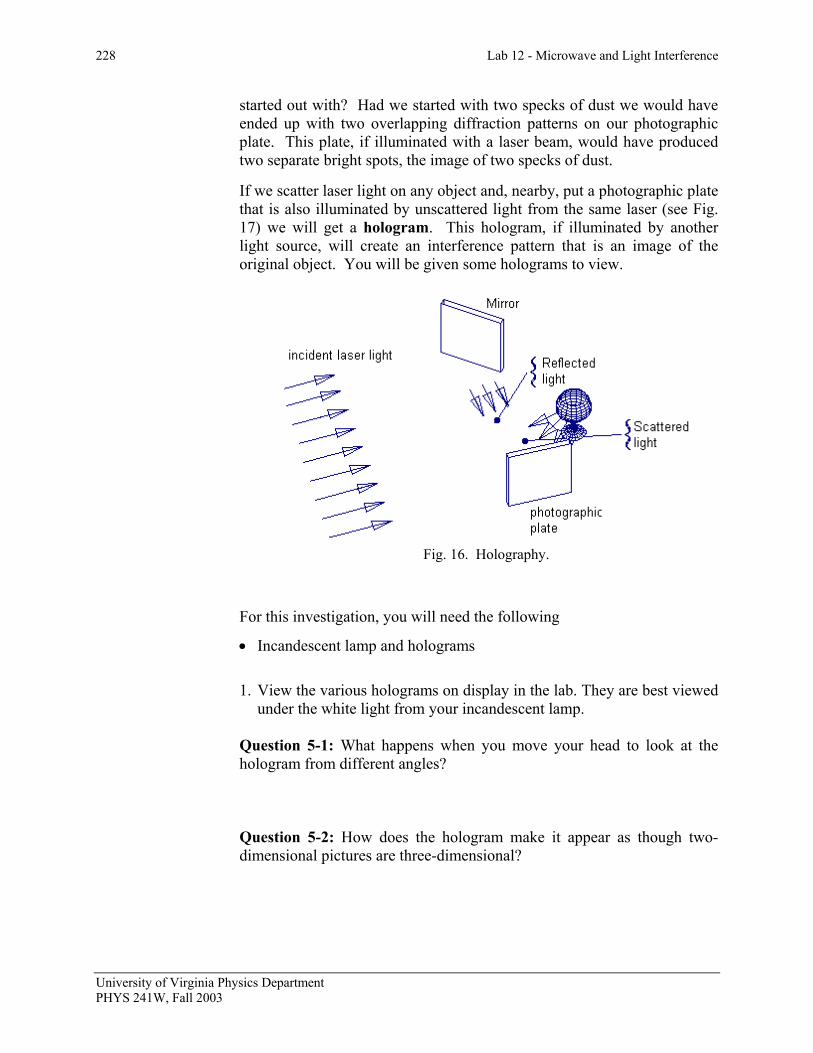
started out with? Had we started with two specks of dust we would have ended up with two overlapping diffraction patterns on our photographic plate. This plate, if illuminated with a laser beam, would have produced two separate bright spots, the image of two specks of dust. If we scatter laser light on any object and, nearby, put a photographic plate that is also illuminated by unscattered light from the same laser (see Fig. 17) we will get a hologram. This hologram, if illuminated by another light source, will create an interference pattern that is an image of the original object. You will be given some holograms to view.
Fig. 16. Holography.
For this investigation, you will need the following
• Incandescent lamp and holograms
1. View the various holograms on display in the lab. They are best viewed
under the white light from your incandescent lamp. Question 5-1: What happens when you move your head to look at the hologram from different angles?
Question 5-2: How does the hologram make it appear as though two-dimensional pictures are three-dimensional?