Embed Size (px)
Citation preview
Research guide and technical manual
Korn FerryFour Dimensional Executive Assessment
Korn Ferry Four Dimensional Executive AssessmentResearch guide and technical manual
© Korn Ferry 2015. All rights reserved.
No part of this work may be copied or transferred to any other expression or form without a license from Korn Ferry.
For the sake of linguistic simplicity in this product, where the masculine form is used, the feminine form should always be understood to be included.
www.kornferry.com
Korn Ferry Four Dimensional Executive Assessment Research guide and technical manual
Version 15.1a—01/2016
Author James L. Lewis
Contributors Maynard Goff
Jeff Jones
Sarah Hezlett
King Y. Tang
Guangrong Dai
Susan D’Mello
Lauren Henry
David Zes
Jeffrey Fetzer
Chelsy Xie
Paul Scheer���
iii | © Korn Ferry 2015. All rights reserved.
Table of contents
Section 1: Introduction to Korn Ferry’s Four Dimensions of Leadership and Talent ....................... 1 Purpose of Technical Manual ............................................................................................................................. 2 Korn Ferry’s Four Dimensions of Leadership and Talent: A brief and general overview ................................... 3
Competencies ............................................................................................................................................ 3 Experiences ............................................................................................................................................... 3 Traits .......................................................................................................................................................... 3 Drivers ....................................................................................................................................................... 4
How to use Korn Ferry’s Four Dimensional Executive Assessment .................................................................. 4
Section 2: The scientific foundation for Korn Ferry’s Four Dimensional Executive Assessment ... 5 Measures in the workplace ................................................................................................................................. 6
The moderated desirability of assessment scores and profiles ................................................................. 6 Descriptive utility always ............................................................................................................................ 7 Describing, fitting, and succeeding ............................................................................................................ 7
Traits .................................................................................................................................................................. 8 Agility ......................................................................................................................................................... 8 Social leadership ..................................................................................................................................... 13 Energy ..................................................................................................................................................... 18
Competencies .................................................................................................................................................. 23 A subset of 15 .......................................................................................................................................... 23 Self-efficacy for competencies ................................................................................................................. 25 Thought competencies ............................................................................................................................ 27 Results competencies .............................................................................................................................. 29 People competencies .............................................................................................................................. 30 Self competencies ................................................................................................................................... 32
Drivers .............................................................................................................................................................. 34 What are drivers? .................................................................................................................................... 35 The benefits of assessing drivers ............................................................................................................ 35 Taxonomy of drivers ................................................................................................................................ 36 Descriptions and known correlates of specific drivers ............................................................................. 38
Balance ........................................................................................................................................... 38 Collaboration ................................................................................................................................... 39 Structure .......................................................................................................................................... 39 Power .............................................................................................................................................. 40 Challenge ........................................................................................................................................ 41 Independence ................................................................................................................................. 41
Organizational culture ...................................................................................................................................... 42 Origin and functionality of organizational culture ..................................................................................... 42 What is organizational culture? ................................................................................................................ 43 Where does organizational culture come from? ...................................................................................... 44 How does culture impact performance? .................................................................................................. 44 Is a strong culture always beneficial? ...................................................................................................... 45 The role of leaders ................................................................................................................................... 46 Assessing organizational culture in executive search ............................................................................. 48
Collaborative ................................................................................................................................... 48 Innovative ........................................................................................................................................ 48 Competitive ..................................................................................................................................... 48 Regulatory ....................................................................................................................................... 48 Cultural features are not mutually exclusive ................................................................................... 49
The benefits of assessing organizational culture in executive search ..................................................... 50
iv | © Korn Ferry 2015. All rights reserved.
Section 3: Measurement methods ........................................................................................................ 52 Datasets and measurement ............................................................................................................................. 53
Traits measurement calibration sample ................................................................................................... 53 Traits and drivers correlational analyses sample, drivers measurement calibration sample ................... 53 Competencies measurement calibration and correlational analyses sample .......................................... 54
Measurement models ....................................................................................................................................... 54 Addressing the problem of faking ............................................................................................................ 54 Forced-choice IRT models ....................................................................................................................... 55 KF4D-Exec IRT model ............................................................................................................................. 55 Results, IRT parameters and reliabilities ................................................................................................. 57
Traits ............................................................................................................................................... 57 Drivers ............................................................................................................................................. 59 Competencies ................................................................................................................................. 59 Construct correlations ..................................................................................................................... 59
Section 4: Empirical findings ................................................................................................................ 62 Associations with outcomes ............................................................................................................................. 63 Role variability .................................................................................................................................................. 63
Measuring the nature of leadership roles ................................................................................................ 66 Average assessment scores across work-analysis variables .................................................................. 72 Trait, driver, and competency associations with outcomes ..................................................................... 74 Traits, work engagement, and organizational commitment ..................................................................... 74
Agility traits ...................................................................................................................................... 74 Social leadership traits .................................................................................................................... 77 Energy traits .................................................................................................................................... 80
Competencies, work engagement, and organizational commitment ....................................................... 82 Thought competencies .................................................................................................................... 82 Results competencies ..................................................................................................................... 85 People competencies ...................................................................................................................... 87 Self competencies ........................................................................................................................... 89
Drivers, work engagement, and organizational commitment ................................................................... 92 Multivariate considerations ...................................................................................................................... 95
Profile models ................................................................................................................................................... 96 Latent profiles on all KF4D measures ...................................................................................................... 96
Class 1 – Rational Independent Strategists .................................................................................... 97 Class 2 – Assertive Persuasive Flexible Managers ........................................................................ 98 Class 3 – Detail-Oriented Empathetic Structured Experts .............................................................. 99 Class 4 – Inspirational Tactical Managers .................................................................................... 100 Class 5 – Inspirational Transformational Architects ...................................................................... 101 Class 6 – Rational Structured Expert Builders .............................................................................. 102 Class 7 – Curious Rational Innovative Introverts .......................................................................... 103 Class 8 – Sociable Structured Balanced Collaborators ................................................................ 104
Class-based fit impressions ................................................................................................................... 105 A second model ..................................................................................................................................... 108 Relationships between culture and drivers ............................................................................................ 111
v | © Korn Ferry 2015. All rights reserved.
Target scores and interpretation .................................................................................................................... 113 Target scores on KF4D trait and driver measures ................................................................................. 113 Analytic strategy .................................................................................................................................... 113
Agility results ................................................................................................................................. 115 Social leadership results ............................................................................................................... 117 Energy results ............................................................................................................................... 119 Trait higher-order factors results ................................................................................................... 121 Drivers results ............................................................................................................................... 123
Interpreting final equations .................................................................................................................... 126 What makes for a target or typical score? ............................................................................................. 127
Agility results ................................................................................................................................. 128 Social leadership results ............................................................................................................... 135 Energy results ............................................................................................................................... 141 Trait higher-order factors results ................................................................................................... 146 Drivers results ............................................................................................................................... 149
Target score vector distance tests ......................................................................................................... 166 Adverse impact analyses ............................................................................................................................... 167
Data sources .......................................................................................................................................... 168 Analytic strategy .................................................................................................................................... 169
Competencies results .................................................................................................................... 169 Higher-order trait composites results ............................................................................................ 172 Traits results .................................................................................................................................. 174 Drivers results ............................................................................................................................... 177
Section 5: Summary ............................................................................................................................. 179 Summary and limitations ................................................................................................................................ 180 Intended use ................................................................................................................................................... 180
References ............................................................................................................................................ 181
Appendices ........................................................................................................................................... 203 A. Acronyms ................................................................................................................................................... 204 B. List of Figures and Tables .......................................................................................................................... 205 C. Table ACORR and TCORR-IRTL .............................................................................................................. 211
1 | © Korn Ferry 2015. All rights reserved.
Section 1 Introduction to Korn Ferry’s Four Dimensions of Leadership and Talent
Korn Ferry’s Four Dimensional Executive Assessment • Research guide and technical manual
2 | © Korn Ferry 2015. All rights reserved.
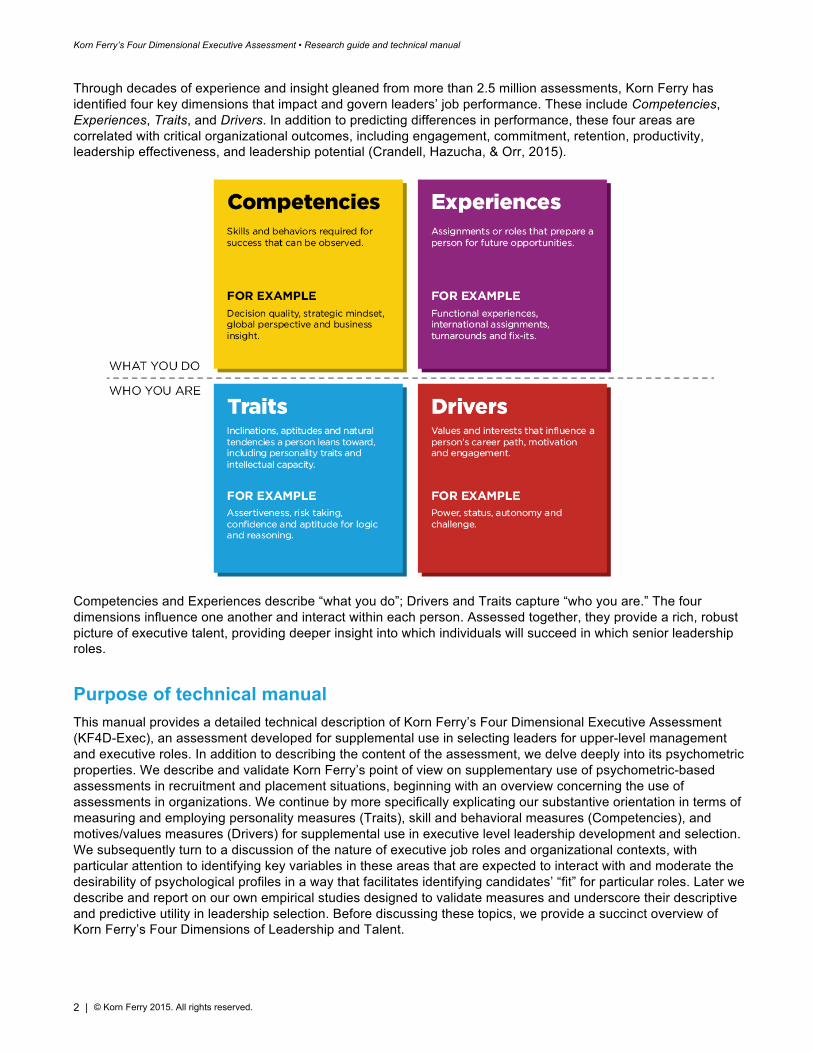
Through decades of experience and insight gleaned from more than 2.5 million assessments, Korn Ferry has identified four key dimensions that impact and govern leaders’ job performance. These include Competencies, Experiences, Traits, and Drivers. In addition to predicting differences in performance, these four areas are correlated with critical organizational outcomes, including engagement, commitment, retention, productivity, leadership effectiveness, and leadership potential (Crandell, Hazucha, & Orr, 2015).
Competencies and Experiences describe “what you do”; Drivers and Traits capture “who you are.” The four dimensions influence one another and interact within each person. Assessed together, they provide a rich, robust picture of executive talent, providing deeper insight into which individuals will succeed in which senior leadership roles.
Purpose of technical manual This manual provides a detailed technical description of Korn Ferry’s Four Dimensional Executive Assessment (KF4D-Exec), an assessment developed for supplemental use in selecting leaders for upper-level management and executive roles. In addition to describing the content of the assessment, we delve deeply into its psychometric properties. We describe and validate Korn Ferry’s point of view on supplementary use of psychometric-based assessments in recruitment and placement situations, beginning with an overview concerning the use of assessments in organizations. We continue by more specifically explicating our substantive orientation in terms of measuring and employing personality measures (Traits), skill and behavioral measures (Competencies), and motives/values measures (Drivers) for supplemental use in executive level leadership development and selection. We subsequently turn to a discussion of the nature of executive job roles and organizational contexts, with particular attention to identifying key variables in these areas that are expected to interact with and moderate the desirability of psychological profiles in a way that facilitates identifying candidates’ “fit” for particular roles. Later we describe and report on our own empirical studies designed to validate measures and underscore their descriptive and predictive utility in leadership selection. Before discussing these topics, we provide a succinct overview of Korn Ferry’s Four Dimensions of Leadership and Talent.
Korn Ferry’s Four Dimensional Executive Assessment • Research guide and technical manual
3 | © Korn Ferry 2015. All rights reserved.
Korn Ferry’s Four Dimensions of Leadership and Talent: A brief and general overview
Competencies Competencies are observable skills and behaviors required for success at work (Lombardo & Eichinger, 2009). They provide a snapshot of a person’s level of proficiency on work-related skills, revealing what the person is capable of doing now. Competency models have become a popular and effective tool for aligning and implementing HR and business initiatives. From the proliferation of models, what competencies truly matter?
Based on a review of the literature, consideration of key business trends, and insights from our data, Korn Ferry has identified and organized critical leadership competencies. The Korn Ferry Leadership Architect library is comprised of 4 factors, 12 clusters, and 38 competencies (Korn Ferry, 2014a). Depending on the leadership level, third-party-rated proficiency with these competencies accounts for between 43% and 64% of total job performance (Barnfield, Dai, Jouve, Orr, Sneltjes, & Storfer, 2014). KF4D-Exec measures 15 of the 38 competencies in our framework. These 15 competencies and their ties to executive success are reviewed in detail later in this manual.
Experiences Experiences are the roles and assignments comprising a person’s career history. They sum up major work-related events and accomplishments, highlighting what an individual has had the opportunity to do and learn. Highly developmental assignments take people out of their comfort zone and involve high visibility, a risk of failure, ambiguity, and a broad scope of responsibility. Examples include managing a turnaround, taking a global assignment, or managing a crisis.
Experiences distinguish leaders. Compared with leaders at other levels, CEOs are more likely to have completed developmental experiences in financial management, strategy development, and external relations (Sevy, Swisher, & Orr, 2014). The experiences of exceptional CEOs even stand out. In a recent study, the top 20% of CEOs on Korn Ferry leadership simulations were those who had greater experience in growing businesses, managing crises, developing strategies, and managing finances (Crandell et al., 2015).
Within the context of executive search, information on candidates’ rich and varied experience is gathered by Korn Ferry’s expert Search Partners, rather than measured with KF4D-Exec. Measures of experience are part of other Korn Ferry assessments, including the Korn Ferry Assessment of Leadership Potential (Korn Ferry, 2015).
Traits Traits are a person’s natural tendencies and abilities, including personality traits and intellectual capacity. Traits guide an individual’s behavior, but can at times be difficult to observe. In addition, although traits reflect stable aspects of “who people are,” they can change slowly over time as people take on new challenges. For example, an introvert who wants to build networks or exert more influence may consciously reach out to meet new people and make an effort to speak out.
For organizations looking to maintain a healthy supply of leaders, individuals’ traits can provide an indicator of those who have high potential for moving into top-level leadership roles. Personality traits and intellectual ability are well-established correlates of leadership success (DeRue, Nahrang, Wellman, & Humphrey, 2011; Judge, Colbert, & Ilies, 2004; Judge, Bono, Ilies, & Gerhardt, 2002).
Korn Ferry research has found that personality profiles at progressive levels of management look substantially different. For example, for first-level supervisors, the traits that strongly correlate with engagement/performance include Need for achievement, Curiosity, Persistence, and Adaptability. For high-level executives, success is also tightly bound to Need for achievement and Curiosity—but top leaders also need much higher degrees of traits such as Risk-taking and Tolerance of ambiguity. As described later in this manual, Korn Ferry has identified 14 key traits for executive candidates.
Korn Ferry’s Four Dimensional Executive Assessment • Research guide and technical manual
4 | © Korn Ferry 2015. All rights reserved.
Drivers Drivers are the deep internal values, motivations, and aspirations that influence a person’s choices. They lie at the heart of critical questions: What is important to me? What do I find rewarding? Do I want more challenge in my work? Stability? Responsibility? Drivers capture the “will do” that creates engagement and energy for a task or role.
Drivers are instrumental to cultural fit, employee engagement, and talent retention. To the extent that leaders’ drivers are aligned with their roles and contexts, they will be energized by them. Drivers are essentially the pivot point for the other three dimensions: if driven, an individual may moderate personality traits, work to improve competencies, or seek out experiences to progress toward a professional goal.
The Korn Ferry drivers framework is a research-based, comprehensive taxonomy of six work-related motivational drivers comprised of 18 sub-dimensions. These drivers are discussed in detail later in this manual.
How to use Korn Ferry’s Four Dimensional Executive Assessment KF4D-Exec is designed to be employed as part of a broader and high-touch process by which candidates are recommended for upper-level management and/or executive role vacancies. It was not developed or intended for use as a screening tool, but rather as a supplement to Korn Ferry’s long-standing, well-informed, and comprehensive executive search process by which our Search Partners and Search Professionals work with clients to identify and vet candidates using their own wealth of experience, insight, expertise, and relationships. KF4D-Exec and all related processes are designed to contribute to related discussions and serve as a single data-point among many that are often otherwise qualitative and/or based on insight and conditions that KF4D-Exec was not designed to measure or incorporate. Ultimate decisions concerning best-fit candidates are made as a result of discussions and multiple points of contact between client representatives, candidates, and Korn Ferry Search Professionals. We place high value and ultimately defer to the expertise and experience of our Search Partners and related personnel. KF4D-Exec was designed for descriptive and value-added purposes to supplement their work and not to replace nor trump their deep professional skill, judgment, insight, and experience.
In aggregate, KF4D-Exec offers both predictive and descriptive value-added utility. While predictive utility is perhaps often emphasized in applied use and in validation efforts, we emphasize and underscore the tool’s descriptive utility as well. The use of scientifically developed measures and models for predicting success do not and should not preclude the continued use of subjectivity, traditional screening methods, and client preference in personnel selection, promotion, development, and/or placement decisions—even subjectivity which is informed by the measures themselves. Given adequate measurement properties, nearly all psychometric-based assessments, regardless of whether and how they have been empirically validated for predictive use, have considerable descriptive utility and tap constructs that may or may not be elucidated with traditional screening methods. As such, the added value associated with psychometric-based measures involves the results of respondent profiles and their descriptive utility as well, viz., what they suggest in terms of one’s social, cognitive, and emotional tendencies in general, regardless of criterion-related issues and target scores that are calibrated using criterion-related data and job spec variables.
Psychometric-based assessments add demonstrable value for personnel decisions, and their continued and increasing use among human resources departments, personnel search organizations, and personnel development firms is, as such, for good reason (Tett, Jackson, & Rothstein, 1991; Scroggins, Thomas, & Morris, 2008; Thomas & Scroggins, 2006; Lombardi, 2011). Nonetheless, the diverse nature of workplace roles, job demands, organizational and national cultures, and the challenges of applied research make identifying and employing predictive measures for workplace success increasingly complex. As such, traditional measures and methods will and should maintain a stable presence in the process of identifying candidates for job vacancies and promotional opportunities—and for good reason. These include things like resume and reference checks, experience, education, skills, interviews, referrals, and subjective notions of fit on diverse variables among key organizational players and decision makers. Among applicant pools and existing personnel who may be targeted for hiring and/or promotion, these “hard fit” variables no doubt contribute to a very large portion of the (often unmeasured) variability in who will ultimately succeed in a job across key outcomes. The use of formal psychometric-based assessments—including measures of personality, problem-solving style, cognitive processing, emotional tendencies, social behavior, career motives, and others—has also played a significant role in personnel research and selection and shows strong indications of increasing in popularity (Kristof-Brown, Zimmerman, & Johnson, 2005). For executive search in particular, we believe and emphasize that the increasing popularity of formal psychometric-based assessments adds value to the extent they are used in supplementary ways and necessarily in conjunction with more traditional and experience-based practices and not as replacements of them.
5 | © Korn Ferry 2015. All rights reserved.
Section 2 The scientific foundation for Korn Ferry’s Four Dimensional Executive Assessment
Korn Ferry’s Four Dimensional Executive Assessment • Research guide and technical manual
6 | © Korn Ferry 2015. All rights reserved.
Measures in the workplace For over a hundred years, psychologists and human resources decision makers have sought and identified measures and methods that increase and/or predict human performance in vocational capacities and in the workplace. As early as 1911, for example, Fredrick Taylor1 showed that systematically scheduling carefully structured and periodic breaks for workers (whose primary job involved handling heavy metal ingots) drastically decreased company costs, reduced fatigue, increased productivity, and resulted in more worker retention. A few years later, during WWI, psychologists developed empirically and theoretically based methods for screening and assigning selected recruits to military jobs in which they would be expected to perform well. Many other important developments were seen over the 20th century and have contributed to the well-established nature of the organizational and industrial psychology and, more broadly, the science of personnel within organizations (see McCarthy, 2002, for a brief review).
Today, the diverse nature of workplace roles, job demands, organizational cultures, and the challenges of applied research have made identifying and employing predictive measures for workplace success increasingly complex. Many measures and methods are quite commonplace and will likely maintain a stable presence in the process of identifying candidates for job vacancies and promotional opportunities—and for good reason. These include what are commonly referred to as “traditional” measures and screening methods, including things like resume and reference checks, experience, education, skills, interviews, referrals, and subjective notions of fit on diverse variables among key organizational players and decision makers. Among applicant pools and existing personnel who may be targeted for hiring and/or promotion, these “hard fit” variables no doubt contribute to a very large portion of the (often unmeasured) variability in who will ultimately succeed in a job across key outcomes. The use of formal psychometrics—including measures of personality, problem-solving style, cognitive processing, emotional tendencies, social behavior, career motives, and others—has also played a significant role in personnel research and selection and shows strong indications of increasing in popularity (Kristof-Brown, Zimmerman, & Johnson, 2005). Human resources departments, personnel search organizations, and personnel development firms increasingly seek and employ these and other “soft fit” measures in making personnel decisions (Tett et al., 1991; Scroggins, Thomas, & Morris, 2008; Thomas & Scroggins, 2006; Lombardi, 2011).
The moderated desirability of assessment scores and profiles The process of fitting a person to a job role and coming to expect maximum or, at least, relatively high personnel performance according to the results of psychometric assessments can be a highly complex one. On the one hand, much research suggests that certain psychological tendencies and cognitive abilities do seem to have a non-context and non-role-specific effect on job performance. For example, provided that sufficiently wide ranges are present in a given sample, individuals with higher general cognitive ability (e.g., IQ) tend to perform better in most professional vocations (Neisser, Boodoo, Bouchard, Boykin, Brody, Ceci, Halpern, Loehlin, Perloff, Sternberg, & Urbina, 1996; Schmidt, Ones, & Hunter, 1992), with perhaps few exceptions (e.g., Lewis, 2015). Yet a one-size-fits-all approach to the predictive utility of many potentially useful psychological constructs is likely to lead human resources professionals and decision makers astray in a considerable number of cases (Tett et al., 1991; Guion, 1998; Tett & Burnett, 2003).
The nature of job roles, organizational contexts, national cultures, and issues surrounding job vacancies are all likely to moderate the desirability of a given response profile on any single measure or group of psychometric measures (Guion, 1998). For example, highly successful individuals in vocations requiring a high degree of expert orientation often have and likely require quite different social behavior and problem-solving tendencies compared to highly successful individuals in people management, executive strategy, and strategic decision-making vocations (Brousseau, 2008).2 Elsewhere, individuals who are well-adjusted socially and emotionally tend to perform better in most jobs, but the impact and importance of emotional intelligence on job performance and related outcomes is apparently more salient for some job roles—including those that require a greater degree of effectively leveraging the skills and abilities of others (Brousseau, Driver, Hourihan, & Larsson, 2006). Moreover, 1 Taylor began doing work as early as 1883. 2 In fact, an expert orientation among executive decision makers is sometimes conceptualized as debilitating and clearly predictive of low performance, as we will partially demonstrate later in this technical manual.
Korn Ferry’s Four Dimensional Executive Assessment • Research guide and technical manual
7 | © Korn Ferry 2015. All rights reserved.
higher-order and cross-level interactions may often be worthy of consideration. A psychological profile in a given job role can be desirable in one industry, company type, company size, national culture, or organizational culture, but undesirable in others (Tett & Burnett, 2003; Lewis, 2012; Lewis & Landis, 2015). In short, some measures yield a single desirable score or profile that can be expected to predict success or indicate potential for success for nearly all respondents across roles and contexts (Harter, Schmidt, Kilham, & Agrawal, 2009), while the desirability of scores or score profiles on other measures are subject to job and context-specific interaction (Lewis, 2012; Tinsley, 2000).
Whether characteristic scores on a measure are desirable in every case or whether they depend on context is a reflection of the way in which the measure’s impact is moderated—and the nature and magnitude of moderation can vary. In some cases, elevated scores on some measure might always be predictive of increased (or decreased) success, but the magnitude of its predictive coefficient(s) might vary across job roles and organizational contexts. Here, we have moderated magnitude, which can indicate the degree of salience for a variable across contexts. On the other hand, elevated levels on some variables may sometimes be positively associated with desired outcomes and other times negatively associated. Here, we have moderated sign, which will indicate whether an elevated score is desirable or undesirable. Clearly, magnitude and sign moderation are not mutually exclusive, although elevated levels of variables having only the former will help forecast success in all or most cases, regardless of contexts or the nature of job roles. Identifying not only specific moderator variables but also gauging whether, how, and the degree to which a variable’s impact is moderated has much potential to offer an approach to customizing assessment-based personnel services across job roles and contexts.
Descriptive utility always The use of scientifically developed measures and models for success prediction also does not and should not preclude the continued use of subjectivity and client preference in executive recruitment, selection, promotion, development, and/or placement decisions—even subjectivity which is informed by the measures themselves. Given adequate measurement properties, nearly all work-related assessments, regardless of whether they have been empirically evaluated for predictive use, have descriptive utility and the potential to tap constructs that may not be elucidated with traditional non-psychometrically-based screening methods. The added value of psychometrically-based measures includes leveraging aggregate research findings of how respondent profiles interact with job and organizational variables in relating to success outcomes. That is, leaders’ response profiles on an assessment, such as KF4D-Exec, may be used in conjunction with what has been learned in research about the interaction among leader, job, and organizational characteristics to inform recommendations about personnel decisions.
Describing, fitting, and succeeding The utility of psychometrics for the selection, recruitment, development, succession planning, and career guidance (etc.) of leaders can come in one or more of at least three different forms. Assessments measuring capabilities known to be related to leader success, such as social, cognitive, and emotional abilities and tendencies, offer descriptive utility. They provide insights valuable for subjective consideration. Other measures can yield scores whose desirability have been empirically established to always or most often be moderated by job and contextual variables. These measures have both descriptive utility and the ability for predicting or determining fit for a particular job role, context(s), or the interaction between them. Measures can also empirically forecast success in all or most cases, regardless of contexts or the nature of job roles. These are general success predictors, whose indication of fit is not context specific; these also retain descriptive utility. Any battery of psychometric assessments should contain measures that address one or more of these components individually and perhaps all of them collectively, depending upon the applied use of the assessment.
A comprehensive assessment framework for applied use is also tied to a larger theoretical framework. Such a framework is often informed by the extant research literature and is tied to outcome measures, which may include performance, success, fit, job satisfaction, work engagement, and others. Theory and scientific understanding can also be induced and cross-validated for confirmation, given sufficient amounts of data. Whether a measure’s utility is only descriptive, is both descriptive and informs fit based on contextual factors only, or is useful for fit calibration and success prediction in a single way across contexts is also either based on theoretically driven reasoning and/or appropriately designed data-based induction.
Korn Ferry’s Four Dimensional Executive Assessment • Research guide and technical manual
8 | © Korn Ferry 2015. All rights reserved.
In the following sections, we focus on describing the traits, competencies, and drivers measured by KF4D-Exec. We delve deeply into the extant literature to illuminate the theoretically driven reasoning supporting their assessment. In addition, we review the literature on organizational culture, providing key background on the role played by culture in executive search. This lays the foundation for latter sections of the manual in which we provide empirical analyses that demonstrate the technical robustness of KF4D-Exec and offer evidence-based guidance for score interpretation in diverse search contexts.
Traits Traits are personality characteristics that exert a notable influence on behavior. They include attitudes, such as optimism, and other natural leanings, such as social astuteness. In organizational psychology, traits may be more or less crucial for success depending on job roles and contexts. Traits measures are perhaps the most visible and well-researched measures available in all of psychology and include (but are not limited to) measures designed specifically for applied use in organizational and corporate settings. For this and other reasons, they carry a considerable degree of legitimacy in diverse contexts and are often expected by clients and human resources practitioners who are seeking assessment services for their organizations (Zaccaro, 2012; Hiller, DeChurch, Murase, & Doty, 2011). To further underscore their high degree of visibility and legitimacy, consider that arguably the largest assessment company in the corporate assessment space is Hogan Assessment Systems who lead with their “Big Seven” personality assessment as well as their “11 Career Derailers” assessment (the latter contains constructs that are closely related to personality both statistically and substantively) (Hogan & Hogan, 2009a, 2009b). The well-known “Big Five” personality constructs include Agreeableness, Conscientiousness, Sociability, Neuroticism, and Openness to Experience. Although notable temporal variability and responsiveness to focused intervention has been shown (Gopinath, 2014; Slaski & Cartwright, 2003), traits are relatively stable over time and have shown good evidence of cross-cultural/cross-regional validity (Costa & McCrae, 1988). Personality measures have both descriptive and predictive utility and are seen as the key component to a “dispositional perspective” on job outcomes (House, Shane, & Herold, 1996).
Decades of research efforts offer insight into the application of trait measures among upper-level management and executive leaders. Meta-analyses and meta-analyses of meta-analyses (Judge, Bono et al., 2002; Ones, Dilchert, Viswesvaran, & Judge, 2007) have demonstrated that at least three of the Big Five personality constructs show sometimes moderated but generally consistent applicability for use among upper-level management and executive leaders. Although these constructs are sometimes described by different names and according to somewhat different conceptualizations, they are perhaps most commonly known as Openness to Experience, Sociability (sometimes overlapping more or less with components of Emotional Intelligence [EQ]), and Conscientiousness. In light of competing conceptualizations, factor structures, and naming conventions across the scientific literature, we henceforth refer to these by terms that distinguish our own conceptualization of each, such that Agility, Social leadership, and Energy roughly correspond to Openness to Experience, Sociability/EQ, and Conscientiousness, respectively.
In the following sections, we discuss each trait and its sub-components in turn. For each trait, we first describe it and briefly review past research relating the trait to leadership and executive outcomes. We also consider the potential moderation of the relationship between the trait and outcomes by job or organizational factors. Then, we describe each sub-component of the trait, discussing past research findings—including potential moderators—before moving on to discuss the next broad trait. Our selection of traits, including sub-components, was driven by what personality constructs have shown the most consistently robust relationships with leader outcomes of interest in prior research.
Agility (AG) Agility refers to an individual’s capacity for complexity, novelty, adaptability, cognitive flexibility, risk, ambiguity, and change. Individuals who are highly agile tend to eschew dogmatism and rigidity, and they place a particularly high value on learning and growing from experiences, including failures (Swisher, Hallenbeck, Orr, Eichinger,
Korn Ferry’s Four Dimensional Executive Assessment • Research guide and technical manual
9 | © Korn Ferry 2015. All rights reserved.
Lombardo, & Capretta, 2012; Lombardo & Eichinger, 2000).3 In general, executive leaders tend to be among the highest scorers on measures of Agility compared to lower-level managers and professionals (Dai, De Meuse, & Tang, 2013). Across the psychological research literature, Agility typically shows positive correlations with leadership emergence, leadership effectiveness, compensation, leadership competence, and promotion rates (Judge & Bono, 2000; Judge, Bono et al., 2002), and conceptualizations of leadership potential often include expected high scores on Agility-like measures (Lominger International, 2007; Swisher, 2012; Cashman, 2013; De Meuse, 2011; Dai et al., 2013; De Meuse, Dai, & Hallenbeck, 2010). Executives high in Agility-like measures typically receive higher marks on measures of overall performance, speed to promotion and retention (Landis, Brousseau, & Johnson, 2011), engagement and job satisfaction, inspirational motivation/idealized influence (Judge & Bono, 2000), composite measures of transformational leadership behavior (Judge & Bono, 2000), and general leadership readiness and leadership skill.
Agility and its predictive utility may be moderated by job and contextual factors. Judge, Bono et al. (2002), for example, reported meta-analytic results on the impact of Agility on leadership and found a positive effect for studies of private sector business, but a zero effect among leaders in government and military. These and other findings offer the beginnings of a framework for understanding the moderated utility of trait profiles on predicting success. Agility has also been used to predict and understand variability in company-level outcomes. Researchers have argued (Everaert, Roy, & Kingdom, 2012; Roy, 2012) and demonstrated (Lewis, 2013) that upper-level executive leadership teams characterized by high collective Agility are crucial for company-level success, particularly in economic or market conditions characterized by volatility, fast change, and slow growth, and among companies and company cultures whose objectives require and emphasize innovation, competition, profitability, market disruption, and market responsivity (Judge, Thoresen, Pucik, & Welbourne, 1999). Agility and its effects on executive success and related outcomes can be better understood by examining its sub-components as described below.
Risk-taking. Operationally, Risk-taking (RI) refers to a willingness to make decisions based on limited information or to take a stand. People high on measures of RI are characterized by a preference for success over security and are likely to exhibit willingness for substantial risk in decision making. Low scorers tend to prefer familiar, prudent, and conservative approaches to decision making and problem solving. Among executives, including CEOs, RI is inversely related to measures of negative affect and anxiety (Delgado-Garcia, Quevedo-Puente, Fuente-Sabate, 2010), and most studies of RI in organizational psychology find that RI typically increases at higher levels of management and leadershi. Moreover, RI is most often associated positively with measures of performance and success among executive managers (Delgado-Garcia et al., 2010; MacCrimmon & Wehrung, 1990). Executives higher in RI also tend to have higher incomes, more education, higher perceived and actual authority, and they tend to work for larger companies (Pavic & Vojinic, 2012; MacCrimmon & Wehrung, 1990). Conversely, risk-aversion (low RI) has been associated with a tendency to punish subordinates for actual or perceived failure, discourage potentially fruitful experimentation, and make decisions based on self-interests more than company interests (Berglas, 1997). Low risk-propensity among executives is also typically associated with weak goal setting, stifling growth and innovation, rigidity, and excessive time to decision making (Boswell, 2013; Galasso & Simcoe, 2011). Fear of risk aversion is sufficiently large and widespread to prompt a notable number of high-profile companies to design compensation packages that will penalize risk-averse executives (Heaney, 2005). Risk-taking also shows indications of being negatively associated with undesirable or premature CEO turnover, particularly when incentivized at appropriate levels (Cziraki & Xu, 2014). Interestingly, experienced executives usually make an impassioned and marked distinction between RI and gambling, such that the latter is far more associated with chance, luck, odds, and “rolling dice.” Rather, executives typically combine notions of RI and its adaptive application with references to skill, experience, informed judgment, and the ability to exert some degree control. Risk-taking is applied or avoided in the context of what can be calculated and what can be done and managed in the case of failure, degrees of failure, and ongoing decision-making processes. Interestingly, both empirical examinations and anecdotal reports from successful managers with adaptive RI tendencies (Shapira, 1995) typically draw associations between adaptive risk-taking and confidence, energy, action orientation, broad employability, confidence, promotability, and achievement orientation. Conversely, risk-aversion is often associated 3 Agility is related to, but differs from Learning agility, which is a key signpost in the Korn Ferry Assessment of Leadership Potential. Learning agility is defined as the willingness and ability to learn from experience, and subsequently apply that learning to perform successfully under new or first-time conditions (Lombardo & Eichinger, 2000; Korn Ferry, 2015). Although Adaptability, Curiosity, Tolerance of ambiguity, and Risk-taking are components of both Agility and Learning agility, Learning agility is broader. For example, Learning agility also involves People agility and Results agility. Agility also is distinct from Learning agility in that it incorporates (negative) Focus.
Korn Ferry’s Four Dimensional Executive Assessment • Research guide and technical manual
10 | © Korn Ferry 2015. All rights reserved.
with notions of pessimism, unwillingness to do more than one’s job description, complacency, defensiveness, and slow decision making (Shapira, 1995).
Despite the many associations between RI and executive outcomes, it is clear that the frequently cited positive effect of RI can sometimes be moderated. Companies or industries characterized by increased need for regulation and stability are less likely to reward risk propensity in terms of compensation, promotability, and/or performance evaluation. Not only company/industry, but job characteristics and other traits within individuals may also moderate the desirability of RI (e.g., Barrick, Parks, & Mount, 2005). Some management professionals speak in terms of company and/or job-based “risk-appetite” that, whether implicitly or explicitly measured, moderates not only the extent to which RI is desirable, but also helps to characterize RI as a trait for which there may be an ideal point under or over which executive dispositions may create misfit.
Adaptability. An adaptable executive is one who maintains comfort with unanticipated changes, including changes in goals and changes in the methods by which goals are pursued. They are typically willing and able to nimbly change approach, adapt easily to diverse situations, adjust to constraints, and manage or rebound from adversity. Executives who are not adaptable tend also to be change-averse and may react to multiple demands or changing priorities with a rigid or inflexible demeanor, or even with low composure or anxiety. Adaptability (AD) has repeatedly been described as a key component of agile leaders who facilitate change and lead effectively in economic or organizational conditions characterized by volatility (Everaert et al., 2012; Swisher, 2012; Orr, 2012). In the modern business climate, AD is increasingly characterized as crucial for executive success in general, but also particularly for leaders in organizations focused on innovation, and during times of change or crisis management (Kantor, Kram, & Sala, 2008; Martinuzzi, 2014). Low AD among C-level executives, including CEOs, is notably associated with underperformance, turnover, board mistrust, and lower pay, and, again, related associations are more pronounced during times of organizational adversity and industry change (Guay, Taylor, & Xiao, 2014). High adaptability is typical among senior executives with more breadth of experience and more complex career trajectories (Zhu, Wolff, Hall, Heras, Gutierrez, & Kram, 2013). AD has sometimes been characterized as a component of key emotional constitution for an executive, such that low AD can impact affective and social outcomes as well, including relationships and perceived managerial performance among peers, subordinates, and superiors (Calarco & Gurvis, 2006). Executives with low adaptability are less efficient in terms of resource use and self-perceived resource need, including human capital (Plattner, 2011). Although market circumstances, cultures, or the nature of executive roles may impact the extent to which adaptability is crucial for leaders, there is generally an overwhelming research consensus spanning 20+ years indicating that AD has measurable and consistent positive effects on most key leadership outcomes—including both individual- and company-level outcomes (Reeves & Deimler, 2011).
Korn Ferry’s Four Dimensional Executive Assessment • Research guide and technical manual
11 | © Korn Ferry 2015. All rights reserved.
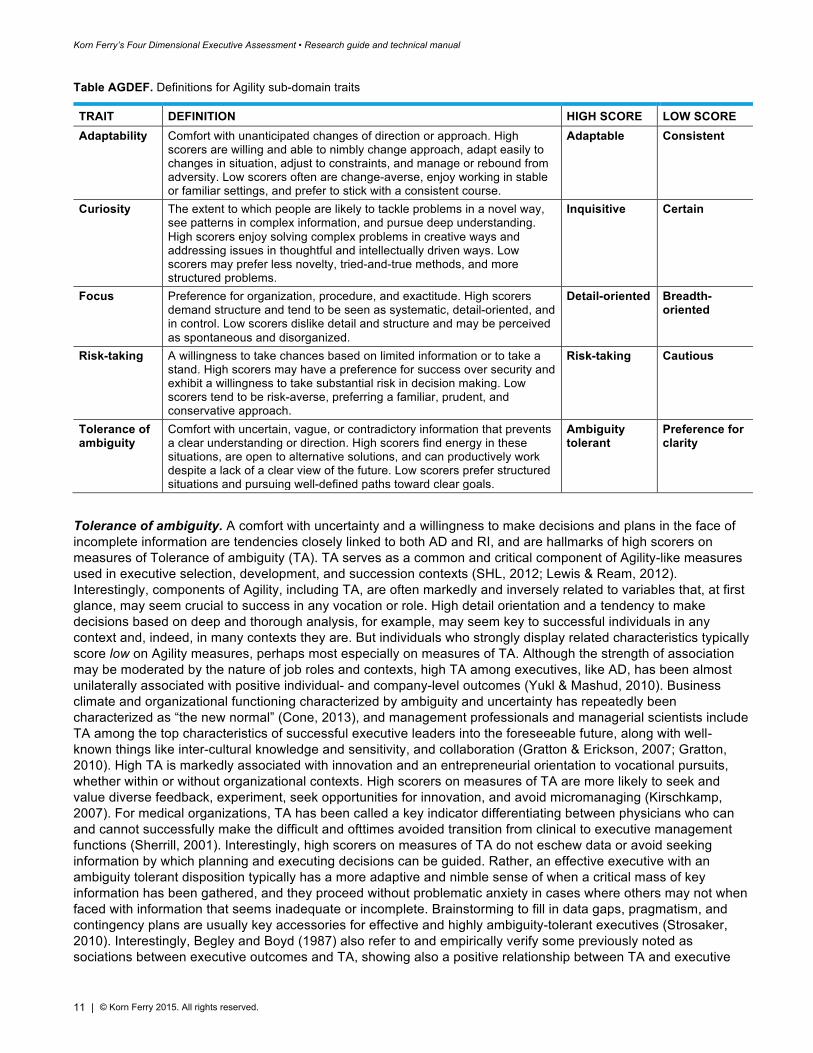
Table AGDEF. Definitions for Agility sub-domain traits
TRAIT DEFINITION HIGH SCORE LOW SCORE Adaptability Comfort with unanticipated changes of direction or approach. High
scorers are willing and able to nimbly change approach, adapt easily to changes in situation, adjust to constraints, and manage or rebound from adversity. Low scorers often are change-averse, enjoy working in stable or familiar settings, and prefer to stick with a consistent course.
Adaptable Consistent
Curiosity The extent to which people are likely to tackle problems in a novel way, see patterns in complex information, and pursue deep understanding. High scorers enjoy solving complex problems in creative ways and addressing issues in thoughtful and intellectually driven ways. Low scorers may prefer less novelty, tried-and-true methods, and more structured problems.
Inquisitive Certain
Focus Preference for organization, procedure, and exactitude. High scorers demand structure and tend to be seen as systematic, detail-oriented, and in control. Low scorers dislike detail and structure and may be perceived as spontaneous and disorganized.
Detail-oriented Breadth-oriented
Risk-taking A willingness to take chances based on limited information or to take a stand. High scorers may have a preference for success over security and exhibit a willingness to take substantial risk in decision making. Low scorers tend to be risk-averse, preferring a familiar, prudent, and conservative approach.
Risk-taking Cautious
Tolerance of ambiguity
Comfort with uncertain, vague, or contradictory information that prevents a clear understanding or direction. High scorers find energy in these situations, are open to alternative solutions, and can productively work despite a lack of a clear view of the future. Low scorers prefer structured situations and pursuing well-defined paths toward clear goals.
Ambiguity tolerant
Preference for clarity
Tolerance of ambiguity. A comfort with uncertainty and a willingness to make decisions and plans in the face of incomplete information are tendencies closely linked to both AD and RI, and are hallmarks of high scorers on measures of Tolerance of ambiguity (TA). TA serves as a common and critical component of Agility-like measures used in executive selection, development, and succession contexts (SHL, 2012; Lewis & Ream, 2012). Interestingly, components of Agility, including TA, are often markedly and inversely related to variables that, at first glance, may seem crucial to success in any vocation or role. High detail orientation and a tendency to make decisions based on deep and thorough analysis, for example, may seem key to successful individuals in any context and, indeed, in many contexts they are. But individuals who strongly display related characteristics typically score low on Agility measures, perhaps most especially on measures of TA. Although the strength of association may be moderated by the nature of job roles and contexts, high TA among executives, like AD, has been almost unilaterally associated with positive individual- and company-level outcomes (Yukl & Mashud, 2010). Business climate and organizational functioning characterized by ambiguity and uncertainty has repeatedly been characterized as “the new normal” (Cone, 2013), and management professionals and managerial scientists include TA among the top characteristics of successful executive leaders into the foreseeable future, along with well-known things like inter-cultural knowledge and sensitivity, and collaboration (Gratton & Erickson, 2007; Gratton, 2010). High TA is markedly associated with innovation and an entrepreneurial orientation to vocational pursuits, whether within or without organizational contexts. High scorers on measures of TA are more likely to seek and value diverse feedback, experiment, seek opportunities for innovation, and avoid micromanaging (Kirschkamp, 2007). For medical organizations, TA has been called a key indicator differentiating between physicians who can and cannot successfully make the difficult and ofttimes avoided transition from clinical to executive management functions (Sherrill, 2001). Interestingly, high scorers on measures of TA do not eschew data or avoid seeking information by which planning and executing decisions can be guided. Rather, an effective executive with an ambiguity tolerant disposition typically has a more adaptive and nimble sense of when a critical mass of key information has been gathered, and they proceed without problematic anxiety in cases where others may not when faced with information that seems inadequate or incomplete. Brainstorming to fill in data gaps, pragmatism, and contingency plans are usually key accessories for effective and highly ambiguity-tolerant executives (Strosaker, 2010). Interestingly, Begley and Boyd (1987) also refer to and empirically verify some previously noted as sociations between executive outcomes and TA, showing also a positive relationship between TA and executive
Korn Ferry’s Four Dimensional Executive Assessment • Research guide and technical manual
12 | © Korn Ferry 2015. All rights reserved.
ROI marks. High TA scores, they assert, are a hallmark of the Type A successful managerial professional who is also typically competitive, tenacious, and skeptical when faced with reports concerning the insurmountability of time and/or resource limitations.4 They also hypothesize and empirically demonstrate, however, that levels of TA and related variables can and do become dysfunctional if too high and/or non-commensurate with needs as dictated by contextual variables. TA then, like RI and others, is typically relatively high among more successful managers, while yet having potential for ideal point values that are likely context dependent, above (or below) which the adaptive nature of TA will cease to be adaptive and become problematic for performance and sustainability.
Curiosity. Curiosity (CU) is the extent to which individuals approach problems in novel ways, see patterns and potential for synthesis in complex information, and pursue deep understanding. High CU scorers tend to seek and solve complex problems creatively and address issues in thoughtful and intellectually driven ways. They also may be described as unconventional and skilled at making fresh connections between ideas and information. Low scorers tend to prefer less novelty and evaluate things according to conventional standards. They are inclined toward tried-and-true methods and prefer structured problems with clear and known solutions. Psychologists have otherwise characterized CU as “intellectual engagement” (Woo, Harms, & Kuncel, 2007) or “mental agility” (Orr, 2012; Swisher, 2012; Cashman, 2013) and describe individuals with low CU as less experienced, insular, inclined toward specialization more than breadth, more interested in answers than in questions, and deferential to logic and convention in potentially limiting ways. A curious executive is likely to express complex things in simple and compelling ways, extract digestible essences from complexity and seemingly unrelated things, and conjure multiple characterizations of single pieces of information or stimuli (also see Brousseau et al., 2006).
Psychologists studying CU draw comparisons between CU and general intelligence (IQ). While there is little or no disagreement that they are divergent constructs, CU has shown a consistently positive but modest correlation with “crystalized intelligence,” which is a measure of accumulated knowledge and skill and the ability to apply them across circumstances. CU tends not to be related to conceptualizations of intelligence that involve pure deductive or inductive reasoning ability independent of experience and acquired knowledge (Goff & Ackerman, 1992; Ackerman & Goff, 1994; also see Spearman, 2005, for a discussion on different types of IQ).
While average intelligence (or higher) has been described as a necessary antecedent of CU, its inclusion in measurement batteries predicting emergence and success among executive leaders has been called, by at least one organizational psychologist, “smarter than IQ” (De Meuse, 2011). Boss ratings of performance and behavior have shown that high scores in CU may not predict promotion among management personnel, but they do predict performance after promotion, and predictive strength has been seen at levels commensurate with statistical notions of “strong prediction” (r = .53; Cohen, 1988). In fact, the authors (Lominger International, 2007) of one study concluded that if more people with high CU were promoted, “the net performance of promoted people would be much stronger” (p. 11). In organizational settings, CU tends to increase at higher levels of management and has been successfully used in the assessment of leadership potential (De Meuse, Dai, & Wu, 2011). Bivariate correlations with performance and leadership potential are moderately strong or strong for all management levels (Lominger International, 2007). It’s utility for career development intervention, succession planning, and selection has also been explicated (Fleit, Hansen, & Butler, 2013).
Focus. We include Focus (FO) among the components of Agility due to the inverse relationship between the two constructs.5 FO taps the extent to which individuals are detail oriented, thorough, and careful in decision making and work processes. Very high scorers may even be described as dogmatic and/or problematically perfectionist. Anecdotally, a problematically high FO score has been associated with “not understanding the extent to which perfect can be the enemy of good” (Simmons, personal communication). FO and FO-like scores tend to decrease at higher levels of management (Brousseau et al., 2006; Lewis & Ream, 2012). Interestingly, FO is sometimes positively associated with performance, but typically only among lower-level managers and individual contributors
4 Later discussions of related traits show that related trait profiles can be desirable or problematic, depending on circumstances. 5 Measures like FO that involve a tendency for detail orientation and thorough, prudent task completion are sometimes a component of Conscientiousness in Big Five personality inventories. Our analog to Conscientiousness (Energy, to be discussed in a later section) omits this component and includes it as a negative indicator of Agility as described here. This is done because of the known negative correlation with the latter and also due to the expectation that FO is negatively correlated with management levels and outcomes among higher-level managers, whom this report and the development of our instrument targets. The development of the Energy measure, as described in a later section, had as a goal an observed positive relationship with management level and with outcomes among higher-level managers.
Korn Ferry’s Four Dimensional Executive Assessment • Research guide and technical manual
13 | © Korn Ferry 2015. All rights reserved.
whose roles involve a notable degree of task orientation and applicability of expertise, perhaps as well as deference to protocol and well-defined process standards. Among executive leaders, FO and FO-like measures typically correlate negatively with executive performance and other management outcomes including career success (Lewis, 2012). Conceptually convergent or otherwise markedly correlated measures have even been characterized as derailers for executive managers (viz., “dutiful” in Hogan & Hogan, 2009a) and are negatively correlated with defining components of transformational leadership behaviors and traits, including measures much like those described earlier (e.g., Tolerance of ambiguity, Adaptability, Risk-taking). Given its known interaction with management level vis-à-vis having a negative or positive effect on performance, it is quite likely FO scores have effects on outcomes that are moderated also by the nature of job roles and contexts within upper-level management groups.
Social leadership (SL) In the modern business climate, social structures within organizations are increasingly characterized as “horizontal,” in ways that underscore the importance of inclusive and effective communication, relationship management, and deploying and investing in the right people in the right ways (Lewis, 2013). Decision-making discretion and organizational cultures that were once more typically hierarchic and “vertical” are now increasingly egalitarian and distributed. People, relationship quality, effective collaboration, and especially talent drive company growth and success now as much as or more than financial capital. As such, social tendencies, fostering motivation, emotional intelligence, and interpersonal skills among leaders are critically important for the success of professionals, leaders and companies, and teams within companies (Romanelli, Cain, & Smith, 2006; Harms & Crede, 2010; Colbert, Barrick, & Bradley, 2014).
As such, human resources professionals and organizational psychologists have increasingly developed and employed measures of emotional constitution and social disposition to help identify the best individuals for leadership roles. Studies of related measures have found them to have substantial impact in terms of predictive utility (Goleman 1998; Womenetics 2014).6 Although different conceptualizations and naming conventions exist (e.g., emotional intelligence, EQ, social skills, interpersonal competence) that sometimes reflect alternative factor structures or competing emphasis on factor sub-components (e.g., Empathy, Extraversion, Dominance, Self-awareness), most organizational psychologists ultimately agree that social-emotional behavior and regulation have measurable relationships with leadership behavior (Harms & Crede, 2010; Bono & Judge, 2004) and marked impact on leadership outcomes, particularly person-level outcomes among upper-level managers and executives (Judge & Bono, 2000). Like Agility, however, leaders’ aggregate scores on related measures also show predictive utility for group or company-level outcomes as well (Colbert et al., 2014; Lewis, 2012).
We conceptualize social-emotional regulation or Social leadership as an individual’s capacity for composure, self-awareness, empathy, affiliation, sociability, and for relating socially in ways that motivate and facilitate the success of others in terms of work-related activities. In the sections below, SL’s sub-factors are described in detail in terms of their conceptualization and known impact on leadership-related variables, including outcomes for executive leaders and their organizations.
Composure. Composure (CP) measures how people are prone to react in stressful situations. A composed individual tends to be calm, poised, and responds well to pressure. Conversely, low-scoring individuals are typically seen as anxious, unsettled, and prone to react to stressful situations in ways that are notably transparent and potentially perceived as negative. They’re also more likely to interpret situations or various stimuli as being stress inducing, and to have corresponding low scores on various ratings of impulse control, which is seen as a key underpinning of virtually all conceptualizations of emotional intelligence and emotional well-being (Goleman, 1995; Goleman, 1998; Gopinath, 2014; Lazarus, 1999). Even scientists from medical professions have suggested that executives and business leaders be selected by processes that include CP-like measures of stress tolerance in order to increase effective leadership and maximize potential for individual- and company-level well-being in both psychological and financial terms (Suurküla, 2015). In general, managerial professionals who are more composed and stress tolerant—particularly in times of organizational change—are more committed to their organizations, more satisfied with their jobs, have more self-esteem, perform better, and are less likely to be viewed as having
6 Given study participant populations having average or higher IQ ranges.
Korn Ferry’s Four Dimensional Executive Assessment • Research guide and technical manual
14 | © Korn Ferry 2015. All rights reserved.
reached career plateau (Judge et al., 1999). They also have more generalized positive affect and a notably higher degree of self-efficacy for achieving goals (Judge et al., 1999).
Low stress tolerance can also be clearly linked with decreased productivity (Aiello & Kolb, 1995). Researchers sometimes refer to the “non-existence” of stress-free modern managerial roles in ways that underscore the importance of stress tolerant dispositional tendencies and even related training for effecting both performance and health outcomes (Anbazhagan & Rajan, 2013). Simply put, everyone has stress—and perhaps most especially upper-level managers with high-profile responsibility and big accountability. As such, high CP is continually described as key to the success of executives in general. It has also been conceptualized as a component of executive “presence” (Dagley, 2013). According to Llopis (2014), for example, a composed executive has body language, an attitude, and general presence that elicit confidence and better work from peers and subordinates. They are more likely to see adversity as opportunity and behave in ways that, more times than not, prevent crises that may otherwise emerge as a result of low composure and related behavior.
Situational self-awareness. Situational self-awareness (SS) is an emerging construct in the industrial/organizational psychology literature. It is sometimes referred to as mindfulness, and has been called a “western adaptation to an eastern way of thought” (Haigh, Moore, Kashdan, & Fresco, 2011). SS involves one’s ability to regulate emotions, anticipate and be proactive for change, accept circumstances, live in the moment, reserve judgment, and be aware of even subtle internal and external information. Low scorers on SS are more likely to be focused on past or future events, are less aware of their impact on situations as they occur, and are more likely to use strict and well-defined heuristics when making decisions or characterizing a situation. Across studies and measurement instruments, SS has repeatedly shown compelling evidence of construct validity and has displayed key correlations with many other psychological constructs and outcomes (Haigh et al., 2011; Feldman, Hayes, Kumar, Geeson, & Laurenceau, 2007). Together with its theoretical foundations, correlational patterns help to elucidate the nature of SS and its potential utility. It has shown considerable positive relationships with positive affect, curiosity and exploration, emotional regulation, mood repair, and cognitive flexibility. Conversely, it has shown substantial negative relationships with a variety of maladaptive and problematic emotional and affective states. Specifically, increases in SS are associated with decreased anxiety, distress, depression, worry, rumination, thought suppression, avoiding experiences, and brooding (Kumar, Feldman, & Hayes, 2008; Johnson, 2007).
For much of its history, SS has been used as part of developmental plans for designing psycho-social interventions in diverse clinical and non-clinical settings. These include acceptance and commitment, relational frame theory, and a host of other cognitive-behavioral interventions (Baer, 2003). Related interventions designed to boost scores on SS-like constructs are emerging rapidly in organizational contexts as well (Hayes, Bond, & Barnes-Holmes, 2006) and have been explicated specifically for high-level executives (Passmore, 2007; Passmore & Marianetti, 2007). The potential utility of SS measures in organizations extends beyond its promising application for predicting who will be successful in the executive ranks. SS also can provide a framework or otherwise assist in coaching and development activities that show indications of substantially helping organizational personnel to manage stress, take advantage of stress, produce results while learning on the job, and mitigate derailment (Lee, 2012).
Emerging conceptualizations of emotional regulation increasingly embed SS in a larger framework as a component and an antecedent to pro-social behavior. It has otherwise been associated with effective strategic decision making, novelty seeking, adaptive risk-taking, and awareness of key resources among key players in organizations (Langer, 2009; Nadkarni & Barr, 2008; Weick & Roberts, 1993). Currently, the consensus in the extant literature is that SS has unilaterally positive effects in organizational contexts and beyond (Lee, 2012; Dane, 2011). Although no empirical work has shown otherwise, this notion is not without critique (Dane, 2011). The paucity of skepticism on SS as a strictly positive characteristic focuses mostly on its “wide attentional breadth” and how it might distract skilled professionals whose charge is to focus on limited information and limited scope issues in considerable depth (Dane, 2011). Ultimately, the criticism is that SS scores in executives may reach a debilitating critical mass associated with indecision and failure to react, more especially among management personnel whose roles involve more narrowly defined task expertise and relatively static task environments (Chajut & Algom, 2003)—job characteristics that are notably more common at lower levels of management, although not exclusively so. Still, given the clear and substantial positive relationships between SS and many general measures of positive adaptive behavior, strategic coping, and emotional states, it is likely that job roles and organizational context will only moderate the magnitude of its otherwise generally positive effect in occupational contexts (Goleman, 1998).
Korn Ferry’s Four Dimensional Executive Assessment • Research guide and technical manual
15 | © Korn Ferry 2015. All rights reserved.
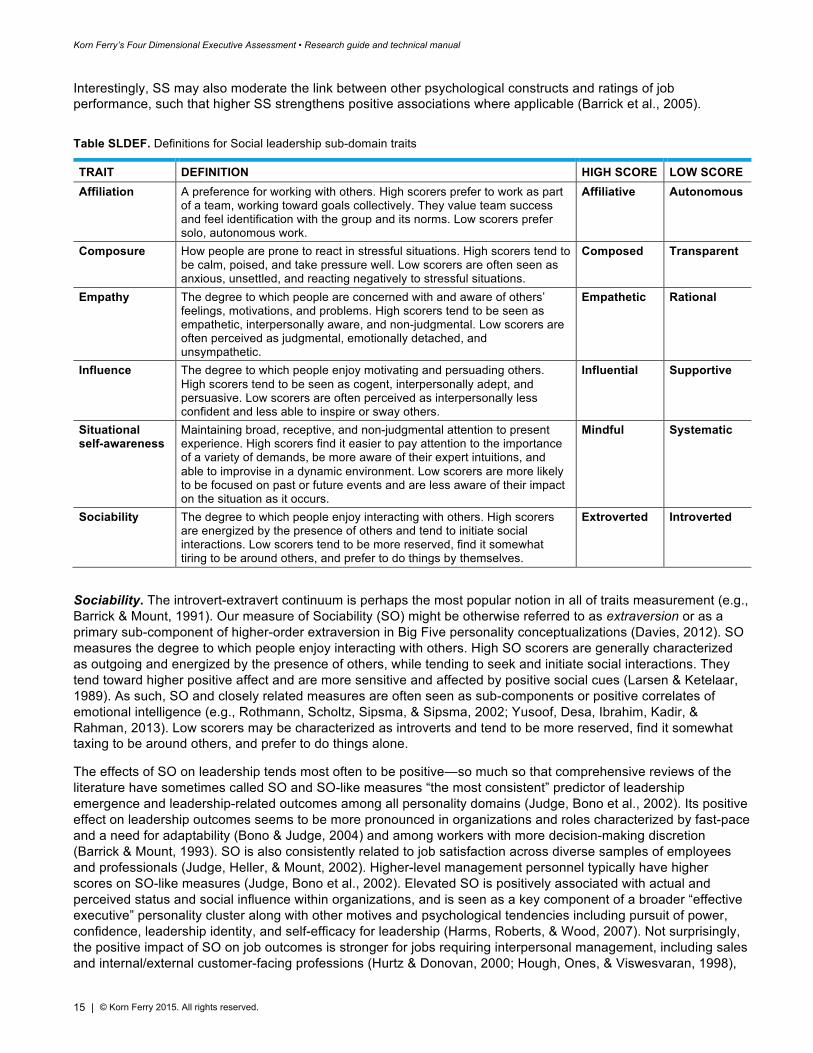
Interestingly, SS may also moderate the link between other psychological constructs and ratings of job performance, such that higher SS strengthens positive associations where applicable (Barrick et al., 2005).
Table SLDEF. Definitions for Social leadership sub-domain traits
TRAIT DEFINITION HIGH SCORE LOW SCORE Affiliation A preference for working with others. High scorers prefer to work as part
of a team, working toward goals collectively. They value team success and feel identification with the group and its norms. Low scorers prefer solo, autonomous work.
Affiliative Autonomous
Composure How people are prone to react in stressful situations. High scorers tend to be calm, poised, and take pressure well. Low scorers are often seen as anxious, unsettled, and reacting negatively to stressful situations.
Composed Transparent
Empathy The degree to which people are concerned with and aware of others’ feelings, motivations, and problems. High scorers tend to be seen as empathetic, interpersonally aware, and non-judgmental. Low scorers are often perceived as judgmental, emotionally detached, and unsympathetic.
Empathetic Rational
Influence The degree to which people enjoy motivating and persuading others. High scorers tend to be seen as cogent, interpersonally adept, and persuasive. Low scorers are often perceived as interpersonally less confident and less able to inspire or sway others.
Influential Supportive
Situational self-awareness
Maintaining broad, receptive, and non-judgmental attention to present experience. High scorers find it easier to pay attention to the importance of a variety of demands, be more aware of their expert intuitions, and able to improvise in a dynamic environment. Low scorers are more likely to be focused on past or future events and are less aware of their impact on the situation as it occurs.
Mindful Systematic
Sociability The degree to which people enjoy interacting with others. High scorers are energized by the presence of others and tend to initiate social interactions. Low scorers tend to be more reserved, find it somewhat tiring to be around others, and prefer to do things by themselves.
Extroverted Introverted
Sociability. The introvert-extravert continuum is perhaps the most popular notion in all of traits measurement (e.g., Barrick & Mount, 1991). Our measure of Sociability (SO) might be otherwise referred to as extraversion or as a primary sub-component of higher-order extraversion in Big Five personality conceptualizations (Davies, 2012). SO measures the degree to which people enjoy interacting with others. High SO scorers are generally characterized as outgoing and energized by the presence of others, while tending to seek and initiate social interactions. They tend toward higher positive affect and are more sensitive and affected by positive social cues (Larsen & Ketelaar, 1989). As such, SO and closely related measures are often seen as sub-components or positive correlates of emotional intelligence (e.g., Rothmann, Scholtz, Sipsma, & Sipsma, 2002; Yusoof, Desa, Ibrahim, Kadir, & Rahman, 2013). Low scorers may be characterized as introverts and tend to be more reserved, find it somewhat taxing to be around others, and prefer to do things alone.
The effects of SO on leadership tends most often to be positive—so much so that comprehensive reviews of the literature have sometimes called SO and SO-like measures “the most consistent” predictor of leadership emergence and leadership-related outcomes among all personality domains (Judge, Bono et al., 2002). Its positive effect on leadership outcomes seems to be more pronounced in organizations and roles characterized by fast-pace and a need for adaptability (Bono & Judge, 2004) and among workers with more decision-making discretion (Barrick & Mount, 1993). SO is also consistently related to job satisfaction across diverse samples of employees and professionals (Judge, Heller, & Mount, 2002). Higher-level management personnel typically have higher scores on SO-like measures (Judge, Bono et al., 2002). Elevated SO is positively associated with actual and perceived status and social influence within organizations, and is seen as a key component of a broader “effective executive” personality cluster along with other motives and psychological tendencies including pursuit of power, confidence, leadership identity, and self-efficacy for leadership (Harms, Roberts, & Wood, 2007). Not surprisingly, the positive impact of SO on job outcomes is stronger for jobs requiring interpersonal management, including sales and internal/external customer-facing professions (Hurtz & Donovan, 2000; Hough, Ones, & Viswesvaran, 1998),
Korn Ferry’s Four Dimensional Executive Assessment • Research guide and technical manual
16 | © Korn Ferry 2015. All rights reserved.
and individuals with higher levels of SO are more likely to pursue careers involving enterprising, sales, management, merchandising, politics, and public service (Larson & Borgen, 2002).
Despite its many and consistent positive effects, elevated SO has sometimes been associated with negative performance ratings in certain job contexts and on certain job-related outcomes (Hartman, 2005). High extraverts, for example, are more likely to have issues with absenteeism and perceived lack of dependability. They also tend toward lower ratings on measures of citizenship behavior, intrinsic motivation, and, in certain circumstances, they are more likely to turnover—even when highly satisfied with their jobs (Stuart & Carson, 1997; Furnham & Miller, 1997; Judge, Martocchio, & Thoresen, 1997). Elevated aggregate SO among top management teams has also been empirically associated with lower average organizational commitment within companies (Colbert et al., 2014). Its impact is less salient and sometimes zero or slightly negative among individual contributors, professional experts, and skilled or semi-skilled professionals (Ones et al., 2007). Measures of SO have also been notably and positively correlated with other constructs that are sometimes described as career derailers. Hogan and Hogan (2009a), for example, report a notably high correlation (with positive magnitude approaching what is conventional for evidence of convergent measures) between SO and a career derailer they call “colorful,” which is strongly associated with poor listening skills and potentially problematic attention-seeking behavior. Others have studied interaction between SO and team composition in ways that underscore circumstances that favor introverted leaders (Grant, Gino, & Hofmann, 2011). Recent studies also suggest that the commonly observed positive effect of SO on job outcomes may not be entirely linear, at least for certain job roles—including sometimes those having a marked social component (Blickle, Meurs, Wihler, Ewen, Merkl, & Missfield, 2015). It is perhaps not difficult to imagine hyper-extraversion as being potentially problematic, particularly when not accompanied with solid skills or trait levels in (other) aspects of social and emotional regulation (e.g., composure). As such, it is likely that the positive impact of SO is not only moderated by job-related variables, but, where applicable, may also have a notable tendency for diminishing returns at markedly high levels across or within vocational types or organizational circumstances.
Empathy. Empathy (EM) refers to the degree to which people are concerned with and aware of others’ feelings, motivations, and problems. High scorers tend to be seen as empathetic, interpersonally aware, and non-judgmental. Low scorers are often perceived as judgmental, emotionally detached, and unsympathetic. EM has been considered indispensable to executive leadership for decades (Wilson, 2015). Executives who lack EM often suffer difficult social relations at work. They tend to be poor collaborators, have trouble with changing and ambiguous situations, and are often generally ineffective at leading others (Gentry, Todd, & Sadri, 2007; Holstein, 2015). EM is unilaterally counted among the components of EQ, and there is no paucity of extant research demonstrating the marked utility of EM in leadership on job performance and other outcomes (e.g., Gentry, Weber, & Sadri, 2007; Langelett, 2014; Bharwaney, Bar-On, & MacKinlay, 2011). We have observed its positive effects on leadership outcomes and emergence in our own data as well (Lewis, 2013; Lewis & Ream, 2012). Cultural or organizational considerations may moderate the magnitude of EM’s positive effects or extent to which EM is in short supply (e.g., Gentry et al., 2007), although its effect is rarely observed to be anything short of positive, particularly when examined using zero-order correlations or when moderators or other measures are not considered concomitantly. A recent study does show, however, that EM may sometimes have problematic effects on executive performance, such that executives with high EM but low scores on most or all other components of EQ or EQ-like constructs may be at risk for derailment and low engagement (Lewis, 2015). In this sense, executives who place a primary emphasis on EM at the expense of showing or employing other components of EQ-like self-awareness, interdependence, and sociability may have problems. Leaders who can read and understand people but have relatively low levels of composure, motivational skill, sociability, and collaborative tendencies are prone to disengaging when faced with executive-level challenges.
Affiliation. Affiliation (AF) refers to individuals’ propensity for working with others and involving others in their work. High scorers characterize work and goal pursuit as team oriented and collective by default. They value collective success and feel or seek identification with groups and their norms. Low scorers seek solo and autonomous work and may see collaborative efforts as ineffective or as a barrier to productivity, success, or goal accomplishment. Researchers increasingly assert that leadership is most often and by definition a group activity that involves collective development, inquiry, and learning. High-level executives tend to oversee, at least informally, multiple individuals and groups across functions and within-organization business units. For these reason and others, AF and AF-like constructs have been characterized as key dispositions among executive leaders (Van Velsor, McCauley, & Ruderman, 2010). A leader who emphasizes and is predisposed toward interdependence tends to
Korn Ferry’s Four Dimensional Executive Assessment • Research guide and technical manual
17 | © Korn Ferry 2015. All rights reserved.
facilitate cross-functional collaboration and communication and related synergies that can be particularly useful in accomplishing enterprise-wide objectives. The positive effects of AF are perhaps particularly salient in increasingly prevalent matrixed or horizontal organizations characterized by a de-emphasis on top-down authority and an emphasis on consensus building, lateral influence, and multiple points of ownership among contributors and stakeholders (Sy & D’Annunzio, 2005). Leaders with high AF-like scores are also more likely to be rated high on measures of organizational citizenship behavior and to promote similar behavior throughout the organization (Johnson, 2008). They also drive company cultures in ways that increase flexibility, responsibility, standards, clarity, and commitment (Goleman, 2000). Emphasizing interdependence in leadership also predicts company-level outcomes. Companies characterized by executive teams who have the strongest tendencies toward collaborative efforts are far more likely to show growth, be in the upper quartile of revenue, and receive high marks on ratings of innovation (Myers, 2013). Affiliative leaders are more likely to have satisfying work relationships, feelings of organizational embeddedness, and feel obligated toward their organizations and organizational members in ways that, among other things, are related to decreased likelihood of job dissatisfaction and intent to turnover or quit (Zimmerman, 2008; Salgado, 2002).7 CEOs with elevated scores on AF-like constructs have companies with higher aggregate organizational commitment levels (Colbert et al., 2014). Increased collective AF among team members is positively associated with team performance in terms of task execution and decision-making quality (Driskell, Salas, & Hughes, 2010). This pattern of relationships with outcomes distinguishes AF from SO, highlighting the distinction between the propensity to collaborate with others and the tendency to be energized by and seek out social interactions. AF may encourage executives to work closely with their current team, driving their own and others’ organizational commitment and team performance.
High AF among executives is not without critique and caution (Yukl, 1998). Van Velsor et al. (2010) assert that interdependence emphasis among executives can sometimes be conflated with a tendency toward hyper-inclusivity in ways that can promote chaos, dysfunctional non-centrality, slow progress, and/or slow decision making among leaders (also see Brousseau et al., 2006). As such, a highly affiliative disposition may result in diminishing returns vis-à-vis leadership effectiveness to the extent that it is not combined with some degree of clarity concerning where ultimate decision-making discretion lies or with a notable degree of motivation to lead or assertiveness among leaders. Affiliative leaders are most effective when they combine their inclination for inclusiveness, or even nurturing, with a clearly stated vision and set of standards (Goleman, 2000; Forde, Hobby, & Lees, 2000).
Influence. Influence (IF) measures the degree to which people are predisposed toward motivating others, leveraging others’ strengths, and using interpersonal skills for marshalling support for an idea or vision. High scorers tend to be seen as cogent, interpersonally adept, and persuasive. Low scorers are often perceived as lacking interpersonal confidence and less interested in inspiring or swaying others; they may be more inclined to play supporting roles in organizations or to defer to formal authority or others when giving or receiving direction. Studies suggest that IF and IF-like dispositions trump all others (including indications of consistent high performance) among traits that boards of directors and high-level managers seek in their fellow leaders when conducting searches for executive role vacancies (Baldoni, 2014; ILC Partners, 2014). Their preference is not without foundation. Zenger and Folkman (2013), for example, found that the magnitude of IF’s positive association with performance in many contexts is larger than many or most well-known executive competencies that are otherwise important for predicting success. Researchers also continue to assert that top-down approaches to leadership are increasingly irrelevant and ineffective in a growing number of organizations (Leigh & Maynard, 2012). As such, like AF, IF is seen as an important disposition for leaders who find themselves most often embedded in organizations that emphasize structures with loosely defined or informal hierarchy (at most), and where an individual’s de facto degree of influence trumps formalities associated with rank, job title, or position.
Executives with high IF tend to be more transparent, adaptable, and collaborative (Leigh & Maynard, 2012). They are more likely to solicit input from others across levels of implied or formalized management hierarchy and to facilitate a sense of ownership for projects and goals among all contributors. IF is positively associated with innovation (Den Hartog et al., 1997) and is typically seen as a key component of leadership styles that facilitate
7 The findings of Zimmerman (2008) and Salgado (2002) were with specific reference to Agreeableness, which contains, as a whole, many features similar to AF, but may have key differences not explicated here or precisely deconstructed from elements that do overlap with our AF measure.
Korn Ferry’s Four Dimensional Executive Assessment • Research guide and technical manual
18 | © Korn Ferry 2015. All rights reserved.
positive changes among groups and maximize group member potential. High IF among leaders may also contribute to group members’ sense of well-being in general (Jacobs, Pfaff, & Lehner et al., 2013).
In some cases, high scores on IF and IF-like constructs among leaders may have potential to become problematic. A leader with high IF may fail to communicate clear expectations and may be less adept at evaluating and giving clear feedback and/or reinforcement of poor or good performance where appropriate (Duggan, 2015; Sandilands, 2015). IF as a primary leadership tool may also be less effective in regulated industries or in well-established companies and/or operational units with inert, fixed, and well-known work processes and objectives. When the goal is to maintain a well-known flow of operations and/or “keep the machine running,” executives and managers with high IF are less likely to have large positive effects on company, business unit, and person-level outcomes (Sandilands, 2015). Some assert that the utility of a high IF leader is more applicable and effective in the private sector and/or in volatile and competitive markets, such that the high IF leader’s high visibility and current popularity sometimes obscures the continuing need for more transactional and hierarchic leadership styles in diverse contexts (Tourish, 2013). High IF among leaders is also often seen as a component of what constitutes the archetypal “visionary” and/or “charismatic” leader. While there is no paucity of research explicating the potentially positive effects of this kind of leadership, some caution that high IF “charismatic visionaries” can, in some cases, also tend toward a lack of integrity or may potentially promote unethical practices among companies and group members (Parry & Proctor-Thomson, 2002). Tourish and Vatcha (2005), for example, argue that many of the executive leaders responsible for high-profile debacles and failures such as Enron and the banking crash of 2008 were high charisma and essentially high IF (Tourish & Vatcha, 2005). While this leader type is likely uncommon, such possibilities perhaps underscore the need to evaluate potential leaders on several dimensions (including with references and in interviews) and profiles of dimensions of social, emotional, and cognitive constitution.
Energy (EN) Among the Big Five personality traits, Conscientiousness (CT) has sometimes been purported to have perhaps the most consistent, well-documented, and positive predictive utility on workplace outcomes (Barrick & Mount, 1991; Hurtz & Donovan, 2000; Mount & Barrick, 1995; O'Connor & Paunonen, 2007). Barrick, Mount, and Judge (2001), for example, refer to CT as having a “trans-occupational positive effect on job-performance.” High CT is most often associated with high performance and, in general, individuals with high CT are also notably less likely to quit, turnover, or to be dissatisfied with their jobs (Zimmerman, 2008). CEO levels and mean levels of CT among top leadership teams have been shown to have incrementally positive predictive utility on organizational-level outcomes and effectiveness measures (Colbert et al., 2014). Although there are competing conceptualizations, CT is typically defined as a latent variable, tapping the extent to which a respondent is achievement-oriented, persistent, and reliable. It is difficult to imagine contexts in which this combination of characteristics would not be desirable and, again, in most cases the literature does support its widely applicable positive impact on job-related outcomes. Yet, despite the assertions of Barrick et al. (2001) and others, the effect of CT has shown some susceptibility to moderation according to job-related and organizational variables, as well as conceptualizations of leadership (Judge, Bono et al., 2002; Reiter-Palmon, Illies, & Kobe-Cross, 2009; Tett, 1998). Where leadership is defined as the extent to which individuals are perceived as leaders by others, for example, CT’s effect is substantial and of virtually equal magnitude to Extraversion. Where leadership is characterized as leaders’ group effectiveness, the impact of CT is clearly trumped by Extraversion and is also arguably lower than all other Big Five traits, while remaining small and positive. Moreover, the positive impact of CT seems to be larger in contexts characterized by rule orientation and bureaucracy. Military and government leaders and leaders of students perform better at higher CT levels, for example. CT among business leaders, however, has a much smaller effect and perhaps even zero effect in some cases (Judge, Bono et al., 2002). Similarly, managerial personnel seem to benefit somewhat less from CT than service workers, individual contributors, expert-oriented professionals, and support function personnel—particularly on common CT sub-component measures like dependability and “order” (Ones et al., 2007). Also, among CEOs, high CT has been found to have a negative association with strategic flexibility in ways that have implications for organizational-level outcomes (Nadkarni & Herrmann, 2010).
Ultimately, the results of meta-analytic studies and the assertions of many highly experienced IO researchers and psychologists support the notion that CT’s impact on leadership effectiveness and emergence is inconsistent—sometimes zero, sometimes positive, and sometimes negative (Reiter-Palmon et al., 2009; Hough, 1992; Hough, Ones, & Viswesvaran, 1998; Tett, 1998). The inconsistencies are likely due to an interplay between competing conceptualizations of CT, the nature of measured outcomes, and the diverse samples of leaders across studies.
Korn Ferry’s Four Dimensional Executive Assessment • Research guide and technical manual
19 | © Korn Ferry 2015. All rights reserved.
Perhaps an ideal starting place for understanding the inconsistency is the nature of CT across studies, viz., it’s sub-components. Indeed, psychologists have argued that the five-factor conceptualization of personality is necessarily hierarchic (Costa & McCrae, 1995) and that grouped sub-components may be predictive of differing outcomes. This includes and has been shown for sub-components of CT (Bogg & Roberts, 2004; Dudley, Orvis, Lebiecki, & Cortina, 2006; Hough & Ones, 2001; Roberts, Chernyshenko, Stark, & Goldberg, 2005). Reliability, or dependability, as often measured is sometimes negatively associated with management level (Tett, 1998) or unrelated to managers’ job performance (Hough, 1992). Although findings of certain studies may support dissenting opinions (e.g., Dudley et al., 2006), dependability is also likely, at least partially, culpable in CT’s known negative association with creativity (Reiter-Palmon et al., 2009), CT’s positive association with conventionality and “traditionalism” (Roberts et al., 2005), and CT’s positive association or sometimes component relationship (e.g., Christiansen & Tett, 2013) with “dutifulness” and “prudence,” which at markedly high levels involve strict rule orientation, unexamined deference to policy, careful detail orientation, perfectionism, and even sometimes dogmatism and rigidity. In contrast, CT facets that have been characterized as achievement, drive, or tenacious and deliberate pursuit of goals predict work and leader performance (Dries & Pepermans, 2012; Hough, 1992; Hough & Ones, 2001; Roberts et al., 2005). Below, we describe the sub-components of our own analog to CT and its known and expected utility for predicting outcomes among executive leaders. We characterize Energy8 as consisting of three sub-domains including Need for achievement, Persistence, and self-efficacy for general leadership, or Assertiveness. This combination of facets of CT and Extraversion can be conceptualized as a compound trait reflecting ambition, vigor, competitiveness, and achievement orientation (Hough & Ones, 2001).
Need for achievement. Need for achievement (NA) refers to motivation by work or activities that allow for skills and abilities testing against an external standard(s). High scorers are typically seen as hard workers and are oriented toward some high standard of excellence that they seek to meet or exceed. They are likely characterized by a perpetual need to improve or to accomplish more. High scorers also typically adhere to an internal locus of control, meaning that they largely attribute outcomes to the extent to which they (and potentially others) worked hard, accepted responsibility, and did their best in every respect. High scorers are also more likely to pursue and obtain loftier goals and to seek job- or goal-related feedback more than personal feedback (McClelland, 1961). Low scorers are not motivated by external standards and tend not to orient themselves according to some clearly defined notion of excellence that they are motivated to meet or exceed. They may also not feel that goal achievement alone is a sufficient reward, adequate (single), or primary measure of success for any pursuit. Low scorers are also likely more interested in personal and subjective feedback than they are external job-related feedback.
Research into NA suggests that it has far-reaching implications for both person-level and aggregate outcomes conceptualized in different ways. McClelland (1961), for example, found that aggregate NA levels among a nation’s population are positively associated with national economic prosperity. Similarly, NA among high-level executives, including CEOs, is positively associated with venture growth (Lee & Tsang, 2001), organizational size (Schlevogt, 1999), and also with innovation (Papadakis & Bourantas, 1998). High NA has been characterized as relatively rare in the US and many other nations, although national averages do significantly vary (McClelland, 1961). Early research suggested that entrepreneurs seem to typically have elevated NA compared to other professionals (McClelland, 1961).
For many decades, NA has often been included among short-listed key traits for executive leaders, and its positive association with management level is well known (McClelland, 1961; Kirkpatrick & Locke, 1991). Singh and Sinha (2013) showed that individuals with high NA are well suited to persist and be satisfied in executive and upper-level management roles. This is because opportunities to satisfy and reinforce one’s achievement need is abundant in executive roles—and more abundant than opportunities to fulfill other needs, including the need for affiliation, control, influence (which was also relatively abundant), and the need to develop or teach others. In both single empirical studies and comprehensive meta-analyses, NA shows a marked positive correlation with leadership and leadership emergence (Judge, Bono et al., 2002; Marinova, Moon, & Kamdar, 2013) as well as managerial performance (Hough, Ones, & Viswesvaran, 1998; Dudley et al., 2006; Ones et al., 2007). Marinova, Moon, and Kamdar (2014) posit and support that NA is markedly associated with leadership emergence and that a partial
8 While recognizing that the word “energy” is sometimes used to characterize the facet of Extraversion related to activity level, we believe the word succinctly and effectively captures our broader trait encompassing tenacious initiative and dogged drive to achieve.
Korn Ferry’s Four Dimensional Executive Assessment • Research guide and technical manual
20 | © Korn Ferry 2015. All rights reserved.
mechanism by which NA scores translate into leadership outcomes is via its impact on individual affinities with competitiveness.
Kumar and Meenakshi (2009) explain that while high NA is often a key asset, those executives who do not combine high NA with notable tendencies toward affiliation, adaptability, and consensus-building can create problematic environments for teams and may be, at best, well suited for short-term growth and not long-term success. High NA executives, they assert, are often “utilitarian” and problematically brief communicators. If they are non-affiliative and lack strong influential communication skills, they also tend to react in predictable and problematic ways to stress. When circumstances become characterized by increased pressure to perform, their high NA tendency to drive harder, while preaching and rewarding hard work and dedication, may transform into confrontation, micromanaging, and distributing blame in ways that target select individuals and/or groups as being incompetent or complacent. One effective counter to these kinds of problems, they assert, may be an increased degree of investment or emphasis on facilitating or selecting for executives who have high NA while also valuing work-life balance. Kumar and Meenakshi (2009) also caution that organizational cultures that value heroes and place primary emphasis on great performers and achieving at all costs are likely more susceptible to having, promoting, and retaining leaders who have dispositional and motivational profiles that interact to create maladaptive high NA.
Elsewhere, a growing body of research suggests that high NA CEOs and top-level leaders can have a far-reaching and predictable impact on organizational cultures and structures. Companies with CEOs having high NA, for example, tend to be and/or become places characterized by increased centralized power and control (Miller & Droge, 1986; Lewin & Stephens, 1994). Some have even characterized NA as the executive’s “stimulant,” and despite a notable amount of research to the contrary, others maintain that high NA leaders are far more inclined toward task orientation and micromanagement and, as such, are better suited for mid-level managerial duties and not high-level executive leadership (McClelland & Boyatzis, 1981). Ultimately, it seems clear from the collective research literature that high NA can be a strength or a weakness for an executive leader. As such, the utility of NA and NA-like measures for supplemental use in leadership development and/or selection is probably optimized when employed in combination with other measures of people, teams, and organizations.
Persistence. Persistence (PE) refers to a tendency toward passionate and steadfast pursuit of personally valued long-term or lifetime goals or values, in spite of obstacles, discouragement, or distraction. High scorers tend to push through adversity and tend not to give up on difficult tasks and pursuits. They are typically characterized as resilient and as having stamina and long-term or stable focus. Low scorers are more likely to change course when faced with adversity, while putting emphasis on emergent opportunities and short-term pursuits and accomplishments. Unlike NA, PE has reference to long-term goal or value perseverance, resilience to adversity, and is not primarily maintained by short-term periodic and ongoing work-related feedback from others or from comparison with easily defined standards of excellence.
Duckworth, Peterson, Matthews, and Kelly (2007) explain that PE as a construct has arguably one of the longest histories in all of psychology and particularly in the “psychology of achievement.” Several early researchers, going back as far as the late 19th century, were interested in variables that separated similar and even similarly gifted individuals into levels of achievement. Many found that persistence, perseverance, and resilience were often key differentiating traits among individuals who otherwise had similar ability levels or similar IQ (Terman & Oden, 1947; Howe, 1999; as noted in Duckworth et al., 2007). Simonton (1994) concludes that PE, or “grit,” is among the more certain and consistent variables that high impact and notable historical figures most often have in common. PE is typically found to be uncorrelated or slightly negatively correlated with IQ levels, and its incremental utility (over IQ and aptitude) for predicting life and occupational outcomes seems well established (Duckworth et al., 2007; Ackerman & Heggestad, 1997; Moutafi, Furnham, & Paltiel, 2005; Eskreis-Winkler, Shulman, Beal, & Duckworth, 2014). In fact, its utility in predicting success is sometimes seen as the cornerstone for understanding the differential and additive utility of natural ability vs. disposition-related variables in understanding life’s outcomes—including work-related outcomes (Ericsson & Charness, 1994). High PE scores are associated with increased emotional stability,9 increased standardized test scores, achievement motivation, educational attainment,
9 In later sections, we corroborate this observation, viz., in a factor analysis of the 14 traits, PE loads onto both the Energy and the Social leadership higher-order traits with substantial magnitude.
Korn Ferry’s Four Dimensional Executive Assessment • Research guide and technical manual
21 | © Korn Ferry 2015. All rights reserved.
educational performance, employment retention, and retention in challenging educational programs—including highly selective military training programs (Duckworth et al., 2007; Eskreis-Winkler et al., 2014).
PE-like constructs are also associated with increased levels of EQ, learning agility, strategic vision, adaptability, motivation to lead, and stakeholder sensitivity among leaders or potential leaders in organizations (Dries & Pepermans, 2012). PE has also been positively associated with CEO and entrepreneurial success (Baum & Locke, 2004). CEOs having higher levels of PE-like traits tend to be more resourceful and confident. They are more effective at communicating, setting, and reaching goals, as well as growing businesses (Baum & Locke, 2004). PE may be characterized as a component or expression of work-related “passion” (Houlfort, Philippe, Vallerand, & Menard, 2014) which, when associated with other socio-emotional adaptive states, is positively predictive of increased enthusiasm, discretionary effort, positive work-related relationships, positive organizational outcomes, work satisfaction, and resilience to burnout (Cardon, Wincent, Singh, & Drnovsek, 2009; Cardon, Zietsma, Saparito, Matherne, & Davis, 2005; Liu, Chen, & Yao, 2011; Philippe, Vallerand, Houlfort, Lavigne, & Donahue, 2010).
Emerging research has distinguished between adaptive and maladaptive “passion” in ways that may have potential implications for applied traits measurement and multivariate profile interpretation, particularly where PE or PE-like measures are involved (Houlfort et al., 2014; Vallerand, Blanchard, Mageau, Koestner, Ratelle, Leonard, Gagne, & Marsolais, 2003).10 Balon, Lecoq, and Rime (2013), for example, explicate key distinctions in personality types otherwise associated with high persistence and passionate pursuit of goals. They demonstrate that a type of maladaptive or “obsessive” passion is part of a trait cluster also characterized by neuroticism (low EQ), low self-regulation (also see Vallerand, Rousseau, Grouzet, Dumais, Grenier, & Blanchard, 2006), decreased sociability, and increased perfectionism in general. On the other hand, adaptive persistence and passion are characterized by increased sociability and EQ, while being unrelated to what they operationalize as “good perfectionism” and negatively related to what they characterize as “problematic perfectionism.” Other researchers drawing from the same theoretical establishment arrive at similar conclusions, viz., that elevated scores on PE-like measures can be a marker associated with known personality types having predictable likelihood of various positive and negative life outcomes, including career and leadership outcomes (Houlfort, Vallerand, & Laframboise, 2015; Harpaz & Snir, 2015; Houlfort & Rinfret, 2010). When combined with circumstances and traits characterized by flexibility, self-awareness, self-regulation, and increasing degrees of autonomy in decision making, high passion and PE are typically associated with positive outcomes (Hodgins & Knee, 2002) and perhaps even increased mindfulness (Brown & Ryan, 2003). Conversely, when high PE is associated with low EQ and reflective of one’s need for acceptance, self-worth, socio-emotional well-being, or even one’s sense of identity, high PE is associated with impulsivity, decreased self-control, and persistence based on need more than free choice and self-determined autonomy (Vallerand et al., 2003; Mageau, Vallerand, Charest, Salvy, Lacaille, Bouffard, & Koestner, 2009). Whether a leader’s steadfast and passionate pursuit of goals can be characterized as adaptive or maladaptive in this way is also predictive of categorical membership in existing and well-known taxonomies of leadership style (e.g., transformational vs. transactional, see Bertocci, 2009) and organizational culture (e.g., Cameron & Quinn, 2006). Market-reactive profit-focused and competitive organizational cultures, for example, typically have leadership and organizational climate characterized by relatively high maladaptive persistence, while inclusive, collaborative, and internally focused organizations have leadership, workers, and climate characterized by relatively elevated adaptive passion and persistence (Houlfort, Vallerand, & Koestner, 2013).
10 In the collective literature briefly reviewed in this section, we make reference to a well-researched dichotomous model of human “passion.” While PE, as formally defined and measured in our system, is not passion per se, a review of the related literature supports that PE is necessarily a non-trivial component or expression of passion as typically measured and conceptualized. We largely treat the two concepts interchangeably here and caution the reader to draw one’s own conclusions.
Korn Ferry’s Four Dimensional Executive Assessment • Research guide and technical manual
22 | © Korn Ferry 2015. All rights reserved.
Table ENDEF. Definitions for Energy sub-domain traits
TRAIT DEFINITION HIGH SCORE LOW SCORE Assertiveness The degree to which people enjoy taking charge and directing
others. High scorers tend to be seen as aggressive and decisive. Low scorers are often perceived as tentative, passive, or indecisive and may be more comfortable following the lead of others.
Assertive Reserved
Need for achievement
Motivation by work or activities that allow testing of skills and abilities against an external standard. High scorers appreciate working hard, judge achievement according to the goal, and strive to meet and exceed standards. Low scorers are not motivated by external standards and tend not to work energetically to exceed expectations.
Driven Content
Persistence A tendency toward passionate and steadfast pursuit of personally valued long-term or lifetime goals, despite obstacles, discouragement, or distraction. High scorers are seen to push through obstacles and not give up on difficult tasks. Low scorers are more likely to pull back from obstacles or lower expectations for their own attainment.
Persistent Accommodating
Assertiveness. Empirical findings show Assertiveness (AS) to be a key component of leadership emergence and potential as well as results-drive and achievement orientation (Dries & Pepermans, 2012).11 AS measures whether people are inclined to proactively assume wide responsibility, take charge, and lead others. A notably assertive individual is convinced that she/he should be in charge, and that both individual and group outcomes will be optimized when she/he is granted group-level decision-making discretion, leadership status, authority to delegate, and authority to set or heavily influence organizational objectives. As such, high AS, like high NA and PE, is no doubt a contributing indicator of internal locus of control, and also might be characterized, at least in part, as self-efficacy for leadership in general (Amos & Klimoski, 2014).12 High AS scorers may also tend to be seen as confident, aggressive, and decisive, while low scorers are likely perceived as tentative, passive, reserved, or indecisive and more comfortable deferring to and following the lead of other individuals or groups. Low scorers may also have and attain leadership roles and operate as such, but this is far more likely when leadership status has been formally assigned and is associated with known and explicated relative managerial rank and job title. High scorers on AS-like measures, on the other hand, will take charge because they feel like it will benefit organizational members and collective pursuits whether or not they were told or were granted clearance to assume responsibility as such. In short, high AS individuals are, to some extent, in charge because they have decided they are in charge, and not necessarily because somebody else, with or without authority, has told them that they are in charge. Their leadership status and effective leadership status often is or at least begins as a de facto more than a de jure leadership status.
In the extant Big Five personality literature, a construct similar to AS is sometimes conceptualized as a component of higher-order Extraversion, and is often called Dominance (e.g., Costa & McCrae, 1992; Depue & Collins, 1999).13 Ones et al. (2007), however, in a comprehensive meta-analytic review, show marked differential predictive 11 Dries & Pepermans (2012) separate components of AS into multiple constructs for which they argue conceptual divergence. Taking initiative, they assert, is a component of “drive,” assertiveness in decision making is a component of “analytical skill,” and actively looking for opportunities to lead, delegating, and objective setting are components of “emergent leadership.” In their study, these higher-order constructs, however, show markedly and arguably statistically convergent correlational patterns (all having r > .75). We make no argument with regard to the relative appropriateness of competing factor structures or conceptual groupings. Indeed, scientific models are based largely on their utility and replicability and the degree to which constructs as measured meet conventional standards of quality and acceptability. Later in this technical manual, we empirically demonstrate adequate psychometric fit for Energy as being a latent construct tapped by indicators including Need for achievement, Persistence, and Assertiveness and, as evidenced in this discussion, all have some reference to locus of control. The high Energy leader has a trait profile characterized by a need to achieve challenging and excellent goals, a tendency to persevere through time and adversity, and a belief that the best outcome for self and others requires that they be in charge or otherwise assume a great deal of responsibility and influence over decisions, objectives, and methods. 12 The utility of self-efficacy measures and theory is maximized when self-efficacy is conceptualized and measured in domain-specific ways (Pajares, 1997). Here, AS is essentially self-efficacy for broadly and generally defined leadership and for facilitating and championing group and company success in organizational contexts. 13 Indeed, in our own data, we find AS loading with SO and IF on a three-indicator latent Extraversion-like factor we dub “Presence.” AS, however, as we show later, also shows significant shared variance with NA and PE. We choose to include AS on the latter latent higher-order factor according to our experience and meta-analytic evidence, suggesting that AS not only loads on an upper-managerial relevant factor with PE and NA, but also has notable predictive variance as a part of higher-order latent factor (Energy) and as a single low-order predictor.
Korn Ferry’s Four Dimensional Executive Assessment • Research guide and technical manual
23 | © Korn Ferry 2015. All rights reserved.
utility for these two components of Extraversion—Sociability and Dominance, particularly for managerial professionals. They find the impact of Dominance on managerial performance is positive and notably different and larger than the impact of Sociability. Judge, Bono et al. (2002) similarly found Sociability and Dominance having separate effects on leadership. Others have conceptualized and supported AS-like constructs as belonging to higher-order factors removed from Sociability or other social-behavior-related measures (e.g., Dries & Pepermans, 2012; Northouse, 1997; Mann, 1959; Stogdill, 1948; Hogan, 1983; Wiggins, 1996). Hogan (1983) and others (e.g., King & Figueredo, 1997) in empirically-based higher-order personality structures separate Dominance from Extraversion or Sociability, concluding that the latter is better dubbed “Surgency”—having reference to general positive mood and sociability, whereas, Dominance emerges as its own factor with primary reference to confidence, independence, and aversion to submissiveness or deference. Others separate AS and social variables and argue that the former and latter are clearly associated, but not necessarily conceptualized as sub-components of a single common latent factor (Dries & Pepermans, 2012). Yet others (e.g., McCrae & Costa, 1987) assert that Sociability is not best combined with AS in an Extraversion factor, but that Sociability belongs with emotional and affective variables—much like found in our own conceptualization of Social leadership above.
AS predicts both self and other rating of Sociability, as well as competency domains like creativity, analytical thinking, and problem solving (e.g., Anderson & Kilduff, 2009). Interestingly, AS seems to affect others’ perceptions of competence in various leadership domains incrementally in models also containing scores of actual competence. As such, Anderson and Kilduff (2009), among others, show that high AS leaders typically instill trust and confidence in others in ways that are not always directly linked to rationality, truth, or more objective measures of actual leadership status or skill. Increased and even very high marks on AS-like measures among CEOs are positively associated with company innovation and company patent counts, and the effect is notably stronger for CEOs operating in highly competitive markets (Galasso & Simcoe, 2011). Assertiveness to lead, however, can sometimes be associated with lack of receptivity, micromanaging, and/or need for control in ways that create challenges for team performance, particularly when high AS marks are present in individuals having low marks on affiliation-type measures or measures of EQ and/or positive affect (Driskell & Salas, 1992).
Competencies Competencies are the skills and behaviors required for success (Lombardo & Eichinger, 2009). Korn Ferry affiliated professionals and scientists have elsewhere written and explicated much concerning competencies and their utility for description, development, coaching, succession planning, and as a supplement to selection activities (e.g., Ruyle, Hallenbeck, Orr, & Swisher, 2010; Lombardo & Eichinger, 2009). Recently, in 2014, we adopted a new competencies framework designed to be implemented across lines of business and, where applicable, for different services and solutions for our clients. A recent comprehensive treatment of competencies and our updated framework is available in the Korn Ferry Leadership Architect™ Research guide and technical manual (Korn Ferry, 2014a). Our discussion of competencies in the following sections makes repeated reference to this publication both implicitly and explicitly and also uses its reported empirical findings, which are primarily based on correlations between third-party-rated competencies and outcome variables. In this technical manual, we concentrate on a subset of competencies selected for use in executive search. Below, we briefly describe the process by which this particular subset was selected for use in search, and we also discuss our point of view vis-à-vis competencies as constructs that can (also) be self-assessed. We conclude the “Competencies” section by describing each of the 15 competencies and providing a brief literature-based overview of the 15 competencies and their utility for use in the executive search context.
A subset of 15 Korn Ferry’s Four Dimensional Executive Assessment (KF4D-Exec) taps 15 of the 38 competencies available in our framework. The subset of 15 was selected according to several considerations. First, we sought a subset that would maximize descriptive and predictive utility and could be reasonably expected to yield self-report results that were useful and had variability across respondents. Our executive search process now and for many years involves client ratings and discussions concerning which competencies are the most important for the managerial vacancy in question. Having collected decades worth of data from these discussions, which include formal ratings and rankings of competencies, we identified some competencies that fail to elicit variability across search engagements. When clients are asked to sort competencies from most to least important for a given managerial
Korn Ferry’s Four Dimensional Executive Assessment • Research guide and technical manual
24 | © Korn Ferry 2015. All rights reserved.
vacancy, competencies (and their analogues in past and legacy frameworks) including Instills trust, Drives results, Communicates effectively, Decision quality, and perhaps to a lesser but still notable extent, Manages complexity, do not elicit variability across clients. They are always at or near the top (or “most important”) and certainly within the top five (when sorting 20, for example) in the vast majority of cases. They also elicit relatively low variability across respondents, especially in data from self-report assessments, being too socially-desirable. We certainly do not suggest that these competency areas are not important. No doubt they are important and highly important in most cases, such that all or most of them might be characterized as “table stakes” or “price of admission” variables. Given the low variability they elicit among clients and respondents, however, these competencies were not included in the subset of 15. Rather, they are seen as areas that are better probed using interviews, reference checks, and other activities that Search Partners, Search Professionals, and clients are better suited to investigate and accustomed to investigating as part of their indispensable and regular qualitative efforts and insight-gathering into particular candidates for particular roles. Competencies from among our exhaustive set of 38, including Business insight, also fail to elicit variability to a notable extent, but along with Organizational savvy is otherwise (and perhaps more importantly) problematic due to context specificity both within and across companies, industries, and/or business sectors. Executive search engagements very commonly involve (yet are not necessarily limited to) locating and securing interest from candidates who are not current members of the client organization conducting the search. As such, Organizational savvy, while having some potential for non-context-specific meaning, is usually strongly conceptualized with direct reference to an organization in which a respondent or ratee is currently employed. This renders any Organizational savvy measure largely moot and/or markedly difficult to conceptualize or measure with self-assessment or with reference to a potential organization and not a current one. Business insight is similarly context specific within industries, sub-industries, or even companies, and it is not terribly rare that a candidate may be considered or seen as a good or optimal fit despite having primary experience in an industry(s) different from the industry involved in a given search engagement.
Having discarded table-stakes and context-specific measures, we were left still with many competencies from which to choose. Remaining competencies were weighed according to a variety of considerations, including our subject-matter experts’ (SMEs) and scientists’ years of experience with professional activities and related data that provide insight into which competencies are typically most important and discriminating for high- and low-performing upper-level managers and executives. Several highly experienced SMEs were involved in this process, as were empirical findings (see Korn Ferry [2014a], for example) that underscore the relative predictive utility of competencies across leadership/management levels with particular attention paid to findings among business unit leaders and senior executives. We sought to arrive at an optimal set of 15 and, as such, did not rely only on bivariate correlations between performance and competencies. Rather, we investigated available data that would maximize uniquely explained variability in performance according to multivariate statistical modeling. To exemplify, consider that Engages and inspires (r = .44) and Drives vision and purpose (r = .42) both have higher known correlations with performance among senior executives than does Global perspective (r = .38). However, in data modeling, both Engages and inspires and Drives vision and purpose (besides being conceptually similar) explain overlapping variability in performance. If one knows a person’s Engages and inspires score and their Drives vision and purpose score, then a similar or exact amount of total performance variance is explained compared to the case that only the former or only the latter is known. However, if one knows only the former or only the latter and the Global perspective score is known, then the total explained variability in performance is increased. Stated differently, the final set of 15 were chosen (in addition to the qualitative considerations already discussed) in pursuit of a set of competencies that maximized incremental predictive/explanatory utility vis-à-vis performance among business unit leaders and senior executives. Moreover, in at least one case a particular competency, viz., Situational adaptability was selected as a notably and incrementally predictive competency. Note that in a dataset of over 5,000, Situational adaptability14 had a low average ranking of 18th of 20. Yet in our analyses, Situational adaptability had notable and notably incremental predictive utility and was, thus, included in the subset of 15. This underscores the importance and added value of using empirical observations in this and other applications, viz., we found that some competencies are quite predictive and uniquely predictive of performance in ways clients are not typically aware of. Such considerations and observations were also involved with and drove the selection of the final set of 15, which can be examined along with their definitions in Table COMDEF.
14 Namely, Demonstrating Personal Flexibility in the Voices competency framework (Korn Ferry, 2014b.)
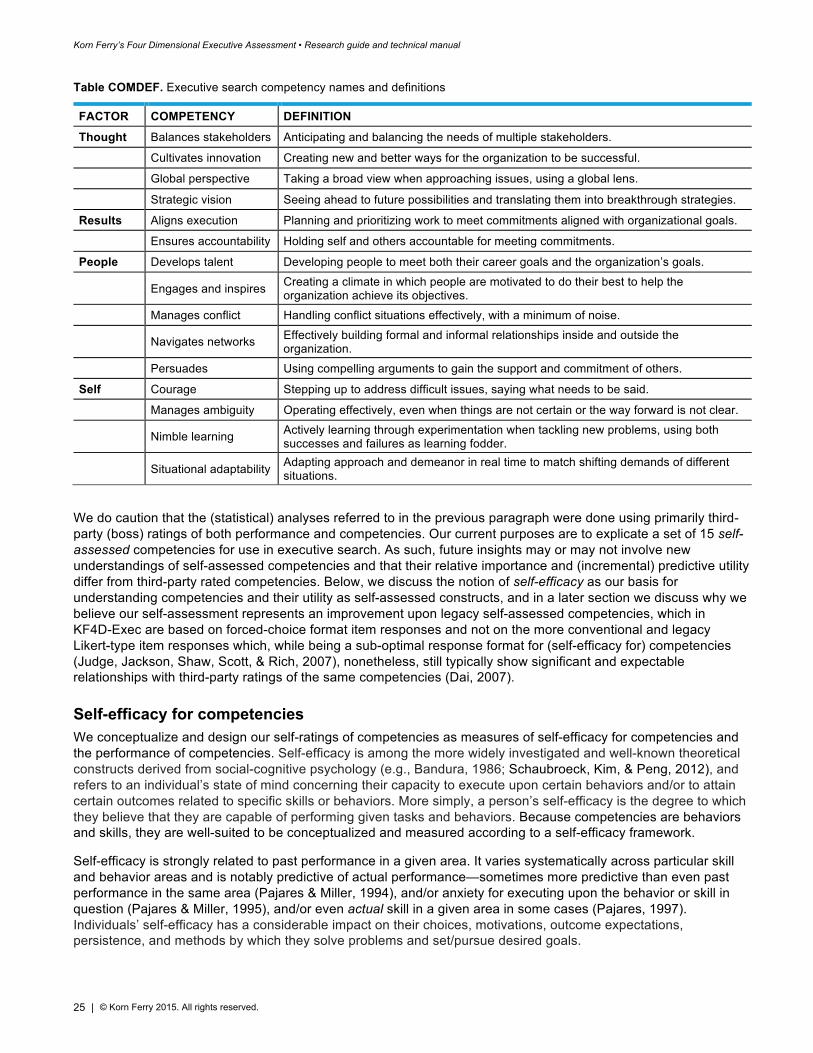
Korn Ferry’s Four Dimensional Executive Assessment • Research guide and technical manual
25 | © Korn Ferry 2015. All rights reserved.
Table COMDEF. Executive search competency names and definitions
FACTOR COMPETENCY DEFINITION
Thought Balances stakeholders Anticipating and balancing the needs of multiple stakeholders.
Cultivates innovation Creating new and better ways for the organization to be successful.
Global perspective Taking a broad view when approaching issues, using a global lens.
Strategic vision Seeing ahead to future possibilities and translating them into breakthrough strategies.
Results Aligns execution Planning and prioritizing work to meet commitments aligned with organizational goals.
Ensures accountability Holding self and others accountable for meeting commitments.
People Develops talent Developing people to meet both their career goals and the organization’s goals.
Engages and inspires Creating a climate in which people are motivated to do their best to help the organization achieve its objectives.
Manages conflict Handling conflict situations effectively, with a minimum of noise.
Navigates networks Effectively building formal and informal relationships inside and outside the organization.
Persuades Using compelling arguments to gain the support and commitment of others.
Self Courage Stepping up to address difficult issues, saying what needs to be said.
Manages ambiguity Operating effectively, even when things are not certain or the way forward is not clear.
Nimble learning Actively learning through experimentation when tackling new problems, using both successes and failures as learning fodder.
Situational adaptability Adapting approach and demeanor in real time to match shifting demands of different situations.
We do caution that the (statistical) analyses referred to in the previous paragraph were done using primarily third-party (boss) ratings of both performance and competencies. Our current purposes are to explicate a set of 15 self-assessed competencies for use in executive search. As such, future insights may or may not involve new understandings of self-assessed competencies and that their relative importance and (incremental) predictive utility differ from third-party rated competencies. Below, we discuss the notion of self-efficacy as our basis for understanding competencies and their utility as self-assessed constructs, and in a later section we discuss why we believe our self-assessment represents an improvement upon legacy self-assessed competencies, which in KF4D-Exec are based on forced-choice format item responses and not on the more conventional and legacy Likert-type item responses which, while being a sub-optimal response format for (self-efficacy for) competencies (Judge, Jackson, Shaw, Scott, & Rich, 2007), nonetheless, still typically show significant and expectable relationships with third-party ratings of the same competencies (Dai, 2007).
Self-efficacy for competencies We conceptualize and design our self-ratings of competencies as measures of self-efficacy for competencies and the performance of competencies. Self-efficacy is among the more widely investigated and well-known theoretical constructs derived from social-cognitive psychology (e.g., Bandura, 1986; Schaubroeck, Kim, & Peng, 2012), and refers to an individual’s state of mind concerning their capacity to execute upon certain behaviors and/or to attain certain outcomes related to specific skills or behaviors. More simply, a person’s self-efficacy is the degree to which they believe that they are capable of performing given tasks and behaviors. Because competencies are behaviors and skills, they are well-suited to be conceptualized and measured according to a self-efficacy framework.
Self-efficacy is strongly related to past performance in a given area. It varies systematically across particular skill and behavior areas and is notably predictive of actual performance—sometimes more predictive than even past performance in the same area (Pajares & Miller, 1994), and/or anxiety for executing upon the behavior or skill in question (Pajares & Miller, 1995), and/or even actual skill in a given area in some cases (Pajares, 1997). Individuals’ self-efficacy has a considerable impact on their choices, motivations, outcome expectations, persistence, and methods by which they solve problems and set/pursue desired goals.
Korn Ferry’s Four Dimensional Executive Assessment • Research guide and technical manual
26 | © Korn Ferry 2015. All rights reserved.
Self-efficacy’s predictive utility for a given outcome increases with the degree of specificity with which both self-efficacy and the skill or outcome is measured (Pajares, 1996). If one is asked, for example, concerning their self-efficacy for a particular management skill such as balancing stakeholders, the response’s relationship to a boss or peer rating of general management ability or performance is likely to be non-zero and positive to the extent that balancing stakeholders is relevant to the role, but the relationship will be stronger when the (boss and/or peer rated) outcome and the self-efficacy assessment specifically tap balancing stakeholders. As such, our assessment is designed to measure specific competencies and is expected to be more predictive of specific job-relevant competency areas, while having a non-zero and positive relationship to performance in general, particularly and increasingly to the extent that the particular competency area is relevant to the job. In KF4D-Exec, the importance of a particular management skill/competency for general success and performance for a given role is partially based on client input and insight around the role in question.
When self-efficacy is low, individuals often think that a given skill or behavior is more difficult than it actually is and, as a result, are often given to increased anxiety, stress, and avoidance of related tasks or behaviors. Individuals with higher self-efficacy for a particular skill persist longer and more passionately in performing the same skill and are more committed to it and resilient to related adversity. High self-efficacy for a given skill is markedly related to optimism, internal locus of control, personal agency, confidence, and decreased stress and anxiety surrounding the same skill or outcome it is intended to produce (Schwarzer & Fuchs, 1995). An individual with high self-efficacy in a given area is more motivated to perform in that area, is more certain that they can affect change and outcomes in that area, learns and adapts more effectively to related setbacks, and responds better to related constructive feedback. Self-efficacy is also related to (better) planning (when high) and success/failure attributions. Individuals with low-self-efficacy will blame self and/or low self-ability when encountering setbacks or failures in a given area and may often give up and/or more quickly become discouraged. Conversely, a person with high self-efficacy will persist in the face of adversity, avoid seeing failure as inert, and will seek and act upon external factors that can be changed, affected, and/or manipulated in order to achieve desired outcomes, including organizational outcomes related to the competency area of interest.
While being notably predictive of actual performance in given areas, self-efficacy likely also captures different information than others’ specific or general performance ratings alone, offering a unique perspective on how leaders view themselves (Stumpf, 2010). People high on self-efficacy believe they can affect the motivation, resources, and actions needed to successfully perform a particular task or achieve a specific outcome (Hannah, Avolio, Luthans, & Harms, 2008; Schyns & Sczesny, 2010). Although self-efficacy was originally conceptualized as specific to a task (e.g., fulfilling a given quota), it also has increasingly been viewed and studied as more broadly domain-specific (Schyns & Sczesny, 2010). In our case, this refers to competency domains such as Cultivates innovation, having Strategic vision, Develops talent, Ensures accountability, and others (see Table COMDEF). Other examples of domain-specific yet broader self-efficacy from the literature include creative self-efficacy, occupational self-efficacy, and leadership self-efficacy. Hannah et al. (2008) assert that “…leadership efficacy is a specific form of efficacy associated with the level of confidence in the knowledge, skills, and abilities associated with leading others.” Leader self-efficacy is positively linked to even broad key outcomes, including organizational commitment, managerial performance, and organizational performance (Hannah et al., 2008; Schaubroeck et al., 2012). Not surprisingly, the less precise but related concept—confidence—is commonly viewed as a critical attribute of successful leaders (Hannah et al., 2008).
In addition, research has shown that leaders’ beliefs about key aspects of leadership capability play an important role in the process of leadership effectiveness. Specifically, leaders’ traits are related to their self-efficacy, which in turn predicts their effectiveness in the eyes of supervisors, peers, and team members (Hannah et al., 2008; Ng, Ang, & Chan, 2008). Ng et al. (2008), for example, showed that leadership self-efficacy variously mediated the impact of Extraversion, Neuroticism, and Conscientiousness on leadership effectiveness. This indicates that self-efficacy is a mechanism through which traits impact leadership outcomes. The mediating effects can be complex and even moderated by context, but the findings of Ng. et al. (2008), nonetheless, underscore the important and potentially value-added information captured by self-evaluations of capabilities, as well as the rich processes through which leaders’ perceptions of their competencies shape their performance. There are additional relevant pathways through which self-efficacy may influence leaders’ success (Schyns & Sczesny, 2010). For one, self-efficacy is associated with performance adaptability in general, including adapting knowledge and skills to meet the demand of new situations and maintaining motivation (Kozlowski, Gully, Brown, Salas, Smith, & Nason, 2001). Self-efficacy is also linked to preference for challenge and challenging tasks.
Korn Ferry’s Four Dimensional Executive Assessment • Research guide and technical manual
27 | © Korn Ferry 2015. All rights reserved.
A variety of approaches have been used to assess self-efficacy, ranging from broad measurement of general self-efficacy to narrow evaluations of self-efficacy to perform very specific tasks. As we explained earlier, the general rule of thumb is to measure self-efficacy at the same level of specificity as the outcome of interest. For example, if the goal is to predict task performance, one should evaluate task self-efficacy (Schyns & Sczesny, 2010). Although general self-efficacy has been linked to work outcomes, we re-emphasize that domain-specific assessments of self-efficacy more strongly relate to domain-specific outcomes and general work performance to the extent that the measured self-efficacy is important for the role in question (see also, Schyns & Sczesny, 2010). In the sections that follow, we review and discuss the 15 competency domains for which we employ self-efficacy measures in KF4D-Exec.
Thought competencies Balances stakeholders. We conceptualize Balances stakeholders (BST) as a thought-oriented competency. BST’s salience likely increases among higher-level managerial professionals and might be primarily considered a leadership skill. High scorers on BST anticipate and balance the needs of multiple stakeholders. They are proactive and demonstrate foresight and sensitivity to the priorities of diverse players both within and outside of their own organizations. High BST scorers lay formal and/or informal infrastructure and prepare organizations and stakeholders to meet diverse needs in ways that will optimize collective and priority goal attainment and the processes by which attainment is secured. Diverse stakeholders rarely align vis-à-vis wide and/or specific conceptualizations of goals and processes by which goals are achieved. As such, related and competing interests, competing needs, and competing priorities have potential to create conflicts and barriers to progress. High BST scorers anticipate related issues proactively and make related provisions early. They’re likely to be poised to provide rapid, versatile, and targeted service and response to a number of different stakeholders.
BST is a key component of effective leaders and leadership teams. Companies without a proliferation of high BST leaders are more likely to encounter a wide range of undesirable organizational and business outcomes, and certainly low revenues and poor financial marks are among them. But the proliferation of low BST among company leaders can also negatively impact even brand image and organizational reputation (Dickinson-Delaporte, Beverland, & Lindgreen, 2010; Palazzo & Basu, 2007; Voss & Moorman, 2005). In fact, some have observed that BST may be particularly salient among high-level executive public relations professionals (Phillips, 2004).
Leaders with high BST often have or are perceived to have more insight into business operations, business needs, and business priorities. They manage conflict better than their low BST counterparts, and have or are typically believed to have better judgment, stronger relationship networks, and are more persuasive. High BST is positively correlated with being organized and prioritizing effectively, as well as integrating feedback and proactively communicating goal-pursuit progress in ways that mitigate project derailment and minimize wasted effort (Korn Ferry, 2014a).
Cultivates innovation. Cultivates innovation (CIN) is a relatively rare skill, even among the highest-level executives. It’s also among the most very difficult competencies to develop and acquire. High scorers on measures of CIN create new and better ways for organizations to be successful. They inspire and champion novel ideas and facilitate the identification and development of new products, services, approaches, processes, and solutions. They keep a relatively sharp focus on information and creativity for sustainable competitive advantage, while encouraging diverse points of view, experimentation, and providing latitude for self and others’ failure in pursuit of the new and different. High CIN leaders are often found in start-up companies, but in any case are increasingly salient amidst conditions characterized by market volatility, economic uncertainty, market disruption, and organizational change. At the same time, organizations with a clear and stable focus and/or markets characterized by stability can render this competency and accompanying motivational orientation less desirable. Market stability and organizational maturity tend to decrease the need and effectiveness of leaders with high CIN scores, as do conditions characterized by a marked need for risk mitigation (Cameron, Quinn, Degraff, & Thakor, 2014).
High scorers on CIN and CIN-like measures effectively project how innovative solutions might perform in the market. They pick effectively from among competing innovative alternatives, and encourage and incentivize subordinates and colleagues to seek novelty and make unobvious connections between disparate pieces of information. Leaders who effectively cultivate innovation are risk-oriented and tolerant of trial and error. They may concede to a variety of conditions and false starts. They are more likely to champion cross-functional synergies
Korn Ferry’s Four Dimensional Executive Assessment • Research guide and technical manual
28 | © Korn Ferry 2015. All rights reserved.
and collaboration and to include diverse experts or non-experts to diversify perspectives and maximize the potential for creative breakthroughs.
CIN is positively correlated with overall job performance across most management levels, but is particularly salient among senior executives and business unit leaders in terms of performance, (avoiding) derailment risk, and promotability where applicable (Korn Ferry, 2014a). CIN shares substantial, positive, and intuitively appealing correlations with other (Korn Ferry) competencies including Global perspective, Strategic vision, Nimble learning, and Drives vision and purpose. Leaders who effectively cultivate innovation are also typically rated by superiors and peers as having better overall general judgment, viz., Decision quality.
Global perspective. Global perspective (GPE) measures the extent to which individuals allow for inclusive and broad information and diverse perspectives when making recommendations or decisions. GPE is substantially predictive of general performance, promotability, and derailment risk across management levels. High GPE is typically a strong competency among effectively innovative leaders and leaders who are also high on independent ratings of Strategic vision, Business insight, and Organizational savvy. Leaders high in GPE also do better in terms of Manages complexity, Nimble learning, and Drives vision and purpose. High GPE leaders tend to critically examine their own principles, assumptions, and judgments, and may seek to compare them to the assumptions and perspectives of others broadly defined. Where applicable, they may seek exposure to within- or between-organization members working in diverse regions or in diverse business units.
Leaders with high GPE place a premium on the potential benefits of diverse thinking, disparate perspectives, competing interests, cross-cultural, and even cross-regional considerations. They may see opportunity in disagreement or non-uniform inter-group policy structures or barriers. Their orientation to information and diverse perspectives often renders them poised for early recognition of emerging (global) trends and for anticipating future needs and/or opportunities (Edin, Lingqvist, & Tamsons, 2012). They typically have or seek insight into how diverse markets, including (but not limited to) diverse regional markets, will react to their organization’s products, strategies, and/or policies. As such, high GPE leaders are more likely to be prepared and poised to align business practices with even diverse geopolitical contexts and/or foreign or inter-industry policy issues or business dynamics. A high GPE leader proactively seeks to localize their products and strategies across variously defined global contexts (Bersin, 2013). Related tendencies can nurture many competitive advantages, including global trade advantages (Travis, 2007). High GPE leaders also tend to proactively seek and nurture strategic personal relationships, opportunities for informal consultation, and restructuring needs or related contingency plans that will contribute to success (Travis, 2007).
Strategic vision. Managers have Strategic vision (SVI)15 to the extent that they orient themselves to future possibilities, effective planning and goal setting, and seek to translate ideas, expectations, forecastings, and emerging opportunities or needs into viable strategies. Like Cultivates innovation, SVI is among the most very difficult competencies to develop and harness. SVI is markedly and positively predictive of overall job performance, promotability, and decreased derailment risk across management levels. Leaders high in SVI tend to have increased business and organizational insight. They manage complexity more effectively. They make better decisions and cultivate the new and different. SVI is very highly correlated with Global perspective, agility-like measures and openness to diverse perspectives and input. Managerial professionals with high SVI identify new opportunities to create value. They commit resources and lift barriers to innovation and promote a culture that rewards creativity.
SVI is, in many cases, a virtual prerequisite for executive leadership roles (Clark, 2013). Companies with high aggregate SVI tend to be in front of emerging opportunities and unforeseen threats, which facilitate timely, informed, and sometimes crucial decisions (Birshan & Kar, 2012). High SVI leaders are leaders who think broadly and inclusively (Clark, 2013). They see emerging trends, recognize the organizational relevance of trends, and anticipate how trends will play out in the future (Birshan & Kar, 2012; Edin, Lingqvist, & Tamsons, 2012). Strategic orientation among modern leaders is increasingly important for sustaining organizational performance and competitive advantage. Strategic planning can, however, become complicated by ambiguous circumstances and the increasingly common volatile and fast-changing nature of markets. For these and other reasons, high SVI is particularly effective when combined with some of its natural correlates such as high adaptability, agility, resilience,
15 In other KF4D solutions and applications outside of executive search, SVI is sometimes referred to as Strategic mindset.
Korn Ferry’s Four Dimensional Executive Assessment • Research guide and technical manual
29 | © Korn Ferry 2015. All rights reserved.
and persistence (Yorks & Nicolaides, 2012). Perhaps, paradoxically, the most effective strategic executives likely bring a mix of malleable and persistent strategic mindset that ultimately fosters long-term goal achievement as well as facilitates ongoing shorter-term and ad hoc achievements.
Results competencies Ensures accountability. Ensures accountability (EAC) is a hallmark of a results-oriented and tactically focused executive. High EAC leaders effectively and diligently hold both self and others accountable to meet commitments. In our own empirical studies of boss-rated competencies and managerial outcomes, EAC’s bivariate relationship with overall performance is as high or higher than all others for senior executives (r = .51; Korn Ferry [2014a]) and is in or very near the top 10 most predictive of performance for all other management levels. It also shows substantial predictive utility for promotability and derailment risk across management levels. High EAC leaders and professionals also tend to be notably action oriented and resourceful. They receive higher marks on measures of driving results, directing work, and tend to be notably skilled at optimizing work processes, among other things. High EAC leaders also strongly tend toward courage and willingness to have difficult conversations, increased decision quality, effective planning, and optimized, effective, and efficient use and allocation of organizational resources (Korn Ferry, 2014a).
High EAC leaders communicate expectations with clarity and are likely perceived as fair and straightforward ambassadors of meritocracy. They tend to plan and evaluate progress systematically. They may divide outcomes into measurable units, think in terms of deliverables and related time lines, and assign responsibilities and expectations with clarity and in concrete terms if and when possible. High EAC leaders may create formal or informal systems and practices that promote accountability, reward results, and foster a feedback-rich organizational culture (Zenger & Folkman, 2014). They can and know when to instill a strong sense of urgency and drive, which often yields improved business performance and helps self, teams, and individuals meet deadlines and commitments (Georgia Perimeter College, 2011). Subordinates and even colleagues of high EAC leaders tend to understand their own roles and importance more clearly, and often are increasingly satisfied with their jobs and have better and more trusting relationships with colleagues and organizational members (Thoms, Dose, & Scott, 2002). Despite the many benefits of high EAC leadership—even among the highest-ranking executives—a high EAC orientation toward management can sometimes operate at cross-purposes or create challenges in matrixed environments or among modern leaders who eschew tactics and detail orientation in favor of agility, adaptability, and high degrees of autonomy granting. EAC is among the easier competencies to develop and is in relatively high supply among managerial professionals. Yet, high EAC in effective combination with high agility, adaptability, flexibility, innovative skill, and forward-thinking strategic orientation may be more elusive and particularly valuable to modern organizations and their leadership.
Aligns execution. Leaders scoring high in Aligns execution (AEX)16 effectively plan, organize, and prioritize work to meet commitments in ways optimally aligned with organizational goals. For entry-level management and high-level executives alike, AEX alone typically explains about 25% of the variability in overall performance. Fortunately, AEX is typically in high supply and relatively easy to acquire and develop. AEX also predicts a substantial portion of the variance in promotability and derailment risk across management levels. High AEX leaders effectively execute upon organizational strategies. They design and employ tactics diligently to achieve organizational goals. They anticipate and remove barriers and allocate organizational resources in alignment with strategic priorities. High AEX leaders identify and promote wide adoption of best practices and lessons learned. They convey clear direction vis-à-vis strategic priorities and ensure that work is coordinated and sequenced appropriately across the organization in pursuit of known and prescribed objectives which they may or may not have set (Lavoie, 2013). They contribute to determining and communicating appropriately ambitious time lines.
The most effective high AEX leaders are also good communicators. They invite and are proactive vis-à-vis lines of communication with diverse stakeholders (Merrett, 2012). In fact, EQ, Social leadership traits, and related competencies may mediate and/or moderate the ultimate impact of AEX on performance outcomes. High AEX leaders also tend to manage complexity, direct work, demonstrate resilience, drive results, and optimize work processes effectively (Korn Ferry, 2014a). High correlates also include Ensures accountability, Decision quality, and Resourcefulness and are all likely key to making a high AEX leader a maximally effective leader. High AEX
16 In other KF4D solutions and applications outside of executive search, AEX is sometimes referred to as Plans and aligns.
Korn Ferry’s Four Dimensional Executive Assessment • Research guide and technical manual
30 | © Korn Ferry 2015. All rights reserved.
and EAC leaders typically have more adaptively motivated and engaged subordinates—particularly among the lower levels. This is due, in part, to increased communication and feedback vis-à-vis individual goal achievement and performance, and the importance of individuals’ contributions (Lavoie, 2013).
High AEX is no doubt an adaptive and key competency across contexts and management levels. A skilled AEX leader is steadfast and driven, but also willing and able to adopt partial solutions to problems and improve and adapt as needed. Unqualified and classic notions of high AEX (careful planning and diligent execution) may typically be found more readily and are perhaps more immediately adaptive and salient in highly structured company cultures and/or within (tactical) business units with relatively clear goals and methods. Managers who view leadership and management as primarily functions of AEX and EAC are more likely among managers at the front lines or mid-levels. They may grow confused and/or frustrated amidst the fluidity, nimble change, and ambiguous circumstances that increasingly characterize modern businesses and modern markets. Organizations, including those with well-defined legacy products and services, are increasingly willing to actively sell products and/or services that, in many cases, are yet to exist and/or yet to be fully designed or conceptualized (Cottmeyer, 2011). Fast and incomplete increasingly default to “lesser evil” status compared to not-so-fast, correct, and fully developed (Dyer, 2015). Technology and software companies, for example, commonly and proactively design, create, and prepare entire departments to specifically handle the inevitable issues raised because they know and expect to release products and services that are incomplete, sometimes not working well, underdeveloped, and/or contain “bugs.” Moreover, client companies and high-level executives increasingly negotiate and design (non-trivial components of) products and services together long before formal contracts exist. As a result, the specific nature of a given service and/or product may not be forthcoming in markedly consequential ways until related agreements are formalized or beyond and, as such, tactical and task-oriented managers and contributors may have to operate also with marked degrees of ambiguity and low clarity. The decree to “build!” is increasingly put forth before the answer to “build what?” is known. As such, a truly skilled high AEX, high EAC, and results-driven leader is most likely also a high agility, highly flexible, and highly ambiguity tolerant leader—and one who is able to avoid the understandable and natural allure of viewing careful planning, clear expectations, clean execution, and classical results-drive as being oriented in an oxymoronic way toward ambiguity, flexibility, risk, unknowns, evolving messages, false starts, and pushing hard in an unknown direction against an unknown surface. Increasingly, effective planning is contingency planning first. Executing often means executing upon what can be known and otherwise laying the infrastructure needed to remain poised and ready to execute quickly and efficiently according to any number of contingencies or complex interactions among contingencies.
People competencies Navigates networks. High scorers on Navigates networks (NNE)17 effectively build formal and informal relationships and relationship networks both within and across organizational boundaries. Senior executives typically score high in this area, but NNE is otherwise a competency that distinguishes between management levels better than most. NNE is also markedly difficult to develop, which contributes in no small way to its low supply among (increasingly) lower-level managerial personnel. NNE is correlated with overall managerial performance, and its predictive utility increases with management level (Korn Ferry, 2014a; Thompson, 2005). Increased NNE is also among the strongest predictors of promotability (Seibert, Crant, & Kraimer, 1999) and decreased derailment risk (Korn Ferry, 2014a). NNE is strongly and positively associated with measures of organizational savvy, persuasiveness, negotiation skill, situational/social adaptability, broad perspective, conflict management, and effective communication. NNE is typically higher among extroverts (Forret & Dougherty, 2001; Wolff & Kim, 2011), and individuals who are more flexible, agile, and open to experiences (Wolff & Kim, 2012) tend toward being proactive more than reactive in a variety of ways (Thompson, 2005). High scorers on NNE-like measures typically value and build key relationships and partnerships across functional, cultural, organizational, and regional boundaries. They tend to be well connected and markedly resourceful in ways that facilitate advancing ideas and implementing initiatives across and within organizations.
Engages and inspires. High scorers on Engages and inspires (EIN)18 motivate others to mentally, emotionally, and with discretionary effort invest in organizational missions, duties, goals, and objectives. EIN is a rare competency across all management levels and is generally predictive of overall performance, promotability, and
17 In other KF4D solutions and applications outside of executive search, NNE is sometimes referred to as Builds networks. 18 In other KF4D solutions and applications outside of executive search, EIN is sometimes referred to as Drives engagement.
Korn Ferry’s Four Dimensional Executive Assessment • Research guide and technical manual
31 | © Korn Ferry 2015. All rights reserved.
decreased derailment risk, although its salience generally increases among higher-level managerial professionals. EIN among leaders tends to positively affect employee and subordinate productivity and loyalty (Kerns, 2014) which in turn—as if operating as a feedback loop—also positively impacts the upper-level managers with elevated EIN. Subordinates and colleagues of high EIN leaders tend to have higher scores on measures of well-being, and companies in which high EIN leaders are abundant tend to have higher returns for investors, increased customer loyalty, increased operating income, increased employee optimism, and higher quality impacting products and services (Kerns, 2014).
Leaders with high EIN tend to be highly effective communicators who empower and grant autonomy to others who, in turn, tend to better understand and value their unique contributions toward organizational objectives. In other words, high EIN leaders make others feel valued and instrumental to organizational success. Leaders scoring high on EIN and EIN-like measures tend to “delegate internalized ownership” and internalized responsibility in ways that increase colleague and subordinate loyalty and discretionary personal investment. They communicate organizational vision and strategy in ways that engage others, incite passion, increase general optimism and confidence, and tend toward making intentional or unintentional effective appeal to individuals’ values and broadly defined goals (see, for example, Zhang, Avery, Bergsteiner, & More, 2014).
EIN is positively associated with other competency areas including collaboration (Leigh & Maynard, 2012), developing talent, directing work, interpersonal savvy, situational adaptability, and driving vision and purpose. High-scoring leaders on EIN and EIN-like measures also build more effective teams and tend to more strongly value and effectively leverage differences and diversity (broadly defined) within/across teams and within/across organizational units (Korn Ferry, 2014a). Additional discussion of EIN and related notions is available in Korn Ferry (2014a) and also is discussed earlier in this technical manual concerning the KF4D-Exec Influence trait, which is a closely related measure having many of the same descriptive hallmarks, correlates, and predictive utilities.
Develops talent. Leaders who effectively develop talent (DTA) proactively nurture people-development and talent-development in ways that facilitate goal achievement for both individuals and organizations. DTA is a rare competency and most often characterized as being notably difficult to acquire and develop. High DTA leaders build and nurture cultures focused on talent. They promote and reinforce the value of active learning and its organizational impact. They tend to sponsor and/or facilitate initiatives or action to ensure leadership and talent excellence and continuity. A leader with notably high DTA will formally and/or informally set and communicate individual and organizational talent development expectations in effective ways.
Companies with high DTA leadership tend toward a culture of continuous learning and improvement (Gardner, 2011). High DTA leaders actively seek talent and potential among their colleagues and subordinates and facilitate developmental opportunities such as mentoring and/or “connecting the right people” (Gallo, 2011), as well as action and experience-based learning, formal training, and/or exposure to challenging growth roles and/or responsibilities. Leaders who effectively develop talent build developmental scaffolds for self and others. They encourage and offer feedback to ensure learning and development. They have high expectations and tend to value and grant increasing levels of autonomy and challenge to subordinates or laterally oriented coworkers, where applicable (Gardner, 2011; Murphy Paul, 2013).
Developing talent is notably correlated with third-party ratings of overall job performance across management levels—including among high-level executives (e.g., r = .38 among senior executives). Its salience, nonetheless, seems at least slightly elevated for first-line and mid-level leaders (Korn Ferry, 2014a), perhaps particularly in terms of promotability. This may be due to mid-level leaders’ increased proximity to lower-level managers and contributors whose need and capacity for growth is typically larger and who are more likely to be in process vis-à-vis establishing and developing their own sense of occupational and organizational identity. Not surprisingly, DTA is also markedly and positively correlated with other Korn Ferry competencies including Directs work, Engages and inspires, Builds effective teams, Attracts top talent, and Courage, among others (Korn Ferry, 2014a).
Manages conflict. Manages conflict (MCO) is a people-oriented competency and refers to handling conflict situations effectively and with a minimum of noise or collateral damage. High MCO scorers have an increased ability to defuse high-tension personnel situations. Employees, especially leaders, who are able to effectively manage conflict often can and do see conflict situations as opportunity that can affect breakthroughs in relationships and communication, contribute to individual and group problem solving, and increase collective and individual strategic and visionary thinking. While MCO is an important competency for all management levels,
Korn Ferry’s Four Dimensional Executive Assessment • Research guide and technical manual
32 | © Korn Ferry 2015. All rights reserved.
including senior executives, research has shown that MCO is one of the most difficult skills to develop, and relatively rare among all types of employees. With the exception of entry-level task-oriented contributors, elevated MCO scores are markedly predictive of performance and promotability, and they significantly lower derailment risk (Korn Ferry, 2014a).
Not surprisingly, leaders who manage conflict effectively also tend to be more willing to confront and successfully engage in difficult and high-stakes conversations. They tend to be more collaborative, persuasive, resilient, socially adaptable, and they more effectively balance stakeholders (Coleman & Kugler, 2014). MCO is also negatively associated with work-related anxiety (Fracher & Blick, 1973) and is positively associated with relationship quality and sociability (Bloomfield & Blick, 1975). MCO is constructive conflict management and is positively related to EQ (Schlaerth et al., 2013). Although we have seen little related evidence in our own data (e.g., Korn Ferry, 2014a), except when examining MCO’s relationship with performance across entry-level professionals and all other levels, some have found the importance and predictive utility of MCO-like constructs to increase among lower-level managers (Schlaerth et al., 2013), suggesting that lower-level managers’ relatively high focus on execution and tactical implementation grant more opportunity for the proliferation of personnel conflict (Schlaerth, Ensari, & Christian, 2013).
Lower scorers on MCO tend to defer to rank-legitimized and “controlling” approaches to negotiations and conflict (Follett, 1973/1924; Magee & Galinsky, 2008; Rubin & Brown, 1975; Zartman & Rubin, 2002). They’re more likely to employ “pressure tactics,” offer fewer concessions, have unrealistic expectations and aspirations, and employ more contentious tactics in conflict (Anderson & Berdahl, 2002; Brown & Levinson, 1987; Dwyer & Walker, 1981; Magee, Galinsky, & Gruenfeld, 2007; McAlister, Bazerman, & Fader, 1986; Rubin & Brown, 1975; Zartman & Rubin, 2002). They also tend to neglect and underestimate the resources and potential impact of lower-level internal stakeholders (Fiske, 1993; Salacuse, 2002). Individuals scoring low on measures of MCO-like constructs are more likely to harbor a sense of general dominance, they fare less well in negotiations, undermine relationships, foster less commitment to their decisions, and cultivate negativity and resentment of subordinates (Lewicki, Saunders, & Barry, 2005; Salacuse, 2002; Yukl, Kim, & Chavez, 1999; Yukl & Tracey, 1992; Zartman & Rubin, 2002).
Persuades. High scorers on the Persuades (PER) competency use compelling arguments to gain the support and commitment of others. PER is a relatively difficult skill to develop and is among the competencies more highly (positively) correlated with performance for all management levels. Interestingly, its positive relationship with performance ratings is higher than its relationship with both promotability and derailment risk, although the correlations are substantial and relatively high with these as well. Not surprisingly, PER is notably correlated with other socially relevant competencies in the wider Korn Ferry competencies framework, including Manages conflict, Interpersonal savvy, Navigates networks, Situational adaptability, and Communicates effectively, among others (Korn Ferry, 2014a).
Individuals with high PER tend toward strong interpersonal skills and negotiating capabilities. Their support-garnering skills tend toward inspiration and win-win outcomes that are likely to result in enduring agreements and, where applicable, enduring change. High scorers tend to have strong relationship networks. They invest priority and discretionary time and effort to establishing and nurturing strong relationships. Their persuasive skill involves communicating a notable and compelling sensitivity to the needs and concerns of others. A leader with strong PER negotiates in ways that underscore the extent to which their position supports and optimizes outcomes related to key business interests. They garner support, commitment, and change the minds of others skillfully, and can be especially effective even when pushing for approaches or decisions that may initially be unpopular or otherwise associated with anxiety among organizational members and stakeholders. When leaders high in PER also have elevated scores in Engages and inspires, Situational adaptability, Influence, and other prosocial and motivational constructs, they are typically able to influence and inspire others and proactively shape shareholder agendas and opinions (Gallo, 2010). As such, PER is likely a key competency among leaders whose jobs involve persistently and proactively balancing stakeholders and representing a variety of within- and between-organization interests and even competing interests.
Self competencies Courage. Leaders with high scores on Courage (COU) tend to address problem situations and controversial issues directly. They will engage proactively in difficult conversations, “saying what needs to be said” in effective,
Korn Ferry’s Four Dimensional Executive Assessment • Research guide and technical manual
33 | © Korn Ferry 2015. All rights reserved.
timely, and appropriate ways. COU seems particularly salient for front-line supervisors and perhaps also senior executives, while being nonetheless predictive of performance, promotability, and (lower) derailment risk for most management levels. COU may be particularly predictive of performance for supervisors and first-level leaders because their orientation to direct reports tends to be more hierarchic and directive. Front-line leaders often do not make decisions or set policies (De Smet, McGurk, & Vinson, 2009), but they rather communicate, enforce, and oversee policy implementation, which may orient them to their direct reports in ways requiring more frequent coaching and even more frequent disciplinary conversation (Sturgeon, 2010). COU, nonetheless, has a similar predictive and top-10 magnitude for senior executives as well (Korn Ferry, 2014a). Many difficult and widely consequential company issues are resolved at the very highest levels of management. AS such, COU is also a particularly salient competency for senior executives (Jablin, 2006) who often feel as if they “stand alone” (Saporito & Winum, 2012), which is partly due, in no small measure, to their need to make and defend high-stakes decisions that may be unpopular or represent necessary compromise in ways that can impact clients, colleagues, and/or personnel in sometimes less than desirable ways. COU is among the more difficult competencies to develop.
High COU leaders tend to be action oriented, and they tend to support others who take personal risks and “do the right thing for the company,” even if unpopular or unsettling to some or many (Tichy & Bennis, 2008). High COU leaders are more resolved and action oriented in high-stakes situations, in crises, in conditions of uncertainty and adversity, and when needing to address behavior inconsistent with organizational core values and objectives. They often act and speak confidently with conviction, particularly in problem or crisis situations, because they tend to be decisive, and to speak and act when they truly believe their decisions and/or point of view are correct (Tichy & Bennis, 2008). They also tend to encourage others to act or speak up where appropriate and to remain sensitive to how organizational policies and direction can affect internal and external stakeholders. High COU leaders tend toward elevated skill in other competency areas including Manages conflict, Decision quality, Directs work, Drives results, and especially Ensures accountability (Korn Ferry, 2014a). They tend to be more experienced in management and leadership and are notably likely to have elevated scores on measures of confidence and integrity (Amos & Klimoski, 2014; Goud, 2005).
Nimble learning. High scorers on measures of Nimble learning (NLE) actively learn through experimentation and use both successes and especially failures as fodder for learning and growth. NLE is moderately difficult to develop and is positively correlated with job performance for all management levels, but especially for senior executives, for whom it is a top-five predictor of performance ratings (Korn Ferry, 2014a). It also predicts promotability and (decreased) derailment risk across levels. High NLE leaders also tend to do better in terms of managing complexity, making quality decisions, cultivating innovation, managing ambiguity, and adaptively employing broad and strategic perspective. NLE has been used as a sub-domain of third-party-rated measures of higher-order learning agility, and is sometimes embedded in a larger cluster of strategic skill measures for executives, being conceptualized as the extent to which individuals learn quickly, broadly, and “on the fly” (Orr & Sack, 2009; Lominger International, 2007).
High NLE leaders tend to promote and foster a company culture that encourages exploration and learning. They expect and provide latitude for failure and place a high value on related learning and how it can ultimately affect improvement and breakthrough (Llopis, 2013); reflection and feedback on failure is a key element of the high NLE leader (Weinzimmer & McConoughey, 2013; Haque, 2010). Informed and skillful trial and error sharpen their instinct for innovation and problem solving (Weinzimmer & McConoughey, 2013).
Manages ambiguity. Leaders with high Manages ambiguity (MAB) scores operate and manage effectively, even when circumstances are uncertain or the way forward is unclear. MAB is among the very most difficult skills to develop, and is in relatively low supply and high demand among leaders and potential leaders. MAB is notably predictive of overall job performance, derailment risk, and promotability across all levels of the leadership pipeline, including among individual and entry-level contributors, whose performance variance is explained by MAB alone at a magnitude near 25%. Leaders with high MAB tend strongly toward increased scores on other Korn Ferry competency measures including Decision quality, Global perspective, Organizational savvy, Being resilient, Situational adaptability, Strategic vision, and especially Nimble learning (NLE) (Korn Ferry, 2014a). In fact, NLE is interestingly coupled with MAB due to the extent to which ambiguous circumstances make experimentation, strides for innovation, latitude for failure, and continual learning all crucial and common elements of modern senior management. In some measurement frameworks, NLE, MAB, and others are included together as sub-components of higher-order composite learning agility measures (Lominger International, 2007).
Korn Ferry’s Four Dimensional Executive Assessment • Research guide and technical manual
34 | © Korn Ferry 2015. All rights reserved.
High MAB leaders are comfortable with uncertainty and in the absence of concrete information or unequivocal decisions and plans. They foster an organizational climate that facilitates change, tolerates uncertainty, and nurtures flexibility. High MAB leaders are more tolerant of stress in many cases and facilitate the same in their teams and colleagues, especially in terms of stress related to uncertainty. They lay infrastructure that makes organizations and teams poised to stay on course, even in the face of unforeseeable and sometimes fast change. They set and communicate goals in ways that allow for directional and methodological adjustments (Sidhu, 2011) and proactively provide operational and social support for uncertainty and fast change in ways that increase adaptability, satisfaction, and performance among their teams, direct reports, and colleagues (Cullen, Edwards, Casper, & Gue, 2014). While MAB makes immediate reference to (self-efficacy for) behavior and skill, MAB and the previously discussed trait Tolerance of ambiguity (TA) are clearly closely linked (r = .50). As such, additional correlates and characteristics of high MAB leaders can be understood by reading the previous section on TA. Note, however, that because MAB makes reference to behavior and not disposition, the possibility of low scores on the former and high on the latter (or vice versa) can and has been observed and has potential implications for understanding and describing KF4D-Exec respondents. For example, a leader may have a disposition characterized by tolerance of ambiguity, but may not be skilled at managing ambiguity. Our self-rated competencies and traits measures are designed to capture this and related differences.
Situational adaptability. Situational adaptability (SAD) is primary a social adaptability, and involves individual skill vis-à-vis effectively adapting approach and demeanor across circumstances, individuals, and/or groups. Like MAB, SAD is a markedly difficult competency to acquire and develop, and notably high SAD leaders are rare across management levels. MAB predicts job performance, promotability, and derailment risk across management levels, and especially in roles involving people-management broadly defined. High SAD leaders also tend to effectively communicate and collaborate. They effectively manage conflict, tend to be more resilient, have higher self-awareness, and value diversity. They inspire others, have higher interpersonal savvy, persuade effectively, and build more effective teams (Korn Ferry, 2014a). SAD is clearly a correlate or component of EQ (Martinuzzi, 2014) and has even been conceptualized as a “meta-competency” which can serve as a determinant of one’s ability to effectively develop and employ other competencies and skills (Briscoe & Hall, 1999). High SAD leaders can effectively adapt their leadership style to best serve a broad range of situations and challenges (Pulakos, Arad, Donovan, & Plamondon, 2000) and help to promote adaptable organizational structures and systems that keep companies poised, relevant, and competitive in volatile markets and circumstances.
Drivers Work motivation has been a central focus of organizational research for many years. The high level of interest in work motivation can be attributed to the long-held belief that individual behavior is influenced by a mix of different factors, including ability, motivation, and situational constraints/facilitators (Campbell & Pritchard, 1976). In human resource management, this is referred to as the AMO framework. In essence, the AMO framework proposes that employee performance (P) is a function of the employee’s ability (A), motivation (M), and opportunity (O) to perform (Boselie, Dietz, & Boon, 2005; Boxall & Purcell, 2008). The AMO model is premised on the idea that organizational interests are best served by the HR system that attends to and optimizes the configuration of the three critical elements. Work motivation is a set of forces that interact with the situation to initiate work-related behavior and to determine its direction, intensity, and duration. This definition highlights the fact that motivation can be seen in the choices individuals make among goals to pursue (i.e., direction), the amount of effort they put forth toward attaining the goals (i.e., intensity), and persistence of action (i.e., duration). In the workplace, notable achievements rarely are the outcome of random activities. Rather, they typically involve a combination of choices concerning what to do, how much attentional effort to devote to specific activities, and when to shift direction and levels of effort. Understanding what motivates individuals at work and what organizations can do to maintain or increase the motivation of their employees can have significant impact on personnel and organizational success.
There have been a variety of ways to conceptualize and investigate motivation. Theories of motivation, however, have converged on the idea that different concepts of motivation can be arranged in a hierarchy. A particularly notable framework that integrates different motivation theories involves Kanfer’s (1990) distinction between distal and proximal motivations. Various motivation constructs differ in terms of their proximities to behavior and action. Motivations that have immediate and direct impact on behaviors are proximal. For instance, goal setting has been widely adopted by managers. Purpose causes action. Goals can focus attention toward goal-relevant activities and
Korn Ferry’s Four Dimensional Executive Assessment • Research guide and technical manual
35 | © Korn Ferry 2015. All rights reserved.
away from irrelevant activities (Locke, 1978). When individuals are committed, goals will energize individuals and initiate the execution of action plans toward attaining the goals. Goal commitment, therefore, is a proximal motivation. On the other hand, whether or not one is committed to a goal set or guided by the organization depends on other individual and situational considerations. Are the expected outcomes of goal attainment important to the person (i.e., valence)? Does the person believe the goals are achievable (i.e., expectancy)? Factors that influence these considerations are more distal than goal commitment with regard to their impact on behaviors. For instance, when the expected outcomes of goal attainment satisfy an individual’s needs, the person is more likely to be motivated to take actions in pursuing the goal. Needs, in this case, represent a set of distal motivations. Proximal motivations guide conscious processes and behavior at a given point in time and situation. In contrast, distal motivations affect action goals through proximal motivations. The impact of distal motivations tends to span longer time frames and across situations. The same need can be satisfied through the pursuit of different action goals. We strive to identify and assess motivations that can predict and explain individuals’ relatively enduring behavioral patterns. To distinguish between proximal motivations, we refer to and measure distal motivations as “drivers.” As such, a driver is an unobservable force originated from within that directs, energizes, and sustains behavior over time and across changing circumstances.
What are drivers? Unlike other individual attributes (e.g., the Big Five model of personality), a consensus and widely adopted framework does not exist for measuring motivational constructs. There are different approaches to conceptualizing and measuring distal motivations. Research on needs and values is foundational to motivation theory and commonly informs related choices. Needs are variable internal states that, when activated or aroused, energize and direct behavior (Pittman & Zeigler, 2007). A need affects behavior when there is a discrepancy between one’s current state and a desired state. The discrepancy leads to the experience of an internal tension that energizes behavior, leading individuals to pursue things in their environment that can help reduce the discrepancy. Although it is not always well supported, Maslow’s (1954) need hierarchy is perhaps the most well-known needs theory. In contrast, values are standards or criteria for selecting among alternatives. They serve as the base for making choices. Values underlie and affect attitudes, which in turn underlie and affect behavior. To consider values in the workplace is to probe the very reasons people work and why they behave in the ways they do in their jobs. A value is an enduring belief that a specific mode of conduct or end state of existence is personally and socially preferable to alternative modes of conduct or end states (Rokeach, 1973). Therefore, values entail attention to both means (how to do) and ends (what to pursue). For instance, two individuals may both have a desire to influence others. However, one may choose to rely on formal power, the other may take a participative or deferential approach. This implies the difference between needs and values. Whereas needs are considered to be at least partially biologically based, values are shaped to a larger extent by social factors such as perceived relative status and also by culture.
Needs and values, nonetheless, are and remain closely related. Values represent the expression of needs. When an individual has a strong need for something, the individual places high value on situations that enable them to satisfy this need. As such, needs and values tend to be used interchangeably in the work motivation literature (Kooij, De Lange, Jansen, Kanfer, & Dikkers, 2011). This is revealed by the fact that measures of needs and values often contain the same test items. For this reason, we reviewed both lines of research to inform the architecture of our framework with the purpose of establishing a taxonomy of drivers that sufficiently synthesizes existing theories of needs and values.
The benefits of assessing drivers Assessing drivers facilitates some degree of evaluation of fit between an individual and an organization (we discuss this more in later sections). Employee performance is a function of ability, motivation, and opportunity. One of the major tasks of the HR function is to establish and maintain the configuration or fit between the person and the work environment through activities such as assessment, deployment, and development. There are multiple aspects of fit, e.g., person-job fit and person-vocation fit (Kristof-Brown & Guay, 2010). One specific type of fit that has been found to have an impact on individual and organizational outcomes is person-organization fit. Aspects of individuals, such as values and expectations, interact with organizational features, such as cultures, to affect the individuals’ attitudinal and behavioral responses. Empirical research has demonstrated the positive outcomes of person-organization fit including perceived organizational attraction (Yu, 2014), job satisfaction and organizational
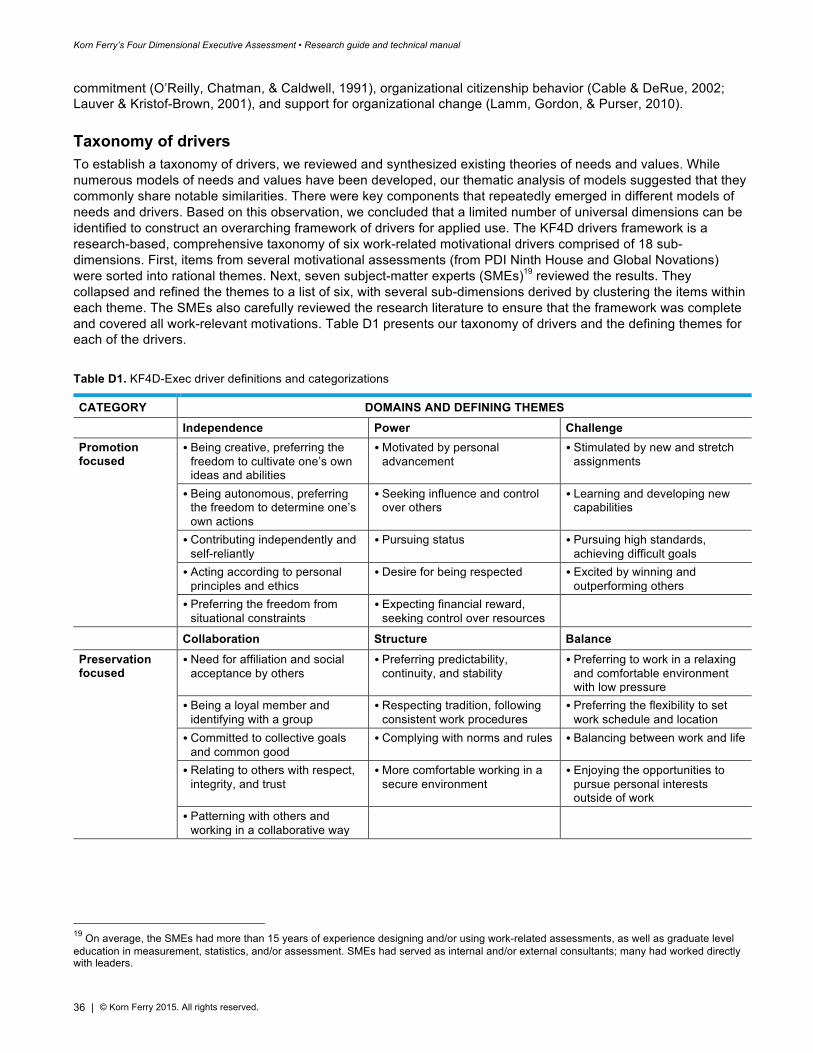
Korn Ferry’s Four Dimensional Executive Assessment • Research guide and technical manual
36 | © Korn Ferry 2015. All rights reserved.
commitment (O’Reilly, Chatman, & Caldwell, 1991), organizational citizenship behavior (Cable & DeRue, 2002; Lauver & Kristof-Brown, 2001), and support for organizational change (Lamm, Gordon, & Purser, 2010).
Taxonomy of drivers To establish a taxonomy of drivers, we reviewed and synthesized existing theories of needs and values. While numerous models of needs and values have been developed, our thematic analysis of models suggested that they commonly share notable similarities. There were key components that repeatedly emerged in different models of needs and drivers. Based on this observation, we concluded that a limited number of universal dimensions can be identified to construct an overarching framework of drivers for applied use. The KF4D drivers framework is a research-based, comprehensive taxonomy of six work-related motivational drivers comprised of 18 sub-dimensions. First, items from several motivational assessments (from PDI Ninth House and Global Novations) were sorted into rational themes. Next, seven subject-matter experts (SMEs)19 reviewed the results. They collapsed and refined the themes to a list of six, with several sub-dimensions derived by clustering the items within each theme. The SMEs also carefully reviewed the research literature to ensure that the framework was complete and covered all work-relevant motivations. Table D1 presents our taxonomy of drivers and the defining themes for each of the drivers.
Table D1. KF4D-Exec driver definitions and categorizations
CATEGORY DOMAINS AND DEFINING THEMES Independence Power Challenge Promotion focused
• Being creative, preferring the freedom to cultivate one’s own ideas and abilities
• Motivated by personal advancement
• Stimulated by new and stretch assignments
• Being autonomous, preferring the freedom to determine one’s own actions
• Seeking influence and control over others
• Learning and developing new capabilities
• Contributing independently and self-reliantly
• Pursuing status • Pursuing high standards, achieving difficult goals
• Acting according to personal principles and ethics
• Desire for being respected • Excited by winning and outperforming others
• Preferring the freedom from situational constraints
• Expecting financial reward, seeking control over resources
Collaboration Structure Balance Preservation focused
• Need for affiliation and social acceptance by others
• Preferring predictability, continuity, and stability
• Preferring to work in a relaxing and comfortable environment with low pressure
• Being a loyal member and identifying with a group
• Respecting tradition, following consistent work procedures
• Preferring the flexibility to set work schedule and location
• Committed to collective goals and common good
• Complying with norms and rules • Balancing between work and life
• Relating to others with respect, integrity, and trust
• More comfortable working in a secure environment
• Enjoying the opportunities to pursue personal interests outside of work
• Patterning with others and working in a collaborative way
19 On average, the SMEs had more than 15 years of experience designing and/or using work-related assessments, as well as graduate level education in measurement, statistics, and/or assessment. SMEs had served as internal and/or external consultants; many had worked directly with leaders.
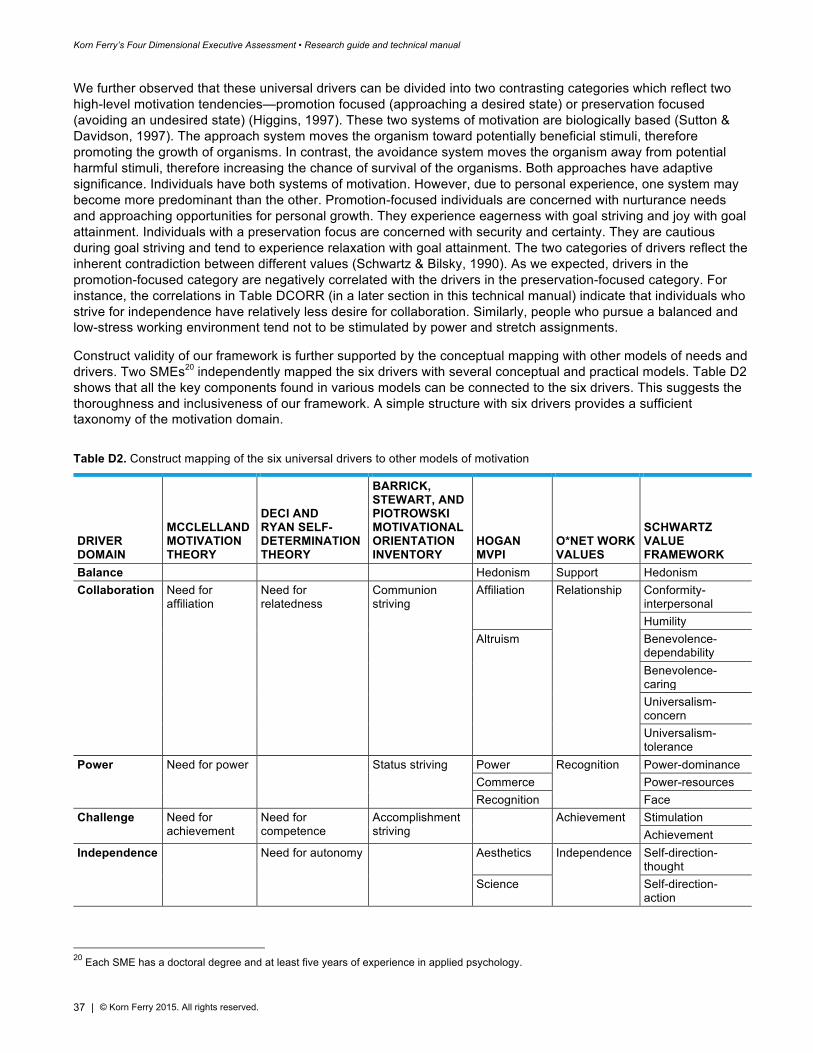
Korn Ferry’s Four Dimensional Executive Assessment • Research guide and technical manual
37 | © Korn Ferry 2015. All rights reserved.
We further observed that these universal drivers can be divided into two contrasting categories which reflect two high-level motivation tendencies—promotion focused (approaching a desired state) or preservation focused (avoiding an undesired state) (Higgins, 1997). These two systems of motivation are biologically based (Sutton & Davidson, 1997). The approach system moves the organism toward potentially beneficial stimuli, therefore promoting the growth of organisms. In contrast, the avoidance system moves the organism away from potential harmful stimuli, therefore increasing the chance of survival of the organisms. Both approaches have adaptive significance. Individuals have both systems of motivation. However, due to personal experience, one system may become more predominant than the other. Promotion-focused individuals are concerned with nurturance needs and approaching opportunities for personal growth. They experience eagerness with goal striving and joy with goal attainment. Individuals with a preservation focus are concerned with security and certainty. They are cautious during goal striving and tend to experience relaxation with goal attainment. The two categories of drivers reflect the inherent contradiction between different values (Schwartz & Bilsky, 1990). As we expected, drivers in the promotion-focused category are negatively correlated with the drivers in the preservation-focused category. For instance, the correlations in Table DCORR (in a later section in this technical manual) indicate that individuals who strive for independence have relatively less desire for collaboration. Similarly, people who pursue a balanced and low-stress working environment tend not to be stimulated by power and stretch assignments.
Construct validity of our framework is further supported by the conceptual mapping with other models of needs and drivers. Two SMEs20 independently mapped the six drivers with several conceptual and practical models. Table D2 shows that all the key components found in various models can be connected to the six drivers. This suggests the thoroughness and inclusiveness of our framework. A simple structure with six drivers provides a sufficient taxonomy of the motivation domain.
Table D2. Construct mapping of the six universal drivers to other models of motivation
DRIVER DOMAIN
MCCLELLAND MOTIVATION THEORY
DECI AND RYAN SELF-DETERMINATION THEORY
BARRICK, STEWART, AND PIOTROWSKI MOTIVATIONAL ORIENTATION INVENTORY
HOGAN MVPI
O*NET WORK VALUES
SCHWARTZ VALUE FRAMEWORK
Balance Hedonism Support Hedonism Collaboration Need for
affiliation Need for relatedness
Communion striving
Affiliation Relationship Conformity-interpersonal Humility
Altruism Benevolence-dependability Benevolence-caring Universalism-concern Universalism-tolerance
Power Need for power Status striving Power Recognition Power-dominance Commerce Power-resources Recognition Face
Challenge Need for achievement
Need for competence
Accomplishment striving
Achievement Stimulation Achievement
Independence Need for autonomy Aesthetics Independence Self-direction-thought
Science Self-direction-action
20 Each SME has a doctoral degree and at least five years of experience in applied psychology.
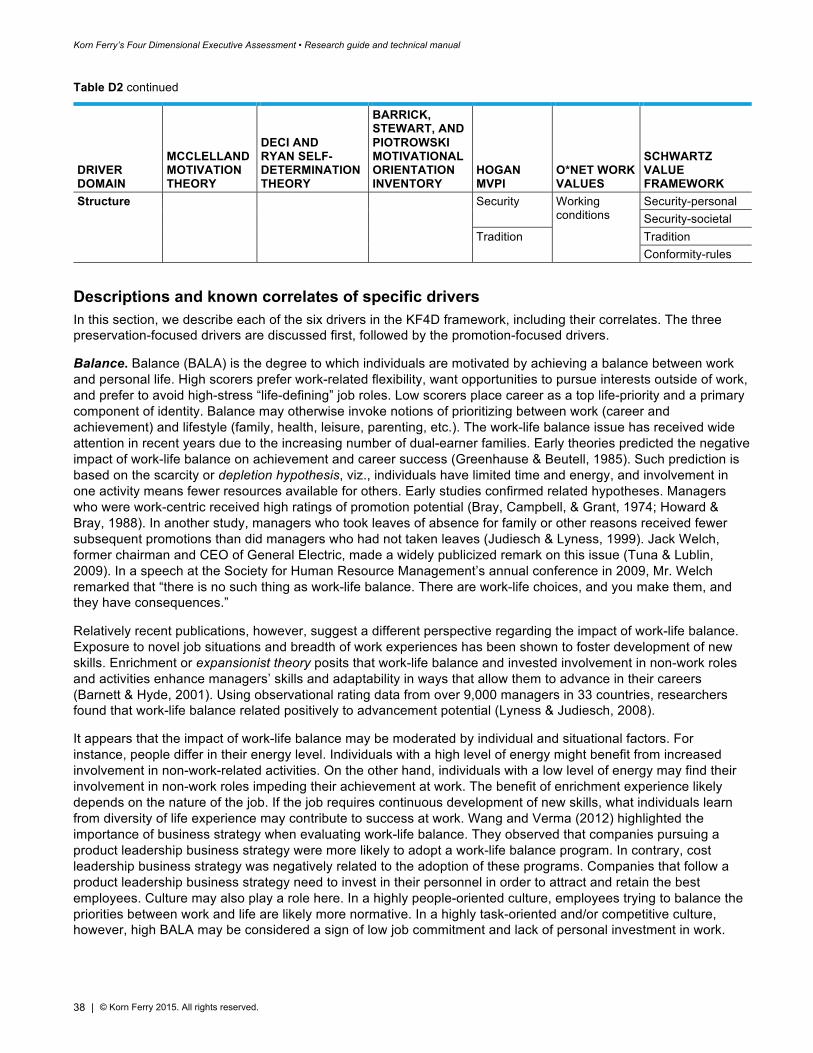
Korn Ferry’s Four Dimensional Executive Assessment • Research guide and technical manual
38 | © Korn Ferry 2015. All rights reserved.
Table D2 continued
DRIVER DOMAIN
MCCLELLAND MOTIVATION THEORY
DECI AND RYAN SELF-DETERMINATION THEORY
BARRICK, STEWART, AND PIOTROWSKI MOTIVATIONAL ORIENTATION INVENTORY
HOGAN MVPI
O*NET WORK VALUES
SCHWARTZ VALUE FRAMEWORK
Structure Security Working conditions
Security-personal Security-societal
Tradition Tradition Conformity-rules
Descriptions and known correlates of specific drivers In this section, we describe each of the six drivers in the KF4D framework, including their correlates. The three preservation-focused drivers are discussed first, followed by the promotion-focused drivers.
Balance. Balance (BALA) is the degree to which individuals are motivated by achieving a balance between work and personal life. High scorers prefer work-related flexibility, want opportunities to pursue interests outside of work, and prefer to avoid high-stress “life-defining” job roles. Low scorers place career as a top life-priority and a primary component of identity. Balance may otherwise invoke notions of prioritizing between work (career and achievement) and lifestyle (family, health, leisure, parenting, etc.). The work-life balance issue has received wide attention in recent years due to the increasing number of dual-earner families. Early theories predicted the negative impact of work-life balance on achievement and career success (Greenhause & Beutell, 1985). Such prediction is based on the scarcity or depletion hypothesis, viz., individuals have limited time and energy, and involvement in one activity means fewer resources available for others. Early studies confirmed related hypotheses. Managers who were work-centric received high ratings of promotion potential (Bray, Campbell, & Grant, 1974; Howard & Bray, 1988). In another study, managers who took leaves of absence for family or other reasons received fewer subsequent promotions than did managers who had not taken leaves (Judiesch & Lyness, 1999). Jack Welch, former chairman and CEO of General Electric, made a widely publicized remark on this issue (Tuna & Lublin, 2009). In a speech at the Society for Human Resource Management’s annual conference in 2009, Mr. Welch remarked that “there is no such thing as work-life balance. There are work-life choices, and you make them, and they have consequences.”
Relatively recent publications, however, suggest a different perspective regarding the impact of work-life balance. Exposure to novel job situations and breadth of work experiences has been shown to foster development of new skills. Enrichment or expansionist theory posits that work-life balance and invested involvement in non-work roles and activities enhance managers’ skills and adaptability in ways that allow them to advance in their careers (Barnett & Hyde, 2001). Using observational rating data from over 9,000 managers in 33 countries, researchers found that work-life balance related positively to advancement potential (Lyness & Judiesch, 2008).
It appears that the impact of work-life balance may be moderated by individual and situational factors. For instance, people differ in their energy level. Individuals with a high level of energy might benefit from increased involvement in non-work-related activities. On the other hand, individuals with a low level of energy may find their involvement in non-work roles impeding their achievement at work. The benefit of enrichment experience likely depends on the nature of the job. If the job requires continuous development of new skills, what individuals learn from diversity of life experience may contribute to success at work. Wang and Verma (2012) highlighted the importance of business strategy when evaluating work-life balance. They observed that companies pursuing a product leadership business strategy were more likely to adopt a work-life balance program. In contrary, cost leadership business strategy was negatively related to the adoption of these programs. Companies that follow a product leadership business strategy need to invest in their personnel in order to attract and retain the best employees. Culture may also play a role here. In a highly people-oriented culture, employees trying to balance the priorities between work and life are likely more normative. In a highly task-oriented and/or competitive culture, however, high BALA may be considered a sign of low job commitment and lack of personal investment in work.
Korn Ferry’s Four Dimensional Executive Assessment • Research guide and technical manual
39 | © Korn Ferry 2015. All rights reserved.
Collaboration. Broadly, Collaboration (COLL) refers to communion striving. It describes actions directed toward obtaining acceptance in personal relationships and getting along with others. Socioanalytic theorists (e.g., Hogan & Warremfeltz, 2003) have argued that people have innate biological needs for acceptance and approval. Being connected to others, feeling a sense of relatedness, and desire for interpersonal attachment is a fundamental human motivation (Baumeister & Leary, 1995). Social isolation is typically not a desired state for human beings. Loneliness generates a threat response, much the same as thirst, hunger, or fear, and even has physiological effects in ways measurably and surprisingly similar to pain (Eisenberger, Lieberman, & Williams, 2003). COLL may have a non-linear relationship with leadership success. On the one hand, COLL is associated with conformity and conflict avoidance, which are not generally typical of leaders. In a longitudinal study, McClelland and Boyatzis (1982) found that the need for affiliation (a COLL-like measure) was negatively related to promotion and managerial level. In today’s organizations, however, the pace of technological change, increased complexity, competitive demands, challenging economics, and risks involved in decision making have made it difficult for individuals to act alone and avoid nurturing interdependence. Leadership research increasingly emphasizes the collaborative approaches to leadership effectiveness (Yammarino, Salas, Serban, Shirreffs, & Shuffler, 2012). Some scholars even suggest that leaders develop and adopt “collective identities,” which involve self-definitions based on group membership (Venus, Mao, Lanaj, & Johnson, 2012). High COLL leaders are motivated by internalizing group values and norms, fulfilling social roles and obligations, and contributing to the group’s welfare. This typically cultivates trust among team members, which in turn results in increased team performance (Drescher, Korsgaard, Welpe, Picot, & Wigand, 2014). Collaborative leadership is increasingly characterized as key for innovation management. In our own data (e.g., D’Mello, 2015), we have repeatedly found collaboration (albeit characterized as a behavior more than a motive) to be one of the most salient predictors of innovation and related outcomes.
Structure. One of the basic survival needs among any group or single organism involves avoiding threats to self and integrity. Early motivation theorists emphasized the centrality of safety and security as a basic motivator (Alderfer, 1969; Maslow, 1959), and related theories have long since been extended beyond basic notions of physical survival. Psychological well-being and integrity are arguably as important for individual survival as are physical needs, particularly among humans. Early research by Frederick Herzberg (1959) invoked the notion of “hygiene” factors (e.g., job security, working conditions, and company policy) and characterized them as central components to workplace survival and well-being rooted in predictability. According to Herzberg, the absence of the hygiene factors result in demotivation.
Structure (STRC) refers to preference for work-related stability, routine, certainty, and predictability. Humans and animals closely associate certainty with comfort and safety and, by nature, often prefer (fore)knowledge concerning “what will happen next” in general or according to any given reinforcement schedule or if-then contingency. Certainty and predictability facilitate control and personal agency and, where rewarding, will reinforce and stabilize behavior. Meeting and reaping rewards according to known and clear expectations generate even physiologically measurable outcomes, including dopamine levels in the brain, which are typically desirable (Schultz, 1999). In contrast, when patterns do not play out according to expectation, or when if-then reinforcement schedules are erratic, people tend to sense instability and threats to well-being.
High STRC is perhaps most adaptive and more cleanly reinforced in bureaucratic and regulatory environments and in job roles with relatively focused goals and processes. The modern economy is increasingly bereft of small-craft workmanship and specialization in favor of rapid and pervasive growth of large corporations. To deal with the increasing complexity, organizations have typically divided and defined job “functions” to clarify duties and responsibilities and to stay organized and efficient. On the other hand, formal and informal functional divisions can create problems and challenges for coordination, which has always been and is increasingly fundamental to organizational goal achievement—particularly in larger organizations with more complex and loftier goals. Coordinating is complicated by multiple and sometimes competing interests, and also by the complexity involved in creating efficient and related alignment vis-à-vis communication, goals, methods, and conceptualizations of group and individual priorities. Interdependence is also complicated by interactions between group and individual intentions, motives, and competencies. Many early organizational researchers and sociologists (e.g., Weber, 1947) regarded bureaucracy as perhaps the most effective form of organizational management, especially for large and/or complex companies, agencies, or group-based pursuits and activities. Bureaucratic organizing principles appealed perhaps most directly to notions of efficiency and rationality and the self-evident need to manage by rules
Korn Ferry’s Four Dimensional Executive Assessment • Research guide and technical manual
40 | © Korn Ferry 2015. All rights reserved.
and regulations; rules and regulations provide standards and clarity for operating procedures and facilitate consistency and standardization.
For better or worse, the realities of modern markets and organizations increasingly create conditions in which certainty and the pursuit of certainty are “enemies of truth.” Contemporary organizational design, rather, emphasizes agility and adaptability, and increasingly rewards cross-functional efforts, related synergies, and comfort with ambiguity (Worley & Larler, 2010). In a 2009 survey, 90% of executives, spanning all regions and industry sectors, ranked organizational agility and adaptability as crucial to business success and survival (Sull, 2009). Businesses and organizations are no longer built to last, but to change. Still, organizational change efforts are difficult, and can and do fail. A meta-analysis of large-scale change efforts suggests that positive outcomes occur less than 40% of the time (Porras & Robertson, 1983). In another study, researchers at the Harvard Business School tracked the impact of change efforts among the Fortune 100 and found that only 30% of the change programs initiated between 1980 and 1995 produced an improvement in bottom-line results (Pascale, Millemann, & Gioia, 1997). These findings, which are highly similar to more recent estimates (Shin, Taylor, & Seo, 2012), have implications for STRC and its status as an adaptive motivator.
Clearly, individuals who value routine, security, and order are more resistant to and disconcerted by change (Oreg, Vakola, & Armenakis, 2014). For these and other reasons, high scores on STRC-like measures are increasingly associated with decreased success, particularly among high-level business executives. High STRC managers and leaders, however, will likely continue to thrive and be preferable in certain roles and contexts, particularly those characterized by strict regulations, well-defined processes, and where the effects of not being precise, correct, and thorough are negative and relatively serious. Power. A drive for Power (POWR) involves a strong desire to influence others. Individuals driven by power enjoy being held responsible for other people and broader group results. They aspire to achieve higher status and even a prestigious title or rank. They are energized by visibility and strive to gain rewards and recognition for their efforts. Motivation for power is arguably among the most critical for leadership success. The essence of leadership itself is embodied in the act of influencing others, and a weak drive for power means a lack of interest in influence and impacting others (McClelland, 1965; McClelland & Burnham, 1976). In Winter’s (1987) study of US presidents, power motivation was significantly correlated with historian ratings of “greatness.” The same power motivation scores have also been linked to ratings of certain aspects of presidential performance, as well as charisma (House, Spangler, & Woycke, 1990). After reviewing the literature, Zaccaro (2001) cited power motivation as a key and incremental predictor of leadership charisma. However, the impact of drive for power may be moderated by a variety of job, individual, and organizational factors.
Using longitudinal data from AT&T managers, McClelland and Boyatzis (1982) found that moderate to high power motivation was related to managerial success 8 and 16 years later for non-technical managers only. No relationship was found for technical managers responsible for engineering-related duties, suggesting that the type of job moderates the size of the relationship between POWR and leadership outcomes. Using the same longitudinal dataset, Winter (1991) found that the relationship between POWR and managerial success 16 years later increased when the manager was also rated as highly responsible. The relationship between POWR and desirable outcomes also may differ depending on the culture and type of organization. For instance, the interaction between power and responsibility in predicting ratings of CEO charismatic leadership was stronger in voluntary organizations than in for-profit organizations (De Hoogh et al., 2005). High POWR is also perhaps more beneficial in hierarchical organizations than organizations that are more “flat,” egalitarian, and participative.
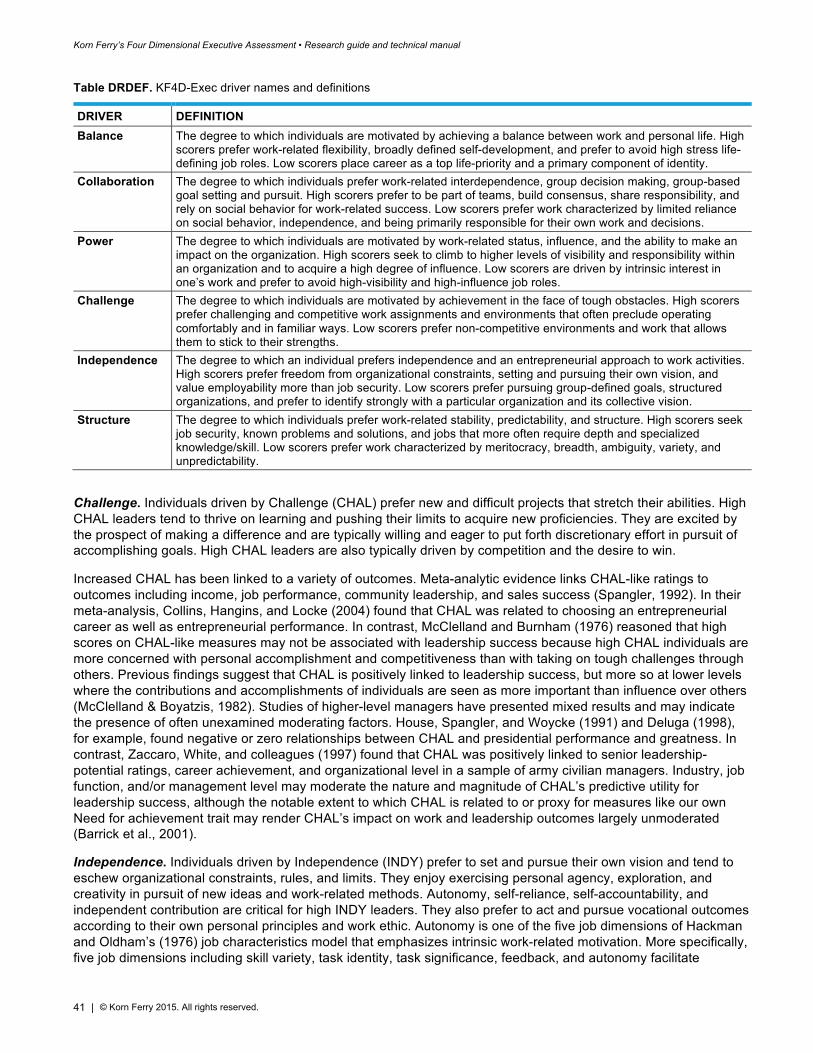
Korn Ferry’s Four Dimensional Executive Assessment • Research guide and technical manual
41 | © Korn Ferry 2015. All rights reserved.
Table DRDEF. KF4D-Exec driver names and definitions
DRIVER DEFINITION Balance The degree to which individuals are motivated by achieving a balance between work and personal life. High
scorers prefer work-related flexibility, broadly defined self-development, and prefer to avoid high stress life-defining job roles. Low scorers place career as a top life-priority and a primary component of identity.
Collaboration The degree to which individuals prefer work-related interdependence, group decision making, group-based goal setting and pursuit. High scorers prefer to be part of teams, build consensus, share responsibility, and rely on social behavior for work-related success. Low scorers prefer work characterized by limited reliance on social behavior, independence, and being primarily responsible for their own work and decisions.
Power The degree to which individuals are motivated by work-related status, influence, and the ability to make an impact on the organization. High scorers seek to climb to higher levels of visibility and responsibility within an organization and to acquire a high degree of influence. Low scorers are driven by intrinsic interest in one’s work and prefer to avoid high-visibility and high-influence job roles.
Challenge The degree to which individuals are motivated by achievement in the face of tough obstacles. High scorers prefer challenging and competitive work assignments and environments that often preclude operating comfortably and in familiar ways. Low scorers prefer non-competitive environments and work that allows them to stick to their strengths.
Independence The degree to which an individual prefers independence and an entrepreneurial approach to work activities. High scorers prefer freedom from organizational constraints, setting and pursuing their own vision, and value employability more than job security. Low scorers prefer pursuing group-defined goals, structured organizations, and prefer to identify strongly with a particular organization and its collective vision.
Structure The degree to which individuals prefer work-related stability, predictability, and structure. High scorers seek job security, known problems and solutions, and jobs that more often require depth and specialized knowledge/skill. Low scorers prefer work characterized by meritocracy, breadth, ambiguity, variety, and unpredictability.
Challenge. Individuals driven by Challenge (CHAL) prefer new and difficult projects that stretch their abilities. High CHAL leaders tend to thrive on learning and pushing their limits to acquire new proficiencies. They are excited by the prospect of making a difference and are typically willing and eager to put forth discretionary effort in pursuit of accomplishing goals. High CHAL leaders are also typically driven by competition and the desire to win.
Increased CHAL has been linked to a variety of outcomes. Meta-analytic evidence links CHAL-like ratings to outcomes including income, job performance, community leadership, and sales success (Spangler, 1992). In their meta-analysis, Collins, Hangins, and Locke (2004) found that CHAL was related to choosing an entrepreneurial career as well as entrepreneurial performance. In contrast, McClelland and Burnham (1976) reasoned that high scores on CHAL-like measures may not be associated with leadership success because high CHAL individuals are more concerned with personal accomplishment and competitiveness than with taking on tough challenges through others. Previous findings suggest that CHAL is positively linked to leadership success, but more so at lower levels where the contributions and accomplishments of individuals are seen as more important than influence over others (McClelland & Boyatzis, 1982). Studies of higher-level managers have presented mixed results and may indicate the presence of often unexamined moderating factors. House, Spangler, and Woycke (1991) and Deluga (1998), for example, found negative or zero relationships between CHAL and presidential performance and greatness. In contrast, Zaccaro, White, and colleagues (1997) found that CHAL was positively linked to senior leadership-potential ratings, career achievement, and organizational level in a sample of army civilian managers. Industry, job function, and/or management level may moderate the nature and magnitude of CHAL’s predictive utility for leadership success, although the notable extent to which CHAL is related to or proxy for measures like our own Need for achievement trait may render CHAL’s impact on work and leadership outcomes largely unmoderated (Barrick et al., 2001).
Independence. Individuals driven by Independence (INDY) prefer to set and pursue their own vision and tend to eschew organizational constraints, rules, and limits. They enjoy exercising personal agency, exploration, and creativity in pursuit of new ideas and work-related methods. Autonomy, self-reliance, self-accountability, and independent contribution are critical for high INDY leaders. They also prefer to act and pursue vocational outcomes according to their own personal principles and work ethic. Autonomy is one of the five job dimensions of Hackman and Oldham’s (1976) job characteristics model that emphasizes intrinsic work-related motivation. More specifically, five job dimensions including skill variety, task identity, task significance, feedback, and autonomy facilitate
Korn Ferry’s Four Dimensional Executive Assessment • Research guide and technical manual
42 | © Korn Ferry 2015. All rights reserved.
psychological states which result in greater internal motivation. Autonomy is most linked to a greater personal sense of responsibility for task outcomes because autonomous individuals make decisions and, hence, have more at stake. The presence of autonomy on the job has been linked to many beneficial job outcomes including job satisfaction, commitment, job involvement, job performance, and motivation to achieve (Spector, 1986). The Spector (1986) meta-analysis also found that higher autonomy on the job was linked to fewer physical symptoms, role stress, emotional distress, absenteeism, and turnover.
Although few scholars have examined the relationship between an autonomy motivation and leadership outcomes, the need for responsibility construct has been linked to career achievement among military officers (Connelly et al., 2000). A similar type of trend has been reported by Stogdill (1974) and Bass (1990a) in their detailed reviews of research on key leader attributes. In addition, some scholars have argued that higher levels of legitimized autonomy precludes worry over whether one is liked and/or accepted by others, which will likely reduce stress, anxiety, and work-avoidance for some—particularly those high INDY leaders who are not markedly affiliative or driven by collaboration (McClelland, 1965; McClelland & Burnham, 1976). These individuals are able to freely make decisions according to their own principles, which at the extreme, could serve as a detriment to their leadership abilities. The link between INDY and leadership performance is thus likely moderated by the nature of the leadership role. If there is a lack of direction, someone with high INDY could do a great job of providing a mission and vision for others based on their own ideas and principles. On the other hand, if the organization is highly collaborative or rule-oriented, a weaker INDY drive might be preferable. Individuals with strong independence drive are likely best suited to higher-level leadership positions in which they have more freedom and fewer constraints than that allowed by lower-level leadership positions. High INDY leaders will also likely fit best in more flexible and innovative cultures. In addition to autonomy-preference, creativity is another major aspect of INDY. In their meta-analysis, Lee and Xia (2006) found that organization size was positively related to the adoption of innovation, except for non-profit organizations. Department size had an even larger positive link to innovation adoption, and hence may favor high INDY leaders.
Organizational culture Culture is a defining aspect of what it means to be human. Human beings are social animals. We are wired for culture. Any group of people working or living together for a longer period of time will develop its own culture. It is the social programming of the mind that distinguishes members of one group of people from another.
The same is true for organizations. Organizations are more than just buildings, machines, inventories, or balance sheets. They are human entities. Step into any grocery store and then into some bank branch. Besides the differences in physical layout, you will also notice how staff interact with their customers differently. You instantly recognize they have distinct behavioral styles. Culture is to organizations what personality is to individuals. Organizational culture can, among other things, be perceived in the distinctive ways people behave across organizations.
Every organization has culture, whether explicit or implicit and whether desirable or undesirable. Because culture shapes and is shaped by employee behavior, it can play a big role in organizational successes or failures. The business press today is littered with references to organizational culture. An Amazon.com search for “organizational culture,” returns over 40,000 publications on this topic. In the past, management was more typically a rational and analytical enterprise. Culture and its invocation were often considered to be “too soft” or perhaps amorphous. Managers today, however, cannot ignore related issues. Successful managers will routinely consider cultural issues when deciding hiring, strategic changing, M&A, or even venture capital investing.
Origin and functionality of organizational culture KF4D-Exec is designed to facilitate taking organizational culture into account during the executive search process. Before describing Korn Ferry’s conceptualization of culture, key questions about organizational culture are considered.
Korn Ferry’s Four Dimensional Executive Assessment • Research guide and technical manual
43 | © Korn Ferry 2015. All rights reserved.
What is organizational culture? While there is common agreement that organizational culture plays a vital role in impacting and shaping behaviors in organizations, there have been various and sometimes competing definitions of organizational culture among organizational researchers and related practitioners. The following list identifies some of the common definitions:
• The way things are done around here (Kennedy & Deal, 2000).
• A collection of overt and covert rules, values, and principles that are enduring and guide org behavior (Burke & Litwin, 1992).
• Glue that holds together an organization through shared patterns of meaning (Martin & Siehl, 1983).
• Shared values and beliefs interact with an organization’s structures and control systems to produce behavioral norms (Uttal, 1983).
• A set of symbols, ceremonies, and myths that communicate the underlying values and beliefs of the organization and its employees (Ouchi, 1981).
• A pattern of shared basic assumptions that the group learned as it solved its problems of external adaptation and internal integration, that has worked well enough to be considered valid and, therefore, to be taught to new members as the correct way to perceive, think, and feel in relation to those problems (Schein, 1990).
As can perhaps be seen, scholars and practitioners target at different aspects of culture in ways that at least partially reflect their specific interests or needs. Some focus on behaviors, others more directly investigate the mechanisms that shape patterns of behavior. While a single definition of organizational culture is elusive, people generally agree that organization culture exists at different levels of abstraction. Schein (1985, 1992) concludes that there are three fundamental layers at which culture manifests itself: observable artifacts, espoused values, and basic underlying assumptions. Using an iceberg as a metaphor, artifacts are the most superficial and observable layer and are “above the water.” They include symbols, organizational languages, narratives (e.g., stories and legends), rites and ceremonies, and organizational practices. Artifacts make culture live. Culture is behavior and behavior is culture (Hammerich & Lewis, 2013). How the company communicates, how the leaders make decisions, how employees do work together—all these are more or less observable, and they reflect the culture of the organization.
Immediately below the artifacts are values. Values are general criteria, standards, or guiding principles that people use to determine which types of behaviors, events, situations, and outcomes are desirable or undesirable. Sometimes values are explicit. They are espoused and formally endorsed by the organizations. Company websites, for example often contain explicit and formal value statements. Some value statements are aspirational, describing what the companies want to achieve. Some are fashionable, because they seem to catch social favoritism at a given historical moment. When values are actually internalized by employees and manifested in their behaviors, they become enacted values.
Deep in the water of the iceberg are assumptions. They’re an implicit part of organizational culture. Assumptions are the core of culture and are difficult to change or challenge because they are deeply engrained and sometimes hard to identify. Most organizational culture theories and models recognize both the observable and less observable components of culture. At Korn Ferry, we conceptualize organizational culture as a set of shared values, beliefs, and norms that can be observed through practices, behaviors, and artifacts.
Korn Ferry’s Four Dimensional Executive Assessment • Research guide and technical manual
44 | © Korn Ferry 2015. All rights reserved.
Where does organizational culture come from? Many theories and writings emphasize the impact of organizational leaders, sometimes with particular emphasis on organizational founders. A company’s culture, particularly during its early years, is inevitably tied to the personality, background, values, and visions of its founder or founders. When founders start their businesses, “the way they want to do business” shapes and determines the organization’s rules, its structure, and its hiring decisions. Southwest Airlines provides an example. The mission of Southwest Airlines is dedication to the highest quality of customer service delivered by creative and happy employees. The company’s relaxed and friendly culture can be traced directly to its CEO and co-founder Herb Kelleher. Kelleher encourages employees to be very informal and have fun at their jobs. Kelleher fosters this type of culture by engaging in unusual acts, such as arriving at shareholder meetings on a motorcycle, wearing jeans and a t-shirt.
But culture is typically not static. It doesn’t spring up and live fully mature at the beginning. It grows and can evolve over the life cycle of an organization (Childress, 2013). Schein (1990) posited that culture is closely linked to organizational survival in two important ways, viz., external adaptation and internal integration. While there are themes and issues common across companies, each company ultimately faces unique internal and external market-based realities. The latter is typically posited to be the single greatest influence in shaping company culture (Deal & Kennedy, 2000). When the environment changes, organizations must find a way to adapt and integrate in order to learn and survive. Values and beliefs mostly come from experience and from trial and error in the business environment. Culture is largely developed and evolved through joint and collective learning via an organization’s experiences (Kotter & Heskett, 1992). All corporations follow a similar business life cycle. Each phase in the life cycle presents a specific set of business challenges. Hammerich and Lewis (2013) observed that organizational culture evolves in predictable ways as organizations transition from one phase to another.
How does culture impact performance? Organizational culture can be viewed as the behaviors and practices that become standard ways of working. Culture impacts performance by serving as an informal control system that communicates expectations. Informal control can be more effective than formal control because it is more likely to involve internalized values and impassioned behavior and action. Culture affects organizational performance in several ways. First, culture signifies how and where the organization should focus their attention. The number one function of organizational culture is external adaptation. Organizational culture embodies what it takes for the organization to succeed in the environment. If customer intimacy is critical to success, the culture will be one that increasingly encourages customer services. If cost efficiency is required, lean philosophy may be adopted throughout the organization. Effective culture increasingly aligns collective behavior to externally influenced strategic imperatives. Second, culture implies and prescribes normative behavior. Organizational success relies on coordinated efforts. When employees are clear about what is expected, fewer hours and resources are spent and potentially wasted toward understanding proper behavior and courses of action. A strong organizational culture can thus reduce coordination costs, and it is one of the competitive sources not easily emulated or copied. Third, organizational culture drives employee engagement. Culture carries aspirational elements. When employees internalize core organizational values, they tend to sense increased fit, personal ownership, and personal responsibility. These, in turn, increase engagement and dedication among general personnel and leaders.
The Venn diagram in Figure VC depicts the relationship between strategies, culture, and employees.
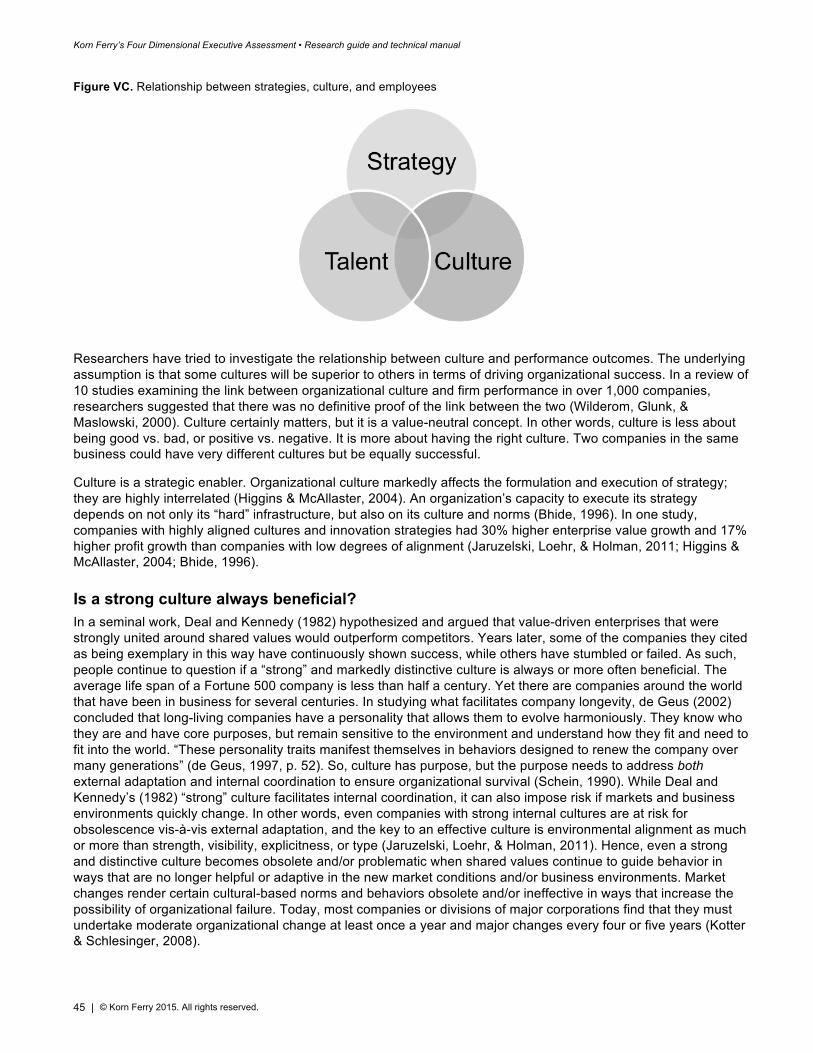
Korn Ferry’s Four Dimensional Executive Assessment • Research guide and technical manual
45 | © Korn Ferry 2015. All rights reserved.
Figure VC. Relationship between strategies, culture, and employees
Researchers have tried to investigate the relationship between culture and performance outcomes. The underlying assumption is that some cultures will be superior to others in terms of driving organizational success. In a review of 10 studies examining the link between organizational culture and firm performance in over 1,000 companies, researchers suggested that there was no definitive proof of the link between the two (Wilderom, Glunk, & Maslowski, 2000). Culture certainly matters, but it is a value-neutral concept. In other words, culture is less about being good vs. bad, or positive vs. negative. It is more about having the right culture. Two companies in the same business could have very different cultures but be equally successful.
Culture is a strategic enabler. Organizational culture markedly affects the formulation and execution of strategy; they are highly interrelated (Higgins & McAllaster, 2004). An organization’s capacity to execute its strategy depends on not only its “hard” infrastructure, but also on its culture and norms (Bhide, 1996). In one study, companies with highly aligned cultures and innovation strategies had 30% higher enterprise value growth and 17% higher profit growth than companies with low degrees of alignment (Jaruzelski, Loehr, & Holman, 2011; Higgins & McAllaster, 2004; Bhide, 1996).
Is a strong culture always beneficial? In a seminal work, Deal and Kennedy (1982) hypothesized and argued that value-driven enterprises that were strongly united around shared values would outperform competitors. Years later, some of the companies they cited as being exemplary in this way have continuously shown success, while others have stumbled or failed. As such, people continue to question if a “strong” and markedly distinctive culture is always or more often beneficial. The average life span of a Fortune 500 company is less than half a century. Yet there are companies around the world that have been in business for several centuries. In studying what facilitates company longevity, de Geus (2002) concluded that long-living companies have a personality that allows them to evolve harmoniously. They know who they are and have core purposes, but remain sensitive to the environment and understand how they fit and need to fit into the world. “These personality traits manifest themselves in behaviors designed to renew the company over many generations” (de Geus, 1997, p. 52). So, culture has purpose, but the purpose needs to address both external adaptation and internal coordination to ensure organizational survival (Schein, 1990). While Deal and Kennedy’s (1982) “strong” culture facilitates internal coordination, it can also impose risk if markets and business environments quickly change. In other words, even companies with strong internal cultures are at risk for obsolescence vis-à-vis external adaptation, and the key to an effective culture is environmental alignment as much or more than strength, visibility, explicitness, or type (Jaruzelski, Loehr, & Holman, 2011). Hence, even a strong and distinctive culture becomes obsolete and/or problematic when shared values continue to guide behavior in ways that are no longer helpful or adaptive in the new market conditions and/or business environments. Market changes render certain cultural-based norms and behaviors obsolete and/or ineffective in ways that increase the possibility of organizational failure. Today, most companies or divisions of major corporations find that they must undertake moderate organizational change at least once a year and major changes every four or five years (Kotter & Schlesinger, 2008).
Korn Ferry’s Four Dimensional Executive Assessment • Research guide and technical manual
46 | © Korn Ferry 2015. All rights reserved.
In many cases, change management does not work as intended. In a telling statistic, leading practitioners of radical corporate reengineering efforts report that success rates in Fortune 1000 companies are well below 50%; some say they are as low as 20% (Strebel, 1996). Change is threatening. It requires people abandoning old habits and adopting new behaviors. Unless something is done to reduce the threats and support the transition from the old to the new, an old and inert culture can undermine a strategic change effort. When the culture is strong, there is a strong pressure for individuals to fit in. A strong culture may impose a great barrier to change.
The well-known demise of telecommunications technology company Nortel Networks Corporation perhaps illustrates this well. Nortel was a Canadian-based technology giant that at its peak in 2000 was the ninth most valuable corporation in the world. By June 2009, however, Nortel announced that it would sell all its business units and effectively end its over 100 years of operation. Nortel’s rigid culture played, perhaps, the primary role in the company’s demise and inability to react to industry changes. Calof, Richards, and Mirabeau et al. (2014) found that the company’s history as a strong industry leader ultimately was also the source of its failure to adapt. Nortel’s strong cultural identity and even related pride created markedly problematic inflexibility in its latter days. Ultimately, the company was unable to respond to evolving and even quick-changing market needs, they ignored emerging trends, and did not accept what the market and customers wanted.
Related risks involve groupthink and its increased likelihood in strong organizational cultures. When there are very cohesive, widely shared, and strongly held organizational norms and values, it may produce groupthink, which is the desire to seek harmony and conformity among the members in a group. Strong organizational cultures can become dysfunctional when employees promote groupthink and avoid confronting or challenging organizational mindsets and norms for fear of being perceived as poor team members or outcasts. Groupthink may lead to poor decision making and excessive behavioral consistency that undermines flexibility, adaptability, and innovation (Tushman & O’Reilly, 1997). Janis (1982) believed that high cohesiveness does not always produce groupthink. If a highly cohesive organization welcomes opinions and ideas and invites alternatives, it is likely that problematic groupthink will be avoided even in a highly cohesive organization.
Enron’s culture has been cited as an example of problematic groupthink (Haasen & Shea, 2003). Groupthink at Enron was built on almost total emphasis on increasing shareholder equity and maximizing individual profit. Diversity of thought was not welcomed and perhaps not tolerated at Enron. Individuals found it hard to challenge the organization’s strategies and behavior, as the pressure was on for everyone to conform. Thus, ethics and integrity were compromised, which contributed notably to Enron’s fall.
For continuous success, companies need to align their cultures with the changing business environment. For most organizations, however, formal examination of culture tends to be among secondary considerations at best, with most management focused on formal procedures such as budget planning, structuring, and manufacturing. Most leaders realize they need to be strategically agile. They periodically revisit their strategies to ensure their competitiveness in the market. They also restructure their organizations accordingly to implement new strategies. Cultural considerations and the utility of related well-developed theoretical lenses and insights are often overlooked or disregarded (Fealy, Oshima, Sullivan, & Arian, 2012). Cultures naturally evolve and develop, but natural evolvement tends to lag behind the frequently changing business strategies and related considerations that are the focus among top management (Hammerich & Lewis, 2013). When culture is allowed to develop by default, it can and often will become misaligned with strategy and structure over time. Childress (2013) described this misalignment as “cultural drift.” Unless there is deliberate activity and decision making to reshape corporate culture, old and habitual behaviors can derail new and emerging strategic initiatives. Hence the increasingly popular business proverbs: “culture eats strategy for breakfast” (e.g., Aulet, 2014; Katzenbach & Leinwand, 2015),21 and “culture eats structure for lunch” (Serewicz, 2013).
The role of leaders Schein (1983) describes a number of mechanisms by which leaders and founders impact organizational culture. These include things like written philosophies or creeds, socialization materials, designs of physical places, deliberate role modeling, reward systems, and via stories/legends about important individuals and benchmark occurrences in the organizational history. Culture may also be shaped and communicated by leaders via what they
21 This statement is originally attributable to Peter Drucker.
Korn Ferry’s Four Dimensional Executive Assessment • Research guide and technical manual
47 | © Korn Ferry 2015. All rights reserved.
attend to and measure, how they react to crises, how they communicate the role of hierarchy in the organization, how they share information, and by the criteria they use and support in making people decisions. These mechanisms can be explicit and implicit, and may depend largely on the personality, skills, experiences, and motivations of the leader. A leader’s personality and values impact what a follower observes as being important and reinforced, which, in turn, helps followers understand the culture (Barrick & Mount, 2005; Parks & Guay, 2009). The mechanisms can loosely be clustered into communication, behavior modeling, and the introduction of new decisions, procedures, and behaviors/actions.
A leader’s ability to communicate their ideas, vision, and values to the entire organization likely determines how strong and pervasive an organization’s cultural identity will be. Values can be espoused values that individuals are supposed to hold but do not necessarily internalize. Values can otherwise be enacted values, which individuals do internalize, act upon, and/or use as cognitive filters in ways that are more than perfunctory. Leaders who impact culture most are effective communicators who are able to both pass along their vision (espoused values) and lead managers and employees to internalize them (enacted values). Research shows that leaders who are more honest, provide a consistent message, and share more information with others tend to foster stronger cultural identity throughout an organization (Gonzalez-Roma, Peiro, & Tordera, 2002; Zohar & Luria, 2004). Transformational leaders tend to be relatively charismatic and effective at fostering self-determined buy-in among organizational members and are, thus, typically more effective at creating a strong cultural message and related cohesion (Bass, 1990b; Burke et al., 2006; Shamir, House, & Arthur, 1993). They also tend to be more autonomy-granting and have higher expectations, which also have been linked to increased performance and “cultural assimilation” among subordinates and organizational members (e.g., Berlew & Hall, 1966; Stedry & Kay, 1966). Leaders who effectively communicate vision and related implementation plans have colleagues and subordinates who more effectively set goals, have higher self-efficacy, and generally perform better (Kirkpatrick & Locke, 1996). Culture can also be communicated through behaviors that leaders demonstrate to their followers. House (1977) suggested that those who are perceived as more nurturing, successful, and competent are more likely to be viewed as behavioral role models to others. Leaders may not only be seen as role models, but can and do shape organizational members’ internalized values, emotional responses, and attitudes to their role models (Bandura, 1969), and this kind of influence is among the foundational notions of what transformational leaders ultimately accomplish.
The psychological tendencies, social behavior, and leadership styles of few or even a single senior leader can have considerable impact on organizational cultures. Organizational members attend to and process how leaders deal with crises, what types of decisions they make, and what kinds of behavior they reinforce with rewards and recognition (Bass & Avolio, 1993). Change-oriented visionary leaders foster cultures where members care about organizational vision and are more emotionally invested in their work. Leaders focused on efficiency, stability, and process improvement emphasize more formal controls, agreements, and rewards, which can have characteristic, predictable, desirable and/or undesirable effects on culture as well (Bass & Avolio, 1993). Increased locus of control among senior leaders is associated with organizational strategies and membership that value risk and innovation at relatively high levels (Miller, Kets De Vries, & Toulouse, 1982). O’Reilly, Caldwell, Chatman, and Doerr (2014) found evidence for several relationships between CEO personalities and culture types, including that CEO personalities and motivational profiles affect organizational culture in ways that have demonstrable implications for financial performance, revenue growth, Tobin’s Q, and analysts’ stock recommendations. O’Reilly et al. (2014) demonstrate that flexible and explorative CEOs foster more adaptive cultures. Extraverted and people-oriented CEOs foster results-oriented cultures, while CEO Neuroticism and Agreeableness are negatively associated with results orientation. Conscientious CEOs foster cultures that value and emphasize detail orientation. Other empirical studies demonstrate similar relationships and have additional potential implications for person-environment fit. Berson, Oreg, and Dvir (2008) and Berg, Oreg, and Dvir (2007) also find close links between CEO values, organizational cultures, and organizational outcomes. CEOs who value security and certainty, for example, have more bureaucratic organizations, while CEOS valuing benevolence and cohesion have organizations with more supportive and people-oriented cultures. Lewin and Stephens (1994) proposed a number of additional hypotheses regarding the link between leader traits—such as need for achievement/power, egalitarianism, risk propensity, and moral reasoning—and strategic action.
Not only do leaders influence culture, but the culture can also impact how a leader leads (Bass & Avolio, 1993). For instance, a leader may struggle to transform an organization to be more innovative and risk embracing if the existing culture is more cautious and compliant. In order for leaders to be successful in managing culture, they
Korn Ferry’s Four Dimensional Executive Assessment • Research guide and technical manual
48 | © Korn Ferry 2015. All rights reserved.
must be able to change their leadership styles quickly or exhibit different styles simultaneously to keep up with major cultural changes (Cameron & Quinn, 2006). If a leader wants to steer the organization’s culture toward more of the clan culture type, they must open up the lines of communication, including listening to the needs of employees (Cameron & Quinn, 2006, p. 88). The leader must demonstrate sincerity and concern for employees, while promoting teamwork and self-management (Cameron & Quinn, 2006). Existing cultures and organizational demographics dictate the amount of latitude a leader has in changing the culture. Leaders may be better able to make major changes when the external environment is more favorable (e.g., economic growth [Cyret & March, 1963]), when there is greater competition in the industry, and when leaders are earlier in their tenures and are more readily accepted and viewed as change agents (Lewin & Stephens, 1994).
Assessing organizational culture in executive search We adopt the competing values framework (CVF) (Quinn & Rohrbaugh, 1985) to assess and think critically about organizational culture. The framework identifies four organizational culture types that are derived from two main dimensions. Each dimension describes two sets of competing values. The first dimension reflects the competing demands of change and stability. One end of the dimension represents an emphasis on flexibility and discretion, whereas the other represents a focus on stability, control, and order. The other dimension reflects the conflicting demands created by the internal organization and the external environment. In responding to the conflicting demand, an organization could be internal focused or external oriented. The four types are clan culture, adhocracy culture, market culture, and hierarchy culture. The CVF has been administered widely in organizations (Cameron et al., 2014) and researched extensively (Hartnell, Ou, & Kinicki, 2011). Empirical studies have repeatedly supported the construct validity of the competing value framework (Howard, 1998; Kalliath, Bluedorn, & Gillespie, 1999). For example, using structural equation modeling, Kalliath and colleagues (1999) found support for the four-factor structure of CVF. We describe each culture type below and, in our KF4D-Exec assessment, refer to the four Cameron & Quinn (2011) culture types as Collaborative, Innovative, Competitive, and Regulatory, respectively.
Collaborative. Collaborative organizations tend toward a long-term focus on building and maintaining cohesion, community, belonging, and empowerment among members. They are people oriented and emphasize continuous development and training, particularly among internal members and stakeholders. In Collaborative cultures, the quality, morale, and commitment of human capital are most often seen as key indicators of success, as is the general sustainability of the organization. Collaborative cultures are found in all industries and markets, but often include organizations where members work toward some known social cause, shared mission, or ideal. Collaborative organizations tend to have leaders who are more likely to be characterized as facilitators, mentors, and/or community builders than bosses or supervisors.
Innovative. Innovative organizations focus on change, expansion, creating the new and different, and market disruption. They are often market oriented, with an emphasis on being first to market, and/or introducing novel products or ideas in ways that create growth, competitive differentiation, and advantage. They often embrace experimentation and risk, and allow individuals and business units reasonable latitude for failure in pursuit of innovation. Leaders within Innovative cultures are often seen as markedly versatile, tolerant of ambiguity, and adaptable. High achievers and typical leaders are likely to be described as imaginative, creative, entrepreneurial, artistic, and/or visionary.
Competitive. Competitive organizations tend toward long- and short-term focus on profitability and earnings. They are customer and market oriented and emphasize goal setting, goal achievement, and driving for results. Success within Competitive cultures is most often defined in terms of profits, contract acquisition, sales, revenue, growth, and/or market share. They are often seen as meritocracies, and their leaders are likely to be characterized as those who work harder, drive for results, and skillfully motivate individuals and groups within the organization to do the same in pursuit of productivity, getting the job done, and focusing on the bottom line.
Regulatory. Regulatory organizations are characterized by the need for accountability, efficiency, and adhering to standards. They tend to be improvement and stability oriented, with an emphasis on creating efficient and reliable systems and processes. High-performance individuals are typically characterized as having cut operation costs, minimized mistakes, improved efficiency, and paid close attention to related details. Regulatory organizations also tend to have leaders whose rank is more clearly defined, and whose backgrounds and roles are characterized by deep knowledge and specialization that will facilitate monitoring, ensuring continuity, maximizing productivity, increasing quality, and maintaining compliance with policy and regulation.
Korn Ferry’s Four Dimensional Executive Assessment • Research guide and technical manual
49 | © Korn Ferry 2015. All rights reserved.
Cultural features are not mutually exclusive. While it is not unusual for organizations to have a dominant culture, we emphasize that the four types are not mutually exclusive and—even when evaluated comprehensively—are not typically measured in a way that forces, seeks, or expects exclusivity (Heritage, Pollock, & Roberts, 2014). While the four cultural types are built on the competing cultural dimensions, they can and do coexist in single organizations. No organization’s culture is characterized by one pure culture type; rather, most organizations have attributes of more than one type. In fact, many organizations may try to strike a balance through simultaneously emphasizing the collaborative culture along with the competitive culture, or the regulatory culture along with the innovative culture, for example. This is supported by a recent meta-analytic research (Hartnell, Ou, & Kinicki, 2011). Results based on data from 84 empirical studies did not show negative relationships among the four culture types. The researchers suggested that organizational cultures included unique aspects from multiple culture types.
Prevailing business challenges often play a large role in determining the types of culture organizations adopt, de facto or de jure. Whether an organization has a strong dominant culture or a balanced cultural profile depends, in part, on business needs and the strategies chosen to meet them. Consider, for example, two potentially contrasting types—regulatory and innovative. A company that does manufacturing outsourcing for other companies may compete on the scale of economy. Coordination, standard processes, and control are highly influential in determining the company’s success. In this case, a strong regulatory culture is likely to be dominant. In another company that considers product differentiation as the key to its success, the culture likely will emphasize flexibility, creativity, and innovation. Management scholars have described the differences between organic and mechanistic organizations. A regulatory culture characterizes the mechanistic organization, whereas the innovative culture tends to portray the organic organization. While early management theories proposed the inherent trade-offs or incompatibility between these two types of organizations and others (e.g., Thompson, 1967), more recent research suggests that they can and do coexist across time or simultaneously. The term “organizational ambidexterity” reflects this kind of thinking (March, 1991) and refers to an organization’s ability to be efficient in its management of prevailing business demands while being adaptive to changes in the environment at the same time. Effective ambidexterity is achieved by balancing exploration that allows the organization to be creative and adaptable and exploitation where the organization relies on more traditional, proven methods of production and doing business (Tushman & O’Reilly, 2002). As such, organizations and/or units within organizations may have cultures that are more appropriately described as hybrid types. Organizations or units may be Regulatory Innovative, Collaborative Competitive, or Regulatory Collaborative, among others.
O’Reilly and Tushman (2013) identified and discussed three types of organizational ambidexterity. The first one is sequential ambidexterity and involves, for example, situations where an organization temporarily creates an organic and innovative environment when the exploration of new ideas is needed, and then switches to the mechanistic and regulatory environment when executional efficiency is desirable. Laplume and Dass (2012) described the evolution of a company over a 65-year period and suggested that during the first 25 years the firm emphasized sequential ambidexterity.
The second is simultaneous ambidexterity and refers to simultaneous pursuit of both exploration and exploitation. Organizations create separate business units or functions to deal with different business issues. Sub-cultures may form to reflect the common problems, goals, and/or experiences that members of a unit share. For instance, the manufacturing department of a large organization may thrive and operate according to regulatory conceptualization of culture, whereas the research and development department may be characterized as an innovative culture. Sub-cultures are more likely to develop in large and mature organizations that encompass a variety of functions and technologies. Reported conditions at the Otsuka Pharmaceutical Company provide an example of simultaneous ambidexterity. To spark innovation, Tatsuo Higuchi, president of Otsuka, emphasized the need for experimentation and out-of-the-box thinking, saying its research laboratories “put a high value on weird people” (Landers, 2003). In Otsuka units that manufacture pharmaceuticals, however, routine and precision are of primary importance, and the company prefers to have high detail orientation personnel that emphasize safety and process while rewarding and valuing personnel who are comfortable following explicit rules and standard procedures. NASA may also conform to a company whose culture is simultaneously and/or sequentially regulatory and innovative in different ways (e.g., Coggins, 2013; Greenberg & Baron, 2010).
The third approach is contextual ambidexterity. Gibson and Birkinshaw (2004) argued that organizations could be ambidextrous by designing features of the organization to permit individuals to decide how to divide their time between exploratory and exploitative activities. The environment enables and encourages individuals to make their
Korn Ferry’s Four Dimensional Executive Assessment • Research guide and technical manual
50 | © Korn Ferry 2015. All rights reserved.
own judgments about how to divide their time between the conflicting demands for alignment and adaptability. At Toyota, for example, workers perform routine tasks like automobile assembly, but are also expected to continuously change their jobs to become more efficient (Adler et al., 1999). Similarly, 3M has been known for more than 60 years to allow and encourage employees to use 15% of their paid time to pursue their own ideas.
These three forms of ambidexterity underscore the complexity of assessing and understanding organizational culture. At Korn Ferry, we do offer comprehensive solutions by which we can measure, explicate, give recommendations, and facilitate change vis-à-vis company culture. Within the context of executive search, however, we take a different approach. Our cultural assessment for the typical executive search engagement is relatively brief, administered only to client representatives close to a specific search engagement, and involves a simple rank-order of the definitions of each culture type described above. It is designed to structure and facilitate discussion with clients, enabling a dialogue that uncovers nuances, challenges, and goals related to organizational culture. The brief assessment helps structure the information-gathering process and offers descriptive utility that can be leveraged when making recommendations about candidates. This utility is enhanced by the empirical findings described later in this manual about the relationships among culture and the Korn Ferry dimensions of leadership. These results have demonstrable implications for person-environment fit, which can inform candidate recommendations.
The benefits of assessing organizational culture in executive search Are leaders transportable? In other words, will a successful executive in one company also be successful in another? The cross-organization and even cross-industry success of some high-profile executives would suggest that leaders are transportable in a non-trivial number of cases (Karaevli & Zajac, 2012). On the other hand, empirical research suggests that cross-institutional moves are complex and that, among other things, organizational culture and culture fit may play a notable role in determining whether new leaders will be successful (Grosysberg, McLean, & Nohria, 2006). Organizational cultures and/or within-organization business-unit cultures have potential to impact the extent to which leaders’ motives and values are congruent and adaptive for success. Related theories emphasize that people tend to seek out and excel in environments that are compatible with their interests and that allow them to implement and invest their own skills, values, and inclinations as strengths (Holland, 1959; Saks & Ashforth, 1997). Individuals who value rules and norms as a primary organizing principle are attracted to regulatory organizations that emphasize norms, assimilation, standard processes, and efficiency. Those who primarily value collective well-being are attracted to collaborative organizations. Individuals who primarily value self-determined vision and purpose are attracted to competitive and innovative organizations, as are those who emphasize winning and competition (Gardner, Reithel, Cogliser, Walumbwa, & Foley 2012). In general, individuals are more attracted to vocations, career choices, and roles consistent with their personalities and values because they often contain inherent and self-sustaining goal and reward structures (Holland, 1973). And, as we have discussed, person-organization fit is perhaps increasingly vital at the executive level and among high-level leaders due to their potential to have large and direct impact on organizational cultures (O’Reilly et al., 2014; Berson, Oreg, & Dvir, 2008). Hence, one of the benefits of utilizing organizational culture in executive search is, at minimum, to invoke discussion of person-environment fit and offer empirically supported insight.
Culture and organizational fit can be conceptualized in different ways. Leaders, for example, may fit with a current culture, or they may facilitate the development of an ideal culture. Our research-based point of view is that finding the right person for a given role can be approached in increasingly informed ways and, among other things, a value-added systematic process involves simultaneous analysis of the role, the organizational culture or ideal culture, and candidate skills, values, and traits (Eaton, 2015). Later in this technical manual, we discuss in more detail upper-level managerial role variability and how the nature of jobs and contexts can moderate the desirability of scores or score profiles on KF4D-Exec and KF4D-like measures. Organizational culture and/or within-organization business-unit cultures should be and are among related considerations because they impact the extent to which leaders’ trait and motivational profiles are desirable and adaptive. The literature in organizational psychology has a long tradition in this area, which is variously referred to as the person-job and, perhaps most specifically in terms of culture, the person-environment fit literature (Lewin, 1951; Ahmad, 2010). Among the many assumptions inherent to the related literature is that job environments interact with person-level traits, motives, attitudes, and skills to impact or facilitate a variety of environmental and/or person-level outcomes, including job success, job performance, self and third-party satisfaction, optimism, self-efficacy, psychological well-being, quality of life, and various conceptualizations of fit (Edwards, 1991; Kristof, 1996; Spokane, Meir, & Catalano, 2000;
Korn Ferry’s Four Dimensional Executive Assessment • Research guide and technical manual
51 | © Korn Ferry 2015. All rights reserved.
Verquer, Beehr, & Wagner, 2003; Greene-Shortridge, 2008). Early and ongoing person-environment fit research (e.g., Caplan, 1987; Kristof-Brown & Guay, 2011) emphasizes that person values and needs interact with environmental supply to create person-environment harmony and, ultimately, person-environment fit. As such, we emphasize our drivers as the closest analog to values and needs and examine them as key variables of interest when handling culture in empirical models. We do assert, however, that traits and skills can and do add value to related considerations as well.
Most executive and high-level managerial roles are challenging and have relatively high accountability and high expectations. As such, we expect and design our Challenge driver to be positively related to important outcomes across contexts and cultures and to be moderated by cultures or role variables in ways that rarely (if ever) preclude the positive predictive magnitude of Challenge. Similarly, given the proliferation of research-based assertions that management and leadership are inherently collaborative endeavors (e.g., Stodd, 2014), we expect that the Collaboration driver is typically found at higher levels among higher-level leaders and that, in most or all cases, it is positively predictive of leadership outcomes and fit. Nonetheless, cultures that emphasize collaboration and/or notably conform to Cameron & Quinn’s (2006) related culture type are probably more likely to have leaders and personnel who are driven by Collaboration. Given that individuals who value and are driven by Collaboration are more likely to encounter circumstances that reward collaborative preference and related efforts, we also expect leaders driven by Collaboration to find more success in collaborative cultures or companies who want to increasingly promote a collaborative culture. In similar ways, the Structure driver is likely to proliferate and be increasingly rewarded in Regulatory cultures or companies that seek to develop a culture with strong regulatory features. The Independence driver is likely to do the same in Innovative cultures or companies that seek to develop increasingly innovative cultural features. These and related context-based hypotheses are discussed and examined in more detail later in this technical manual.
52 | © Korn Ferry 2015. All rights reserved.
Section 3 Measurement methods
Korn Ferry’s Four Dimensional Executive Assessment • Research guide and technical manual
53 | © Korn Ferry 2015. All rights reserved.
Datasets and measurement In forthcoming sections, we begin to test hypotheses and describe empirical results and findings related to KF4D-Exec measures, how they impact and correlate with outcomes and work-analysis variables, and how related relationships are moderated in expected and intuitive ways. Before we do, however, we first turn our attention to describing the various and primary samples that were secured and analyzed in pursuit of construct and criterion-related validity. Then, before moving on to correlational and empirical findings, we first explicate our measurement models for each of the traits, competencies, and drivers which we have described in previous sections.
Traits measurement calibration sample To calibrate our measurement models for traits, we secured demographics, work-related variables, and trait item responses from 2,022 managerial professionals in 2013 using online survey distributor Qualtrics (www.Qualtrics.com). We refer to this as Sample 1. Participants were secured by Qualtrics and were US-based managerial professionals who were full-time employees of companies with greater than $1 billion revenue and a combined family income exceeding $100,000. Participants were male (60.53%) or female (39.47%), and reported ethnic backgrounds including African American (3.56%), Asian, (5.16%), Hispanic (3.81%), Native American (<1%), Pacific Islander (<1%), White (85.17%), or Other (1.45%). Participants’ self-reported forced-choice managerial levels included managers of supervisors/directors (20.77%), vice presidents (17.36%), business unit leader/senior vice presidents/C-level executives (13.85%), and CEOs (12.51%). Participants also reported the scope of their responsibility from among ordered categorical managerial scope levels including none/individual contributor (11.82%), project team (13.80%), one department or function (28.29%), one business unit or subsidiary (12.56%), multiple business units (14.89%), or the entire firm/organization (18.64%). Respondents reported total annual income by choosing from among 13 ordered categorical levels ranging from > $20,000 to ≥ $150,000. About a third (36.55%) of respondents had total annual income ≥ $150,000.
Traits and drivers correlational analyses sample, drivers measurement calibration sample Throughout this technical manual, we make repeated reference to respondent background variables, work-related and work-analysis variables, work engagement, organizational commitment, and related correlational analyses vis-à-vis norm-referenced standardized scores for traits and drivers. The same dataset also served to calibrate measurement models for drivers. We refer to this as Sample 2. Participants included 2,001 managerial professionals whose data were secured again by Qualtrics in 2014, and were US-based full-time managerial professionals employed in companies having greater than $1 billion revenue. All participants had a combined family annual income exceeding $100,000. Participants were male (70.01%) or female (29.99%), and reported ethnic backgrounds including African American (2.15%), Asian, (4.95%), Hispanic (2.35%), Native American (0.25%), Pacific Islander (0.25%), White (88.45%), or Other (1.05%), while some declined to indicate (0.55%). Participants’ self-reported forced-choice managerial levels included managers of supervisors/directors (42.63%), vice presidents (41.88%), business unit leader/senior vice presidents/C-level executives (13.34%), and CEOs (2.15%). Participants also reported the scope of their responsibility from among ordered categorical managerial scope levels including none/individual contributor (1.40%), project team (7.05%), one department or function (43.23%), one business unit or subsidiary (22.84%), multiple business units (17.74%), or the entire firm/organization (7.75%). Respondents reported total annual income by choosing from among 13 ordered categorical levels ranging from > $20,000 to ≥ $150,000. The majority (57.28%) of respondents had total annual income ≥ $150,000.
In brief, data from these two samples were used to derive IRT parameters and generate scores on traits and drivers. Specifically, trait scores for the “traits and drivers” sample were computed using Item Response Theory (IRT) threshold and discrimination parameters estimated from the previously described traits measurement calibrations sample. The drivers IRT scores were computed using IRT parameters from Sample 2. C-level IRT score means and management-level referenced pooled standard deviations served as parameters for creating the z-scores (M = 0, SD = 1) and percentiles reported throughout this technical manual. Given the purpose of KF4D-Exec, C-level executives are the appropriate normative group and provide a meaningful “mid-point” for interpreting assessment results. Work-analysis variables and related statistics are discussed and explicated later in this technical manual.
Korn Ferry’s Four Dimensional Executive Assessment • Research guide and technical manual
54 | © Korn Ferry 2015. All rights reserved.
Competencies measurement calibration and correlational analyses sample Measurement models and correlational analyses for competencies were based on a single sample of 1,001 respondents who reported demographics, work-related variables, and competency forced-choice item responses, as well as trait and driver item responses.22 This sample overlaps with Sample 2 described in the immediately previous section and was approximately 50% of it; only half of that sample were administered the competencies measure. We refer to this as Sample 3. Participants, again, were secured in 2014 by Qualtrics, and included US-based managerial professionals who were full-time employees of companies with greater than $1 billion revenue and a combined family income exceeding $100,000. Participants were male (70.03%) or female (29.97%), and reported ethnic backgrounds including African American (2.30%), Asian, (5.29%), Hispanic (2.60%), Native American (0.40%), Pacific Islander (0.30%), White (88.01%), or Other (1.10%), while some declined to indicate (0.60%). Participants’ self-reported forced-choice managerial levels included directors or managers of supervisors (41.56%), vice presidents (42.56%), business unit leader/senior vice presidents/C-level executives (13.69%), and CEOs (2.20%). Participants also reported the scope of their responsibility from among ordered categorical managerial scope levels including none/individual contributor (0.80%), project team (6.39%), one department or function (40.66%), one business unit or subsidiary (24.18%), multiple business units (19.28%), or the entire firm/organization (8.69%). Respondents reported total annual income by choosing from among 13 ordered categorical levels ranging from > $20,000 to ≥ $150,000. The majority (57.96%) of respondents had total annual income ≥ $150,000. Standardized scores were based on raw competency IRT scores. C-level IRT score means and management-level referenced pooled standard deviations served as parameters for creating the z-scores (M = 0, SD = 1) and percentiles reported throughout this technical manual.
Measurement models
Addressing the problem of faking Psychometricians are increasingly concerned with known response distortions associated with prevailing Likert-style response formats in psychological measurement (Stark et al., 2001). As evidence of the validity of personality assessments for predicting job performance has accumulated, their use has increased, spurring applicant interest in gaining an advantage on them. The growing availability of self-coaching materials and use of unproctored internet-based tests has further contributed to the potential for faking to be increasingly problematic (Sliter & Christiansen, 2012).
Psychological measurement professionals, where applicable, have long developed and employed social desirability and/or “faking scales” in order to detect faking and deal with related problems. When detecting faking in this way, however, it is difficult to know how to proceed. In many cases and research settings, a completed assessment may simply be thrown out. In applied settings, coaches and decision makers faced with using assessment results may simply be warned that the results are perhaps untrustworthy and to proceed with caution. Yet others have attempted to use results from faking detection or social desirability scales to adjust observed scores in diverse ways (Goffin & Christiansen, 2003). Such methods, however, have been repeatedly criticized as being arbitrary and difficult to validate (McCrae & Costa, 1983; Goffin & Christiansen, 2003).
Ipsative response formats also have been developed and employed to combat faking. These formats force respondents to make difficult choices between items and endorsement magnitudes. They do not allow for extreme high or extreme low endorsement of every item and, as such, have been variously developed and employed to combat faking (Sackett & Lievins, 2008). In addition to combating faking, ipsative measurement can markedly reduce response bias, “halo” or leniency effects, and response variance attributable to individual response styles not immediately associated with item content (Bartram, 2007; Cheung & Chan, 2002). For example, on a Likert-type scale, some respondents are just more likely to use the extreme anchors and, consequently, more “strongly agree” or “strongly disagree” with things that they would otherwise endorse (or not endorse) more moderately. Scale scores based on Likert-type items are likely to contain related variance in addition to construct true-score variance. Although ipsative response formats offer a means to address faking and response bias problems, when used in combination with pervasive classical scoring methods, traditional forced choice response formats always 22 As such, we later refer to this as the “full sample,” because all respondents in this case have competency, trait, and driver scores, as well as full background variables and work-analysis variables. See Tables LPA4D, CGFAN, CAVG, and related Figures, for example.
Korn Ferry’s Four Dimensional Executive Assessment • Research guide and technical manual
55 | © Korn Ferry 2015. All rights reserved.
produce scale scores that are problematically auto-correlated and interdependent (Brown & Maydeu-Olivares, 2011). In other words, ipsative response data scored with traditional and pervasive methods ensure that estimated person-scores on particular constructs are, in very large part, a direct and artificial reflection of person-scores on the other constructs contained in forced-choice response dichotomies or multi-item blocks (Heggestad, Morrison, Reeve, & McCoy, 2006). This dependency makes normative comparisons across individuals difficult and violates the assumptions of many commonly used statistics.
Forced-choice IRT models For decades, researchers in psychological measurement have sought to tackle related problems associated with ipsative measures. Stark, Chernyshenko, and Drasgow (2005) developed a pairwise preference ideal point model that addresses most related problems by pairing and presenting items with similar levels of social desirability and by employing scoring and parameter estimation methods that are shown to perform well under certain conditions vis-à-vis eliminating ipsative auto-correlation. To obtain person-scores with markedly high relative efficiency, Stark & Chernyshenko (2007) point out that number of pairwise preference ratings to obtain reasonable person-score standard errors may be particularly high in non-adaptive testing situations. Hence, the Stark et al. (2005) pairwise preference model works best and is markedly more efficient with computer assisted adaptive testing administration, wherein item presentation is customized according to real-time response patterns, both in terms of item/block presentation and the number of items/blocks presented prior to estimating final construct score estimates. Where fixed form administration is optimal or necessary, test administration and reliability using the Stark et al. (2005) model may require many more items than desirable and may generally limit its (perceived) feasibility. Also, Brown and Maydeu-Olivares (2010) point out limitations associated with the model’s reliance on an ideal point measurement framework. These limitations include the relative difficulty of writing items, the lack of invariance in parameter estimates and model fit when reversing item coding, and the apparent reduced accuracy of item parameter estimation (Maydeu-Olivares, Hernandez, & McDonald, 2006).
As an alternative, Brown & Maydeu-Olivares (2011) developed a structured multidimensional forced-choice IRT model that addresses problems associated with faking, response bias, and ipsativity while also addressing some of the limitations of the paired preference Stark et al. (2005) model. The authors describe a linear model that is linear in differences between latent traits. The latent states are directly manifest by binary comparisons of items that are otherwise presented in ipsative/forced-choice blocks. The model rearranges forced-choice responses into a series of exhaustive binary comparisons, thereby allowing for components of non-ipsative trait measures to drive parameter estimation, scoring, and interpretation of person-scores. The model is novel in that it creates a relative independence among otherwise predictably auto-correlated forced-choice based construct scores. It is flexible in terms of forced-choice block sizes and is feasible in that parameters and scores can be estimated using existing popular statistical software packages, including Mplus (Muthen & Muthen, 2010). We also have developed a related R package (Zes, 2015; Zes, Lewis, & Landis, 2014) that similarly estimates the Brown & Maydeu-Olivares (2011) model and related extensions of it.
KF4D-Exec IRT model Our measures of traits, drivers, and competencies are all administered in forced-choice response format in order to decrease potential problems associated with faking and response bias. Each construct type is grouped together in its own test form. Traits are measured with traits, drivers with drivers, and competencies with competencies. Construct scores are estimated using a modification (Zes, 2015; Zes et al., 2014) of the Brown & Maydeu-Olivares (2011) Forced-Choice Item Response Theory (FCIRT) model to arrive at construct estimates whose correlations are based on the nature of the constructs and not according to forced-choice item response format artifacts.23 Eight items were designed to tap each trait, and trait response blocks contain four items each. Each competency and each driver are measured using ten items, and response blocks for these domains contain seven and six items each, respectively. An example of a forced-choice multi-item block from the drivers test form is shown in Table FC1. This example illustrates that each response block is comprised of items measuring multiple scales within the
23 In early developmental efforts, we administered and scored forced-choice based trait scales and Likert-based trait scales of the same items and constructs to the same individuals and found, much as Brown & Maydeu-Olivares (2011) did, that alternate-form correlations between the same constructs typically had magnitudes consistent with most conceptualizations of alternate test form construct convergence (e.g., r > .70 in every case). The correlation matrix is shown in the appendix in Table TCORR-IRTL.
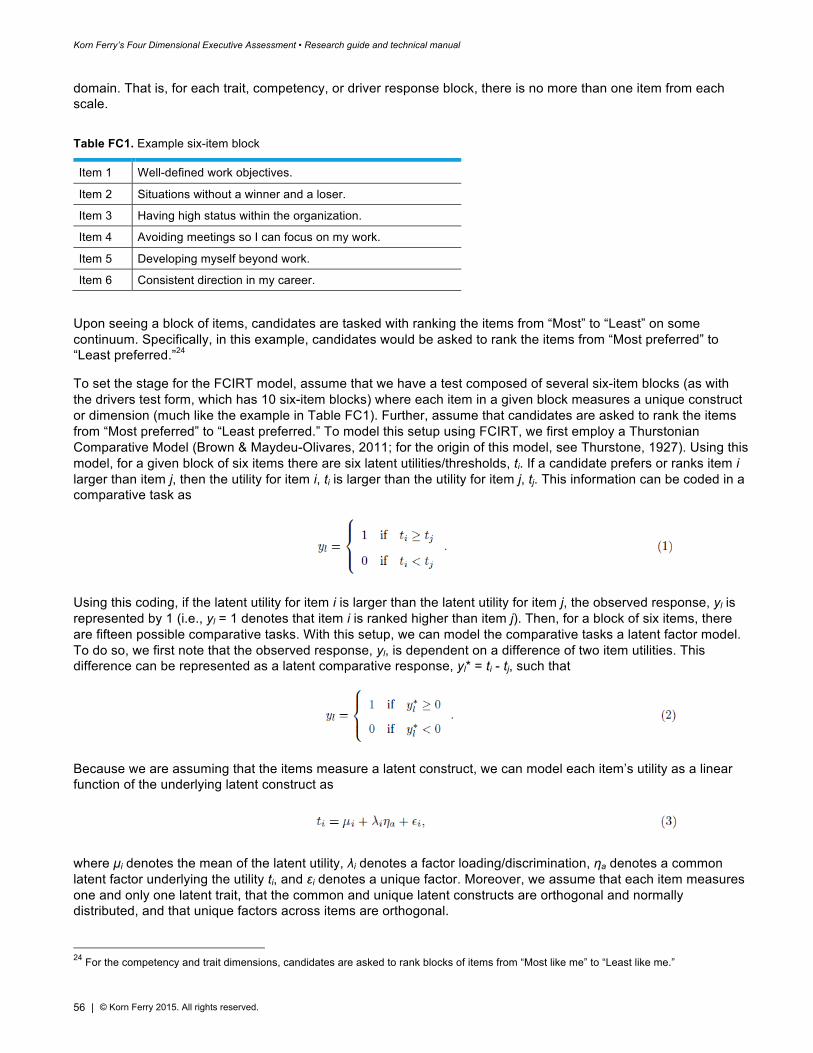
Korn Ferry’s Four Dimensional Executive Assessment • Research guide and technical manual
56 | © Korn Ferry 2015. All rights reserved.
domain. That is, for each trait, competency, or driver response block, there is no more than one item from each scale.
Table FC1. Example six-item block
Item 1 Well-defined work objectives.
Item 2 Situations without a winner and a loser.
Item 3 Having high status within the organization.
Item 4 Avoiding meetings so I can focus on my work.
Item 5 Developing myself beyond work.
Item 6 Consistent direction in my career.
Upon seeing a block of items, candidates are tasked with ranking the items from “Most” to “Least” on some continuum. Specifically, in this example, candidates would be asked to rank the items from “Most preferred” to “Least preferred.”24
To set the stage for the FCIRT model, assume that we have a test composed of several six-item blocks (as with the drivers test form, which has 10 six-item blocks) where each item in a given block measures a unique construct or dimension (much like the example in Table FC1). Further, assume that candidates are asked to rank the items from “Most preferred” to “Least preferred.” To model this setup using FCIRT, we first employ a Thurstonian Comparative Model (Brown & Maydeu-Olivares, 2011; for the origin of this model, see Thurstone, 1927). Using this model, for a given block of six items there are six latent utilities/thresholds, ti. If a candidate prefers or ranks item i larger than item j, then the utility for item i, ti is larger than the utility for item j, tj. This information can be coded in a comparative task as
Using this coding, if the latent utility for item i is larger than the latent utility for item j, the observed response, yl is represented by 1 (i.e., yl = 1 denotes that item i is ranked higher than item j). Then, for a block of six items, there are fifteen possible comparative tasks. With this setup, we can model the comparative tasks a latent factor model. To do so, we first note that the observed response, yl, is dependent on a difference of two item utilities. This difference can be represented as a latent comparative response, yl* = ti - tj, such that
Because we are assuming that the items measure a latent construct, we can model each item’s utility as a linear function of the underlying latent construct as
where µi denotes the mean of the latent utility, λi denotes a factor loading/discrimination, ηa denotes a common latent factor underlying the utility ti, and εi denotes a unique factor. Moreover, we assume that each item measures one and only one latent trait, that the common and unique latent constructs are orthogonal and normally distributed, and that unique factors across items are orthogonal.
24 For the competency and trait dimensions, candidates are asked to rank blocks of items from “Most like me” to “Least like me.”
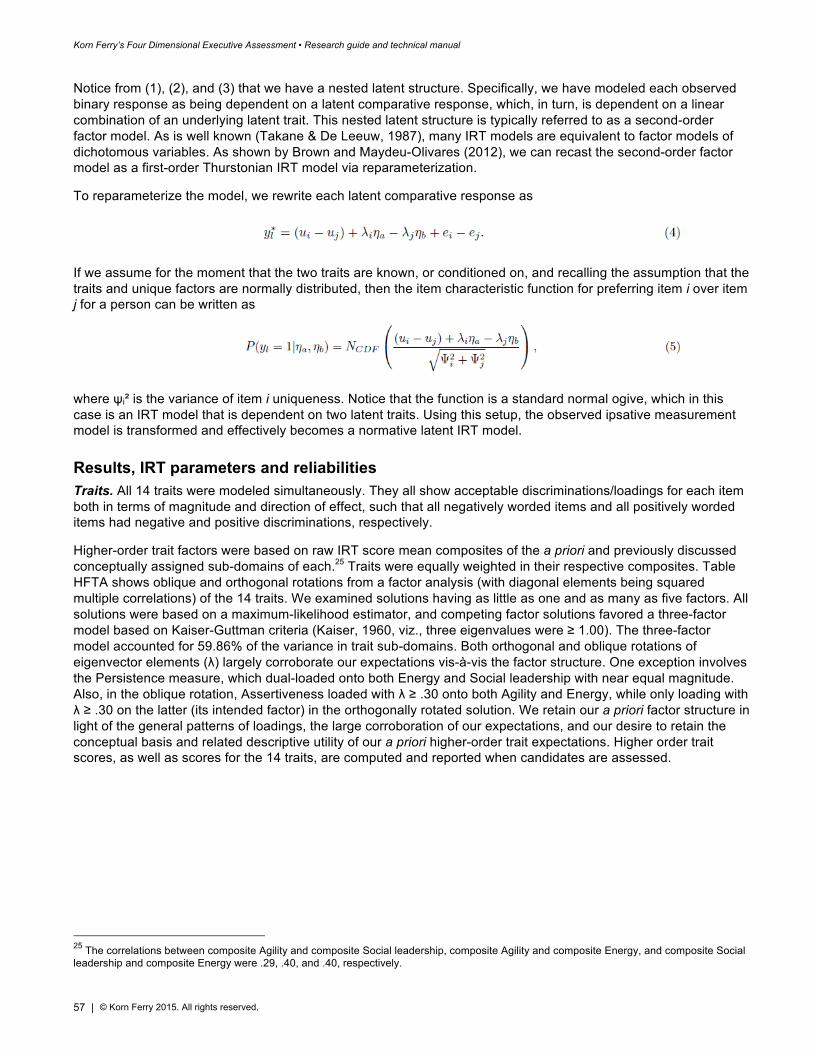
Korn Ferry’s Four Dimensional Executive Assessment • Research guide and technical manual
57 | © Korn Ferry 2015. All rights reserved.
Notice from (1), (2), and (3) that we have a nested latent structure. Specifically, we have modeled each observed binary response as being dependent on a latent comparative response, which, in turn, is dependent on a linear combination of an underlying latent trait. This nested latent structure is typically referred to as a second-order factor model. As is well known (Takane & De Leeuw, 1987), many IRT models are equivalent to factor models of dichotomous variables. As shown by Brown and Maydeu-Olivares (2012), we can recast the second-order factor model as a first-order Thurstonian IRT model via reparameterization.
To reparameterize the model, we rewrite each latent comparative response as
If we assume for the moment that the two traits are known, or conditioned on, and recalling the assumption that the traits and unique factors are normally distributed, then the item characteristic function for preferring item i over item j for a person can be written as
where ψi² is the variance of item i uniqueness. Notice that the function is a standard normal ogive, which in this case is an IRT model that is dependent on two latent traits. Using this setup, the observed ipsative measurement model is transformed and effectively becomes a normative latent IRT model.
Results, IRT parameters and reliabilities Traits. All 14 traits were modeled simultaneously. They all show acceptable discriminations/loadings for each item both in terms of magnitude and direction of effect, such that all negatively worded items and all positively worded items had negative and positive discriminations, respectively.
Higher-order trait factors were based on raw IRT score mean composites of the a priori and previously discussed conceptually assigned sub-domains of each.25 Traits were equally weighted in their respective composites. Table HFTA shows oblique and orthogonal rotations from a factor analysis (with diagonal elements being squared multiple correlations) of the 14 traits. We examined solutions having as little as one and as many as five factors. All solutions were based on a maximum-likelihood estimator, and competing factor solutions favored a three-factor model based on Kaiser-Guttman criteria (Kaiser, 1960, viz., three eigenvalues were ≥ 1.00). The three-factor model accounted for 59.86% of the variance in trait sub-domains. Both orthogonal and oblique rotations of eigenvector elements (λ) largely corroborate our expectations vis-à-vis the factor structure. One exception involves the Persistence measure, which dual-loaded onto both Energy and Social leadership with near equal magnitude. Also, in the oblique rotation, Assertiveness loaded with λ ≥ .30 onto both Agility and Energy, while only loading with λ ≥ .30 on the latter (its intended factor) in the orthogonally rotated solution. We retain our a priori factor structure in light of the general patterns of loadings, the large corroboration of our expectations, and our desire to retain the conceptual basis and related descriptive utility of our a priori higher-order trait expectations. Higher order trait scores, as well as scores for the 14 traits, are computed and reported when candidates are assessed.
25 The correlations between composite Agility and composite Social leadership, composite Agility and composite Energy, and composite Social leadership and composite Energy were .29, .40, and .40, respectively.
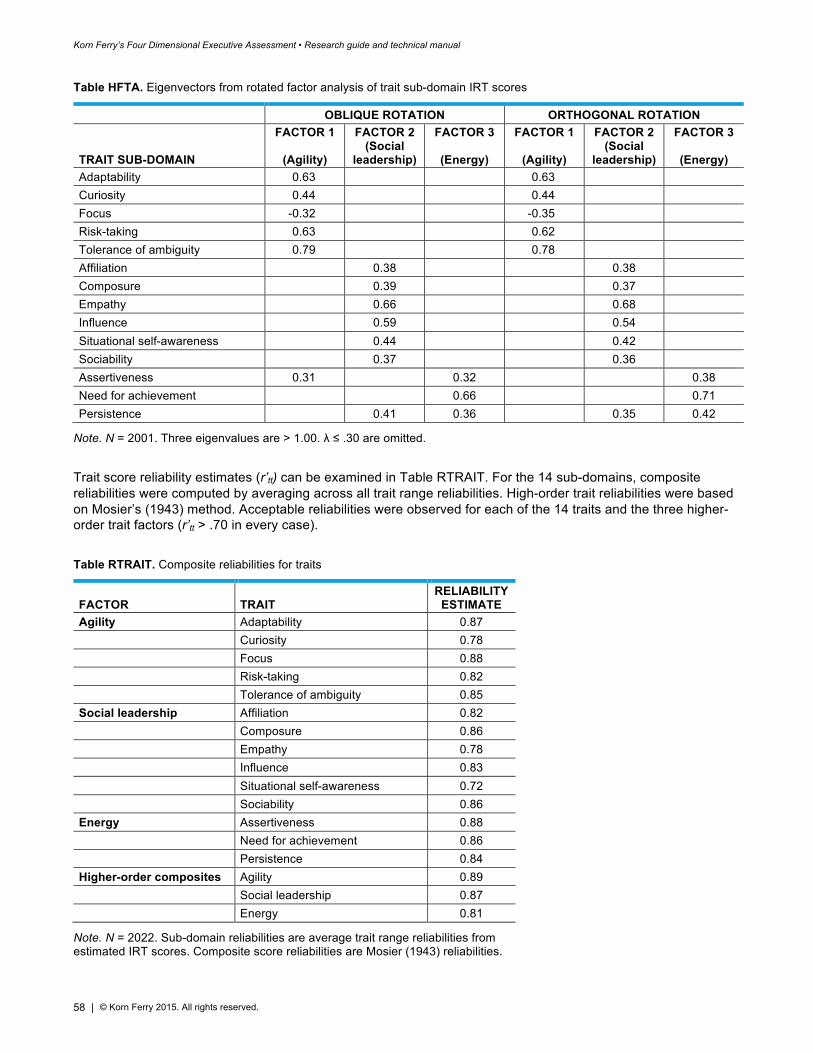
Korn Ferry’s Four Dimensional Executive Assessment • Research guide and technical manual
58 | © Korn Ferry 2015. All rights reserved.
Table HFTA. Eigenvectors from rotated factor analysis of trait sub-domain IRT scores
OBLIQUE ROTATION ORTHOGONAL ROTATION
TRAIT SUB-DOMAIN
FACTOR 1
(Agility)
FACTOR 2 (Social
leadership)
FACTOR 3
(Energy)
FACTOR 1
(Agility)
FACTOR 2 (Social
leadership)
FACTOR 3
(Energy) Adaptability 0.63 0.63 Curiosity 0.44 0.44 Focus -0.32 -0.35 Risk-taking 0.63 0.62 Tolerance of ambiguity 0.79 0.78 Affiliation 0.38 0.38 Composure 0.39 0.37 Empathy 0.66 0.68 Influence 0.59 0.54 Situational self-awareness 0.44 0.42 Sociability 0.37 0.36 Assertiveness 0.31 0.32 0.38 Need for achievement 0.66 0.71 Persistence 0.41 0.36 0.35 0.42
Note. N = 2001. Three eigenvalues are > 1.00. λ ≤ .30 are omitted.
Trait score reliability estimates (r’tt) can be examined in Table RTRAIT. For the 14 sub-domains, composite reliabilities were computed by averaging across all trait range reliabilities. High-order trait reliabilities were based on Mosier’s (1943) method. Acceptable reliabilities were observed for each of the 14 traits and the three higher-order trait factors (r’tt > .70 in every case).
Table RTRAIT. Composite reliabilities for traits
FACTOR TRAIT RELIABILITY
ESTIMATE Agility Adaptability 0.87 Curiosity 0.78 Focus 0.88 Risk-taking 0.82 Tolerance of ambiguity 0.85 Social leadership Affiliation 0.82 Composure 0.86 Empathy 0.78 Influence 0.83 Situational self-awareness 0.72 Sociability 0.86 Energy Assertiveness 0.88 Need for achievement 0.86 Persistence 0.84 Higher-order composites Agility 0.89 Social leadership 0.87 Energy 0.81
Note. N = 2022. Sub-domain reliabilities are average trait range reliabilities from estimated IRT scores. Composite score reliabilities are Mosier (1943) reliabilities.
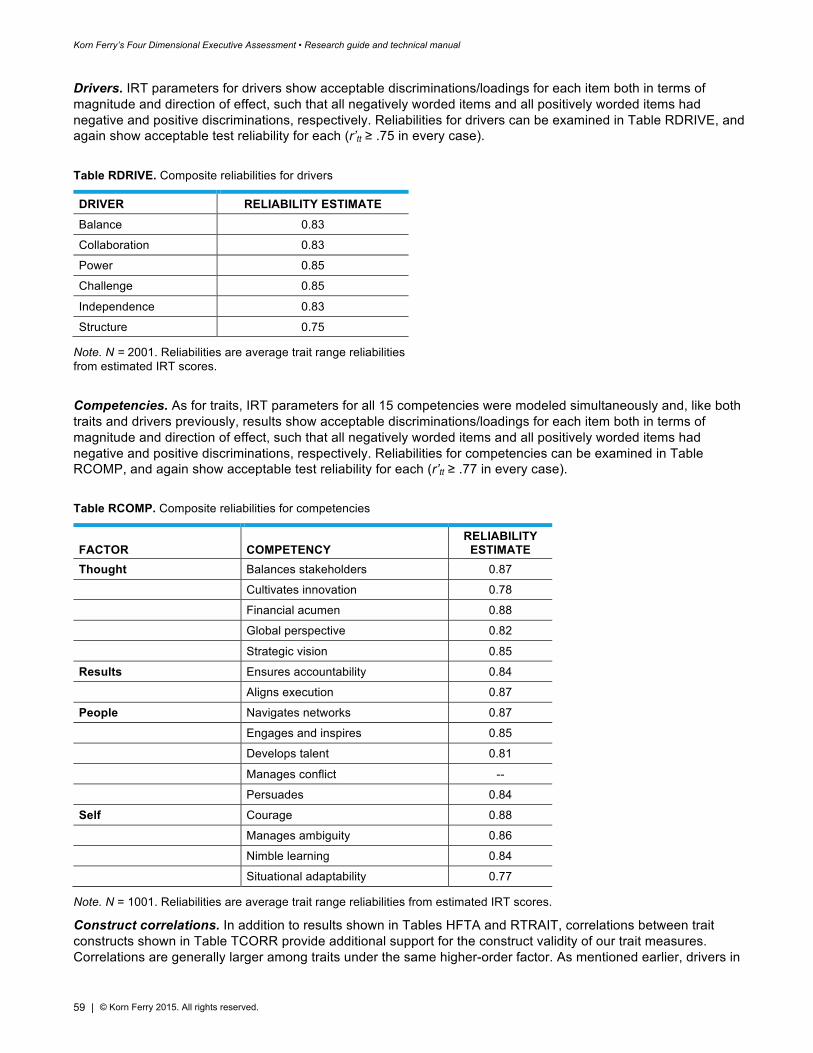
Korn Ferry’s Four Dimensional Executive Assessment • Research guide and technical manual
59 | © Korn Ferry 2015. All rights reserved.
Drivers. IRT parameters for drivers show acceptable discriminations/loadings for each item both in terms of magnitude and direction of effect, such that all negatively worded items and all positively worded items had negative and positive discriminations, respectively. Reliabilities for drivers can be examined in Table RDRIVE, and again show acceptable test reliability for each (r’tt ≥ .75 in every case).
Table RDRIVE. Composite reliabilities for drivers
DRIVER RELIABILITY ESTIMATE Balance 0.83
Collaboration 0.83
Power 0.85
Challenge 0.85
Independence 0.83
Structure 0.75
Note. N = 2001. Reliabilities are average trait range reliabilities from estimated IRT scores.
Competencies. As for traits, IRT parameters for all 15 competencies were modeled simultaneously and, like both traits and drivers previously, results show acceptable discriminations/loadings for each item both in terms of magnitude and direction of effect, such that all negatively worded items and all positively worded items had negative and positive discriminations, respectively. Reliabilities for competencies can be examined in Table RCOMP, and again show acceptable test reliability for each (r’tt ≥ .77 in every case).
Table RCOMP. Composite reliabilities for competencies
FACTOR COMPETENCY RELIABILITY
ESTIMATE Thought Balances stakeholders 0.87
Cultivates innovation 0.78
Financial acumen 0.88
Global perspective 0.82
Strategic vision 0.85
Results Ensures accountability 0.84
Aligns execution 0.87
People Navigates networks 0.87
Engages and inspires 0.85
Develops talent 0.81
Manages conflict --
Persuades 0.84
Self Courage 0.88
Manages ambiguity 0.86
Nimble learning 0.84
Situational adaptability 0.77
Note. N = 1001. Reliabilities are average trait range reliabilities from estimated IRT scores.
Construct correlations. In addition to results shown in Tables HFTA and RTRAIT, correlations between trait constructs shown in Table TCORR provide additional support for the construct validity of our trait measures. Correlations are generally larger among traits under the same higher-order factor. As mentioned earlier, drivers in
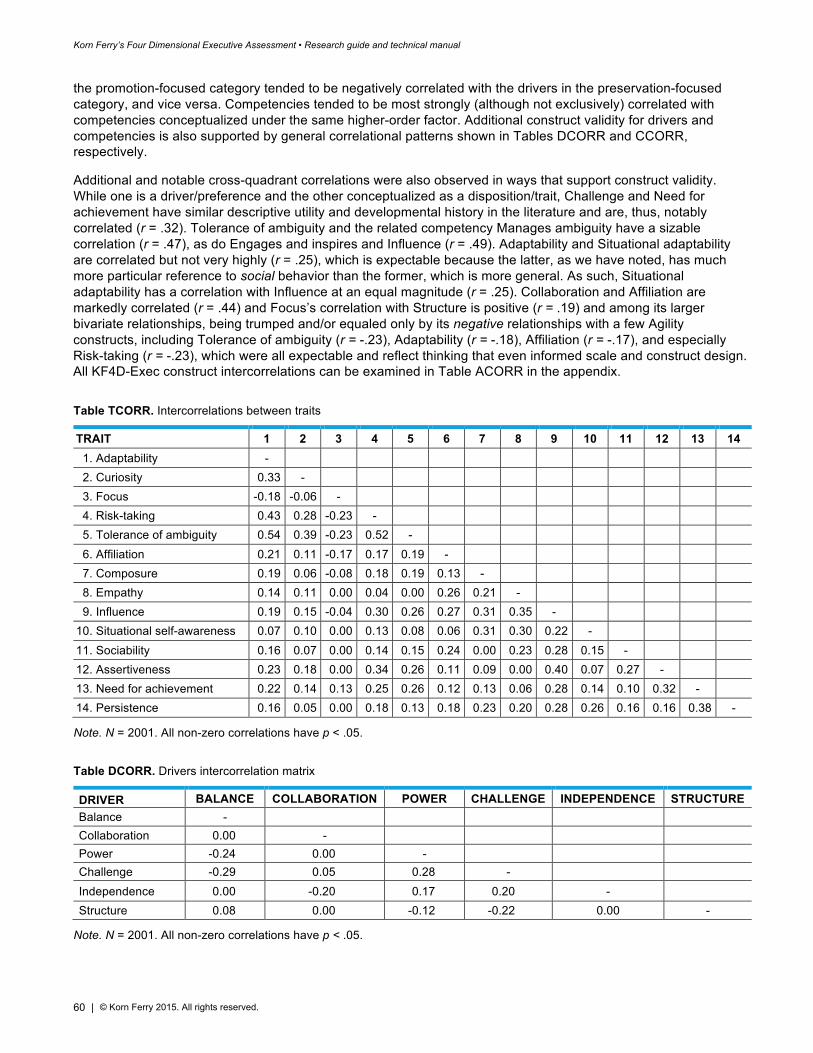
Korn Ferry’s Four Dimensional Executive Assessment • Research guide and technical manual
60 | © Korn Ferry 2015. All rights reserved.
the promotion-focused category tended to be negatively correlated with the drivers in the preservation-focused category, and vice versa. Competencies tended to be most strongly (although not exclusively) correlated with competencies conceptualized under the same higher-order factor. Additional construct validity for drivers and competencies is also supported by general correlational patterns shown in Tables DCORR and CCORR, respectively.
Additional and notable cross-quadrant correlations were also observed in ways that support construct validity. While one is a driver/preference and the other conceptualized as a disposition/trait, Challenge and Need for achievement have similar descriptive utility and developmental history in the literature and are, thus, notably correlated (r = .32). Tolerance of ambiguity and the related competency Manages ambiguity have a sizable correlation (r = .47), as do Engages and inspires and Influence (r = .49). Adaptability and Situational adaptability are correlated but not very highly (r = .25), which is expectable because the latter, as we have noted, has much more particular reference to social behavior than the former, which is more general. As such, Situational adaptability has a correlation with Influence at an equal magnitude (r = .25). Collaboration and Affiliation are markedly correlated (r = .44) and Focus’s correlation with Structure is positive (r = .19) and among its larger bivariate relationships, being trumped and/or equaled only by its negative relationships with a few Agility constructs, including Tolerance of ambiguity (r = -.23), Adaptability (r = -.18), Affiliation (r = -.17), and especially Risk-taking (r = -.23), which were all expectable and reflect thinking that even informed scale and construct design. All KF4D-Exec construct intercorrelations can be examined in Table ACORR in the appendix.
Table TCORR. Intercorrelations between traits
TRAIT 1 2 3 4 5 6 7 8 9 10 11 12 13 14 1. Adaptability - 2. Curiosity 0.33 - 3. Focus -0.18 -0.06 - 4. Risk-taking 0.43 0.28 -0.23 - 5. Tolerance of ambiguity 0.54 0.39 -0.23 0.52 - 6. Affiliation 0.21 0.11 -0.17 0.17 0.19 - 7. Composure 0.19 0.06 -0.08 0.18 0.19 0.13 - 8. Empathy 0.14 0.11 0.00 0.04 0.00 0.26 0.21 - 9. Influence 0.19 0.15 -0.04 0.30 0.26 0.27 0.31 0.35 - 10. Situational self-awareness 0.07 0.10 0.00 0.13 0.08 0.06 0.31 0.30 0.22 - 11. Sociability 0.16 0.07 0.00 0.14 0.15 0.24 0.00 0.23 0.28 0.15 - 12. Assertiveness 0.23 0.18 0.00 0.34 0.26 0.11 0.09 0.00 0.40 0.07 0.27 - 13. Need for achievement 0.22 0.14 0.13 0.25 0.26 0.12 0.13 0.06 0.28 0.14 0.10 0.32 - 14. Persistence 0.16 0.05 0.00 0.18 0.13 0.18 0.23 0.20 0.28 0.26 0.16 0.16 0.38 -
Note. N = 2001. All non-zero correlations have p < .05.
Table DCORR. Drivers intercorrelation matrix
DRIVER BALANCE COLLABORATION POWER CHALLENGE INDEPENDENCE STRUCTURE Balance - Collaboration 0.00 - Power -0.24 0.00 - Challenge -0.29 0.05 0.28 - Independence 0.00 -0.20 0.17 0.20 - Structure 0.08 0.00 -0.12 -0.22 0.00 -
Note. N = 2001. All non-zero correlations have p < .05.
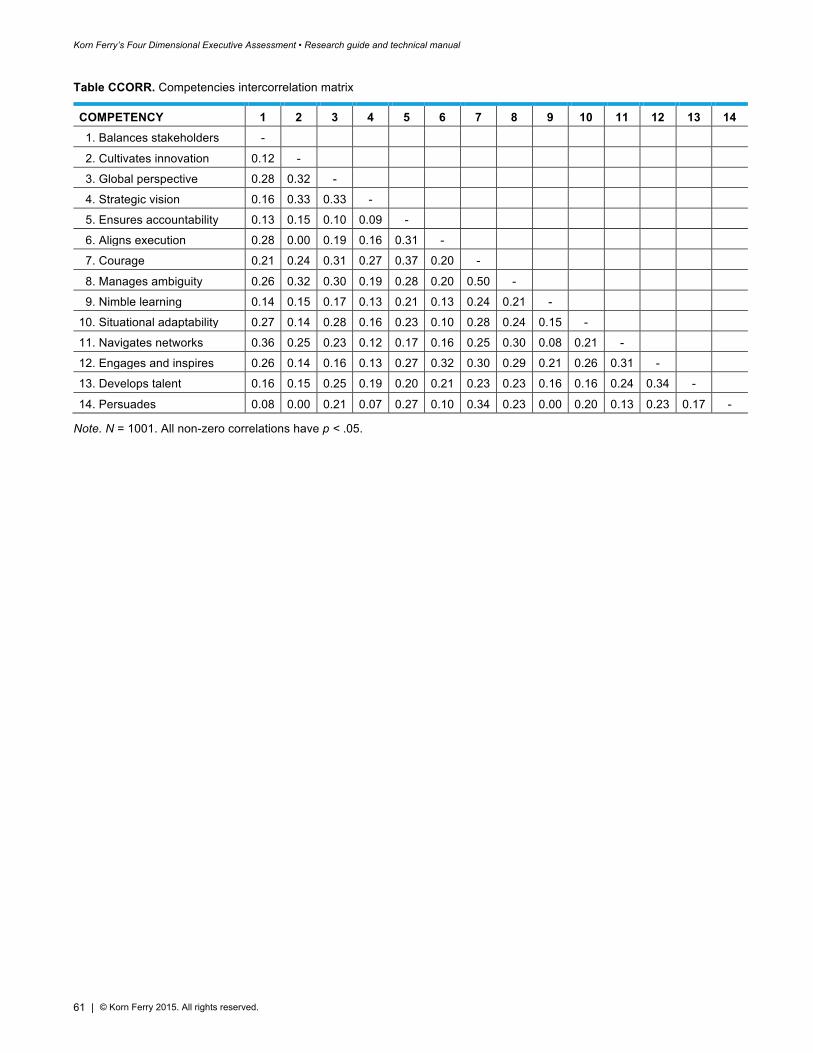
Korn Ferry’s Four Dimensional Executive Assessment • Research guide and technical manual
61 | © Korn Ferry 2015. All rights reserved.
Table CCORR. Competencies intercorrelation matrix
COMPETENCY 1 2 3 4 5 6 7 8 9 10 11 12 13 14 1. Balances stakeholders -
2. Cultivates innovation 0.12 -
3. Global perspective 0.28 0.32 -
4. Strategic vision 0.16 0.33 0.33 -
5. Ensures accountability 0.13 0.15 0.10 0.09 -
6. Aligns execution 0.28 0.00 0.19 0.16 0.31 -
7. Courage 0.21 0.24 0.31 0.27 0.37 0.20 -
8. Manages ambiguity 0.26 0.32 0.30 0.19 0.28 0.20 0.50 -
9. Nimble learning 0.14 0.15 0.17 0.13 0.21 0.13 0.24 0.21 -
10. Situational adaptability 0.27 0.14 0.28 0.16 0.23 0.10 0.28 0.24 0.15 -
11. Navigates networks 0.36 0.25 0.23 0.12 0.17 0.16 0.25 0.30 0.08 0.21 -
12. Engages and inspires 0.26 0.14 0.16 0.13 0.27 0.32 0.30 0.29 0.21 0.26 0.31 -
13. Develops talent 0.16 0.15 0.25 0.19 0.20 0.21 0.23 0.23 0.16 0.16 0.24 0.34 -
14. Persuades 0.08 0.00 0.21 0.07 0.27 0.10 0.34 0.23 0.00 0.20 0.13 0.23 0.17 -
Note. N = 1001. All non-zero correlations have p < .05.
62 | © Korn Ferry 2015. All rights reserved.
Section 4 Empirical findings
Korn Ferry’s Four Dimensional Executive Assessment • Research guide and technical manual
63 | © Korn Ferry 2015. All rights reserved.
Associations with outcomes The following sections of this technical manual are a description of empirical findings supporting each component of the KF4D prediction model. It is a complex model capturing rich nuances of variation in person, role, company culture, and outcomes that together establish the best possible fit of person to position. Each section builds upon the findings of prior sections. Taken together, they describe the empirical foundation for the dynamic model that ensures the utility of KF4D for any executive leadership role. Below, we provide a preview of these sections.
Role variability will review the nature of leadership roles, their variability and measurement. That leadership roles vary in important ways is axiomatic. We will describe the systematic ways roles vary and demonstrate how those differences are captured in work-analysis variables as latent leadership role types.
Average assessment scores across work-analysis variables will discuss analyses that demonstrate how scores on the assessment person variables vary in important ways depending on the leadership role types.
Trait, driver, and competency associations with outcomes will describe the critical outcome measures, work engagement and organizational commitment, and will discuss how traits, drivers, and competencies are potent univariate predictors of these outcomes. The findings are discussed in separate traits, drivers, and competencies sections: Traits, work engagement, and organizational commitment; Competencies, work engagement, and organizational commitment; and Drivers, work engagement, and organizational commitment.
In Multivariate considerations, we utilize latent classes and other groupings of variables to present and discuss substantive interpretations illustrative of how person, role, and outcome measures interact to determine fit and success in a role.
We begin with a discussion of Latent profiles on all KF4D-Exec person measures. Here, we describe the latent person or leader classes’ underlying scores on trait, driver, and competency measures. These classes form descriptive latent leader types.
Class-based fit impressions describes how these descriptive latent leader types differ systematically in how they are related to work-analysis variables and management levels. Findings describe how latent role types and latent person profile groupings interact to explain work engagement scores. A second model further describes interactions between work-analysis variables and KF4D-Exec person measure classes.
Relationships between culture and drivers presents findings illustrating how drivers and culture interact to influence person-environment fit and success.
The Multivariate considerations sections just previewed employ classes or groupings to illustrate the substantive interpretations of interactions among person, role, and culture. In a moderated prediction/fit model using continuous predictor, moderator, and outcome variables, such groupings are not required. In the sections that follow, we turn to describing the full dynamic KF4D-Exec prediction, moderation, and fit model.
In Target scores on KF4D-Exec trait and driver measures, we detail the development of target score profiles for person measures based on moderators, outcomes, and related interactions. In it we demonstrate how, for any given configuration of work-analysis variables, an optimal score profile or range of scores can be described that indicate the best likelihood of superior outcomes. Positions have variable work-analysis scores, management level, and company culture, such that many or all of them have different and custom target trait and target driver profiles associated with each role. Interpreting final equations provides examples with substantive interpretations of profiles.
Target score vector distance tests demonstrates how the fit to the target profile is a powerful predictor of outcomes. Better fit is demonstrated to result in many times greater likelihood of superior outcomes than poor fit.
Role variability Before displaying and discussing additional empirical results, we first turn to a discussion of the nature of leadership roles and their potential to systematically vary. Our discussion intends to focus on the nature of
Korn Ferry’s Four Dimensional Executive Assessment • Research guide and technical manual
64 | © Korn Ferry 2015. All rights reserved.
managerial roles and not on the psychological constitution of leaders and/or managers themselves per se, although clearly, and as we will increasingly demonstrate, the two concepts are linked in important ways. After describing our point of view concerning job roles and the importance of understanding variability in job roles, we return to discussion of empirical findings in which we increasingly underscore that the nature of job roles can moderate the salience and sometimes the interpretation of psychological assessment scores in applied use.
Leadership roles are often similar. They typically involve having some degree of high-stakes decision making, having a large scope of responsibility, and having high-profile accountability for company and/or business unit outcomes. Throughout this technical manual, however, we also have variously made reference to the ways in which executive roles and role contexts can vary, and how related variability can sometimes impact the desirability of score profiles on assessments. So how do executives and executive leadership roles vary? Consider, for example, that some leaders are tasked with making broad organizational changes to improve efficiency or productivity, or to help guide organizations in ways that will facilitate growth and sustainability in the face of market or economic volatility. Some executive roles require higher levels of expertise than others, while some rely more heavily on breadth and/or social behavior for success. Some roles are characterized by clearly defined reporting relationships, while others have loosely defined or lateral relationships among co-workers, co-leaders, and stakeholders. Some roles are more strategic. Some are more tactical. Some are both. Some involve tackling quick-changing, volatile, and multiple objectives, while others focus on maintaining stability and making improvements or efficiency increases toward accomplishing well-defined, stable, or more limited objectives. In short, despite all the similarities that may exist, leadership roles are often markedly diverse, and inter-role differences may render particular assessment profiles more or less desirable (Lewis & Landis, 2015; Tett & Guterman, 2000).
In the discussion that follows, we review related studies and analyze data to more closely examine how leadership roles vary in ways that are potentially meaningful vis-à-vis Korn Ferry’s Four Dimensions of Leadership and Talent model, with particular attention paid to three of the four quadrants including traits, drivers, and (self-efficacy for) competencies. Among the different traditions we draw from is the well-established literature on transformational vs. transactional leaders and leadership roles (McCleskey, 2014). Kuhnert and Lewis (1987) argue that these different kinds of leadership perspectives are best understood when considered in conjunction with individual psychological measures, including traits and motives. Transformational leaders and related roles are those that are typically described in terms of charisma, inspiration, subordinate empowerment, and subordinate self-determination (Bass & Avolio, 2000; Kark, Shamir, & Chen, 2003; Burns, 2003). The extant literature communicates a consensus that transformational leaders are relatively more effective for companies and markets characterized by change and the need to innovate (Allen, Smith & Da Silva, 2013; Bass, 1997; Seyhan, 2013), particularly when companies are large and complex (Kotter, 1990). Whether entirely accurate or not,26 researchers tend to reference “transformational leaders” and leaders who are “change drivers” synonymously (Oke, Munshi, & Walumbwa, 2009; Armenakis & Harris, 2009; Riggio, Bass, & Orr, 2004). Psychological profiles associated with transformational leaders and related role demands often invoke notions of broad strategic vision, inspirational influence, charisma, adaptability, change facilitation, emotional stability, socially skilled leadership, intellectual stimulation, self-confidence, and preference for challenge and novelty (Bryman, 1992; Oldham & Cummings, 1996; Allen et al., 2013; Harms & Crede, 2010; Zhang, Avery, Bergsteiner, & More, 2014). Transformational leaders are also typically described as those who tend, in relative terms, to eschew rigidity, dogma, protocol, details, establishment, and deference to known best practices or prevailing paradigms designed to facilitate maintenance, security, and status quo more than innovation, risk, and change (Seyhan, 2013). They are also typically seen as those who empower others and seek to convert followers into leaders, not into better followers. They motivate subordinates and peers via effectively promoting widespread self-determined adoption of shared internalized values and transcendence of self-interests in favor of group values and group interests (Den Hartog, Van Muijen, & Koopman, 1997). These and other characteristics of transformational leaders are adaptive and desirable in many cases, but can also be associated with potential ineffectiveness or situational inappropriateness due to overreliance on emotion, broad perspective, and general aversion for details and logical reasoning—which can sometimes be crucial (Kokemuller, 2015; Tropman & Wooten, 2013).
26 Indeed, some leaders who are hired and/or expected to manage or institute change are charged with instituting change in ways that are not commensurate with the wider notion of transformational leadership and related psychological tendencies (Brousseau et al., 2006).
Korn Ferry’s Four Dimensional Executive Assessment • Research guide and technical manual
65 | © Korn Ferry 2015. All rights reserved.
The transactional leader, on the other hand, defers more readily to implicit or explicit reward structures27 and/or rules and protocol in order to motivate peers and subordinates (Kuhnert & Lewis, 1987). Transactional leadership roles are more immediately (although not exclusively) associated with maintenance and assimilation more than change (Bass, 1997), internalized and communicated goal- and process-clarity (Sims, 1977; Kuhnert & Lewis, 1987; Avery, 2004), ensuring and promoting compliance (Bass, 1985; Avery, 2004), and reliance on status based on de jure authority associated with leader titles and formalized rank more than de facto authority associated with a leader’s person, social capital, social skills, and relationship quality (Atwater & Yammarino,1996).
There is some disagreement in the literature concerning whether transformational leaders and leadership styles are always desirable and more desirable than other types to which they are often compared, including transactional leadership styles, closely related sub-types (e.g., contingent-reward leaders), and others (Judge & Piccolo, 2004). Early and foundational research tended to characterize the two types as opposite poles on a single continuum (Burns, 1978), while prevailing and subsequent research has conceptualized them as separate constructs (Bass, 1985) and even sometimes as successive stages of development, where transactional and within-transactional sub-types are most typically seen as phases or building blocks en route the more advanced and desirable transformational stage(s) (Kegan, 1982; Kuhnert & Lewis, 1987). The extant literature has long since been heavy with studies that treat higher-order or sub-components of transformational and transactional leadership as separate constructs and even model their impact simultaneously, interactively, or incrementally in predictive equations (Judge & Piccolo, 2004; Avolio, 1999; Harms & Crede, 2010). Prevailing opinion increasingly maintains that the best leaders are perhaps both transactional and transformational in adaptive ways (Bass, 1999; Bass et al., 2003; Bryant, 2003) and/or that high-performing teams are characterized by an optimal balance of leaders emphasizing either transactional or transformational styles (Ingram, 2015). Moreover, meta-analysis and recent studies suggest that key sub-components of the two constructs may sometimes be difficult to separate and are highly positively correlated. Specifically, the contingent-reward component of transactional leadership has arguably been its hallmark since the beginning and has now sometimes shown strong or nearly convergent positive correlational magnitude with transformational leadership, as well as consistent positive impact on leadership outcomes (Judge & Piccolo, 2004). Moreover, contrary to once-prevailing collective hypotheses, contingent-reward transactional leadership may be associated with increased management levels and success at those levels at similar (Harms & Crede, 2010) or even higher magnitude than higher-order transformational leadership and/or its sub-components (e.g., charisma, inspiration, idealized influence, intellectual-stimulation). The comparative effect of the two leadership styles seems to be moderated by the nature of roles and contexts (Judge & Piccolo, 2004; Kotter, 1990).
Related works, including recent work by Tropman and Wooten (2013), offer a compelling model explaining differences in upper-level managerial roles/contexts and provide fodder for understanding how those differences can moderate the effectiveness of different leadership styles. Upper-level managers and managerial roles, they assert, are either made to be Builders or Architects. Moreover, they suggest, as have others using a similar lens (e.g., Denis, Langley, & Cazale, 1996) that the concerns of the former and the concerns of the latter are in perpetual opposition and tension to some degree. Builders and Builder evaluations depend on being organized and attuned to details and efficiency. They are focused on tactics and execution, maintaining the flow of operations as well as environmental control and monitoring. Signs of success for the Builder typically evoke notions of reliability, avoiding operational crises, and effectively maintaining or strengthening an organization’s current or legacy strongholds. Architects and Architect success, on the other hand, are far more connected to strategy and vision than with tactics and execution. The Architect eschews tactics and related details in favor of strategic vision, future orientation, and averting strategic and “directional” crises. The Architect is primarily concerned with changing, innovating, and revolutionizing than with maintaining, securing, and evolving. According to Tropman and Wooten (2013), the Architect leader role provides that the successful incumbent “does the opposite of what the organization is strong at at the moment” (p. 327) and is, unlike the Builder, oriented to leadership in a way that rarely involves deference to formal status, rank, or job title as a way of motivating and influencing.
We suggest and clarify that roles or leaders more consistent with the Tropman and Wooten (2013) Builder type are also more likely to be depth- and expertise-oriented and legitimized as such, while Architects are likely more oriented toward breadth, quick-changing objectives, and more complex social demands. The former, given its
27 These include extrinsic rewards such as compensation, promotion, and recognition, etc., but can also have reference to respect, trust, and other less explicit yet important rewards.
Korn Ferry’s Four Dimensional Executive Assessment • Research guide and technical manual
66 | © Korn Ferry 2015. All rights reserved.
emphasis on execution and maintenance, is also more likely characterized by (even communicated) clarity and/or pursuit of clarity in goals and solutions, while the latter is more oriented toward ambiguity, flexibility, and novelty (see Hay, 2006, for example; Avery, 2004). Denis et al. (1996) draws similar distinctions that, among other things, underscore the sometimes opposing nature of the related types. Leadership demands involving ambiguity, flexibility, and change are associated with leadership models emphasizing integration, lateral and integrated role designations, collective decision making, and decentralization (Zhang et al., 2014). Stability and maintenance orientations to leadership are more associated with making consequential and clear distinctions between roles. These distinctions may emphasize the dominion of individuals with certain formal credentials or professional status based on specialized and/or deep expertise, among other things. Stability leadership, while sometimes desirable, is nevertheless sometimes described as “defensive” and “protectionist,” and it promotes conditions that may be effective but are generally sub-optimal for innovative pursuits, particularly when transactionally oriented leaders lack adaptive emotional constitution (Liu et al., 2011). Stability leadership is more oriented toward change as containable and incidental, and it may even sometimes regard strategic and innovative orientation as irresponsible, anxiety inducing, illogical, threatening, unprovable, irrational, or even subversive. Nonetheless, stability and rules-oriented leadership is still sometimes optimal (Kotter, 1990) and positively or more positively predictive of desired outcomes in general or in some contexts (Harms & Crede, 2010). It’s likely more effective, for example, for small groups and quantitative production-related outcomes than is visionary-change leadership (Lowe, Kroeck, & Sivasubramanian, 1996). It is also still found at high levels among top executives in general (Brown & Moshavi, 2002; Harms & Crede, 2010).
Common sense and the extant literature clearly support that any model, and perhaps especially a two- (and sometimes mutually opposing) type model of leaders and leadership roles is limited and will likely fail to capture general or domain-specific ways in which types are not mutually exclusive or adequately described. Earlier in this section, for example, we found that, despite early and even persistent theoretical leanings, transactional and transformational leadership styles are not mutually exclusive even within individuals, and neither style clearly holds a monopoly on effectiveness across or perhaps even within a given context or characterization of a context. A given managerial role may very much require, for example, both strategic and tactical input and preoccupation. A role or leader characterized in general or in emphasis as an Architect likely still needs to invoke both formal rank and lateral informal influence to motivate and lead at different times. Any leader called upon to make significant organizational changes may do so primarily by building and strengthening relationships, securing broad consensus, influencing with social/emotional appeal, and facilitating widespread internalized agreement and collective values that motivate and evoke increased discretionary effort and commitment in others. Other change-oriented leadership roles, however, may necessarily involve firing people, radically and deliberately restructuring, and/or making rank-legitimized implied or explicit ultimatums to groups or individuals. Some change agents may need to do both. As such, KF4D-Exec roles and role variability adopts and allows for a lens shaped by related theories and seeks primarily to describe individuals and jobs in terms of balance or relative emphasis on related variables. Leadership roles may have a clear mix of stability and transformational demands, or they may require relative emphasis on one or the other in various ways.
Measuring the nature of leadership roles How should the diverse demands on executives be understood and characterized? That is, given clear evidence of leadership role variability, what methods are appropriate for analyzing the requirements of leadership roles? Traditionally, in IO Psychology, a systematic job analysis is conducted to understand the nature of a job role and what it requires in terms of skills, abilities, and/or knowledge for success (Brannick, Levine, & Morgeson, 2013). Related practices were originally developed primarily for task-based personnel and often involve things like measures of manual dexterity, physical ability or strength, and/or clearly defined experiences and “hard skills” that are either of little importance to upper-level managerial roles or are otherwise established via resume, background, and reference checks. Traditional job analysis is often atheoretical, can create difficult challenges to generalizability across jobs and organizations (May, 1996), and often involves repeatedly administering survey instruments with many hundreds of items (e.g., Johnson & Carter, 2010; McCourt & Eldridge, 2003).
More recent thinking characterizes traditional job analysis as increasingly obsolete, perhaps especially for upper-level managers and executives. In their review, Atchison, Belcher, and Thomsen (2013), for example, characterize traditional job analysis, saying “…the future of job analysis is in doubt…(because jobs) are now more fluid and flexible…(and) more generic…(job descriptions are now designed) to accommodate the growth of the
Korn Ferry’s Four Dimensional Executive Assessment • Research guide and technical manual
67 | © Korn Ferry 2015. All rights reserved.
individual…There is (now) greater concern with the person aspects of job analysis, such as personality traits required for success or competencies and interpersonal relationships, than with traditional work-related topics.” Similarly, Singh (2008) argues that traditional job analysis is linked to an outdated perspective on what a “job” is—one that assumes jobs to be “encapsulated” and clear-cut, relatively distinct entities that are relatively static and have clear boundaries. As such, Singh (2008) maintains that assumptions underlying traditional job analysis reflect, among other things, increasingly problematic and outdated distinctions between “managers” and “laborers.”
In light of emerging research on job analysis and our focus on upper-level management and executive leaders, we choose to make a distinction between traditional task-oriented job analyses and what high-profile researchers have otherwise referred to as trait- or values-based job analyses (Costa, McCrae, & Kay, 1995; Tett & Burnett, 2003). The latter is relatively congruent with emerging consensus on job analysis (Atchison et al., 2013) and is based on notions of situation-trait relevance, person-situation interactionism, and related frameworks (e.g., Tett & Guterman, 2000), asserting that psychological dispositions and individual motives are important to the extent that environments provide cues and needs that allow for or require their expression. Building on this and relating theories, Tett and Burnett (2003) argue that any trait or trait-like measures used for supplemental determination of fit or for predicting success in jobs is best and most appropriately employed in conjunction with a related work-analysis used to determine the extent to which measured dispositions are in demand and required for success in the role under consideration. The importance of utilizing work-analysis variables is underscored by the previously reviewed studies showing that the nature of (executive) job roles moderate the extent to which a given disposition or measure is related to success, and related moderation can render a particular construct or construct-profile positively, negatively, or even unrelated to job performance, satisfaction, fit, turnover, or any other outcome of interest.
Therefore, informed by our review on the nature of leadership roles, SME input, and analyses from related initiatives, we developed a six-dimensional model of work-analysis variables that describe executive and upper-level manager role variability. These work-analysis variables are expected to interact with assessment profiles to inform person-role fit. First, we assert that roles are more or less Strategic vs. Tactical. The former involves long-term goal setting and vision, while the latter involves driving execution and carrying out strategic initiatives as variously prescribed. Second, leadership roles also involve real or communicated Ambiguity in goals and solutions vs. Clarity in goals and solutions. The latter is moderately and positively correlated with Tactical, and primarily involves executing on known objectives by using or identifying best-practice processes and ensuring accountability and compliance. Third, leadership roles also may rely more or less on Matrixed/Lateral Influence vs. Top-Down Authority, such that the former emphasizes influencing without authority and nurturing wide self-determined buy-in among organizational members. Conversely, roles that rely on and invoke Top-Down Authority emphasize formal decision-making authority, rank, prescriptive management, and facilitating relative clarity concerning what does and does not constitute compliance and reward-merited performance. Fourth, organizations seeking leaders may also be more or less interested in transformational Change Agents vs. Stability Managers who oversee and facilitate maintenance of operations and organizational processes. In addition, upper-level managerial roles may require Experts who are depth oriented and relatively technical and/or specialized vs. Managerial Professionals who are breadth oriented and more focused on fast learning and perhaps even people management and deployment and, hence, social behavior as a tool for success. Finally, company environments or given roles may be more or less characterized by relatively Stable Objectives linked to legacy and/or narrowly defined goods and services or by Volatile and quick-changing or novel objectives characterized by market responsiveness, continually emerging opportunities, and/or changing objectives that result in new and/or rapidly arising and changing organizational initiatives (Raj, 2012).
We further posit that the poles of each conceptual continuum tend to contribute to leadership roles that loosely conform to notions of transformational or visionary leadership (Change, Strategy, Breadth/Fast Learning, Volatile Objectives, Lateral Influence, Ambiguity) or transactional/stability management, viz., Tropman and Wooten’s (2013) Builder type (Maintenance, Tactics, Expert Oriented, Top-Down Authority, Stable Legacy Objectives, Clarity). Table WACC, which displays bivariate correlations between ratings of forced-choice semantic-differential items, lends some support to this notion. Specifically, high-level stakeholders within companies seeking to fill leadership and executive role vacancies were asked to characterize the role vacancy in terms of expectations and
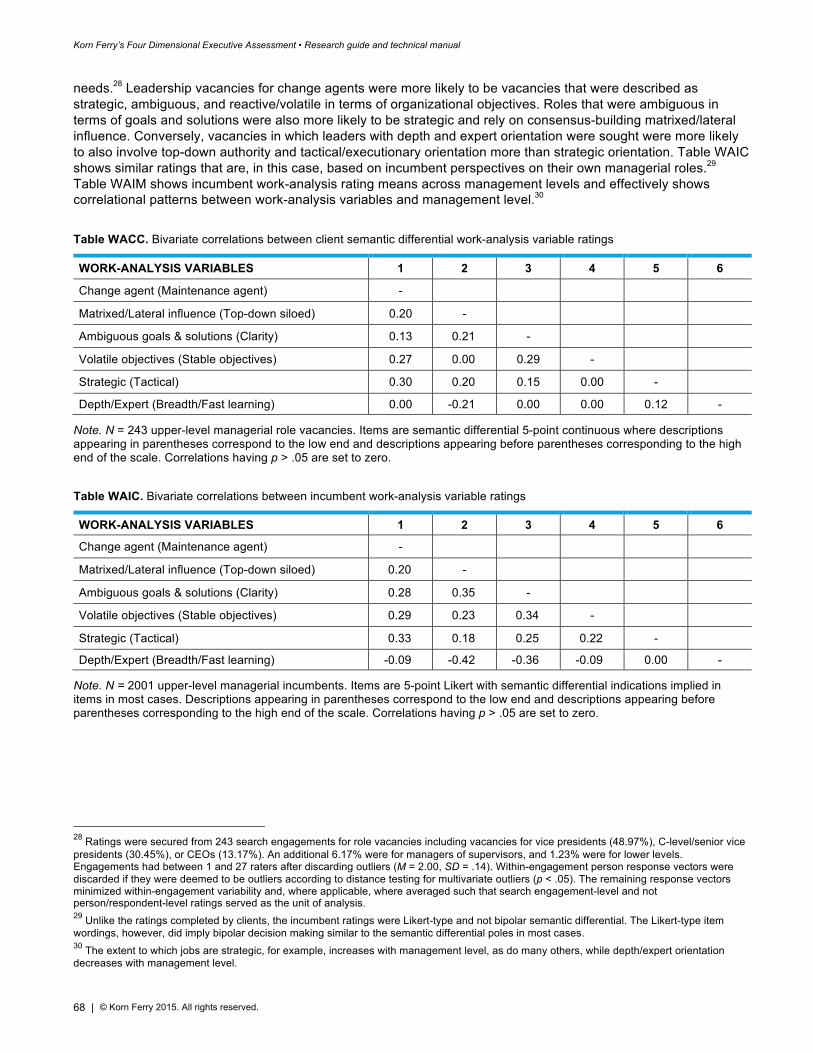
Korn Ferry’s Four Dimensional Executive Assessment • Research guide and technical manual
68 | © Korn Ferry 2015. All rights reserved.
needs.28 Leadership vacancies for change agents were more likely to be vacancies that were described as strategic, ambiguous, and reactive/volatile in terms of organizational objectives. Roles that were ambiguous in terms of goals and solutions were also more likely to be strategic and rely on consensus-building matrixed/lateral influence. Conversely, vacancies in which leaders with depth and expert orientation were sought were more likely to also involve top-down authority and tactical/executionary orientation more than strategic orientation. Table WAIC shows similar ratings that are, in this case, based on incumbent perspectives on their own managerial roles.29 Table WAIM shows incumbent work-analysis rating means across management levels and effectively shows correlational patterns between work-analysis variables and management level.30
Table WACC. Bivariate correlations between client semantic differential work-analysis variable ratings
WORK-ANALYSIS VARIABLES 1 2 3 4 5 6
Change agent (Maintenance agent) - Matrixed/Lateral influence (Top-down siloed) 0.20 - Ambiguous goals & solutions (Clarity) 0.13 0.21 - Volatile objectives (Stable objectives) 0.27 0.00 0.29 - Strategic (Tactical) 0.30 0.20 0.15 0.00 - Depth/Expert (Breadth/Fast learning) 0.00 -0.21 0.00 0.00 0.12 -
Note. N = 243 upper-level managerial role vacancies. Items are semantic differential 5-point continuous where descriptions appearing in parentheses correspond to the low end and descriptions appearing before parentheses corresponding to the high end of the scale. Correlations having p > .05 are set to zero.
Table WAIC. Bivariate correlations between incumbent work-analysis variable ratings
WORK-ANALYSIS VARIABLES 1 2 3 4 5 6
Change agent (Maintenance agent) - Matrixed/Lateral influence (Top-down siloed) 0.20 - Ambiguous goals & solutions (Clarity) 0.28 0.35 - Volatile objectives (Stable objectives) 0.29 0.23 0.34 - Strategic (Tactical) 0.33 0.18 0.25 0.22 - Depth/Expert (Breadth/Fast learning) -0.09 -0.42 -0.36 -0.09 0.00 -
Note. N = 2001 upper-level managerial incumbents. Items are 5-point Likert with semantic differential indications implied in items in most cases. Descriptions appearing in parentheses correspond to the low end and descriptions appearing before parentheses corresponding to the high end of the scale. Correlations having p > .05 are set to zero.
28 Ratings were secured from 243 search engagements for role vacancies including vacancies for vice presidents (48.97%), C-level/senior vice presidents (30.45%), or CEOs (13.17%). An additional 6.17% were for managers of supervisors, and 1.23% were for lower levels. Engagements had between 1 and 27 raters after discarding outliers (M = 2.00, SD = .14). Within-engagement person response vectors were discarded if they were deemed to be outliers according to distance testing for multivariate outliers (p < .05). The remaining response vectors minimized within-engagement variability and, where applicable, where averaged such that search engagement-level and not person/respondent-level ratings served as the unit of analysis. 29 Unlike the ratings completed by clients, the incumbent ratings were Likert-type and not bipolar semantic differential. The Likert-type item wordings, however, did imply bipolar decision making similar to the semantic differential poles in most cases. 30 The extent to which jobs are strategic, for example, increases with management level, as do many others, while depth/expert orientation decreases with management level.
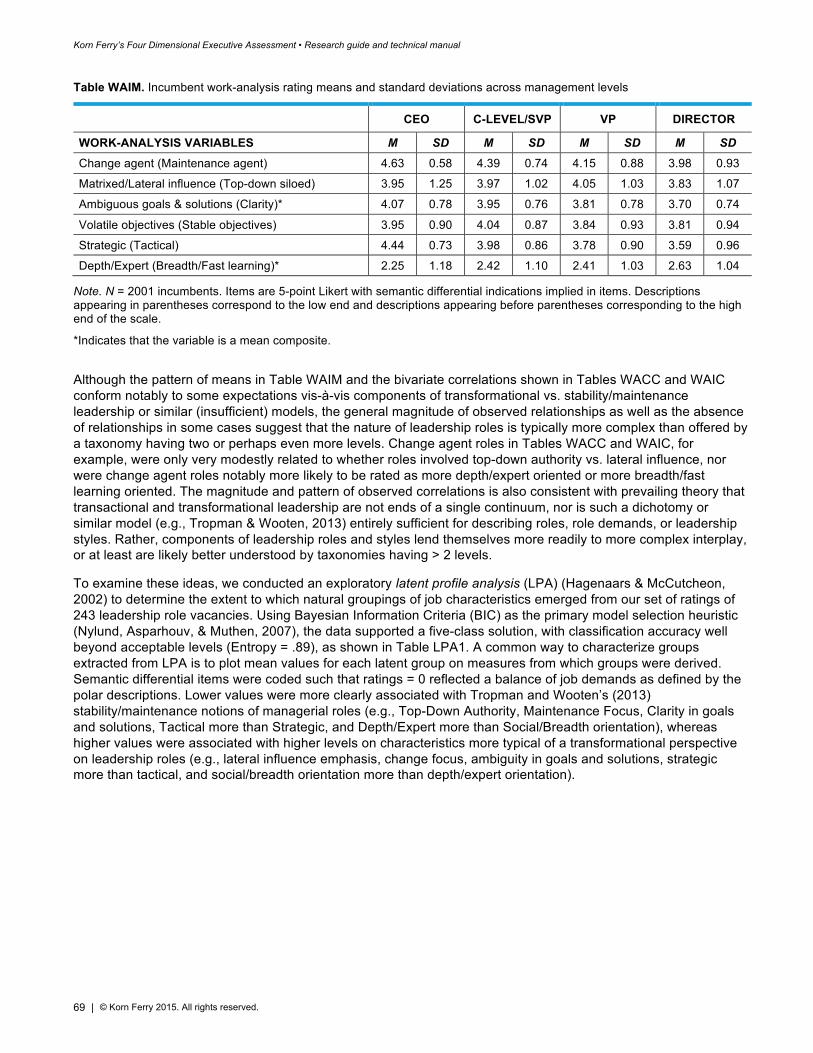
Korn Ferry’s Four Dimensional Executive Assessment • Research guide and technical manual
69 | © Korn Ferry 2015. All rights reserved.
Table WAIM. Incumbent work-analysis rating means and standard deviations across management levels
CEO C-LEVEL/SVP VP DIRECTOR
WORK-ANALYSIS VARIABLES M SD M SD M SD M SD Change agent (Maintenance agent) 4.63 0.58 4.39 0.74 4.15 0.88 3.98 0.93
Matrixed/Lateral influence (Top-down siloed) 3.95 1.25 3.97 1.02 4.05 1.03 3.83 1.07
Ambiguous goals & solutions (Clarity)* 4.07 0.78 3.95 0.76 3.81 0.78 3.70 0.74
Volatile objectives (Stable objectives) 3.95 0.90 4.04 0.87 3.84 0.93 3.81 0.94
Strategic (Tactical) 4.44 0.73 3.98 0.86 3.78 0.90 3.59 0.96
Depth/Expert (Breadth/Fast learning)* 2.25 1.18 2.42 1.10 2.41 1.03 2.63 1.04
Note. N = 2001 incumbents. Items are 5-point Likert with semantic differential indications implied in items. Descriptions appearing in parentheses correspond to the low end and descriptions appearing before parentheses corresponding to the high end of the scale.
*Indicates that the variable is a mean composite.
Although the pattern of means in Table WAIM and the bivariate correlations shown in Tables WACC and WAIC conform notably to some expectations vis-à-vis components of transformational vs. stability/maintenance leadership or similar (insufficient) models, the general magnitude of observed relationships as well as the absence of relationships in some cases suggest that the nature of leadership roles is typically more complex than offered by a taxonomy having two or perhaps even more levels. Change agent roles in Tables WACC and WAIC, for example, were only very modestly related to whether roles involved top-down authority vs. lateral influence, nor were change agent roles notably more likely to be rated as more depth/expert oriented or more breadth/fast learning oriented. The magnitude and pattern of observed correlations is also consistent with prevailing theory that transactional and transformational leadership are not ends of a single continuum, nor is such a dichotomy or similar model (e.g., Tropman & Wooten, 2013) entirely sufficient for describing roles, role demands, or leadership styles. Rather, components of leadership roles and styles lend themselves more readily to more complex interplay, or at least are likely better understood by taxonomies having > 2 levels.
To examine these ideas, we conducted an exploratory latent profile analysis (LPA) (Hagenaars & McCutcheon, 2002) to determine the extent to which natural groupings of job characteristics emerged from our set of ratings of 243 leadership role vacancies. Using Bayesian Information Criteria (BIC) as the primary model selection heuristic (Nylund, Asparhouv, & Muthen, 2007), the data supported a five-class solution, with classification accuracy well beyond acceptable levels (Entropy = .89), as shown in Table LPA1. A common way to characterize groups extracted from LPA is to plot mean values for each latent group on measures from which groups were derived. Semantic differential items were coded such that ratings = 0 reflected a balance of job demands as defined by the polar descriptions. Lower values were more clearly associated with Tropman and Wooten’s (2013) stability/maintenance notions of managerial roles (e.g., Top-Down Authority, Maintenance Focus, Clarity in goals and solutions, Tactical more than Strategic, and Depth/Expert more than Social/Breadth orientation), whereas higher values were associated with higher levels on characteristics more typical of a transformational perspective on leadership roles (e.g., lateral influence emphasis, change focus, ambiguity in goals and solutions, strategic more than tactical, and social/breadth orientation more than depth/expert orientation).
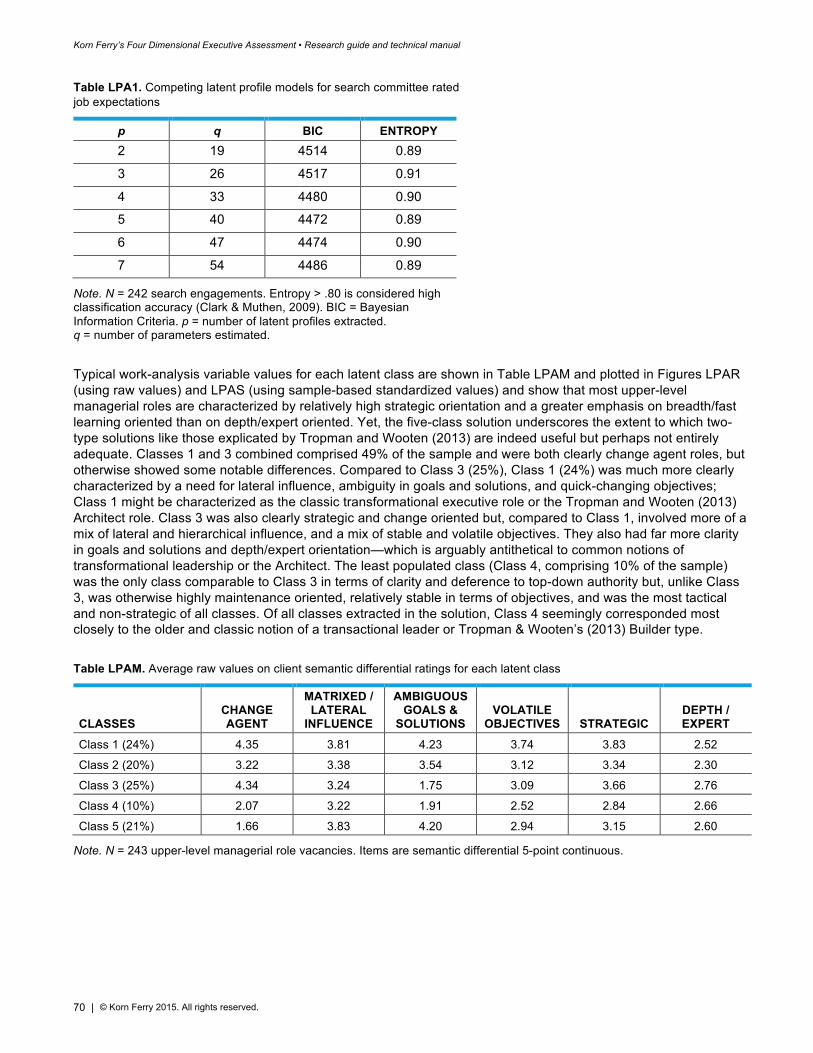
Korn Ferry’s Four Dimensional Executive Assessment • Research guide and technical manual
70 | © Korn Ferry 2015. All rights reserved.
Table LPA1. Competing latent profile models for search committee rated job expectations
p q BIC ENTROPY 2 19 4514 0.89 3 26 4517 0.91 4 33 4480 0.90 5 40 4472 0.89 6 47 4474 0.90 7 54 4486 0.89
Note. N = 242 search engagements. Entropy > .80 is considered high classification accuracy (Clark & Muthen, 2009). BIC = Bayesian Information Criteria. p = number of latent profiles extracted. q = number of parameters estimated.
Typical work-analysis variable values for each latent class are shown in Table LPAM and plotted in Figures LPAR (using raw values) and LPAS (using sample-based standardized values) and show that most upper-level managerial roles are characterized by relatively high strategic orientation and a greater emphasis on breadth/fast learning oriented than on depth/expert oriented. Yet, the five-class solution underscores the extent to which two-type solutions like those explicated by Tropman and Wooten (2013) are indeed useful but perhaps not entirely adequate. Classes 1 and 3 combined comprised 49% of the sample and were both clearly change agent roles, but otherwise showed some notable differences. Compared to Class 3 (25%), Class 1 (24%) was much more clearly characterized by a need for lateral influence, ambiguity in goals and solutions, and quick-changing objectives; Class 1 might be characterized as the classic transformational executive role or the Tropman and Wooten (2013) Architect role. Class 3 was also clearly strategic and change oriented but, compared to Class 1, involved more of a mix of lateral and hierarchical influence, and a mix of stable and volatile objectives. They also had far more clarity in goals and solutions and depth/expert orientation—which is arguably antithetical to common notions of transformational leadership or the Architect. The least populated class (Class 4, comprising 10% of the sample) was the only class comparable to Class 3 in terms of clarity and deference to top-down authority but, unlike Class 3, was otherwise highly maintenance oriented, relatively stable in terms of objectives, and was the most tactical and non-strategic of all classes. Of all classes extracted in the solution, Class 4 seemingly corresponded most closely to the older and classic notion of a transactional leader or Tropman & Wooten’s (2013) Builder type.
Table LPAM. Average raw values on client semantic differential ratings for each latent class
CLASSES CHANGE AGENT
MATRIXED / LATERAL
INFLUENCE
AMBIGUOUS GOALS &
SOLUTIONS VOLATILE
OBJECTIVES STRATEGIC DEPTH / EXPERT
Class 1 (24%) 4.35 3.81 4.23 3.74 3.83 2.52
Class 2 (20%) 3.22 3.38 3.54 3.12 3.34 2.30
Class 3 (25%) 4.34 3.24 1.75 3.09 3.66 2.76
Class 4 (10%) 2.07 3.22 1.91 2.52 2.84 2.66
Class 5 (21%) 1.66 3.83 4.20 2.94 3.15 2.60
Note. N = 243 upper-level managerial role vacancies. Items are semantic differential 5-point continuous.
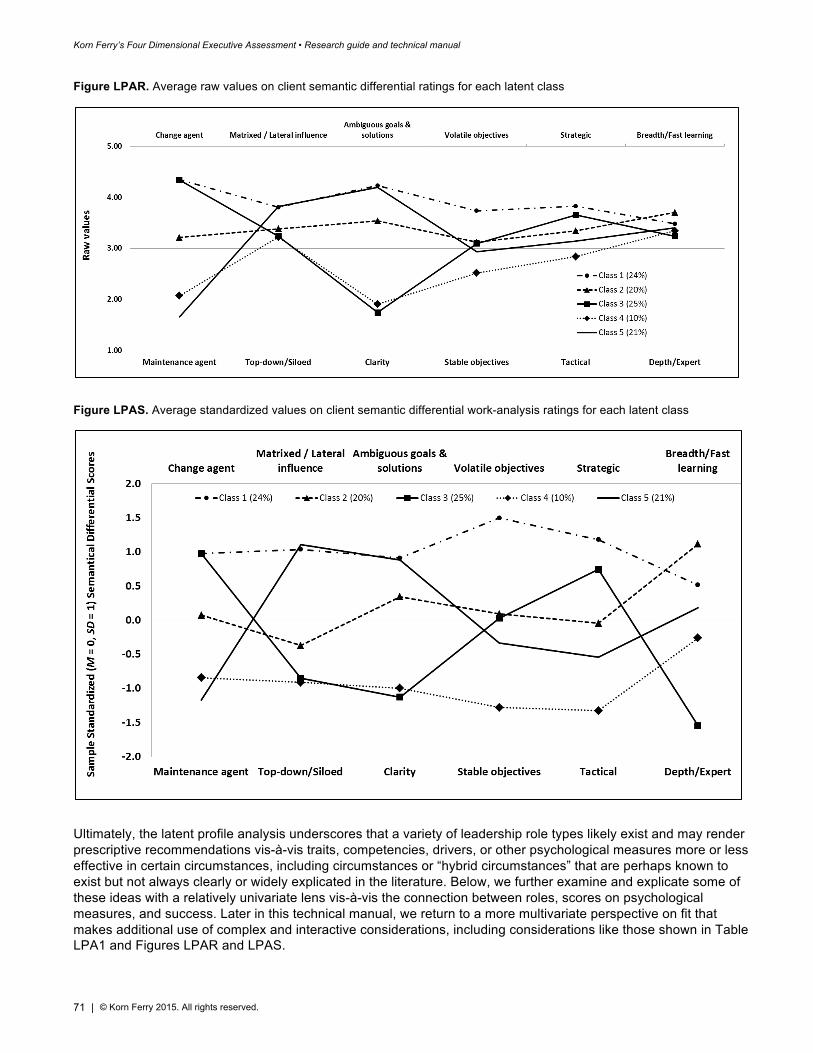
Korn Ferry’s Four Dimensional Executive Assessment • Research guide and technical manual
71 | © Korn Ferry 2015. All rights reserved.
Figure LPAR. Average raw values on client semantic differential ratings for each latent class
Figure LPAS. Average standardized values on client semantic differential work-analysis ratings for each latent class
Ultimately, the latent profile analysis underscores that a variety of leadership role types likely exist and may render prescriptive recommendations vis-à-vis traits, competencies, drivers, or other psychological measures more or less effective in certain circumstances, including circumstances or “hybrid circumstances” that are perhaps known to exist but not always clearly or widely explicated in the literature. Below, we further examine and explicate some of these ideas with a relatively univariate lens vis-à-vis the connection between roles, scores on psychological measures, and success. Later in this technical manual, we return to a more multivariate perspective on fit that makes additional use of complex and interactive considerations, including considerations like those shown in Table LPA1 and Figures LPAR and LPAS.
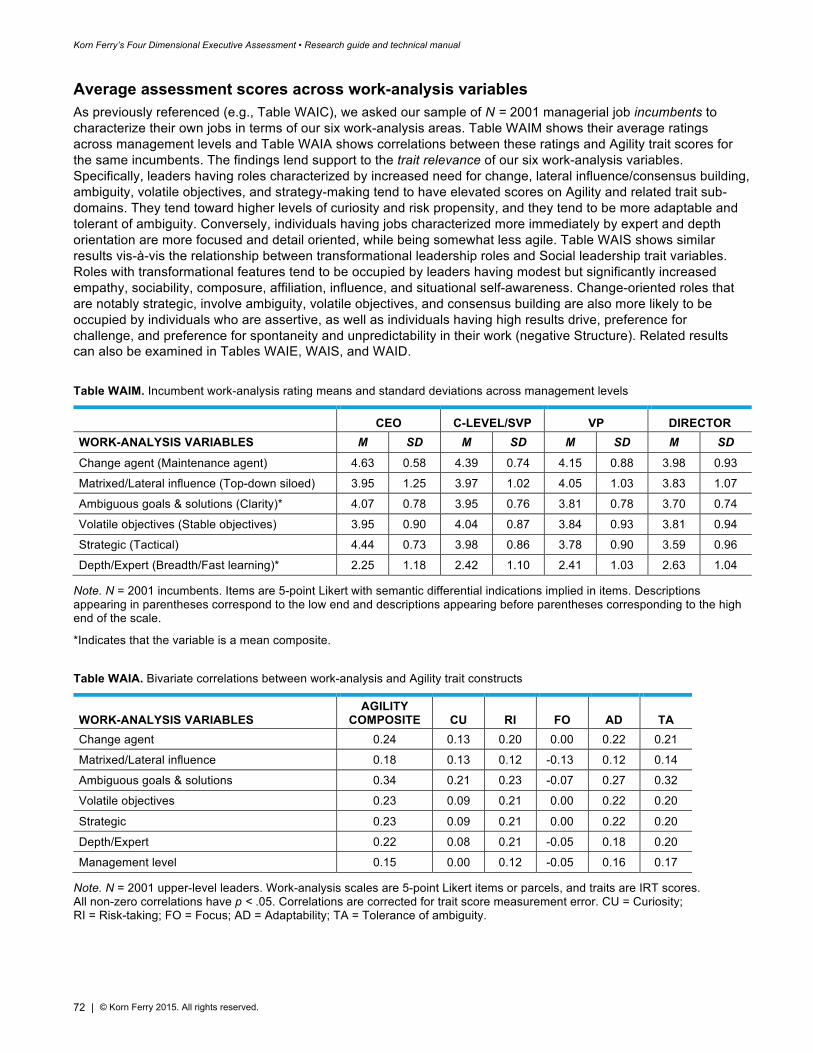
Korn Ferry’s Four Dimensional Executive Assessment • Research guide and technical manual
72 | © Korn Ferry 2015. All rights reserved.
Average assessment scores across work-analysis variables As previously referenced (e.g., Table WAIC), we asked our sample of N = 2001 managerial job incumbents to characterize their own jobs in terms of our six work-analysis areas. Table WAIM shows their average ratings across management levels and Table WAIA shows correlations between these ratings and Agility trait scores for the same incumbents. The findings lend support to the trait relevance of our six work-analysis variables. Specifically, leaders having roles characterized by increased need for change, lateral influence/consensus building, ambiguity, volatile objectives, and strategy-making tend to have elevated scores on Agility and related trait sub-domains. They tend toward higher levels of curiosity and risk propensity, and they tend to be more adaptable and tolerant of ambiguity. Conversely, individuals having jobs characterized more immediately by expert and depth orientation are more focused and detail oriented, while being somewhat less agile. Table WAIS shows similar results vis-à-vis the relationship between transformational leadership roles and Social leadership trait variables. Roles with transformational features tend to be occupied by leaders having modest but significantly increased empathy, sociability, composure, affiliation, influence, and situational self-awareness. Change-oriented roles that are notably strategic, involve ambiguity, volatile objectives, and consensus building are also more likely to be occupied by individuals who are assertive, as well as individuals having high results drive, preference for challenge, and preference for spontaneity and unpredictability in their work (negative Structure). Related results can also be examined in Tables WAIE, WAIS, and WAID.
Table WAIM. Incumbent work-analysis rating means and standard deviations across management levels
CEO C-LEVEL/SVP VP DIRECTOR WORK-ANALYSIS VARIABLES M SD M SD M SD M SD
Change agent (Maintenance agent) 4.63 0.58 4.39 0.74 4.15 0.88 3.98 0.93
Matrixed/Lateral influence (Top-down siloed) 3.95 1.25 3.97 1.02 4.05 1.03 3.83 1.07
Ambiguous goals & solutions (Clarity)* 4.07 0.78 3.95 0.76 3.81 0.78 3.70 0.74
Volatile objectives (Stable objectives) 3.95 0.90 4.04 0.87 3.84 0.93 3.81 0.94
Strategic (Tactical) 4.44 0.73 3.98 0.86 3.78 0.90 3.59 0.96
Depth/Expert (Breadth/Fast learning)* 2.25 1.18 2.42 1.10 2.41 1.03 2.63 1.04
Note. N = 2001 incumbents. Items are 5-point Likert with semantic differential indications implied in items. Descriptions appearing in parentheses correspond to the low end and descriptions appearing before parentheses corresponding to the high end of the scale.
*Indicates that the variable is a mean composite.
Table WAIA. Bivariate correlations between work-analysis and Agility trait constructs
WORK-ANALYSIS VARIABLES AGILITY
COMPOSITE CU RI FO AD TA Change agent 0.24 0.13 0.20 0.00 0.22 0.21
Matrixed/Lateral influence 0.18 0.13 0.12 -0.13 0.12 0.14
Ambiguous goals & solutions 0.34 0.21 0.23 -0.07 0.27 0.32
Volatile objectives 0.23 0.09 0.21 0.00 0.22 0.20
Strategic 0.23 0.09 0.21 0.00 0.22 0.20
Depth/Expert 0.22 0.08 0.21 -0.05 0.18 0.20
Management level 0.15 0.00 0.12 -0.05 0.16 0.17
Note. N = 2001 upper-level leaders. Work-analysis scales are 5-point Likert items or parcels, and traits are IRT scores. All non-zero correlations have p < .05. Correlations are corrected for trait score measurement error. CU = Curiosity; RI = Risk-taking; FO = Focus; AD = Adaptability; TA = Tolerance of ambiguity.
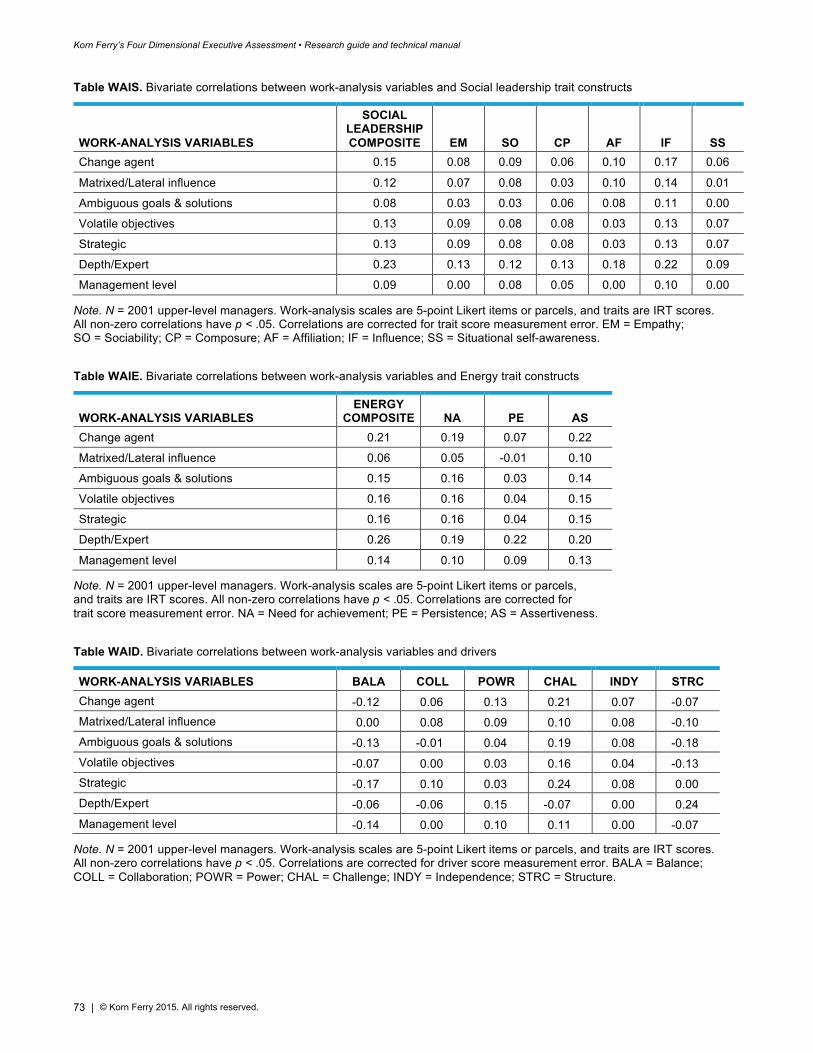
Korn Ferry’s Four Dimensional Executive Assessment • Research guide and technical manual
73 | © Korn Ferry 2015. All rights reserved.
Table WAIS. Bivariate correlations between work-analysis variables and Social leadership trait constructs
WORK-ANALYSIS VARIABLES
SOCIAL LEADERSHIP COMPOSITE EM SO CP AF IF SS
Change agent 0.15 0.08 0.09 0.06 0.10 0.17 0.06
Matrixed/Lateral influence 0.12 0.07 0.08 0.03 0.10 0.14 0.01
Ambiguous goals & solutions 0.08 0.03 0.03 0.06 0.08 0.11 0.00
Volatile objectives 0.13 0.09 0.08 0.08 0.03 0.13 0.07
Strategic 0.13 0.09 0.08 0.08 0.03 0.13 0.07
Depth/Expert 0.23 0.13 0.12 0.13 0.18 0.22 0.09
Management level 0.09 0.00 0.08 0.05 0.00 0.10 0.00
Note. N = 2001 upper-level managers. Work-analysis scales are 5-point Likert items or parcels, and traits are IRT scores. All non-zero correlations have p < .05. Correlations are corrected for trait score measurement error. EM = Empathy; SO = Sociability; CP = Composure; AF = Affiliation; IF = Influence; SS = Situational self-awareness.
Table WAIE. Bivariate correlations between work-analysis variables and Energy trait constructs
WORK-ANALYSIS VARIABLES ENERGY
COMPOSITE NA PE AS Change agent 0.21 0.19 0.07 0.22
Matrixed/Lateral influence 0.06 0.05 -0.01 0.10
Ambiguous goals & solutions 0.15 0.16 0.03 0.14
Volatile objectives 0.16 0.16 0.04 0.15
Strategic 0.16 0.16 0.04 0.15
Depth/Expert 0.26 0.19 0.22 0.20
Management level 0.14 0.10 0.09 0.13
Note. N = 2001 upper-level managers. Work-analysis scales are 5-point Likert items or parcels, and traits are IRT scores. All non-zero correlations have p < .05. Correlations are corrected for trait score measurement error. NA = Need for achievement; PE = Persistence; AS = Assertiveness.
Table WAID. Bivariate correlations between work-analysis variables and drivers
WORK-ANALYSIS VARIABLES BALA COLL POWR CHAL INDY STRC Change agent -0.12 0.06 0.13 0.21 0.07 -0.07 Matrixed/Lateral influence 0.00 0.08 0.09 0.10 0.08 -0.10 Ambiguous goals & solutions -0.13 -0.01 0.04 0.19 0.08 -0.18 Volatile objectives -0.07 0.00 0.03 0.16 0.04 -0.13 Strategic -0.17 0.10 0.03 0.24 0.08 0.00 Depth/Expert -0.06 -0.06 0.15 -0.07 0.00 0.24 Management level -0.14 0.00 0.10 0.11 0.00 -0.07
Note. N = 2001 upper-level managers. Work-analysis scales are 5-point Likert items or parcels, and traits are IRT scores. All non-zero correlations have p < .05. Correlations are corrected for driver score measurement error. BALA = Balance; COLL = Collaboration; POWR = Power; CHAL = Challenge; INDY = Independence; STRC = Structure.
Korn Ferry’s Four Dimensional Executive Assessment • Research guide and technical manual
74 | © Korn Ferry 2015. All rights reserved.
Trait, driver, and competency associations with outcomes The results in Tables WAIA through WAID show trait and driver relatedness of job variables and ultimately speak to average differences on traits and drivers across job role variables. That job roles characterized by transformational leadership components are more likely to be occupied by incumbents having characteristic scores on given traits and drivers provides, at best, introductory evidence that elevated scores on any trait, driver, or competency are more or less desirable, and/or more or less desirable in a given role context. A better measure of score desirability is the extent to which given scores are associated with outcomes of interest. To this end, Tables WEAG through OCPPL show associations between work engagement levels, organizational commitment levels, and assessment scores across work-analysis variable levels.
Organizational commitment and work engagement are often variables of particular interest to HR professionals and organizational scientists and are known to be markedly predictive of both organizational and person-level outcomes including service, sales, quality, retention, profits, shareholder returns, turnover, customer service, productivity, job performance, and others (Markos & Sridevi, 2010; Kruse, 2012; Harter, Schmidt, & Hayes, 2002; Harter, Schmidt, Agrawal, & Plowman, 2013).31 Many also link collective worker engagement to industry and even national outcomes (Gallup, 2010). Work engagement reflects the extent to which professionals are satisfied with and emotionally invested in their jobs and whether they will expend discretionary effort for their organizations. Organizational commitment is closely linked to turnover and retention (Cohen, 1993) and involves the extent to which individuals identify with their organizations and are invested in their jobs and organizations in even psychologically measureable ways. Like our traits, drivers, and competency measures, our work engagement (r’tt = .82) and organizational commitment (r’tt = .79) measures are based on FCIRT format and scoring (Brown & Maydeu-Olivares 2011; Zes et al., 2015) and, as such, have relatively favorable properties vis-à-vis faking and response bias, as previously discussed. Each of these measures is composed of ten items, with half worded positively and half negatively32. The organizational commitment items capture leaders’ positive emotional attachment to and desire to remain a part of the organization. The work engagement items gauge leaders’ absorption with and dedication to work.
Traits, work engagement, and organizational commitment Agility traits. In Table WEAG, we find that at C-level averages on each work-analysis variable, Agility and virtually every sub-component of Agility is positively predictive of work engagement (WE), such that being at or above the 70th percentile of work engagement is typically associated with between .08 and .41 standard deviation increase in a given Agility-related trait (M = .26, SD = .10). Moreover, for C-level executives in general, Adaptability and Tolerance of ambiguity typically increase .54 and .55 standard deviations (respectively) among those at or above the 70th percentile of engagement. When work-analysis variables (including change orientation, lateral influence, strategy-making, ambiguity in goals and solutions, and volatile objectives) are notably high, most Agility traits become more salient, as evidenced by the related increase in their positive relationship with WE in most cases. Note, however, that when managerial roles are characterized by relatively high levels of need for expertise and depth,33 most Agility measures become either less salient in predicting WE or their relationship to WE remains somewhat notable but reverses. Perhaps the best example of moderation as such in Table WEAG involves the relationship between Focus and WE across levels of depth/expert (vs. breadth/fast learning) orientation in leadership roles. Earlier, we discussed that Focus was included as a component of overall agility due to its expected (and observed, see Tables HFTA and TCORR) negative loading on that construct. Here, we see that expectation playing out notably. When depth/expert orientation is markedly high, Focus is strongly positively
31 Harter et al. (2013) report an r = .42 correlation between work engagement and composite business unit performance, and also report that organizations, industries, and countries scarcely, if ever, moderate the nature and magnitude of the relationship. 32 Examples of organizational commitment items are “I care about the success of the organization” and “It is hard to envision my future in this organization.” Examples of work engagement items are “I am filled with energy when I do my work” and “I do as much work as I am paid to do.” 33 Our measure and related discussion of depth/expert in Table LPAM, Figure LPAR, and Figure LPAS are based on a single Likert item. In Tables WEAG through OCPPL, we use a more informative and reliable composite that is more correlated with other work-analysis areas but also, we believe, more informative and commensurate with what we are ultimately trying to represent. Because the former analyses are multivariate in nature and are more sensitive and complicated by highly correlated variables, we chose to use the simpler single-item conceptualization of depth/expert in the latent profile analyses but used the composite here in the more univariate cases. We return to the former in later analyses that are, again, more multivariate and, hence, introduce more potential complications vis-à-vis multicollinearity. Through adjusting the measure to diminish multicollinearity pitfalls, we hope to offer the most robust insights into the complex relationships between assessment profiles, work-analysis variables (or management level), and outcomes.
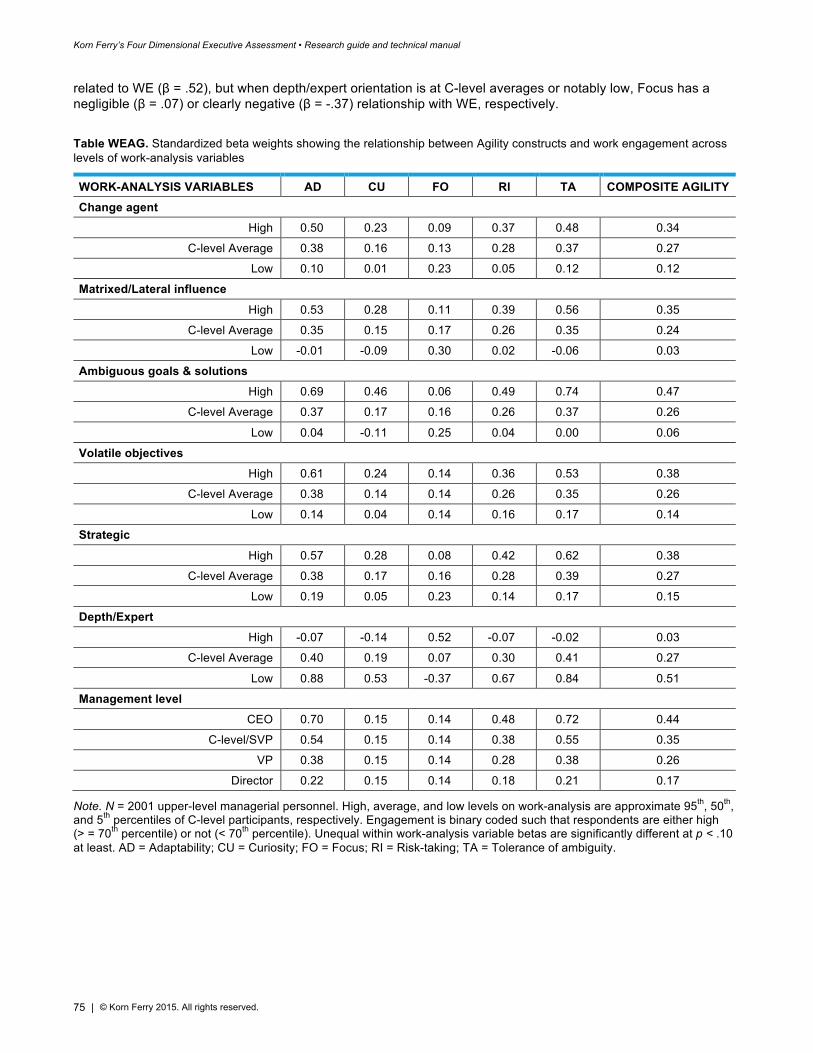
Korn Ferry’s Four Dimensional Executive Assessment • Research guide and technical manual
75 | © Korn Ferry 2015. All rights reserved.
related to WE (β = .52), but when depth/expert orientation is at C-level averages or notably low, Focus has a negligible (β = .07) or clearly negative (β = -.37) relationship with WE, respectively.
Table WEAG. Standardized beta weights showing the relationship between Agility constructs and work engagement across levels of work-analysis variables
WORK-ANALYSIS VARIABLES AD CU FO RI TA COMPOSITE AGILITY Change agent
High 0.50 0.23 0.09 0.37 0.48 0.34
C-level Average 0.38 0.16 0.13 0.28 0.37 0.27
Low 0.10 0.01 0.23 0.05 0.12 0.12
Matrixed/Lateral influence
High 0.53 0.28 0.11 0.39 0.56 0.35
C-level Average 0.35 0.15 0.17 0.26 0.35 0.24
Low -0.01 -0.09 0.30 0.02 -0.06 0.03
Ambiguous goals & solutions
High 0.69 0.46 0.06 0.49 0.74 0.47
C-level Average 0.37 0.17 0.16 0.26 0.37 0.26
Low 0.04 -0.11 0.25 0.04 0.00 0.06
Volatile objectives
High 0.61 0.24 0.14 0.36 0.53 0.38
C-level Average 0.38 0.14 0.14 0.26 0.35 0.26
Low 0.14 0.04 0.14 0.16 0.17 0.14
Strategic
High 0.57 0.28 0.08 0.42 0.62 0.38
C-level Average 0.38 0.17 0.16 0.28 0.39 0.27
Low 0.19 0.05 0.23 0.14 0.17 0.15
Depth/Expert High -0.07 -0.14 0.52 -0.07 -0.02 0.03
C-level Average 0.40 0.19 0.07 0.30 0.41 0.27
Low 0.88 0.53 -0.37 0.67 0.84 0.51
Management level CEO 0.70 0.15 0.14 0.48 0.72 0.44
C-level/SVP 0.54 0.15 0.14 0.38 0.55 0.35
VP 0.38 0.15 0.14 0.28 0.38 0.26
Director 0.22 0.15 0.14 0.18 0.21 0.17
Note. N = 2001 upper-level managerial personnel. High, average, and low levels on work-analysis are approximate 95th, 50th, and 5th percentiles of C-level participants, respectively. Engagement is binary coded such that respondents are either high (> = 70th percentile) or not (< 70th percentile). Unequal within work-analysis variable betas are significantly different at p < .10 at least. AD = Adaptability; CU = Curiosity; FO = Focus; RI = Risk-taking; TA = Tolerance of ambiguity.
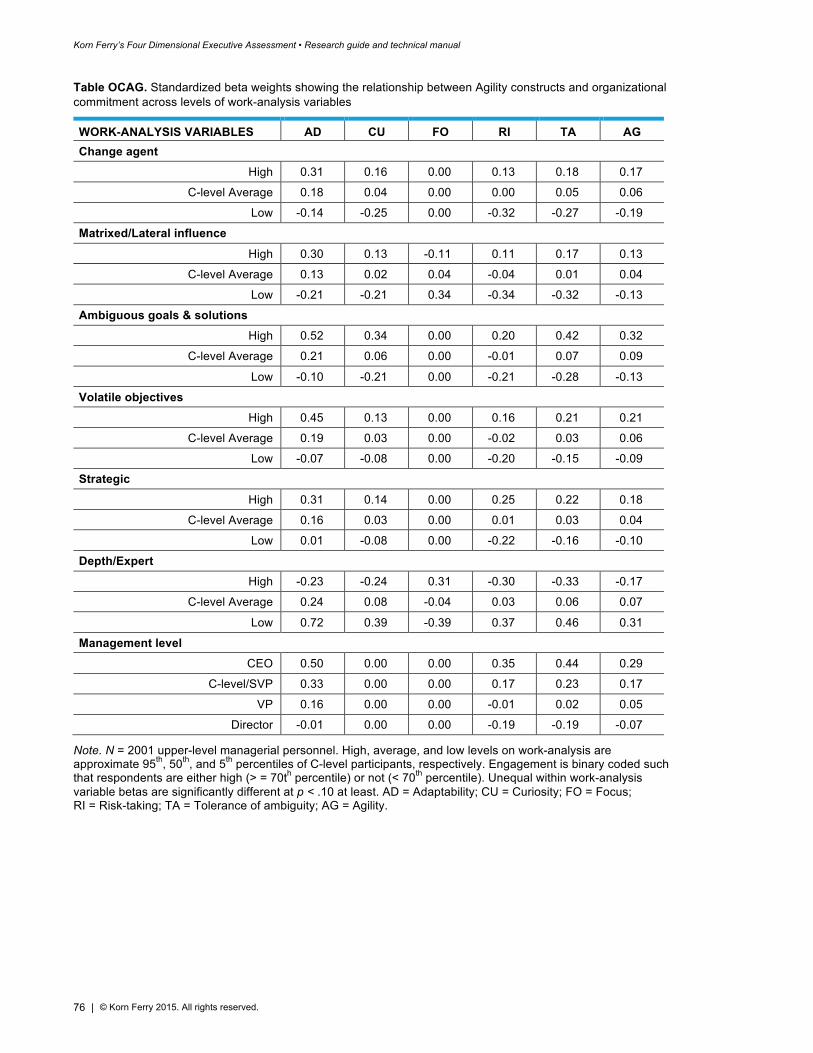
Korn Ferry’s Four Dimensional Executive Assessment • Research guide and technical manual
76 | © Korn Ferry 2015. All rights reserved.
Table OCAG. Standardized beta weights showing the relationship between Agility constructs and organizational commitment across levels of work-analysis variables
WORK-ANALYSIS VARIABLES AD CU FO RI TA AG Change agent
High 0.31 0.16 0.00 0.13 0.18 0.17
C-level Average 0.18 0.04 0.00 0.00 0.05 0.06
Low -0.14 -0.25 0.00 -0.32 -0.27 -0.19
Matrixed/Lateral influence
High 0.30 0.13 -0.11 0.11 0.17 0.13
C-level Average 0.13 0.02 0.04 -0.04 0.01 0.04
Low -0.21 -0.21 0.34 -0.34 -0.32 -0.13
Ambiguous goals & solutions
High 0.52 0.34 0.00 0.20 0.42 0.32
C-level Average 0.21 0.06 0.00 -0.01 0.07 0.09
Low -0.10 -0.21 0.00 -0.21 -0.28 -0.13
Volatile objectives
High 0.45 0.13 0.00 0.16 0.21 0.21
C-level Average 0.19 0.03 0.00 -0.02 0.03 0.06
Low -0.07 -0.08 0.00 -0.20 -0.15 -0.09
Strategic
High 0.31 0.14 0.00 0.25 0.22 0.18
C-level Average 0.16 0.03 0.00 0.01 0.03 0.04
Low 0.01 -0.08 0.00 -0.22 -0.16 -0.10
Depth/Expert High -0.23 -0.24 0.31 -0.30 -0.33 -0.17
C-level Average 0.24 0.08 -0.04 0.03 0.06 0.07
Low 0.72 0.39 -0.39 0.37 0.46 0.31
Management level CEO 0.50 0.00 0.00 0.35 0.44 0.29
C-level/SVP 0.33 0.00 0.00 0.17 0.23 0.17
VP 0.16 0.00 0.00 -0.01 0.02 0.05
Director -0.01 0.00 0.00 -0.19 -0.19 -0.07
Note. N = 2001 upper-level managerial personnel. High, average, and low levels on work-analysis are approximate 95th, 50th, and 5th percentiles of C-level participants, respectively. Engagement is binary coded such that respondents are either high (> = 70th percentile) or not (< 70th percentile). Unequal within work-analysis variable betas are significantly different at p < .10 at least. AD = Adaptability; CU = Curiosity; FO = Focus; RI = Risk-taking; TA = Tolerance of ambiguity; AG = Agility.
Korn Ferry’s Four Dimensional Executive Assessment • Research guide and technical manual
77 | © Korn Ferry 2015. All rights reserved.
Agility constructs and organizational commitment (OC) show relationship patterns (Table OCAG) similar to those observed between Agility and WE, although β values at C-level and C-level work-analysis averages overall tend to be higher for the latter (mean βAD = .40; mean βCU = .16; mean βFO = .13; mean βRI = .29; mean βTA = .41; mean βAG_OVERALL = .28)34 than for the former (mean βAD = .21; mean βCU = .03; mean βFO = 0; mean βRI = .03; mean βTA = .07; mean βAG_OVERALL = .07). In no cases were non-zero relationships between OC and Agility constructs unmoderated. The most consistent relationships were seen between OC and Adaptability. CEOs and C-level leaders are typically and notably more committed to their organizations when they are more adaptable (β = .50 and β = .33, respectively). When jobs present with high change orientation, quick-changing objectives, ambiguity, and other components of transformational demands, Adaptability becomes a particularly salient trait for leaders’ commitment. For both management level and work-analysis dimensions, Risk-taking, Tolerance of ambiguity, and overall Agility show similar although somewhat less pronounced increases in salience vis-à-vis OC. In contrast, Curiosity and Focus do not become more salient for leaders’ organizational commitment or work engagement as management level increases.
Social leadership traits. Table WESL shows correlations between Social leadership constructs and WE. The Social leadership composite variable shows a positive relationship to WE at C-level averages of each work-analysis variable. When roles become more change oriented and generally transformational, Social leadership and its sub-domains show increases in magnitude vis-à-vis relationships with WE in most cases. As seen previously with Agility and Agility sub-domains, the moderating effect of depth/expert is particularly notable. Increases in depth/expert orientation are typically associated with decreases in the salience of Social leadership variables, and this is particularly evident with traits including Affiliation and Influence. At markedly low levels of depth/expert orientation, leaders having 70th percentile or higher scores in work engagement typically have Affiliation and Influence scores that are approximately one-half standard deviation higher on each. When depth/expert orientation is markedly high, however, Affiliation and Influence show negligible and near zero (β = -.03 and β = .04, respectively) association with WE. Composure, Influence, and overall Social leadership also show notable increases in salience among higher-level leaders, although the impact of each on WE remains non-zero and positive at lower levels as well. As might be expected, jobs characterized by different levels of ambiguity in goals and solutions do not tend to moderate the salience of Social leadership constructs vis-à-vis WE (with the exception of Affiliation). This stands in notable contrast to what was seen and expectable in Table WEAG where the extent to which roles involved ambiguous goals and solutions showed a strong moderating influence on Agility constructs—constructs which clearly and even by definition are more related to the degree to which individuals need clarity or are otherwise able to take risks, adapt to the unknown, and navigate ambiguous circumstances comfortably. Notably absent in Table WESL were strong and pervasive bivariate relationships between Situational self-awareness and WE and, to a lesser extent, between Composure and WE. The latter relationship became notably non-zero only when management levels were higher and strategic orientation was markedly high.
Composure and Situational self-awareness, however, did show a greater preponderance of (modest yet significant) association to OC than with WE, as shown in Table OCSL. The impact of Composure on OC was positive and larger to the extent that jobs involved managing quick-changing market-reactive objectives. In all other cases, the positive and modest impact of both Composure and Situational self-awareness on OC were unmoderated. Empathy was more predictive of OC than it was WE, having non-zero and positive βs in every unmoderated case and, as might be expected, being increasingly salient when roles demanded high lateral influence and high social/breadth orientation. Influence and Affiliation are moderated similarly, in addition to having increasing salience vis-à-vis OC when jobs are more strategic and ambiguous in terms of goals and solutions. Across management levels, Social leadership and each of its sub-domains have a positive and similar impact on OC, although influence seems increasingly salient at higher levels of management and may become negligibly or non-predictive of OC at markedly low leadership/management levels.
34 These values summarize the standardized beta weights relating work engagement to each sub-component of Agility, as well as overall Agility, at the mean level of all work-analysis variables and the C-level management level. That is, each mean β is the average of the all beta weights at the average level of the work-analysis variables and at the C-level management level for a given sub-component, or the overall trait.
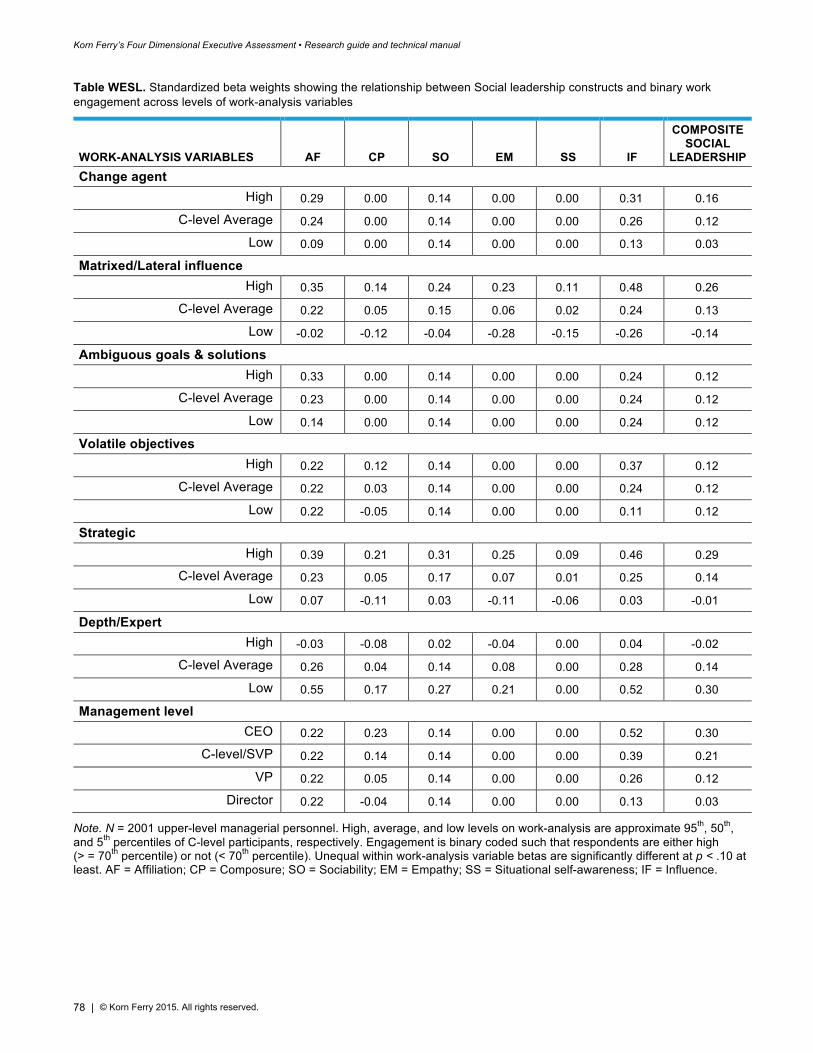
Korn Ferry’s Four Dimensional Executive Assessment • Research guide and technical manual
78 | © Korn Ferry 2015. All rights reserved.
Table WESL. Standardized beta weights showing the relationship between Social leadership constructs and binary work engagement across levels of work-analysis variables
WORK-ANALYSIS VARIABLES AF CP SO EM SS IF
COMPOSITE SOCIAL
LEADERSHIP Change agent
High 0.29 0.00 0.14 0.00 0.00 0.31 0.16
C-level Average 0.24 0.00 0.14 0.00 0.00 0.26 0.12
Low 0.09 0.00 0.14 0.00 0.00 0.13 0.03
Matrixed/Lateral influence
High 0.35 0.14 0.24 0.23 0.11 0.48 0.26
C-level Average 0.22 0.05 0.15 0.06 0.02 0.24 0.13
Low -0.02 -0.12 -0.04 -0.28 -0.15 -0.26 -0.14
Ambiguous goals & solutions
High 0.33 0.00 0.14 0.00 0.00 0.24 0.12
C-level Average 0.23 0.00 0.14 0.00 0.00 0.24 0.12
Low 0.14 0.00 0.14 0.00 0.00 0.24 0.12
Volatile objectives
High 0.22 0.12 0.14 0.00 0.00 0.37 0.12
C-level Average 0.22 0.03 0.14 0.00 0.00 0.24 0.12
Low 0.22 -0.05 0.14 0.00 0.00 0.11 0.12
Strategic
High 0.39 0.21 0.31 0.25 0.09 0.46 0.29
C-level Average 0.23 0.05 0.17 0.07 0.01 0.25 0.14
Low 0.07 -0.11 0.03 -0.11 -0.06 0.03 -0.01
Depth/Expert High -0.03 -0.08 0.02 -0.04 0.00 0.04 -0.02
C-level Average 0.26 0.04 0.14 0.08 0.00 0.28 0.14
Low 0.55 0.17 0.27 0.21 0.00 0.52 0.30
Management level CEO 0.22 0.23 0.14 0.00 0.00 0.52 0.30
C-level/SVP 0.22 0.14 0.14 0.00 0.00 0.39 0.21
VP 0.22 0.05 0.14 0.00 0.00 0.26 0.12
Director 0.22 -0.04 0.14 0.00 0.00 0.13 0.03
Note. N = 2001 upper-level managerial personnel. High, average, and low levels on work-analysis are approximate 95th, 50th, and 5th percentiles of C-level participants, respectively. Engagement is binary coded such that respondents are either high (> = 70th percentile) or not (< 70th percentile). Unequal within work-analysis variable betas are significantly different at p < .10 at least. AF = Affiliation; CP = Composure; SO = Sociability; EM = Empathy; SS = Situational self-awareness; IF = Influence.
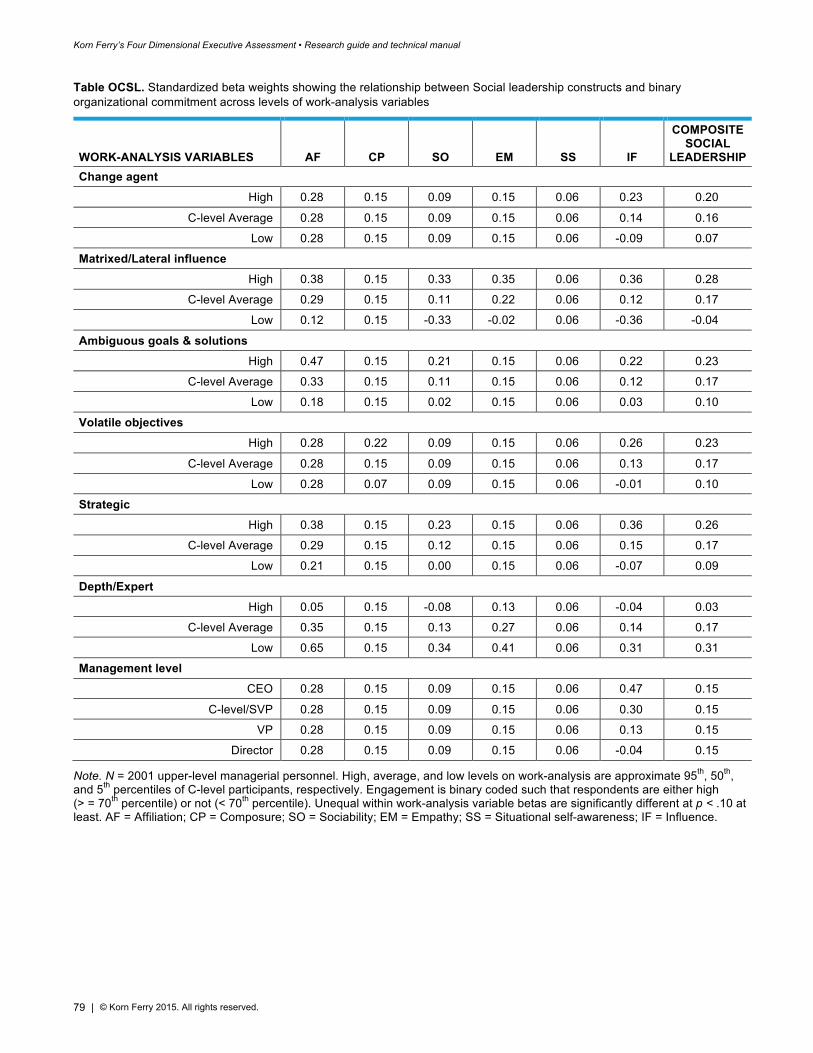
Korn Ferry’s Four Dimensional Executive Assessment • Research guide and technical manual
79 | © Korn Ferry 2015. All rights reserved.
Table OCSL. Standardized beta weights showing the relationship between Social leadership constructs and binary organizational commitment across levels of work-analysis variables
WORK-ANALYSIS VARIABLES AF CP SO EM SS IF
COMPOSITE SOCIAL
LEADERSHIP Change agent
High 0.28 0.15 0.09 0.15 0.06 0.23 0.20
C-level Average 0.28 0.15 0.09 0.15 0.06 0.14 0.16
Low 0.28 0.15 0.09 0.15 0.06 -0.09 0.07
Matrixed/Lateral influence
High 0.38 0.15 0.33 0.35 0.06 0.36 0.28
C-level Average 0.29 0.15 0.11 0.22 0.06 0.12 0.17
Low 0.12 0.15 -0.33 -0.02 0.06 -0.36 -0.04
Ambiguous goals & solutions
High 0.47 0.15 0.21 0.15 0.06 0.22 0.23
C-level Average 0.33 0.15 0.11 0.15 0.06 0.12 0.17
Low 0.18 0.15 0.02 0.15 0.06 0.03 0.10
Volatile objectives
High 0.28 0.22 0.09 0.15 0.06 0.26 0.23
C-level Average 0.28 0.15 0.09 0.15 0.06 0.13 0.17
Low 0.28 0.07 0.09 0.15 0.06 -0.01 0.10
Strategic
High 0.38 0.15 0.23 0.15 0.06 0.36 0.26
C-level Average 0.29 0.15 0.12 0.15 0.06 0.15 0.17
Low 0.21 0.15 0.00 0.15 0.06 -0.07 0.09
Depth/Expert High 0.05 0.15 -0.08 0.13 0.06 -0.04 0.03
C-level Average 0.35 0.15 0.13 0.27 0.06 0.14 0.17
Low 0.65 0.15 0.34 0.41 0.06 0.31 0.31
Management level CEO 0.28 0.15 0.09 0.15 0.06 0.47 0.15
C-level/SVP 0.28 0.15 0.09 0.15 0.06 0.30 0.15
VP 0.28 0.15 0.09 0.15 0.06 0.13 0.15
Director 0.28 0.15 0.09 0.15 0.06 -0.04 0.15
Note. N = 2001 upper-level managerial personnel. High, average, and low levels on work-analysis are approximate 95th, 50th, and 5th percentiles of C-level participants, respectively. Engagement is binary coded such that respondents are either high (> = 70th percentile) or not (< 70th percentile). Unequal within work-analysis variable betas are significantly different at p < .10 at least. AF = Affiliation; CP = Composure; SO = Sociability; EM = Empathy; SS = Situational self-awareness; IF = Influence.
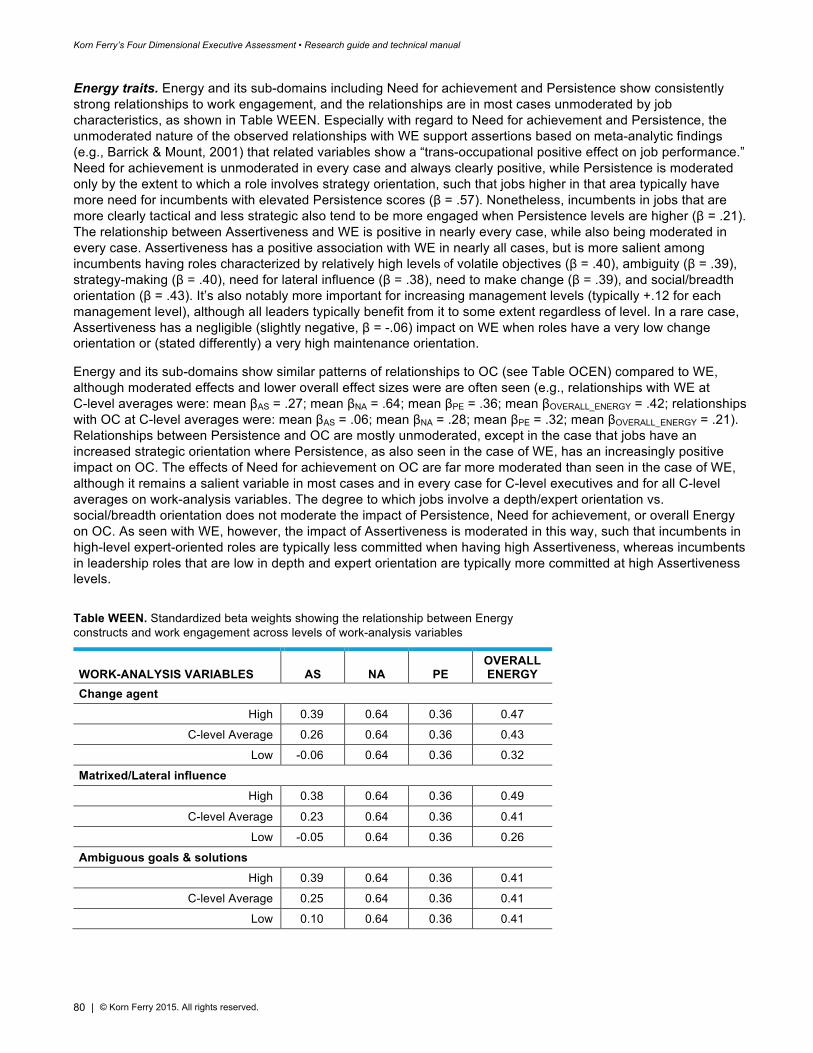
Korn Ferry’s Four Dimensional Executive Assessment • Research guide and technical manual
80 | © Korn Ferry 2015. All rights reserved.
Energy traits. Energy and its sub-domains including Need for achievement and Persistence show consistently strong relationships to work engagement, and the relationships are in most cases unmoderated by job characteristics, as shown in Table WEEN. Especially with regard to Need for achievement and Persistence, the unmoderated nature of the observed relationships with WE support assertions based on meta-analytic findings (e.g., Barrick & Mount, 2001) that related variables show a “trans-occupational positive effect on job performance.” Need for achievement is unmoderated in every case and always clearly positive, while Persistence is moderated only by the extent to which a role involves strategy orientation, such that jobs higher in that area typically have more need for incumbents with elevated Persistence scores (β = .57). Nonetheless, incumbents in jobs that are more clearly tactical and less strategic also tend to be more engaged when Persistence levels are higher (β = .21). The relationship between Assertiveness and WE is positive in nearly every case, while also being moderated in every case. Assertiveness has a positive association with WE in nearly all cases, but is more salient among incumbents having roles characterized by relatively high levels of volatile objectives (β = .40), ambiguity (β = .39), strategy-making (β = .40), need for lateral influence (β = .38), need to make change (β = .39), and social/breadth orientation (β = .43). It’s also notably more important for increasing management levels (typically +.12 for each management level), although all leaders typically benefit from it to some extent regardless of level. In a rare case, Assertiveness has a negligible (slightly negative, β = -.06) impact on WE when roles have a very low change orientation or (stated differently) a very high maintenance orientation.
Energy and its sub-domains show similar patterns of relationships to OC (see Table OCEN) compared to WE, although moderated effects and lower overall effect sizes were are often seen (e.g., relationships with WE at C-level averages were: mean βAS = .27; mean βNA = .64; mean βPE = .36; mean βOVERALL_ENERGY = .42; relationships with OC at C-level averages were: mean βAS = .06; mean βNA = .28; mean βPE = .32; mean βOVERALL_ENERGY = .21). Relationships between Persistence and OC are mostly unmoderated, except in the case that jobs have an increased strategic orientation where Persistence, as also seen in the case of WE, has an increasingly positive impact on OC. The effects of Need for achievement on OC are far more moderated than seen in the case of WE, although it remains a salient variable in most cases and in every case for C-level executives and for all C-level averages on work-analysis variables. The degree to which jobs involve a depth/expert orientation vs. social/breadth orientation does not moderate the impact of Persistence, Need for achievement, or overall Energy on OC. As seen with WE, however, the impact of Assertiveness is moderated in this way, such that incumbents in high-level expert-oriented roles are typically less committed when having high Assertiveness, whereas incumbents in leadership roles that are low in depth and expert orientation are typically more committed at high Assertiveness levels.
Table WEEN. Standardized beta weights showing the relationship between Energy constructs and work engagement across levels of work-analysis variables
WORK-ANALYSIS VARIABLES AS NA PE OVERALL ENERGY
Change agent High 0.39 0.64 0.36 0.47
C-level Average 0.26 0.64 0.36 0.43
Low -0.06 0.64 0.36 0.32
Matrixed/Lateral influence
High 0.38 0.64 0.36 0.49
C-level Average 0.23 0.64 0.36 0.41
Low -0.05 0.64 0.36 0.26
Ambiguous goals & solutions
High 0.39 0.64 0.36 0.41
C-level Average 0.25 0.64 0.36 0.41
Low 0.10 0.64 0.36 0.41
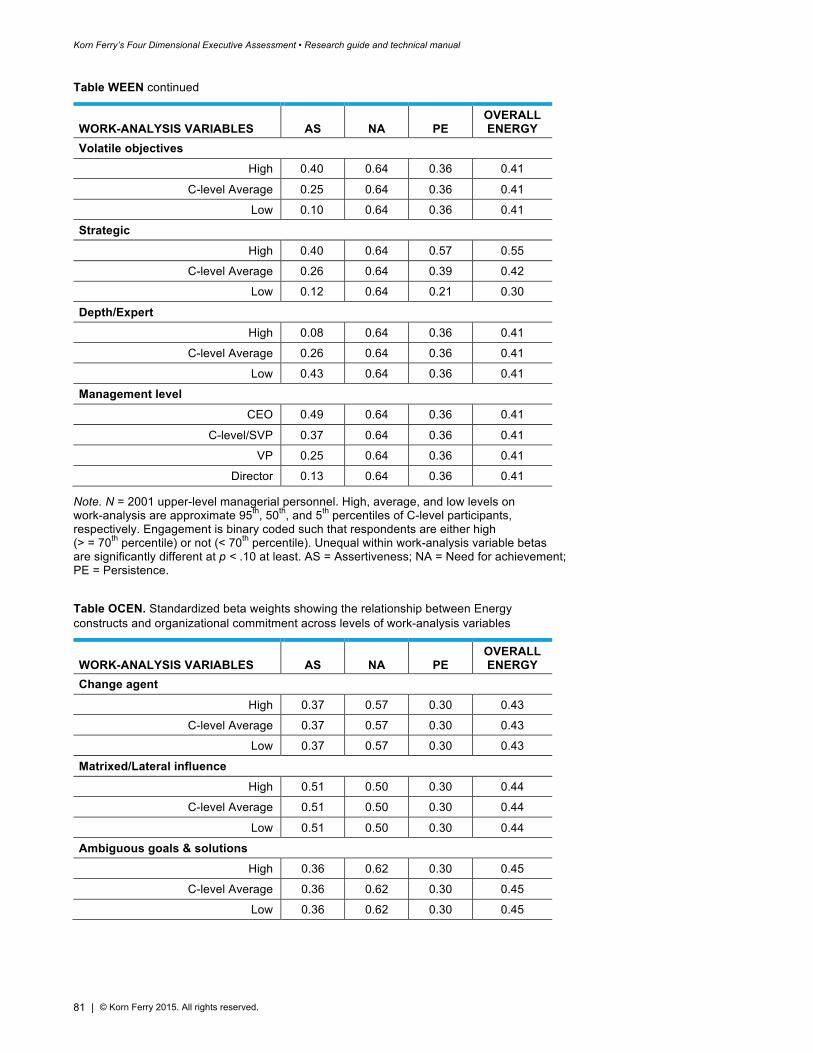
Korn Ferry’s Four Dimensional Executive Assessment • Research guide and technical manual
81 | © Korn Ferry 2015. All rights reserved.
Table WEEN continued
WORK-ANALYSIS VARIABLES AS NA PE OVERALL ENERGY
Volatile objectives
High 0.40 0.64 0.36 0.41
C-level Average 0.25 0.64 0.36 0.41
Low 0.10 0.64 0.36 0.41
Strategic
High 0.40 0.64 0.57 0.55
C-level Average 0.26 0.64 0.39 0.42
Low 0.12 0.64 0.21 0.30
Depth/Expert High 0.08 0.64 0.36 0.41
C-level Average 0.26 0.64 0.36 0.41
Low 0.43 0.64 0.36 0.41
Management level CEO 0.49 0.64 0.36 0.41
C-level/SVP 0.37 0.64 0.36 0.41
VP 0.25 0.64 0.36 0.41
Director 0.13 0.64 0.36 0.41
Note. N = 2001 upper-level managerial personnel. High, average, and low levels on work-analysis are approximate 95th, 50th, and 5th percentiles of C-level participants, respectively. Engagement is binary coded such that respondents are either high (> = 70th percentile) or not (< 70th percentile). Unequal within work-analysis variable betas are significantly different at p < .10 at least. AS = Assertiveness; NA = Need for achievement; PE = Persistence.
Table OCEN. Standardized beta weights showing the relationship between Energy constructs and organizational commitment across levels of work-analysis variables
WORK-ANALYSIS VARIABLES AS NA PE OVERALL ENERGY
Change agent
High 0.37 0.57 0.30 0.43
C-level Average 0.37 0.57 0.30 0.43
Low 0.37 0.57 0.30 0.43
Matrixed/Lateral influence
High 0.51 0.50 0.30 0.44
C-level Average 0.51 0.50 0.30 0.44
Low 0.51 0.50 0.30 0.44
Ambiguous goals & solutions
High 0.36 0.62 0.30 0.45
C-level Average 0.36 0.62 0.30 0.45
Low 0.36 0.62 0.30 0.45
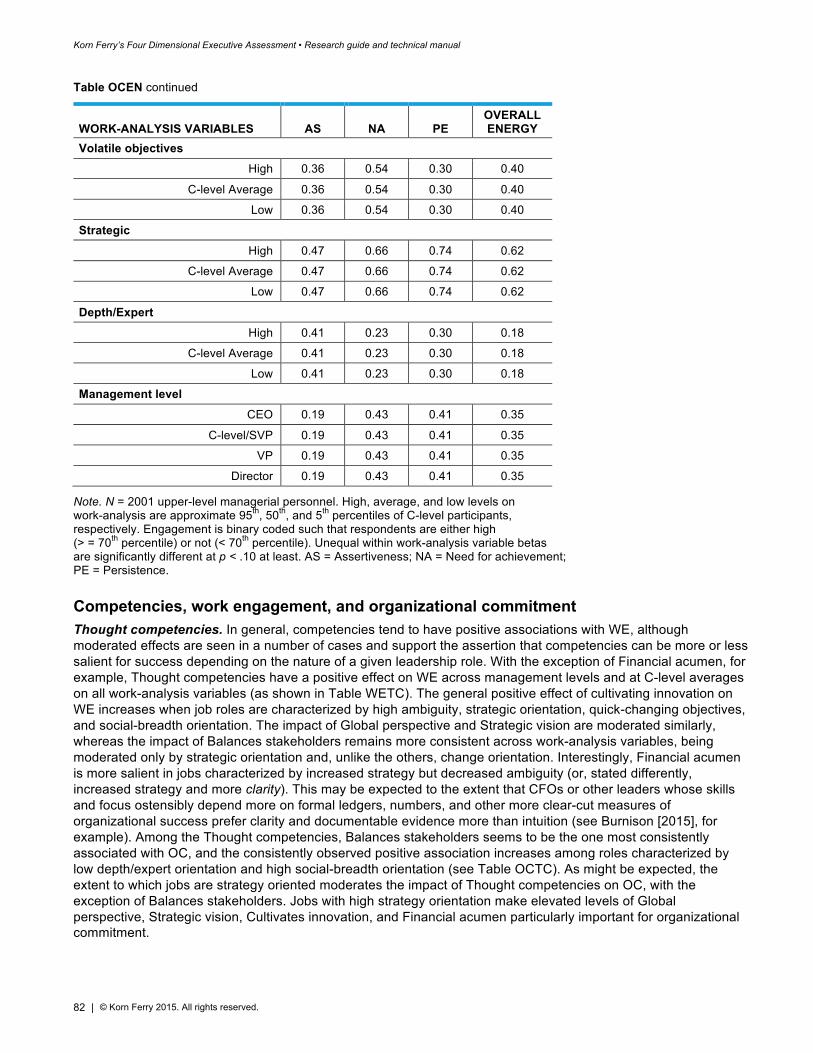
Korn Ferry’s Four Dimensional Executive Assessment • Research guide and technical manual
82 | © Korn Ferry 2015. All rights reserved.
Table OCEN continued
WORK-ANALYSIS VARIABLES AS NA PE OVERALL ENERGY
Volatile objectives
High 0.36 0.54 0.30 0.40
C-level Average 0.36 0.54 0.30 0.40
Low 0.36 0.54 0.30 0.40
Strategic
High 0.47 0.66 0.74 0.62
C-level Average 0.47 0.66 0.74 0.62
Low 0.47 0.66 0.74 0.62
Depth/Expert High 0.41 0.23 0.30 0.18
C-level Average 0.41 0.23 0.30 0.18
Low 0.41 0.23 0.30 0.18
Management level CEO 0.19 0.43 0.41 0.35
C-level/SVP 0.19 0.43 0.41 0.35
VP 0.19 0.43 0.41 0.35
Director 0.19 0.43 0.41 0.35
Note. N = 2001 upper-level managerial personnel. High, average, and low levels on work-analysis are approximate 95th, 50th, and 5th percentiles of C-level participants, respectively. Engagement is binary coded such that respondents are either high (> = 70th percentile) or not (< 70th percentile). Unequal within work-analysis variable betas are significantly different at p < .10 at least. AS = Assertiveness; NA = Need for achievement; PE = Persistence.
Competencies, work engagement, and organizational commitment Thought competencies. In general, competencies tend to have positive associations with WE, although moderated effects are seen in a number of cases and support the assertion that competencies can be more or less salient for success depending on the nature of a given leadership role. With the exception of Financial acumen, for example, Thought competencies have a positive effect on WE across management levels and at C-level averages on all work-analysis variables (as shown in Table WETC). The general positive effect of cultivating innovation on WE increases when job roles are characterized by high ambiguity, strategic orientation, quick-changing objectives, and social-breadth orientation. The impact of Global perspective and Strategic vision are moderated similarly, whereas the impact of Balances stakeholders remains more consistent across work-analysis variables, being moderated only by strategic orientation and, unlike the others, change orientation. Interestingly, Financial acumen is more salient in jobs characterized by increased strategy but decreased ambiguity (or, stated differently, increased strategy and more clarity). This may be expected to the extent that CFOs or other leaders whose skills and focus ostensibly depend more on formal ledgers, numbers, and other more clear-cut measures of organizational success prefer clarity and documentable evidence more than intuition (see Burnison [2015], for example). Among the Thought competencies, Balances stakeholders seems to be the one most consistently associated with OC, and the consistently observed positive association increases among roles characterized by low depth/expert orientation and high social-breadth orientation (see Table OCTC). As might be expected, the extent to which jobs are strategy oriented moderates the impact of Thought competencies on OC, with the exception of Balances stakeholders. Jobs with high strategy orientation make elevated levels of Global perspective, Strategic vision, Cultivates innovation, and Financial acumen particularly important for organizational commitment.
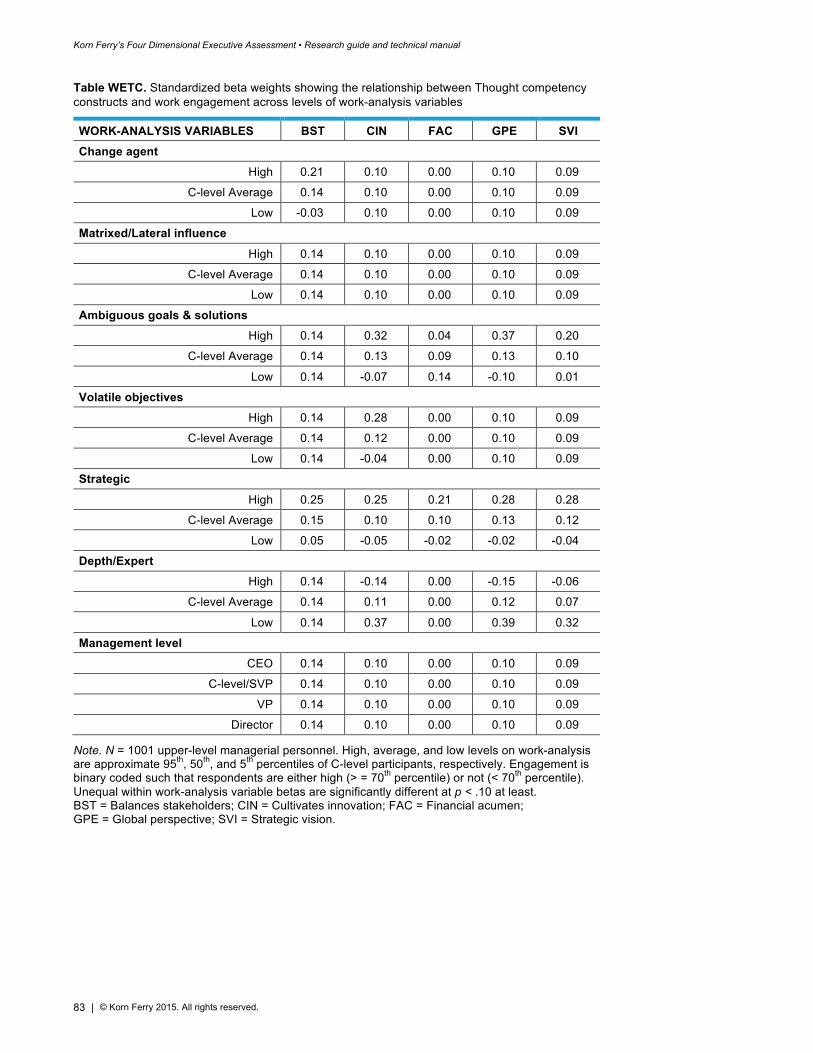
Korn Ferry’s Four Dimensional Executive Assessment • Research guide and technical manual
83 | © Korn Ferry 2015. All rights reserved.
Table WETC. Standardized beta weights showing the relationship between Thought competency constructs and work engagement across levels of work-analysis variables
WORK-ANALYSIS VARIABLES BST CIN FAC GPE SVI Change agent
High 0.21 0.10 0.00 0.10 0.09
C-level Average 0.14 0.10 0.00 0.10 0.09
Low -0.03 0.10 0.00 0.10 0.09
Matrixed/Lateral influence
High 0.14 0.10 0.00 0.10 0.09
C-level Average 0.14 0.10 0.00 0.10 0.09
Low 0.14 0.10 0.00 0.10 0.09
Ambiguous goals & solutions
High 0.14 0.32 0.04 0.37 0.20
C-level Average 0.14 0.13 0.09 0.13 0.10
Low 0.14 -0.07 0.14 -0.10 0.01
Volatile objectives
High 0.14 0.28 0.00 0.10 0.09
C-level Average 0.14 0.12 0.00 0.10 0.09
Low 0.14 -0.04 0.00 0.10 0.09
Strategic
High 0.25 0.25 0.21 0.28 0.28
C-level Average 0.15 0.10 0.10 0.13 0.12
Low 0.05 -0.05 -0.02 -0.02 -0.04
Depth/Expert High 0.14 -0.14 0.00 -0.15 -0.06
C-level Average 0.14 0.11 0.00 0.12 0.07
Low 0.14 0.37 0.00 0.39 0.32
Management level CEO 0.14 0.10 0.00 0.10 0.09
C-level/SVP 0.14 0.10 0.00 0.10 0.09
VP 0.14 0.10 0.00 0.10 0.09
Director 0.14 0.10 0.00 0.10 0.09
Note. N = 1001 upper-level managerial personnel. High, average, and low levels on work-analysis are approximate 95th, 50th, and 5th percentiles of C-level participants, respectively. Engagement is binary coded such that respondents are either high (> = 70th percentile) or not (< 70th percentile). Unequal within work-analysis variable betas are significantly different at p < .10 at least. BST = Balances stakeholders; CIN = Cultivates innovation; FAC = Financial acumen; GPE = Global perspective; SVI = Strategic vision.
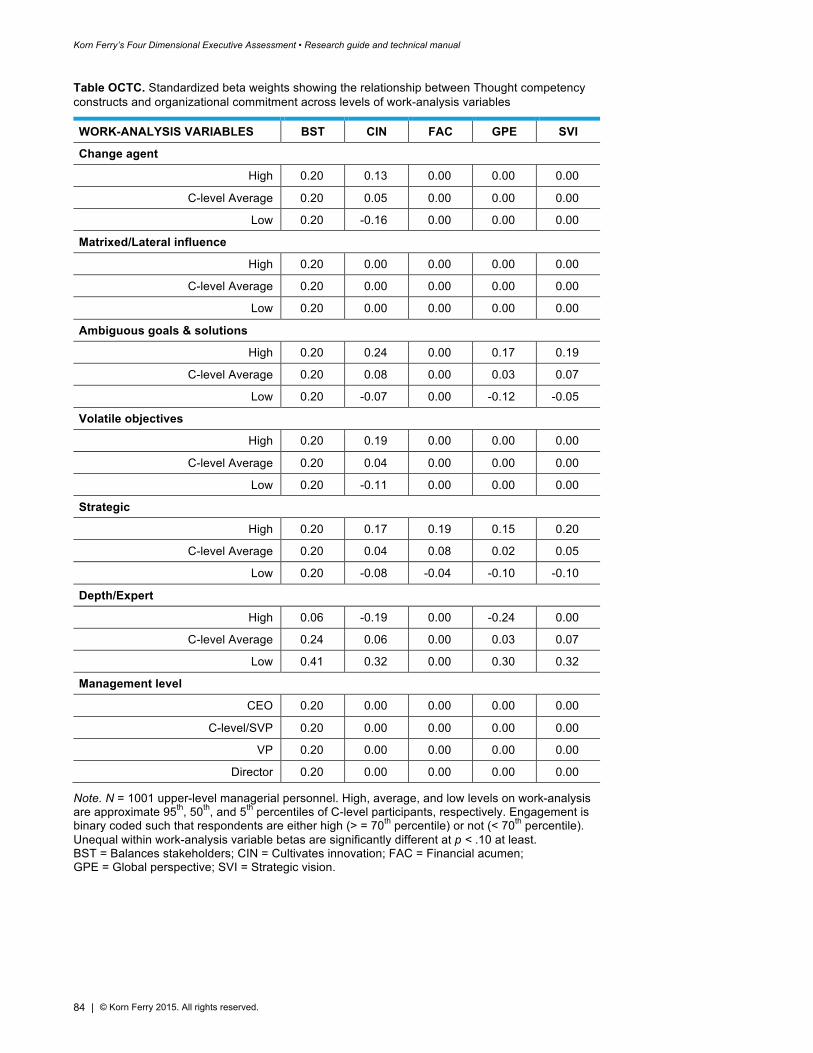
Korn Ferry’s Four Dimensional Executive Assessment • Research guide and technical manual
84 | © Korn Ferry 2015. All rights reserved.
Table OCTC. Standardized beta weights showing the relationship between Thought competency constructs and organizational commitment across levels of work-analysis variables
WORK-ANALYSIS VARIABLES BST CIN FAC GPE SVI
Change agent
High 0.20 0.13 0.00 0.00 0.00
C-level Average 0.20 0.05 0.00 0.00 0.00
Low 0.20 -0.16 0.00 0.00 0.00
Matrixed/Lateral influence
High 0.20 0.00 0.00 0.00 0.00
C-level Average 0.20 0.00 0.00 0.00 0.00
Low 0.20 0.00 0.00 0.00 0.00
Ambiguous goals & solutions
High 0.20 0.24 0.00 0.17 0.19
C-level Average 0.20 0.08 0.00 0.03 0.07
Low 0.20 -0.07 0.00 -0.12 -0.05
Volatile objectives
High 0.20 0.19 0.00 0.00 0.00
C-level Average 0.20 0.04 0.00 0.00 0.00
Low 0.20 -0.11 0.00 0.00 0.00
Strategic
High 0.20 0.17 0.19 0.15 0.20
C-level Average 0.20 0.04 0.08 0.02 0.05
Low 0.20 -0.08 -0.04 -0.10 -0.10
Depth/Expert
High 0.06 -0.19 0.00 -0.24 0.00
C-level Average 0.24 0.06 0.00 0.03 0.07
Low 0.41 0.32 0.00 0.30 0.32
Management level
CEO 0.20 0.00 0.00 0.00 0.00
C-level/SVP 0.20 0.00 0.00 0.00 0.00
VP 0.20 0.00 0.00 0.00 0.00
Director 0.20 0.00 0.00 0.00 0.00
Note. N = 1001 upper-level managerial personnel. High, average, and low levels on work-analysis are approximate 95th, 50th, and 5th percentiles of C-level participants, respectively. Engagement is binary coded such that respondents are either high (> = 70th percentile) or not (< 70th percentile). Unequal within work-analysis variable betas are significantly different at p < .10 at least. BST = Balances stakeholders; CIN = Cultivates innovation; FAC = Financial acumen; GPE = Global perspective; SVI = Strategic vision.
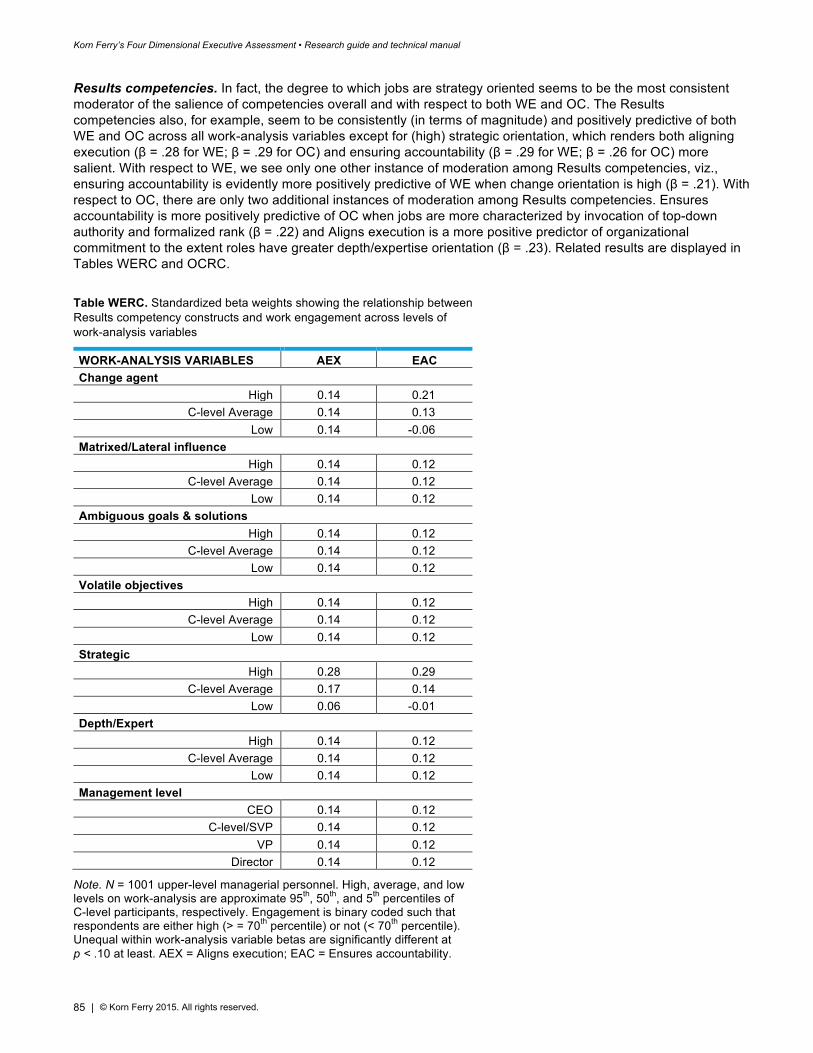
Korn Ferry’s Four Dimensional Executive Assessment • Research guide and technical manual
85 | © Korn Ferry 2015. All rights reserved.
Results competencies. In fact, the degree to which jobs are strategy oriented seems to be the most consistent moderator of the salience of competencies overall and with respect to both WE and OC. The Results competencies also, for example, seem to be consistently (in terms of magnitude) and positively predictive of both WE and OC across all work-analysis variables except for (high) strategic orientation, which renders both aligning execution (β = .28 for WE; β = .29 for OC) and ensuring accountability (β = .29 for WE; β = .26 for OC) more salient. With respect to WE, we see only one other instance of moderation among Results competencies, viz., ensuring accountability is evidently more positively predictive of WE when change orientation is high (β = .21). With respect to OC, there are only two additional instances of moderation among Results competencies. Ensures accountability is more positively predictive of OC when jobs are more characterized by invocation of top-down authority and formalized rank (β = .22) and Aligns execution is a more positive predictor of organizational commitment to the extent roles have greater depth/expertise orientation (β = .23). Related results are displayed in Tables WERC and OCRC.
Table WERC. Standardized beta weights showing the relationship between Results competency constructs and work engagement across levels of work-analysis variables
WORK-ANALYSIS VARIABLES AEX EAC Change agent
High 0.14 0.21 C-level Average 0.14 0.13
Low 0.14 -0.06 Matrixed/Lateral influence
High 0.14 0.12 C-level Average 0.14 0.12
Low 0.14 0.12 Ambiguous goals & solutions
High 0.14 0.12 C-level Average 0.14 0.12
Low 0.14 0.12 Volatile objectives
High 0.14 0.12 C-level Average 0.14 0.12
Low 0.14 0.12 Strategic
High 0.28 0.29 C-level Average 0.17 0.14
Low 0.06 -0.01 Depth/Expert
High 0.14 0.12 C-level Average 0.14 0.12
Low 0.14 0.12 Management level
CEO 0.14 0.12 C-level/SVP 0.14 0.12
VP 0.14 0.12 Director 0.14 0.12
Note. N = 1001 upper-level managerial personnel. High, average, and low levels on work-analysis are approximate 95th, 50th, and 5th percentiles of C-level participants, respectively. Engagement is binary coded such that respondents are either high (> = 70th percentile) or not (< 70th percentile). Unequal within work-analysis variable betas are significantly different at p < .10 at least. AEX = Aligns execution; EAC = Ensures accountability.
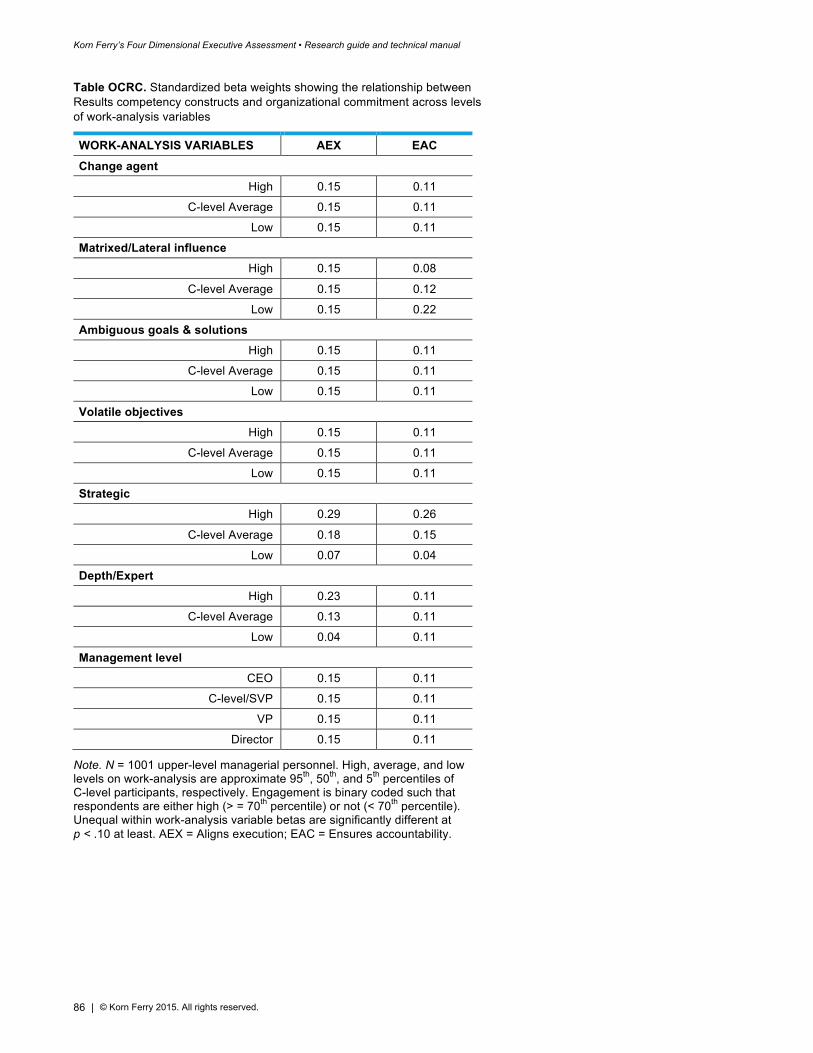
Korn Ferry’s Four Dimensional Executive Assessment • Research guide and technical manual
86 | © Korn Ferry 2015. All rights reserved.
Table OCRC. Standardized beta weights showing the relationship between Results competency constructs and organizational commitment across levels of work-analysis variables
WORK-ANALYSIS VARIABLES AEX EAC
Change agent High 0.15 0.11
C-level Average 0.15 0.11
Low 0.15 0.11
Matrixed/Lateral influence
High 0.15 0.08
C-level Average 0.15 0.12
Low 0.15 0.22
Ambiguous goals & solutions
High 0.15 0.11
C-level Average 0.15 0.11
Low 0.15 0.11
Volatile objectives
High 0.15 0.11
C-level Average 0.15 0.11
Low 0.15 0.11
Strategic
High 0.29 0.26
C-level Average 0.18 0.15
Low 0.07 0.04
Depth/Expert High 0.23 0.11
C-level Average 0.13 0.11
Low 0.04 0.11
Management level CEO 0.15 0.11
C-level/SVP 0.15 0.11
VP 0.15 0.11
Director 0.15 0.11
Note. N = 1001 upper-level managerial personnel. High, average, and low levels on work-analysis are approximate 95th, 50th, and 5th percentiles of C-level participants, respectively. Engagement is binary coded such that respondents are either high (> = 70th percentile) or not (< 70th percentile). Unequal within work-analysis variable betas are significantly different at p < .10 at least. AEX = Aligns execution; EAC = Ensures accountability.
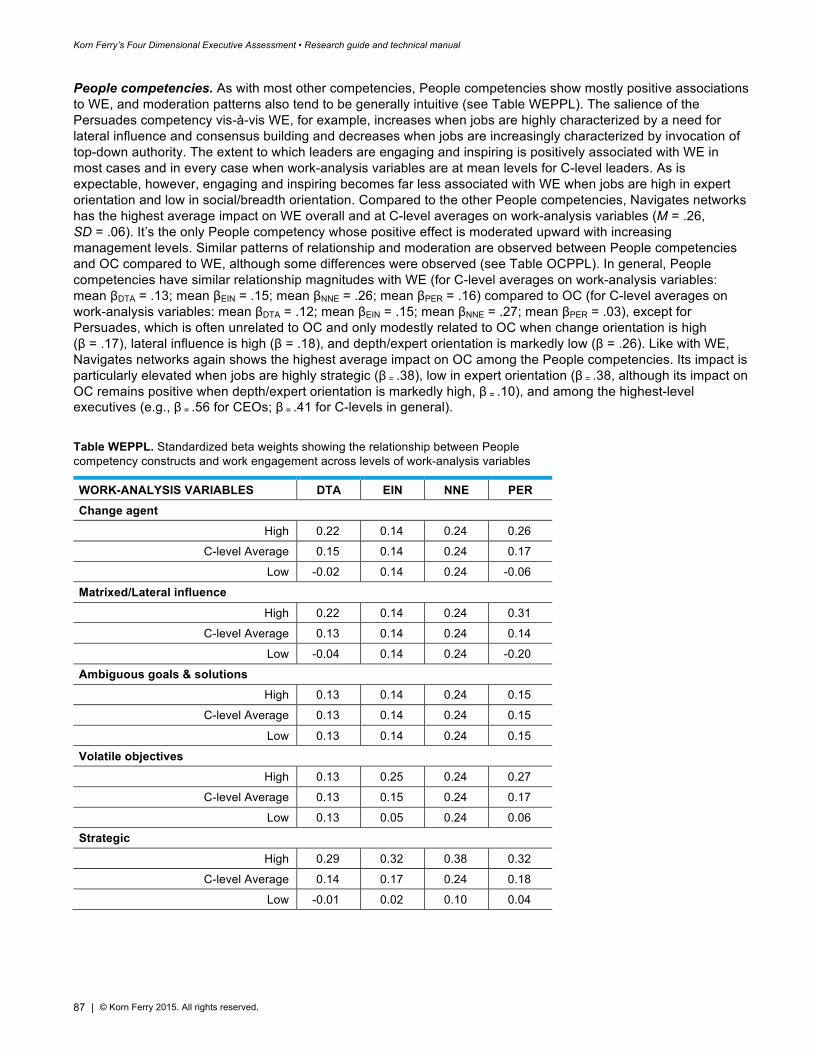
Korn Ferry’s Four Dimensional Executive Assessment • Research guide and technical manual
87 | © Korn Ferry 2015. All rights reserved.
People competencies. As with most other competencies, People competencies show mostly positive associations to WE, and moderation patterns also tend to be generally intuitive (see Table WEPPL). The salience of the Persuades competency vis-à-vis WE, for example, increases when jobs are highly characterized by a need for lateral influence and consensus building and decreases when jobs are increasingly characterized by invocation of top-down authority. The extent to which leaders are engaging and inspiring is positively associated with WE in most cases and in every case when work-analysis variables are at mean levels for C-level leaders. As is expectable, however, engaging and inspiring becomes far less associated with WE when jobs are high in expert orientation and low in social/breadth orientation. Compared to the other People competencies, Navigates networks has the highest average impact on WE overall and at C-level averages on work-analysis variables (M = .26, SD = .06). It’s the only People competency whose positive effect is moderated upward with increasing management levels. Similar patterns of relationship and moderation are observed between People competencies and OC compared to WE, although some differences were observed (see Table OCPPL). In general, People competencies have similar relationship magnitudes with WE (for C-level averages on work-analysis variables: mean βDTA = .13; mean βEIN = .15; mean βNNE = .26; mean βPER = .16) compared to OC (for C-level averages on work-analysis variables: mean βDTA = .12; mean βEIN = .15; mean βNNE = .27; mean βPER = .03), except for Persuades, which is often unrelated to OC and only modestly related to OC when change orientation is high (β = .17), lateral influence is high (β = .18), and depth/expert orientation is markedly low (β = .26). Like with WE, Navigates networks again shows the highest average impact on OC among the People competencies. Its impact is particularly elevated when jobs are highly strategic (β = .38), low in expert orientation (β = .38, although its impact on OC remains positive when depth/expert orientation is markedly high, β = .10), and among the highest-level executives (e.g., β = .56 for CEOs; β = .41 for C-levels in general).
Table WEPPL. Standardized beta weights showing the relationship between People competency constructs and work engagement across levels of work-analysis variables
WORK-ANALYSIS VARIABLES DTA EIN NNE PER Change agent
High 0.22 0.14 0.24 0.26
C-level Average 0.15 0.14 0.24 0.17
Low -0.02 0.14 0.24 -0.06
Matrixed/Lateral influence
High 0.22 0.14 0.24 0.31
C-level Average 0.13 0.14 0.24 0.14
Low -0.04 0.14 0.24 -0.20
Ambiguous goals & solutions
High 0.13 0.14 0.24 0.15
C-level Average 0.13 0.14 0.24 0.15
Low 0.13 0.14 0.24 0.15
Volatile objectives
High 0.13 0.25 0.24 0.27
C-level Average 0.13 0.15 0.24 0.17
Low 0.13 0.05 0.24 0.06
Strategic
High 0.29 0.32 0.38 0.32
C-level Average 0.14 0.17 0.24 0.18
Low -0.01 0.02 0.10 0.04
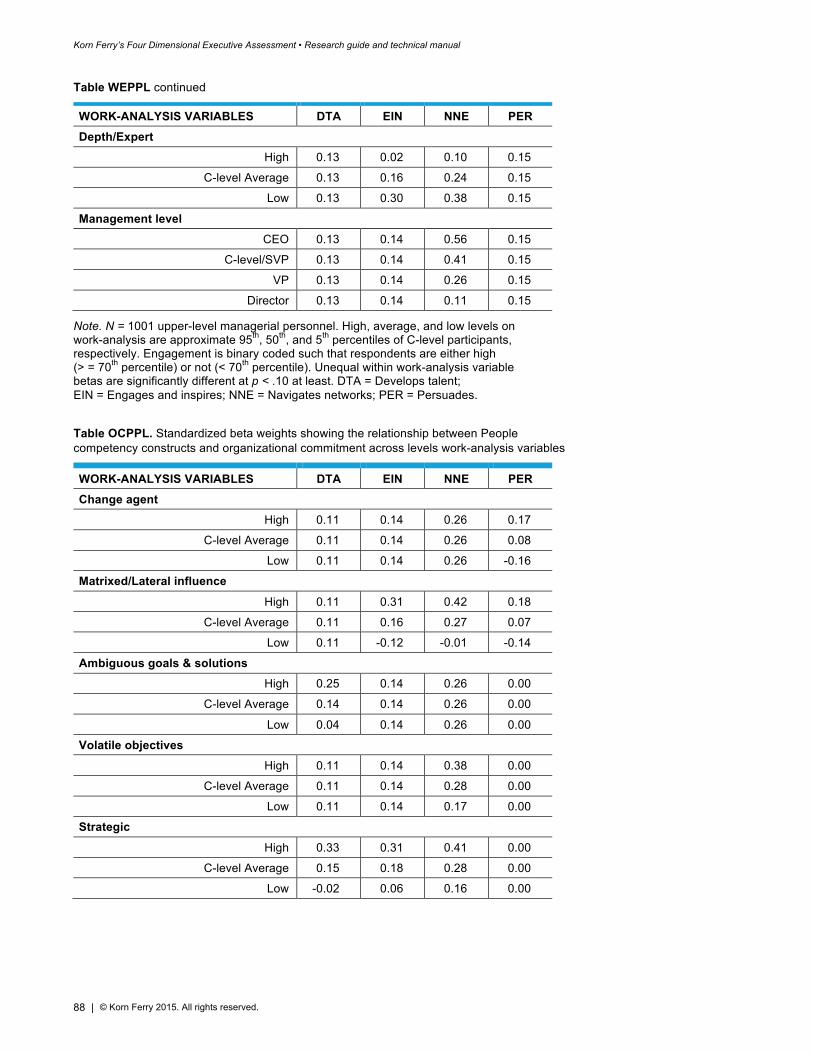
Korn Ferry’s Four Dimensional Executive Assessment • Research guide and technical manual
88 | © Korn Ferry 2015. All rights reserved.
Table WEPPL continued
WORK-ANALYSIS VARIABLES DTA EIN NNE PER Depth/Expert
High 0.13 0.02 0.10 0.15
C-level Average 0.13 0.16 0.24 0.15
Low 0.13 0.30 0.38 0.15
Management level CEO 0.13 0.14 0.56 0.15
C-level/SVP 0.13 0.14 0.41 0.15
VP 0.13 0.14 0.26 0.15
Director 0.13 0.14 0.11 0.15
Note. N = 1001 upper-level managerial personnel. High, average, and low levels on work-analysis are approximate 95th, 50th, and 5th percentiles of C-level participants, respectively. Engagement is binary coded such that respondents are either high (> = 70th percentile) or not (< 70th percentile). Unequal within work-analysis variable betas are significantly different at p < .10 at least. DTA = Develops talent; EIN = Engages and inspires; NNE = Navigates networks; PER = Persuades.
Table OCPPL. Standardized beta weights showing the relationship between People competency constructs and organizational commitment across levels work-analysis variables
WORK-ANALYSIS VARIABLES DTA EIN NNE PER Change agent
High 0.11 0.14 0.26 0.17
C-level Average 0.11 0.14 0.26 0.08
Low 0.11 0.14 0.26 -0.16
Matrixed/Lateral influence
High 0.11 0.31 0.42 0.18
C-level Average 0.11 0.16 0.27 0.07
Low 0.11 -0.12 -0.01 -0.14
Ambiguous goals & solutions
High 0.25 0.14 0.26 0.00
C-level Average 0.14 0.14 0.26 0.00
Low 0.04 0.14 0.26 0.00
Volatile objectives
High 0.11 0.14 0.38 0.00
C-level Average 0.11 0.14 0.28 0.00
Low 0.11 0.14 0.17 0.00
Strategic
High 0.33 0.31 0.41 0.00
C-level Average 0.15 0.18 0.28 0.00
Low -0.02 0.06 0.16 0.00
Korn Ferry’s Four Dimensional Executive Assessment • Research guide and technical manual
89 | © Korn Ferry 2015. All rights reserved.
Table OCPPL continued
WORK-ANALYSIS VARIABLES DTA EIN NNE PER Depth/Expert
High 0.11 0.00 0.26 -0.09
C-level Average 0.11 0.18 0.26 0.09
Low 0.11 0.35 0.26 0.26
Management level CEO 0.11 0.14 0.26 0.00
C-level/SVP 0.11 0.14 0.26 0.00
VP 0.11 0.14 0.26 0.00
Director 0.11 0.14 0.26 0.00
Note. N = 1001 upper-level managerial personnel. High, average, and low levels on work-analysis are approximate 95th, 50th, and 5th percentiles of C-level participants, respectively. Engagement is binary coded such that respondents are either high (> = 70th percentile) or not (< 70th percentile). Unequal within work-analysis variable betas are significantly different at p < .10 at least. DTA = Develops talent; EIN = Engages and inspires; NNE = Navigates networks; PER = Persuades.
Self competencies. Associations between Self competencies and WE are generally positive but also often moderated. More transformational-type role demands tend to render each of them notably more salient with respect to WE. Situational adaptability has a consistently positive and modest effect on WE, which is moderated by the degree to which roles are characterized by a need for lateral influence, volatile objectives, and social/breadth orientation. The lack of moderation by the extent to which roles require change agents may initially seem surprising, but is appropriate based on the previously noted nature of Situational adaptability as being primarily a social adaptability (see competencies descriptions earlier in this technical manual). Unlike Situational adaptability, the effect of Manages ambiguity on WE, as might be expected, is moderated by the degree to which a role is ambiguous in goals and solutions, such that its effect becomes increasingly positive. Nimble learning has no effect on WE in nearly all cases, showing only one modest positive effect on WE, viz., when roles are characterized by quick-changing objectives/high market reactivity. In contrast, Nimble learning is related modestly and positively to OC in every case and is unmoderated in every case, including across management levels. The association between OC and Situational adaptability is again unmoderated by role ambiguity and again moderated by lateral influence levels. With the exception of Nimble learning, all Self competencies become increasingly salient when jobs have low depth/expert orientation. For both OC and WE, the Courage competency becomes markedly more salient at higher levels of management. Additional results showing relationships between Self competencies and WE and between Self competencies and OC can be examined in Tables WESLF and OCSLF.
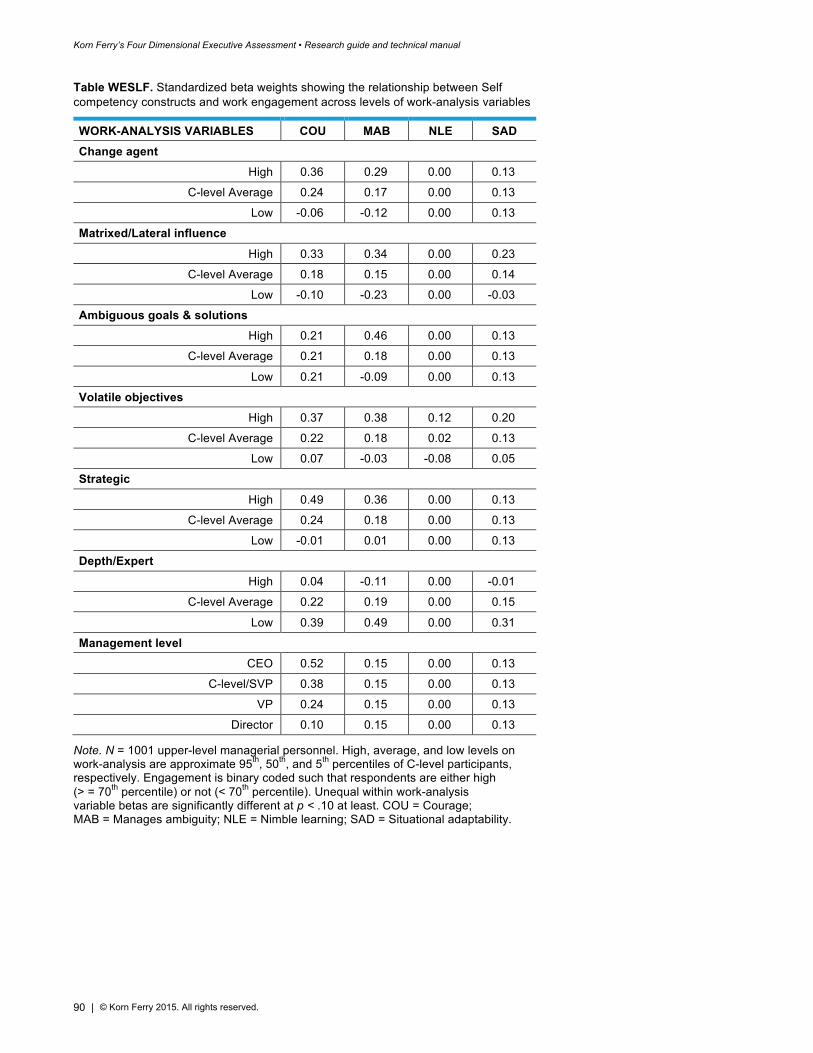
Korn Ferry’s Four Dimensional Executive Assessment • Research guide and technical manual
90 | © Korn Ferry 2015. All rights reserved.
Table WESLF. Standardized beta weights showing the relationship between Self competency constructs and work engagement across levels of work-analysis variables
WORK-ANALYSIS VARIABLES COU MAB NLE SAD Change agent
High 0.36 0.29 0.00 0.13
C-level Average 0.24 0.17 0.00 0.13
Low -0.06 -0.12 0.00 0.13
Matrixed/Lateral influence
High 0.33 0.34 0.00 0.23
C-level Average 0.18 0.15 0.00 0.14
Low -0.10 -0.23 0.00 -0.03
Ambiguous goals & solutions
High 0.21 0.46 0.00 0.13
C-level Average 0.21 0.18 0.00 0.13
Low 0.21 -0.09 0.00 0.13
Volatile objectives
High 0.37 0.38 0.12 0.20
C-level Average 0.22 0.18 0.02 0.13
Low 0.07 -0.03 -0.08 0.05
Strategic
High 0.49 0.36 0.00 0.13
C-level Average 0.24 0.18 0.00 0.13
Low -0.01 0.01 0.00 0.13
Depth/Expert High 0.04 -0.11 0.00 -0.01
C-level Average 0.22 0.19 0.00 0.15
Low 0.39 0.49 0.00 0.31
Management level CEO 0.52 0.15 0.00 0.13
C-level/SVP 0.38 0.15 0.00 0.13
VP 0.24 0.15 0.00 0.13
Director 0.10 0.15 0.00 0.13
Note. N = 1001 upper-level managerial personnel. High, average, and low levels on work-analysis are approximate 95th, 50th, and 5th percentiles of C-level participants, respectively. Engagement is binary coded such that respondents are either high (> = 70th percentile) or not (< 70th percentile). Unequal within work-analysis variable betas are significantly different at p < .10 at least. COU = Courage; MAB = Manages ambiguity; NLE = Nimble learning; SAD = Situational adaptability.
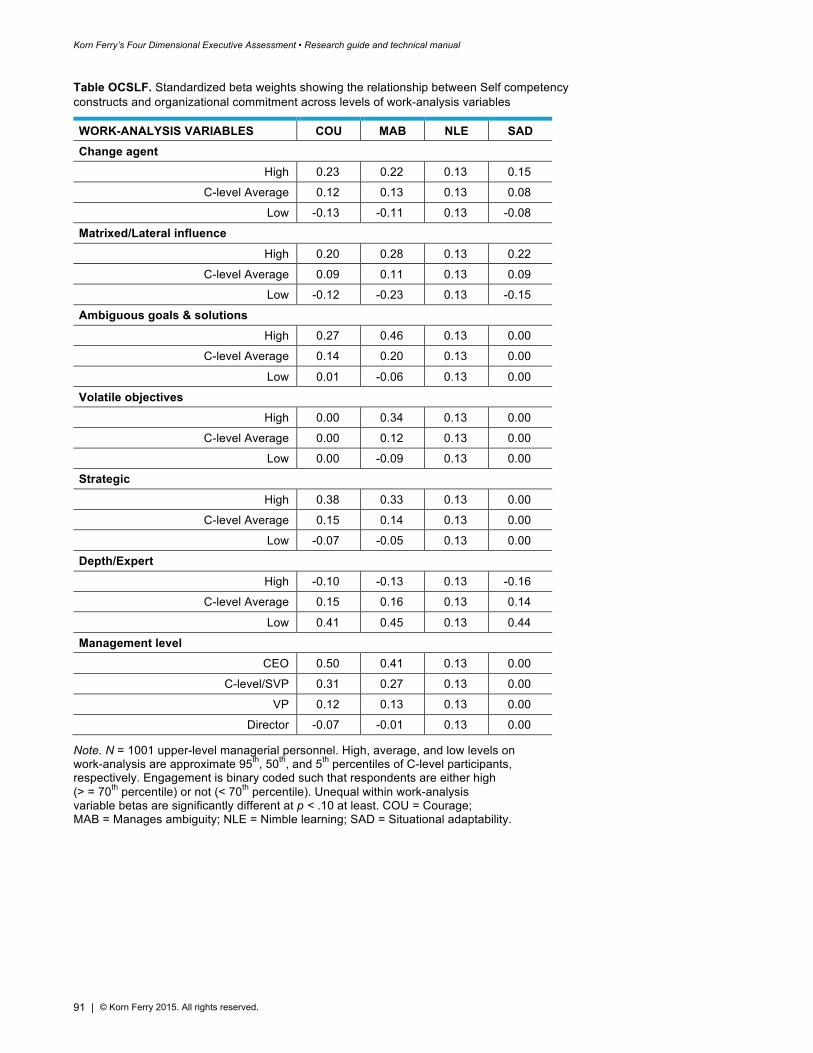
Korn Ferry’s Four Dimensional Executive Assessment • Research guide and technical manual
91 | © Korn Ferry 2015. All rights reserved.
Table OCSLF. Standardized beta weights showing the relationship between Self competency constructs and organizational commitment across levels of work-analysis variables
WORK-ANALYSIS VARIABLES COU MAB NLE SAD Change agent
High 0.23 0.22 0.13 0.15
C-level Average 0.12 0.13 0.13 0.08
Low -0.13 -0.11 0.13 -0.08
Matrixed/Lateral influence
High 0.20 0.28 0.13 0.22
C-level Average 0.09 0.11 0.13 0.09
Low -0.12 -0.23 0.13 -0.15
Ambiguous goals & solutions
High 0.27 0.46 0.13 0.00
C-level Average 0.14 0.20 0.13 0.00
Low 0.01 -0.06 0.13 0.00
Volatile objectives
High 0.00 0.34 0.13 0.00
C-level Average 0.00 0.12 0.13 0.00
Low 0.00 -0.09 0.13 0.00
Strategic
High 0.38 0.33 0.13 0.00
C-level Average 0.15 0.14 0.13 0.00
Low -0.07 -0.05 0.13 0.00
Depth/Expert High -0.10 -0.13 0.13 -0.16
C-level Average 0.15 0.16 0.13 0.14
Low 0.41 0.45 0.13 0.44
Management level CEO 0.50 0.41 0.13 0.00
C-level/SVP 0.31 0.27 0.13 0.00
VP 0.12 0.13 0.13 0.00
Director -0.07 -0.01 0.13 0.00
Note. N = 1001 upper-level managerial personnel. High, average, and low levels on work-analysis are approximate 95th, 50th, and 5th percentiles of C-level participants, respectively. Engagement is binary coded such that respondents are either high (> = 70th percentile) or not (< 70th percentile). Unequal within work-analysis variable betas are significantly different at p < .10 at least. COU = Courage; MAB = Manages ambiguity; NLE = Nimble learning; SAD = Situational adaptability.
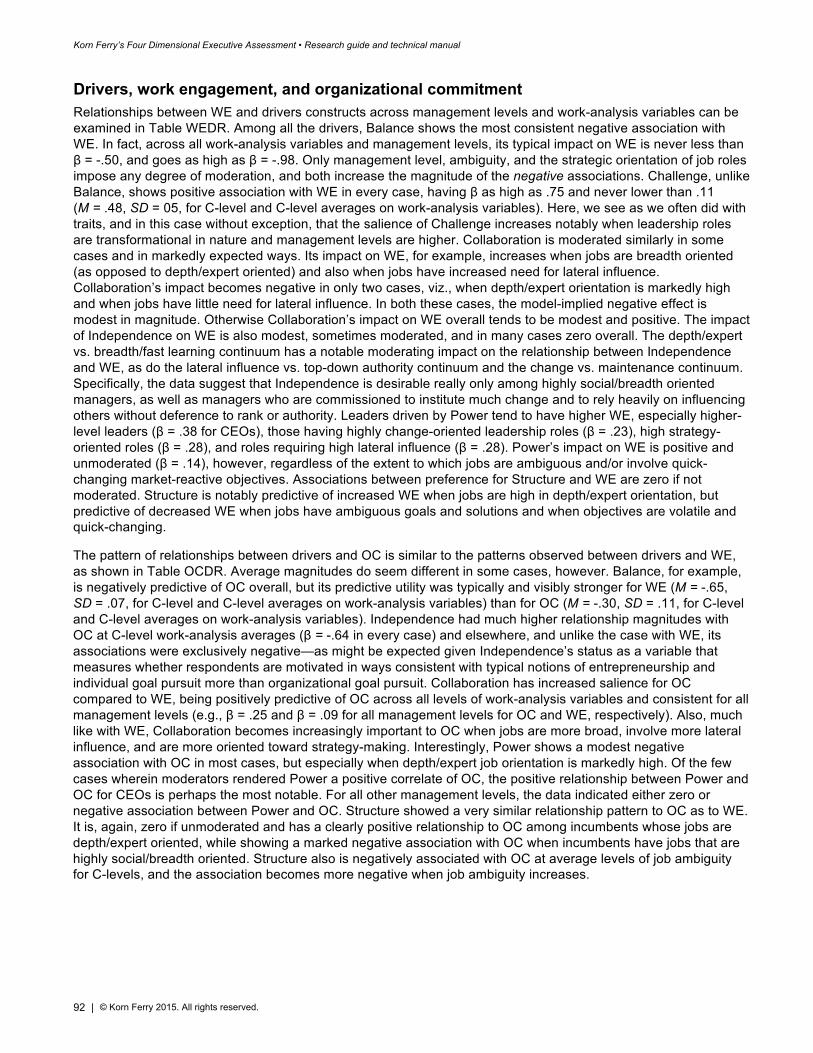
Korn Ferry’s Four Dimensional Executive Assessment • Research guide and technical manual
92 | © Korn Ferry 2015. All rights reserved.
Drivers, work engagement, and organizational commitment Relationships between WE and drivers constructs across management levels and work-analysis variables can be examined in Table WEDR. Among all the drivers, Balance shows the most consistent negative association with WE. In fact, across all work-analysis variables and management levels, its typical impact on WE is never less than β = -.50, and goes as high as β = -.98. Only management level, ambiguity, and the strategic orientation of job roles impose any degree of moderation, and both increase the magnitude of the negative associations. Challenge, unlike Balance, shows positive association with WE in every case, having β as high as .75 and never lower than .11 (M = .48, SD = 05, for C-level and C-level averages on work-analysis variables). Here, we see as we often did with traits, and in this case without exception, that the salience of Challenge increases notably when leadership roles are transformational in nature and management levels are higher. Collaboration is moderated similarly in some cases and in markedly expected ways. Its impact on WE, for example, increases when jobs are breadth oriented (as opposed to depth/expert oriented) and also when jobs have increased need for lateral influence. Collaboration’s impact becomes negative in only two cases, viz., when depth/expert orientation is markedly high and when jobs have little need for lateral influence. In both these cases, the model-implied negative effect is modest in magnitude. Otherwise Collaboration’s impact on WE overall tends to be modest and positive. The impact of Independence on WE is also modest, sometimes moderated, and in many cases zero overall. The depth/expert vs. breadth/fast learning continuum has a notable moderating impact on the relationship between Independence and WE, as do the lateral influence vs. top-down authority continuum and the change vs. maintenance continuum. Specifically, the data suggest that Independence is desirable really only among highly social/breadth oriented managers, as well as managers who are commissioned to institute much change and to rely heavily on influencing others without deference to rank or authority. Leaders driven by Power tend to have higher WE, especially higher-level leaders (β = .38 for CEOs), those having highly change-oriented leadership roles (β = .23), high strategy-oriented roles (β = .28), and roles requiring high lateral influence (β = .28). Power’s impact on WE is positive and unmoderated (β = .14), however, regardless of the extent to which jobs are ambiguous and/or involve quick-changing market-reactive objectives. Associations between preference for Structure and WE are zero if not moderated. Structure is notably predictive of increased WE when jobs are high in depth/expert orientation, but predictive of decreased WE when jobs have ambiguous goals and solutions and when objectives are volatile and quick-changing.
The pattern of relationships between drivers and OC is similar to the patterns observed between drivers and WE, as shown in Table OCDR. Average magnitudes do seem different in some cases, however. Balance, for example, is negatively predictive of OC overall, but its predictive utility was typically and visibly stronger for WE (M = -.65, SD = .07, for C-level and C-level averages on work-analysis variables) than for OC (M = -.30, SD = .11, for C-level and C-level averages on work-analysis variables). Independence had much higher relationship magnitudes with OC at C-level work-analysis averages (β = -.64 in every case) and elsewhere, and unlike the case with WE, its associations were exclusively negative—as might be expected given Independence’s status as a variable that measures whether respondents are motivated in ways consistent with typical notions of entrepreneurship and individual goal pursuit more than organizational goal pursuit. Collaboration has increased salience for OC compared to WE, being positively predictive of OC across all levels of work-analysis variables and consistent for all management levels (e.g., β = .25 and β = .09 for all management levels for OC and WE, respectively). Also, much like with WE, Collaboration becomes increasingly important to OC when jobs are more broad, involve more lateral influence, and are more oriented toward strategy-making. Interestingly, Power shows a modest negative association with OC in most cases, but especially when depth/expert job orientation is markedly high. Of the few cases wherein moderators rendered Power a positive correlate of OC, the positive relationship between Power and OC for CEOs is perhaps the most notable. For all other management levels, the data indicated either zero or negative association between Power and OC. Structure showed a very similar relationship pattern to OC as to WE. It is, again, zero if unmoderated and has a clearly positive relationship to OC among incumbents whose jobs are depth/expert oriented, while showing a marked negative association with OC when incumbents have jobs that are highly social/breadth oriented. Structure also is negatively associated with OC at average levels of job ambiguity for C-levels, and the association becomes more negative when job ambiguity increases.
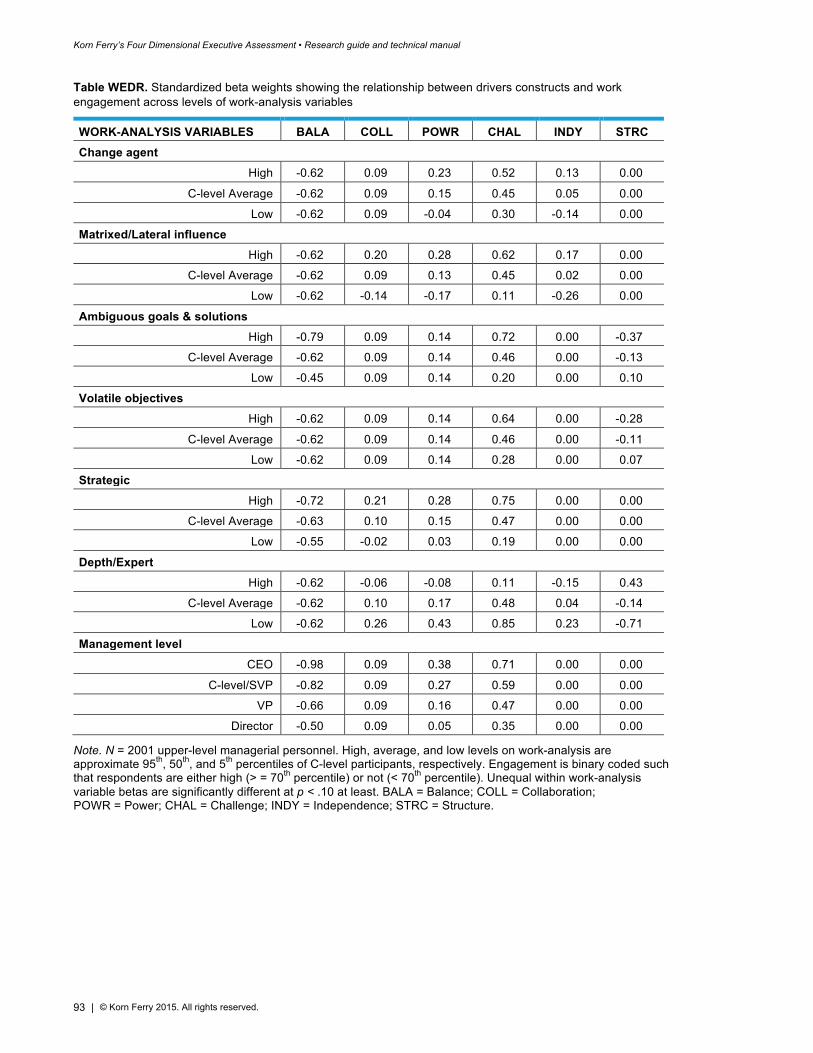
Korn Ferry’s Four Dimensional Executive Assessment • Research guide and technical manual
93 | © Korn Ferry 2015. All rights reserved.
Table WEDR. Standardized beta weights showing the relationship between drivers constructs and work engagement across levels of work-analysis variables
WORK-ANALYSIS VARIABLES BALA COLL POWR CHAL INDY STRC Change agent
High -0.62 0.09 0.23 0.52 0.13 0.00
C-level Average -0.62 0.09 0.15 0.45 0.05 0.00
Low -0.62 0.09 -0.04 0.30 -0.14 0.00
Matrixed/Lateral influence
High -0.62 0.20 0.28 0.62 0.17 0.00
C-level Average -0.62 0.09 0.13 0.45 0.02 0.00
Low -0.62 -0.14 -0.17 0.11 -0.26 0.00
Ambiguous goals & solutions
High -0.79 0.09 0.14 0.72 0.00 -0.37
C-level Average -0.62 0.09 0.14 0.46 0.00 -0.13
Low -0.45 0.09 0.14 0.20 0.00 0.10
Volatile objectives
High -0.62 0.09 0.14 0.64 0.00 -0.28
C-level Average -0.62 0.09 0.14 0.46 0.00 -0.11
Low -0.62 0.09 0.14 0.28 0.00 0.07
Strategic
High -0.72 0.21 0.28 0.75 0.00 0.00
C-level Average -0.63 0.10 0.15 0.47 0.00 0.00
Low -0.55 -0.02 0.03 0.19 0.00 0.00
Depth/Expert High -0.62 -0.06 -0.08 0.11 -0.15 0.43
C-level Average -0.62 0.10 0.17 0.48 0.04 -0.14
Low -0.62 0.26 0.43 0.85 0.23 -0.71
Management level CEO -0.98 0.09 0.38 0.71 0.00 0.00
C-level/SVP -0.82 0.09 0.27 0.59 0.00 0.00
VP -0.66 0.09 0.16 0.47 0.00 0.00
Director -0.50 0.09 0.05 0.35 0.00 0.00
Note. N = 2001 upper-level managerial personnel. High, average, and low levels on work-analysis are approximate 95th, 50th, and 5th percentiles of C-level participants, respectively. Engagement is binary coded such that respondents are either high (> = 70th percentile) or not (< 70th percentile). Unequal within work-analysis variable betas are significantly different at p < .10 at least. BALA = Balance; COLL = Collaboration; POWR = Power; CHAL = Challenge; INDY = Independence; STRC = Structure.
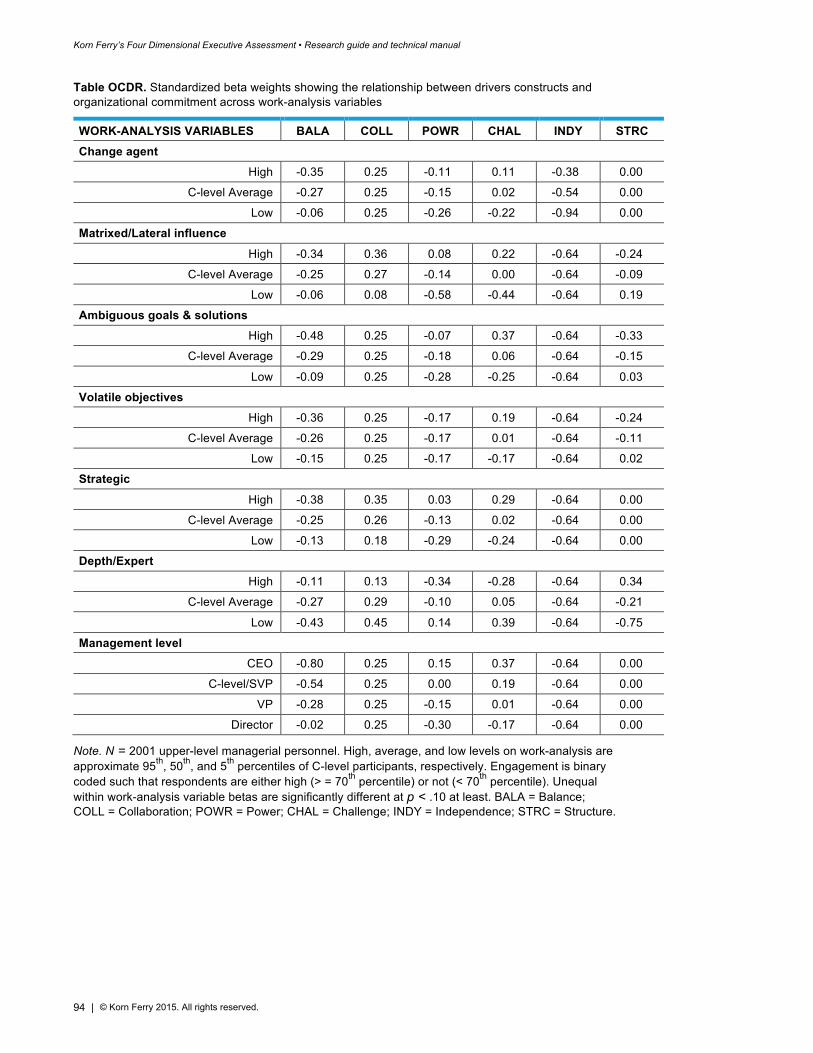
Korn Ferry’s Four Dimensional Executive Assessment • Research guide and technical manual
94 | © Korn Ferry 2015. All rights reserved.
Table OCDR. Standardized beta weights showing the relationship between drivers constructs and organizational commitment across work-analysis variables
WORK-ANALYSIS VARIABLES BALA COLL POWR CHAL INDY STRC Change agent
High -0.35 0.25 -0.11 0.11 -0.38 0.00
C-level Average -0.27 0.25 -0.15 0.02 -0.54 0.00
Low -0.06 0.25 -0.26 -0.22 -0.94 0.00
Matrixed/Lateral influence
High -0.34 0.36 0.08 0.22 -0.64 -0.24
C-level Average -0.25 0.27 -0.14 0.00 -0.64 -0.09
Low -0.06 0.08 -0.58 -0.44 -0.64 0.19
Ambiguous goals & solutions
High -0.48 0.25 -0.07 0.37 -0.64 -0.33
C-level Average -0.29 0.25 -0.18 0.06 -0.64 -0.15
Low -0.09 0.25 -0.28 -0.25 -0.64 0.03
Volatile objectives
High -0.36 0.25 -0.17 0.19 -0.64 -0.24
C-level Average -0.26 0.25 -0.17 0.01 -0.64 -0.11
Low -0.15 0.25 -0.17 -0.17 -0.64 0.02
Strategic
High -0.38 0.35 0.03 0.29 -0.64 0.00
C-level Average -0.25 0.26 -0.13 0.02 -0.64 0.00
Low -0.13 0.18 -0.29 -0.24 -0.64 0.00
Depth/Expert High -0.11 0.13 -0.34 -0.28 -0.64 0.34
C-level Average -0.27 0.29 -0.10 0.05 -0.64 -0.21
Low -0.43 0.45 0.14 0.39 -0.64 -0.75
Management level CEO -0.80 0.25 0.15 0.37 -0.64 0.00
C-level/SVP -0.54 0.25 0.00 0.19 -0.64 0.00
VP -0.28 0.25 -0.15 0.01 -0.64 0.00
Director -0.02 0.25 -0.30 -0.17 -0.64 0.00
Note. N = 2001 upper-level managerial personnel. High, average, and low levels on work-analysis are approximate 95th, 50th, and 5th percentiles of C-level participants, respectively. Engagement is binary coded such that respondents are either high (> = 70th percentile) or not (< 70th percentile). Unequal within work-analysis variable betas are significantly different at p < .10 at least. BALA = Balance; COLL = Collaboration; POWR = Power; CHAL = Challenge; INDY = Independence; STRC = Structure.
Korn Ferry’s Four Dimensional Executive Assessment • Research guide and technical manual
95 | © Korn Ferry 2015. All rights reserved.
Multivariate considerations The many relationships shown in the immediately previous sections (viz., Tables WEAG through OCPPL) demonstrate the work relatedness of KF4D-Exec traits, drivers, and self-efficacy for competencies. Assessment scores are predictive of management level and mean levels of job characteristics. Results not only show that particular KF4D-Exec response patterns are more likely to be found in particular roles and levels of management, but they also support KF4D-Exec utility for predicting indicators of job success and for determining how and whether particular scores are more or less salient for success. Results explicated in previous sections, however, are effectively bivariate in every case and, therefore, tell a necessary but perhaps incomplete story vis-à-vis the potential for applied utility of individual KF4D-Exec score profiles. They also fail to capitalize on more multivariate and parsimonious statistical procedures that increase statistical power, decrease residual variance, and allow for additional examination of variable interaction and incremental utility of measures. KF4D-Exec is designed to be a system that, among other things, yields an overall descriptive and cohesive impression of respondents on traits, drivers, and competencies. It also offers insight into whether, given a pattern of responses across scales and sub-scales, a particular person is more or less well matched for a given management vacancy. Analyses like those shown in Tables WEAG through OCPPL are perhaps more immediately consistent with score-by-score perspectives on assessment and less suited for gestalt and “whole person” and/or “whole job” perspectives on the psychology of leadership.
Earlier in this technical manual, for example, we discussed that the extant literature on leadership has increasingly adopted more complex perspectives on the nature of jobs in ways more commensurate with multivariate and more nuanced interpretations of leadership. Leaders or leadership roles are not clearly transformational, transactional, contingent-reward, nor do they otherwise conform neatly to some level of any given taxonomy—perhaps even taxonomies that have notable degrees of complexity. Leaders are individuals tasked to lead organizations and organizational units to success amidst a complex interplay of variables, some of which are measureable and lend themselves to value-added systems designed to supplement human resources decisions, and some of which will likely remain unmeasured or unmeasurable short of employing methods sure to be unfeasible and unacceptably invasive for common and wide applied use.
Nonetheless, scientific methods for description and prescription can and do, with virtually no exception, make use of limited taxonomies, incomplete information, and imperfect inferences that demonstrably add value to human endeavors, including personnel development and selection within organizations. Moreover, the development and explication of simple and intuitively appealing models persist in leadership psychology and beyond, and for good reason. George Box, former president of the American Statistical Association and fellow of the British Royal Society, famously announced—in what might be considered an unintentional treatise on epistemology and scientific modeling—that “all models are wrong, but some are useful” (Box & Draper, 1987). There is little doubt that Dr. Box and others of similar esteem would agree that a fair elaboration on his famous quote might assert that, “all applied statistical models explain variance in outcomes of interest, while retaining a numerically expressible and no-zero error term that reflects the (quantifiable) inevitability of being wrong in a non-trivial number of cases.”35 The power of statistical procedures, however, is rooted in the knowledge that decisions supported by a scientific model are certainly and demonstrably wrong in notably fewer cases compared to decisions based on random chance. With both inevitable imperfection and demonstrable value-added utility in mind, we continue our discussion of the KF4D-Exec measurement system in this section by explicating some gestalt and multivariate approaches to understanding KF4D-Exec’s potential utility for applied use.
35 This is particularly true in social and psychological sciences compared to physics, chemistry, and engineering. In the former, measures are rarely natural ratio-level measures but more typically interval-level at best, and in many cases key constructs are latent and not manifest (like speed or temperature).
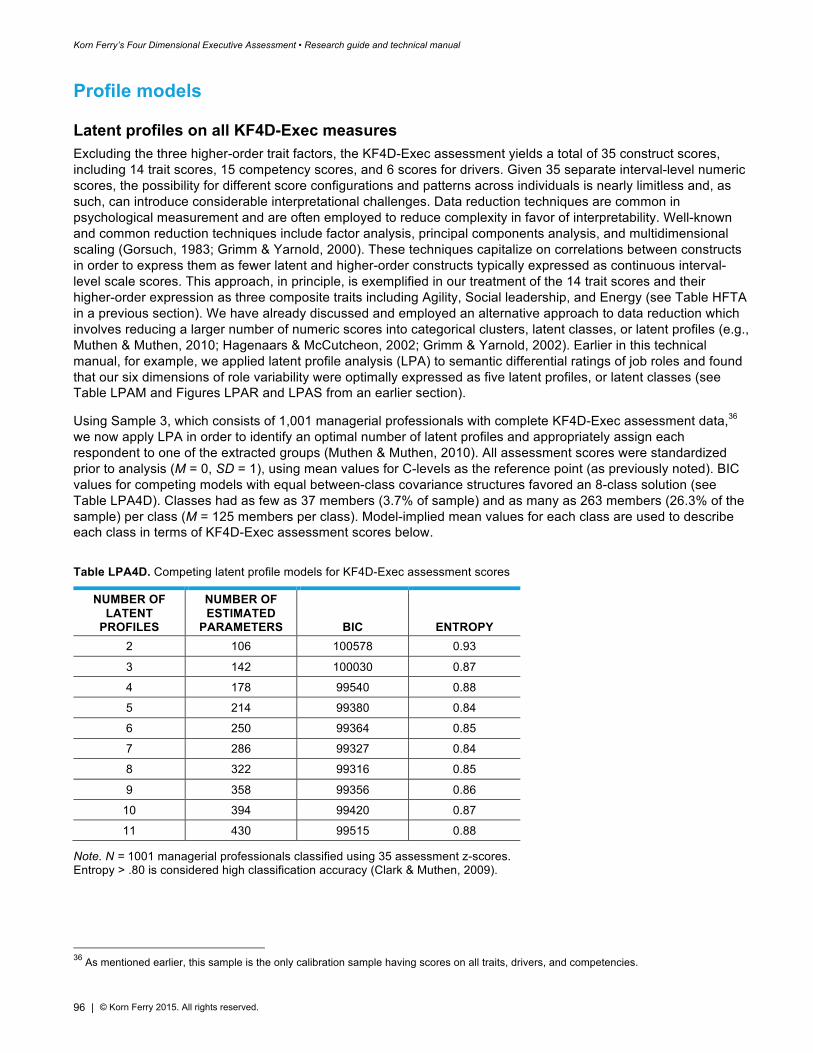
Korn Ferry’s Four Dimensional Executive Assessment • Research guide and technical manual
96 | © Korn Ferry 2015. All rights reserved.
Profile models
Latent profiles on all KF4D-Exec measures Excluding the three higher-order trait factors, the KF4D-Exec assessment yields a total of 35 construct scores, including 14 trait scores, 15 competency scores, and 6 scores for drivers. Given 35 separate interval-level numeric scores, the possibility for different score configurations and patterns across individuals is nearly limitless and, as such, can introduce considerable interpretational challenges. Data reduction techniques are common in psychological measurement and are often employed to reduce complexity in favor of interpretability. Well-known and common reduction techniques include factor analysis, principal components analysis, and multidimensional scaling (Gorsuch, 1983; Grimm & Yarnold, 2000). These techniques capitalize on correlations between constructs in order to express them as fewer latent and higher-order constructs typically expressed as continuous interval-level scale scores. This approach, in principle, is exemplified in our treatment of the 14 trait scores and their higher-order expression as three composite traits including Agility, Social leadership, and Energy (see Table HFTA in a previous section). We have already discussed and employed an alternative approach to data reduction which involves reducing a larger number of numeric scores into categorical clusters, latent classes, or latent profiles (e.g., Muthen & Muthen, 2010; Hagenaars & McCutcheon, 2002; Grimm & Yarnold, 2002). Earlier in this technical manual, for example, we applied latent profile analysis (LPA) to semantic differential ratings of job roles and found that our six dimensions of role variability were optimally expressed as five latent profiles, or latent classes (see Table LPAM and Figures LPAR and LPAS from an earlier section).
Using Sample 3, which consists of 1,001 managerial professionals with complete KF4D-Exec assessment data,36 we now apply LPA in order to identify an optimal number of latent profiles and appropriately assign each respondent to one of the extracted groups (Muthen & Muthen, 2010). All assessment scores were standardized prior to analysis (M = 0, SD = 1), using mean values for C-levels as the reference point (as previously noted). BIC values for competing models with equal between-class covariance structures favored an 8-class solution (see Table LPA4D). Classes had as few as 37 members (3.7% of sample) and as many as 263 members (26.3% of the sample) per class (M = 125 members per class). Model-implied mean values for each class are used to describe each class in terms of KF4D-Exec assessment scores below.
Table LPA4D. Competing latent profile models for KF4D-Exec assessment scores
NUMBER OF LATENT
PROFILES
NUMBER OF ESTIMATED
PARAMETERS BIC ENTROPY 2 106 100578 0.93
3 142 100030 0.87
4 178 99540 0.88
5 214 99380 0.84
6 250 99364 0.85
7 286 99327 0.84
8 322 99316 0.85
9 358 99356 0.86
10 394 99420 0.87
11 430 99515 0.88
Note. N = 1001 managerial professionals classified using 35 assessment z-scores. Entropy > .80 is considered high classification accuracy (Clark & Muthen, 2009).
36 As mentioned earlier, this sample is the only calibration sample having scores on all traits, drivers, and competencies.
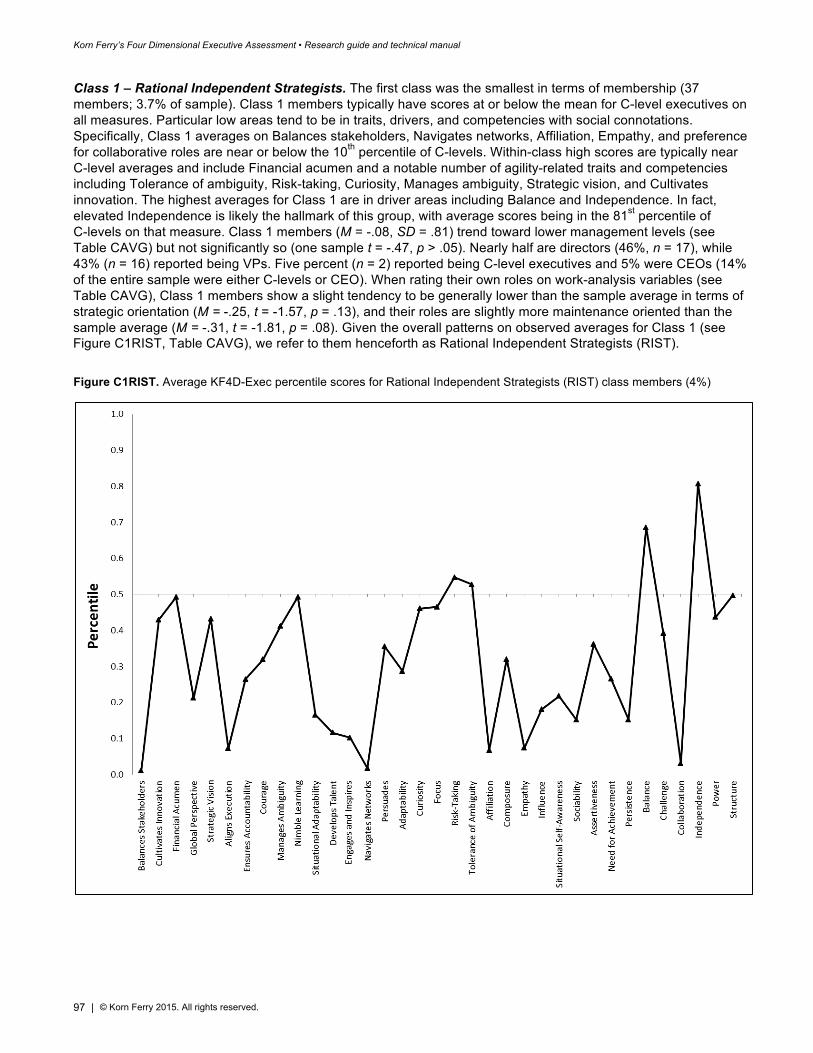
Korn Ferry’s Four Dimensional Executive Assessment • Research guide and technical manual
97 | © Korn Ferry 2015. All rights reserved.
Class 1 – Rational Independent Strategists. The first class was the smallest in terms of membership (37 members; 3.7% of sample). Class 1 members typically have scores at or below the mean for C-level executives on all measures. Particular low areas tend to be in traits, drivers, and competencies with social connotations. Specifically, Class 1 averages on Balances stakeholders, Navigates networks, Affiliation, Empathy, and preference for collaborative roles are near or below the 10th percentile of C-levels. Within-class high scores are typically near C-level averages and include Financial acumen and a notable number of agility-related traits and competencies including Tolerance of ambiguity, Risk-taking, Curiosity, Manages ambiguity, Strategic vision, and Cultivates innovation. The highest averages for Class 1 are in driver areas including Balance and Independence. In fact, elevated Independence is likely the hallmark of this group, with average scores being in the 81st percentile of C-levels on that measure. Class 1 members (M = -.08, SD = .81) trend toward lower management levels (see Table CAVG) but not significantly so (one sample t = -.47, p > .05). Nearly half are directors (46%, n = 17), while 43% (n = 16) reported being VPs. Five percent (n = 2) reported being C-level executives and 5% were CEOs (14% of the entire sample were either C-levels or CEO). When rating their own roles on work-analysis variables (see Table CAVG), Class 1 members show a slight tendency to be generally lower than the sample average in terms of strategic orientation (M = -.25, t = -1.57, p = .13), and their roles are slightly more maintenance oriented than the sample average (M = -.31, t = -1.81, p = .08). Given the overall patterns on observed averages for Class 1 (see Figure C1RIST, Table CAVG), we refer to them henceforth as Rational Independent Strategists (RIST).
Figure C1RIST. Average KF4D-Exec percentile scores for Rational Independent Strategists (RIST) class members (4%)
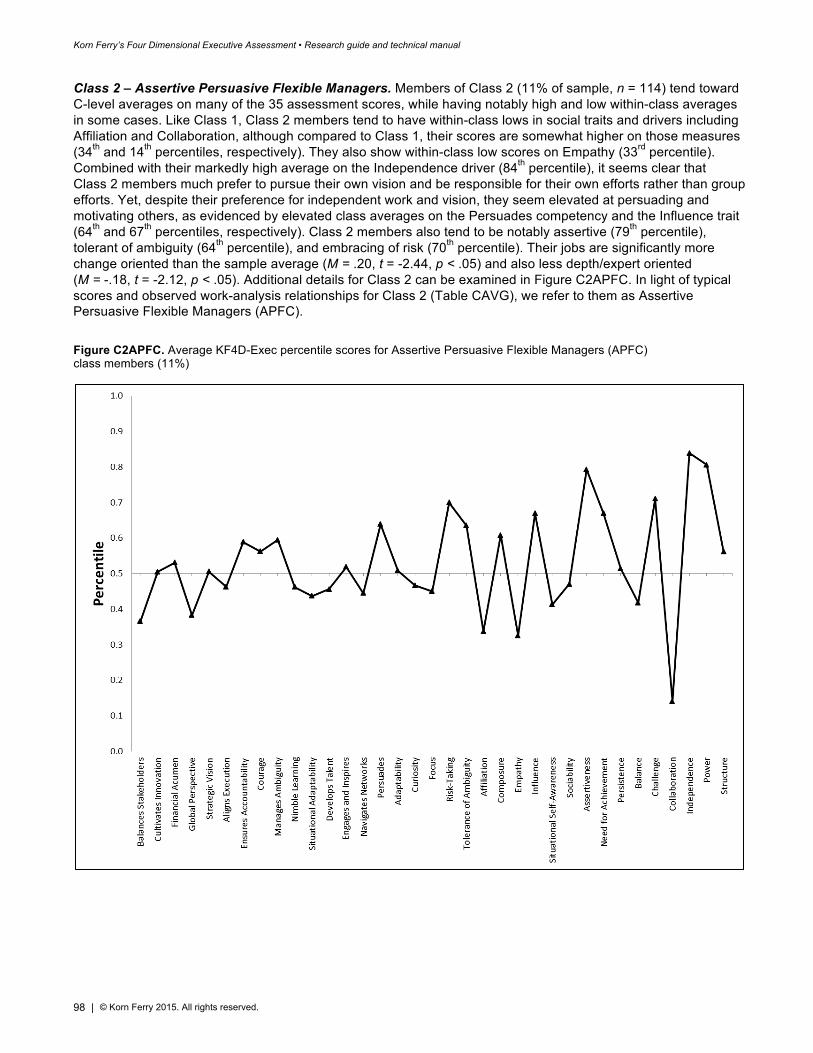
Korn Ferry’s Four Dimensional Executive Assessment • Research guide and technical manual
98 | © Korn Ferry 2015. All rights reserved.
Class 2 – Assertive Persuasive Flexible Managers. Members of Class 2 (11% of sample, n = 114) tend toward C-level averages on many of the 35 assessment scores, while having notably high and low within-class averages in some cases. Like Class 1, Class 2 members tend to have within-class lows in social traits and drivers including Affiliation and Collaboration, although compared to Class 1, their scores are somewhat higher on those measures (34th and 14th percentiles, respectively). They also show within-class low scores on Empathy (33rd percentile). Combined with their markedly high average on the Independence driver (84th percentile), it seems clear that Class 2 members much prefer to pursue their own vision and be responsible for their own efforts rather than group efforts. Yet, despite their preference for independent work and vision, they seem elevated at persuading and motivating others, as evidenced by elevated class averages on the Persuades competency and the Influence trait (64th and 67th percentiles, respectively). Class 2 members also tend to be notably assertive (79th percentile), tolerant of ambiguity (64th percentile), and embracing of risk (70th percentile). Their jobs are significantly more change oriented than the sample average (M = .20, t = -2.44, p < .05) and also less depth/expert oriented (M = -.18, t = -2.12, p < .05). Additional details for Class 2 can be examined in Figure C2APFC. In light of typical scores and observed work-analysis relationships for Class 2 (Table CAVG), we refer to them as Assertive Persuasive Flexible Managers (APFC).
Figure C2APFC. Average KF4D-Exec percentile scores for Assertive Persuasive Flexible Managers (APFC) class members (11%)
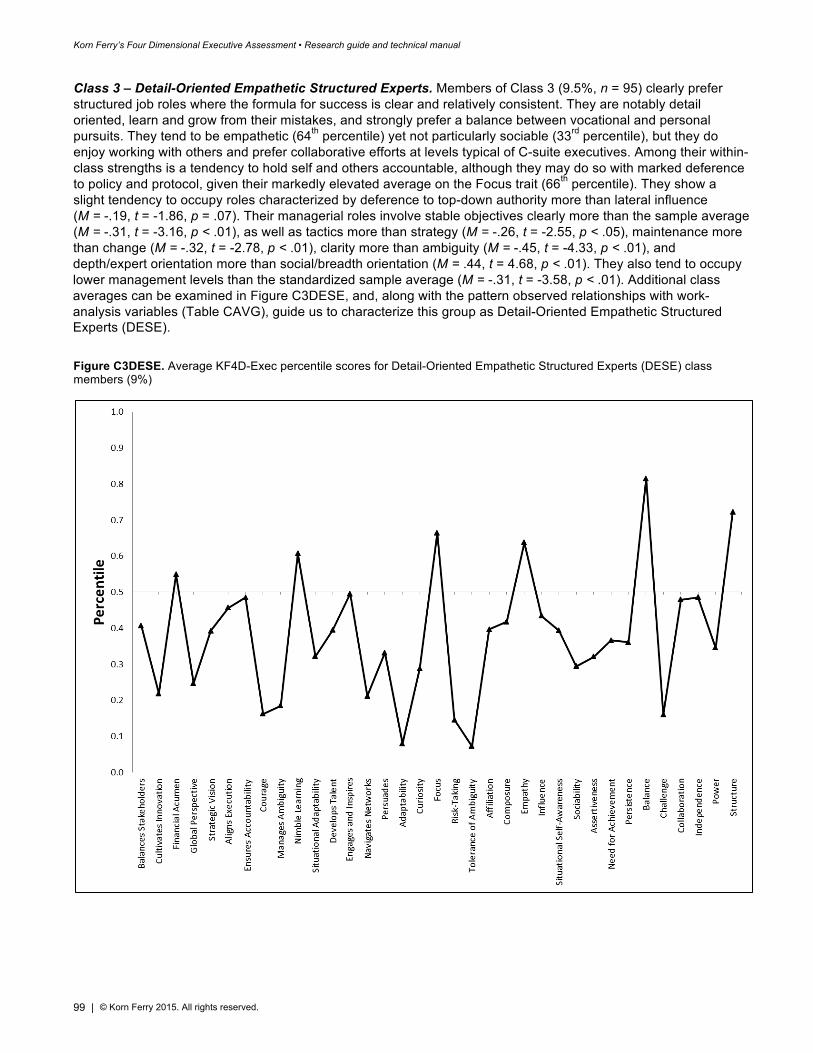
Korn Ferry’s Four Dimensional Executive Assessment • Research guide and technical manual
99 | © Korn Ferry 2015. All rights reserved.
Class 3 – Detail-Oriented Empathetic Structured Experts. Members of Class 3 (9.5%, n = 95) clearly prefer structured job roles where the formula for success is clear and relatively consistent. They are notably detail oriented, learn and grow from their mistakes, and strongly prefer a balance between vocational and personal pursuits. They tend to be empathetic (64th percentile) yet not particularly sociable (33rd percentile), but they do enjoy working with others and prefer collaborative efforts at levels typical of C-suite executives. Among their within-class strengths is a tendency to hold self and others accountable, although they may do so with marked deference to policy and protocol, given their markedly elevated average on the Focus trait (66th percentile). They show a slight tendency to occupy roles characterized by deference to top-down authority more than lateral influence (M = -.19, t = -1.86, p = .07). Their managerial roles involve stable objectives clearly more than the sample average (M = -.31, t = -3.16, p < .01), as well as tactics more than strategy (M = -.26, t = -2.55, p < .05), maintenance more than change (M = -.32, t = -2.78, p < .01), clarity more than ambiguity (M = -.45, t = -4.33, p < .01), and depth/expert orientation more than social/breadth orientation (M = .44, t = 4.68, p < .01). They also tend to occupy lower management levels than the standardized sample average (M = -.31, t = -3.58, p < .01). Additional class averages can be examined in Figure C3DESE, and, along with the pattern observed relationships with work-analysis variables (Table CAVG), guide us to characterize this group as Detail-Oriented Empathetic Structured Experts (DESE).
Figure C3DESE. Average KF4D-Exec percentile scores for Detail-Oriented Empathetic Structured Experts (DESE) class members (9%)
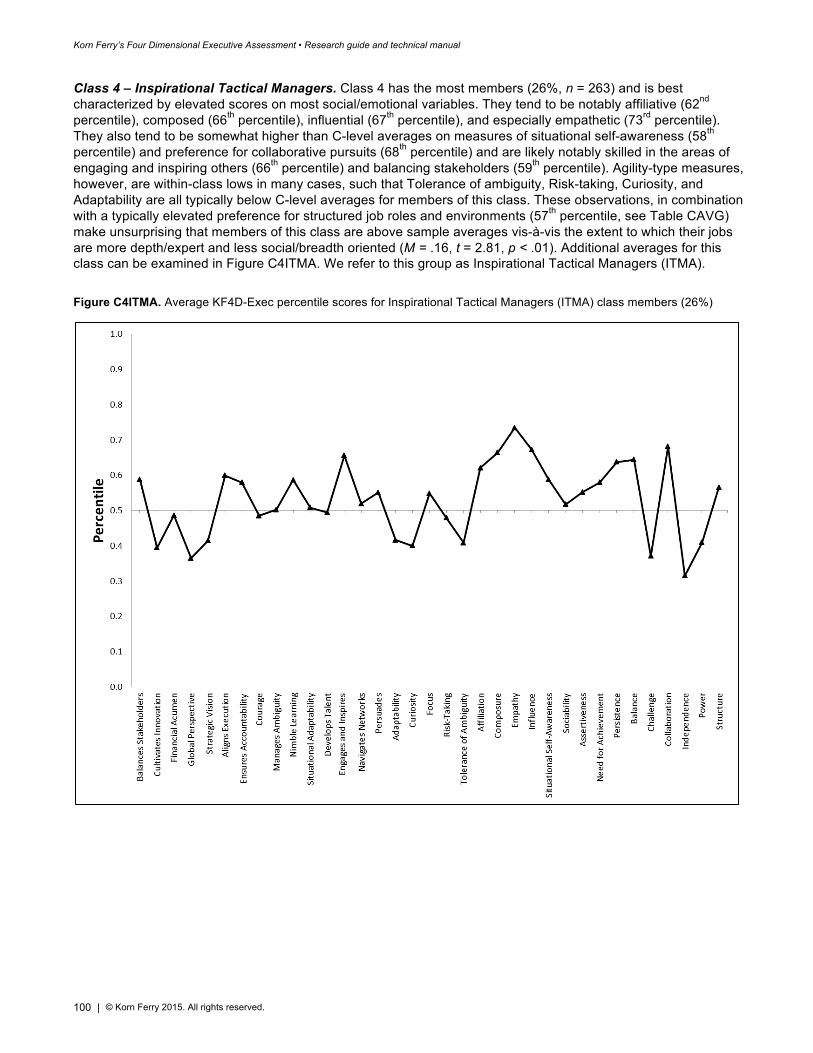
Korn Ferry’s Four Dimensional Executive Assessment • Research guide and technical manual
100 | © Korn Ferry 2015. All rights reserved.
Class 4 – Inspirational Tactical Managers. Class 4 has the most members (26%, n = 263) and is best characterized by elevated scores on most social/emotional variables. They tend to be notably affiliative (62nd percentile), composed (66th percentile), influential (67th percentile), and especially empathetic (73rd percentile). They also tend to be somewhat higher than C-level averages on measures of situational self-awareness (58th percentile) and preference for collaborative pursuits (68th percentile) and are likely notably skilled in the areas of engaging and inspiring others (66th percentile) and balancing stakeholders (59th percentile). Agility-type measures, however, are within-class lows in many cases, such that Tolerance of ambiguity, Risk-taking, Curiosity, and Adaptability are all typically below C-level averages for members of this class. These observations, in combination with a typically elevated preference for structured job roles and environments (57th percentile, see Table CAVG) make unsurprising that members of this class are above sample averages vis-à-vis the extent to which their jobs are more depth/expert and less social/breadth oriented (M = .16, t = 2.81, p < .01). Additional averages for this class can be examined in Figure C4ITMA. We refer to this group as Inspirational Tactical Managers (ITMA).
Figure C4ITMA. Average KF4D-Exec percentile scores for Inspirational Tactical Managers (ITMA) class members (26%)
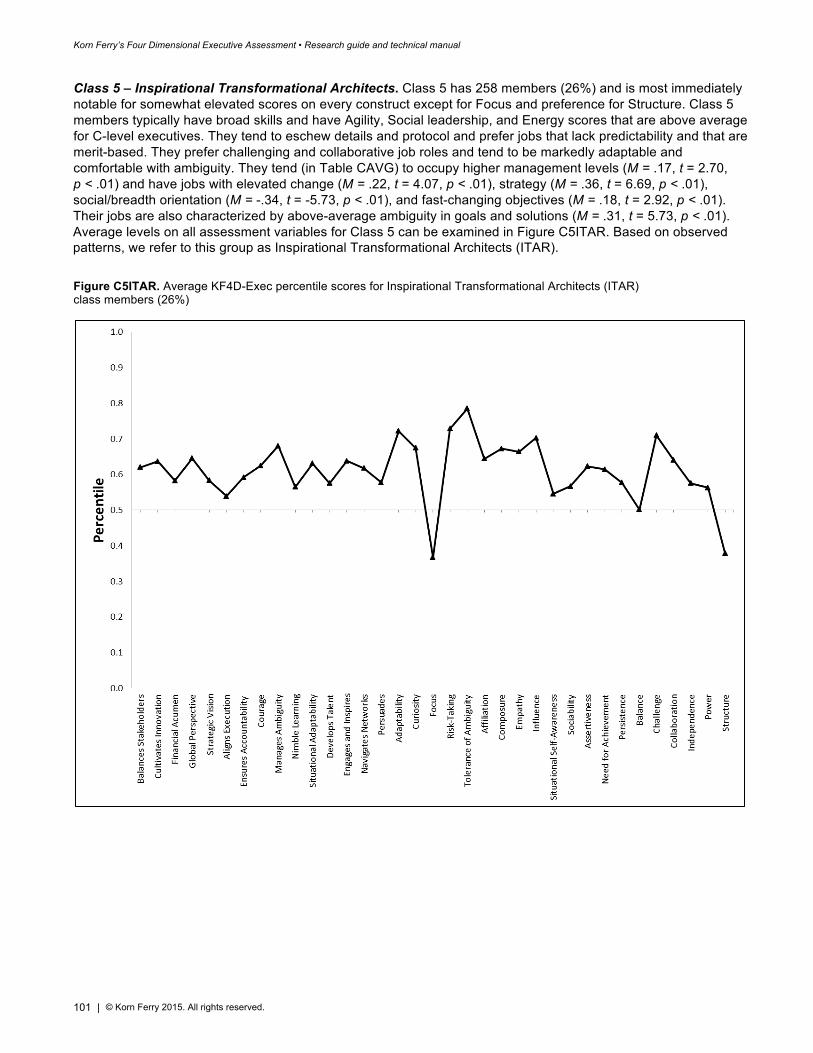
Korn Ferry’s Four Dimensional Executive Assessment • Research guide and technical manual
101 | © Korn Ferry 2015. All rights reserved.
Class 5 – Inspirational Transformational Architects. Class 5 has 258 members (26%) and is most immediately notable for somewhat elevated scores on every construct except for Focus and preference for Structure. Class 5 members typically have broad skills and have Agility, Social leadership, and Energy scores that are above average for C-level executives. They tend to eschew details and protocol and prefer jobs that lack predictability and that are merit-based. They prefer challenging and collaborative job roles and tend to be markedly adaptable and comfortable with ambiguity. They tend (in Table CAVG) to occupy higher management levels (M = .17, t = 2.70, p < .01) and have jobs with elevated change (M = .22, t = 4.07, p < .01), strategy (M = .36, t = 6.69, p < .01), social/breadth orientation (M = -.34, t = -5.73, p < .01), and fast-changing objectives (M = .18, t = 2.92, p < .01). Their jobs are also characterized by above-average ambiguity in goals and solutions (M = .31, t = 5.73, p < .01). Average levels on all assessment variables for Class 5 can be examined in Figure C5ITAR. Based on observed patterns, we refer to this group as Inspirational Transformational Architects (ITAR).
Figure C5ITAR. Average KF4D-Exec percentile scores for Inspirational Transformational Architects (ITAR) class members (26%)
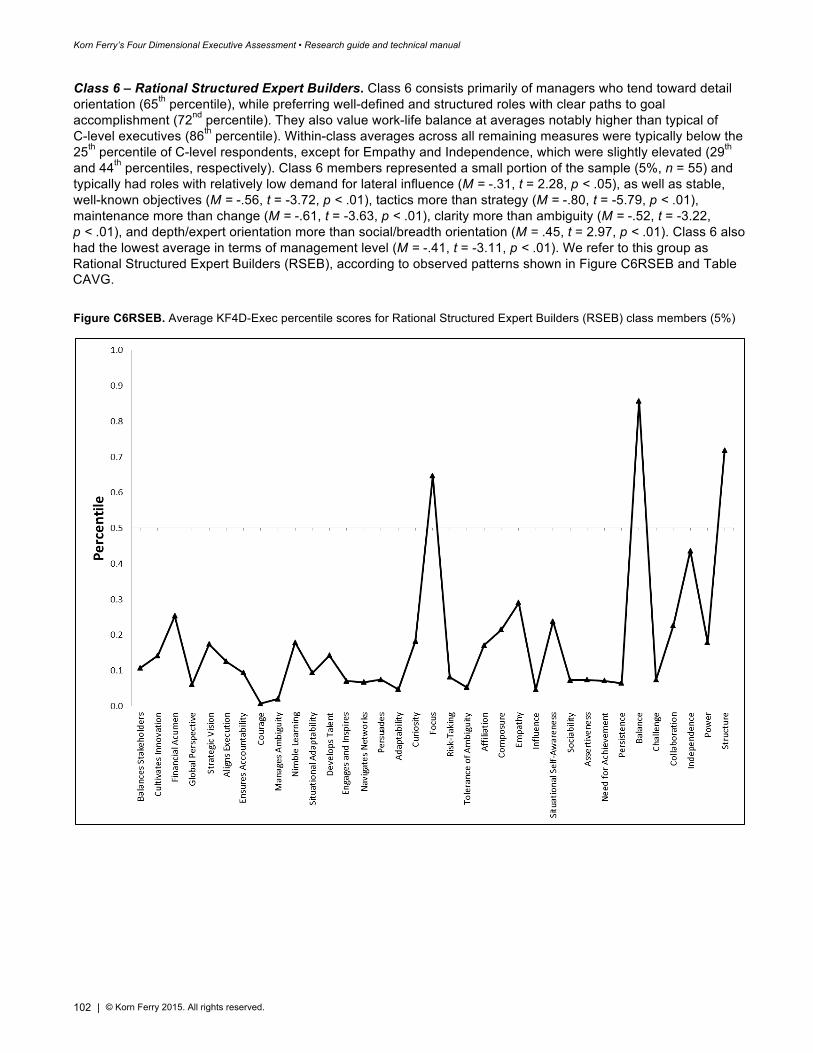
Korn Ferry’s Four Dimensional Executive Assessment • Research guide and technical manual
102 | © Korn Ferry 2015. All rights reserved.
Class 6 – Rational Structured Expert Builders. Class 6 consists primarily of managers who tend toward detail orientation (65th percentile), while preferring well-defined and structured roles with clear paths to goal accomplishment (72nd percentile). They also value work-life balance at averages notably higher than typical of C-level executives (86th percentile). Within-class averages across all remaining measures were typically below the 25th percentile of C-level respondents, except for Empathy and Independence, which were slightly elevated (29th and 44th percentiles, respectively). Class 6 members represented a small portion of the sample (5%, n = 55) and typically had roles with relatively low demand for lateral influence (M = -.31, t = 2.28, p < .05), as well as stable, well-known objectives (M = -.56, t = -3.72, p < .01), tactics more than strategy (M = -.80, t = -5.79, p < .01), maintenance more than change (M = -.61, t = -3.63, p < .01), clarity more than ambiguity (M = -.52, t = -3.22, p < .01), and depth/expert orientation more than social/breadth orientation (M = .45, t = 2.97, p < .01). Class 6 also had the lowest average in terms of management level (M = -.41, t = -3.11, p < .01). We refer to this group as Rational Structured Expert Builders (RSEB), according to observed patterns shown in Figure C6RSEB and Table CAVG.
Figure C6RSEB. Average KF4D-Exec percentile scores for Rational Structured Expert Builders (RSEB) class members (5%)
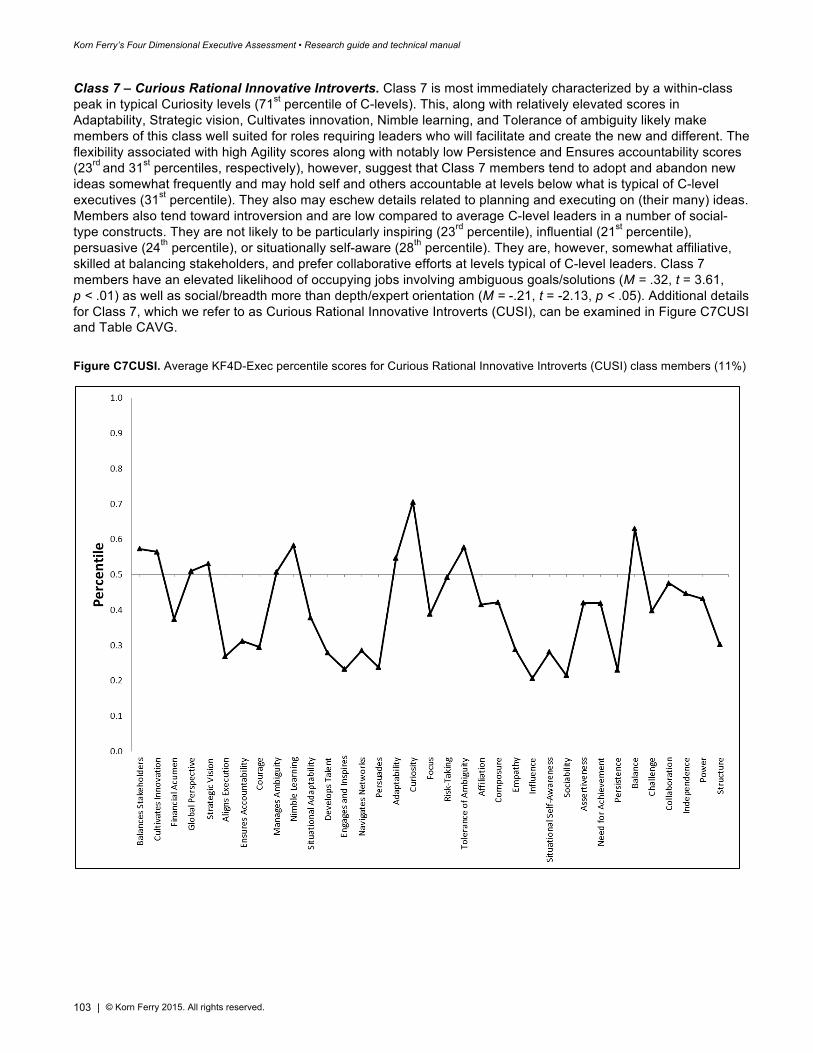
Korn Ferry’s Four Dimensional Executive Assessment • Research guide and technical manual
103 | © Korn Ferry 2015. All rights reserved.
Class 7 – Curious Rational Innovative Introverts. Class 7 is most immediately characterized by a within-class peak in typical Curiosity levels (71st percentile of C-levels). This, along with relatively elevated scores in Adaptability, Strategic vision, Cultivates innovation, Nimble learning, and Tolerance of ambiguity likely make members of this class well suited for roles requiring leaders who will facilitate and create the new and different. The flexibility associated with high Agility scores along with notably low Persistence and Ensures accountability scores (23rd
and 31st percentiles, respectively), however, suggest that Class 7 members tend to adopt and abandon new ideas somewhat frequently and may hold self and others accountable at levels below what is typical of C-level executives (31st percentile). They also may eschew details related to planning and executing on (their many) ideas. Members also tend toward introversion and are low compared to average C-level leaders in a number of social-type constructs. They are not likely to be particularly inspiring (23rd percentile), influential (21st percentile), persuasive (24th percentile), or situationally self-aware (28th percentile). They are, however, somewhat affiliative, skilled at balancing stakeholders, and prefer collaborative efforts at levels typical of C-level leaders. Class 7 members have an elevated likelihood of occupying jobs involving ambiguous goals/solutions (M = .32, t = 3.61, p < .01) as well as social/breadth more than depth/expert orientation (M = -.21, t = -2.13, p < .05). Additional details for Class 7, which we refer to as Curious Rational Innovative Introverts (CUSI), can be examined in Figure C7CUSI and Table CAVG.
Figure C7CUSI. Average KF4D-Exec percentile scores for Curious Rational Innovative Introverts (CUSI) class members (11%)
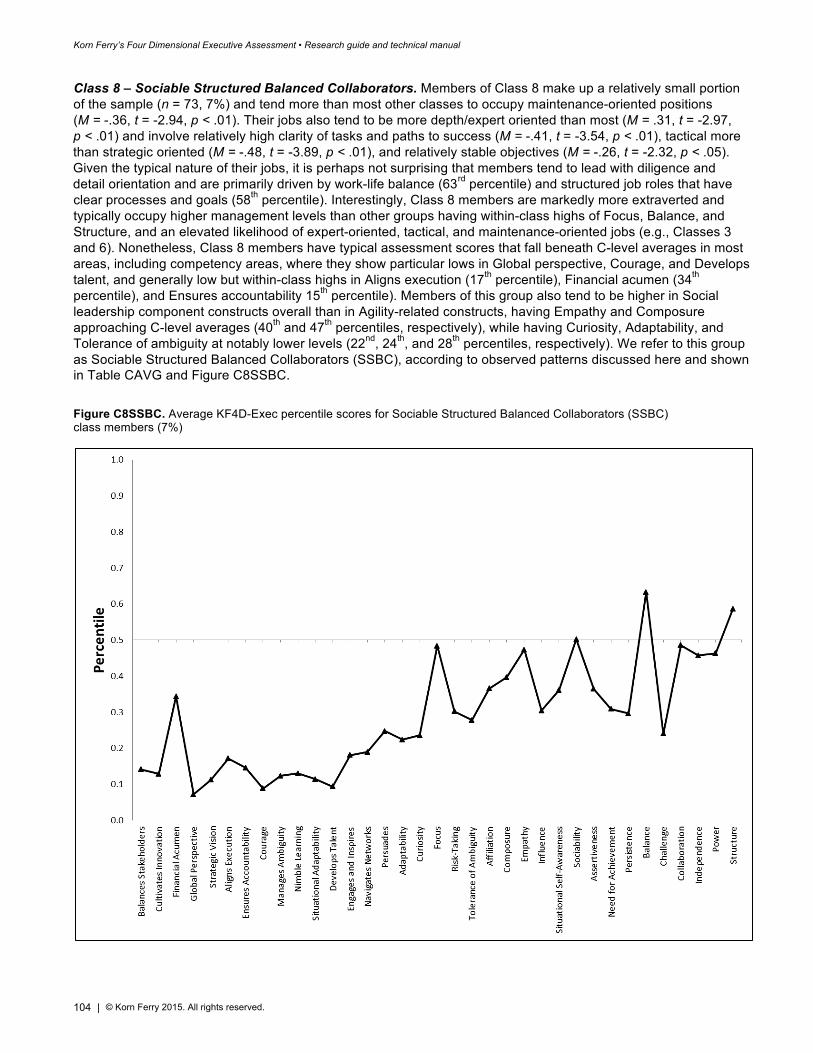
Korn Ferry’s Four Dimensional Executive Assessment • Research guide and technical manual
104 | © Korn Ferry 2015. All rights reserved.
Class 8 – Sociable Structured Balanced Collaborators. Members of Class 8 make up a relatively small portion of the sample (n = 73, 7%) and tend more than most other classes to occupy maintenance-oriented positions (M = -.36, t = -2.94, p < .01). Their jobs also tend to be more depth/expert oriented than most (M = .31, t = -2.97, p < .01) and involve relatively high clarity of tasks and paths to success (M = -.41, t = -3.54, p < .01), tactical more than strategic oriented (M = -.48, t = -3.89, p < .01), and relatively stable objectives (M = -.26, t = -2.32, p < .05). Given the typical nature of their jobs, it is perhaps not surprising that members tend to lead with diligence and detail orientation and are primarily driven by work-life balance (63rd percentile) and structured job roles that have clear processes and goals (58th percentile). Interestingly, Class 8 members are markedly more extraverted and typically occupy higher management levels than other groups having within-class highs of Focus, Balance, and Structure, and an elevated likelihood of expert-oriented, tactical, and maintenance-oriented jobs (e.g., Classes 3 and 6). Nonetheless, Class 8 members have typical assessment scores that fall beneath C-level averages in most areas, including competency areas, where they show particular lows in Global perspective, Courage, and Develops talent, and generally low but within-class highs in Aligns execution (17th percentile), Financial acumen (34th percentile), and Ensures accountability 15th percentile). Members of this group also tend to be higher in Social leadership component constructs overall than in Agility-related constructs, having Empathy and Composure approaching C-level averages (40th and 47th percentiles, respectively), while having Curiosity, Adaptability, and Tolerance of ambiguity at notably lower levels (22nd, 24th, and 28th percentiles, respectively). We refer to this group as Sociable Structured Balanced Collaborators (SSBC), according to observed patterns discussed here and shown in Table CAVG and Figure C8SSBC.
Figure C8SSBC. Average KF4D-Exec percentile scores for Sociable Structured Balanced Collaborators (SSBC) class members (7%)
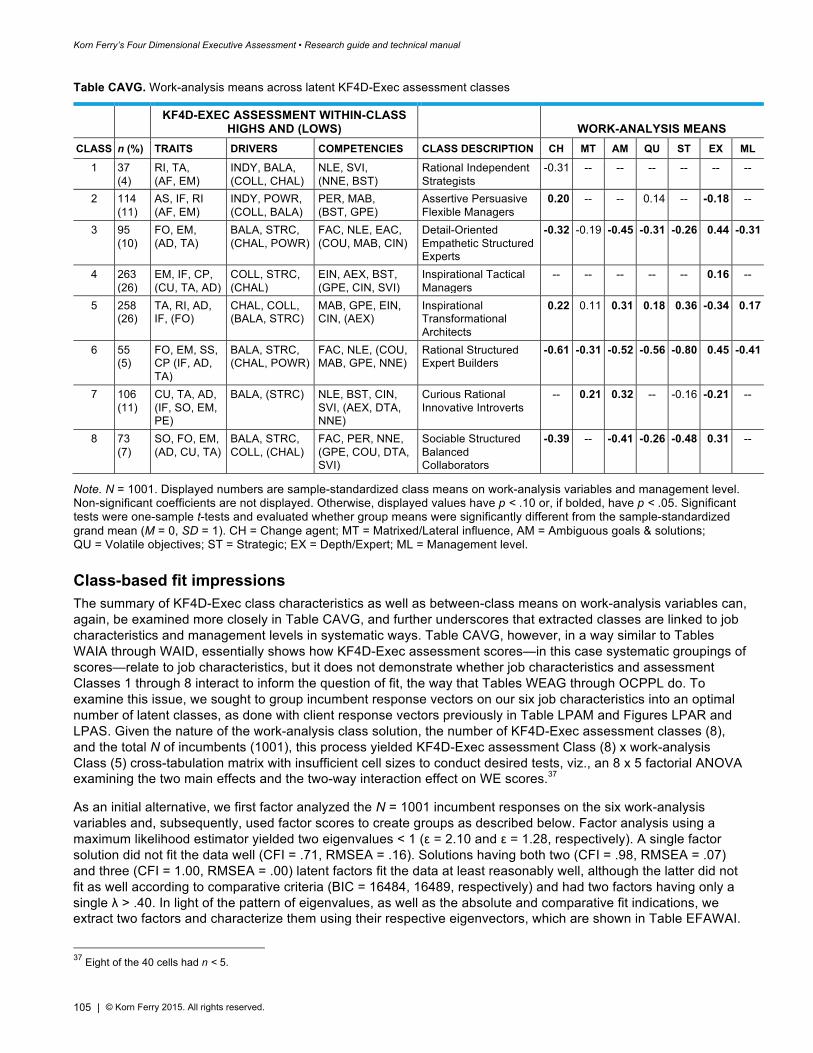
Korn Ferry’s Four Dimensional Executive Assessment • Research guide and technical manual
105 | © Korn Ferry 2015. All rights reserved.
Table CAVG. Work-analysis means across latent KF4D-Exec assessment classes
KF4D-EXEC ASSESSMENT WITHIN-CLASS
HIGHS AND (LOWS) WORK-ANALYSIS MEANS CLASS n (%) TRAITS DRIVERS COMPETENCIES CLASS DESCRIPTION CH MT AM QU ST EX ML
1 37 (4)
RI, TA, (AF, EM)
INDY, BALA, (COLL, CHAL)
NLE, SVI, (NNE, BST)
Rational Independent Strategists
-0.31 -- -- -- -- -- --
2 114 (11)
AS, IF, RI (AF, EM)
INDY, POWR, (COLL, BALA)
PER, MAB, (BST, GPE)
Assertive Persuasive Flexible Managers
0.20 -- -- 0.14 -- -0.18 --
3 95 (10)
FO, EM, (AD, TA)
BALA, STRC, (CHAL, POWR)
FAC, NLE, EAC, (COU, MAB, CIN)
Detail-Oriented Empathetic Structured Experts
-0.32 -0.19 -0.45 -0.31 -0.26 0.44 -0.31
4 263 (26)
EM, IF, CP, (CU, TA, AD)
COLL, STRC, (CHAL)
EIN, AEX, BST, (GPE, CIN, SVI)
Inspirational Tactical Managers
-- -- -- -- -- 0.16 --
5 258 (26)
TA, RI, AD, IF, (FO)
CHAL, COLL, (BALA, STRC)
MAB, GPE, EIN, CIN, (AEX)
Inspirational Transformational Architects
0.22 0.11 0.31 0.18 0.36 -0.34 0.17
6 55 (5)
FO, EM, SS, CP (IF, AD, TA)
BALA, STRC, (CHAL, POWR)
FAC, NLE, (COU, MAB, GPE, NNE)
Rational Structured Expert Builders
-0.61 -0.31 -0.52 -0.56 -0.80 0.45 -0.41
7 106 (11)
CU, TA, AD, (IF, SO, EM, PE)
BALA, (STRC) NLE, BST, CIN, SVI, (AEX, DTA, NNE)
Curious Rational Innovative Introverts
-- 0.21 0.32 -- -0.16 -0.21 --
8 73 (7)
SO, FO, EM, (AD, CU, TA)
BALA, STRC, COLL, (CHAL)
FAC, PER, NNE, (GPE, COU, DTA, SVI)
Sociable Structured Balanced Collaborators
-0.39 -- -0.41 -0.26 -0.48 0.31 --
Note. N = 1001. Displayed numbers are sample-standardized class means on work-analysis variables and management level. Non-significant coefficients are not displayed. Otherwise, displayed values have p < .10 or, if bolded, have p < .05. Significant tests were one-sample t-tests and evaluated whether group means were significantly different from the sample-standardized grand mean (M = 0, SD = 1). CH = Change agent; MT = Matrixed/Lateral influence, AM = Ambiguous goals & solutions; QU = Volatile objectives; ST = Strategic; EX = Depth/Expert; ML = Management level.
Class-based fit impressions The summary of KF4D-Exec class characteristics as well as between-class means on work-analysis variables can, again, be examined more closely in Table CAVG, and further underscores that extracted classes are linked to job characteristics and management levels in systematic ways. Table CAVG, however, in a way similar to Tables WAIA through WAID, essentially shows how KF4D-Exec assessment scores—in this case systematic groupings of scores—relate to job characteristics, but it does not demonstrate whether job characteristics and assessment Classes 1 through 8 interact to inform the question of fit, the way that Tables WEAG through OCPPL do. To examine this issue, we sought to group incumbent response vectors on our six job characteristics into an optimal number of latent classes, as done with client response vectors previously in Table LPAM and Figures LPAR and LPAS. Given the nature of the work-analysis class solution, the number of KF4D-Exec assessment classes (8), and the total N of incumbents (1001), this process yielded KF4D-Exec assessment Class (8) x work-analysis Class (5) cross-tabulation matrix with insufficient cell sizes to conduct desired tests, viz., an 8 x 5 factorial ANOVA examining the two main effects and the two-way interaction effect on WE scores.37
As an initial alternative, we first factor analyzed the N = 1001 incumbent responses on the six work-analysis variables and, subsequently, used factor scores to create groups as described below. Factor analysis using a maximum likelihood estimator yielded two eigenvalues < 1 (ε = 2.10 and ε = 1.28, respectively). A single factor solution did not fit the data well (CFI = .71, RMSEA = .16). Solutions having both two (CFI = .98, RMSEA = .07) and three (CFI = 1.00, RMSEA = .00) latent factors fit the data at least reasonably well, although the latter did not fit as well according to comparative criteria (BIC = 16484, 16489, respectively) and had two factors having only a single λ > .40. In light of the pattern of eigenvalues, as well as the absolute and comparative fit indications, we extract two factors and characterize them using their respective eigenvectors, which are shown in Table EFAWAI.
37 Eight of the 40 cells had n < 5.
Korn Ferry’s Four Dimensional Executive Assessment • Research guide and technical manual
106 | © Korn Ferry 2015. All rights reserved.
Table EFAWAI. Rotated solutions of work-analysis variables
WORK-ANALYSIS VARIABLE
OBLIQUE ROTATION ORTHOGONAL ROTATION FACTOR 1:
Strategic Change Ambiguous
FACTOR 2: Top-down
Depth / Expert
FACTOR 1: Strategic Change
Ambiguous
FACTOR 2: Top-down
Depth / Expert Change agent 0.50 0.01 0.51 -0.10
Matrixed/Lateral influence 0.17 -0.48 0.14 -0.54
Ambiguous goals & solutions 0.47 -0.31 0.44 -0.43
Volatile objectives 0.52 -0.01 0.47 -0.17
Strategic 0.50 0.12 0.52 0.02
Depth/Expert 0.00 0.91 0.00 0.85
Note. N = 2001. Correlated factors from the oblique solution had r = -.22.
Table EFAWAI shows that both the oblique (geomin, Muthen & Muthen, 2010) and orthogonally (varimax) rotated vectors of loadings yielded virtually the same pattern of loadings and same interpretation. High scorers on Factor 1 are change agents with a strategic orientation to work. Their roles are characterized by ambiguity and volatile fast-changing objectives. The pattern of loadings on Factor 1 suggests that scores be interpreted as the extent to which respondents are strategic change agents in a volatile and ambiguous environment. Factor 2 is characterized most immediately by a very high positive loading for the depth/expert variable. High scorers have roles that require notable expertise and, given the negative loadings for lateral influence and ambiguity, high scorers also occupy roles having more formal management hierarchy and some increase in clarity vis-à-vis goals and solutions. After computing regression-type factor scores using scoring coefficients from the orthogonally rotated solution (Pett, Lackey, & Sullivan, 2003), we grouped each respondent into one of four categories using the scores. In Table EFACT, the work-analysis group having scores above the mean on each factor can be described as expert-oriented strategic change agents with top-down decision-making orientation. Moving across rows in Table EFACT, the group in the top right cell has higher than sample mean scores on the depth/expert factor but lower than average scores on the strategic/change/ambiguity factor. As such, we characterize this group as expert-oriented maintenance agents with top-down decision-making orientation. Characterizations of the remaining groups are derived similarly and are included in the two-way classification Table EFACT, along with cell sizes and cell percentages for each.
Table EFACT. Classification table and descriptions for created groups
FACTOR 1: Strategic Change Ambiguous
Above sample mean At or below sample mean
FACTOR 2: Top-down
Depth/Expert
Above sample mean
n = 529 (26.44%) Depth/Expert Top-down Strategic Change Agent
n = 535 (26.74%) Depth/Expert Top-down
Tactical Maintenance Agent in a Stable Environment
At or below sample mean
n = 475 (23.74%) Social/Breadth Lateral
Strategic Change Agent in an Ambiguous Volatile
Environment
n = 462 (23.09%) Social/Breadth-Oriented
Lateral Tactical Maintenance Agent
A work-analysis group (4) x assessment Class (8) factorial ANOVA was conducted to examine the impact of group membership on WE. The omnibus test for the full model was significant (F [31, 969] = 6.14, p < .0001) and accounted for 16.4% of WE’s variance (point-biserial R = .40). Further examination showed significant and incremental main effects for both the work-analysis grouping (F [3, 969] = 6.39, p < .001, R2
= .02) and KF4D-Exec assessment classes (F [7, 969] = 11.72, p < .001). The interaction between the groups was also significant (F [21, 969] = 1.71, p < .05, R2
= .03) and suggests that, despite the notable unique main effects of each grouping variable, the impact of KF4D-Exec assessment scores are ultimately moderated by the four-level work-analysis
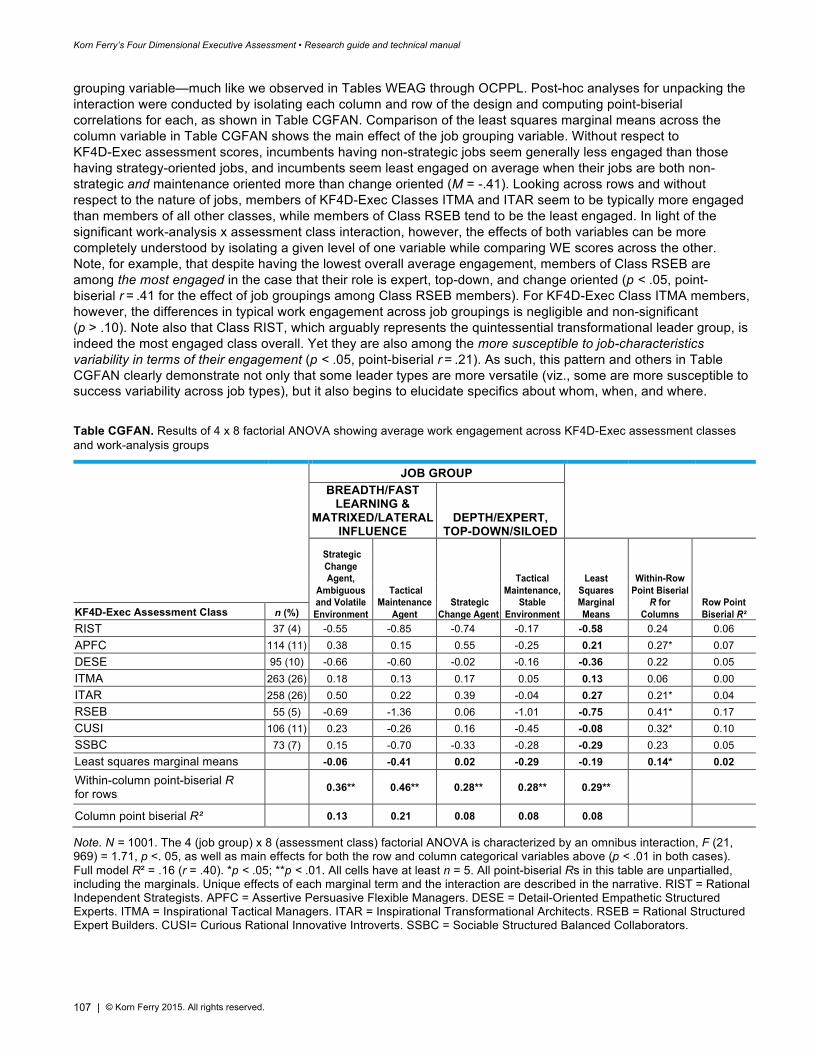
Korn Ferry’s Four Dimensional Executive Assessment • Research guide and technical manual
107 | © Korn Ferry 2015. All rights reserved.
grouping variable—much like we observed in Tables WEAG through OCPPL. Post-hoc analyses for unpacking the interaction were conducted by isolating each column and row of the design and computing point-biserial correlations for each, as shown in Table CGFAN. Comparison of the least squares marginal means across the column variable in Table CGFAN shows the main effect of the job grouping variable. Without respect to KF4D-Exec assessment scores, incumbents having non-strategic jobs seem generally less engaged than those having strategy-oriented jobs, and incumbents seem least engaged on average when their jobs are both non-strategic and maintenance oriented more than change oriented (M = -.41). Looking across rows and without respect to the nature of jobs, members of KF4D-Exec Classes ITMA and ITAR seem to be typically more engaged than members of all other classes, while members of Class RSEB tend to be the least engaged. In light of the significant work-analysis x assessment class interaction, however, the effects of both variables can be more completely understood by isolating a given level of one variable while comparing WE scores across the other. Note, for example, that despite having the lowest overall average engagement, members of Class RSEB are among the most engaged in the case that their role is expert, top-down, and change oriented (p < .05, point-biserial r = .41 for the effect of job groupings among Class RSEB members). For KF4D-Exec Class ITMA members, however, the differences in typical work engagement across job groupings is negligible and non-significant (p > .10). Note also that Class RIST, which arguably represents the quintessential transformational leader group, is indeed the most engaged class overall. Yet they are also among the more susceptible to job-characteristics variability in terms of their engagement (p < .05, point-biserial r = .21). As such, this pattern and others in Table CGFAN clearly demonstrate not only that some leader types are more versatile (viz., some are more susceptible to success variability across job types), but it also begins to elucidate specifics about whom, when, and where.
Table CGFAN. Results of 4 x 8 factorial ANOVA showing average work engagement across KF4D-Exec assessment classes and work-analysis groups
JOB GROUP
BREADTH/FAST LEARNING &
MATRIXED/LATERAL INFLUENCE
DEPTH/EXPERT, TOP-DOWN/SILOED
Strategic Change Agent,
Ambiguous and Volatile Environment
Tactical Maintenance
Agent Strategic
Change Agent
Tactical Maintenance,
Stable Environment
Least Squares Marginal Means
Within-Row Point Biserial
R for Columns
Row Point Biserial R²
KF4D-Exec Assessment Class n (%) RIST 37 (4) -0.55 -0.85 -0.74 -0.17 -0.58 0.24 0.06 APFC 114 (11) 0.38 0.15 0.55 -0.25 0.21 0.27* 0.07 DESE 95 (10) -0.66 -0.60 -0.02 -0.16 -0.36 0.22 0.05 ITMA 263 (26) 0.18 0.13 0.17 0.05 0.13 0.06 0.00 ITAR 258 (26) 0.50 0.22 0.39 -0.04 0.27 0.21* 0.04 RSEB 55 (5) -0.69 -1.36 0.06 -1.01 -0.75 0.41* 0.17 CUSI 106 (11) 0.23 -0.26 0.16 -0.45 -0.08 0.32* 0.10 SSBC 73 (7) 0.15 -0.70 -0.33 -0.28 -0.29 0.23 0.05 Least squares marginal means -0.06 -0.41 0.02 -0.29 -0.19 0.14* 0.02 Within-column point-biserial R for rows 0.36** 0.46** 0.28** 0.28** 0.29**
Column point biserial R² 0.13 0.21 0.08 0.08 0.08
Note. N = 1001. The 4 (job group) x 8 (assessment class) factorial ANOVA is characterized by an omnibus interaction, F (21, 969) = 1.71, p <. 05, as well as main effects for both the row and column categorical variables above (p < .01 in both cases). Full model R² = .16 (r = .40). *p < .05; **p < .01. All cells have at least n = 5. All point-biserial Rs in this table are unpartialled, including the marginals. Unique effects of each marginal term and the interaction are described in the narrative. RIST = Rational Independent Strategists. APFC = Assertive Persuasive Flexible Managers. DESE = Detail-Oriented Empathetic Structured Experts. ITMA = Inspirational Tactical Managers. ITAR = Inspirational Transformational Architects. RSEB = Rational Structured Expert Builders. CUSI= Curious Rational Innovative Introverts. SSBC = Sociable Structured Balanced Collaborators.
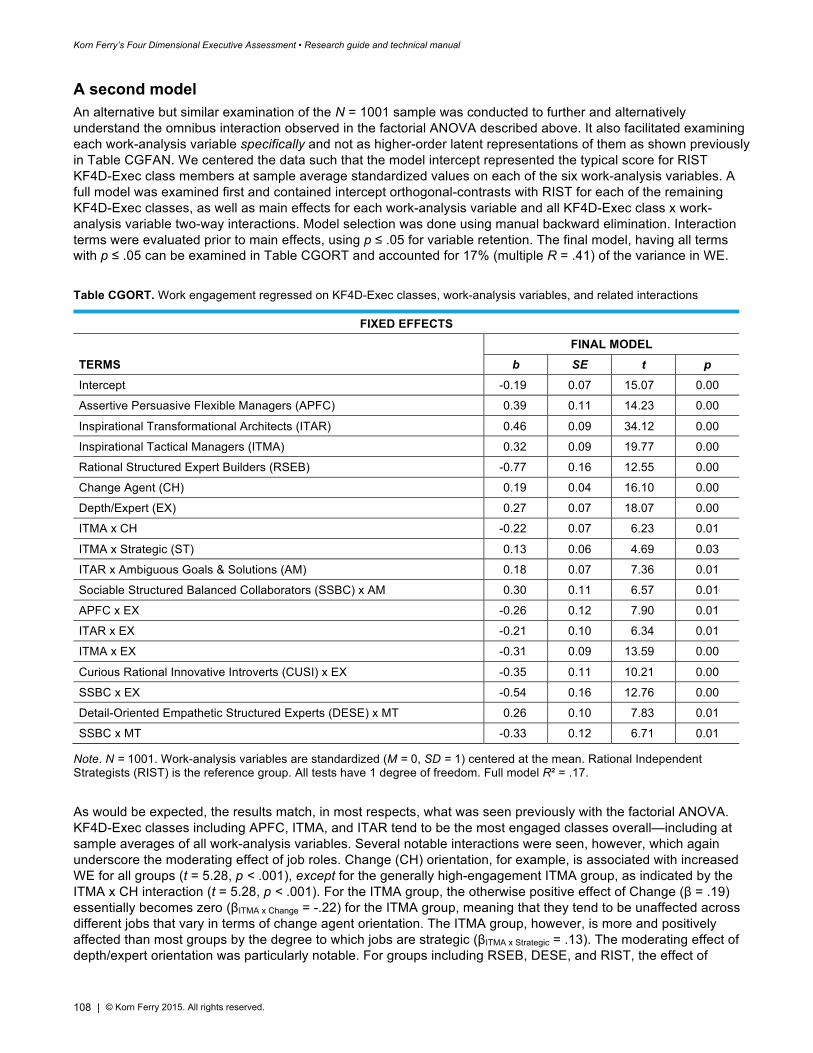
Korn Ferry’s Four Dimensional Executive Assessment • Research guide and technical manual
108 | © Korn Ferry 2015. All rights reserved.
A second model An alternative but similar examination of the N = 1001 sample was conducted to further and alternatively understand the omnibus interaction observed in the factorial ANOVA described above. It also facilitated examining each work-analysis variable specifically and not as higher-order latent representations of them as shown previously in Table CGFAN. We centered the data such that the model intercept represented the typical score for RIST KF4D-Exec class members at sample average standardized values on each of the six work-analysis variables. A full model was examined first and contained intercept orthogonal-contrasts with RIST for each of the remaining KF4D-Exec classes, as well as main effects for each work-analysis variable and all KF4D-Exec class x work-analysis variable two-way interactions. Model selection was done using manual backward elimination. Interaction terms were evaluated prior to main effects, using p ≤ .05 for variable retention. The final model, having all terms with p ≤ .05 can be examined in Table CGORT and accounted for 17% (multiple R = .41) of the variance in WE.
Table CGORT. Work engagement regressed on KF4D-Exec classes, work-analysis variables, and related interactions
FIXED EFFECTS FINAL MODEL
TERMS b SE t p Intercept -0.19 0.07 15.07 0.00
Assertive Persuasive Flexible Managers (APFC) 0.39 0.11 14.23 0.00
Inspirational Transformational Architects (ITAR) 0.46 0.09 34.12 0.00
Inspirational Tactical Managers (ITMA) 0.32 0.09 19.77 0.00
Rational Structured Expert Builders (RSEB) -0.77 0.16 12.55 0.00
Change Agent (CH) 0.19 0.04 16.10 0.00
Depth/Expert (EX) 0.27 0.07 18.07 0.00
ITMA x CH -0.22 0.07 6.23 0.01
ITMA x Strategic (ST) 0.13 0.06 4.69 0.03
ITAR x Ambiguous Goals & Solutions (AM) 0.18 0.07 7.36 0.01
Sociable Structured Balanced Collaborators (SSBC) x AM 0.30 0.11 6.57 0.01
APFC x EX -0.26 0.12 7.90 0.01
ITAR x EX -0.21 0.10 6.34 0.01
ITMA x EX -0.31 0.09 13.59 0.00
Curious Rational Innovative Introverts (CUSI) x EX -0.35 0.11 10.21 0.00
SSBC x EX -0.54 0.16 12.76 0.00
Detail-Oriented Empathetic Structured Experts (DESE) x MT 0.26 0.10 7.83 0.01
SSBC x MT -0.33 0.12 6.71 0.01
Note. N = 1001. Work-analysis variables are standardized (M = 0, SD = 1) centered at the mean. Rational Independent Strategists (RIST) is the reference group. All tests have 1 degree of freedom. Full model R² = .17.
As would be expected, the results match, in most respects, what was seen previously with the factorial ANOVA. KF4D-Exec classes including APFC, ITMA, and ITAR tend to be the most engaged classes overall—including at sample averages of all work-analysis variables. Several notable interactions were seen, however, which again underscore the moderating effect of job roles. Change (CH) orientation, for example, is associated with increased WE for all groups (t = 5.28, p < .001), except for the generally high-engagement ITMA group, as indicated by the ITMA x CH interaction (t = 5.28, p < .001). For the ITMA group, the otherwise positive effect of Change (β = .19) essentially becomes zero (βITMA x Change = -.22) for the ITMA group, meaning that they tend to be unaffected across different jobs that vary in terms of change agent orientation. The ITMA group, however, is more and positively affected than most groups by the degree to which jobs are strategic (βITMA x Strategic = .13). The moderating effect of depth/expert orientation was particularly notable. For groups including RSEB, DESE, and RIST, the effect of
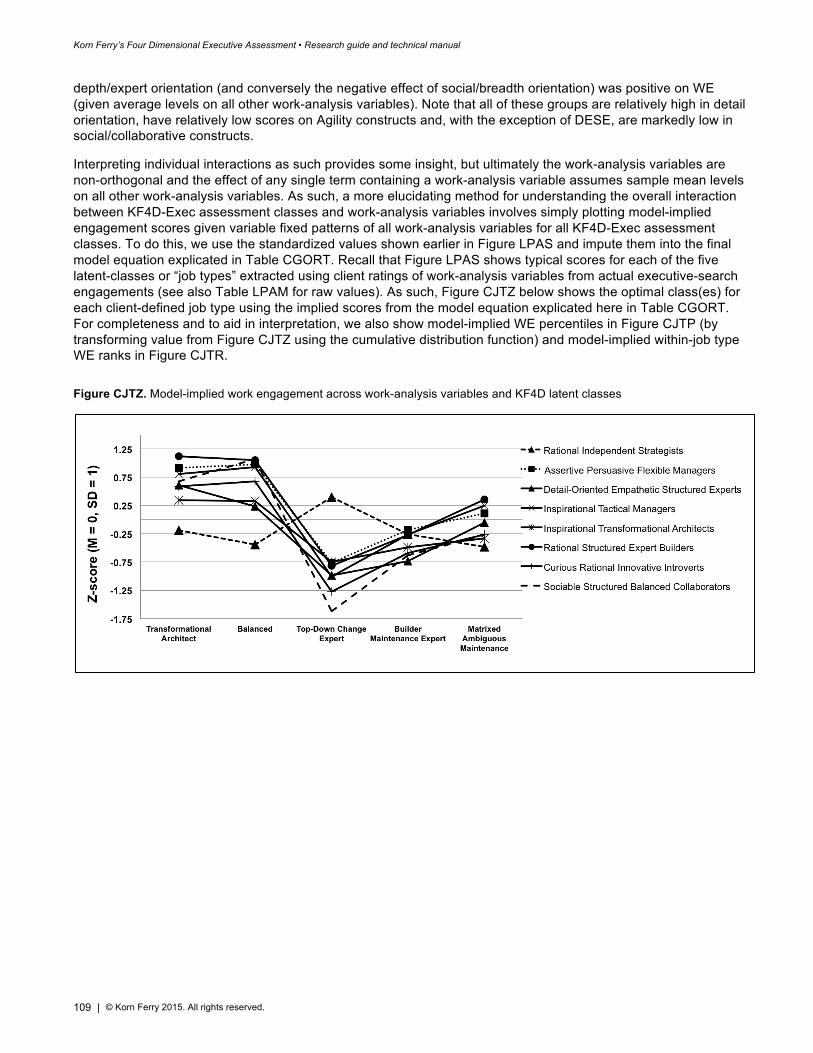
Korn Ferry’s Four Dimensional Executive Assessment • Research guide and technical manual
109 | © Korn Ferry 2015. All rights reserved.
depth/expert orientation (and conversely the negative effect of social/breadth orientation) was positive on WE (given average levels on all other work-analysis variables). Note that all of these groups are relatively high in detail orientation, have relatively low scores on Agility constructs and, with the exception of DESE, are markedly low in social/collaborative constructs.
Interpreting individual interactions as such provides some insight, but ultimately the work-analysis variables are non-orthogonal and the effect of any single term containing a work-analysis variable assumes sample mean levels on all other work-analysis variables. As such, a more elucidating method for understanding the overall interaction between KF4D-Exec assessment classes and work-analysis variables involves simply plotting model-implied engagement scores given variable fixed patterns of all work-analysis variables for all KF4D-Exec assessment classes. To do this, we use the standardized values shown earlier in Figure LPAS and impute them into the final model equation explicated in Table CGORT. Recall that Figure LPAS shows typical scores for each of the five latent-classes or “job types” extracted using client ratings of work-analysis variables from actual executive-search engagements (see also Table LPAM for raw values). As such, Figure CJTZ below shows the optimal class(es) for each client-defined job type using the implied scores from the model equation explicated here in Table CGORT. For completeness and to aid in interpretation, we also show model-implied WE percentiles in Figure CJTP (by transforming value from Figure CJTZ using the cumulative distribution function) and model-implied within-job type WE ranks in Figure CJTR.
Figure CJTZ. Model-implied work engagement across work-analysis variables and KF4D latent classes
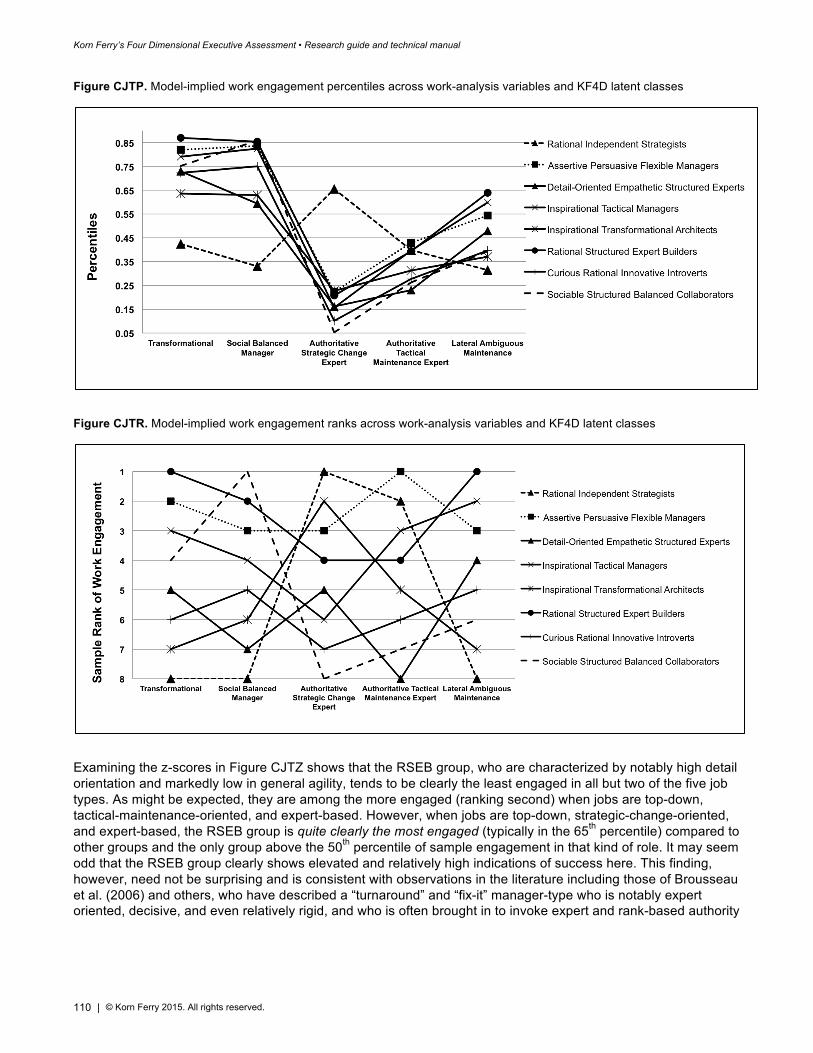
Korn Ferry’s Four Dimensional Executive Assessment • Research guide and technical manual
110 | © Korn Ferry 2015. All rights reserved.
Figure CJTP. Model-implied work engagement percentiles across work-analysis variables and KF4D latent classes
Figure CJTR. Model-implied work engagement ranks across work-analysis variables and KF4D latent classes
Examining the z-scores in Figure CJTZ shows that the RSEB group, who are characterized by notably high detail orientation and markedly low in general agility, tends to be clearly the least engaged in all but two of the five job types. As might be expected, they are among the more engaged (ranking second) when jobs are top-down, tactical-maintenance-oriented, and expert-based. However, when jobs are top-down, strategic-change-oriented, and expert-based, the RSEB group is quite clearly the most engaged (typically in the 65th percentile) compared to other groups and the only group above the 50th percentile of sample engagement in that kind of role. It may seem odd that the RSEB group clearly shows elevated and relatively high indications of success here. This finding, however, need not be surprising and is consistent with observations in the literature including those of Brousseau et al. (2006) and others, who have described a “turnaround” and “fix-it” manager-type who is notably expert oriented, decisive, and even relatively rigid, and who is often brought in to invoke expert and rank-based authority
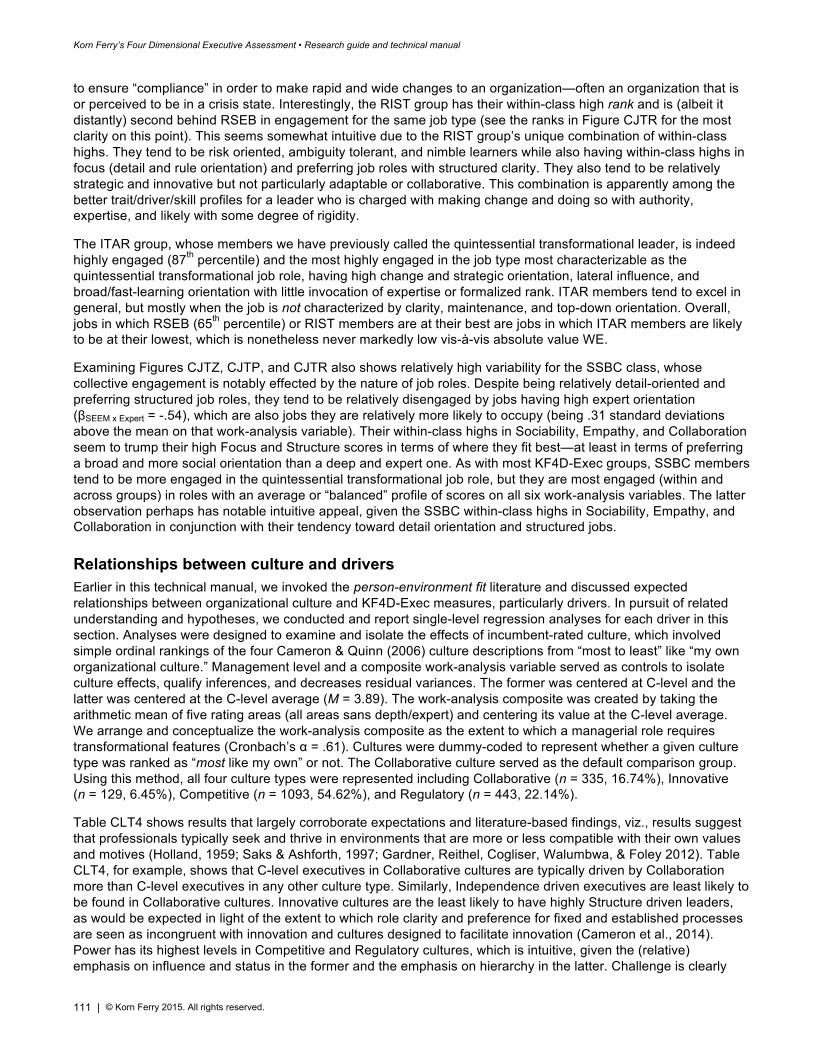
Korn Ferry’s Four Dimensional Executive Assessment • Research guide and technical manual
111 | © Korn Ferry 2015. All rights reserved.
to ensure “compliance” in order to make rapid and wide changes to an organization—often an organization that is or perceived to be in a crisis state. Interestingly, the RIST group has their within-class high rank and is (albeit it distantly) second behind RSEB in engagement for the same job type (see the ranks in Figure CJTR for the most clarity on this point). This seems somewhat intuitive due to the RIST group’s unique combination of within-class highs. They tend to be risk oriented, ambiguity tolerant, and nimble learners while also having within-class highs in focus (detail and rule orientation) and preferring job roles with structured clarity. They also tend to be relatively strategic and innovative but not particularly adaptable or collaborative. This combination is apparently among the better trait/driver/skill profiles for a leader who is charged with making change and doing so with authority, expertise, and likely with some degree of rigidity.
The ITAR group, whose members we have previously called the quintessential transformational leader, is indeed highly engaged (87th percentile) and the most highly engaged in the job type most characterizable as the quintessential transformational job role, having high change and strategic orientation, lateral influence, and broad/fast-learning orientation with little invocation of expertise or formalized rank. ITAR members tend to excel in general, but mostly when the job is not characterized by clarity, maintenance, and top-down orientation. Overall, jobs in which RSEB (65th percentile) or RIST members are at their best are jobs in which ITAR members are likely to be at their lowest, which is nonetheless never markedly low vis-à-vis absolute value WE.
Examining Figures CJTZ, CJTP, and CJTR also shows relatively high variability for the SSBC class, whose collective engagement is notably effected by the nature of job roles. Despite being relatively detail-oriented and preferring structured job roles, they tend to be relatively disengaged by jobs having high expert orientation (βSEEM x Expert = -.54), which are also jobs they are relatively more likely to occupy (being .31 standard deviations above the mean on that work-analysis variable). Their within-class highs in Sociability, Empathy, and Collaboration seem to trump their high Focus and Structure scores in terms of where they fit best—at least in terms of preferring a broad and more social orientation than a deep and expert one. As with most KF4D-Exec groups, SSBC members tend to be more engaged in the quintessential transformational job role, but they are most engaged (within and across groups) in roles with an average or “balanced” profile of scores on all six work-analysis variables. The latter observation perhaps has notable intuitive appeal, given the SSBC within-class highs in Sociability, Empathy, and Collaboration in conjunction with their tendency toward detail orientation and structured jobs.
Relationships between culture and drivers Earlier in this technical manual, we invoked the person-environment fit literature and discussed expected relationships between organizational culture and KF4D-Exec measures, particularly drivers. In pursuit of related understanding and hypotheses, we conducted and report single-level regression analyses for each driver in this section. Analyses were designed to examine and isolate the effects of incumbent-rated culture, which involved simple ordinal rankings of the four Cameron & Quinn (2006) culture descriptions from “most to least” like “my own organizational culture.” Management level and a composite work-analysis variable served as controls to isolate culture effects, qualify inferences, and decreases residual variances. The former was centered at C-level and the latter was centered at the C-level average (M = 3.89). The work-analysis composite was created by taking the arithmetic mean of five rating areas (all areas sans depth/expert) and centering its value at the C-level average. We arrange and conceptualize the work-analysis composite as the extent to which a managerial role requires transformational features (Cronbach’s α = .61). Cultures were dummy-coded to represent whether a given culture type was ranked as “most like my own” or not. The Collaborative culture served as the default comparison group. Using this method, all four culture types were represented including Collaborative (n = 335, 16.74%), Innovative (n = 129, 6.45%), Competitive (n = 1093, 54.62%), and Regulatory (n = 443, 22.14%).
Table CLT4 shows results that largely corroborate expectations and literature-based findings, viz., results suggest that professionals typically seek and thrive in environments that are more or less compatible with their own values and motives (Holland, 1959; Saks & Ashforth, 1997; Gardner, Reithel, Cogliser, Walumbwa, & Foley 2012). Table CLT4, for example, shows that C-level executives in Collaborative cultures are typically driven by Collaboration more than C-level executives in any other culture type. Similarly, Independence driven executives are least likely to be found in Collaborative cultures. Innovative cultures are the least likely to have highly Structure driven leaders, as would be expected in light of the extent to which role clarity and preference for fixed and established processes are seen as incongruent with innovation and cultures designed to facilitate innovation (Cameron et al., 2014). Power has its highest levels in Competitive and Regulatory cultures, which is intuitive, given the (relative) emphasis on influence and status in the former and the emphasis on hierarchy in the latter. Challenge is clearly
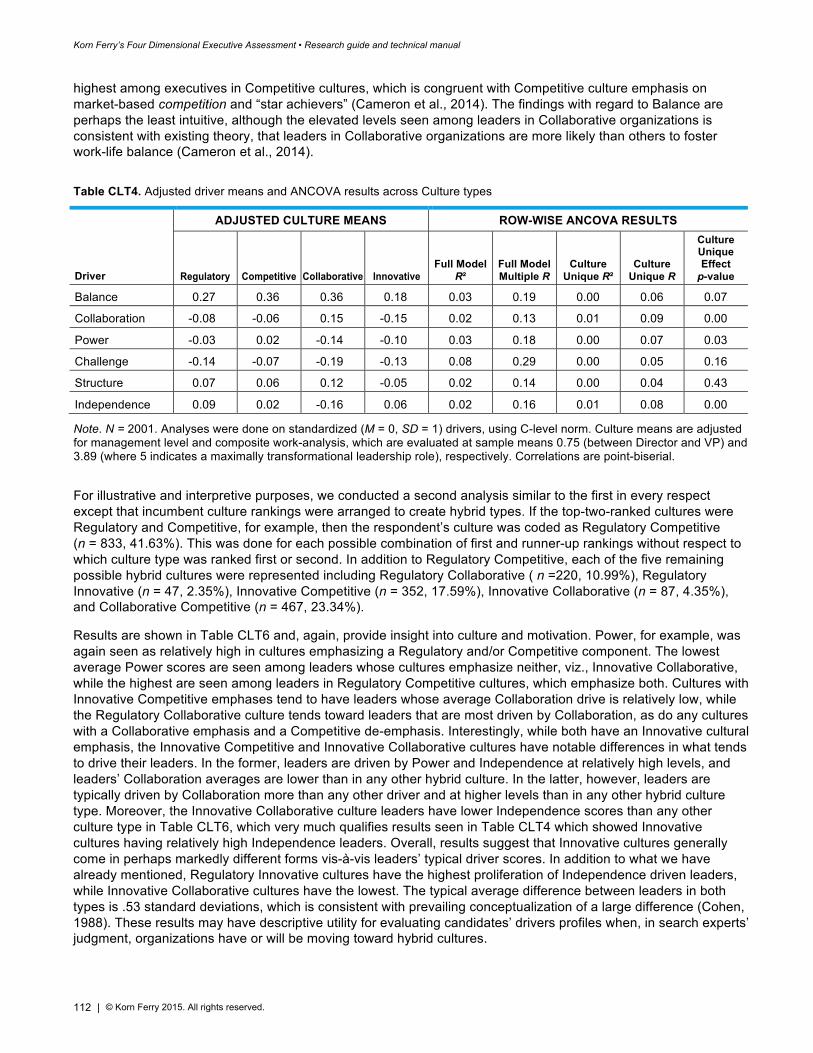
Korn Ferry’s Four Dimensional Executive Assessment • Research guide and technical manual
112 | © Korn Ferry 2015. All rights reserved.
highest among executives in Competitive cultures, which is congruent with Competitive culture emphasis on market-based competition and “star achievers” (Cameron et al., 2014). The findings with regard to Balance are perhaps the least intuitive, although the elevated levels seen among leaders in Collaborative organizations is consistent with existing theory, that leaders in Collaborative organizations are more likely than others to foster work-life balance (Cameron et al., 2014).
Table CLT4. Adjusted driver means and ANCOVA results across Culture types
Driver
ADJUSTED CULTURE MEANS ROW-WISE ANCOVA RESULTS
Regulatory Competitive Collaborative Innovative Full Model
R² Full Model Multiple R
Culture Unique R²
Culture Unique R
Culture Unique Effect
p-value
Balance 0.27 0.36 0.36 0.18 0.03 0.19 0.00 0.06 0.07
Collaboration -0.08 -0.06 0.15 -0.15 0.02 0.13 0.01 0.09 0.00
Power -0.03 0.02 -0.14 -0.10 0.03 0.18 0.00 0.07 0.03
Challenge -0.14 -0.07 -0.19 -0.13 0.08 0.29 0.00 0.05 0.16
Structure 0.07 0.06 0.12 -0.05 0.02 0.14 0.00 0.04 0.43
Independence 0.09 0.02 -0.16 0.06 0.02 0.16 0.01 0.08 0.00
Note. N = 2001. Analyses were done on standardized (M = 0, SD = 1) drivers, using C-level norm. Culture means are adjusted for management level and composite work-analysis, which are evaluated at sample means 0.75 (between Director and VP) and 3.89 (where 5 indicates a maximally transformational leadership role), respectively. Correlations are point-biserial.
For illustrative and interpretive purposes, we conducted a second analysis similar to the first in every respect except that incumbent culture rankings were arranged to create hybrid types. If the top-two-ranked cultures were Regulatory and Competitive, for example, then the respondent’s culture was coded as Regulatory Competitive (n = 833, 41.63%). This was done for each possible combination of first and runner-up rankings without respect to which culture type was ranked first or second. In addition to Regulatory Competitive, each of the five remaining possible hybrid cultures were represented including Regulatory Collaborative ( n =220, 10.99%), Regulatory Innovative (n = 47, 2.35%), Innovative Competitive (n = 352, 17.59%), Innovative Collaborative (n = 87, 4.35%), and Collaborative Competitive (n = 467, 23.34%).
Results are shown in Table CLT6 and, again, provide insight into culture and motivation. Power, for example, was again seen as relatively high in cultures emphasizing a Regulatory and/or Competitive component. The lowest average Power scores are seen among leaders whose cultures emphasize neither, viz., Innovative Collaborative, while the highest are seen among leaders in Regulatory Competitive cultures, which emphasize both. Cultures with Innovative Competitive emphases tend to have leaders whose average Collaboration drive is relatively low, while the Regulatory Collaborative culture tends toward leaders that are most driven by Collaboration, as do any cultures with a Collaborative emphasis and a Competitive de-emphasis. Interestingly, while both have an Innovative cultural emphasis, the Innovative Competitive and Innovative Collaborative cultures have notable differences in what tends to drive their leaders. In the former, leaders are driven by Power and Independence at relatively high levels, and leaders’ Collaboration averages are lower than in any other hybrid culture. In the latter, however, leaders are typically driven by Collaboration more than any other driver and at higher levels than in any other hybrid culture type. Moreover, the Innovative Collaborative culture leaders have lower Independence scores than any other culture type in Table CLT6, which very much qualifies results seen in Table CLT4 which showed Innovative cultures having relatively high Independence leaders. Overall, results suggest that Innovative cultures generally come in perhaps markedly different forms vis-à-vis leaders’ typical driver scores. In addition to what we have already mentioned, Regulatory Innovative cultures have the highest proliferation of Independence driven leaders, while Innovative Collaborative cultures have the lowest. The typical average difference between leaders in both types is .53 standard deviations, which is consistent with prevailing conceptualization of a large difference (Cohen, 1988). These results may have descriptive utility for evaluating candidates’ drivers profiles when, in search experts’ judgment, organizations have or will be moving toward hybrid cultures.
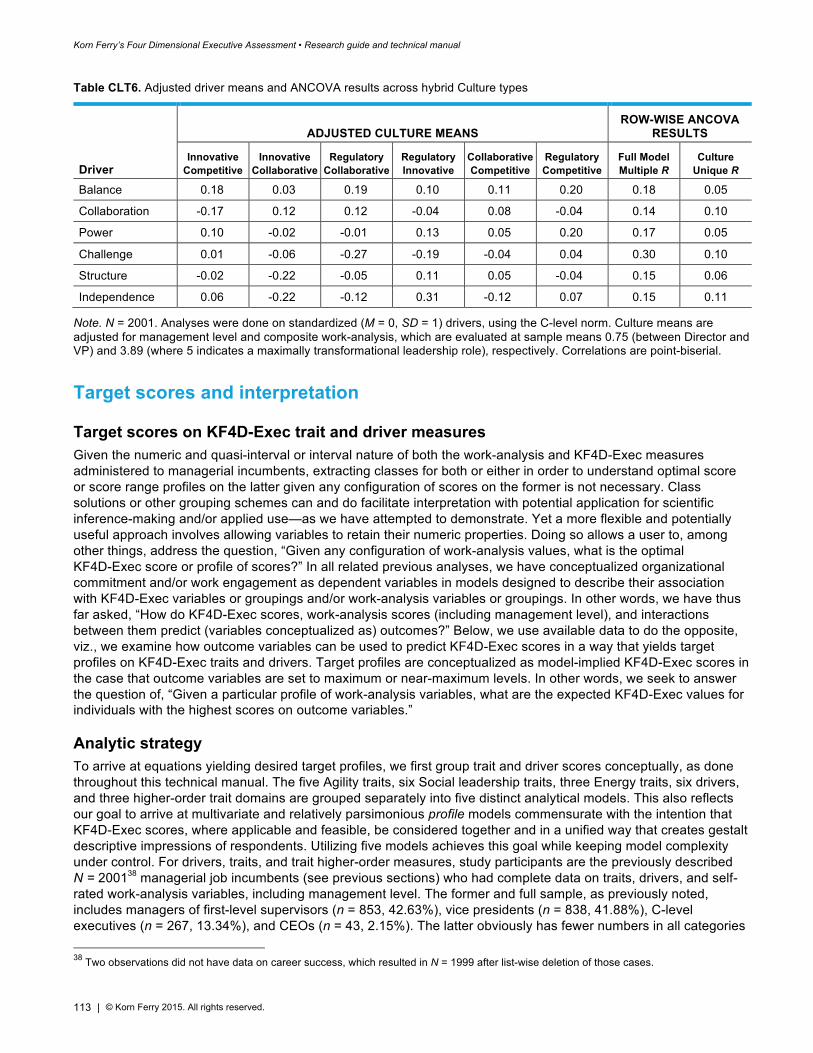
Korn Ferry’s Four Dimensional Executive Assessment • Research guide and technical manual
113 | © Korn Ferry 2015. All rights reserved.
Table CLT6. Adjusted driver means and ANCOVA results across hybrid Culture types
ADJUSTED CULTURE MEANS ROW-WISE ANCOVA
RESULTS
Driver Innovative
Competitive Innovative
Collaborative Regulatory
Collaborative Regulatory Innovative
Collaborative Competitive
Regulatory Competitive
Full Model Multiple R
Culture Unique R
Balance 0.18 0.03 0.19 0.10 0.11 0.20 0.18 0.05
Collaboration -0.17 0.12 0.12 -0.04 0.08 -0.04 0.14 0.10
Power 0.10 -0.02 -0.01 0.13 0.05 0.20 0.17 0.05
Challenge 0.01 -0.06 -0.27 -0.19 -0.04 0.04 0.30 0.10
Structure -0.02 -0.22 -0.05 0.11 0.05 -0.04 0.15 0.06
Independence 0.06 -0.22 -0.12 0.31 -0.12 0.07 0.15 0.11
Note. N = 2001. Analyses were done on standardized (M = 0, SD = 1) drivers, using the C-level norm. Culture means are adjusted for management level and composite work-analysis, which are evaluated at sample means 0.75 (between Director and VP) and 3.89 (where 5 indicates a maximally transformational leadership role), respectively. Correlations are point-biserial.
Target scores and interpretation
Target scores on KF4D-Exec trait and driver measures Given the numeric and quasi-interval or interval nature of both the work-analysis and KF4D-Exec measures administered to managerial incumbents, extracting classes for both or either in order to understand optimal score or score range profiles on the latter given any configuration of scores on the former is not necessary. Class solutions or other grouping schemes can and do facilitate interpretation with potential application for scientific inference-making and/or applied use—as we have attempted to demonstrate. Yet a more flexible and potentially useful approach involves allowing variables to retain their numeric properties. Doing so allows a user to, among other things, address the question, “Given any configuration of work-analysis values, what is the optimal KF4D-Exec score or profile of scores?” In all related previous analyses, we have conceptualized organizational commitment and/or work engagement as dependent variables in models designed to describe their association with KF4D-Exec variables or groupings and/or work-analysis variables or groupings. In other words, we have thus far asked, “How do KF4D-Exec scores, work-analysis scores (including management level), and interactions between them predict (variables conceptualized as) outcomes?” Below, we use available data to do the opposite, viz., we examine how outcome variables can be used to predict KF4D-Exec scores in a way that yields target profiles on KF4D-Exec traits and drivers. Target profiles are conceptualized as model-implied KF4D-Exec scores in the case that outcome variables are set to maximum or near-maximum levels. In other words, we seek to answer the question of, “Given a particular profile of work-analysis variables, what are the expected KF4D-Exec values for individuals with the highest scores on outcome variables.”
Analytic strategy To arrive at equations yielding desired target profiles, we first group trait and driver scores conceptually, as done throughout this technical manual. The five Agility traits, six Social leadership traits, three Energy traits, six drivers, and three higher-order trait domains are grouped separately into five distinct analytical models. This also reflects our goal to arrive at multivariate and relatively parsimonious profile models commensurate with the intention that KF4D-Exec scores, where applicable and feasible, be considered together and in a unified way that creates gestalt descriptive impressions of respondents. Utilizing five models achieves this goal while keeping model complexity under control. For drivers, traits, and trait higher-order measures, study participants are the previously described N = 200138 managerial job incumbents (see previous sections) who had complete data on traits, drivers, and self-rated work-analysis variables, including management level. The former and full sample, as previously noted, includes managers of first-level supervisors (n = 853, 42.63%), vice presidents (n = 838, 41.88%), C-level executives (n = 267, 13.34%), and CEOs (n = 43, 2.15%). The latter obviously has fewer numbers in all categories 38 Two observations did not have data on career success, which resulted in N = 1999 after list-wise deletion of those cases.
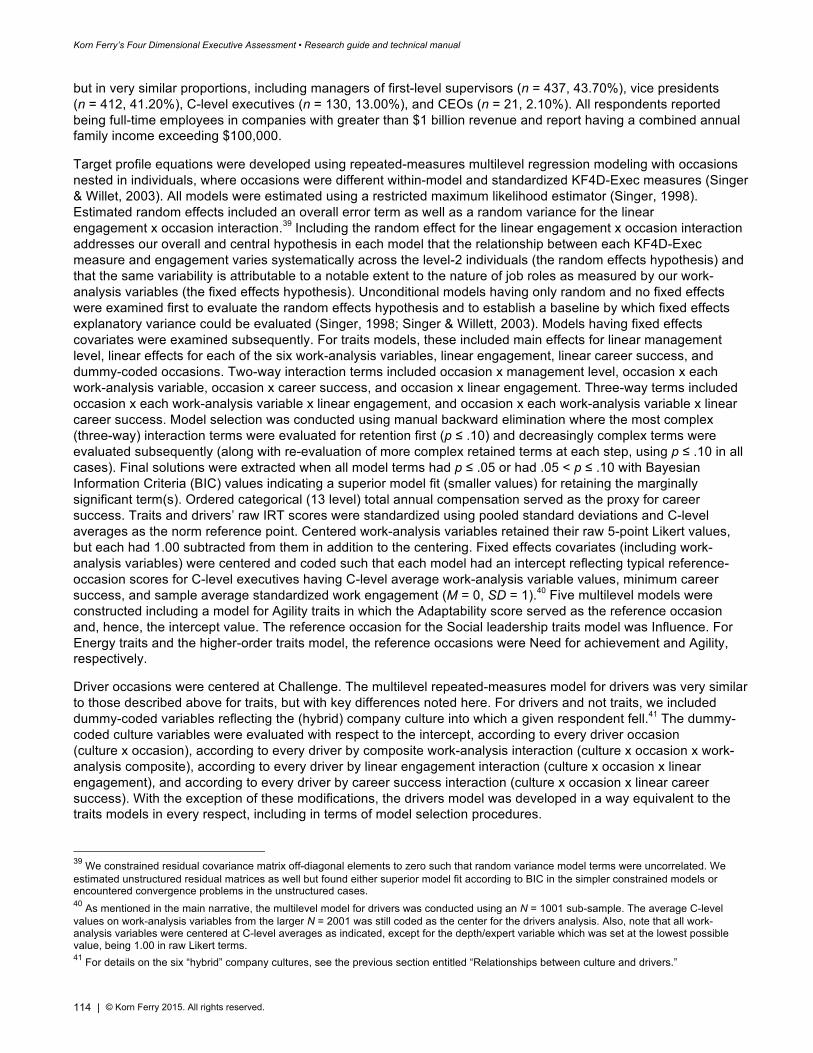
Korn Ferry’s Four Dimensional Executive Assessment • Research guide and technical manual
114 | © Korn Ferry 2015. All rights reserved.
but in very similar proportions, including managers of first-level supervisors (n = 437, 43.70%), vice presidents (n = 412, 41.20%), C-level executives (n = 130, 13.00%), and CEOs (n = 21, 2.10%). All respondents reported being full-time employees in companies with greater than $1 billion revenue and report having a combined annual family income exceeding $100,000.
Target profile equations were developed using repeated-measures multilevel regression modeling with occasions nested in individuals, where occasions were different within-model and standardized KF4D-Exec measures (Singer & Willet, 2003). All models were estimated using a restricted maximum likelihood estimator (Singer, 1998). Estimated random effects included an overall error term as well as a random variance for the linear engagement x occasion interaction.39 Including the random effect for the linear engagement x occasion interaction addresses our overall and central hypothesis in each model that the relationship between each KF4D-Exec measure and engagement varies systematically across the level-2 individuals (the random effects hypothesis) and that the same variability is attributable to a notable extent to the nature of job roles as measured by our work-analysis variables (the fixed effects hypothesis). Unconditional models having only random and no fixed effects were examined first to evaluate the random effects hypothesis and to establish a baseline by which fixed effects explanatory variance could be evaluated (Singer, 1998; Singer & Willett, 2003). Models having fixed effects covariates were examined subsequently. For traits models, these included main effects for linear management level, linear effects for each of the six work-analysis variables, linear engagement, linear career success, and dummy-coded occasions. Two-way interaction terms included occasion x management level, occasion x each work-analysis variable, occasion x career success, and occasion x linear engagement. Three-way terms included occasion x each work-analysis variable x linear engagement, and occasion x each work-analysis variable x linear career success. Model selection was conducted using manual backward elimination where the most complex (three-way) interaction terms were evaluated for retention first (p ≤ .10) and decreasingly complex terms were evaluated subsequently (along with re-evaluation of more complex retained terms at each step, using p ≤ .10 in all cases). Final solutions were extracted when all model terms had p ≤ .05 or had .05 < p ≤ .10 with Bayesian Information Criteria (BIC) values indicating a superior model fit (smaller values) for retaining the marginally significant term(s). Ordered categorical (13 level) total annual compensation served as the proxy for career success. Traits and drivers’ raw IRT scores were standardized using pooled standard deviations and C-level averages as the norm reference point. Centered work-analysis variables retained their raw 5-point Likert values, but each had 1.00 subtracted from them in addition to the centering. Fixed effects covariates (including work-analysis variables) were centered and coded such that each model had an intercept reflecting typical reference-occasion scores for C-level executives having C-level average work-analysis variable values, minimum career success, and sample average standardized work engagement (M = 0, SD = 1).40 Five multilevel models were constructed including a model for Agility traits in which the Adaptability score served as the reference occasion and, hence, the intercept value. The reference occasion for the Social leadership traits model was Influence. For Energy traits and the higher-order traits model, the reference occasions were Need for achievement and Agility, respectively.
Driver occasions were centered at Challenge. The multilevel repeated-measures model for drivers was very similar to those described above for traits, but with key differences noted here. For drivers and not traits, we included dummy-coded variables reflecting the (hybrid) company culture into which a given respondent fell.41 The dummy-coded culture variables were evaluated with respect to the intercept, according to every driver occasion (culture x occasion), according to every driver by composite work-analysis interaction (culture x occasion x work-analysis composite), according to every driver by linear engagement interaction (culture x occasion x linear engagement), and according to every driver by career success interaction (culture x occasion x linear career success). With the exception of these modifications, the drivers model was developed in a way equivalent to the traits models in every respect, including in terms of model selection procedures.
39 We constrained residual covariance matrix off-diagonal elements to zero such that random variance model terms were uncorrelated. We estimated unstructured residual matrices as well but found either superior model fit according to BIC in the simpler constrained models or encountered convergence problems in the unstructured cases. 40 As mentioned in the main narrative, the multilevel model for drivers was conducted using an N = 1001 sub-sample. The average C-level values on work-analysis variables from the larger N = 2001 was still coded as the center for the drivers analysis. Also, note that all work-analysis variables were centered at C-level averages as indicated, except for the depth/expert variable which was set at the lowest possible value, being 1.00 in raw Likert terms. 41 For details on the six “hybrid” company cultures, see the previous section entitled “Relationships between culture and drivers.”
Korn Ferry’s Four Dimensional Executive Assessment • Research guide and technical manual
115 | © Korn Ferry 2015. All rights reserved.
As mentioned above, all models were analyzed using sample based z-scores and yielded typical case z-scores for the most highly engaged and most successful managers (or for any other desired values of engagement and career success) given any configuration of work-analysis variables, including management level. We converted model-implied scores to percentiles (using the cumulative distribution function) in some cases for descriptive purposes as shown in subsequent sections.
Agility results. The unconditional model showed significant random variance for level-2 individuals overall (σ2 = .193, z = 16.09, p < .0001), the work engagement (WE) x within-individual occasion interaction (WIOC) (σ2 = .040, z = 3.10, p < .001), and the overall level-1 occasion residual (σ2 = .836, z = 49.70, p < .0001). We therefore retained all random effects and continued with the full model containing all fixed effects covariates and interactions of interest. The full model yielded 6 three-way interactions that were retained according to the inclusion threshold (p ≤ .10). These included the Career success (CS) x Focus (FO) x Strategic orientation (ST) term (t [7908] = -1.67, p < .10), the CS x Risk-taking (RI) x ST term (t [7908] = 2.06, p < .05), the WE x FO x Quick/volatile objectives (QU) term (t [7908] = -1.91, p < .10), the WE x Tolerance of ambiguity (TA) x Ambiguous goals and solutions (AM) term (t [7908] = 1.70, p < .10), the WE x RI x Matrixed/Lateral influence (MT) term (t [7908] = -1.81, p < .10), and the WE x FO x Depth/Expert (EX) term (t [7908] = 3.21, p < .01). All other three-way interactions failed to meet the inclusion threshold and were discarded. A first reduced model was examined and revealed that two of the previously included three-way interactions now failed to meet the inclusion threshold. These included WE x FO x QU (t [7950] = -1.50, p = .13), and WE x TA x AM (t [7950] = 1.40, p = .16). These were discarded and the model was again estimated. In this model, all remaining three-way interactions again met the inclusion threshold as did 12 two-way interactions including CS x QU (t [7952] = -2.41, p < .05), CS x FO (t [7952] = -5.76, p < .0001), FO x Management level (ML) (t [7952] = -2.90, p < .01), Curiosity (CU) x ML (t [7952] = -2.91, p < .01), FO x EX (t [7952] = 8.77, p < .0001), CU x EX (t [7952] = 4.38, p < .0001), FO x MT (t [7952] = -4.26, p < .0001), TA x AM (t [7952] = 1.75, p < .10), FO x AM (t [7952] = -7.11, p < .0001), FO x QU (t [7952] = -2.97, p < .01), CU x QU (t [7952] = -3.92, p < .0001), FO x Change orientation (CH) (t [7952] = -2.26, p < .05), WE x RI (t [7952] = -3.15, p < .01), WE x FO (t [7952] = -4.71, p < .0001), WE x CU (t [7952] = -3.79, p < .01), WE x EX (t [1976] = -2.96, p < .01), and WE x QU (t [1976] = 1.78, p < .10). All other interaction terms were discarded and we examined another reduced model that revealed no changes with regard to any previously retained interaction terms and only a single main effect that failed to meet the inclusion threshold, viz., the main effect of FO (t [7974] = -0.98, p = .33). This term was discarded and another reduced model estimated in which all remaining terms met the inclusion threshold, but one term had .05 < p < .10, viz., the CS x QU interaction (t [1986] = -1.70, p = .09). This term was removed and the model was re-estimated. The re-estimated model had all remaining effects with p ≤ .05 and a BIC value (27623.4) indicating a superior fit compared to the former model (BIC = 27629.3). The model with the marginally significant term was therefore discarded in favor of the latter and final model.
The final model with all retained covariates and interactions accounted for 28.65% of the random level-2 variance attributable to individuals, 47.50% of the random WE x WIOC variance (meaning the variability in the relationship between WE and Agility sub-domains across individuals), and 5.98% of the level-1 occasion variance. All random variances did, however, remain significantly non-zero (p < .05). Full and final model results can be examined in detail in Table MLM1.
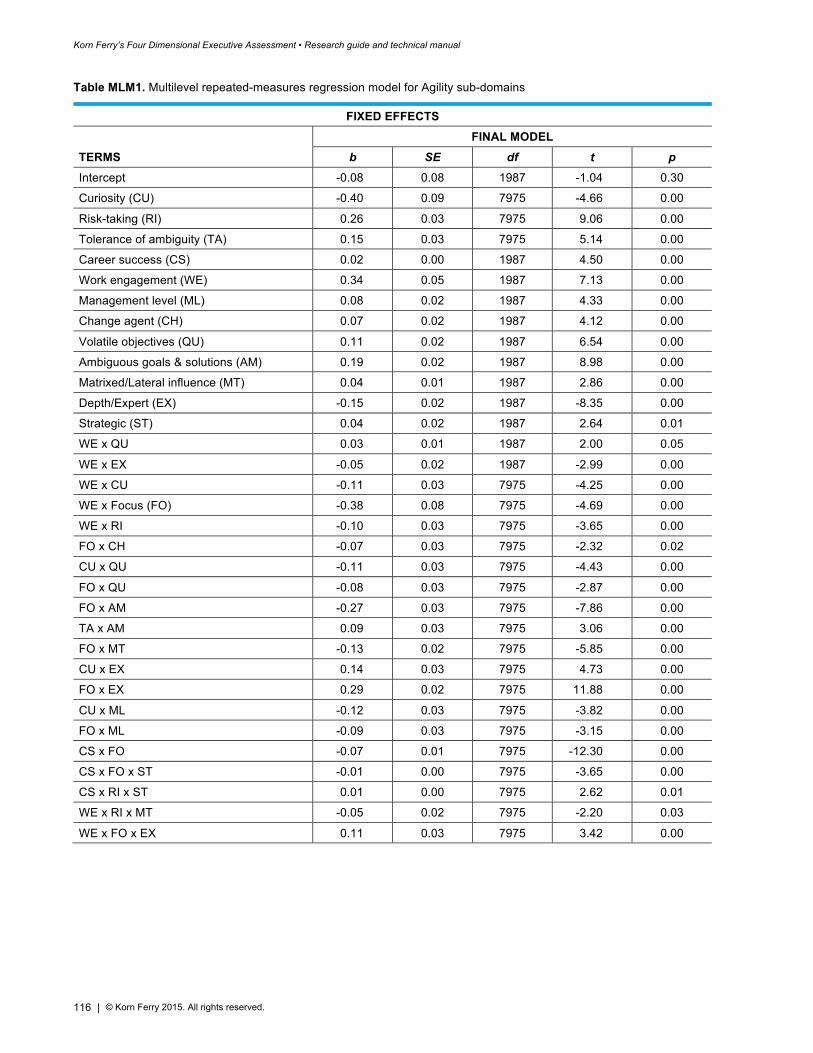
Korn Ferry’s Four Dimensional Executive Assessment • Research guide and technical manual
116 | © Korn Ferry 2015. All rights reserved.
Table MLM1. Multilevel repeated-measures regression model for Agility sub-domains
FIXED EFFECTS FINAL MODEL
TERMS b SE df t p Intercept -0.08 0.08 1987 -1.04 0.30
Curiosity (CU) -0.40 0.09 7975 -4.66 0.00
Risk-taking (RI) 0.26 0.03 7975 9.06 0.00
Tolerance of ambiguity (TA) 0.15 0.03 7975 5.14 0.00
Career success (CS) 0.02 0.00 1987 4.50 0.00
Work engagement (WE) 0.34 0.05 1987 7.13 0.00
Management level (ML) 0.08 0.02 1987 4.33 0.00
Change agent (CH) 0.07 0.02 1987 4.12 0.00
Volatile objectives (QU) 0.11 0.02 1987 6.54 0.00
Ambiguous goals & solutions (AM) 0.19 0.02 1987 8.98 0.00
Matrixed/Lateral influence (MT) 0.04 0.01 1987 2.86 0.00
Depth/Expert (EX) -0.15 0.02 1987 -8.35 0.00
Strategic (ST) 0.04 0.02 1987 2.64 0.01
WE x QU 0.03 0.01 1987 2.00 0.05
WE x EX -0.05 0.02 1987 -2.99 0.00
WE x CU -0.11 0.03 7975 -4.25 0.00
WE x Focus (FO) -0.38 0.08 7975 -4.69 0.00
WE x RI -0.10 0.03 7975 -3.65 0.00
FO x CH -0.07 0.03 7975 -2.32 0.02
CU x QU -0.11 0.03 7975 -4.43 0.00
FO x QU -0.08 0.03 7975 -2.87 0.00
FO x AM -0.27 0.03 7975 -7.86 0.00
TA x AM 0.09 0.03 7975 3.06 0.00
FO x MT -0.13 0.02 7975 -5.85 0.00
CU x EX 0.14 0.03 7975 4.73 0.00
FO x EX 0.29 0.02 7975 11.88 0.00
CU x ML -0.12 0.03 7975 -3.82 0.00
FO x ML -0.09 0.03 7975 -3.15 0.00
CS x FO -0.07 0.01 7975 -12.30 0.00
CS x FO x ST -0.01 0.00 7975 -3.65 0.00
CS x RI x ST 0.01 0.00 7975 2.62 0.01
WE x RI x MT -0.05 0.02 7975 -2.20 0.03
WE x FO x EX 0.11 0.03 7975 3.42 0.00
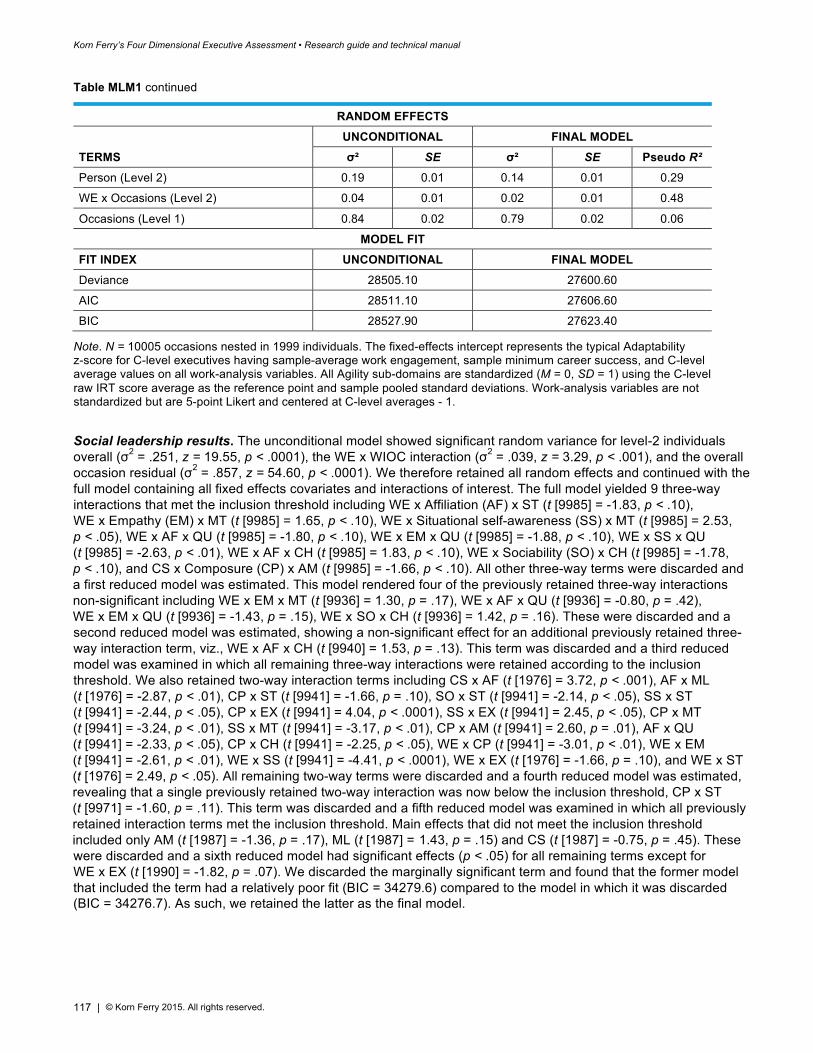
Korn Ferry’s Four Dimensional Executive Assessment • Research guide and technical manual
117 | © Korn Ferry 2015. All rights reserved.
Table MLM1 continued
RANDOM EFFECTS UNCONDITIONAL FINAL MODEL TERMS σ² SE σ² SE Pseudo R² Person (Level 2) 0.19 0.01 0.14 0.01 0.29
WE x Occasions (Level 2) 0.04 0.01 0.02 0.01 0.48
Occasions (Level 1) 0.84 0.02 0.79 0.02 0.06
MODEL FIT FIT INDEX UNCONDITIONAL FINAL MODEL Deviance 28505.10 27600.60
AIC 28511.10 27606.60
BIC 28527.90 27623.40
Note. N = 10005 occasions nested in 1999 individuals. The fixed-effects intercept represents the typical Adaptability z-score for C-level executives having sample-average work engagement, sample minimum career success, and C-level average values on all work-analysis variables. All Agility sub-domains are standardized (M = 0, SD = 1) using the C-level raw IRT score average as the reference point and sample pooled standard deviations. Work-analysis variables are not standardized but are 5-point Likert and centered at C-level averages - 1.
Social leadership results. The unconditional model showed significant random variance for level-2 individuals overall (σ2 = .251, z = 19.55, p < .0001), the WE x WIOC interaction (σ2 = .039, z = 3.29, p < .001), and the overall occasion residual (σ2 = .857, z = 54.60, p < .0001). We therefore retained all random effects and continued with the full model containing all fixed effects covariates and interactions of interest. The full model yielded 9 three-way interactions that met the inclusion threshold including WE x Affiliation (AF) x ST (t [9985] = -1.83, p < .10), WE x Empathy (EM) x MT (t [9985] = 1.65, p < .10), WE x Situational self-awareness (SS) x MT (t [9985] = 2.53, p < .05), WE x AF x QU (t [9985] = -1.80, p < .10), WE x EM x QU (t [9985] = -1.88, p < .10), WE x SS x QU (t [9985] = -2.63, p < .01), WE x AF x CH (t [9985] = 1.83, p < .10), WE x Sociability (SO) x CH (t [9985] = -1.78, p < .10), and CS x Composure (CP) x AM (t [9985] = -1.66, p < .10). All other three-way terms were discarded and a first reduced model was estimated. This model rendered four of the previously retained three-way interactions non-significant including WE x EM x MT (t [9936] = 1.30, p = .17), WE x AF x QU (t [9936] = -0.80, p = .42), WE x EM x QU (t [9936] = -1.43, p = .15), WE x SO x CH (t [9936] = 1.42, p = .16). These were discarded and a second reduced model was estimated, showing a non-significant effect for an additional previously retained three-way interaction term, viz., WE x AF x CH (t [9940] = 1.53, p = .13). This term was discarded and a third reduced model was examined in which all remaining three-way interactions were retained according to the inclusion threshold. We also retained two-way interaction terms including CS x AF (t [1976] = 3.72, p < .001), AF x ML (t [1976] = -2.87, p < .01), CP x ST (t [9941] = -1.66, p = .10), SO x ST (t [9941] = -2.14, p < .05), SS x ST (t [9941] = -2.44, p < .05), CP x EX (t [9941] = 4.04, p < .0001), SS x EX (t [9941] = 2.45, p < .05), CP x MT (t [9941] = -3.24, p < .01), SS x MT (t [9941] = -3.17, p < .01), CP x AM (t [9941] = 2.60, p = .01), AF x QU (t [9941] = -2.33, p < .05), CP x CH (t [9941] = -2.25, p < .05), WE x CP (t [9941] = -3.01, p < .01), WE x EM (t [9941] = -2.61, p < .01), WE x SS (t [9941] = -4.41, p < .0001), WE x EX (t [1976] = -1.66, p = .10), and WE x ST (t [1976] = 2.49, p < .05). All remaining two-way terms were discarded and a fourth reduced model was estimated, revealing that a single previously retained two-way interaction was now below the inclusion threshold, CP x ST (t [9971] = -1.60, p = .11). This term was discarded and a fifth reduced model was examined in which all previously retained interaction terms met the inclusion threshold. Main effects that did not meet the inclusion threshold included only AM (t [1987] = -1.36, p = .17), ML (t [1987] = 1.43, p = .15) and CS (t [1987] = -0.75, p = .45). These were discarded and a sixth reduced model had significant effects (p < .05) for all remaining terms except for WE x EX (t [1990] = -1.82, p = .07). We discarded the marginally significant term and found that the former model that included the term had a relatively poor fit (BIC = 34279.6) compared to the model in which it was discarded (BIC = 34276.7). As such, we retained the latter as the final model.
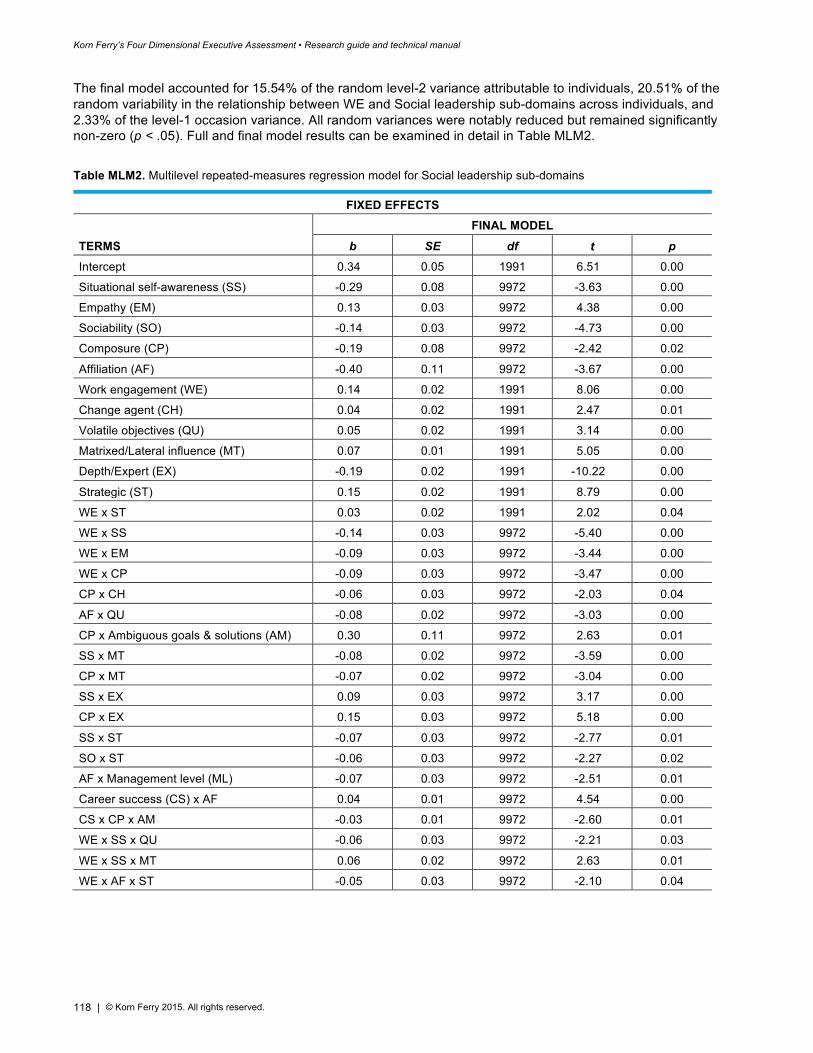
Korn Ferry’s Four Dimensional Executive Assessment • Research guide and technical manual
118 | © Korn Ferry 2015. All rights reserved.
The final model accounted for 15.54% of the random level-2 variance attributable to individuals, 20.51% of the random variability in the relationship between WE and Social leadership sub-domains across individuals, and 2.33% of the level-1 occasion variance. All random variances were notably reduced but remained significantly non-zero (p < .05). Full and final model results can be examined in detail in Table MLM2.
Table MLM2. Multilevel repeated-measures regression model for Social leadership sub-domains
FIXED EFFECTS FINAL MODEL
TERMS b SE df t p Intercept 0.34 0.05 1991 6.51 0.00
Situational self-awareness (SS) -0.29 0.08 9972 -3.63 0.00
Empathy (EM) 0.13 0.03 9972 4.38 0.00
Sociability (SO) -0.14 0.03 9972 -4.73 0.00
Composure (CP) -0.19 0.08 9972 -2.42 0.02
Affiliation (AF) -0.40 0.11 9972 -3.67 0.00
Work engagement (WE) 0.14 0.02 1991 8.06 0.00
Change agent (CH) 0.04 0.02 1991 2.47 0.01
Volatile objectives (QU) 0.05 0.02 1991 3.14 0.00
Matrixed/Lateral influence (MT) 0.07 0.01 1991 5.05 0.00
Depth/Expert (EX) -0.19 0.02 1991 -10.22 0.00
Strategic (ST) 0.15 0.02 1991 8.79 0.00
WE x ST 0.03 0.02 1991 2.02 0.04
WE x SS -0.14 0.03 9972 -5.40 0.00
WE x EM -0.09 0.03 9972 -3.44 0.00
WE x CP -0.09 0.03 9972 -3.47 0.00
CP x CH -0.06 0.03 9972 -2.03 0.04
AF x QU -0.08 0.02 9972 -3.03 0.00
CP x Ambiguous goals & solutions (AM) 0.30 0.11 9972 2.63 0.01
SS x MT -0.08 0.02 9972 -3.59 0.00
CP x MT -0.07 0.02 9972 -3.04 0.00
SS x EX 0.09 0.03 9972 3.17 0.00
CP x EX 0.15 0.03 9972 5.18 0.00
SS x ST -0.07 0.03 9972 -2.77 0.01
SO x ST -0.06 0.03 9972 -2.27 0.02
AF x Management level (ML) -0.07 0.03 9972 -2.51 0.01
Career success (CS) x AF 0.04 0.01 9972 4.54 0.00
CS x CP x AM -0.03 0.01 9972 -2.60 0.01
WE x SS x QU -0.06 0.03 9972 -2.21 0.03
WE x SS x MT 0.06 0.02 9972 2.63 0.01
WE x AF x ST -0.05 0.03 9972 -2.10 0.04
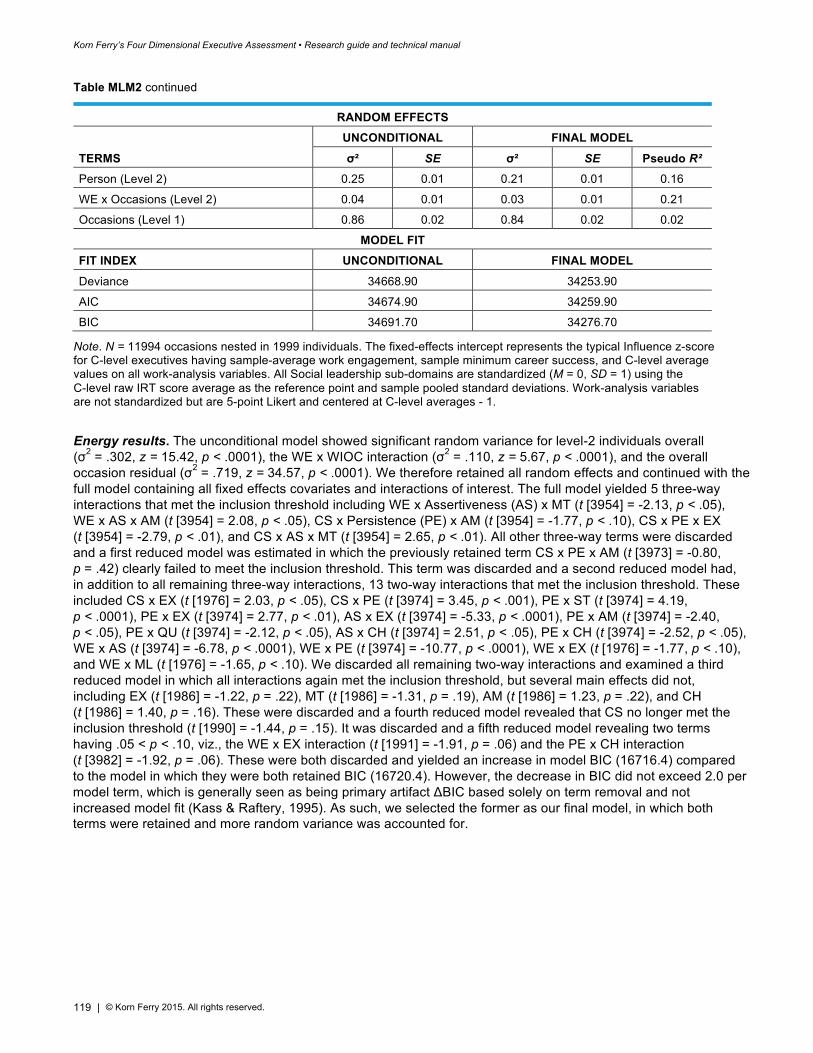
Korn Ferry’s Four Dimensional Executive Assessment • Research guide and technical manual
119 | © Korn Ferry 2015. All rights reserved.
Table MLM2 continued
RANDOM EFFECTS UNCONDITIONAL FINAL MODEL
TERMS σ² SE σ² SE Pseudo R² Person (Level 2) 0.25 0.01 0.21 0.01 0.16
WE x Occasions (Level 2) 0.04 0.01 0.03 0.01 0.21
Occasions (Level 1) 0.86 0.02 0.84 0.02 0.02
MODEL FIT FIT INDEX UNCONDITIONAL FINAL MODEL
Deviance 34668.90 34253.90
AIC 34674.90 34259.90
BIC 34691.70 34276.70
Note. N = 11994 occasions nested in 1999 individuals. The fixed-effects intercept represents the typical Influence z-score for C-level executives having sample-average work engagement, sample minimum career success, and C-level average values on all work-analysis variables. All Social leadership sub-domains are standardized (M = 0, SD = 1) using the C-level raw IRT score average as the reference point and sample pooled standard deviations. Work-analysis variables are not standardized but are 5-point Likert and centered at C-level averages - 1.
Energy results. The unconditional model showed significant random variance for level-2 individuals overall (σ2 = .302, z = 15.42, p < .0001), the WE x WIOC interaction (σ2 = .110, z = 5.67, p < .0001), and the overall occasion residual (σ2 = .719, z = 34.57, p < .0001). We therefore retained all random effects and continued with the full model containing all fixed effects covariates and interactions of interest. The full model yielded 5 three-way interactions that met the inclusion threshold including WE x Assertiveness (AS) x MT (t [3954] = -2.13, p < .05), WE x AS x AM (t [3954] = 2.08, p < .05), CS x Persistence (PE) x AM (t [3954] = -1.77, p < .10), CS x PE x EX (t [3954] = -2.79, p < .01), and CS x AS x MT (t [3954] = 2.65, p < .01). All other three-way terms were discarded and a first reduced model was estimated in which the previously retained term CS x PE x AM (t [3973] = -0.80, p = .42) clearly failed to meet the inclusion threshold. This term was discarded and a second reduced model had, in addition to all remaining three-way interactions, 13 two-way interactions that met the inclusion threshold. These included CS x EX (t [1976] = 2.03, p < .05), CS x PE (t [3974] = 3.45, p < .001), PE x ST (t [3974] = 4.19, p < .0001), PE x EX (t [3974] = 2.77, p < .01), AS x EX (t [3974] = -5.33, p < .0001), PE x AM (t [3974] = -2.40, p < .05), PE x QU (t [3974] = -2.12, p < .05), AS x CH (t [3974] = 2.51, p < .05), PE x CH (t [3974] = -2.52, p < .05), WE x AS (t [3974] = -6.78, p < .0001), WE x PE (t [3974] = -10.77, p < .0001), WE x EX (t [1976] = -1.77, p < .10), and WE x ML (t [1976] = -1.65, p < .10). We discarded all remaining two-way interactions and examined a third reduced model in which all interactions again met the inclusion threshold, but several main effects did not, including EX (t [1986] = -1.22, p = .22), MT (t [1986] = -1.31, p = .19), AM (t [1986] = 1.23, p = .22), and CH (t [1986] = 1.40, p = .16). These were discarded and a fourth reduced model revealed that CS no longer met the inclusion threshold (t [1990] = -1.44, p = .15). It was discarded and a fifth reduced model revealing two terms having .05 < p < .10, viz., the WE x EX interaction (t [1991] = -1.91, p = .06) and the PE x CH interaction (t [3982] = -1.92, p = .06). These were both discarded and yielded an increase in model BIC (16716.4) compared to the model in which they were both retained BIC (16720.4). However, the decrease in BIC did not exceed 2.0 per model term, which is generally seen as being primary artifact ΔBIC based solely on term removal and not increased model fit (Kass & Raftery, 1995). As such, we selected the former as our final model, in which both terms were retained and more random variance was accounted for.
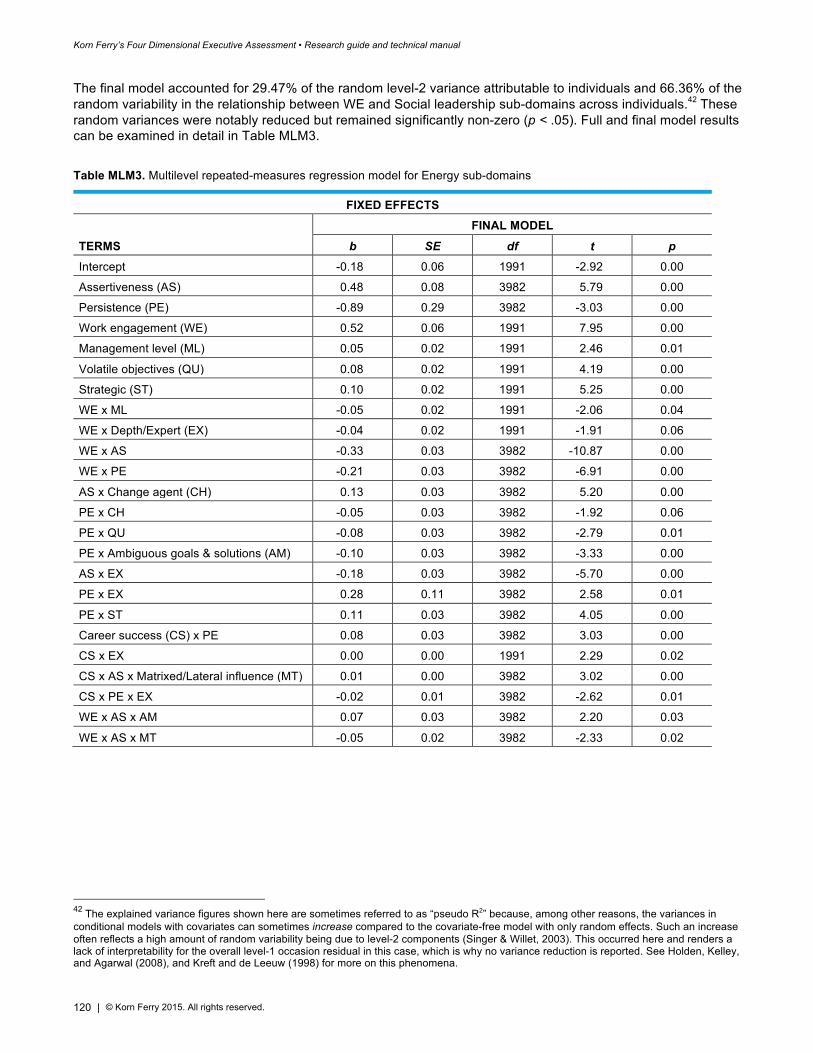
Korn Ferry’s Four Dimensional Executive Assessment • Research guide and technical manual
120 | © Korn Ferry 2015. All rights reserved.
The final model accounted for 29.47% of the random level-2 variance attributable to individuals and 66.36% of the random variability in the relationship between WE and Social leadership sub-domains across individuals.42 These random variances were notably reduced but remained significantly non-zero (p < .05). Full and final model results can be examined in detail in Table MLM3.
Table MLM3. Multilevel repeated-measures regression model for Energy sub-domains
FIXED EFFECTS FINAL MODEL
TERMS b SE df t p Intercept -0.18 0.06 1991 -2.92 0.00
Assertiveness (AS) 0.48 0.08 3982 5.79 0.00
Persistence (PE) -0.89 0.29 3982 -3.03 0.00
Work engagement (WE) 0.52 0.06 1991 7.95 0.00
Management level (ML) 0.05 0.02 1991 2.46 0.01
Volatile objectives (QU) 0.08 0.02 1991 4.19 0.00
Strategic (ST) 0.10 0.02 1991 5.25 0.00
WE x ML -0.05 0.02 1991 -2.06 0.04
WE x Depth/Expert (EX) -0.04 0.02 1991 -1.91 0.06
WE x AS -0.33 0.03 3982 -10.87 0.00
WE x PE -0.21 0.03 3982 -6.91 0.00
AS x Change agent (CH) 0.13 0.03 3982 5.20 0.00
PE x CH -0.05 0.03 3982 -1.92 0.06
PE x QU -0.08 0.03 3982 -2.79 0.01
PE x Ambiguous goals & solutions (AM) -0.10 0.03 3982 -3.33 0.00
AS x EX -0.18 0.03 3982 -5.70 0.00
PE x EX 0.28 0.11 3982 2.58 0.01
PE x ST 0.11 0.03 3982 4.05 0.00
Career success (CS) x PE 0.08 0.03 3982 3.03 0.00
CS x EX 0.00 0.00 1991 2.29 0.02
CS x AS x Matrixed/Lateral influence (MT) 0.01 0.00 3982 3.02 0.00
CS x PE x EX -0.02 0.01 3982 -2.62 0.01
WE x AS x AM 0.07 0.03 3982 2.20 0.03
WE x AS x MT -0.05 0.02 3982 -2.33 0.02
42 The explained variance figures shown here are sometimes referred to as “pseudo R2” because, among other reasons, the variances in conditional models with covariates can sometimes increase compared to the covariate-free model with only random effects. Such an increase often reflects a high amount of random variability being due to level-2 components (Singer & Willet, 2003). This occurred here and renders a lack of interpretability for the overall level-1 occasion residual in this case, which is why no variance reduction is reported. See Holden, Kelley, and Agarwal (2008), and Kreft and de Leeuw (1998) for more on this phenomena.
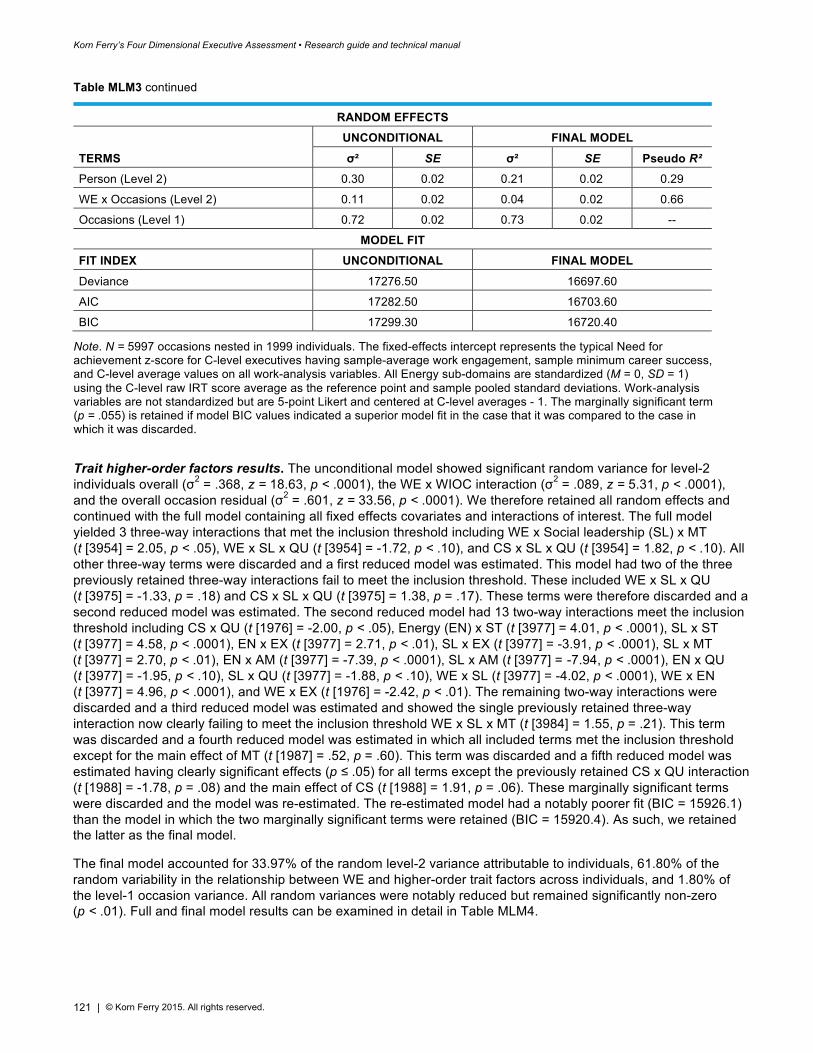
Korn Ferry’s Four Dimensional Executive Assessment • Research guide and technical manual
121 | © Korn Ferry 2015. All rights reserved.
Table MLM3 continued
RANDOM EFFECTS UNCONDITIONAL FINAL MODEL
TERMS σ² SE σ² SE Pseudo R² Person (Level 2) 0.30 0.02 0.21 0.02 0.29
WE x Occasions (Level 2) 0.11 0.02 0.04 0.02 0.66
Occasions (Level 1) 0.72 0.02 0.73 0.02 --
MODEL FIT FIT INDEX UNCONDITIONAL FINAL MODEL
Deviance 17276.50 16697.60
AIC 17282.50 16703.60
BIC 17299.30 16720.40
Note. N = 5997 occasions nested in 1999 individuals. The fixed-effects intercept represents the typical Need for achievement z-score for C-level executives having sample-average work engagement, sample minimum career success, and C-level average values on all work-analysis variables. All Energy sub-domains are standardized (M = 0, SD = 1) using the C-level raw IRT score average as the reference point and sample pooled standard deviations. Work-analysis variables are not standardized but are 5-point Likert and centered at C-level averages - 1. The marginally significant term (p = .055) is retained if model BIC values indicated a superior model fit in the case that it was compared to the case in which it was discarded.
Trait higher-order factors results. The unconditional model showed significant random variance for level-2 individuals overall (σ2 = .368, z = 18.63, p < .0001), the WE x WIOC interaction (σ2 = .089, z = 5.31, p < .0001), and the overall occasion residual (σ2 = .601, z = 33.56, p < .0001). We therefore retained all random effects and continued with the full model containing all fixed effects covariates and interactions of interest. The full model yielded 3 three-way interactions that met the inclusion threshold including WE x Social leadership (SL) x MT (t [3954] = 2.05, p < .05), WE x SL x QU (t [3954] = -1.72, p < .10), and CS x SL x QU (t [3954] = 1.82, p < .10). All other three-way terms were discarded and a first reduced model was estimated. This model had two of the three previously retained three-way interactions fail to meet the inclusion threshold. These included WE x SL x QU (t [3975] = -1.33, p = .18) and CS x SL x QU (t [3975] = 1.38, p = .17). These terms were therefore discarded and a second reduced model was estimated. The second reduced model had 13 two-way interactions meet the inclusion threshold including CS x QU (t [1976] = -2.00, p < .05), Energy (EN) x ST (t [3977] = 4.01, p < .0001), SL x ST (t [3977] = 4.58, p < .0001), EN x EX (t [3977] = 2.71, p < .01), SL x EX (t [3977] = -3.91, p < .0001), SL x MT (t [3977] = 2.70, p < .01), EN x AM (t [3977] = -7.39, p < .0001), SL x AM (t [3977] = -7.94, p < .0001), EN x QU (t [3977] = -1.95, p < .10), SL x QU (t [3977] = -1.88, p < .10), WE x SL (t [3977] = -4.02, p < .0001), WE x EN (t [3977] = 4.96, p < .0001), and WE x EX (t [1976] = -2.42, p < .01). The remaining two-way interactions were discarded and a third reduced model was estimated and showed the single previously retained three-way interaction now clearly failing to meet the inclusion threshold WE x SL x MT (t [3984] = 1.55, p = .21). This term was discarded and a fourth reduced model was estimated in which all included terms met the inclusion threshold except for the main effect of MT (t [1987] = .52, p = .60). This term was discarded and a fifth reduced model was estimated having clearly significant effects (p ≤ .05) for all terms except the previously retained CS x QU interaction (t [1988] = -1.78, p = .08) and the main effect of CS (t [1988] = 1.91, p = .06). These marginally significant terms were discarded and the model was re-estimated. The re-estimated model had a notably poorer fit (BIC = 15926.1) than the model in which the two marginally significant terms were retained (BIC = 15920.4). As such, we retained the latter as the final model.
The final model accounted for 33.97% of the random level-2 variance attributable to individuals, 61.80% of the random variability in the relationship between WE and higher-order trait factors across individuals, and 1.80% of the level-1 occasion variance. All random variances were notably reduced but remained significantly non-zero (p < .01). Full and final model results can be examined in detail in Table MLM4.
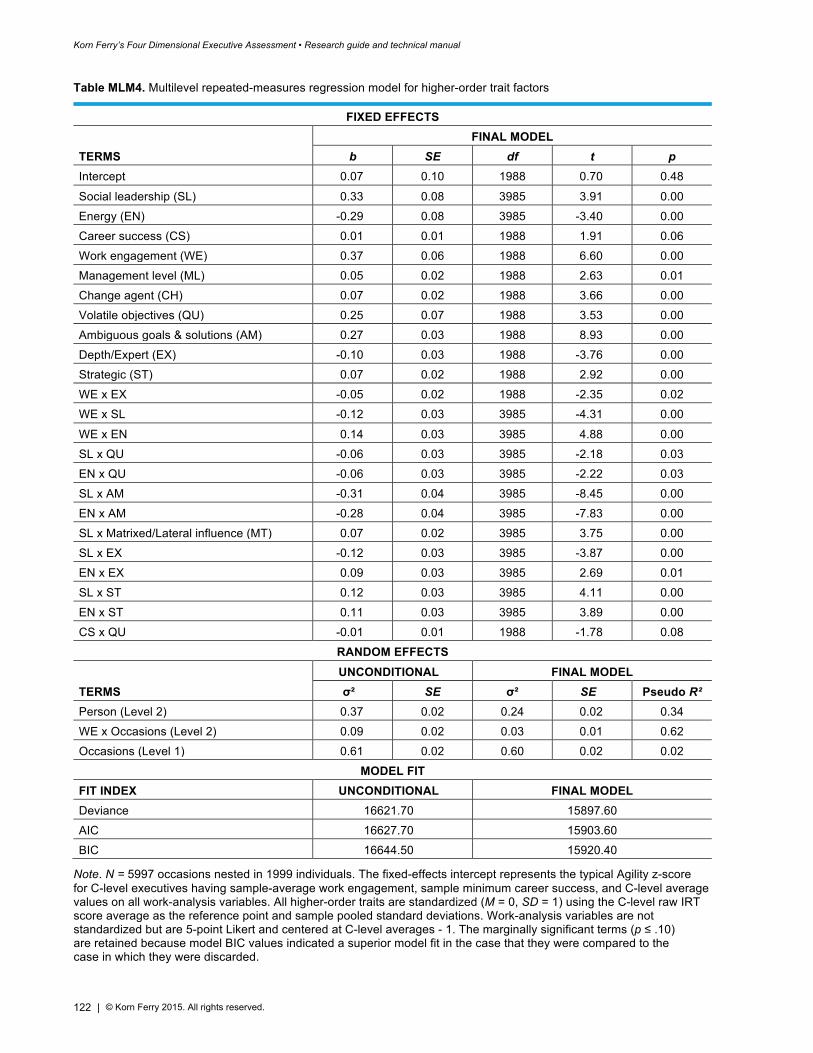
Korn Ferry’s Four Dimensional Executive Assessment • Research guide and technical manual
122 | © Korn Ferry 2015. All rights reserved.
Table MLM4. Multilevel repeated-measures regression model for higher-order trait factors
FIXED EFFECTS FINAL MODEL
TERMS b SE df t p Intercept 0.07 0.10 1988 0.70 0.48
Social leadership (SL) 0.33 0.08 3985 3.91 0.00
Energy (EN) -0.29 0.08 3985 -3.40 0.00
Career success (CS) 0.01 0.01 1988 1.91 0.06
Work engagement (WE) 0.37 0.06 1988 6.60 0.00
Management level (ML) 0.05 0.02 1988 2.63 0.01
Change agent (CH) 0.07 0.02 1988 3.66 0.00
Volatile objectives (QU) 0.25 0.07 1988 3.53 0.00
Ambiguous goals & solutions (AM) 0.27 0.03 1988 8.93 0.00
Depth/Expert (EX) -0.10 0.03 1988 -3.76 0.00
Strategic (ST) 0.07 0.02 1988 2.92 0.00
WE x EX -0.05 0.02 1988 -2.35 0.02
WE x SL -0.12 0.03 3985 -4.31 0.00
WE x EN 0.14 0.03 3985 4.88 0.00
SL x QU -0.06 0.03 3985 -2.18 0.03
EN x QU -0.06 0.03 3985 -2.22 0.03
SL x AM -0.31 0.04 3985 -8.45 0.00
EN x AM -0.28 0.04 3985 -7.83 0.00
SL x Matrixed/Lateral influence (MT) 0.07 0.02 3985 3.75 0.00
SL x EX -0.12 0.03 3985 -3.87 0.00
EN x EX 0.09 0.03 3985 2.69 0.01
SL x ST 0.12 0.03 3985 4.11 0.00
EN x ST 0.11 0.03 3985 3.89 0.00
CS x QU -0.01 0.01 1988 -1.78 0.08
RANDOM EFFECTS UNCONDITIONAL FINAL MODEL TERMS σ² SE σ² SE Pseudo R² Person (Level 2) 0.37 0.02 0.24 0.02 0.34
WE x Occasions (Level 2) 0.09 0.02 0.03 0.01 0.62
Occasions (Level 1) 0.61 0.02 0.60 0.02 0.02
MODEL FIT FIT INDEX UNCONDITIONAL FINAL MODEL Deviance 16621.70 15897.60
AIC 16627.70 15903.60
BIC 16644.50 15920.40
Note. N = 5997 occasions nested in 1999 individuals. The fixed-effects intercept represents the typical Agility z-score for C-level executives having sample-average work engagement, sample minimum career success, and C-level average values on all work-analysis variables. All higher-order traits are standardized (M = 0, SD = 1) using the C-level raw IRT score average as the reference point and sample pooled standard deviations. Work-analysis variables are not standardized but are 5-point Likert and centered at C-level averages - 1. The marginally significant terms (p ≤ .10) are retained because model BIC values indicated a superior model fit in the case that they were compared to the case in which they were discarded.
Korn Ferry’s Four Dimensional Executive Assessment • Research guide and technical manual
123 | © Korn Ferry 2015. All rights reserved.
Drivers results. The unconditional model showed a zero random variance for level-2 individuals overall, and rendered a non-positive definite solution. That random variance was therefore removed from all subsequent analyses. The WE x WIOC interaction (σ2 = .074, z = 6.03, p < .0001) and the overall occasion residual (σ2 = .873, z = 58.11, p < .0001) were both significantly non-zero. We therefore retained these random effects and continued with the full model containing all fixed effects covariates and interactions of interest. The full model yielded 6 four-way interactions that met the inclusion threshold including WE x Regulatory Collaborative (RC) x ST x Collaboration (COLL) (t [9815] = 2.51, p < .05), WE x Innovative Collaborative (IC) x ST x Power (POWR) (t [9815] = 1.85, p < .10), WE x Regulatory Competitive (RP) x ST x Balance (BALA) (t [9815] = -2.30, p < .05), WE x Regulatory Innovative (IR) x EX x Independence (INDY) (t [9815] = 1.91, p < .10), IC x QU x POWR x WE (t [9815] = -1.68, p < .10), and RC x CH x COLL x WE (t [9815] = -1.88, p < .10). We discarded all other four-way terms and examined a first reduced model, which led us to retain all previously retained four-way interactions as well as 24 three-way interactions including WE x IC x INDY (t [9839] = 1.86 p < .10), WE x RC x STRC (t [9839] = -3.85, p < .0001), WE x IC x STRC (t [9839] = 2.26, p < .05), WE x RP x STRC (t [9839] = 2.48, p < .05), WE x Collaborative Competitive (CC) x STRC (t [9839] = 1.88, p < .10), WE x RC x BALA (t [9839] = 2.64, p < .01), WE x RC x POWR (t [9839] = 1.66, p < .10), WE x RC x COLL (t [9839] = -3.04, p < .01), and WE x RP x COLL (t [9839] = 1.91, p < .10), RC x STRC x ML (t [9839] = -1.92, p < .10), RP x BALA x ML (t [9839] = 2.43, p < .05), RC x COLL x ML (t [9839] = -2.43, p < .05), IC x COLL x ML (t [9839] = -1.85, p < .10), CC x COLL x ML (t [9839] = -2.55, p < .05), WE x RC x ST (t [1940] = -1.76, p < .10), WE x RC x CH (t [1940] = 2.12, p < .05), WE x COLL x ST (t [9839] = -2.08, p < .05), WE x STRC x EX (t [9839] = 2.63, p < .01), WE x RC x ST (t [9839] = 1.69, p < .10), WE x BALA x AM (t [9839] = -1.63, p < .10), RC x COLL x ST (t [1940] = -2.56, p < .01), IR x INDY x ST (t [9839] = 1.93, p = .05), RC x COLL x QU (t [9839] = 2.50, p < .05), IR x INDY x QU (t [1940] = -1.96, p < .05). We discarded all other three-way interactions and examined a second reduced model in which four of the previously retained interactions including WE x IC x ST x POWR (t [9925] = -0.54, p = .59), WE x RP x ST x BALA (t [9925] = -1.43, p = .15), WE x IR x EX x INDY (t [9925] = 0.41, p = .68), and IC x QU x POWR x WE (t [9925] = -0.62, p = .53) failed to meet the inclusion threshold. These were discarded and a third reduced model was examined in which 28 two-way interactions met the inclusion threshold. These included RP x BALA (t [9938] = 1.97, p < .05), RP x ML (t [1968] = -1.71, p < .10), BALA x ML (t [9938] = -4.58, p < .0001), STRC x ML (t [9938] = -2.02, p < .05), INDY x ST (t [9938] = -2.87, p < .01), STRC x ST (t [9938] = -3.94, p < .0001), BALA x ST (t [9938] = -5.90, p < .0001), POWR x ST (t [9938] = -1.98, p < .05), INDY x EX (t [9938] = 2.46, p < .05), STRC x EX (t [9938] = 12.47, p < .0001), BALA x EX (t [9938] = 2.85, p < .01), STRC x MT (t [9938] = -2.16, p < .05), COLL x MT (t [9938] = 2.50, p < .05), STRC x AM (t [9938] = -5.92, p < .0001), BALA x AM (t [9938] = -4.34, p < .0001), POWR x AM (t [9938] = -2.51, p < .01), COLL x AM (t [9938] = -5.02, p < .0001), STRC x QU (t [9938] = -4.74, p < .0001), BALA x QU (t [9938] = -1.85, p < .10), POWR x QU (t [9938] = -1.69, p < .10), COLL x QU (t [9938] = -2.44, p < .05), STRC x CH (t [9938] = -2.47, p < .05), COLL x CH (t [9938] = -2.07, p < .05), WE x INDY (t [9938] = -9.76, p < .0001), WE x STRC (t [9938] = -5.67, p < .0001), WE x BALA (t [9938] = -17.38, p < .0001), WE x POWR (t [9938] = -6.18, p < .0001), WE x COLL (t [9938] = -5.18, p < .0001), WE x ST (t [1968] = 1.86, p < .10). All others were discarded and a fourth reduced model was examined in which three previously retained three-way interactions now failed to meet the inclusion threshold. These included WE x RC x BALA (t [9957] = 1.26, p = .21), WE x RC x ST (t [1983] = -1.53, p = .13), WE x STRC x EX (t [9957] = 1.54, p = .13). We discarded these and estimated a fifth reduced model in which another previously retained three-way interaction failed to meet the inclusion threshold, viz., WE x RC x CH (t [9959] = 1.12, p = .26). This was discarded and a sixth reduced model led us to discard a previously retained four-way term, viz., WE x RC x COLL x CH (t [9957] = -1.36, p = .17). We discarded it and examined a seventh reduced model in which two previously retained two-way interactions failed to retain the inclusion threshold. These include POWR x QU (t [9960] = -1.55, p = .12) and WE x ST (t [1985] = 1.21, p = .23). These were discarded in favor of an eighth reduced model in which WE x COLL x ST (t [9961] = -1.39, p = .16). This term was discarded and a ninth reduced model showed that the final remaining four-way interaction failed to meet the inclusion threshold, WE x RC x COLL x ST (t [9962] = 1.52, p = .13). This term was discarded and a tenth reduced model was estimated in which all previously retained interactions again met the inclusion threshold, but several main effects did not, including RC (t [1986] = -0.59, p = .55), CC (t [1986] = -0.93, p = .35), IR (t [1986] = 0.13, p = .90), INDY (t [9963] = -1.24, p = .21), BALA (t [1986] = -0.33, p = .74), and COLL (t [1986] = 0.48, p = .63). These were discarded and an eleventh model was estimated in which all terms met the inclusion threshold, but two terms had .05 < p < .10. These included RC x STRC x ML (t [9966] = -1.69, p = .09) and WE x BALA x AM (t [9966] = -1.85, p = .06). These were discarded and a comparative model was estimated, having a slightly lower fit (BIC = 32239.9) than the model having the two marginally significant terms (BIC = 32236.7). The latter, however, only had a fit
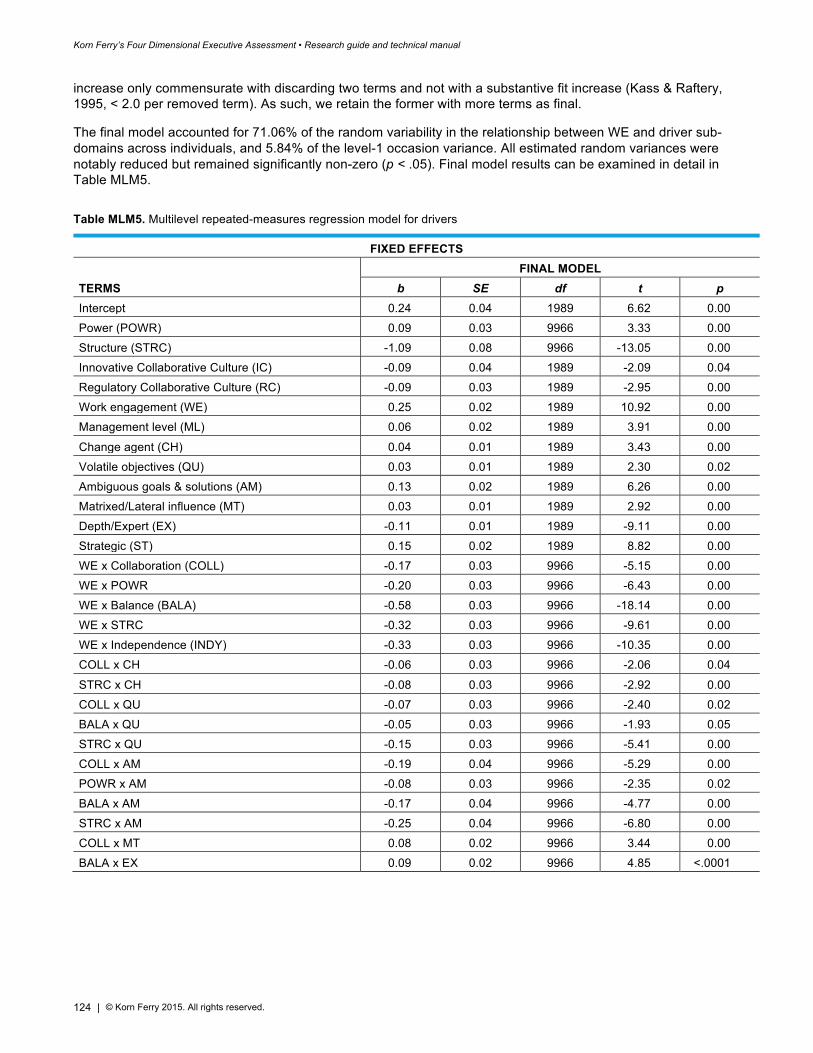
Korn Ferry’s Four Dimensional Executive Assessment • Research guide and technical manual
124 | © Korn Ferry 2015. All rights reserved.
increase only commensurate with discarding two terms and not with a substantive fit increase (Kass & Raftery, 1995, < 2.0 per removed term). As such, we retain the former with more terms as final.
The final model accounted for 71.06% of the random variability in the relationship between WE and driver sub-domains across individuals, and 5.84% of the level-1 occasion variance. All estimated random variances were notably reduced but remained significantly non-zero (p < .05). Final model results can be examined in detail in Table MLM5.
Table MLM5. Multilevel repeated-measures regression model for drivers
FIXED EFFECTS FINAL MODEL
TERMS b SE df t p Intercept 0.24 0.04 1989 6.62 0.00
Power (POWR) 0.09 0.03 9966 3.33 0.00
Structure (STRC) -1.09 0.08 9966 -13.05 0.00
Innovative Collaborative Culture (IC) -0.09 0.04 1989 -2.09 0.04
Regulatory Collaborative Culture (RC) -0.09 0.03 1989 -2.95 0.00
Work engagement (WE) 0.25 0.02 1989 10.92 0.00
Management level (ML) 0.06 0.02 1989 3.91 0.00
Change agent (CH) 0.04 0.01 1989 3.43 0.00
Volatile objectives (QU) 0.03 0.01 1989 2.30 0.02
Ambiguous goals & solutions (AM) 0.13 0.02 1989 6.26 0.00
Matrixed/Lateral influence (MT) 0.03 0.01 1989 2.92 0.00
Depth/Expert (EX) -0.11 0.01 1989 -9.11 0.00
Strategic (ST) 0.15 0.02 1989 8.82 0.00
WE x Collaboration (COLL) -0.17 0.03 9966 -5.15 0.00
WE x POWR -0.20 0.03 9966 -6.43 0.00
WE x Balance (BALA) -0.58 0.03 9966 -18.14 0.00
WE x STRC -0.32 0.03 9966 -9.61 0.00
WE x Independence (INDY) -0.33 0.03 9966 -10.35 0.00
COLL x CH -0.06 0.03 9966 -2.06 0.04
STRC x CH -0.08 0.03 9966 -2.92 0.00
COLL x QU -0.07 0.03 9966 -2.40 0.02
BALA x QU -0.05 0.03 9966 -1.93 0.05
STRC x QU -0.15 0.03 9966 -5.41 0.00
COLL x AM -0.19 0.04 9966 -5.29 0.00
POWR x AM -0.08 0.03 9966 -2.35 0.02
BALA x AM -0.17 0.04 9966 -4.77 0.00
STRC x AM -0.25 0.04 9966 -6.80 0.00
COLL x MT 0.08 0.02 9966 3.44 0.00
BALA x EX 0.09 0.02 9966 4.85 <.0001
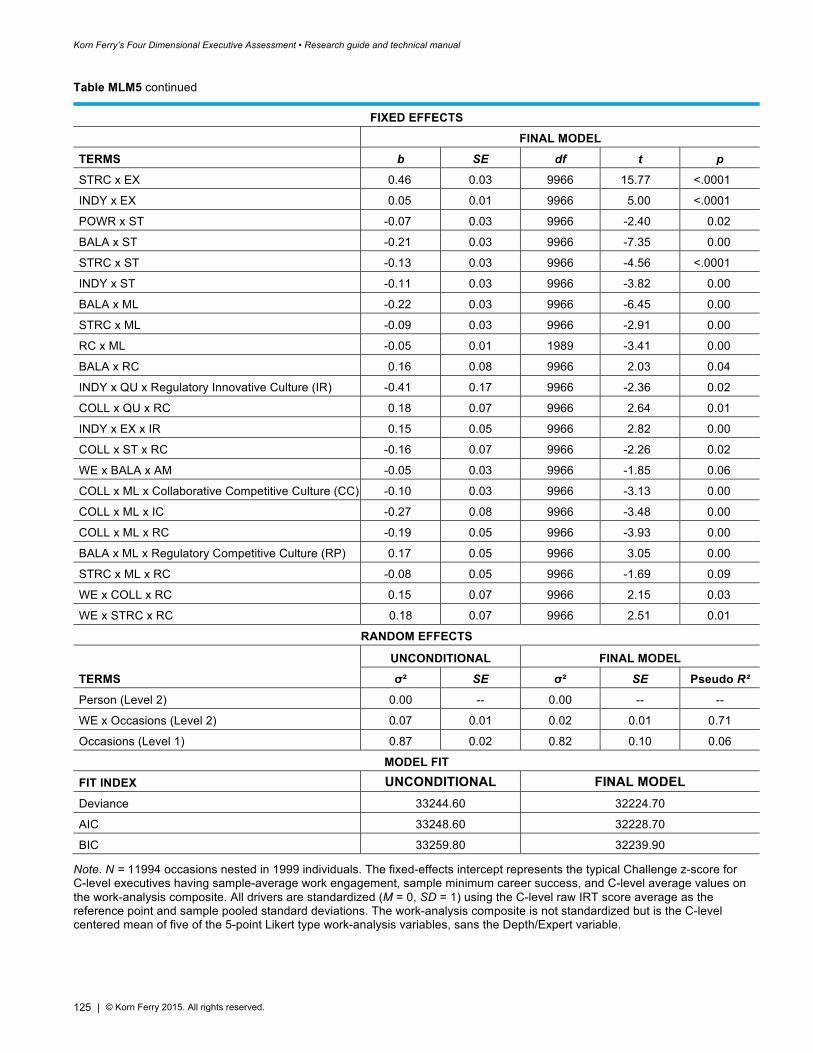
Korn Ferry’s Four Dimensional Executive Assessment • Research guide and technical manual
125 | © Korn Ferry 2015. All rights reserved.
Table MLM5 continued
FIXED EFFECTS
FINAL MODEL
TERMS b SE df t p
STRC x EX 0.46 0.03 9966 15.77 <.0001
INDY x EX 0.05 0.01 9966 5.00 <.0001
POWR x ST -0.07 0.03 9966 -2.40 0.02
BALA x ST -0.21 0.03 9966 -7.35 0.00
STRC x ST -0.13 0.03 9966 -4.56 <.0001
INDY x ST -0.11 0.03 9966 -3.82 0.00
BALA x ML -0.22 0.03 9966 -6.45 0.00
STRC x ML -0.09 0.03 9966 -2.91 0.00
RC x ML -0.05 0.01 1989 -3.41 0.00
BALA x RC 0.16 0.08 9966 2.03 0.04
INDY x QU x Regulatory Innovative Culture (IR) -0.41 0.17 9966 -2.36 0.02
COLL x QU x RC 0.18 0.07 9966 2.64 0.01
INDY x EX x IR 0.15 0.05 9966 2.82 0.00
COLL x ST x RC -0.16 0.07 9966 -2.26 0.02
WE x BALA x AM -0.05 0.03 9966 -1.85 0.06
COLL x ML x Collaborative Competitive Culture (CC) -0.10 0.03 9966 -3.13 0.00
COLL x ML x IC -0.27 0.08 9966 -3.48 0.00
COLL x ML x RC -0.19 0.05 9966 -3.93 0.00
BALA x ML x Regulatory Competitive Culture (RP) 0.17 0.05 9966 3.05 0.00
STRC x ML x RC -0.08 0.05 9966 -1.69 0.09
WE x COLL x RC 0.15 0.07 9966 2.15 0.03
WE x STRC x RC 0.18 0.07 9966 2.51 0.01
RANDOM EFFECTS
UNCONDITIONAL FINAL MODEL
TERMS σ² SE σ² SE Pseudo R²
Person (Level 2) 0.00 -- 0.00 -- --
WE x Occasions (Level 2) 0.07 0.01 0.02 0.01 0.71
Occasions (Level 1) 0.87 0.02 0.82 0.10 0.06
MODEL FIT
FIT INDEX UNCONDITIONAL FINAL MODEL
Deviance 33244.60 32224.70
AIC 33248.60 32228.70
BIC 33259.80 32239.90
Note. N = 11994 occasions nested in 1999 individuals. The fixed-effects intercept represents the typical Challenge z-score for C-level executives having sample-average work engagement, sample minimum career success, and C-level average values on the work-analysis composite. All drivers are standardized (M = 0, SD = 1) using the C-level raw IRT score average as the reference point and sample pooled standard deviations. The work-analysis composite is not standardized but is the C-level centered mean of five of the 5-point Likert type work-analysis variables, sans the Depth/Expert variable.
Korn Ferry’s Four Dimensional Executive Assessment • Research guide and technical manual
126 | © Korn Ferry 2015. All rights reserved.
Interpreting final equations In the sections that follow, we discuss and underscore some of the practical implications and substantive meaning of the equations/models extracted and described above. To facilitate, we plot model-implied KF4D-Exec scores for upper-level managers having high and low WE and CS across work-analysis levels and, where applicable, company culture.43 We also show relationships between KF4D-Exec scores and WE/CS across levels of work-analysis variables in ways that will facilitate understanding. Examples and discussion put forth in the following sections are not intended to be exhaustive. Extracted models were based on continuous or quasi-continuous work-analysis variables and not groups and, as such, model equations included main and/or interaction effects for up to six quantitative work-analysis variables, ordered categorical management level, and also (in the case of drivers) measures of company culture. As such, the potential for drawing comparisons and/or arriving at optimal (or sub-optimal or average) model-implied KF4D-Exec scores and profiles of scores is nearly limitless in the purely quantitative sense. Consider, for example, that the work-analysis variables alone—even when (where applicable) conceptualized conservatively as having 5 possible integer values each—have (56) 15,625 potential combinations or vectors. Given that even the most comprehensive and carefully developed theoretical and multivariate models in the social sciences rarely have or exceed effect sizes of R2 = 20%–30%, we certainly do not argue or support that these models permit or require that kind of exactitude for practical purposes. We do maintain that the extracted models provide a considerable degree of flexibility for making comparisons, making inferences, and/or arriving at target or typical score-ranges for many different leadership role conceptualizations. Yet our broad-stroke treatment of the findings in the following sections reflects what we believe and recommend vis-à-vis the utility of our models. They provide insights that add practical value and support for understanding and thinking critically and broadly about leaders, leadership roles, and fit for different kinds of leadership roles. The applied utility of the findings is contained in the gestalt and theoretically supportable impressions that they yield.
For exemplary purposes, we repeatedly make use of two of the five previously discussed work-analysis classes shown in Figures LPAR and LPAS. We do so by imputing typical work-analysis values for each class (from Table LPAM, showing pre-centered values) into model equations in order to arrive at comparative model-implied KF4D-Exec scores as desired for each of the intuitively appealing and notably contrastable types. Class 1, as we have discussed, is a relatively typical class in many respects (both in terms of sample proportion and patterns of work-analysis values) and is our most commensurate analogue to Tropman & Wooten’s (2013) transformational Architect type of leadership role (TARC). We have discussed that the typical TARC role is characterized by high ambiguity, volatile objectives, matrixed/lateral influence, high strategic and change orientation, and low depth/expertise in favor of breadth and a fast/wide learning orientation to management. We assert that the whole of the extant literature and the patterns in our own data suggest that this type best represents today’s prototypical upper-level or C-level executive job role. We do not suggest, however, and have not observed in our own data that upper-level managerial roles do not vary in important ways. As such, we employ typical work-analysis values (from Table LPAM)44 for Class 4 as our analogue to Tropman & Wooten’s (2013) Builder-maintainer archetype (BLDR). BLDRs constitute 10% of our live-engagement data to date.45 Their management level is typically lower than TARCs in our data (although all levels are represented for BLDR roles in the class solution shown in Table LPAM), and their job roles are typically characterized by a tactical and maintenance orientation, clarity, deference to top-down rank-based influence, as well as relatively high depth and expertise orientation. We again emphasize that the model equations do not require deferring to types or categorical conceptualizations of job roles, but allow for the imputation of continuous or quasi-continuous values (ranging from 1 to 5) for each of the work-analysis variables and related interactions. We only employ archetypes here in order to facilitate discussion and draw literature-
43 Our reference to high and low work engagement scores in the narrative and all Figures and Tables in this section is operationalized as WE = 2.6 and -2.6, respectively, when used in equations for model-implied values. As mentioned previously, CS is a 13-level ordered categorical variable and is high and low in equations when set at 12 and 0, respectively. 44 The depth/expert values are adjusted to a more extreme value for BLDRs to increase comparability and underscore contrasts. TARC scores are left at 2.52 as in Table LPAM, whereas scores are adjusted upward to 4.50 for BLDRs. 45 In other words, we serve clients who are looking for different kinds of leaders, including the BLDR type for which we provide recruitment services at regular and non-trivial yet relatively low proportions.
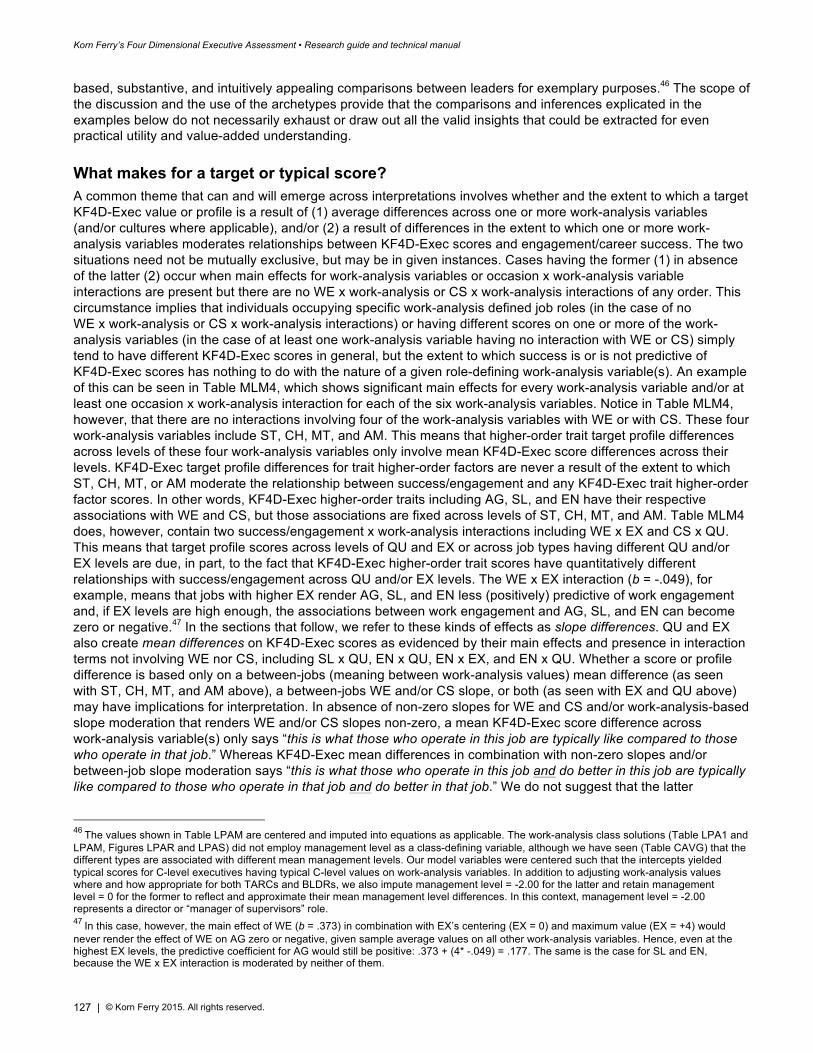
Korn Ferry’s Four Dimensional Executive Assessment • Research guide and technical manual
127 | © Korn Ferry 2015. All rights reserved.
based, substantive, and intuitively appealing comparisons between leaders for exemplary purposes.46 The scope of the discussion and the use of the archetypes provide that the comparisons and inferences explicated in the examples below do not necessarily exhaust or draw out all the valid insights that could be extracted for even practical utility and value-added understanding.
What makes for a target or typical score? A common theme that can and will emerge across interpretations involves whether and the extent to which a target KF4D-Exec value or profile is a result of (1) average differences across one or more work-analysis variables (and/or cultures where applicable), and/or (2) a result of differences in the extent to which one or more work-analysis variables moderates relationships between KF4D-Exec scores and engagement/career success. The two situations need not be mutually exclusive, but may be in given instances. Cases having the former (1) in absence of the latter (2) occur when main effects for work-analysis variables or occasion x work-analysis variable interactions are present but there are no WE x work-analysis or CS x work-analysis interactions of any order. This circumstance implies that individuals occupying specific work-analysis defined job roles (in the case of no WE x work-analysis or CS x work-analysis interactions) or having different scores on one or more of the work-analysis variables (in the case of at least one work-analysis variable having no interaction with WE or CS) simply tend to have different KF4D-Exec scores in general, but the extent to which success is or is not predictive of KF4D-Exec scores has nothing to do with the nature of a given role-defining work-analysis variable(s). An example of this can be seen in Table MLM4, which shows significant main effects for every work-analysis variable and/or at least one occasion x work-analysis interaction for each of the six work-analysis variables. Notice in Table MLM4, however, that there are no interactions involving four of the work-analysis variables with WE or with CS. These four work-analysis variables include ST, CH, MT, and AM. This means that higher-order trait target profile differences across levels of these four work-analysis variables only involve mean KF4D-Exec score differences across their levels. KF4D-Exec target profile differences for trait higher-order factors are never a result of the extent to which ST, CH, MT, or AM moderate the relationship between success/engagement and any KF4D-Exec trait higher-order factor scores. In other words, KF4D-Exec higher-order traits including AG, SL, and EN have their respective associations with WE and CS, but those associations are fixed across levels of ST, CH, MT, and AM. Table MLM4 does, however, contain two success/engagement x work-analysis interactions including WE x EX and CS x QU. This means that target profile scores across levels of QU and EX or across job types having different QU and/or EX levels are due, in part, to the fact that KF4D-Exec higher-order trait scores have quantitatively different relationships with success/engagement across QU and/or EX levels. The WE x EX interaction (b = -.049), for example, means that jobs with higher EX render AG, SL, and EN less (positively) predictive of work engagement and, if EX levels are high enough, the associations between work engagement and AG, SL, and EN can become zero or negative.47 In the sections that follow, we refer to these kinds of effects as slope differences. QU and EX also create mean differences on KF4D-Exec scores as evidenced by their main effects and presence in interaction terms not involving WE nor CS, including SL x QU, EN x QU, EN x EX, and EN x QU. Whether a score or profile difference is based only on a between-jobs (meaning between work-analysis values) mean difference (as seen with ST, CH, MT, and AM above), a between-jobs WE and/or CS slope, or both (as seen with EX and QU above) may have implications for interpretation. In absence of non-zero slopes for WE and CS and/or work-analysis-based slope moderation that renders WE and/or CS slopes non-zero, a mean KF4D-Exec score difference across work-analysis variable(s) only says “this is what those who operate in this job are typically like compared to those who operate in that job.” Whereas KF4D-Exec mean differences in combination with non-zero slopes and/or between-job slope moderation says “this is what those who operate in this job and do better in this job are typically like compared to those who operate in that job and do better in that job.” We do not suggest that the latter
46 The values shown in Table LPAM are centered and imputed into equations as applicable. The work-analysis class solutions (Table LPA1 and LPAM, Figures LPAR and LPAS) did not employ management level as a class-defining variable, although we have seen (Table CAVG) that the different types are associated with different mean management levels. Our model variables were centered such that the intercepts yielded typical scores for C-level executives having typical C-level values on work-analysis variables. In addition to adjusting work-analysis values where and how appropriate for both TARCs and BLDRs, we also impute management level = -2.00 for the latter and retain management level = 0 for the former to reflect and approximate their mean management level differences. In this context, management level = -2.00 represents a director or “manager of supervisors” role. 47 In this case, however, the main effect of WE (b = .373) in combination with EX’s centering (EX = 0) and maximum value (EX = +4) would never render the effect of WE on AG zero or negative, given sample average values on all other work-analysis variables. Hence, even at the highest EX levels, the predictive coefficient for AG would still be positive: .373 + (4* -.049) = .177. The same is the case for SL and EN, because the WE x EX interaction is moderated by neither of them.
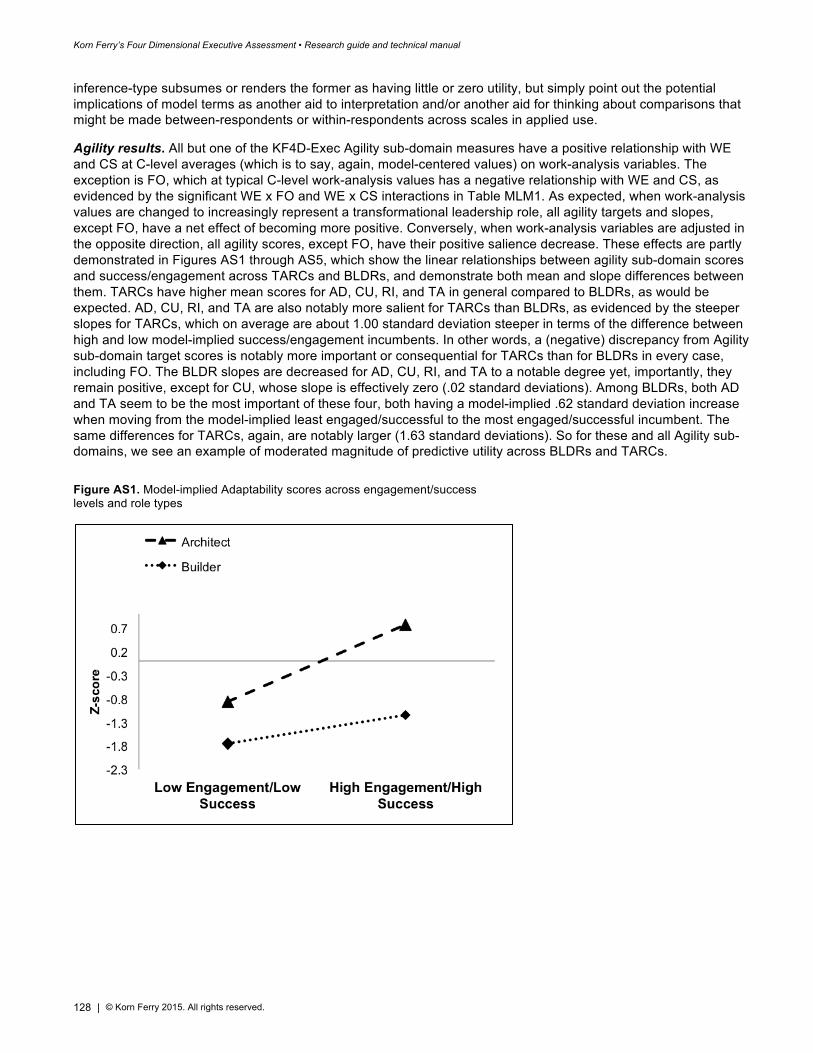
Korn Ferry’s Four Dimensional Executive Assessment • Research guide and technical manual
128 | © Korn Ferry 2015. All rights reserved.
inference-type subsumes or renders the former as having little or zero utility, but simply point out the potential implications of model terms as another aid to interpretation and/or another aid for thinking about comparisons that might be made between-respondents or within-respondents across scales in applied use.
Agility results. All but one of the KF4D-Exec Agility sub-domain measures have a positive relationship with WE and CS at C-level averages (which is to say, again, model-centered values) on work-analysis variables. The exception is FO, which at typical C-level work-analysis values has a negative relationship with WE and CS, as evidenced by the significant WE x FO and WE x CS interactions in Table MLM1. As expected, when work-analysis values are changed to increasingly represent a transformational leadership role, all agility targets and slopes, except FO, have a net effect of becoming more positive. Conversely, when work-analysis variables are adjusted in the opposite direction, all agility scores, except FO, have their positive salience decrease. These effects are partly demonstrated in Figures AS1 through AS5, which show the linear relationships between agility sub-domain scores and success/engagement across TARCs and BLDRs, and demonstrate both mean and slope differences between them. TARCs have higher mean scores for AD, CU, RI, and TA in general compared to BLDRs, as would be expected. AD, CU, RI, and TA are also notably more salient for TARCs than BLDRs, as evidenced by the steeper slopes for TARCs, which on average are about 1.00 standard deviation steeper in terms of the difference between high and low model-implied success/engagement incumbents. In other words, a (negative) discrepancy from Agility sub-domain target scores is notably more important or consequential for TARCs than for BLDRs in every case, including FO. The BLDR slopes are decreased for AD, CU, RI, and TA to a notable degree yet, importantly, they remain positive, except for CU, whose slope is effectively zero (.02 standard deviations). Among BLDRs, both AD and TA seem to be the most important of these four, both having a model-implied .62 standard deviation increase when moving from the model-implied least engaged/successful to the most engaged/successful incumbent. The same differences for TARCs, again, are notably larger (1.63 standard deviations). So for these and all Agility sub-domains, we see an example of moderated magnitude of predictive utility across BLDRs and TARCs.
Figure AS1. Model-implied Adaptability scores across engagement/success levels and role types
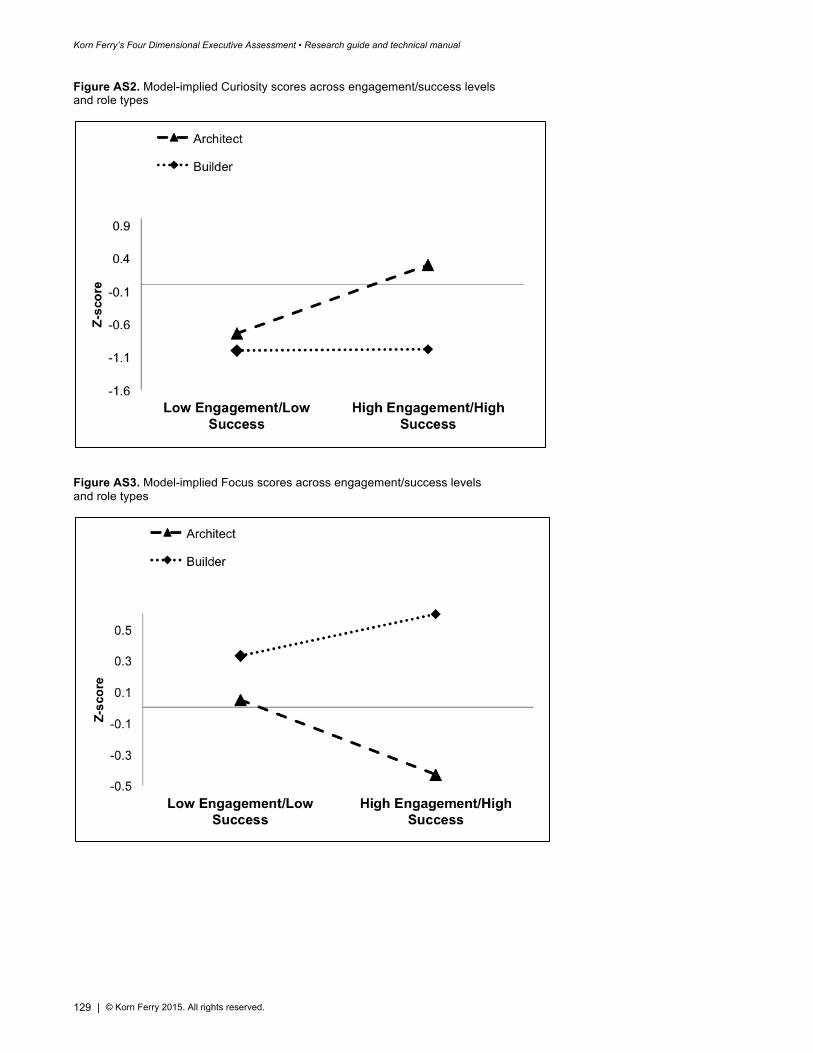
Korn Ferry’s Four Dimensional Executive Assessment • Research guide and technical manual
129 | © Korn Ferry 2015. All rights reserved.
Figure AS2. Model-implied Curiosity scores across engagement/success levels and role types
Figure AS3. Model-implied Focus scores across engagement/success levels and role types
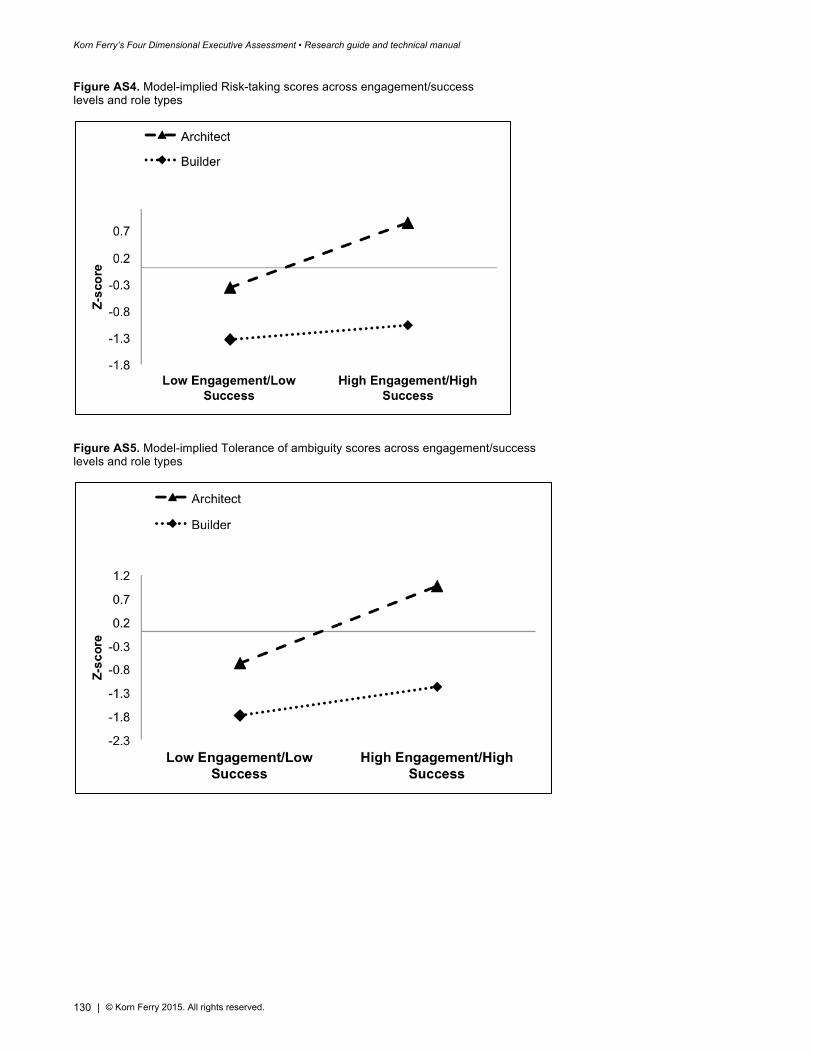
Korn Ferry’s Four Dimensional Executive Assessment • Research guide and technical manual
130 | © Korn Ferry 2015. All rights reserved.
Figure AS4. Model-implied Risk-taking scores across engagement/success levels and role types
Figure AS5. Model-implied Tolerance of ambiguity scores across engagement/success levels and role types
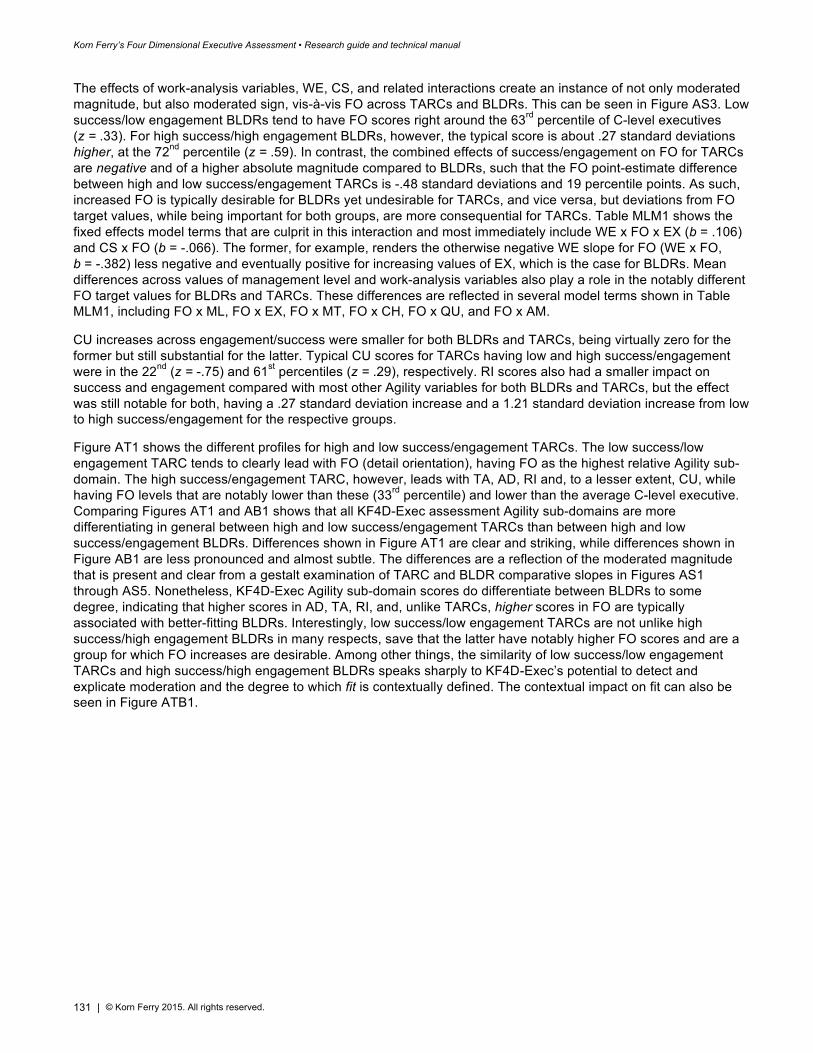
Korn Ferry’s Four Dimensional Executive Assessment • Research guide and technical manual
131 | © Korn Ferry 2015. All rights reserved.
The effects of work-analysis variables, WE, CS, and related interactions create an instance of not only moderated magnitude, but also moderated sign, vis-à-vis FO across TARCs and BLDRs. This can be seen in Figure AS3. Low success/low engagement BLDRs tend to have FO scores right around the 63rd percentile of C-level executives (z = .33). For high success/high engagement BLDRs, however, the typical score is about .27 standard deviations higher, at the 72nd percentile (z = .59). In contrast, the combined effects of success/engagement on FO for TARCs are negative and of a higher absolute magnitude compared to BLDRs, such that the FO point-estimate difference between high and low success/engagement TARCs is -.48 standard deviations and 19 percentile points. As such, increased FO is typically desirable for BLDRs yet undesirable for TARCs, and vice versa, but deviations from FO target values, while being important for both groups, are more consequential for TARCs. Table MLM1 shows the fixed effects model terms that are culprit in this interaction and most immediately include WE x FO x EX (b = .106) and CS x FO (b = -.066). The former, for example, renders the otherwise negative WE slope for FO (WE x FO, b = -.382) less negative and eventually positive for increasing values of EX, which is the case for BLDRs. Mean differences across values of management level and work-analysis variables also play a role in the notably different FO target values for BLDRs and TARCs. These differences are reflected in several model terms shown in Table MLM1, including FO x ML, FO x EX, FO x MT, FO x CH, FO x QU, and FO x AM.
CU increases across engagement/success were smaller for both BLDRs and TARCs, being virtually zero for the former but still substantial for the latter. Typical CU scores for TARCs having low and high success/engagement were in the 22nd (z = -.75) and 61st percentiles (z = .29), respectively. RI scores also had a smaller impact on success and engagement compared with most other Agility variables for both BLDRs and TARCs, but the effect was still notable for both, having a .27 standard deviation increase and a 1.21 standard deviation increase from low to high success/engagement for the respective groups.
Figure AT1 shows the different profiles for high and low success/engagement TARCs. The low success/low engagement TARC tends to clearly lead with FO (detail orientation), having FO as the highest relative Agility sub-domain. The high success/engagement TARC, however, leads with TA, AD, RI and, to a lesser extent, CU, while having FO levels that are notably lower than these (33rd percentile) and lower than the average C-level executive. Comparing Figures AT1 and AB1 shows that all KF4D-Exec assessment Agility sub-domains are more differentiating in general between high and low success/engagement TARCs than between high and low success/engagement BLDRs. Differences shown in Figure AT1 are clear and striking, while differences shown in Figure AB1 are less pronounced and almost subtle. The differences are a reflection of the moderated magnitude that is present and clear from a gestalt examination of TARC and BLDR comparative slopes in Figures AS1 through AS5. Nonetheless, KF4D-Exec Agility sub-domain scores do differentiate between BLDRs to some degree, indicating that higher scores in AD, TA, RI, and, unlike TARCs, higher scores in FO are typically associated with better-fitting BLDRs. Interestingly, low success/low engagement TARCs are not unlike high success/high engagement BLDRs in many respects, save that the latter have notably higher FO scores and are a group for which FO increases are desirable. Among other things, the similarity of low success/low engagement TARCs and high success/high engagement BLDRs speaks sharply to KF4D-Exec’s potential to detect and explicate moderation and the degree to which fit is contextually defined. The contextual impact on fit can also be seen in Figure ATB1.
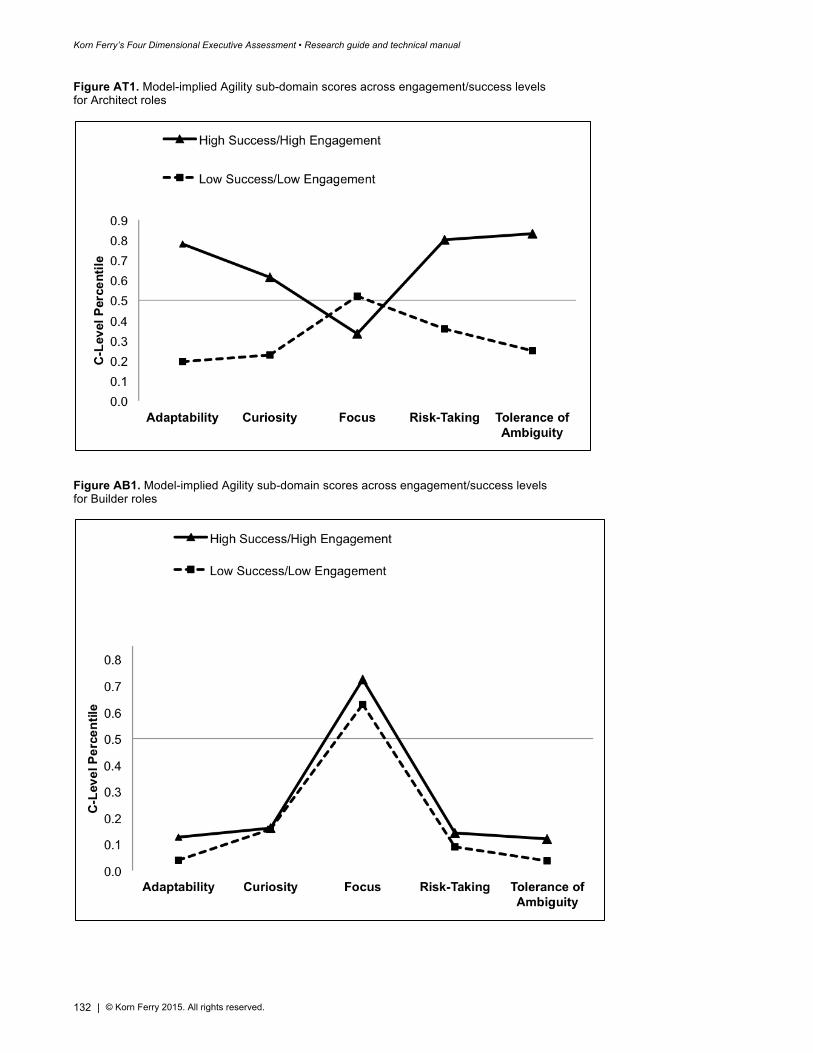
Korn Ferry’s Four Dimensional Executive Assessment • Research guide and technical manual
132 | © Korn Ferry 2015. All rights reserved.
Figure AT1. Model-implied Agility sub-domain scores across engagement/success levels for Architect roles
Figure AB1. Model-implied Agility sub-domain scores across engagement/success levels for Builder roles
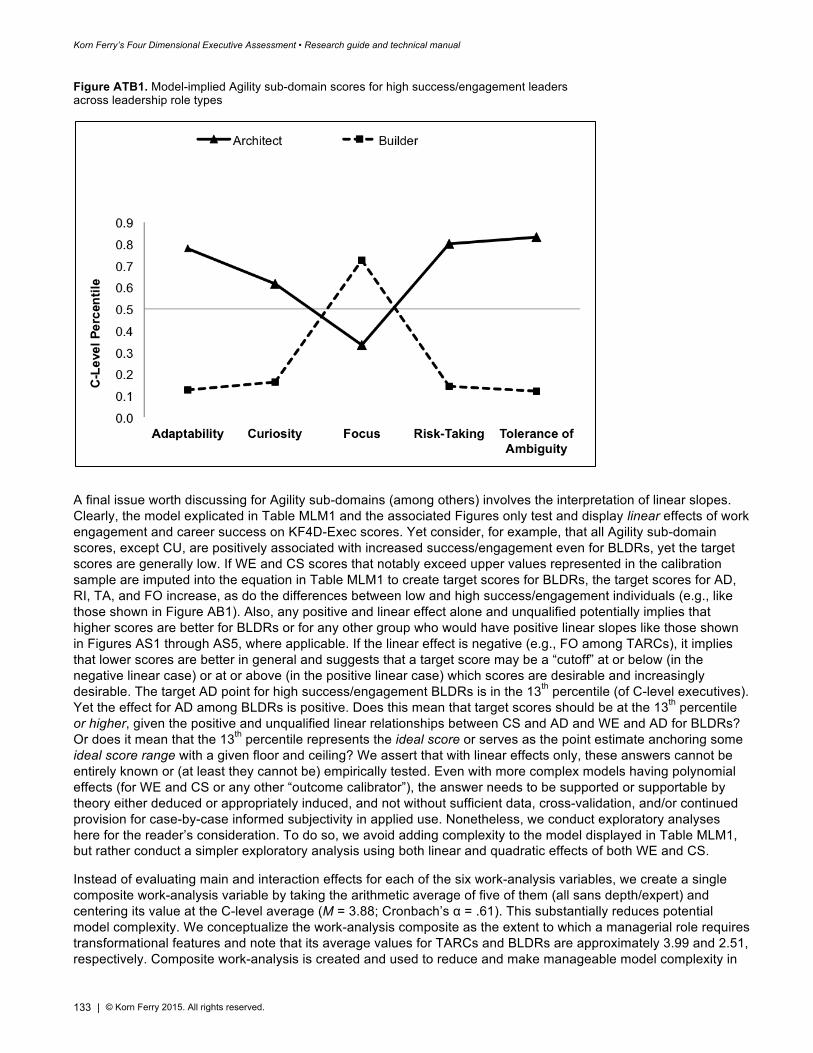
Korn Ferry’s Four Dimensional Executive Assessment • Research guide and technical manual
133 | © Korn Ferry 2015. All rights reserved.
Figure ATB1. Model-implied Agility sub-domain scores for high success/engagement leaders across leadership role types
A final issue worth discussing for Agility sub-domains (among others) involves the interpretation of linear slopes. Clearly, the model explicated in Table MLM1 and the associated Figures only test and display linear effects of work engagement and career success on KF4D-Exec scores. Yet consider, for example, that all Agility sub-domain scores, except CU, are positively associated with increased success/engagement even for BLDRs, yet the target scores are generally low. If WE and CS scores that notably exceed upper values represented in the calibration sample are imputed into the equation in Table MLM1 to create target scores for BLDRs, the target scores for AD, RI, TA, and FO increase, as do the differences between low and high success/engagement individuals (e.g., like those shown in Figure AB1). Also, any positive and linear effect alone and unqualified potentially implies that higher scores are better for BLDRs or for any other group who would have positive linear slopes like those shown in Figures AS1 through AS5, where applicable. If the linear effect is negative (e.g., FO among TARCs), it implies that lower scores are better in general and suggests that a target score may be a “cutoff” at or below (in the negative linear case) or at or above (in the positive linear case) which scores are desirable and increasingly desirable. The target AD point for high success/engagement BLDRs is in the 13th percentile (of C-level executives). Yet the effect for AD among BLDRs is positive. Does this mean that target scores should be at the 13th percentile or higher, given the positive and unqualified linear relationships between CS and AD and WE and AD for BLDRs? Or does it mean that the 13th percentile represents the ideal score or serves as the point estimate anchoring some ideal score range with a given floor and ceiling? We assert that with linear effects only, these answers cannot be entirely known or (at least they cannot be) empirically tested. Even with more complex models having polynomial effects (for WE and CS or any other “outcome calibrator”), the answer needs to be supported or supportable by theory either deduced or appropriately induced, and not without sufficient data, cross-validation, and/or continued provision for case-by-case informed subjectivity in applied use. Nonetheless, we conduct exploratory analyses here for the reader’s consideration. To do so, we avoid adding complexity to the model displayed in Table MLM1, but rather conduct a simpler exploratory analysis using both linear and quadratic effects of both WE and CS.
Instead of evaluating main and interaction effects for each of the six work-analysis variables, we create a single composite work-analysis variable by taking the arithmetic average of five of them (all sans depth/expert) and centering its value at the C-level average (M = 3.88; Cronbach’s α = .61). This substantially reduces potential model complexity. We conceptualize the work-analysis composite as the extent to which a managerial role requires transformational features and note that its average values for TARCs and BLDRs are approximately 3.99 and 2.51, respectively. Composite work-analysis is created and used to reduce and make manageable model complexity in
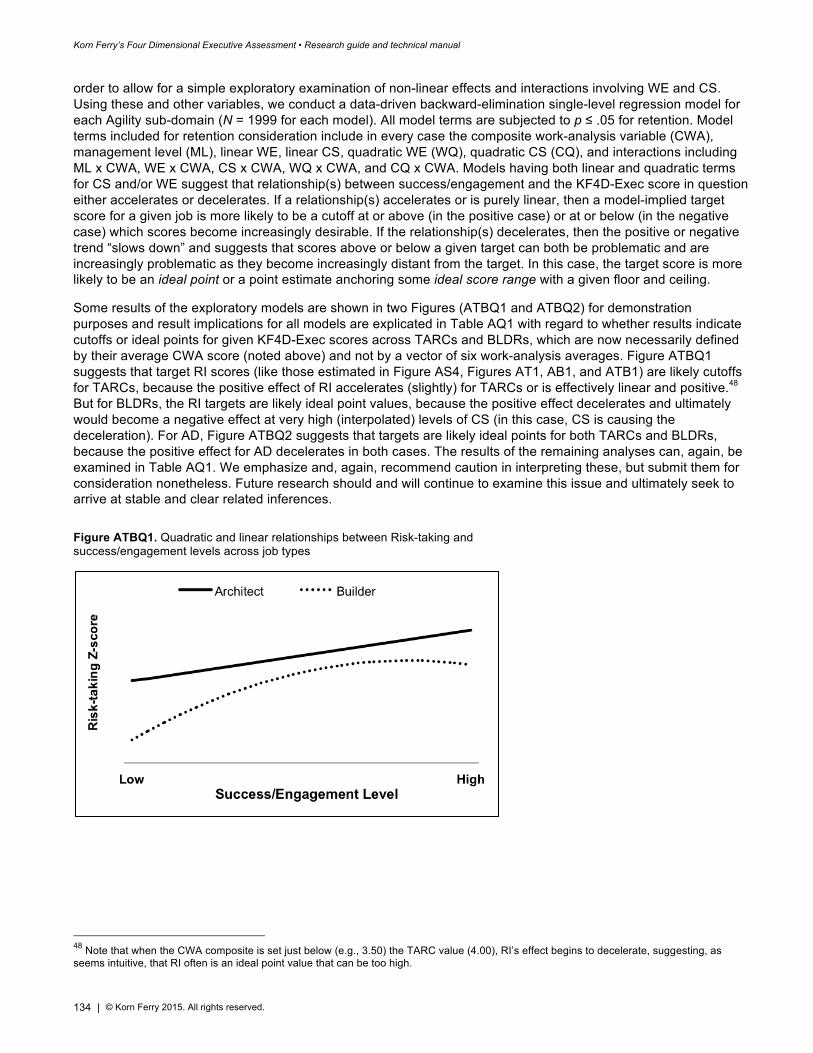
Korn Ferry’s Four Dimensional Executive Assessment • Research guide and technical manual
134 | © Korn Ferry 2015. All rights reserved.
order to allow for a simple exploratory examination of non-linear effects and interactions involving WE and CS. Using these and other variables, we conduct a data-driven backward-elimination single-level regression model for each Agility sub-domain (N = 1999 for each model). All model terms are subjected to p ≤ .05 for retention. Model terms included for retention consideration include in every case the composite work-analysis variable (CWA), management level (ML), linear WE, linear CS, quadratic WE (WQ), quadratic CS (CQ), and interactions including ML x CWA, WE x CWA, CS x CWA, WQ x CWA, and CQ x CWA. Models having both linear and quadratic terms for CS and/or WE suggest that relationship(s) between success/engagement and the KF4D-Exec score in question either accelerates or decelerates. If a relationship(s) accelerates or is purely linear, then a model-implied target score for a given job is more likely to be a cutoff at or above (in the positive case) or at or below (in the negative case) which scores become increasingly desirable. If the relationship(s) decelerates, then the positive or negative trend “slows down” and suggests that scores above or below a given target can both be problematic and are increasingly problematic as they become increasingly distant from the target. In this case, the target score is more likely to be an ideal point or a point estimate anchoring some ideal score range with a given floor and ceiling.
Some results of the exploratory models are shown in two Figures (ATBQ1 and ATBQ2) for demonstration purposes and result implications for all models are explicated in Table AQ1 with regard to whether results indicate cutoffs or ideal points for given KF4D-Exec scores across TARCs and BLDRs, which are now necessarily defined by their average CWA score (noted above) and not by a vector of six work-analysis averages. Figure ATBQ1 suggests that target RI scores (like those estimated in Figure AS4, Figures AT1, AB1, and ATB1) are likely cutoffs for TARCs, because the positive effect of RI accelerates (slightly) for TARCs or is effectively linear and positive.48 But for BLDRs, the RI targets are likely ideal point values, because the positive effect decelerates and ultimately would become a negative effect at very high (interpolated) levels of CS (in this case, CS is causing the deceleration). For AD, Figure ATBQ2 suggests that targets are likely ideal points for both TARCs and BLDRs, because the positive effect for AD decelerates in both cases. The results of the remaining analyses can, again, be examined in Table AQ1. We emphasize and, again, recommend caution in interpreting these, but submit them for consideration nonetheless. Future research should and will continue to examine this issue and ultimately seek to arrive at stable and clear related inferences.
Figure ATBQ1. Quadratic and linear relationships between Risk-taking and success/engagement levels across job types
48 Note that when the CWA composite is set just below (e.g., 3.50) the TARC value (4.00), RI’s effect begins to decelerate, suggesting, as seems intuitive, that RI often is an ideal point value that can be too high.
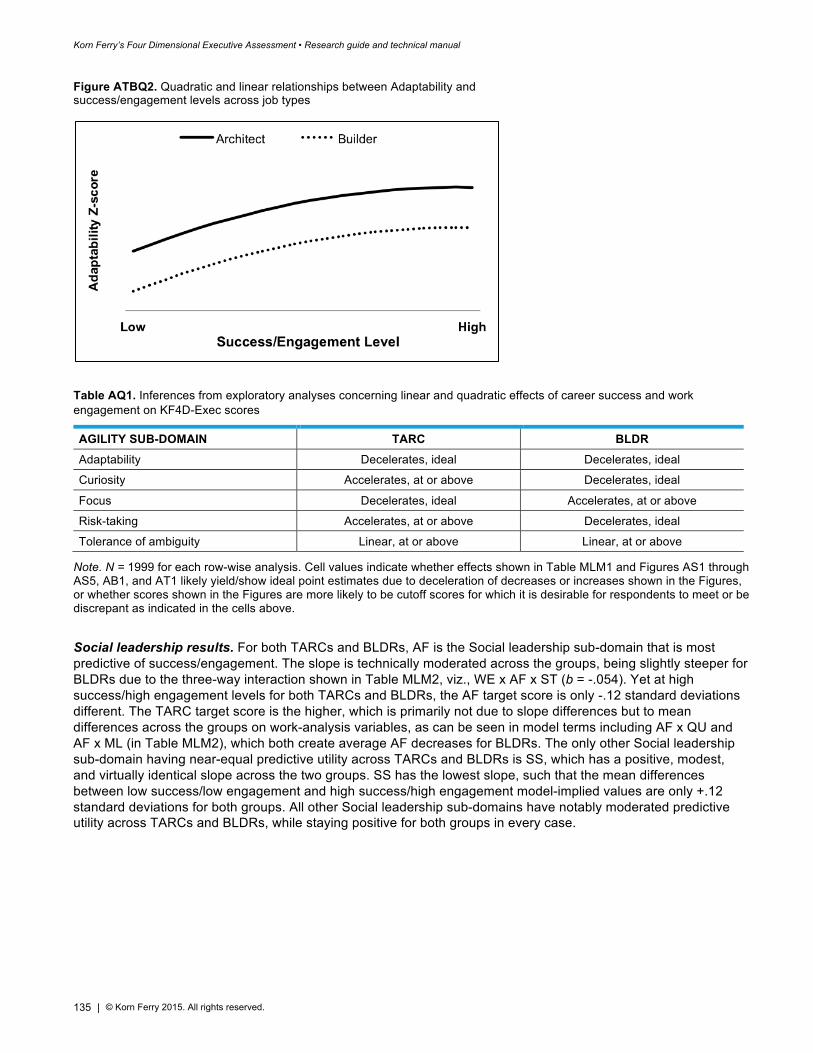
Korn Ferry’s Four Dimensional Executive Assessment • Research guide and technical manual
135 | © Korn Ferry 2015. All rights reserved.
Figure ATBQ2. Quadratic and linear relationships between Adaptability and success/engagement levels across job types
Table AQ1. Inferences from exploratory analyses concerning linear and quadratic effects of career success and work engagement on KF4D-Exec scores
AGILITY SUB-DOMAIN TARC BLDR Adaptability Decelerates, ideal Decelerates, ideal
Curiosity Accelerates, at or above Decelerates, ideal
Focus Decelerates, ideal Accelerates, at or above
Risk-taking Accelerates, at or above Decelerates, ideal
Tolerance of ambiguity Linear, at or above Linear, at or above
Note. N = 1999 for each row-wise analysis. Cell values indicate whether effects shown in Table MLM1 and Figures AS1 through AS5, AB1, and AT1 likely yield/show ideal point estimates due to deceleration of decreases or increases shown in the Figures, or whether scores shown in the Figures are more likely to be cutoff scores for which it is desirable for respondents to meet or be discrepant as indicated in the cells above.
Social leadership results. For both TARCs and BLDRs, AF is the Social leadership sub-domain that is most predictive of success/engagement. The slope is technically moderated across the groups, being slightly steeper for BLDRs due to the three-way interaction shown in Table MLM2, viz., WE x AF x ST (b = -.054). Yet at high success/high engagement levels for both TARCs and BLDRs, the AF target score is only -.12 standard deviations different. The TARC target score is the higher, which is primarily not due to slope differences but to mean differences across the groups on work-analysis variables, as can be seen in model terms including AF x QU and AF x ML (in Table MLM2), which both create average AF decreases for BLDRs. The only other Social leadership sub-domain having near-equal predictive utility across TARCs and BLDRs is SS, which has a positive, modest, and virtually identical slope across the two groups. SS has the lowest slope, such that the mean differences between low success/low engagement and high success/high engagement model-implied values are only +.12 standard deviations for both groups. All other Social leadership sub-domains have notably moderated predictive utility across TARCs and BLDRs, while staying positive for both groups in every case.
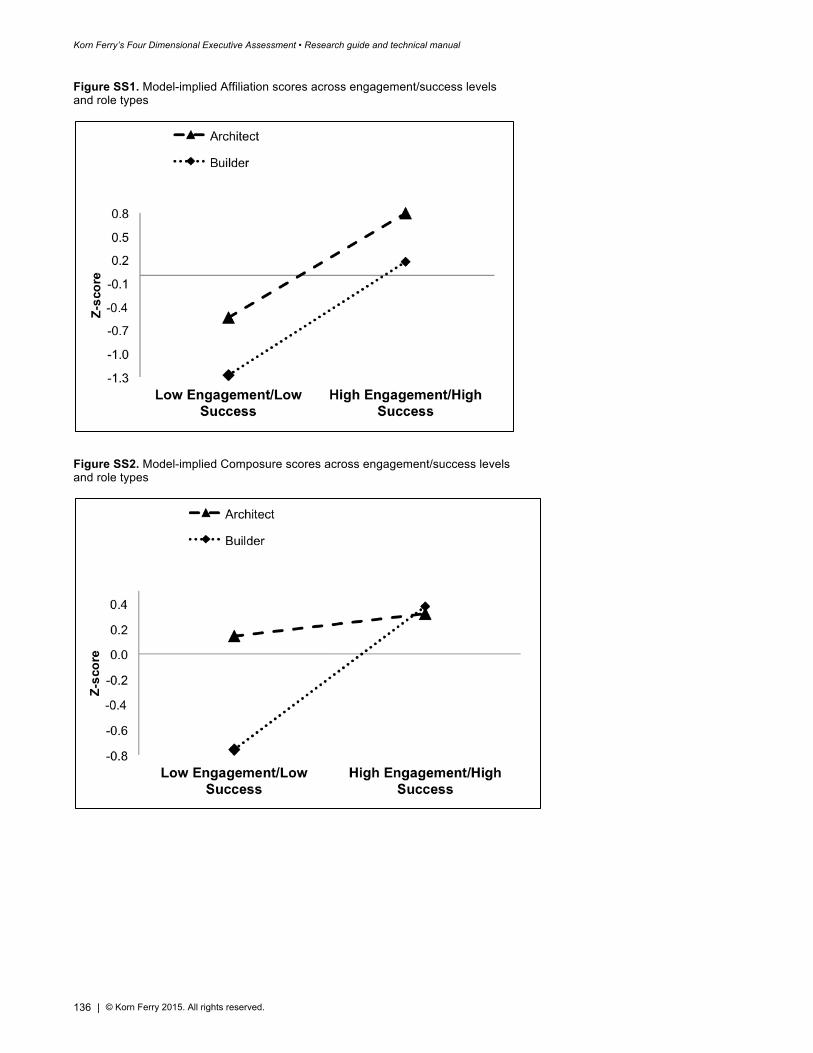
Korn Ferry’s Four Dimensional Executive Assessment • Research guide and technical manual
136 | © Korn Ferry 2015. All rights reserved.
Figure SS1. Model-implied Affiliation scores across engagement/success levels and role types
Figure SS2. Model-implied Composure scores across engagement/success levels and role types
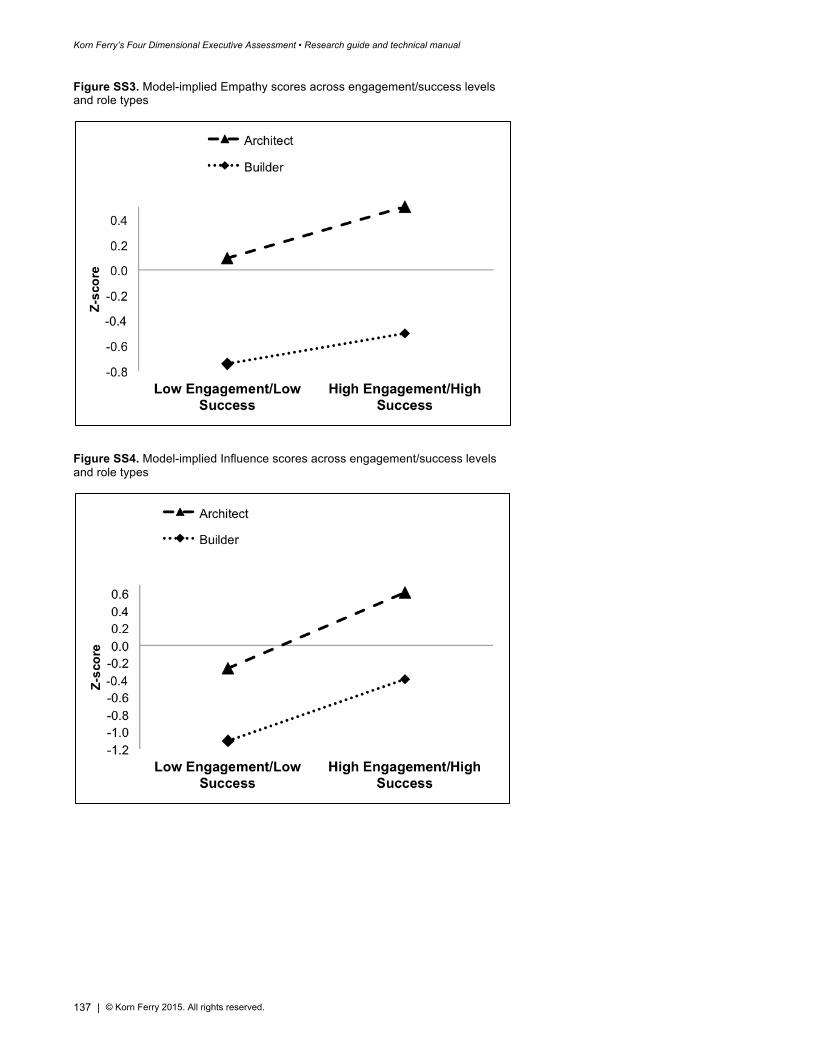
Korn Ferry’s Four Dimensional Executive Assessment • Research guide and technical manual
137 | © Korn Ferry 2015. All rights reserved.
Figure SS3. Model-implied Empathy scores across engagement/success levels and role types
Figure SS4. Model-implied Influence scores across engagement/success levels and role types
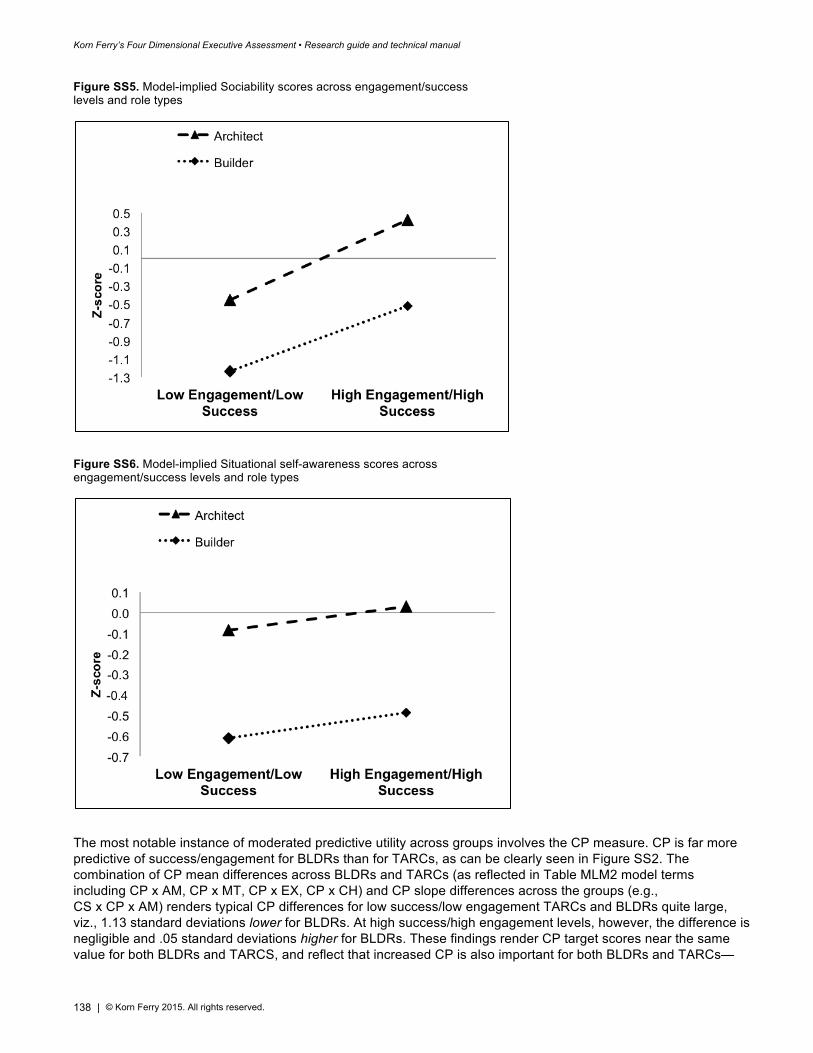
Korn Ferry’s Four Dimensional Executive Assessment • Research guide and technical manual
138 | © Korn Ferry 2015. All rights reserved.
Figure SS5. Model-implied Sociability scores across engagement/success levels and role types
Figure SS6. Model-implied Situational self-awareness scores across engagement/success levels and role types
The most notable instance of moderated predictive utility across groups involves the CP measure. CP is far more predictive of success/engagement for BLDRs than for TARCs, as can be clearly seen in Figure SS2. The combination of CP mean differences across BLDRs and TARCs (as reflected in Table MLM2 model terms including CP x AM, CP x MT, CP x EX, CP x CH) and CP slope differences across the groups (e.g., CS x CP x AM) renders typical CP differences for low success/low engagement TARCs and BLDRs quite large, viz., 1.13 standard deviations lower for BLDRs. At high success/high engagement levels, however, the difference is negligible and .05 standard deviations higher for BLDRs. These findings render CP target scores near the same value for both BLDRs and TARCS, and reflect that increased CP is also important for both BLDRs and TARCs—
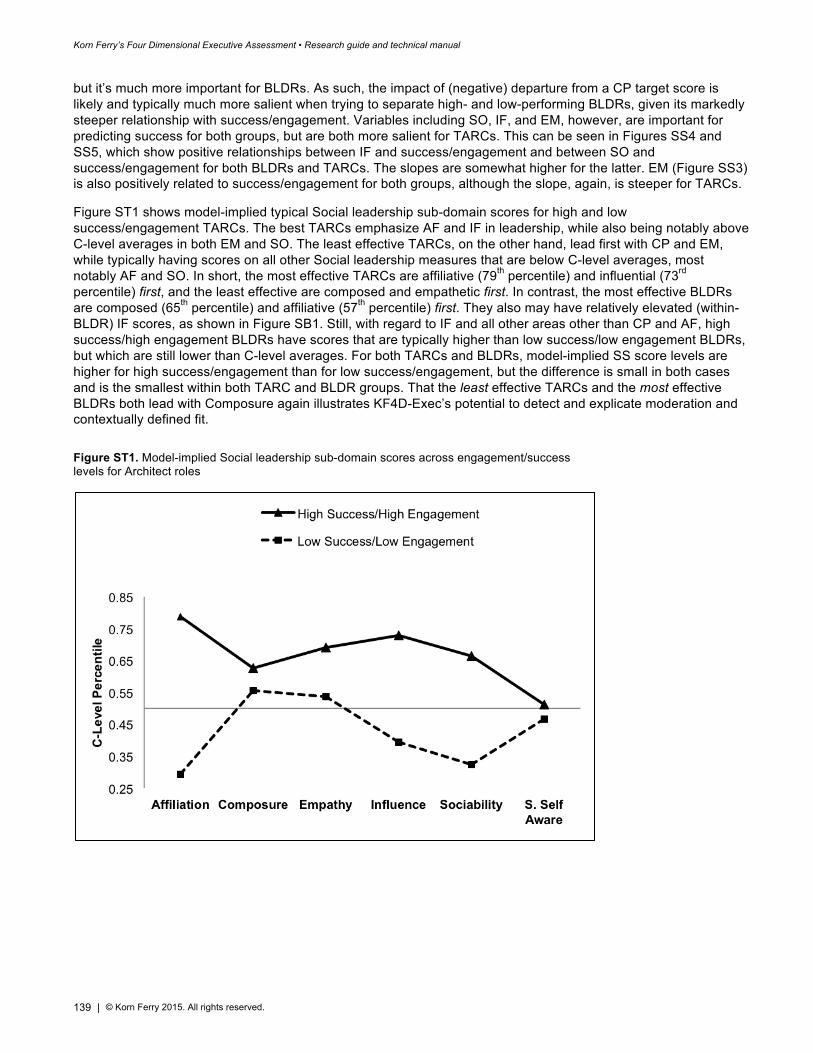
Korn Ferry’s Four Dimensional Executive Assessment • Research guide and technical manual
139 | © Korn Ferry 2015. All rights reserved.
but it’s much more important for BLDRs. As such, the impact of (negative) departure from a CP target score is likely and typically much more salient when trying to separate high- and low-performing BLDRs, given its markedly steeper relationship with success/engagement. Variables including SO, IF, and EM, however, are important for predicting success for both groups, but are both more salient for TARCs. This can be seen in Figures SS4 and SS5, which show positive relationships between IF and success/engagement and between SO and success/engagement for both BLDRs and TARCs. The slopes are somewhat higher for the latter. EM (Figure SS3) is also positively related to success/engagement for both groups, although the slope, again, is steeper for TARCs.
Figure ST1 shows model-implied typical Social leadership sub-domain scores for high and low success/engagement TARCs. The best TARCs emphasize AF and IF in leadership, while also being notably above C-level averages in both EM and SO. The least effective TARCs, on the other hand, lead first with CP and EM, while typically having scores on all other Social leadership measures that are below C-level averages, most notably AF and SO. In short, the most effective TARCs are affiliative (79th percentile) and influential (73rd percentile) first, and the least effective are composed and empathetic first. In contrast, the most effective BLDRs are composed (65th percentile) and affiliative (57th percentile) first. They also may have relatively elevated (within-BLDR) IF scores, as shown in Figure SB1. Still, with regard to IF and all other areas other than CP and AF, high success/high engagement BLDRs have scores that are typically higher than low success/low engagement BLDRs, but which are still lower than C-level averages. For both TARCs and BLDRs, model-implied SS score levels are higher for high success/engagement than for low success/engagement, but the difference is small in both cases and is the smallest within both TARC and BLDR groups. That the least effective TARCs and the most effective BLDRs both lead with Composure again illustrates KF4D-Exec’s potential to detect and explicate moderation and contextually defined fit.
Figure ST1. Model-implied Social leadership sub-domain scores across engagement/success levels for Architect roles
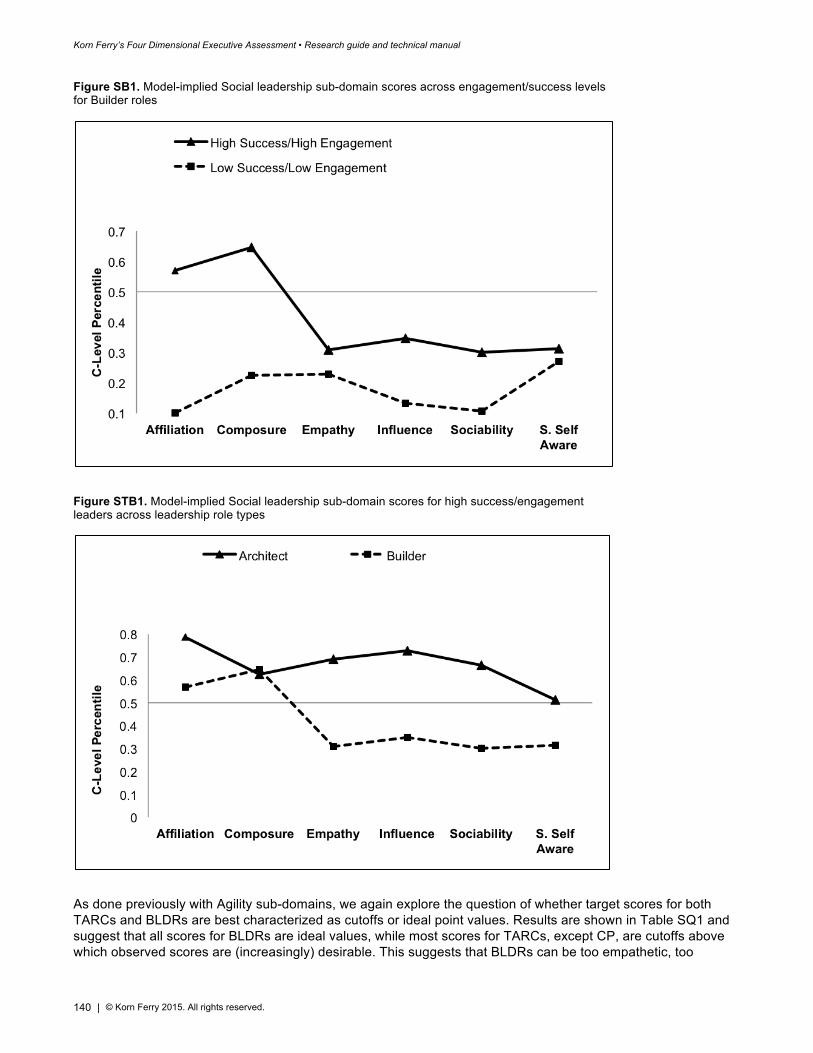
Korn Ferry’s Four Dimensional Executive Assessment • Research guide and technical manual
140 | © Korn Ferry 2015. All rights reserved.
Figure SB1. Model-implied Social leadership sub-domain scores across engagement/success levels for Builder roles
Figure STB1. Model-implied Social leadership sub-domain scores for high success/engagement leaders across leadership role types
As done previously with Agility sub-domains, we again explore the question of whether target scores for both TARCs and BLDRs are best characterized as cutoffs or ideal point values. Results are shown in Table SQ1 and suggest that all scores for BLDRs are ideal values, while most scores for TARCs, except CP, are cutoffs above which observed scores are (increasingly) desirable. This suggests that BLDRs can be too empathetic, too
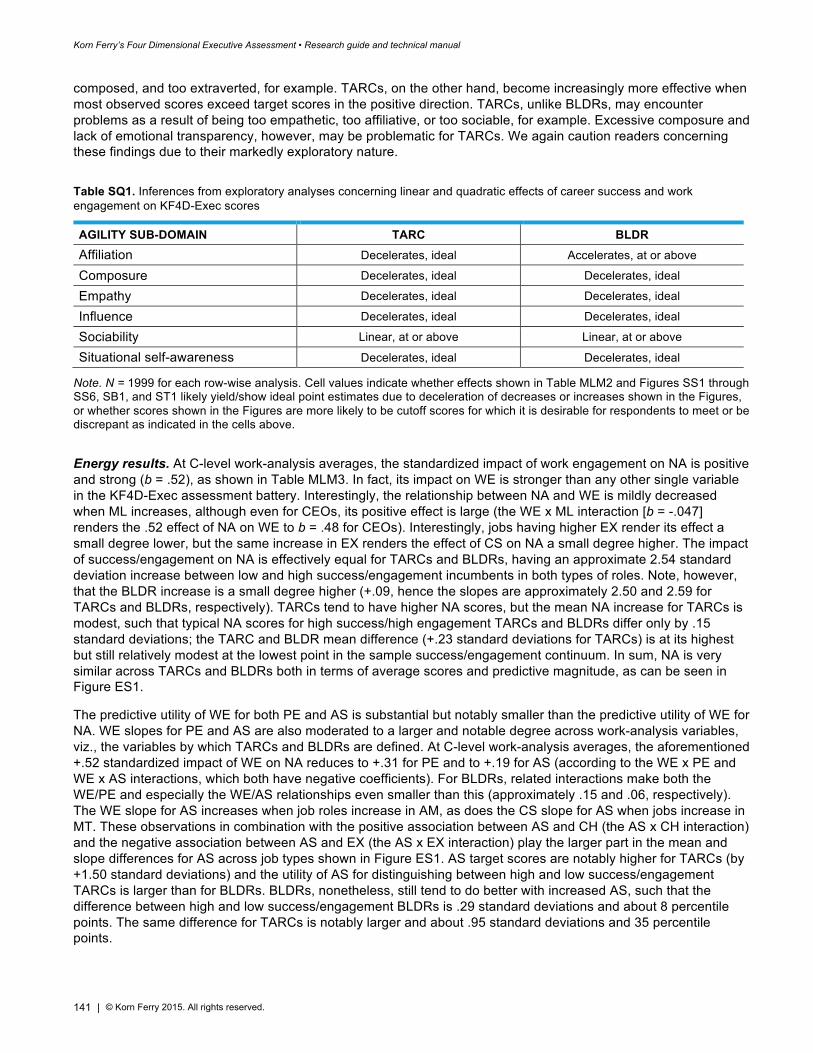
Korn Ferry’s Four Dimensional Executive Assessment • Research guide and technical manual
141 | © Korn Ferry 2015. All rights reserved.
composed, and too extraverted, for example. TARCs, on the other hand, become increasingly more effective when most observed scores exceed target scores in the positive direction. TARCs, unlike BLDRs, may encounter problems as a result of being too empathetic, too affiliative, or too sociable, for example. Excessive composure and lack of emotional transparency, however, may be problematic for TARCs. We again caution readers concerning these findings due to their markedly exploratory nature.
Table SQ1. Inferences from exploratory analyses concerning linear and quadratic effects of career success and work engagement on KF4D-Exec scores
AGILITY SUB-DOMAIN TARC BLDR Affiliation Decelerates, ideal Accelerates, at or above
Composure Decelerates, ideal Decelerates, ideal
Empathy Decelerates, ideal Decelerates, ideal
Influence Decelerates, ideal Decelerates, ideal
Sociability Linear, at or above Linear, at or above
Situational self-awareness Decelerates, ideal Decelerates, ideal
Note. N = 1999 for each row-wise analysis. Cell values indicate whether effects shown in Table MLM2 and Figures SS1 through SS6, SB1, and ST1 likely yield/show ideal point estimates due to deceleration of decreases or increases shown in the Figures, or whether scores shown in the Figures are more likely to be cutoff scores for which it is desirable for respondents to meet or be discrepant as indicated in the cells above.
Energy results. At C-level work-analysis averages, the standardized impact of work engagement on NA is positive and strong (b = .52), as shown in Table MLM3. In fact, its impact on WE is stronger than any other single variable in the KF4D-Exec assessment battery. Interestingly, the relationship between NA and WE is mildly decreased when ML increases, although even for CEOs, its positive effect is large (the WE x ML interaction [b = -.047] renders the .52 effect of NA on WE to b = .48 for CEOs). Interestingly, jobs having higher EX render its effect a small degree lower, but the same increase in EX renders the effect of CS on NA a small degree higher. The impact of success/engagement on NA is effectively equal for TARCs and BLDRs, having an approximate 2.54 standard deviation increase between low and high success/engagement incumbents in both types of roles. Note, however, that the BLDR increase is a small degree higher (+.09, hence the slopes are approximately 2.50 and 2.59 for TARCs and BLDRs, respectively). TARCs tend to have higher NA scores, but the mean NA increase for TARCs is modest, such that typical NA scores for high success/high engagement TARCs and BLDRs differ only by .15 standard deviations; the TARC and BLDR mean difference (+.23 standard deviations for TARCs) is at its highest but still relatively modest at the lowest point in the sample success/engagement continuum. In sum, NA is very similar across TARCs and BLDRs both in terms of average scores and predictive magnitude, as can be seen in Figure ES1.
The predictive utility of WE for both PE and AS is substantial but notably smaller than the predictive utility of WE for NA. WE slopes for PE and AS are also moderated to a larger and notable degree across work-analysis variables, viz., the variables by which TARCs and BLDRs are defined. At C-level work-analysis averages, the aforementioned +.52 standardized impact of WE on NA reduces to +.31 for PE and to +.19 for AS (according to the WE x PE and WE x AS interactions, which both have negative coefficients). For BLDRs, related interactions make both the WE/PE and especially the WE/AS relationships even smaller than this (approximately .15 and .06, respectively). The WE slope for AS increases when job roles increase in AM, as does the CS slope for AS when jobs increase in MT. These observations in combination with the positive association between AS and CH (the AS x CH interaction) and the negative association between AS and EX (the AS x EX interaction) play the larger part in the mean and slope differences for AS across job types shown in Figure ES1. AS target scores are notably higher for TARCs (by +1.50 standard deviations) and the utility of AS for distinguishing between high and low success/engagement TARCs is larger than for BLDRs. BLDRs, nonetheless, still tend to do better with increased AS, such that the difference between high and low success/engagement BLDRs is .29 standard deviations and about 8 percentile points. The same difference for TARCs is notably larger and about .95 standard deviations and 35 percentile points.
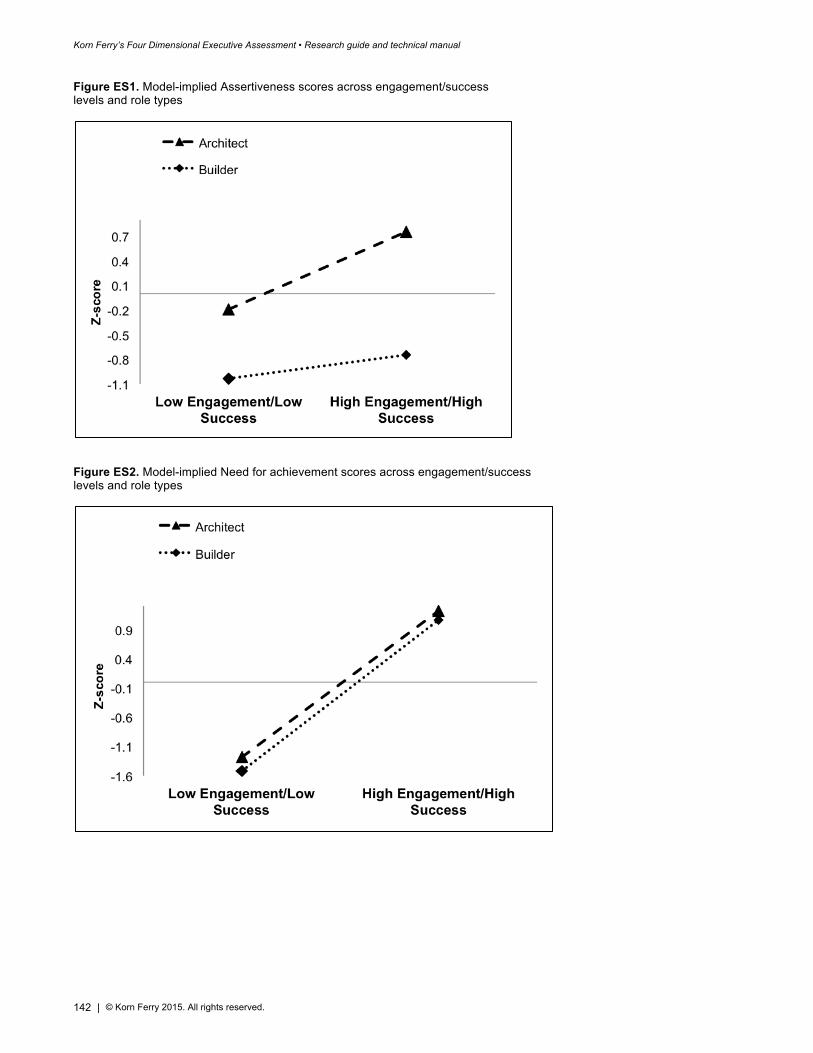
Korn Ferry’s Four Dimensional Executive Assessment • Research guide and technical manual
142 | © Korn Ferry 2015. All rights reserved.
Figure ES1. Model-implied Assertiveness scores across engagement/success levels and role types
Figure ES2. Model-implied Need for achievement scores across engagement/success levels and role types
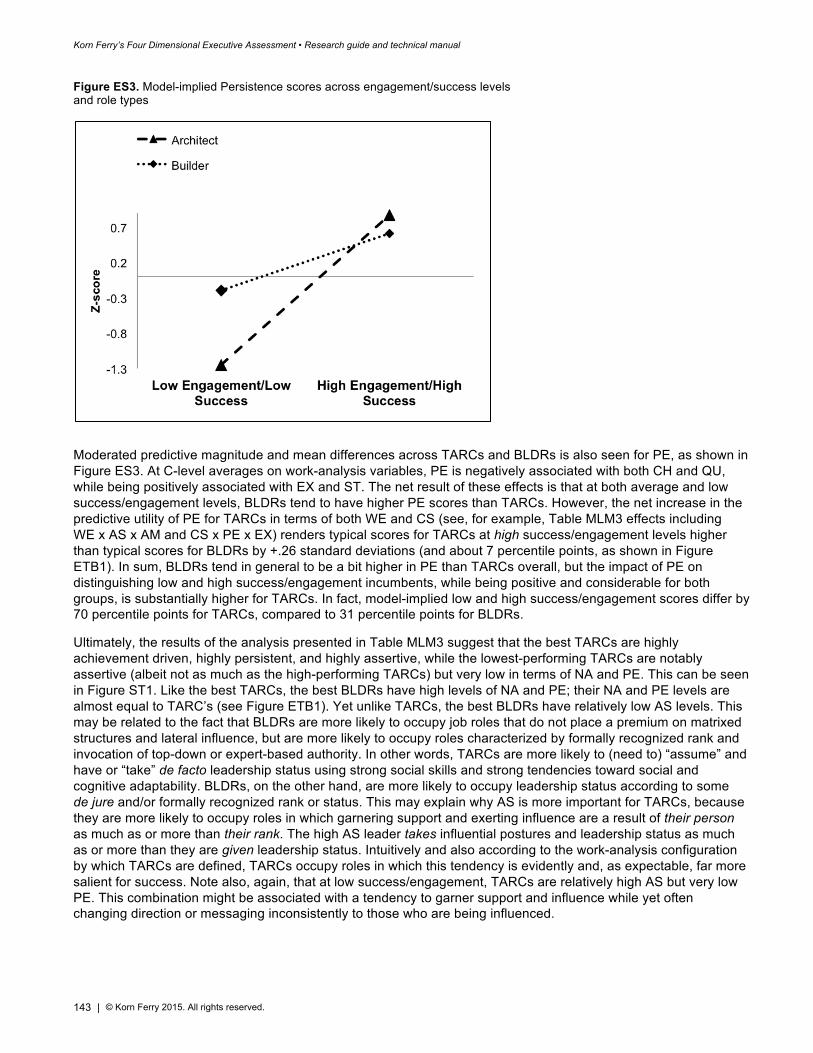
Korn Ferry’s Four Dimensional Executive Assessment • Research guide and technical manual
143 | © Korn Ferry 2015. All rights reserved.
Figure ES3. Model-implied Persistence scores across engagement/success levels and role types
Moderated predictive magnitude and mean differences across TARCs and BLDRs is also seen for PE, as shown in Figure ES3. At C-level averages on work-analysis variables, PE is negatively associated with both CH and QU, while being positively associated with EX and ST. The net result of these effects is that at both average and low success/engagement levels, BLDRs tend to have higher PE scores than TARCs. However, the net increase in the predictive utility of PE for TARCs in terms of both WE and CS (see, for example, Table MLM3 effects including WE x AS x AM and CS x PE x EX) renders typical scores for TARCs at high success/engagement levels higher than typical scores for BLDRs by +.26 standard deviations (and about 7 percentile points, as shown in Figure ETB1). In sum, BLDRs tend in general to be a bit higher in PE than TARCs overall, but the impact of PE on distinguishing low and high success/engagement incumbents, while being positive and considerable for both groups, is substantially higher for TARCs. In fact, model-implied low and high success/engagement scores differ by 70 percentile points for TARCs, compared to 31 percentile points for BLDRs.
Ultimately, the results of the analysis presented in Table MLM3 suggest that the best TARCs are highly achievement driven, highly persistent, and highly assertive, while the lowest-performing TARCs are notably assertive (albeit not as much as the high-performing TARCs) but very low in terms of NA and PE. This can be seen in Figure ST1. Like the best TARCs, the best BLDRs have high levels of NA and PE; their NA and PE levels are almost equal to TARC’s (see Figure ETB1). Yet unlike TARCs, the best BLDRs have relatively low AS levels. This may be related to the fact that BLDRs are more likely to occupy job roles that do not place a premium on matrixed structures and lateral influence, but are more likely to occupy roles characterized by formally recognized rank and invocation of top-down or expert-based authority. In other words, TARCs are more likely to (need to) “assume” and have or “take” de facto leadership status using strong social skills and strong tendencies toward social and cognitive adaptability. BLDRs, on the other hand, are more likely to occupy leadership status according to some de jure and/or formally recognized rank or status. This may explain why AS is more important for TARCs, because they are more likely to occupy roles in which garnering support and exerting influence are a result of their person as much as or more than their rank. The high AS leader takes influential postures and leadership status as much as or more than they are given leadership status. Intuitively and also according to the work-analysis configuration by which TARCs are defined, TARCs occupy roles in which this tendency is evidently and, as expectable, far more salient for success. Note also, again, that at low success/engagement, TARCs are relatively high AS but very low PE. This combination might be associated with a tendency to garner support and influence while yet often changing direction or messaging inconsistently to those who are being influenced.
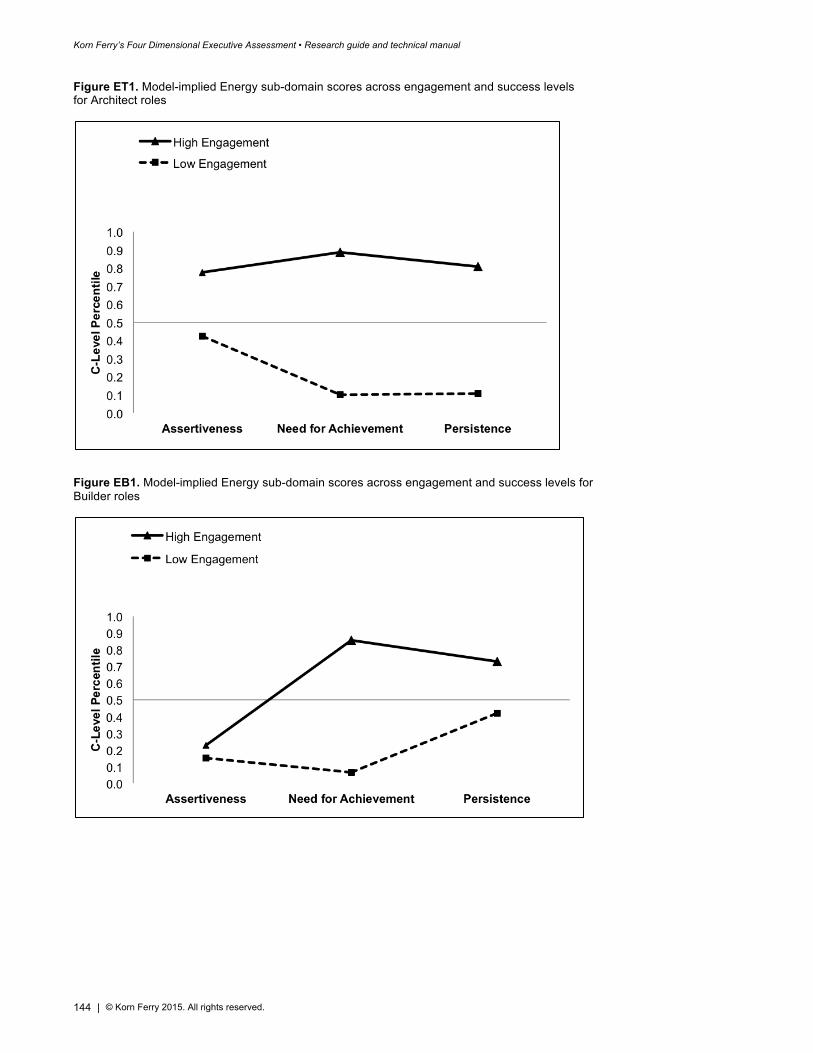
Korn Ferry’s Four Dimensional Executive Assessment • Research guide and technical manual
144 | © Korn Ferry 2015. All rights reserved.
Figure ET1. Model-implied Energy sub-domain scores across engagement and success levels for Architect roles
Figure EB1. Model-implied Energy sub-domain scores across engagement and success levels for Builder roles
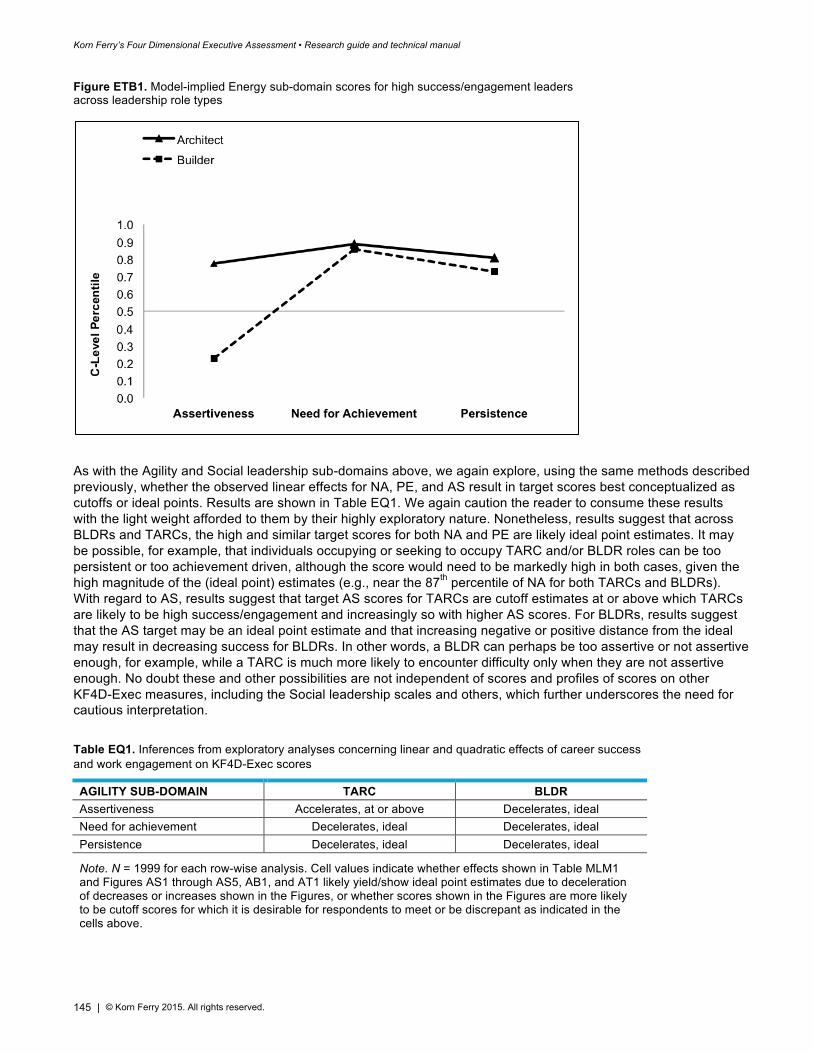
Korn Ferry’s Four Dimensional Executive Assessment • Research guide and technical manual
145 | © Korn Ferry 2015. All rights reserved.
Figure ETB1. Model-implied Energy sub-domain scores for high success/engagement leaders across leadership role types
As with the Agility and Social leadership sub-domains above, we again explore, using the same methods described previously, whether the observed linear effects for NA, PE, and AS result in target scores best conceptualized as cutoffs or ideal points. Results are shown in Table EQ1. We again caution the reader to consume these results with the light weight afforded to them by their highly exploratory nature. Nonetheless, results suggest that across BLDRs and TARCs, the high and similar target scores for both NA and PE are likely ideal point estimates. It may be possible, for example, that individuals occupying or seeking to occupy TARC and/or BLDR roles can be too persistent or too achievement driven, although the score would need to be markedly high in both cases, given the high magnitude of the (ideal point) estimates (e.g., near the 87th percentile of NA for both TARCs and BLDRs). With regard to AS, results suggest that target AS scores for TARCs are cutoff estimates at or above which TARCs are likely to be high success/engagement and increasingly so with higher AS scores. For BLDRs, results suggest that the AS target may be an ideal point estimate and that increasing negative or positive distance from the ideal may result in decreasing success for BLDRs. In other words, a BLDR can perhaps be too assertive or not assertive enough, for example, while a TARC is much more likely to encounter difficulty only when they are not assertive enough. No doubt these and other possibilities are not independent of scores and profiles of scores on other KF4D-Exec measures, including the Social leadership scales and others, which further underscores the need for cautious interpretation.
Table EQ1. Inferences from exploratory analyses concerning linear and quadratic effects of career success and work engagement on KF4D-Exec scores
AGILITY SUB-DOMAIN TARC BLDR Assertiveness Accelerates, at or above Decelerates, ideal Need for achievement Decelerates, ideal Decelerates, ideal Persistence Decelerates, ideal Decelerates, ideal
Note. N = 1999 for each row-wise analysis. Cell values indicate whether effects shown in Table MLM1 and Figures AS1 through AS5, AB1, and AT1 likely yield/show ideal point estimates due to deceleration of decreases or increases shown in the Figures, or whether scores shown in the Figures are more likely to be cutoff scores for which it is desirable for respondents to meet or be discrepant as indicated in the cells above.
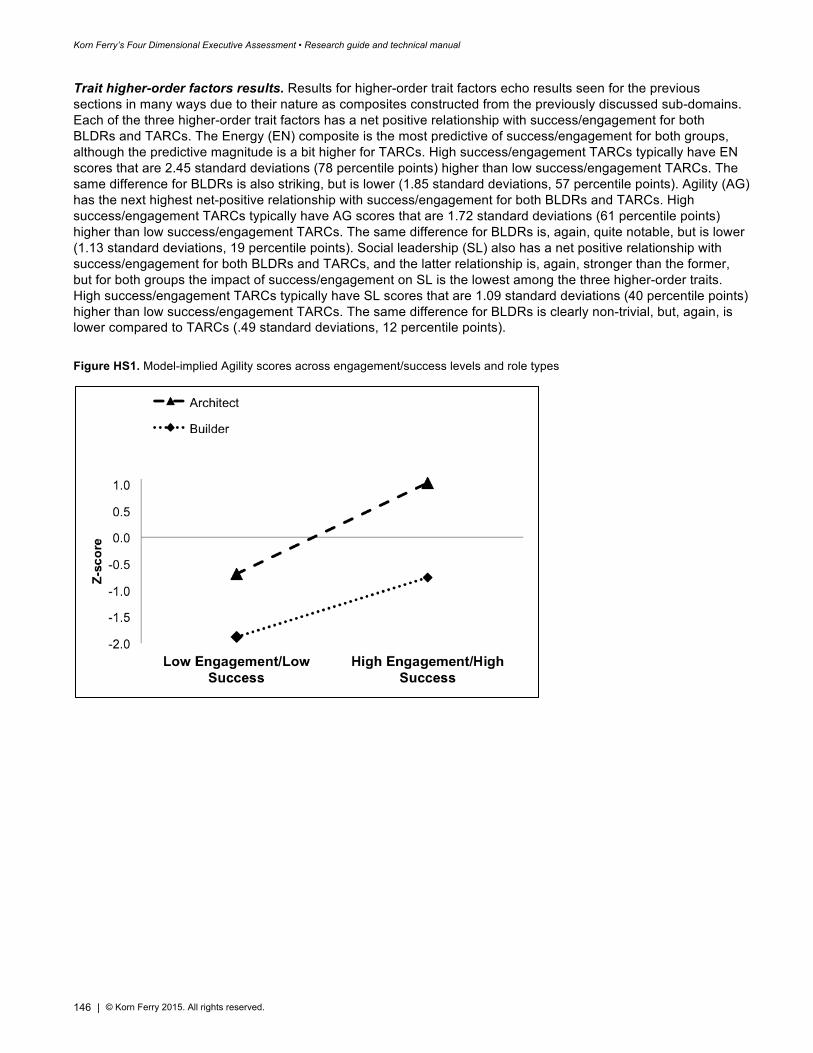
Korn Ferry’s Four Dimensional Executive Assessment • Research guide and technical manual
146 | © Korn Ferry 2015. All rights reserved.
Trait higher-order factors results. Results for higher-order trait factors echo results seen for the previous sections in many ways due to their nature as composites constructed from the previously discussed sub-domains. Each of the three higher-order trait factors has a net positive relationship with success/engagement for both BLDRs and TARCs. The Energy (EN) composite is the most predictive of success/engagement for both groups, although the predictive magnitude is a bit higher for TARCs. High success/engagement TARCs typically have EN scores that are 2.45 standard deviations (78 percentile points) higher than low success/engagement TARCs. The same difference for BLDRs is also striking, but is lower (1.85 standard deviations, 57 percentile points). Agility (AG) has the next highest net-positive relationship with success/engagement for both BLDRs and TARCs. High success/engagement TARCs typically have AG scores that are 1.72 standard deviations (61 percentile points) higher than low success/engagement TARCs. The same difference for BLDRs is, again, quite notable, but is lower (1.13 standard deviations, 19 percentile points). Social leadership (SL) also has a net positive relationship with success/engagement for both BLDRs and TARCs, and the latter relationship is, again, stronger than the former, but for both groups the impact of success/engagement on SL is the lowest among the three higher-order traits. High success/engagement TARCs typically have SL scores that are 1.09 standard deviations (40 percentile points) higher than low success/engagement TARCs. The same difference for BLDRs is clearly non-trivial, but, again, is lower compared to TARCs (.49 standard deviations, 12 percentile points).
Figure HS1. Model-implied Agility scores across engagement/success levels and role types
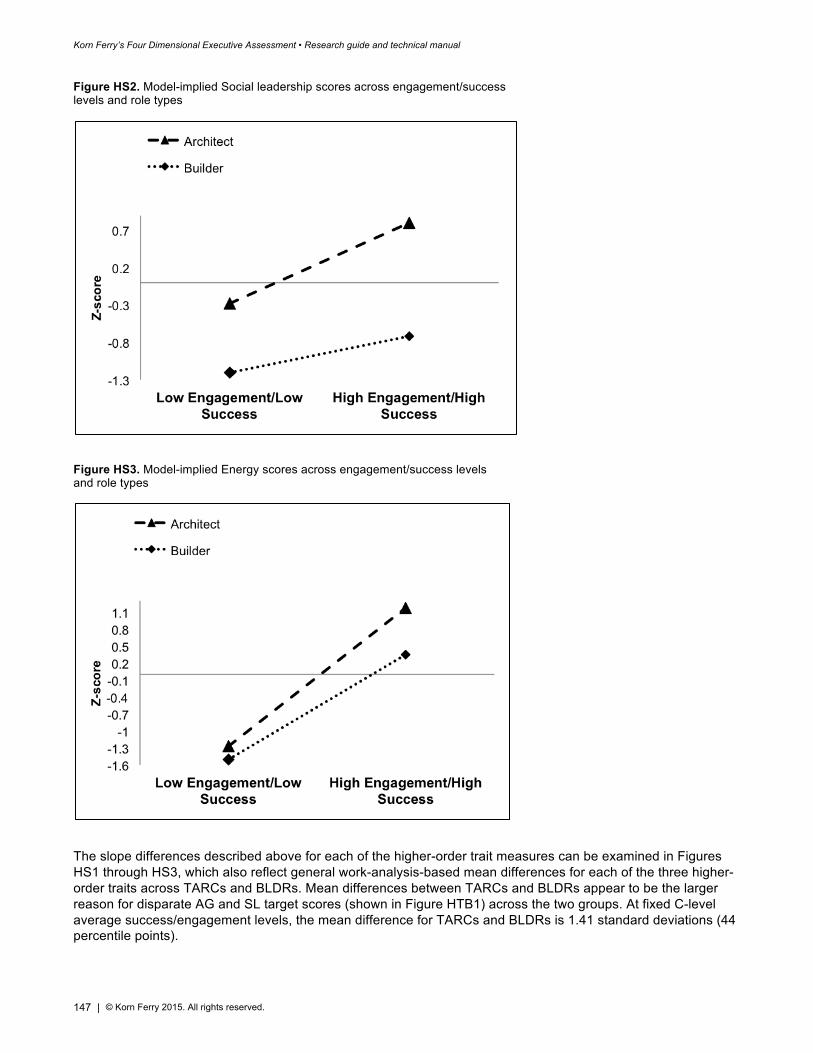
Korn Ferry’s Four Dimensional Executive Assessment • Research guide and technical manual
147 | © Korn Ferry 2015. All rights reserved.
Figure HS2. Model-implied Social leadership scores across engagement/success levels and role types
Figure HS3. Model-implied Energy scores across engagement/success levels and role types
The slope differences described above for each of the higher-order trait measures can be examined in Figures HS1 through HS3, which also reflect general work-analysis-based mean differences for each of the three higher-order traits across TARCs and BLDRs. Mean differences between TARCs and BLDRs appear to be the larger reason for disparate AG and SL target scores (shown in Figure HTB1) across the two groups. At fixed C-level average success/engagement levels, the mean difference for TARCs and BLDRs is 1.41 standard deviations (44 percentile points).
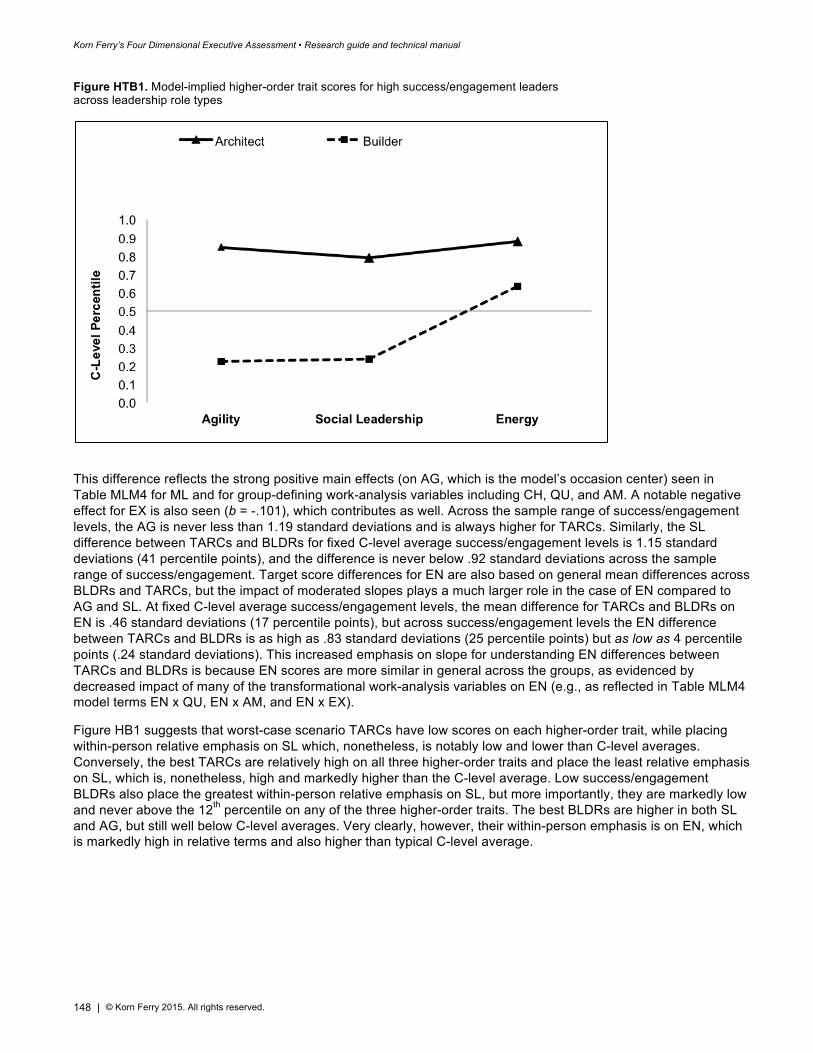
Korn Ferry’s Four Dimensional Executive Assessment • Research guide and technical manual
148 | © Korn Ferry 2015. All rights reserved.
Figure HTB1. Model-implied higher-order trait scores for high success/engagement leaders across leadership role types
This difference reflects the strong positive main effects (on AG, which is the model’s occasion center) seen in Table MLM4 for ML and for group-defining work-analysis variables including CH, QU, and AM. A notable negative effect for EX is also seen (b = -.101), which contributes as well. Across the sample range of success/engagement levels, the AG is never less than 1.19 standard deviations and is always higher for TARCs. Similarly, the SL difference between TARCs and BLDRs for fixed C-level average success/engagement levels is 1.15 standard deviations (41 percentile points), and the difference is never below .92 standard deviations across the sample range of success/engagement. Target score differences for EN are also based on general mean differences across BLDRs and TARCs, but the impact of moderated slopes plays a much larger role in the case of EN compared to AG and SL. At fixed C-level average success/engagement levels, the mean difference for TARCs and BLDRs on EN is .46 standard deviations (17 percentile points), but across success/engagement levels the EN difference between TARCs and BLDRs is as high as .83 standard deviations (25 percentile points) but as low as 4 percentile points (.24 standard deviations). This increased emphasis on slope for understanding EN differences between TARCs and BLDRs is because EN scores are more similar in general across the groups, as evidenced by decreased impact of many of the transformational work-analysis variables on EN (e.g., as reflected in Table MLM4 model terms EN x QU, EN x AM, and EN x EX).
Figure HB1 suggests that worst-case scenario TARCs have low scores on each higher-order trait, while placing within-person relative emphasis on SL which, nonetheless, is notably low and lower than C-level averages. Conversely, the best TARCs are relatively high on all three higher-order traits and place the least relative emphasis on SL, which is, nonetheless, high and markedly higher than the C-level average. Low success/engagement BLDRs also place the greatest within-person relative emphasis on SL, but more importantly, they are markedly low and never above the 12th percentile on any of the three higher-order traits. The best BLDRs are higher in both SL and AG, but still well below C-level averages. Very clearly, however, their within-person emphasis is on EN, which is markedly high in relative terms and also higher than typical C-level average.
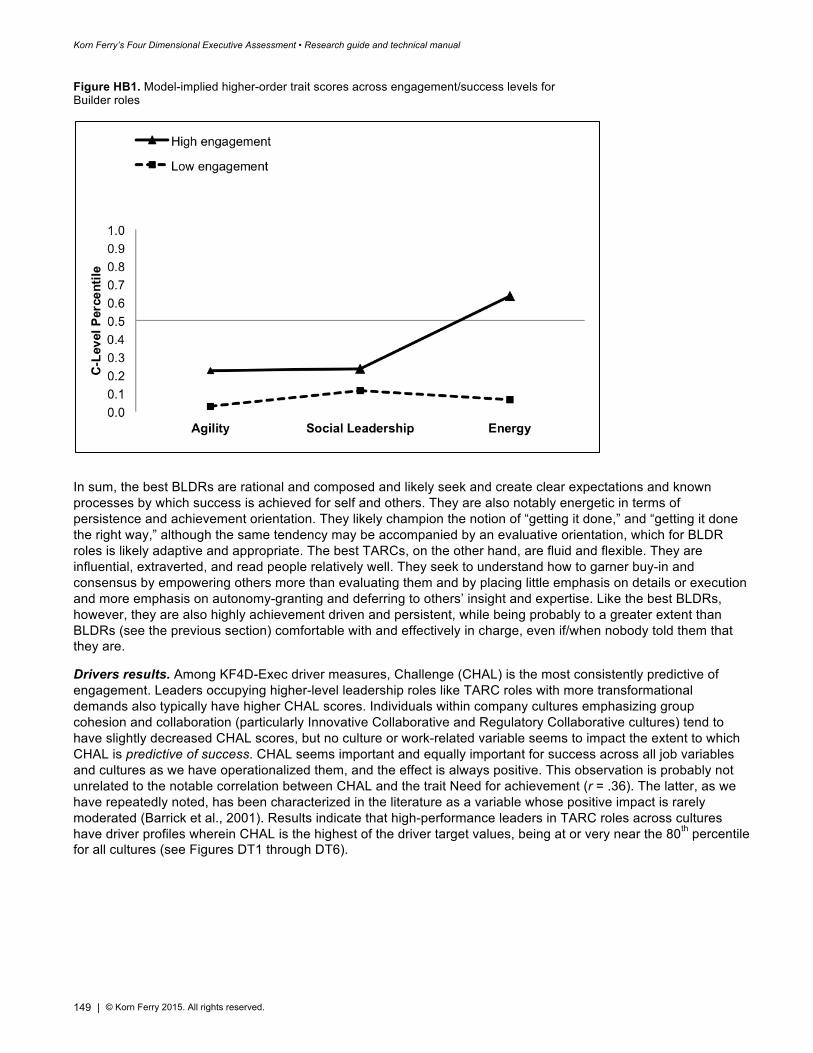
Korn Ferry’s Four Dimensional Executive Assessment • Research guide and technical manual
149 | © Korn Ferry 2015. All rights reserved.
Figure HB1. Model-implied higher-order trait scores across engagement/success levels for Builder roles
In sum, the best BLDRs are rational and composed and likely seek and create clear expectations and known processes by which success is achieved for self and others. They are also notably energetic in terms of persistence and achievement orientation. They likely champion the notion of “getting it done,” and “getting it done the right way,” although the same tendency may be accompanied by an evaluative orientation, which for BLDR roles is likely adaptive and appropriate. The best TARCs, on the other hand, are fluid and flexible. They are influential, extraverted, and read people relatively well. They seek to understand how to garner buy-in and consensus by empowering others more than evaluating them and by placing little emphasis on details or execution and more emphasis on autonomy-granting and deferring to others’ insight and expertise. Like the best BLDRs, however, they are also highly achievement driven and persistent, while being probably to a greater extent than BLDRs (see the previous section) comfortable with and effectively in charge, even if/when nobody told them that they are.
Drivers results. Among KF4D-Exec driver measures, Challenge (CHAL) is the most consistently predictive of engagement. Leaders occupying higher-level leadership roles like TARC roles with more transformational demands also typically have higher CHAL scores. Individuals within company cultures emphasizing group cohesion and collaboration (particularly Innovative Collaborative and Regulatory Collaborative cultures) tend to have slightly decreased CHAL scores, but no culture or work-related variable seems to impact the extent to which CHAL is predictive of success. CHAL seems important and equally important for success across all job variables and cultures as we have operationalized them, and the effect is always positive. This observation is probably not unrelated to the notable correlation between CHAL and the trait Need for achievement (r = .36). The latter, as we have repeatedly noted, has been characterized in the literature as a variable whose positive impact is rarely moderated (Barrick et al., 2001). Results indicate that high-performance leaders in TARC roles across cultures have driver profiles wherein CHAL is the highest of the driver target values, being at or very near the 80th percentile for all cultures (see Figures DT1 through DT6).
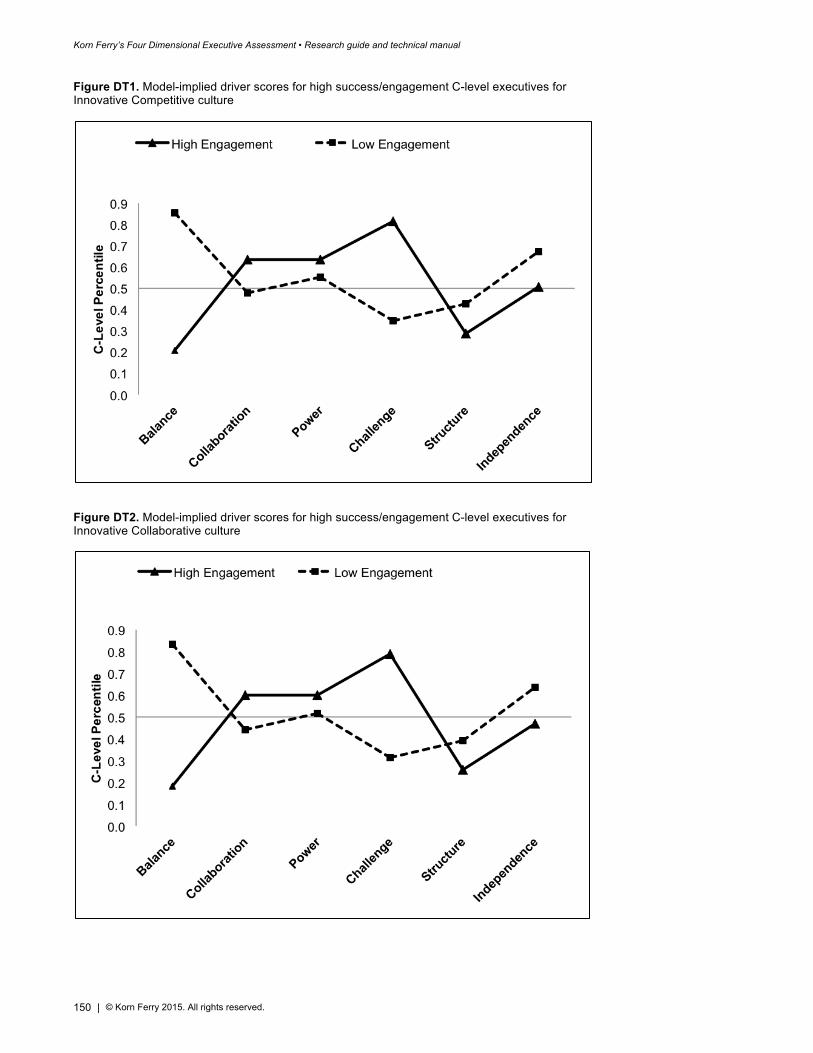
Korn Ferry’s Four Dimensional Executive Assessment • Research guide and technical manual
150 | © Korn Ferry 2015. All rights reserved.
Figure DT1. Model-implied driver scores for high success/engagement C-level executives for Innovative Competitive culture
Figure DT2. Model-implied driver scores for high success/engagement C-level executives for Innovative Collaborative culture
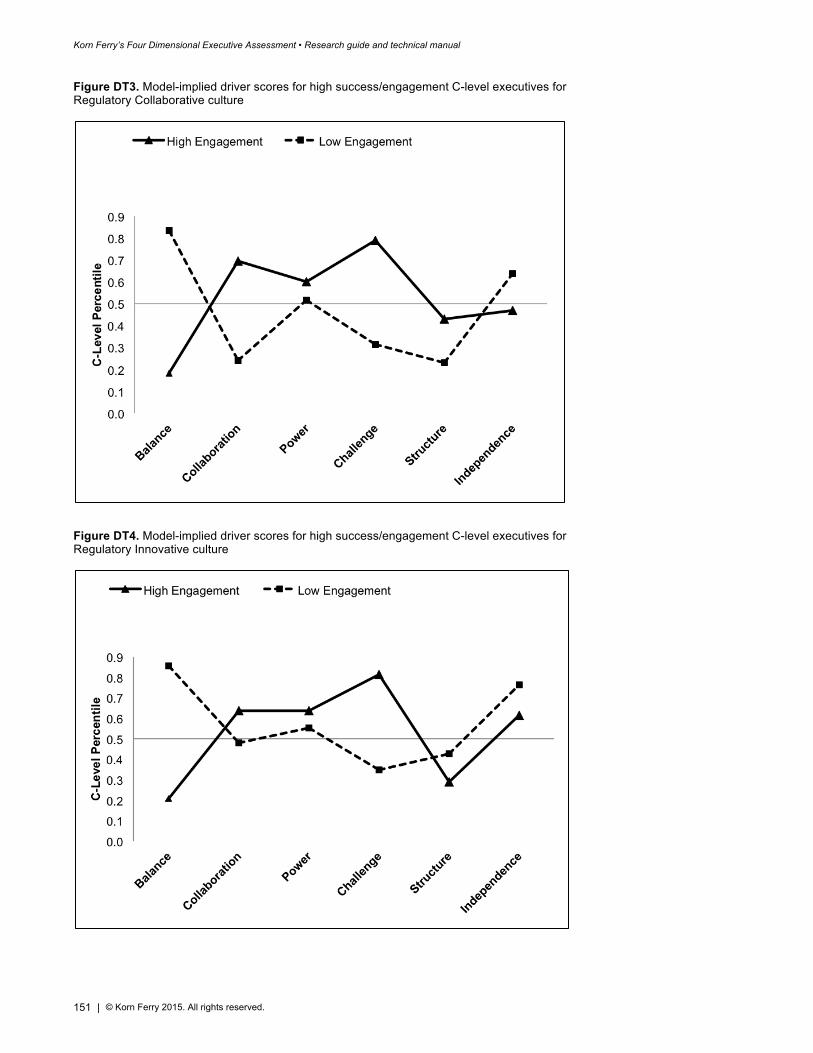
Korn Ferry’s Four Dimensional Executive Assessment • Research guide and technical manual
151 | © Korn Ferry 2015. All rights reserved.
Figure DT3. Model-implied driver scores for high success/engagement C-level executives for Regulatory Collaborative culture
Figure DT4. Model-implied driver scores for high success/engagement C-level executives for Regulatory Innovative culture
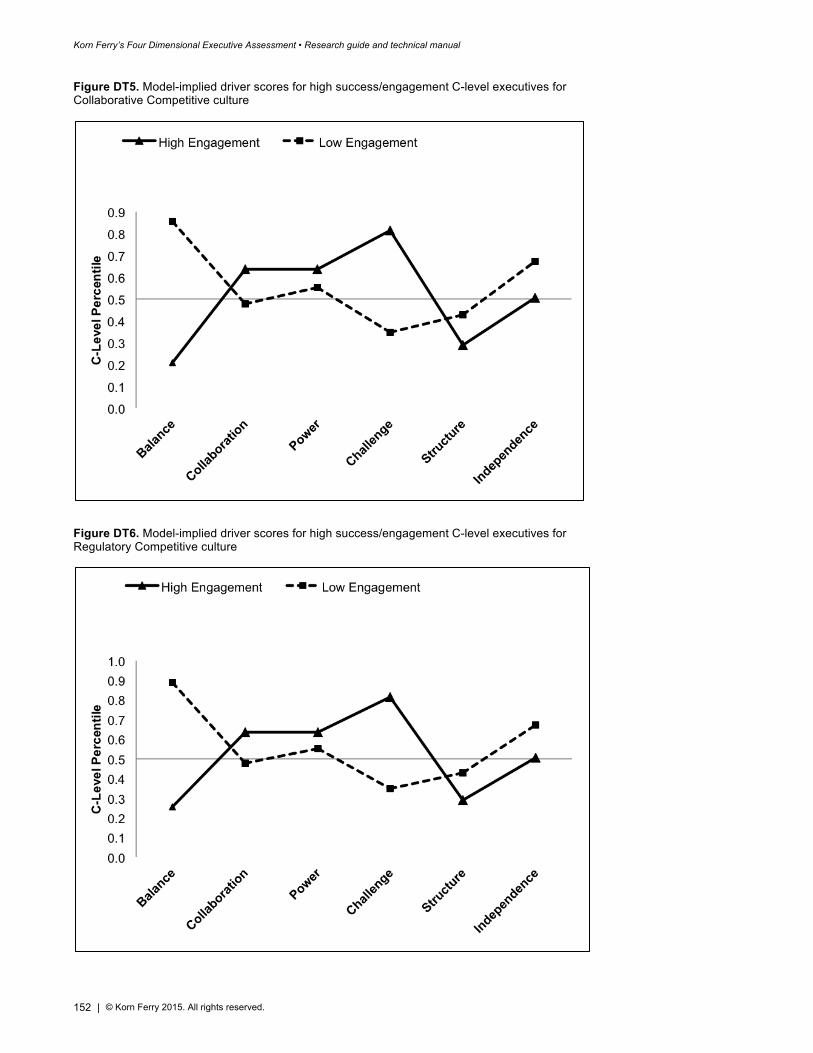
Korn Ferry’s Four Dimensional Executive Assessment • Research guide and technical manual
152 | © Korn Ferry 2015. All rights reserved.
Figure DT5. Model-implied driver scores for high success/engagement C-level executives for Collaborative Competitive culture
Figure DT6. Model-implied driver scores for high success/engagement C-level executives for Regulatory Competitive culture
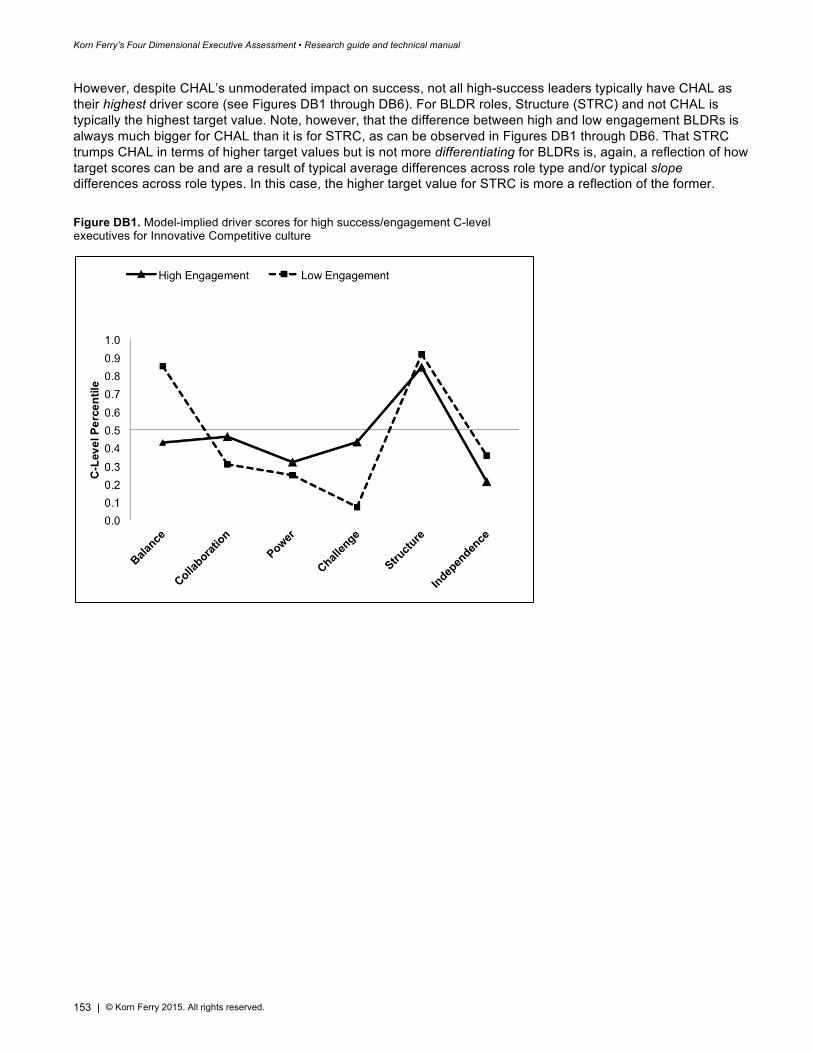
Korn Ferry’s Four Dimensional Executive Assessment • Research guide and technical manual
153 | © Korn Ferry 2015. All rights reserved.
However, despite CHAL’s unmoderated impact on success, not all high-success leaders typically have CHAL as their highest driver score (see Figures DB1 through DB6). For BLDR roles, Structure (STRC) and not CHAL is typically the highest target value. Note, however, that the difference between high and low engagement BLDRs is always much bigger for CHAL than it is for STRC, as can be observed in Figures DB1 through DB6. That STRC trumps CHAL in terms of higher target values but is not more differentiating for BLDRs is, again, a reflection of how target scores can be and are a result of typical average differences across role type and/or typical slope differences across role types. In this case, the higher target value for STRC is more a reflection of the former.
Figure DB1. Model-implied driver scores for high success/engagement C-level executives for Innovative Competitive culture
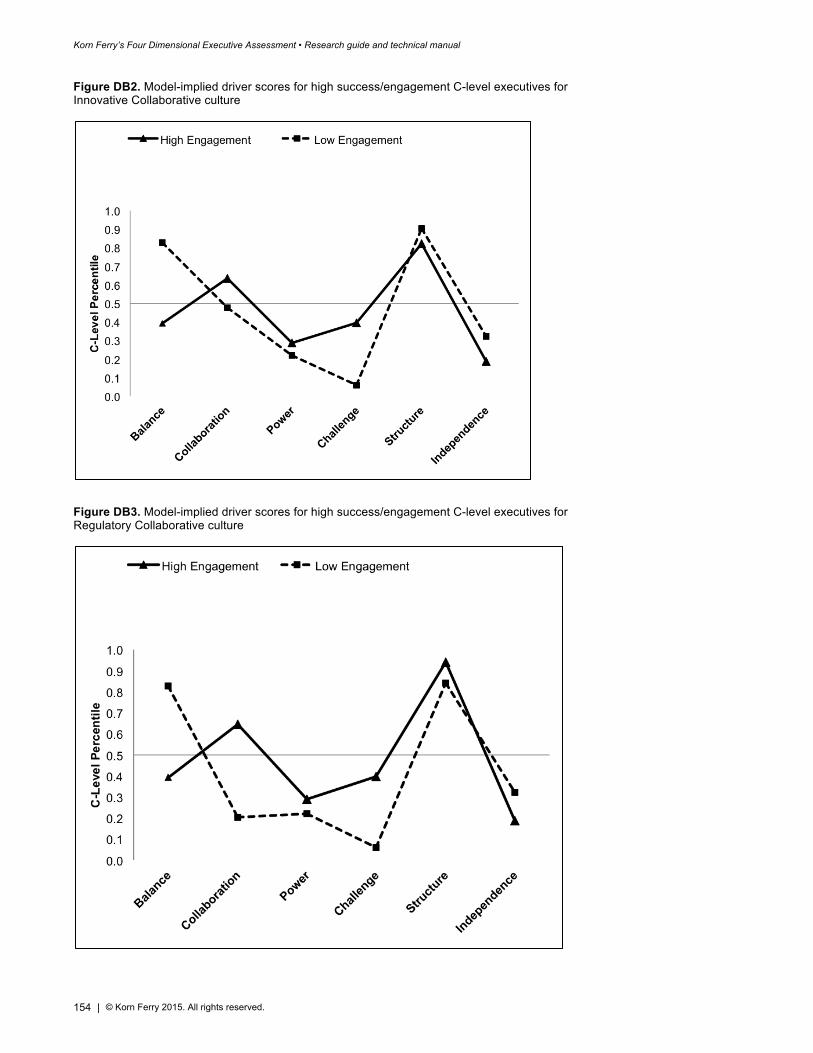
Korn Ferry’s Four Dimensional Executive Assessment • Research guide and technical manual
154 | © Korn Ferry 2015. All rights reserved.
Figure DB2. Model-implied driver scores for high success/engagement C-level executives for Innovative Collaborative culture
Figure DB3. Model-implied driver scores for high success/engagement C-level executives for Regulatory Collaborative culture
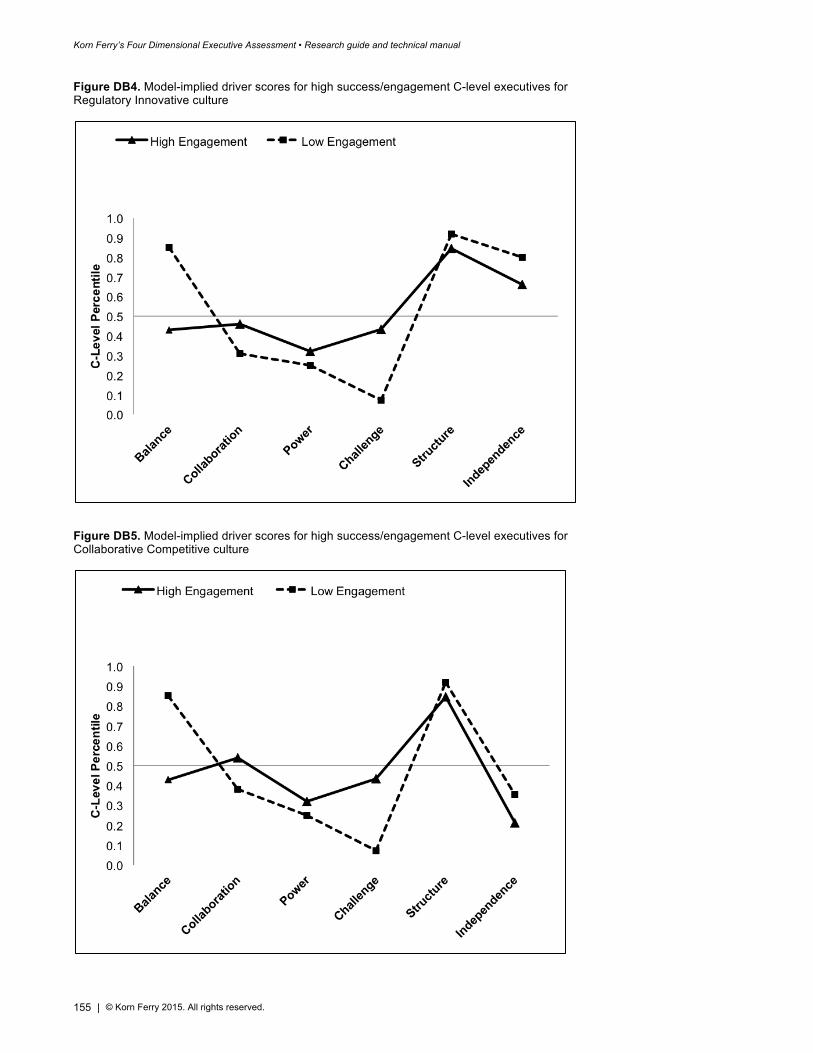
Korn Ferry’s Four Dimensional Executive Assessment • Research guide and technical manual
155 | © Korn Ferry 2015. All rights reserved.
Figure DB4. Model-implied driver scores for high success/engagement C-level executives for Regulatory Innovative culture
Figure DB5. Model-implied driver scores for high success/engagement C-level executives for Collaborative Competitive culture
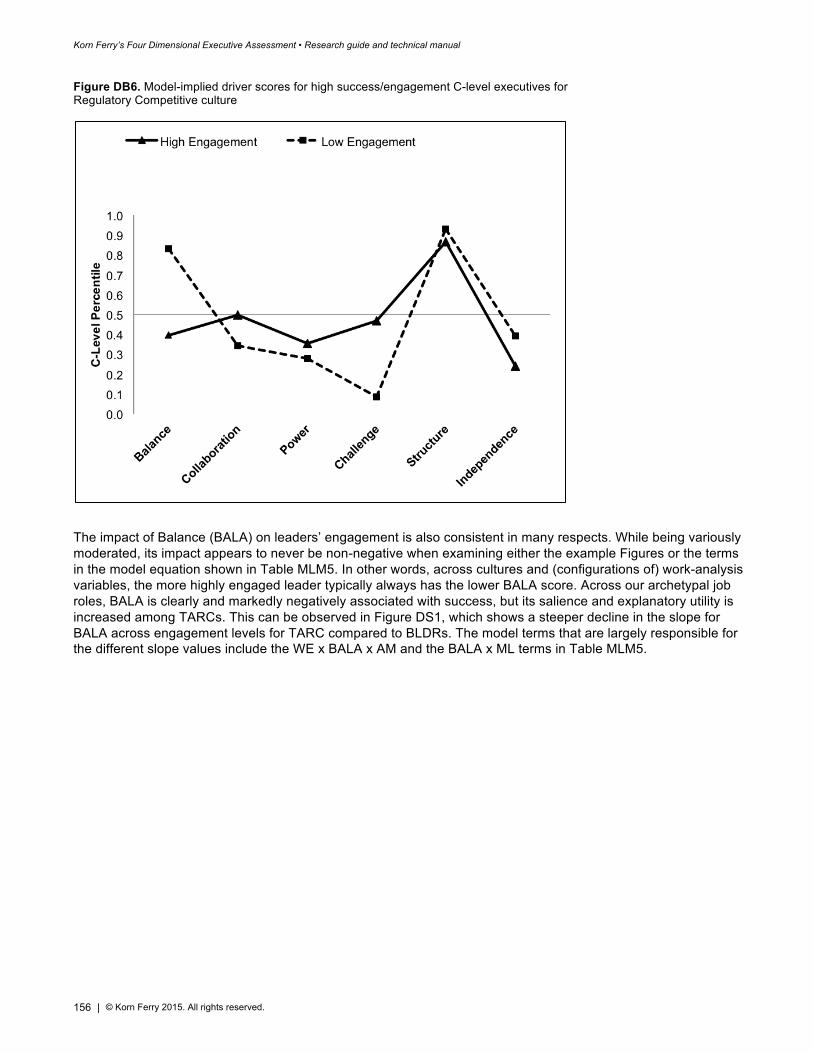
Korn Ferry’s Four Dimensional Executive Assessment • Research guide and technical manual
156 | © Korn Ferry 2015. All rights reserved.
Figure DB6. Model-implied driver scores for high success/engagement C-level executives for Regulatory Competitive culture
The impact of Balance (BALA) on leaders’ engagement is also consistent in many respects. While being variously moderated, its impact appears to never be non-negative when examining either the example Figures or the terms in the model equation shown in Table MLM5. In other words, across cultures and (configurations of) work-analysis variables, the more highly engaged leader typically always has the lower BALA score. Across our archetypal job roles, BALA is clearly and markedly negatively associated with success, but its salience and explanatory utility is increased among TARCs. This can be observed in Figure DS1, which shows a steeper decline in the slope for BALA across engagement levels for TARC compared to BLDRs. The model terms that are largely responsible for the different slope values include the WE x BALA x AM and the BALA x ML terms in Table MLM5.
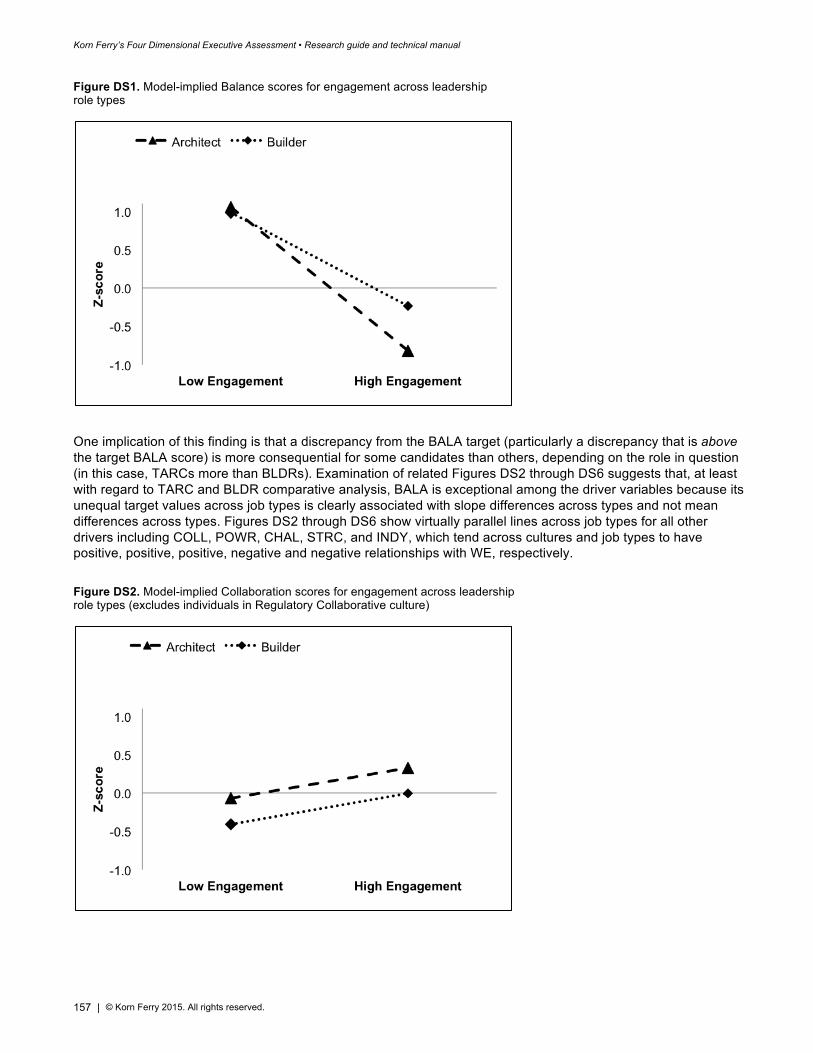
Korn Ferry’s Four Dimensional Executive Assessment • Research guide and technical manual
157 | © Korn Ferry 2015. All rights reserved.
Figure DS1. Model-implied Balance scores for engagement across leadership role types
One implication of this finding is that a discrepancy from the BALA target (particularly a discrepancy that is above the target BALA score) is more consequential for some candidates than others, depending on the role in question (in this case, TARCs more than BLDRs). Examination of related Figures DS2 through DS6 suggests that, at least with regard to TARC and BLDR comparative analysis, BALA is exceptional among the driver variables because its unequal target values across job types is clearly associated with slope differences across types and not mean differences across types. Figures DS2 through DS6 show virtually parallel lines across job types for all other drivers including COLL, POWR, CHAL, STRC, and INDY, which tend across cultures and job types to have positive, positive, positive, negative and negative relationships with WE, respectively.
Figure DS2. Model-implied Collaboration scores for engagement across leadership role types (excludes individuals in Regulatory Collaborative culture)
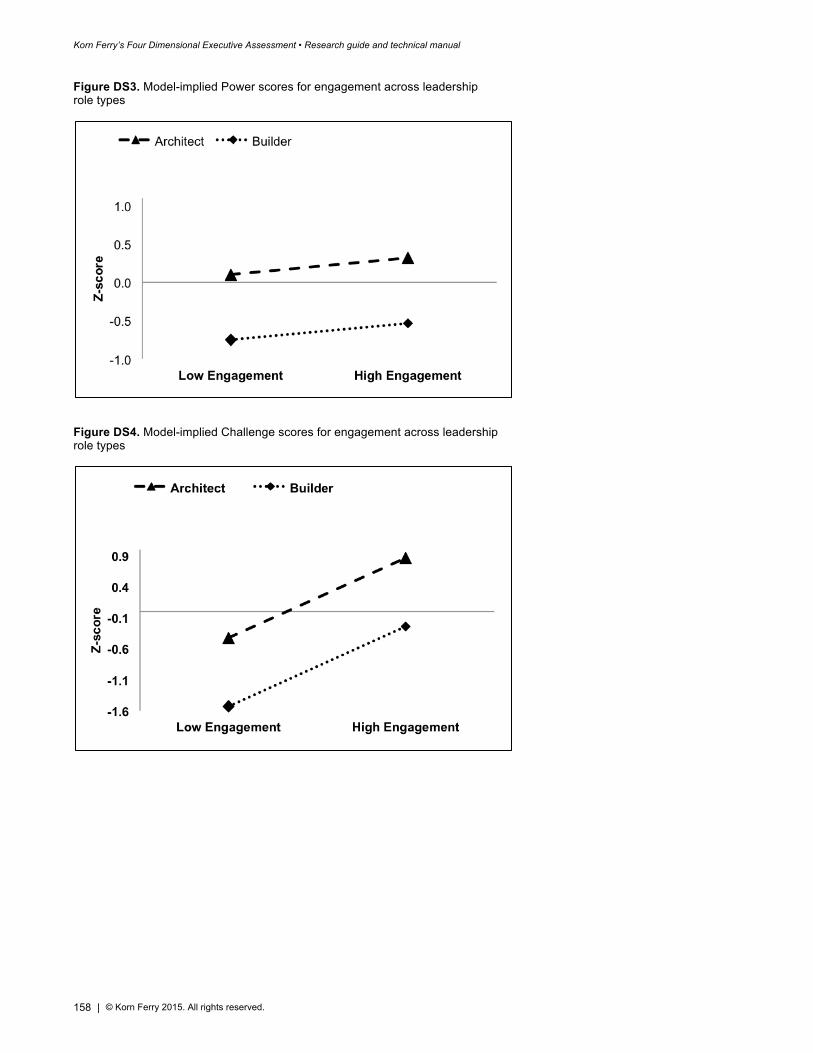
Korn Ferry’s Four Dimensional Executive Assessment • Research guide and technical manual
158 | © Korn Ferry 2015. All rights reserved.
Figure DS3. Model-implied Power scores for engagement across leadership role types
Figure DS4. Model-implied Challenge scores for engagement across leadership role types
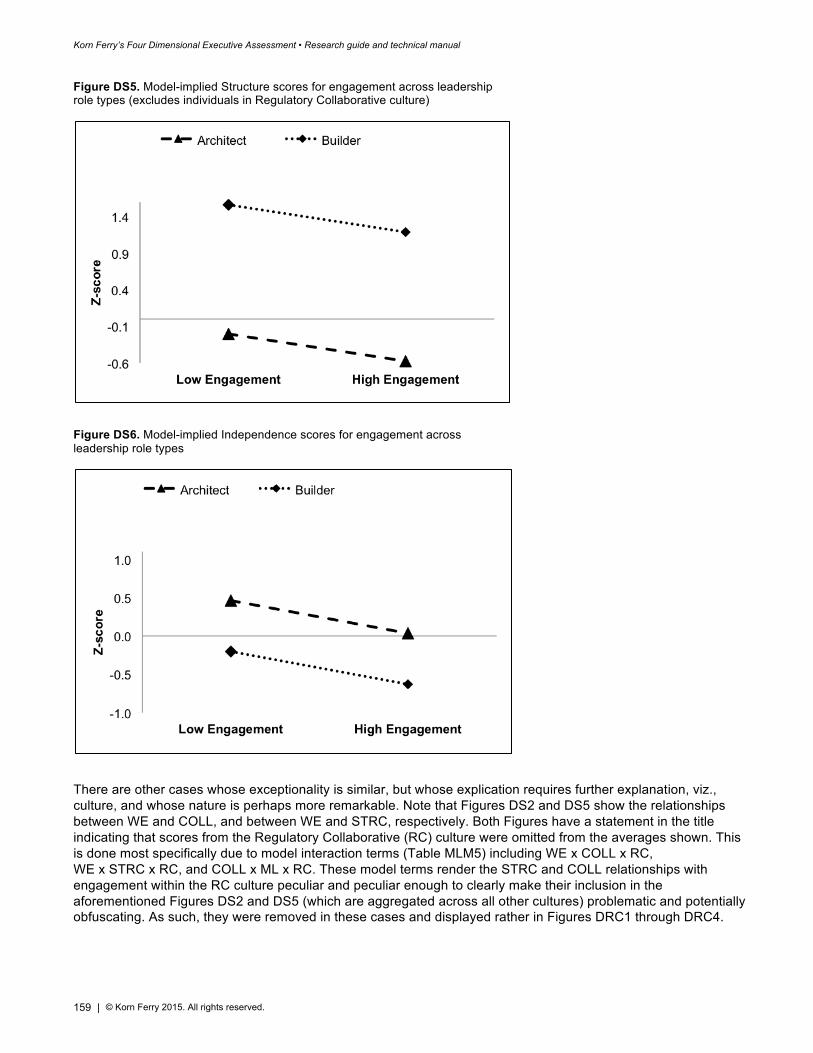
Korn Ferry’s Four Dimensional Executive Assessment • Research guide and technical manual
159 | © Korn Ferry 2015. All rights reserved.
Figure DS5. Model-implied Structure scores for engagement across leadership role types (excludes individuals in Regulatory Collaborative culture)
Figure DS6. Model-implied Independence scores for engagement across leadership role types
There are other cases whose exceptionality is similar, but whose explication requires further explanation, viz., culture, and whose nature is perhaps more remarkable. Note that Figures DS2 and DS5 show the relationships between WE and COLL, and between WE and STRC, respectively. Both Figures have a statement in the title indicating that scores from the Regulatory Collaborative (RC) culture were omitted from the averages shown. This is done most specifically due to model interaction terms (Table MLM5) including WE x COLL x RC, WE x STRC x RC, and COLL x ML x RC. These model terms render the STRC and COLL relationships with engagement within the RC culture peculiar and peculiar enough to clearly make their inclusion in the aforementioned Figures DS2 and DS5 (which are aggregated across all other cultures) problematic and potentially obfuscating. As such, they were removed in these cases and displayed rather in Figures DRC1 through DRC4.
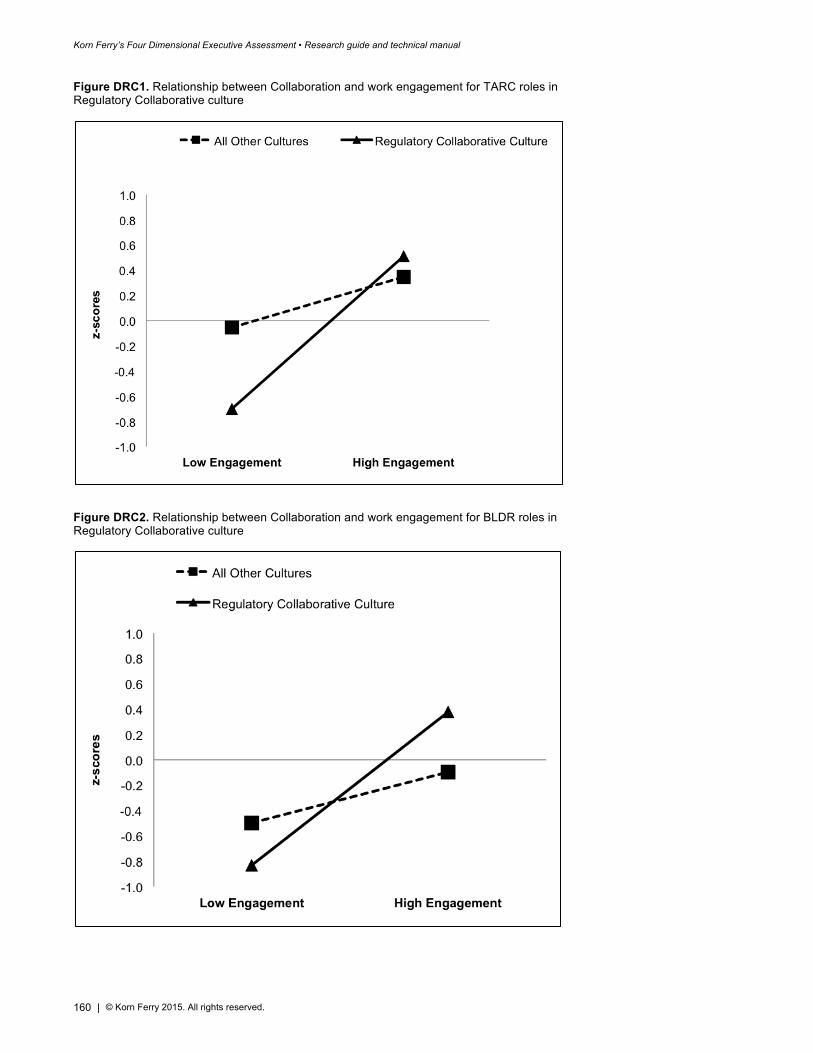
Korn Ferry’s Four Dimensional Executive Assessment • Research guide and technical manual
160 | © Korn Ferry 2015. All rights reserved.
Figure DRC1. Relationship between Collaboration and work engagement for TARC roles in Regulatory Collaborative culture
Figure DRC2. Relationship between Collaboration and work engagement for BLDR roles in Regulatory Collaborative culture
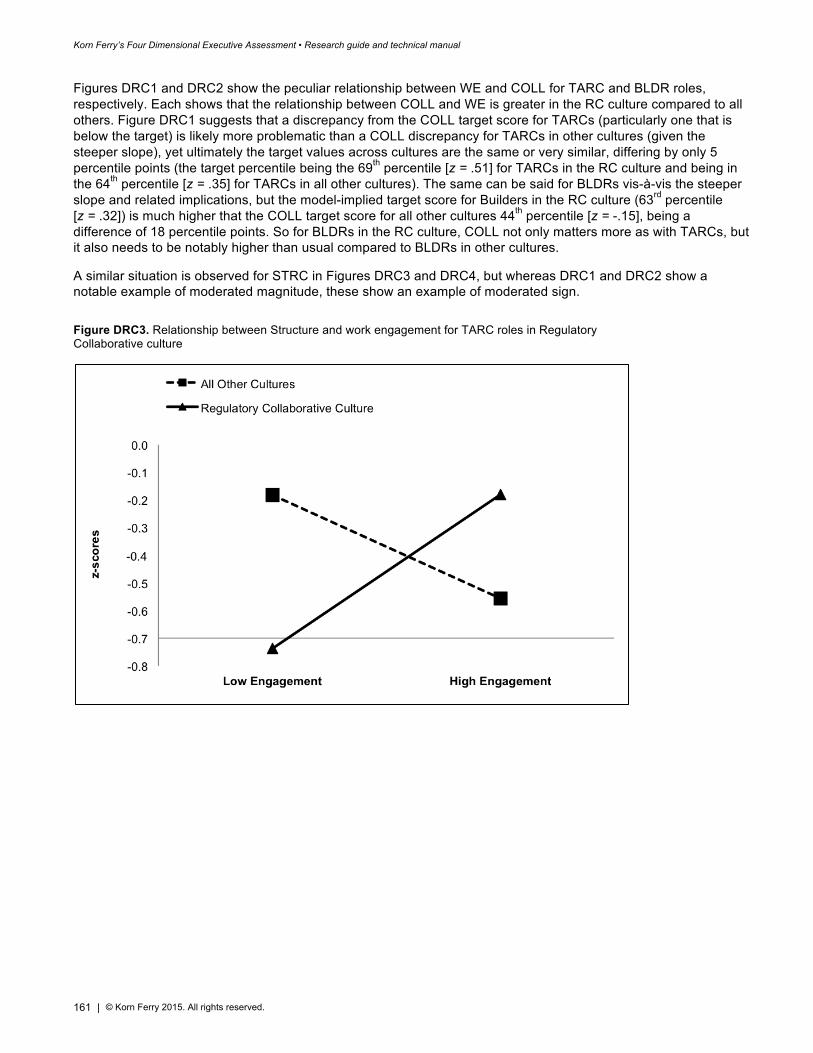
Korn Ferry’s Four Dimensional Executive Assessment • Research guide and technical manual
161 | © Korn Ferry 2015. All rights reserved.
Figures DRC1 and DRC2 show the peculiar relationship between WE and COLL for TARC and BLDR roles, respectively. Each shows that the relationship between COLL and WE is greater in the RC culture compared to all others. Figure DRC1 suggests that a discrepancy from the COLL target score for TARCs (particularly one that is below the target) is likely more problematic than a COLL discrepancy for TARCs in other cultures (given the steeper slope), yet ultimately the target values across cultures are the same or very similar, differing by only 5 percentile points (the target percentile being the 69th percentile [z = .51] for TARCs in the RC culture and being in the 64th percentile [z = .35] for TARCs in all other cultures). The same can be said for BLDRs vis-à-vis the steeper slope and related implications, but the model-implied target score for Builders in the RC culture (63rd percentile [z = .32]) is much higher that the COLL target score for all other cultures 44th percentile [z = -.15], being a difference of 18 percentile points. So for BLDRs in the RC culture, COLL not only matters more as with TARCs, but it also needs to be notably higher than usual compared to BLDRs in other cultures.
A similar situation is observed for STRC in Figures DRC3 and DRC4, but whereas DRC1 and DRC2 show a notable example of moderated magnitude, these show an example of moderated sign.
Figure DRC3. Relationship between Structure and work engagement for TARC roles in Regulatory Collaborative culture
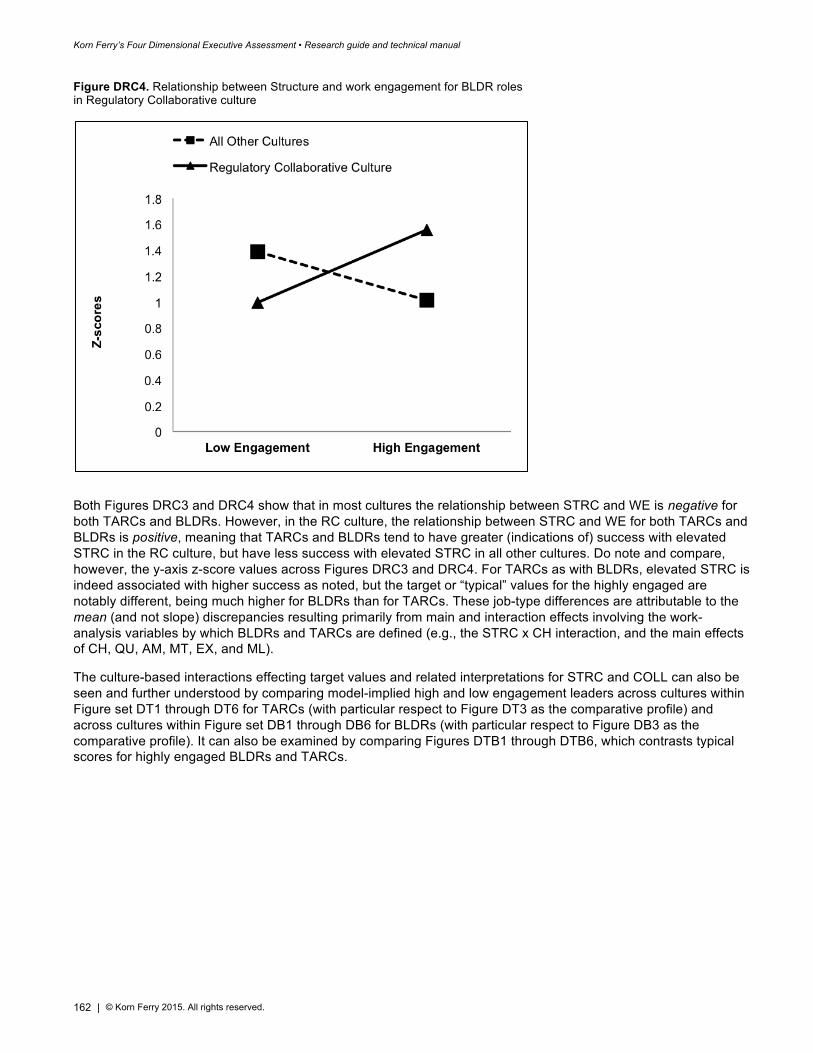
Korn Ferry’s Four Dimensional Executive Assessment • Research guide and technical manual
162 | © Korn Ferry 2015. All rights reserved.
Figure DRC4. Relationship between Structure and work engagement for BLDR roles in Regulatory Collaborative culture
Both Figures DRC3 and DRC4 show that in most cultures the relationship between STRC and WE is negative for both TARCs and BLDRs. However, in the RC culture, the relationship between STRC and WE for both TARCs and BLDRs is positive, meaning that TARCs and BLDRs tend to have greater (indications of) success with elevated STRC in the RC culture, but have less success with elevated STRC in all other cultures. Do note and compare, however, the y-axis z-score values across Figures DRC3 and DRC4. For TARCs as with BLDRs, elevated STRC is indeed associated with higher success as noted, but the target or “typical” values for the highly engaged are notably different, being much higher for BLDRs than for TARCs. These job-type differences are attributable to the mean (and not slope) discrepancies resulting primarily from main and interaction effects involving the work-analysis variables by which BLDRs and TARCs are defined (e.g., the STRC x CH interaction, and the main effects of CH, QU, AM, MT, EX, and ML).
The culture-based interactions effecting target values and related interpretations for STRC and COLL can also be seen and further understood by comparing model-implied high and low engagement leaders across cultures within Figure set DT1 through DT6 for TARCs (with particular respect to Figure DT3 as the comparative profile) and across cultures within Figure set DB1 through DB6 for BLDRs (with particular respect to Figure DB3 as the comparative profile). It can also be examined by comparing Figures DTB1 through DTB6, which contrasts typical scores for highly engaged BLDRs and TARCs.
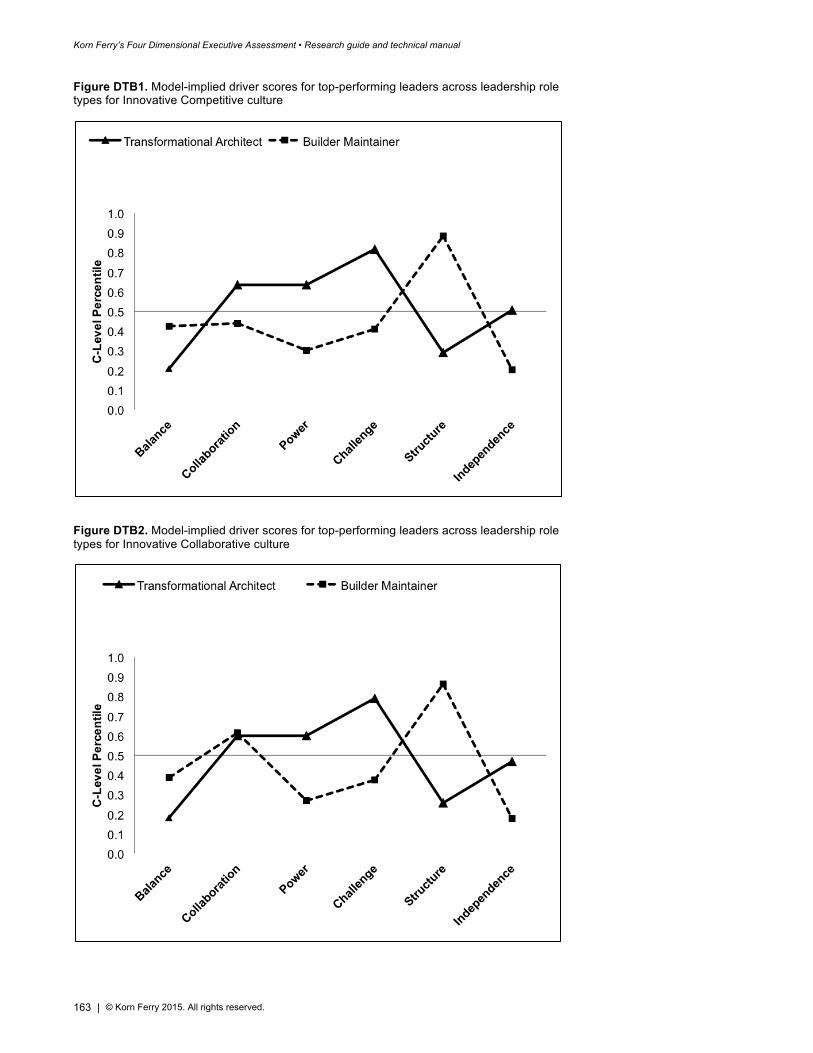
Korn Ferry’s Four Dimensional Executive Assessment • Research guide and technical manual
163 | © Korn Ferry 2015. All rights reserved.
Figure DTB1. Model-implied driver scores for top-performing leaders across leadership role types for Innovative Competitive culture
Figure DTB2. Model-implied driver scores for top-performing leaders across leadership role types for Innovative Collaborative culture
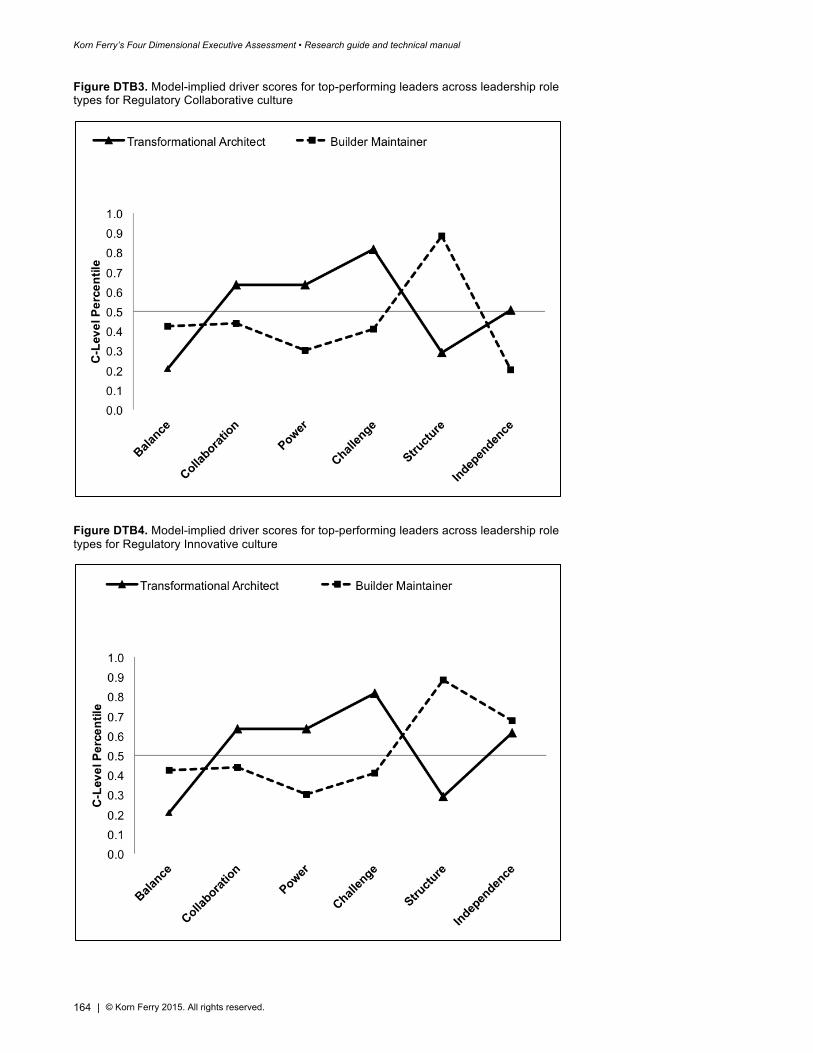
Korn Ferry’s Four Dimensional Executive Assessment • Research guide and technical manual
164 | © Korn Ferry 2015. All rights reserved.
Figure DTB3. Model-implied driver scores for top-performing leaders across leadership role types for Regulatory Collaborative culture
Figure DTB4. Model-implied driver scores for top-performing leaders across leadership role types for Regulatory Innovative culture
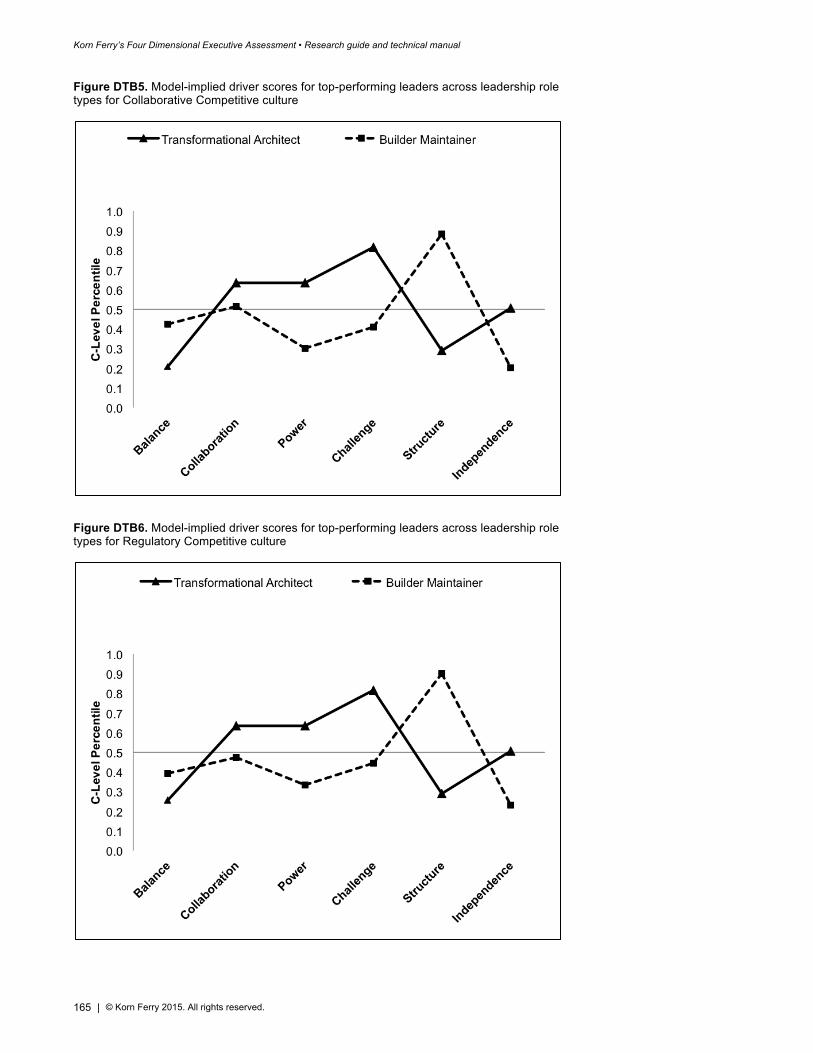
Korn Ferry’s Four Dimensional Executive Assessment • Research guide and technical manual
165 | © Korn Ferry 2015. All rights reserved.
Figure DTB5. Model-implied driver scores for top-performing leaders across leadership role types for Collaborative Competitive culture
Figure DTB6. Model-implied driver scores for top-performing leaders across leadership role types for Regulatory Competitive culture
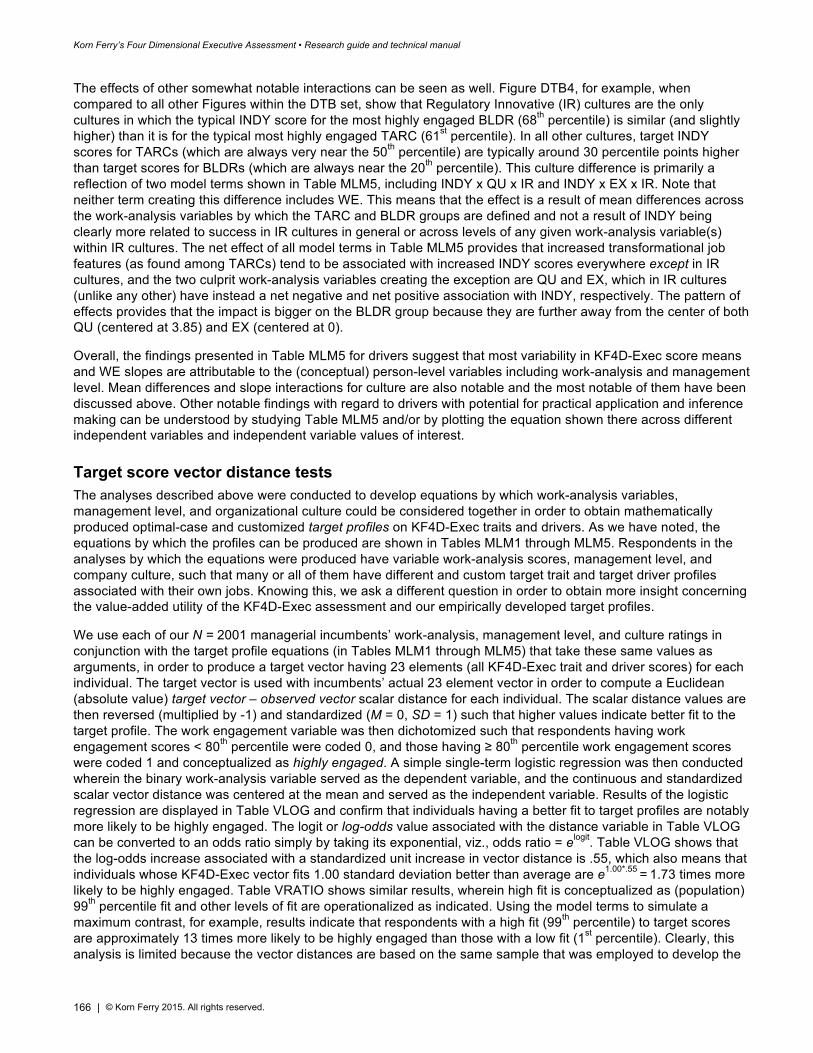
Korn Ferry’s Four Dimensional Executive Assessment • Research guide and technical manual
166 | © Korn Ferry 2015. All rights reserved.
The effects of other somewhat notable interactions can be seen as well. Figure DTB4, for example, when compared to all other Figures within the DTB set, show that Regulatory Innovative (IR) cultures are the only cultures in which the typical INDY score for the most highly engaged BLDR (68th percentile) is similar (and slightly higher) than it is for the typical most highly engaged TARC (61st percentile). In all other cultures, target INDY scores for TARCs (which are always very near the 50th percentile) are typically around 30 percentile points higher than target scores for BLDRs (which are always near the 20th percentile). This culture difference is primarily a reflection of two model terms shown in Table MLM5, including INDY x QU x IR and INDY x EX x IR. Note that neither term creating this difference includes WE. This means that the effect is a result of mean differences across the work-analysis variables by which the TARC and BLDR groups are defined and not a result of INDY being clearly more related to success in IR cultures in general or across levels of any given work-analysis variable(s) within IR cultures. The net effect of all model terms in Table MLM5 provides that increased transformational job features (as found among TARCs) tend to be associated with increased INDY scores everywhere except in IR cultures, and the two culprit work-analysis variables creating the exception are QU and EX, which in IR cultures (unlike any other) have instead a net negative and net positive association with INDY, respectively. The pattern of effects provides that the impact is bigger on the BLDR group because they are further away from the center of both QU (centered at 3.85) and EX (centered at 0).
Overall, the findings presented in Table MLM5 for drivers suggest that most variability in KF4D-Exec score means and WE slopes are attributable to the (conceptual) person-level variables including work-analysis and management level. Mean differences and slope interactions for culture are also notable and the most notable of them have been discussed above. Other notable findings with regard to drivers with potential for practical application and inference making can be understood by studying Table MLM5 and/or by plotting the equation shown there across different independent variables and independent variable values of interest.
Target score vector distance tests The analyses described above were conducted to develop equations by which work-analysis variables, management level, and organizational culture could be considered together in order to obtain mathematically produced optimal-case and customized target profiles on KF4D-Exec traits and drivers. As we have noted, the equations by which the profiles can be produced are shown in Tables MLM1 through MLM5. Respondents in the analyses by which the equations were produced have variable work-analysis scores, management level, and company culture, such that many or all of them have different and custom target trait and target driver profiles associated with their own jobs. Knowing this, we ask a different question in order to obtain more insight concerning the value-added utility of the KF4D-Exec assessment and our empirically developed target profiles.
We use each of our N = 2001 managerial incumbents’ work-analysis, management level, and culture ratings in conjunction with the target profile equations (in Tables MLM1 through MLM5) that take these same values as arguments, in order to produce a target vector having 23 elements (all KF4D-Exec trait and driver scores) for each individual. The target vector is used with incumbents’ actual 23 element vector in order to compute a Euclidean (absolute value) target vector – observed vector scalar distance for each individual. The scalar distance values are then reversed (multiplied by -1) and standardized (M = 0, SD = 1) such that higher values indicate better fit to the target profile. The work engagement variable was then dichotomized such that respondents having work engagement scores < 80th percentile were coded 0, and those having ≥ 80th percentile work engagement scores were coded 1 and conceptualized as highly engaged. A simple single-term logistic regression was then conducted wherein the binary work-analysis variable served as the dependent variable, and the continuous and standardized scalar vector distance was centered at the mean and served as the independent variable. Results of the logistic regression are displayed in Table VLOG and confirm that individuals having a better fit to target profiles are notably more likely to be highly engaged. The logit or log-odds value associated with the distance variable in Table VLOG can be converted to an odds ratio simply by taking its exponential, viz., odds ratio = elogit. Table VLOG shows that the log-odds increase associated with a standardized unit increase in vector distance is .55, which also means that individuals whose KF4D-Exec vector fits 1.00 standard deviation better than average are e1.00*.55 = 1.73 times more likely to be highly engaged. Table VRATIO shows similar results, wherein high fit is conceptualized as (population) 99th percentile fit and other levels of fit are operationalized as indicated. Using the model terms to simulate a maximum contrast, for example, results indicate that respondents with a high fit (99th percentile) to target scores are approximately 13 times more likely to be highly engaged than those with a low fit (1st percentile). Clearly, this analysis is limited because the vector distances are based on the same sample that was employed to develop the
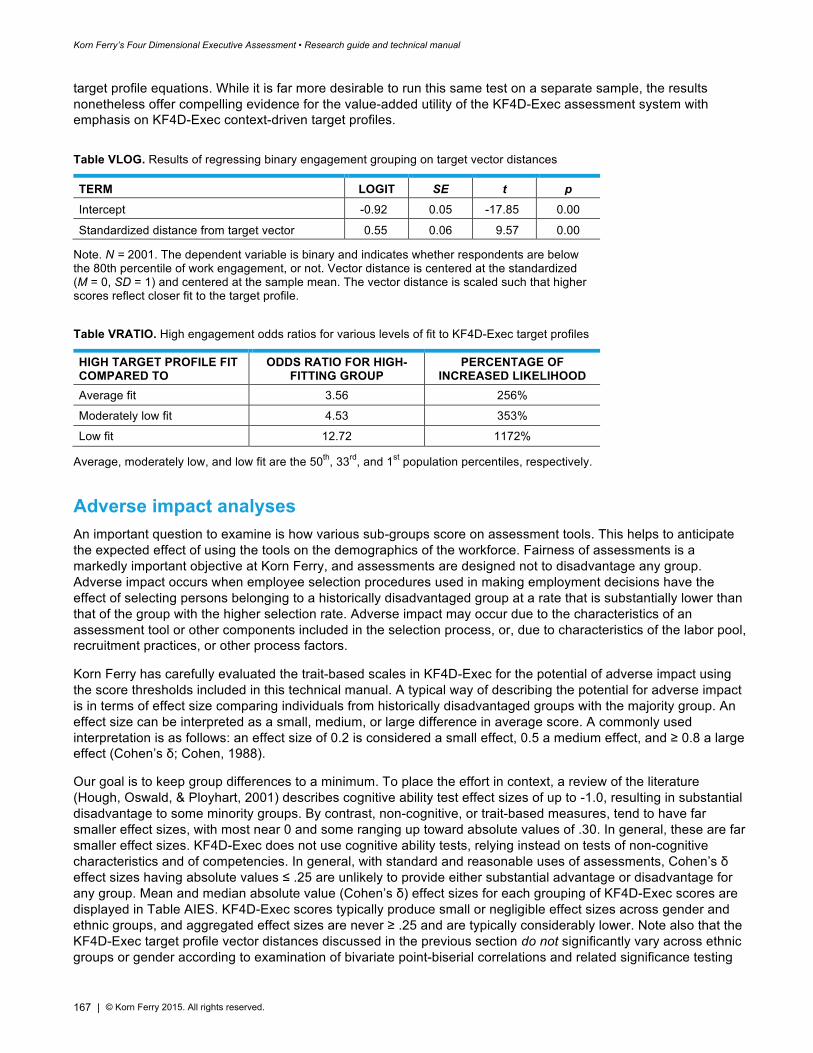
Korn Ferry’s Four Dimensional Executive Assessment • Research guide and technical manual
167 | © Korn Ferry 2015. All rights reserved.
target profile equations. While it is far more desirable to run this same test on a separate sample, the results nonetheless offer compelling evidence for the value-added utility of the KF4D-Exec assessment system with emphasis on KF4D-Exec context-driven target profiles.
Table VLOG. Results of regressing binary engagement grouping on target vector distances
TERM LOGIT SE t p Intercept -0.92 0.05 -17.85 0.00
Standardized distance from target vector 0.55 0.06 9.57 0.00
Note. N = 2001. The dependent variable is binary and indicates whether respondents are below the 80th percentile of work engagement, or not. Vector distance is centered at the standardized (M = 0, SD = 1) and centered at the sample mean. The vector distance is scaled such that higher scores reflect closer fit to the target profile.
Table VRATIO. High engagement odds ratios for various levels of fit to KF4D-Exec target profiles
HIGH TARGET PROFILE FIT COMPARED TO
ODDS RATIO FOR HIGH-FITTING GROUP
PERCENTAGE OF INCREASED LIKELIHOOD
Average fit 3.56 256%
Moderately low fit 4.53 353%
Low fit 12.72 1172%
Average, moderately low, and low fit are the 50th, 33rd, and 1st population percentiles, respectively.
Adverse impact analyses An important question to examine is how various sub-groups score on assessment tools. This helps to anticipate the expected effect of using the tools on the demographics of the workforce. Fairness of assessments is a markedly important objective at Korn Ferry, and assessments are designed not to disadvantage any group. Adverse impact occurs when employee selection procedures used in making employment decisions have the effect of selecting persons belonging to a historically disadvantaged group at a rate that is substantially lower than that of the group with the higher selection rate. Adverse impact may occur due to the characteristics of an assessment tool or other components included in the selection process, or, due to characteristics of the labor pool, recruitment practices, or other process factors.
Korn Ferry has carefully evaluated the trait-based scales in KF4D-Exec for the potential of adverse impact using the score thresholds included in this technical manual. A typical way of describing the potential for adverse impact is in terms of effect size comparing individuals from historically disadvantaged groups with the majority group. An effect size can be interpreted as a small, medium, or large difference in average score. A commonly used interpretation is as follows: an effect size of 0.2 is considered a small effect, 0.5 a medium effect, and ≥ 0.8 a large effect (Cohen’s δ; Cohen, 1988).
Our goal is to keep group differences to a minimum. To place the effort in context, a review of the literature (Hough, Oswald, & Ployhart, 2001) describes cognitive ability test effect sizes of up to -1.0, resulting in substantial disadvantage to some minority groups. By contrast, non-cognitive, or trait-based measures, tend to have far smaller effect sizes, with most near 0 and some ranging up toward absolute values of .30. In general, these are far smaller effect sizes. KF4D-Exec does not use cognitive ability tests, relying instead on tests of non-cognitive characteristics and of competencies. In general, with standard and reasonable uses of assessments, Cohen’s δ effect sizes having absolute values ≤ .25 are unlikely to provide either substantial advantage or disadvantage for any group. Mean and median absolute value (Cohen’s δ) effect sizes for each grouping of KF4D-Exec scores are displayed in Table AIES. KF4D-Exec scores typically produce small or negligible effect sizes across gender and ethnic groups, and aggregated effect sizes are never ≥ .25 and are typically considerably lower. Note also that the KF4D-Exec target profile vector distances discussed in the previous section do not significantly vary across ethnic groups or gender according to examination of bivariate point-biserial correlations and related significance testing
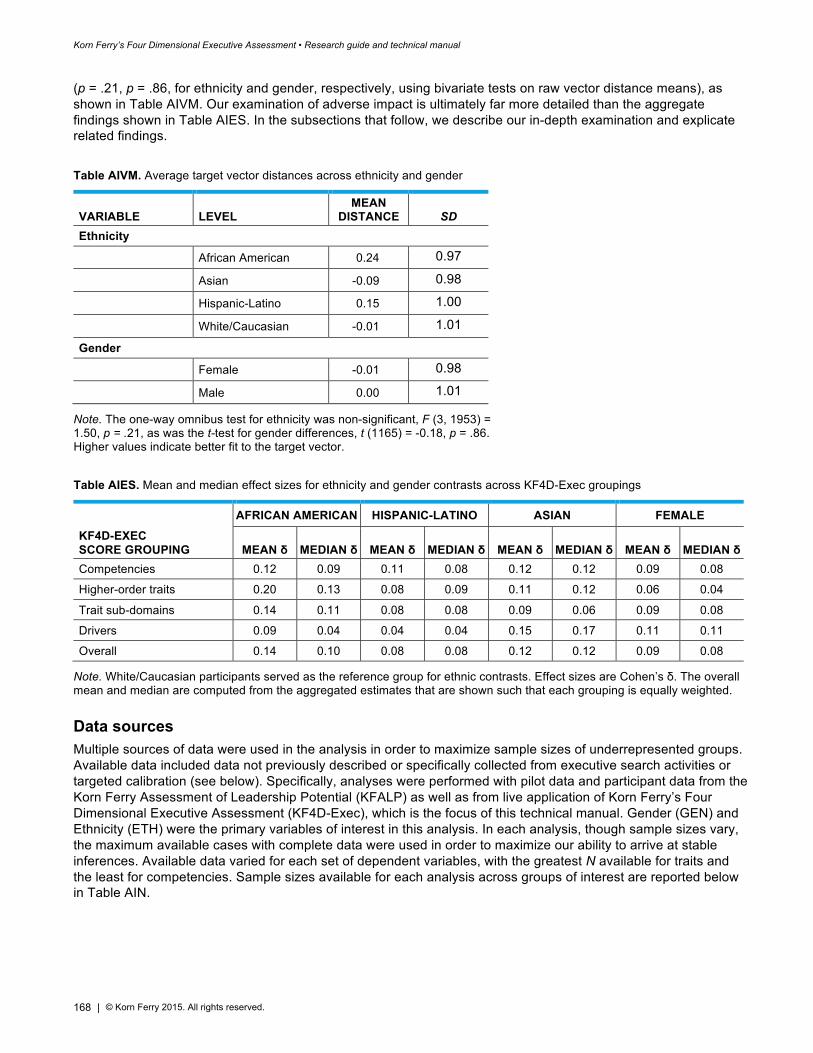
Korn Ferry’s Four Dimensional Executive Assessment • Research guide and technical manual
168 | © Korn Ferry 2015. All rights reserved.
(p = .21, p = .86, for ethnicity and gender, respectively, using bivariate tests on raw vector distance means), as shown in Table AIVM. Our examination of adverse impact is ultimately far more detailed than the aggregate findings shown in Table AIES. In the subsections that follow, we describe our in-depth examination and explicate related findings.
Table AIVM. Average target vector distances across ethnicity and gender
VARIABLE LEVEL MEAN
DISTANCE SD Ethnicity
African American 0.24 0.97 Asian -0.09 0.98 Hispanic-Latino 0.15 1.00 White/Caucasian -0.01 1.01 Gender
Female -0.01 0.98 Male 0.00 1.01
Note. The one-way omnibus test for ethnicity was non-significant, F (3, 1953) = 1.50, p = .21, as was the t-test for gender differences, t (1165) = -0.18, p = .86. Higher values indicate better fit to the target vector.
Table AIES. Mean and median effect sizes for ethnicity and gender contrasts across KF4D-Exec groupings
AFRICAN AMERICAN HISPANIC-LATINO ASIAN FEMALE KF4D-EXEC SCORE GROUPING MEAN δ MEDIAN δ MEAN δ MEDIAN δ MEAN δ MEDIAN δ MEAN δ MEDIAN δ Competencies 0.12 0.09 0.11 0.08 0.12 0.12 0.09 0.08
Higher-order traits 0.20 0.13 0.08 0.09 0.11 0.12 0.06 0.04
Trait sub-domains 0.14 0.11 0.08 0.08 0.09 0.06 0.09 0.08
Drivers 0.09 0.04 0.04 0.04 0.15 0.17 0.11 0.11
Overall 0.14 0.10 0.08 0.08 0.12 0.12 0.09 0.08
Note. White/Caucasian participants served as the reference group for ethnic contrasts. Effect sizes are Cohen’s δ. The overall mean and median are computed from the aggregated estimates that are shown such that each grouping is equally weighted.
Data sources Multiple sources of data were used in the analysis in order to maximize sample sizes of underrepresented groups. Available data included data not previously described or specifically collected from executive search activities or targeted calibration (see below). Specifically, analyses were performed with pilot data and participant data from the Korn Ferry Assessment of Leadership Potential (KFALP) as well as from live application of Korn Ferry’s Four Dimensional Executive Assessment (KF4D-Exec), which is the focus of this technical manual. Gender (GEN) and Ethnicity (ETH) were the primary variables of interest in this analysis. In each analysis, though sample sizes vary, the maximum available cases with complete data were used in order to maximize our ability to arrive at stable inferences. Available data varied for each set of dependent variables, with the greatest N available for traits and the least for competencies. Sample sizes available for each analysis across groups of interest are reported below in Table AIN.
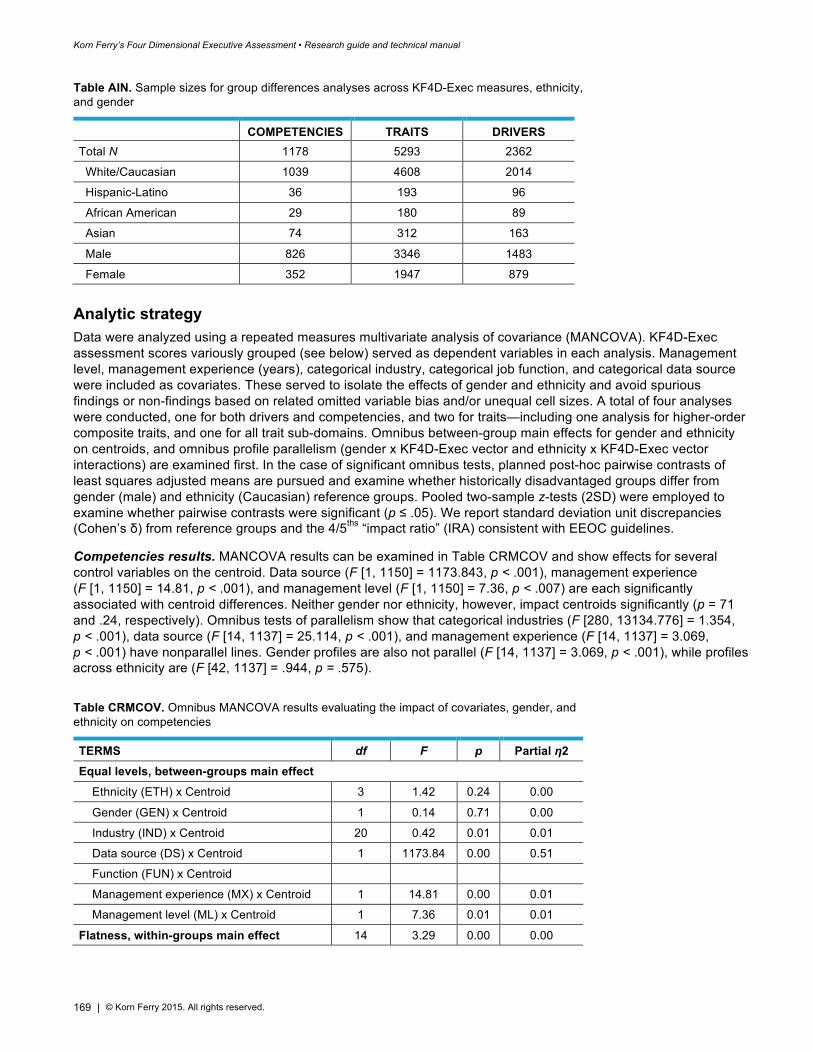
Korn Ferry’s Four Dimensional Executive Assessment • Research guide and technical manual
169 | © Korn Ferry 2015. All rights reserved.
Table AIN. Sample sizes for group differences analyses across KF4D-Exec measures, ethnicity, and gender
COMPETENCIES TRAITS DRIVERS Total N 1178 5293 2362
White/Caucasian 1039 4608 2014
Hispanic-Latino 36 193 96
African American 29 180 89
Asian 74 312 163
Male 826 3346 1483
Female 352 1947 879
Analytic strategy Data were analyzed using a repeated measures multivariate analysis of covariance (MANCOVA). KF4D-Exec assessment scores variously grouped (see below) served as dependent variables in each analysis. Management level, management experience (years), categorical industry, categorical job function, and categorical data source were included as covariates. These served to isolate the effects of gender and ethnicity and avoid spurious findings or non-findings based on related omitted variable bias and/or unequal cell sizes. A total of four analyses were conducted, one for both drivers and competencies, and two for traits—including one analysis for higher-order composite traits, and one for all trait sub-domains. Omnibus between-group main effects for gender and ethnicity on centroids, and omnibus profile parallelism (gender x KF4D-Exec vector and ethnicity x KF4D-Exec vector interactions) are examined first. In the case of significant omnibus tests, planned post-hoc pairwise contrasts of least squares adjusted means are pursued and examine whether historically disadvantaged groups differ from gender (male) and ethnicity (Caucasian) reference groups. Pooled two-sample z-tests (2SD) were employed to examine whether pairwise contrasts were significant (p ≤ .05). We report standard deviation unit discrepancies (Cohen’s δ) from reference groups and the 4/5ths “impact ratio” (IRA) consistent with EEOC guidelines.
Competencies results. MANCOVA results can be examined in Table CRMCOV and show effects for several control variables on the centroid. Data source (F [1, 1150] = 1173.843, p < .001), management experience (F [1, 1150] = 14.81, p < .001), and management level (F [1, 1150] = 7.36, p < .007) are each significantly associated with centroid differences. Neither gender nor ethnicity, however, impact centroids significantly (p = 71 and .24, respectively). Omnibus tests of parallelism show that categorical industries (F [280, 13134.776] = 1.354, p < .001), data source (F [14, 1137] = 25.114, p < .001), and management experience (F [14, 1137] = 3.069, p < .001) have nonparallel lines. Gender profiles are also not parallel (F [14, 1137] = 3.069, p < .001), while profiles across ethnicity are (F [42, 1137] = .944, p = .575).
Table CRMCOV. Omnibus MANCOVA results evaluating the impact of covariates, gender, and ethnicity on competencies
TERMS df F p Partial η2 Equal levels, between-groups main effect Ethnicity (ETH) x Centroid 3 1.42 0.24 0.00
Gender (GEN) x Centroid 1 0.14 0.71 0.00
Industry (IND) x Centroid 20 0.42 0.01 0.01
Data source (DS) x Centroid 1 1173.84 0.00 0.51
Function (FUN) x Centroid
Management experience (MX) x Centroid 1 14.81 0.00 0.01
Management level (ML) x Centroid 1 7.36 0.01 0.01
Flatness, within-groups main effect 14 3.29 0.00 0.00
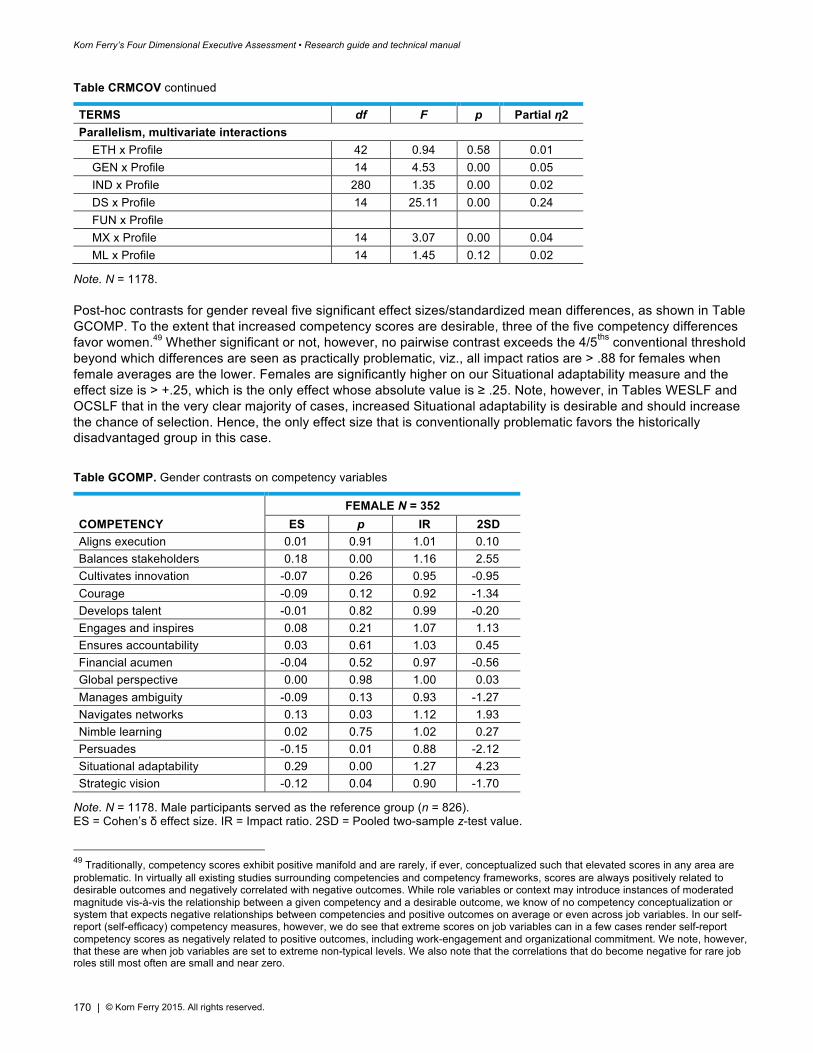
Korn Ferry’s Four Dimensional Executive Assessment • Research guide and technical manual
170 | © Korn Ferry 2015. All rights reserved.
Table CRMCOV continued
TERMS df F p Partial η2 Parallelism, multivariate interactions ETH x Profile 42 0.94 0.58 0.01 GEN x Profile 14 4.53 0.00 0.05 IND x Profile 280 1.35 0.00 0.02 DS x Profile 14 25.11 0.00 0.24 FUN x Profile MX x Profile 14 3.07 0.00 0.04 ML x Profile 14 1.45 0.12 0.02
Note. N = 1178.
Post-hoc contrasts for gender reveal five significant effect sizes/standardized mean differences, as shown in Table GCOMP. To the extent that increased competency scores are desirable, three of the five competency differences favor women.49 Whether significant or not, however, no pairwise contrast exceeds the 4/5ths conventional threshold beyond which differences are seen as practically problematic, viz., all impact ratios are > .88 for females when female averages are the lower. Females are significantly higher on our Situational adaptability measure and the effect size is > +.25, which is the only effect whose absolute value is ≥ .25. Note, however, in Tables WESLF and OCSLF that in the very clear majority of cases, increased Situational adaptability is desirable and should increase the chance of selection. Hence, the only effect size that is conventionally problematic favors the historically disadvantaged group in this case.
Table GCOMP. Gender contrasts on competency variables
FEMALE N = 352 COMPETENCY ES p IR 2SD Aligns execution 0.01 0.91 1.01 0.10 Balances stakeholders 0.18 0.00 1.16 2.55 Cultivates innovation -0.07 0.26 0.95 -0.95 Courage -0.09 0.12 0.92 -1.34 Develops talent -0.01 0.82 0.99 -0.20 Engages and inspires 0.08 0.21 1.07 1.13 Ensures accountability 0.03 0.61 1.03 0.45 Financial acumen -0.04 0.52 0.97 -0.56 Global perspective 0.00 0.98 1.00 0.03 Manages ambiguity -0.09 0.13 0.93 -1.27 Navigates networks 0.13 0.03 1.12 1.93 Nimble learning 0.02 0.75 1.02 0.27 Persuades -0.15 0.01 0.88 -2.12 Situational adaptability 0.29 0.00 1.27 4.23 Strategic vision -0.12 0.04 0.90 -1.70
Note. N = 1178. Male participants served as the reference group (n = 826). ES = Cohen’s δ effect size. IR = Impact ratio. 2SD = Pooled two-sample z-test value.
49 Traditionally, competency scores exhibit positive manifold and are rarely, if ever, conceptualized such that elevated scores in any area are problematic. In virtually all existing studies surrounding competencies and competency frameworks, scores are always positively related to desirable outcomes and negatively correlated with negative outcomes. While role variables or context may introduce instances of moderated magnitude vis-à-vis the relationship between a given competency and a desirable outcome, we know of no competency conceptualization or system that expects negative relationships between competencies and positive outcomes on average or even across job variables. In our self-report (self-efficacy) competency measures, however, we do see that extreme scores on job variables can in a few cases render self-report competency scores as negatively related to positive outcomes, including work-engagement and organizational commitment. We note, however, that these are when job variables are set to extreme non-typical levels. We also note that the correlations that do become negative for rare job roles still most often are small and near zero.
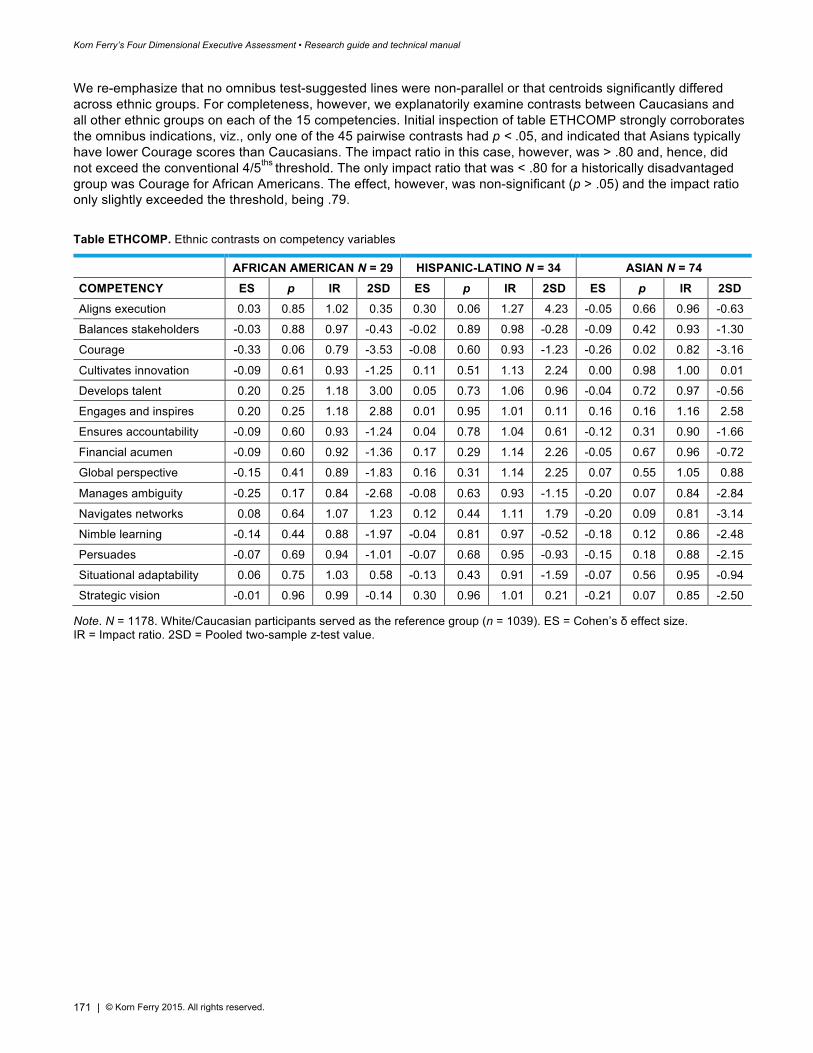
Korn Ferry’s Four Dimensional Executive Assessment • Research guide and technical manual
171 | © Korn Ferry 2015. All rights reserved.
We re-emphasize that no omnibus test-suggested lines were non-parallel or that centroids significantly differed across ethnic groups. For completeness, however, we explanatorily examine contrasts between Caucasians and all other ethnic groups on each of the 15 competencies. Initial inspection of table ETHCOMP strongly corroborates the omnibus indications, viz., only one of the 45 pairwise contrasts had p < .05, and indicated that Asians typically have lower Courage scores than Caucasians. The impact ratio in this case, however, was > .80 and, hence, did not exceed the conventional 4/5ths threshold. The only impact ratio that was < .80 for a historically disadvantaged group was Courage for African Americans. The effect, however, was non-significant (p > .05) and the impact ratio only slightly exceeded the threshold, being .79.
Table ETHCOMP. Ethnic contrasts on competency variables
AFRICAN AMERICAN N = 29 HISPANIC-LATINO N = 34 ASIAN N = 74 COMPETENCY ES p IR 2SD ES p IR 2SD ES p IR 2SD Aligns execution 0.03 0.85 1.02 0.35 0.30 0.06 1.27 4.23 -0.05 0.66 0.96 -0.63
Balances stakeholders -0.03 0.88 0.97 -0.43 -0.02 0.89 0.98 -0.28 -0.09 0.42 0.93 -1.30
Courage -0.33 0.06 0.79 -3.53 -0.08 0.60 0.93 -1.23 -0.26 0.02 0.82 -3.16
Cultivates innovation -0.09 0.61 0.93 -1.25 0.11 0.51 1.13 2.24 0.00 0.98 1.00 0.01
Develops talent 0.20 0.25 1.18 3.00 0.05 0.73 1.06 0.96 -0.04 0.72 0.97 -0.56
Engages and inspires 0.20 0.25 1.18 2.88 0.01 0.95 1.01 0.11 0.16 0.16 1.16 2.58
Ensures accountability -0.09 0.60 0.93 -1.24 0.04 0.78 1.04 0.61 -0.12 0.31 0.90 -1.66
Financial acumen -0.09 0.60 0.92 -1.36 0.17 0.29 1.14 2.26 -0.05 0.67 0.96 -0.72
Global perspective -0.15 0.41 0.89 -1.83 0.16 0.31 1.14 2.25 0.07 0.55 1.05 0.88
Manages ambiguity -0.25 0.17 0.84 -2.68 -0.08 0.63 0.93 -1.15 -0.20 0.07 0.84 -2.84
Navigates networks 0.08 0.64 1.07 1.23 0.12 0.44 1.11 1.79 -0.20 0.09 0.81 -3.14
Nimble learning -0.14 0.44 0.88 -1.97 -0.04 0.81 0.97 -0.52 -0.18 0.12 0.86 -2.48
Persuades -0.07 0.69 0.94 -1.01 -0.07 0.68 0.95 -0.93 -0.15 0.18 0.88 -2.15
Situational adaptability 0.06 0.75 1.03 0.58 -0.13 0.43 0.91 -1.59 -0.07 0.56 0.95 -0.94
Strategic vision -0.01 0.96 0.99 -0.14 0.30 0.96 1.01 0.21 -0.21 0.07 0.85 -2.50
Note. N = 1178. White/Caucasian participants served as the reference group (n = 1039). ES = Cohen’s δ effect size. IR = Impact ratio. 2SD = Pooled two-sample z-test value.
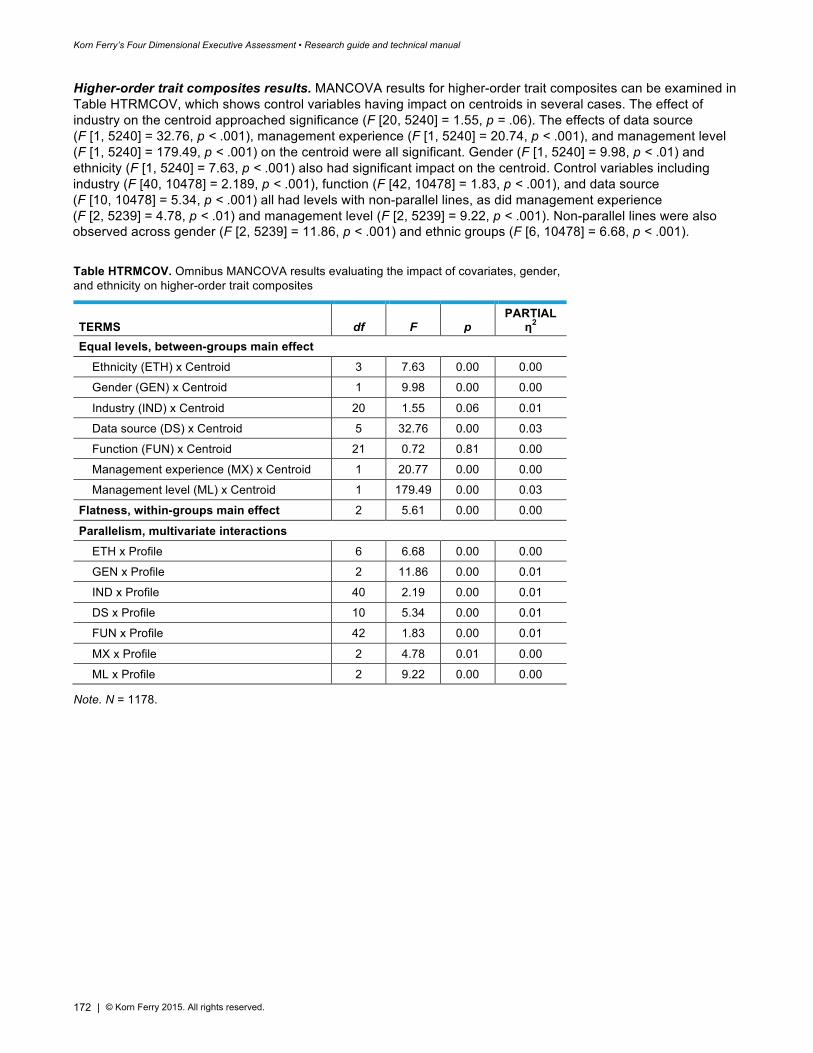
Korn Ferry’s Four Dimensional Executive Assessment • Research guide and technical manual
172 | © Korn Ferry 2015. All rights reserved.
Higher-order trait composites results. MANCOVA results for higher-order trait composites can be examined in Table HTRMCOV, which shows control variables having impact on centroids in several cases. The effect of industry on the centroid approached significance (F [20, 5240] = 1.55, p = .06). The effects of data source (F [1, 5240] = 32.76, p < .001), management experience (F [1, 5240] = 20.74, p < .001), and management level (F [1, 5240] = 179.49, p < .001) on the centroid were all significant. Gender (F [1, 5240] = 9.98, p < .01) and ethnicity (F [1, 5240] = 7.63, p < .001) also had significant impact on the centroid. Control variables including industry (F [40, 10478] = 2.189, p < .001), function (F [42, 10478] = 1.83, p < .001), and data source (F [10, 10478] = 5.34, p < .001) all had levels with non-parallel lines, as did management experience (F [2, 5239] = 4.78, p < .01) and management level (F [2, 5239] = 9.22, p < .001). Non-parallel lines were also observed across gender (F [2, 5239] = 11.86, p < .001) and ethnic groups (F [6, 10478] = 6.68, p < .001).
Table HTRMCOV. Omnibus MANCOVA results evaluating the impact of covariates, gender, and ethnicity on higher-order trait composites
TERMS df F p PARTIAL
η2 Equal levels, between-groups main effect Ethnicity (ETH) x Centroid 3 7.63 0.00 0.00
Gender (GEN) x Centroid 1 9.98 0.00 0.00
Industry (IND) x Centroid 20 1.55 0.06 0.01
Data source (DS) x Centroid 5 32.76 0.00 0.03
Function (FUN) x Centroid 21 0.72 0.81 0.00
Management experience (MX) x Centroid 1 20.77 0.00 0.00
Management level (ML) x Centroid 1 179.49 0.00 0.03
Flatness, within-groups main effect 2 5.61 0.00 0.00
Parallelism, multivariate interactions ETH x Profile 6 6.68 0.00 0.00
GEN x Profile 2 11.86 0.00 0.01
IND x Profile 40 2.19 0.00 0.01
DS x Profile 10 5.34 0.00 0.01
FUN x Profile 42 1.83 0.00 0.01
MX x Profile 2 4.78 0.01 0.00
ML x Profile 2 9.22 0.00 0.00
Note. N = 1178.
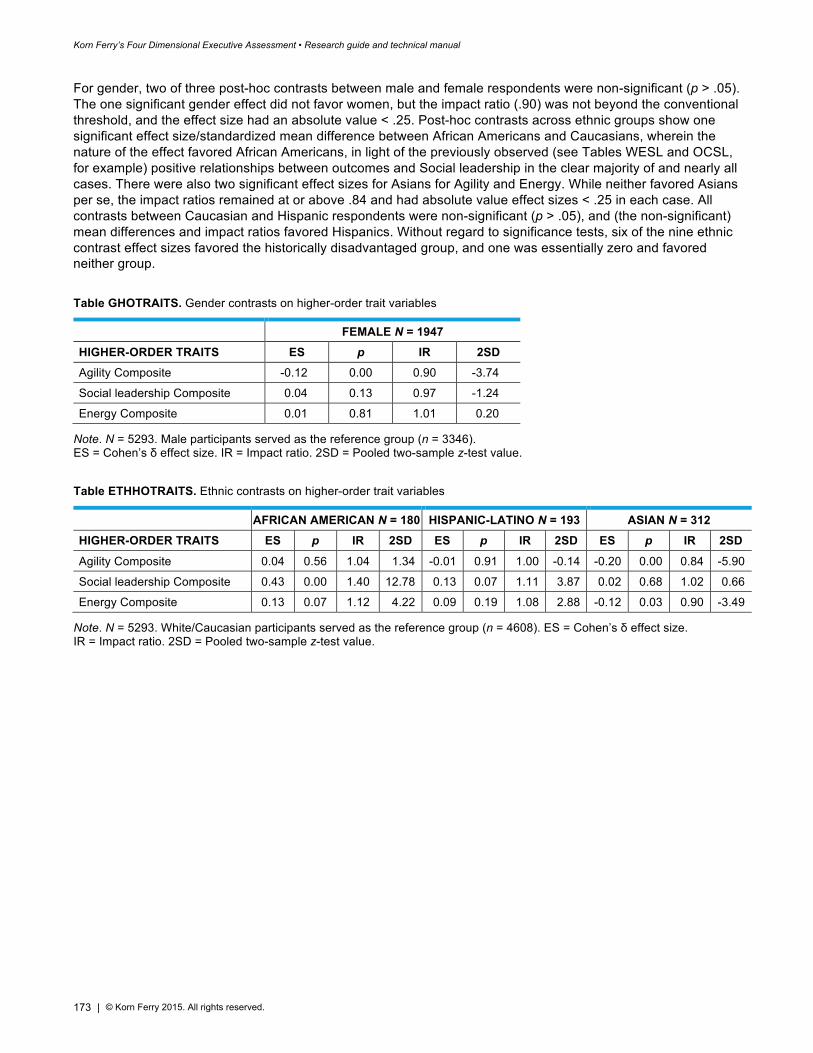
Korn Ferry’s Four Dimensional Executive Assessment • Research guide and technical manual
173 | © Korn Ferry 2015. All rights reserved.
For gender, two of three post-hoc contrasts between male and female respondents were non-significant (p > .05). The one significant gender effect did not favor women, but the impact ratio (.90) was not beyond the conventional threshold, and the effect size had an absolute value < .25. Post-hoc contrasts across ethnic groups show one significant effect size/standardized mean difference between African Americans and Caucasians, wherein the nature of the effect favored African Americans, in light of the previously observed (see Tables WESL and OCSL, for example) positive relationships between outcomes and Social leadership in the clear majority of and nearly all cases. There were also two significant effect sizes for Asians for Agility and Energy. While neither favored Asians per se, the impact ratios remained at or above .84 and had absolute value effect sizes < .25 in each case. All contrasts between Caucasian and Hispanic respondents were non-significant (p > .05), and (the non-significant) mean differences and impact ratios favored Hispanics. Without regard to significance tests, six of the nine ethnic contrast effect sizes favored the historically disadvantaged group, and one was essentially zero and favored neither group.
Table GHOTRAITS. Gender contrasts on higher-order trait variables
FEMALE N = 1947 HIGHER-ORDER TRAITS ES p IR 2SD Agility Composite -0.12 0.00 0.90 -3.74
Social leadership Composite 0.04 0.13 0.97 -1.24
Energy Composite 0.01 0.81 1.01 0.20
Note. N = 5293. Male participants served as the reference group (n = 3346). ES = Cohen’s δ effect size. IR = Impact ratio. 2SD = Pooled two-sample z-test value.
Table ETHHOTRAITS. Ethnic contrasts on higher-order trait variables
AFRICAN AMERICAN N = 180 HISPANIC-LATINO N = 193 ASIAN N = 312 HIGHER-ORDER TRAITS ES p IR 2SD ES p IR 2SD ES p IR 2SD
Agility Composite 0.04 0.56 1.04 1.34 -0.01 0.91 1.00 -0.14 -0.20 0.00 0.84 -5.90
Social leadership Composite 0.43 0.00 1.40 12.78 0.13 0.07 1.11 3.87 0.02 0.68 1.02 0.66
Energy Composite 0.13 0.07 1.12 4.22 0.09 0.19 1.08 2.88 -0.12 0.03 0.90 -3.49
Note. N = 5293. White/Caucasian participants served as the reference group (n = 4608). ES = Cohen’s δ effect size. IR = Impact ratio. 2SD = Pooled two-sample z-test value.
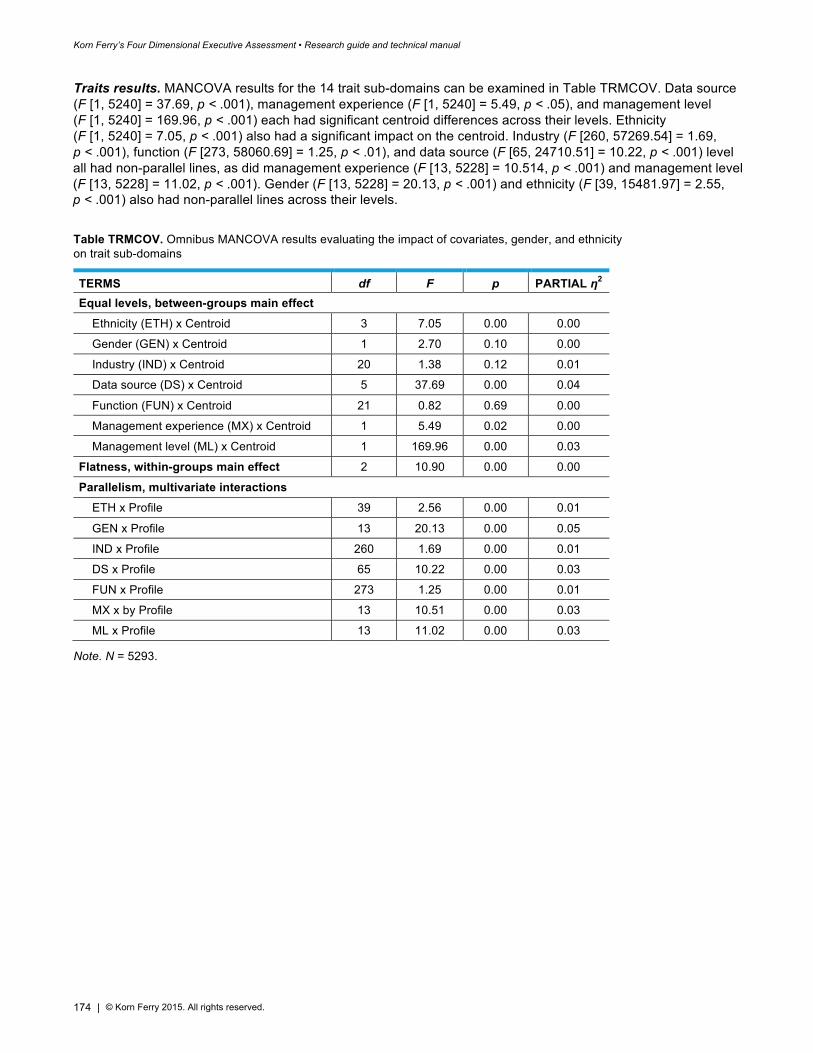
Korn Ferry’s Four Dimensional Executive Assessment • Research guide and technical manual
174 | © Korn Ferry 2015. All rights reserved.
Traits results. MANCOVA results for the 14 trait sub-domains can be examined in Table TRMCOV. Data source (F [1, 5240] = 37.69, p < .001), management experience (F [1, 5240] = 5.49, p < .05), and management level (F [1, 5240] = 169.96, p < .001) each had significant centroid differences across their levels. Ethnicity (F [1, 5240] = 7.05, p < .001) also had a significant impact on the centroid. Industry (F [260, 57269.54] = 1.69, p < .001), function (F [273, 58060.69] = 1.25, p < .01), and data source (F [65, 24710.51] = 10.22, p < .001) level all had non-parallel lines, as did management experience (F [13, 5228] = 10.514, p < .001) and management level (F [13, 5228] = 11.02, p < .001). Gender (F [13, 5228] = 20.13, p < .001) and ethnicity (F [39, 15481.97] = 2.55, p < .001) also had non-parallel lines across their levels.
Table TRMCOV. Omnibus MANCOVA results evaluating the impact of covariates, gender, and ethnicity on trait sub-domains
TERMS df F p PARTIAL η2 Equal levels, between-groups main effect Ethnicity (ETH) x Centroid 3 7.05 0.00 0.00
Gender (GEN) x Centroid 1 2.70 0.10 0.00
Industry (IND) x Centroid 20 1.38 0.12 0.01
Data source (DS) x Centroid 5 37.69 0.00 0.04
Function (FUN) x Centroid 21 0.82 0.69 0.00
Management experience (MX) x Centroid 1 5.49 0.02 0.00
Management level (ML) x Centroid 1 169.96 0.00 0.03
Flatness, within-groups main effect 2 10.90 0.00 0.00
Parallelism, multivariate interactions ETH x Profile 39 2.56 0.00 0.01
GEN x Profile 13 20.13 0.00 0.05
IND x Profile 260 1.69 0.00 0.01
DS x Profile 65 10.22 0.00 0.03
FUN x Profile 273 1.25 0.00 0.01
MX x by Profile 13 10.51 0.00 0.03
ML x Profile 13 11.02 0.00 0.03
Note. N = 5293.
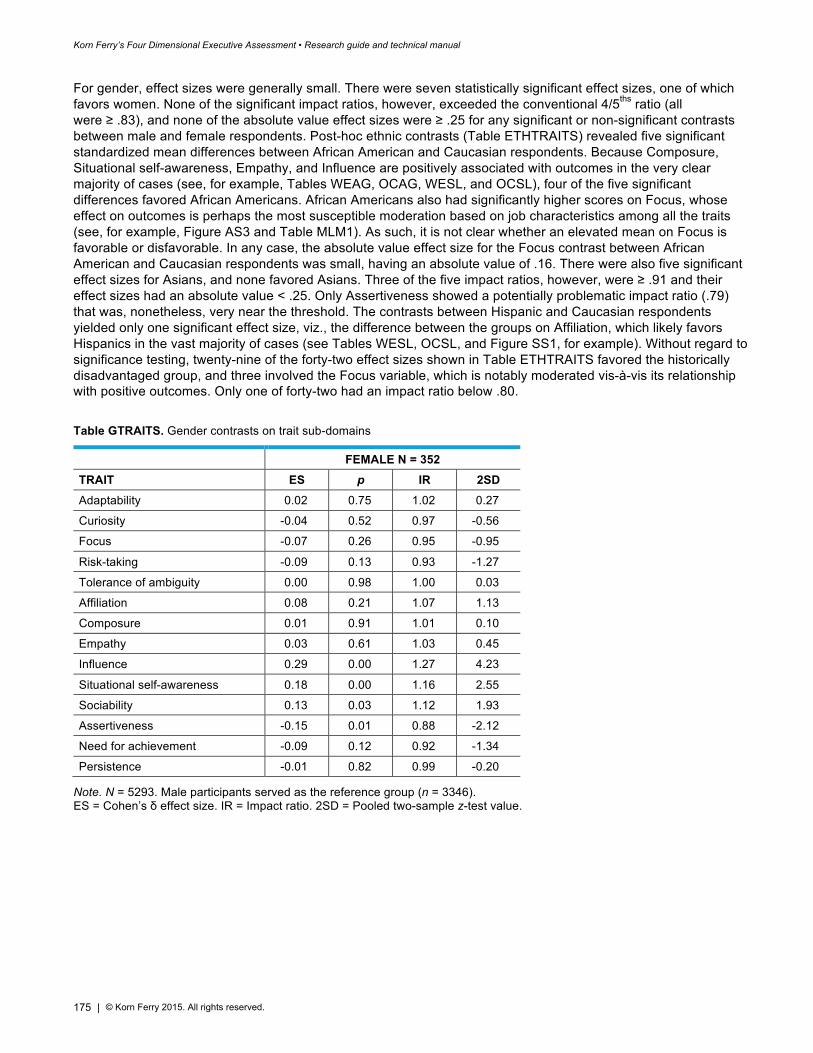
Korn Ferry’s Four Dimensional Executive Assessment • Research guide and technical manual
175 | © Korn Ferry 2015. All rights reserved.
For gender, effect sizes were generally small. There were seven statistically significant effect sizes, one of which favors women. None of the significant impact ratios, however, exceeded the conventional 4/5ths ratio (all were ≥ .83), and none of the absolute value effect sizes were ≥ .25 for any significant or non-significant contrasts between male and female respondents. Post-hoc ethnic contrasts (Table ETHTRAITS) revealed five significant standardized mean differences between African American and Caucasian respondents. Because Composure, Situational self-awareness, Empathy, and Influence are positively associated with outcomes in the very clear majority of cases (see, for example, Tables WEAG, OCAG, WESL, and OCSL), four of the five significant differences favored African Americans. African Americans also had significantly higher scores on Focus, whose effect on outcomes is perhaps the most susceptible moderation based on job characteristics among all the traits (see, for example, Figure AS3 and Table MLM1). As such, it is not clear whether an elevated mean on Focus is favorable or disfavorable. In any case, the absolute value effect size for the Focus contrast between African American and Caucasian respondents was small, having an absolute value of .16. There were also five significant effect sizes for Asians, and none favored Asians. Three of the five impact ratios, however, were ≥ .91 and their effect sizes had an absolute value < .25. Only Assertiveness showed a potentially problematic impact ratio (.79) that was, nonetheless, very near the threshold. The contrasts between Hispanic and Caucasian respondents yielded only one significant effect size, viz., the difference between the groups on Affiliation, which likely favors Hispanics in the vast majority of cases (see Tables WESL, OCSL, and Figure SS1, for example). Without regard to significance testing, twenty-nine of the forty-two effect sizes shown in Table ETHTRAITS favored the historically disadvantaged group, and three involved the Focus variable, which is notably moderated vis-à-vis its relationship with positive outcomes. Only one of forty-two had an impact ratio below .80.
Table GTRAITS. Gender contrasts on trait sub-domains
FEMALE N = 352 TRAIT ES p IR 2SD Adaptability 0.02 0.75 1.02 0.27
Curiosity -0.04 0.52 0.97 -0.56
Focus -0.07 0.26 0.95 -0.95
Risk-taking -0.09 0.13 0.93 -1.27
Tolerance of ambiguity 0.00 0.98 1.00 0.03
Affiliation 0.08 0.21 1.07 1.13
Composure 0.01 0.91 1.01 0.10
Empathy 0.03 0.61 1.03 0.45
Influence 0.29 0.00 1.27 4.23
Situational self-awareness 0.18 0.00 1.16 2.55
Sociability 0.13 0.03 1.12 1.93
Assertiveness -0.15 0.01 0.88 -2.12
Need for achievement -0.09 0.12 0.92 -1.34
Persistence -0.01 0.82 0.99 -0.20
Note. N = 5293. Male participants served as the reference group (n = 3346). ES = Cohen’s δ effect size. IR = Impact ratio. 2SD = Pooled two-sample z-test value.
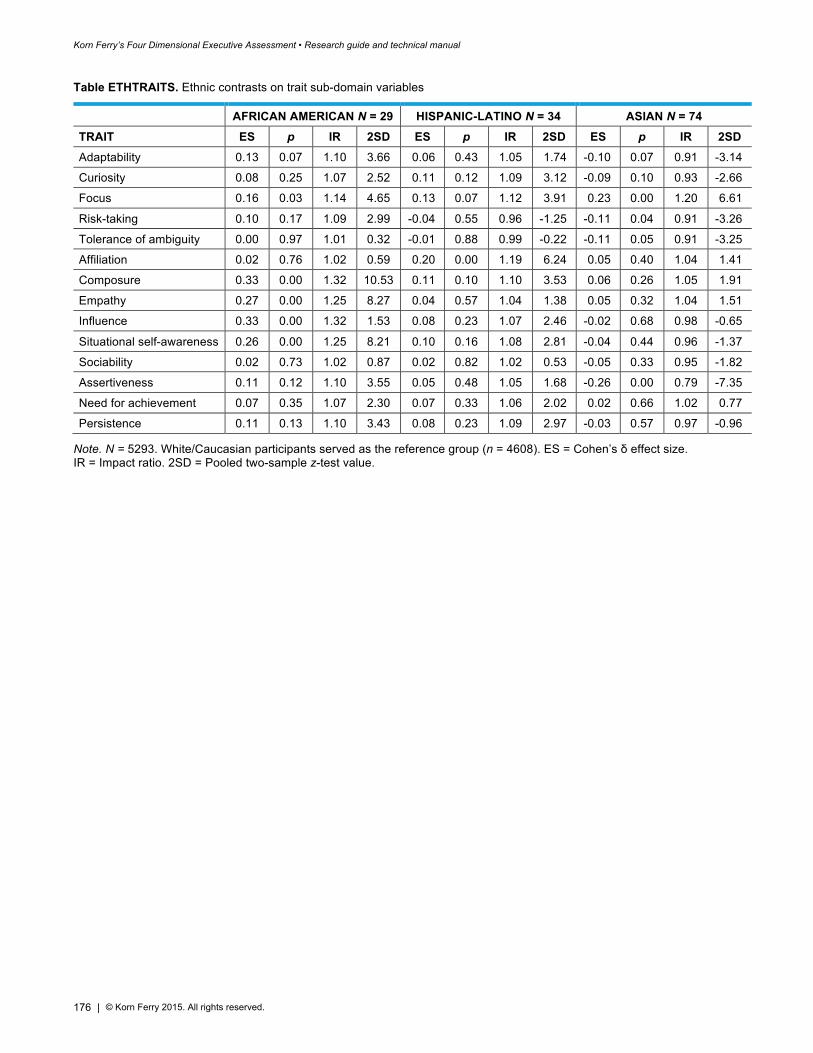
Korn Ferry’s Four Dimensional Executive Assessment • Research guide and technical manual
176 | © Korn Ferry 2015. All rights reserved.
Table ETHTRAITS. Ethnic contrasts on trait sub-domain variables
AFRICAN AMERICAN N = 29 HISPANIC-LATINO N = 34 ASIAN N = 74 TRAIT ES p IR 2SD ES p IR 2SD ES p IR 2SD Adaptability 0.13 0.07 1.10 3.66 0.06 0.43 1.05 1.74 -0.10 0.07 0.91 -3.14
Curiosity 0.08 0.25 1.07 2.52 0.11 0.12 1.09 3.12 -0.09 0.10 0.93 -2.66
Focus 0.16 0.03 1.14 4.65 0.13 0.07 1.12 3.91 0.23 0.00 1.20 6.61
Risk-taking 0.10 0.17 1.09 2.99 -0.04 0.55 0.96 -1.25 -0.11 0.04 0.91 -3.26
Tolerance of ambiguity 0.00 0.97 1.01 0.32 -0.01 0.88 0.99 -0.22 -0.11 0.05 0.91 -3.25
Affiliation 0.02 0.76 1.02 0.59 0.20 0.00 1.19 6.24 0.05 0.40 1.04 1.41
Composure 0.33 0.00 1.32 10.53 0.11 0.10 1.10 3.53 0.06 0.26 1.05 1.91
Empathy 0.27 0.00 1.25 8.27 0.04 0.57 1.04 1.38 0.05 0.32 1.04 1.51
Influence 0.33 0.00 1.32 1.53 0.08 0.23 1.07 2.46 -0.02 0.68 0.98 -0.65
Situational self-awareness 0.26 0.00 1.25 8.21 0.10 0.16 1.08 2.81 -0.04 0.44 0.96 -1.37
Sociability 0.02 0.73 1.02 0.87 0.02 0.82 1.02 0.53 -0.05 0.33 0.95 -1.82
Assertiveness 0.11 0.12 1.10 3.55 0.05 0.48 1.05 1.68 -0.26 0.00 0.79 -7.35
Need for achievement 0.07 0.35 1.07 2.30 0.07 0.33 1.06 2.02 0.02 0.66 1.02 0.77
Persistence 0.11 0.13 1.10 3.43 0.08 0.23 1.09 2.97 -0.03 0.57 0.97 -0.96
Note. N = 5293. White/Caucasian participants served as the reference group (n = 4608). ES = Cohen’s δ effect size. IR = Impact ratio. 2SD = Pooled two-sample z-test value.
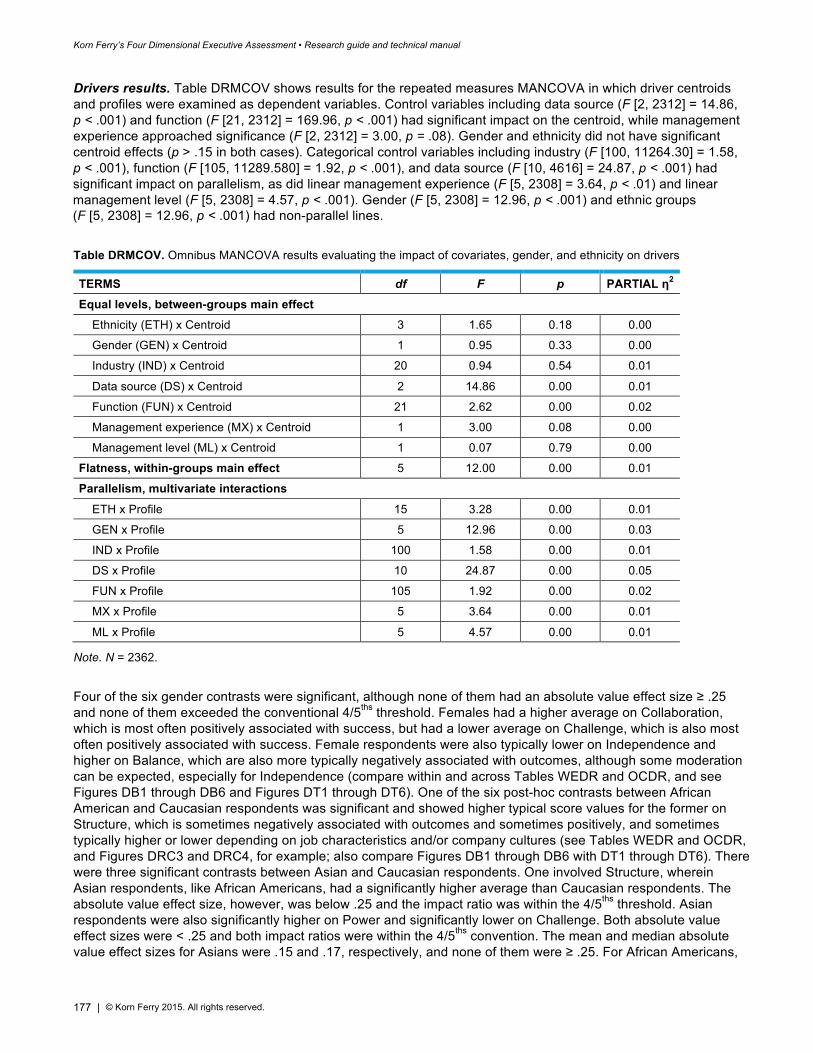
Korn Ferry’s Four Dimensional Executive Assessment • Research guide and technical manual
177 | © Korn Ferry 2015. All rights reserved.
Drivers results. Table DRMCOV shows results for the repeated measures MANCOVA in which driver centroids and profiles were examined as dependent variables. Control variables including data source (F [2, 2312] = 14.86, p < .001) and function (F [21, 2312] = 169.96, p < .001) had significant impact on the centroid, while management experience approached significance (F [2, 2312] = 3.00, p = .08). Gender and ethnicity did not have significant centroid effects (p > .15 in both cases). Categorical control variables including industry (F [100, 11264.30] = 1.58, p < .001), function (F [105, 11289.580] = 1.92, p < .001), and data source (F [10, 4616] = 24.87, p < .001) had significant impact on parallelism, as did linear management experience (F [5, 2308] = 3.64, p < .01) and linear management level (F [5, 2308] = 4.57, p < .001). Gender (F [5, 2308] = 12.96, p < .001) and ethnic groups (F [5, 2308] = 12.96, p < .001) had non-parallel lines.
Table DRMCOV. Omnibus MANCOVA results evaluating the impact of covariates, gender, and ethnicity on drivers
TERMS df F p PARTIAL η2 Equal levels, between-groups main effect Ethnicity (ETH) x Centroid 3 1.65 0.18 0.00
Gender (GEN) x Centroid 1 0.95 0.33 0.00
Industry (IND) x Centroid 20 0.94 0.54 0.01
Data source (DS) x Centroid 2 14.86 0.00 0.01
Function (FUN) x Centroid 21 2.62 0.00 0.02
Management experience (MX) x Centroid 1 3.00 0.08 0.00
Management level (ML) x Centroid 1 0.07 0.79 0.00
Flatness, within-groups main effect 5 12.00 0.00 0.01
Parallelism, multivariate interactions
ETH x Profile 15 3.28 0.00 0.01
GEN x Profile 5 12.96 0.00 0.03
IND x Profile 100 1.58 0.00 0.01
DS x Profile 10 24.87 0.00 0.05
FUN x Profile 105 1.92 0.00 0.02
MX x Profile 5 3.64 0.00 0.01
ML x Profile 5 4.57 0.00 0.01
Note. N = 2362.
Four of the six gender contrasts were significant, although none of them had an absolute value effect size ≥ .25 and none of them exceeded the conventional 4/5ths threshold. Females had a higher average on Collaboration, which is most often positively associated with success, but had a lower average on Challenge, which is also most often positively associated with success. Female respondents were also typically lower on Independence and higher on Balance, which are also more typically negatively associated with outcomes, although some moderation can be expected, especially for Independence (compare within and across Tables WEDR and OCDR, and see Figures DB1 through DB6 and Figures DT1 through DT6). One of the six post-hoc contrasts between African American and Caucasian respondents was significant and showed higher typical score values for the former on Structure, which is sometimes negatively associated with outcomes and sometimes positively, and sometimes typically higher or lower depending on job characteristics and/or company cultures (see Tables WEDR and OCDR, and Figures DRC3 and DRC4, for example; also compare Figures DB1 through DB6 with DT1 through DT6). There were three significant contrasts between Asian and Caucasian respondents. One involved Structure, wherein Asian respondents, like African Americans, had a significantly higher average than Caucasian respondents. The absolute value effect size, however, was below .25 and the impact ratio was within the 4/5ths threshold. Asian respondents were also significantly higher on Power and significantly lower on Challenge. Both absolute value effect sizes were < .25 and both impact ratios were within the 4/5ths convention. The mean and median absolute value effect sizes for Asians were .15 and .17, respectively, and none of them were ≥ .25. For African Americans,
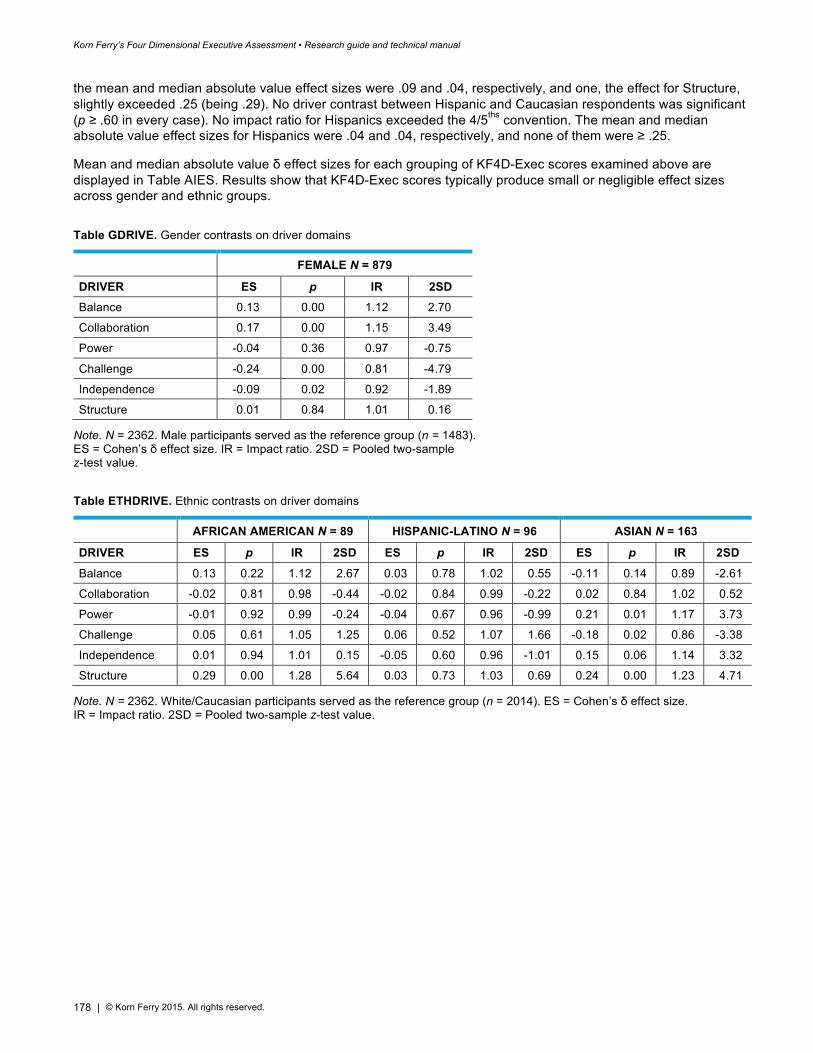
Korn Ferry’s Four Dimensional Executive Assessment • Research guide and technical manual
178 | © Korn Ferry 2015. All rights reserved.
the mean and median absolute value effect sizes were .09 and .04, respectively, and one, the effect for Structure, slightly exceeded .25 (being .29). No driver contrast between Hispanic and Caucasian respondents was significant (p ≥ .60 in every case). No impact ratio for Hispanics exceeded the 4/5ths convention. The mean and median absolute value effect sizes for Hispanics were .04 and .04, respectively, and none of them were ≥ .25.
Mean and median absolute value δ effect sizes for each grouping of KF4D-Exec scores examined above are displayed in Table AIES. Results show that KF4D-Exec scores typically produce small or negligible effect sizes across gender and ethnic groups.
Table GDRIVE. Gender contrasts on driver domains
FEMALE N = 879
DRIVER ES p IR 2SD Balance 0.13 0.00 1.12 2.70
Collaboration 0.17 0.00 1.15 3.49
Power -0.04 0.36 0.97 -0.75
Challenge -0.24 0.00 0.81 -4.79
Independence -0.09 0.02 0.92 -1.89
Structure 0.01 0.84 1.01 0.16
Note. N = 2362. Male participants served as the reference group (n = 1483). ES = Cohen’s δ effect size. IR = Impact ratio. 2SD = Pooled two-sample z-test value.
Table ETHDRIVE. Ethnic contrasts on driver domains
AFRICAN AMERICAN N = 89 HISPANIC-LATINO N = 96 ASIAN N = 163
DRIVER ES p IR 2SD ES p IR 2SD ES p IR 2SD
Balance 0.13 0.22 1.12 2.67 0.03 0.78 1.02 0.55 -0.11 0.14 0.89 -2.61
Collaboration -0.02 0.81 0.98 -0.44 -0.02 0.84 0.99 -0.22 0.02 0.84 1.02 0.52
Power -0.01 0.92 0.99 -0.24 -0.04 0.67 0.96 -0.99 0.21 0.01 1.17 3.73
Challenge 0.05 0.61 1.05 1.25 0.06 0.52 1.07 1.66 -0.18 0.02 0.86 -3.38
Independence 0.01 0.94 1.01 0.15 -0.05 0.60 0.96 -1.01 0.15 0.06 1.14 3.32
Structure 0.29 0.00 1.28 5.64 0.03 0.73 1.03 0.69 0.24 0.00 1.23 4.71
Note. N = 2362. White/Caucasian participants served as the reference group (n = 2014). ES = Cohen’s δ effect size. IR = Impact ratio. 2SD = Pooled two-sample z-test value.
179 | © Korn Ferry 2015. All rights reserved.
Section 5 Summary and limitations
Korn Ferry’s Four Dimensional Executive Assessment • Research guide and technical manual
180 | © Korn Ferry 2015. All rights reserved.
Summary and limitations The sections above provide considerable support for the utility and validity of the KF4D-Exec system in general and also for the construct validity of our KF4D-Exec measures. KF4D-Exec measures show acceptable reliability/internal consistency in every case. There are indications of concurrent validity, content validity, criterion-related and predictive validity, and divergent validity, where applicable. KF4D-Exec measures also show indications of discriminating between functional job groups and groups defined according to success levels in different ways that support discriminant validity. Our study of KF4D-Exec variables and their relationships to outcomes and work-analysis variables is not without a variety of notable limitations.
Intended use KF4D-Exec is designed to be employed as part of a broader and high-touch process by which candidates are recommended for upper-level management and/or executive role vacancies. It was not developed or intended for use as a screening tool, but rather as a supplement to Korn Ferry’s long-standing, well-informed, and comprehensive executive search process by which our Search Partners and Search Professionals work with clients to identify and vet candidates using their own wealth of experience, insight, expertise, and relationships. KF4D-Exec and all related processes are designed to contribute to related discussions and serve as a single data-point among many that are often otherwise qualitative and/or based on insight and conditions that KF4D-Exec was not designed to measure or incorporate. Ultimate decisions concerning best-fit candidates are made as a result of discussions and multiple points of contact between client representatives, candidates, and Korn Ferry Search Professionals. We place high value and ultimately defer to the expertise and experience of our Search Partners and related personnel. KF4D-Exec was designed for descriptive and value-added purposes to supplement their work and not to replace nor trump their deep professional skill, judgment, insight, and experience.
181 | © Korn Ferry 2015. All rights reserved.
References
Korn Ferry’s Four Dimensional Executive Assessment • Research guide and technical manual
182 | © Korn Ferry 2015. All rights reserved.
Ackerman, P. L., & Goff, M. (1994). Typical intellectual engagement and personality: Reply to Rocklin (1994). Journal of Educational Psychology, 86(1), 150-153. doi: 10.1037/0022-0663.86.1.150
Ackerman, P. L., & Heggestad, E. D. (1997). Intelligence, personality, and interests: Evidence for overlapping traits. Psychological Bulletin, 121(2), 219-245. doi: 10.1037/0033-2909.121.2.219
Adler, P., Goldoftas, B., & Levine, D. (1999). Flexibility versus efficiency? A case study of model changeovers in the Toyota production system. Organization Science, 10, 43-68.
Ahmad, K. Z. (2010). Person-environment fit approach to intolerance of inequity and free-riders. International Business Research, 3(1), 35-42.
Aiello, J. R., & Kolb, K. J. (1995). Electronic performance monitoring and social content: Impact on productivity and stress. Journal of Applied Psychology, 80(3) 339-353.
Alderfer, C. P. (1969). An empirical test of a new theory of human needs. Organizational Behavior and Human Performance, 4(2), 142-175.
Allen, S. L., Smith, J. E., & Da Silva, N. (2013). Leadership style in relation to organizational change and organizational creativity: Perceptions from nonprofit organizational members. Nonprofit Management and Leadership, 24(1), 23-42. doi: 10.1002/nml.21078
Amos, B., & Klimoski, R. J. (2014). Courage: Making teamwork work well. Group & Organization Management, 39(1), 110-128. doi: 10.1177/1059601113520407
Anbazhagan, A., & Rajan, L. J. (2013). A conceptual framework of occupational stress and coping strategies. International Journal of Business Economics & Management Research, 3(5), 154-172.
Anderson, C., & Berdahl, J. L. (2002). The experience of power: Examining the effects of power on approach and inhibition tendencies. Journal of Personality and Social Psychology, 83(6), 1362-1377. doi: 10.1037/0022-3514.83.6.1362
Anderson, C., & Kilduff, G. J. (2009). Why do dominant personalities attain influence in face-to-face groups? The competence-signaling effects of trait dominance. Journal of Personality and Social Psychology. 96(2), 491–503. doi: 10.1037/a0014201
Armenakis, A. A., & Harris, S. G. (2009). Reflections: Our journey in organizational change research and practice. Journal of Change Management, 9(2), 127-142. doi: 10.1080/14697010902879079
Atchison, T. J., Belcher, D. W., & Thomsen, D. J. (2013). Internet based benefits & compensation administration. ERI. Retrieved from https://dlc.erieri.com/index.cfm?fuseaction=textbook.chpt10
Atwater, L. E., & Yammarino, F. J. (1996). Bases of power in relation to leader behavior: A field investigation. Journal of Business and Psychology, 11(1), 3-22.
Aulet, B. (2014). Culture eats strategy for breakfast. Retrieved from: http://techcrunch.com/2014/04/12/culture-eats-strategy-for-breakfast/
Avery, G. C. (2004). Understanding leadership: Paradigms and cases. London: Sage. Avolio, B. (1999). Full leadership development: Building the vital forces in organization. Thousand Oaks, CA: Sage
Publications. Baer, R. A. (2003). Mindfulness training as a clinical intervention: A conceptual and empirical review. Clinical
Psychology: Science and Practice, 10(2), 125. Baldoni, J. (2014, March 25). It’s not enough to manage, you must inspire. Forbes. Retrieved from
http://www.forbes.com/sites/johnbaldoni/2014/03/25/its-not-enough-to-manage-you must-inspire/ Balon, S., Lecoq, J., & Rime, B. (2013). Passion and personality: Is passionate behaviour a function of personality?
European Review of Applied Psychology, 63(1), 59-65. Bandura, A. (1969). Social learning theory of identificatory processes. In D. A. Goslin (Ed.), Handbook of
socialization theory and research (pp. 213-262). Chicago, IL: Rand McNally. Bandura, A. (1986). Social foundations of thought and action: A social cognitive theory. Englewood Cliffs, NJ:
Prentice-Hall. Barnett, R. C., & Hyde, J. S. (2001). Women, men, work, and family: An expansionist theory. American
Psychologist, 56, 781–796. Barnfield, H., Dai, G., Jouve, M., Orr, J. E., Sneltjes, C., & Storfer, P. (2014). Define. Distill. Deploy. Adopting
twenty-first century competencies for high-impact talent. Los Angeles, CA: Korn Ferry Institute. Barrick, M. R., & Mount, M. K. (1991). The Big Five personality dimensions and job performance: A meta-analysis.
Personnel Psychology, 44(1), 1-26.
Korn Ferry’s Four Dimensional Executive Assessment • Research guide and technical manual
183 | © Korn Ferry 2015. All rights reserved.
Barrick, M. R., & Mount, M. K. (1993). Autonomy as a moderator of the relationships between the Big Five personality dimensions and job performance. Journal of Applied Psychology, 78(1), 111-118. doi: http://dx.doi.org/10.1037/0021-9010.78.1.111
Barrick, M. R., & Mount, M. K. (2005). Yes, personality matters: Moving on to more important matters. Human Performance, 18(4), 359-372.
Barrick, M. R., Mount, M. K., & Judge, T. A. (2001). Personality and performance at the beginning of the new millennium: What do we know and where do we go next? International Journal of Selection and Assessment, 9(1-2), 9-30. doi: 10.1111/1468-2389.00160
Barrick, M. R., Parks, L., & Mount, M. K. (2005). Self-monitoring as a moderator of the relationships between personality traits and performance. Personnel Psychology, 58(3), 745-767. doi: 10.1111/j.1744-6570.2005.00716.x
Bartram, D. (2007). Increasing validity with forced-choice criterion measurement formats. International Journal of Selection and Assessment, 15(3), 263-272. doi: 10.1111/j.1468-2389.2007.00386.x
Bass, B. M. (1985). Leadership and performance beyond expectations. New York, NY: Free Press. Bass, B. M. (1990a). Handbook of leadership. Theory, research & managerial applications (3rd ed.). New York,
NY: Free Press. Bass, B. M. (1990b). From transactional to transformational leadership: Learning to share the vision.
Organizational Dynamics, 19, 19-31. Bass, B. M. (1999). Two decades of research and development in transformational leadership. European Journal
of Work and Organizational Psychology, 8(1), 9-32. Bass, B. M., & Avolio, B. J. (1993). Transformational leadership and organizational culture. Public Administration
Quarterly, 17(1), 112-121. Bass, B., & Avolio, B. (2000). Full-range of leadership development: Manual for the Multifactor Leadership
Questionnaire. Palo Alto, CA: Mind Garden. Bass, B. M., Jung, D. I., Avolio, B. J., & Berson, Y. (2003). Predicting unit performance by assessing
transformational and transactional leadership. Journal of Applied Psychology, 88(2), 207-218. Baum, J. R., & Locke, E. A. (2004). The relationship of entrepreneurial traits, skill, and motivation to subsequent
venture growth. Journal of Applied Psychology, 89(4), 587598. doi: 10.1037/0021-9010.89.4.587 Baumeister, R. F., & Leary, J. R. (1995). The need to belong: Desire for interpersonal attachments as a
fundamental human motivation. Psychological Bulletin, 117(3), 497529. Begley, T. M., & Boyd, D. P. (1987). A comparison of entrepreneurs and managers of small business firms. Journal
of Management, 13(1), 99-108. Berglas, S. (1997, 02). Once-fearless entrepreneurs who respond to success by avoiding risk and change can
strangle their business. Inc., 19, 35-36. Retrieved from http://ezproxy.middlebury.edu/login?url=http://search.proquest.com/docview/214512531?accountid=12447
Berlew, D. E., & Hall, D. T. (1966). The socialization of managers: Effects of expectations on performance. Administrative Science Quarterly, 11(2), 207-223.
Bersin, J. (2013, April 23). The world is not global, it’s local. Forbes. Retrieved from http://www.forbes.com/sites/joshbersin/2013/04/23/the-world-is-not-global-ts-local/
Berson, Y., Oreg, S., & Dvir, T. (2008). CEO values, organizational culture and firm outcomes. Journal of Organizational Behavior, 29(5), 615-633.
Bertocci, D. I. (2009). Leadership in organizations: There is a difference between leaders and managers. University Press of America.
Bharwaney, G., Bar-On, R., & MacKinlay, A. (2011). EQ and the bottom line: Emotional intelligence increases individual occupational performance. Leadership and Organizational Productivity [Online]. Retrieved from http://www.eiconsortium.org/pdf/Bharwaney_BarOn_MacKinlay_EQ_and_Bottom_Line.pdf
Bhide, A. (1996). The questions every entrepreneur must answer. Harvard Business Review, 73(6), 120-130. Birshan, M., & Kar, J. (2012, July). Becoming more strategic: Three tips for any executive. McKinsey Quarterly.
Retrieved from http://www.mckinsey.com/insights/strategy/becoming_more_strategic_three_tips for_any_executive
Korn Ferry’s Four Dimensional Executive Assessment • Research guide and technical manual
184 | © Korn Ferry 2015. All rights reserved.
Blickle, G., Meurs, J., Wihler, A., Ewen, C., Merkl, R., & Missfield, T. (2015). Extraversion and job performance. How context relevance and bandwidth specificity create a non-linear, positive, and asymptotic relationship. Journal of Vocational Behavior, 87, 80-88.
Bloomfield, D. R., & Blick, K. A. (1975). Personality correlates of verbal conflict resolution. The Journal of Psychology: Interdisciplinary and Applied, 90(1), 45-49.
Bogg, T., & Roberts, B. W. (2004). Conscientiousness and health-related behaviors: A meta-analysis of the leading behavioral contributors to mortality. Psychological Bulletin, 130(6), 887-919.
Bono, J. E., & Judge, T. A. (2004). Personality and transformational and transactional leadership: A meta-analysis. Journal of Applied Psychology, 89(5), 901-910. doi: 10.1037/0021-9010.89.5.901
Boselie, P., Dietz, G., & Boon, C. (2005). Commonalities and contradictions in HRM and performance research. Human Resource Management Journal, 15, 67-94.
Boxall, P., & Purcell, J. (2008). Strategy and human resource management. Hampshire: Palgrave MacMillan. Brannick, M. T., Levine, E. L., & Morgeson, F. P. (2007). Job analysis—methods, research and applications for
human resource management. Thousand Oaks, CA: Sage. Bray, D. W., Campbell, R. J., & Grant, D. L. (1974). Formative years in business: A long-term AT&T study of
managerial lives. New York, NY: Wiley. Briscoe, J. P., & Hall, D. T. (1999). Grooming and picking leaders using competency frameworks: Do they work?
An alternative approach and new guidelines for practice. Organizational Dynamics, 28(2), 37-52. Brousseau, K. (2008). Profiling and predicting sales success. White paper. Decision Dynamics. Brousseau, K., Driver, M., Hourihan, G., & Larsson, R. (2006). The seasoned executive’s decision-making style.
Harvard Business Review, 84, 109-121. Brown, A., & Maydeu-Olivares, A. (2010). Issues that should not be overlooked in the dominance versus ideal point
controversy. Industrial and Organizational Psychology, 3(4), 489-493. Brown, A., & Maydeu-Olivares, A. (2011). Item response modeling of forced-choice questionnaires. Educational
and Psychological Measurement, 71(3), 460-502. Brown, A., & Maydeu-Olivares, A. (2012). Fitting a Thurstonian IRT model to forced-choice data using Mplus.
Behavior Research Methods, 44(4), 1135-1147. Brown, F. W., & Moshavi, D. (2002). Herding academic cats: Faculty reactions to transformational and contingent
reward leadership by department chairs. Journal of Leadership Studies, 8(3): 79-94. Brown, K. W., & Ryan, R. M. (2003). The benefits of being present: Mindfulness and its role in psychological well-
being. Journal of Personality and Social Psychology, 84(4), 822-848. doi: 10.1037/0022-3514.84.4.822 Bryant, S. E. (2003). The role of transformational and transactional leadership in creating, sharing and exploiting
organizational knowledge. Journal of Leadership & Organizational Studies, 9(4), 32-44. doi: 10.1177/107179190300900403
Bryman, A. (1992). Charisma and leadership in organizations. London: Sage. Burger, J. M. (1992). Desire for control: Personality, social, and clinical perspectives. New York, NY: Plenum
Press. Burke, W. W., & Litwin, G. H. (1992). A causal model of organizational performance and change. Journal of
Management, 18(3), 523-545. Burns, J. M. (1978). Leadership. Oxford: Harper & Row. Cable, D. M., & DeRue, D. S. (2002). The convergent and discriminant validity of subjective fit perceptions. Journal
of Applied Psychology, 87(5), 875-884. Calarco, A., & Gurvis, J. (2006). Flexible flyers: A leader’s framework for developing adaptability. Leadership in
Action, 25(6), 14-16. doi: 10.1002/lia.1142 Caldwell, D. F., & Burger, J. M. (1997). Personality and social influence strategies in the workplace. Personality
and Social Psychology Bulletin, 23(10), 1003-1012. Calof, J., Richards, G., Mirabeau, L., Mouftah, J., Mackinnon, P., Chapman, P., & Vasudev, P. M. (2014). An
overview of the demise of Nortel Networks and key lessons learned: Systemic effects in environment, resilience and black-cloud formation. Retrieved from http://sites.telfer.uottawa.ca/nortelstudy/files/2014/02/nortel-summary-report-and-executive-summary.pdf
Korn Ferry’s Four Dimensional Executive Assessment • Research guide and technical manual
185 | © Korn Ferry 2015. All rights reserved.
Cameron, K. S., & Quinn, R. E. (2006). Diagnosing and changing organizational culture: Based on the competing values framework (Revised ed.). San Francisco, CA: Jossey-Bass.
Cameron, K. S., Quinn, R. E., Degraff, J., & Thakor, A. V. (2014). Competing values leadership: Creating value in organizations (2nd ed.). Northampton, MA: Edward Elgar.
Campbell, J. P., & Pritchard, R. D. (1976). Motivation theory in industrial and organizational psychology. In M. D. Dunnette (Ed.), Handbook of industrial and organizational psychology (pp. 63-130). Chicago, IL: Rand McNally.
Caplan, R. D. (1987). Person-environment fit theory: Commensurate dimensions, time perspectives, and mechanisms. Journal of Vocational Behavior, 31, 248-267.
Cardon, M. S., Wincent, J., Singh, J., & Drnovsek, M. (2009). The nature and experience of entrepreneurial passion. The Academy of Management Review, 34(3), 511-532. doi: 10.5465/AMR.2009.40633190
Cardon, M. S., Zietsma, C., Saparito, P., Matherne, B., & Davis, C. (2005). A tale of passion: New insights into entrepreneurship from a parenthood metaphor. Journal of Business Venturing, 20, 23-45.
Cashman, K. (2013). The five dimensions of learning agile leaders. Forbes. Retrieved from http://www.forbes.com/sites/kevincashman/2013/04/03/the-five-dimensions-of-learning-agile-leaders/
Chajut, E., & Algom, D. (2003). Selective attention improves under stress: Implications for theories of social cognition. Journal of Personality and Social Psychology, 85(2), 231-248. doi: 10.1037/0022-3514.85.2.231
Cheung, M. W. L., & Chan, W. (2002). Reducing uniform response bias with ipsative measurement in multiple-group confirmatory factor analysis. Structural Equation Modeling, 9(1), 55-77. doi: 10.1207/S15328007SEM0901_4
Childress, J. R. (2013). Leverage: The CEO’s guide to corporate culture. London, UK: Principia Associates. Christiansen, N., & Tett, R. (2013). Handbook of personality at work (Applied Psychology Series). New York, NY:
Routledge. Clark, D. (2013, October 8). What’s keeping you from being strategic? Forbes. Retrieved from
http://www.forbes.com/sites/dorieclark/2013/10/08/whats-keeping-you-from-being-strategic/ Cohen, A. (1993). Organizational commitment and turnover: A meta-analysis. Academy of Management Journal,
36(5), 1140-1157. Cohen, J. (1988). Statistical power analysis for the behavioral sciences (2nd ed.). Hillsdale, NJ: Lawrence Erlbaum
Associates. Colbert, A. E., Barrick, M. R., & Bradley, B. H. (2014). Personality and leadership composition in top management
teams: Implications for organizational effectiveness. Personnel Psychology, 67(2), 351-387. doi: 10.1111/peps.12036
Coleman, P. T., & Kugler, K. G. (2014). Tracking managerial conflict adaptivity: Introducing a dynamic measure of adaptive conflict management in organizations. Journal of Organizational Behavior, 35(7), 945-968. doi: 10.1002/job.1935
Collins, C. J., Hanges, P. J., & Locke, E. A. (2004). The relationship of achievement motivation to entrepreneurial behavior: A meta-analysis. Human Performance, 17(1), 95-117.
Cone, J. (2013). Tolerating ambiguity in four simple steps. Interaction Associates. Retrieved from http://interactionassociates.com/insights/blog/tolerating-ambiguity-four-simple-steps#.Vj_I2ZV0zug
Connelly, M. S., Gilbert, J. A., Zaccaro, S. J., Threlfall, K. V., Marks, M. A., & Mumford, M. D. (2000). Exploring the relationship of leadership skills and knowledge to leader performance. The Leadership Quarterly, 11(1), 65-86.
Costa, P. T. & McCrae, R. R. (1988). Personality in adulthood: A six-year longitudinal study of self-reports and spouse ratings on the NEO Personality Inventory. Journal of Personality and Social Psychology, 54(5), 853.
Costa, P. T. & McCrae, R. R. (1992). Revised NEO Personality Inventory Manual. Odessa, FL: Psychological Assessment Resources Inc.
Costa, P. T., & McCrae, R. R. (1995). Domains and facets: Hierarchical personality assessment using the revised NEO personality inventory. Journal of Personality Assessment, 64, 2150.
Costa, P. T., McCrae, R. R., & Kay, G. G. (1995). Persons, places, and personality: Career assessment using the revised NEO personality inventory. Journal of Career Assessment, 3(2), 123-139. doi: 10.1177/106907279500300202
Korn Ferry’s Four Dimensional Executive Assessment • Research guide and technical manual
186 | © Korn Ferry 2015. All rights reserved.
Cottmeyer, M. (2011). Balance the system first [Blog]. Retrieved from http://www.leadingagile.com/2011/07/balance-the-system-first/
Crandell, S., Hazucha, J., & Orr, E. (2015). Precision talent intelligence: The definitive four dimensions of leadership talent (Report). Los Angeles, CA: Korn Ferry Institute.
Cullen, K. L., Edwards, B. D., Casper, W. C., & Gue, K. R. (2014). Employees’ adaptability and perceptions of change-related uncertainty: Implications for perceived organizational support, job satisfaction, and performance. Journal of Business and Psychology, 29(2), 269-280. doi: 10.1007/s10869-013-9312-y
Cyert, R. M., & March, J. G. (1963). A behavioral theory of the firm. Englewood Cliffs, NJ. Cziraki, P., & Xu, M. (2014, October). CEO job security and risk-taking (No. dp729). Financial Markets Group. Dagley, G. R. (2013). Executive presence: Influence beyond authority. Australian Human Resources Institute.
1-17. Retrieved from https://workingwithourselves.files.wordpress.com/2009/03/executive-presence-report-g-dagley-2013.pdf
Dai, G. (2007). Self-other agreement on leadership competency ratings: The moderating effects of rater perspectives and rating ambiguity. Minneapolis, MN: Lominger Limited, Inc.
Dai, G., De Meuse, K. P., & Tang, K. (2013). The role of learning agility in executive career success: The results of two field studies. Journal of Managerial Issues, 25(2), 108-131.
Dane, E. (2011). Paying attention to mindfulness and its effects on task performance in the workplace. Journal of Management. 37(4), 997-1018.
Davies, S. E. (2012). Lower and higher order facets and factors of the interpersonal traits among the Big Five: Specifying, measuring, and understanding Extraversion and Agreeableness (Doctoral dissertation). Minneapolis, MN: University of Minnesota.
Deal, T. E., & Kennedy, A. A. (1982, 2000). Corporate cultures: The rites and rituals of corporate life. New York, NY: Perseus Books Publishing.
De Geus, A. (2002). The living company: Habits for survival in a turbulent business environment. Boston, MA: Harvard Business Press.
De Hoogh, A. H. B., Den Hartog, D. N., Koopman, P. L., Thierry, H., Van den Berg, P. T., Van der Weide, J. G., & Wilderom, C. P. M. (2005). Leader motives, charismatic leadership, and subordinates’ work attitude in the profit and voluntary sector. The Leadership Quarterly, 16(1), 17-38.
Delgado-García, J. B., De Quevedo-Puente, E., & Fuente-Sabate, J. M. (2010). The impact of ownership structure on corporate reputation: Evidence from Spain. Corporate Governance: An International Review, 18(6), 540-556.
Deluga, R. J. (1998). American presidential proactivity, charismatic leadership, and rated performance. The Leadership Quarterly, 9(3), 265-291.
Dembroski, T. M., MacDougall, J. M., & Musante, L. (1984). Desirability of control versus locus of control: Relationship to paralinguistics in the type A interview. Health Psychology, 3(1), 15-26. doi: 10.1037/0278-6133.3.1.15
De Meuse, K.P. (2011). What’s smarter than IQ? Learning agility. It’s No. 1—above intelligence and education—in predicting leadership success. New York, NY: Korn Ferry Institute.
De Meuse, K. P., Dai, G., & Hallenbeck, G. S. (2010). Learning agility: A construct whose time has come. Consulting Psychology Journal: Practice and Research 62(2), 119-30.
De Meuse, K. P., Dai, G., & Wu, J. (2011). Leadership skills across organizational levels: A closer examination. The Psychologist-Manager Journal, 14: 120–139.
Den Hartog, D. N., Van Muijen, J. J., & Koopman, P. L. (1997). Transactional versus transformational leadership: An analysis of the MLQ. Journal of Occupational and Organizational Psychology, 70, 19-34.
Denis, J. L., Langley, A., & Cazale, L. (1996). Leadership and strategic change under ambiguity. Organization Studies, 17(4): 673–99.
Depue, R. A., & Collins, P. F. (1999). Neurobiology of the structure of personality: Dopamine, facilitation of incentive motivation, and extraversion. Behavioral and Brain Sciences, 22, 491-569.
DeRue, D. S., Nahrang, J. D., Wellman, N., & Humphrey, S. E. (2011). Trait and behavioral theories of leadership: An integration and meta-analytic test of their relative validity. Personnel Psychology, 64, 7-25.
Korn Ferry’s Four Dimensional Executive Assessment • Research guide and technical manual
187 | © Korn Ferry 2015. All rights reserved.
De Smet, A., McGurk, M., & Vinson, M. (2009, August). Unlocking the potential of frontline managers. McKinsey Quarterly. Retrieved from http://jmgadmin.clearrocksolutions.com/content/recordedcalls/ebonyfagbuyi_7176/JMT_Unlocking%20the%20potential%20of%20frontline%20managers.pdf
Dickinson-Delaporte, S., Beverland, M., & Lindgreen, A. (2010). Building corporate reputation with stakeholders. European Journal of Marketing, 44(11), 1856-1874. doi: 10.1108/03090561011079918
D’Mello, S. (2015). Keys to success. Los Angeles, CA: Korn Ferry Institute. Drescher, M., Korsgaard, M. A., Welpe, I. M., Picot, A., & Wigand, R. T. (2012). The dynamics of shared
leadership: Building trust and enhancing performance. Journal of Applied Psychology, 99(5), 771-783. Dries, N., & Pepermans, R. (2012). How to identify leadership potential: Development and testing of a consensus
model. Human Resource Management, 51(3), 361-385. doi: 10.1002/hrm.21473 Driskell, J. E., & Salas, E. (1992). Collective behaviour and team performance, Human Factors, 34, 277-288. Driskell, J. E., Salas, E., & Hughes, S. (2010). Collective orientation and team performance: Development of an
individual differences measure. Human Factors, 52(2), 316-328. doi: 10.1177/0018720809359522 Duckworth, A. L., Peterson, C., Matthews, M. D., & Kelly, D. R. (2007). Grit: Perseverance and passion
for long-term goals. Journal of Personality and Social Psychology, 92(6), 10871101. doi: 10.1037/0022-3514.92.6.1087
Dudley, N. M., Orvis, K. A., Lebiecki, J. E., & Cortina, J. M. (2006). A meta-analytic investigation of conscientiousness in the prediction of job performance: Examining the intercorrelations and the incremental validity of narrow traits. Journal of Applied Psychology, 91(1), 40-57. doi: http://dx.doi.org/10.1037/0021-9010.91.1.40
Duggan, T. (2015). The implication of transactional leadership style. Retrieved from: http://smallbusiness.chron.com/implication-transactional-leadership-style-10265.html
Dwyer, F. R., & Walker, Jr., O. C. (1981). Bargaining in an asymmetrical power structure. The Journal of Marketing, 45(1), 104-115.
Eaton, D. (2015). Making the shift: Leading first with who we are, not what we do. People + Strategy, 38(3), 2-5. Edin, P., Lingqvist, O., & Tamsons, A. (2012, July 26). The best sales leaders are trend hunters. Harvard Business
Review Blog Network. Retrieved from https://hbr.org/2012/07/sales-is-all-about-hitting/ Edwards, J. R. (1991). Person-job fit: A conceptual integration, literature review, and methodological critique. In
C. L. Cooper & I. T. Robertson (Eds.), International review of individual and organizational psychology (Vol. 6, pp. 283-357). New York, NY: Wiley.
Engaged employees tend to be happier. (2014, Jan. 30). The Charlotte Post. Retrieved from http://ezproxy.middlebury.edu/login?url=http://search.proquest.com/docview/1497398291?accountid=12447
Ericsson, K. A., & Charness, N. (1994). Expert performance: Its structure and acquisition. American Psychologist, 49(8), 725-747. doi: 10.1037/0003-066X.49.8.725
Eskreis-Winkler, L., Shulman, E. P., Beal, S. A., & Duckworth, A. L. (2014). The grit effect: Predicting retention in the military, the workplace, school and marriage. Frontiers in Psychology, 5(36). doi: 10.3389/fpsyg.2014.00036
Everaert, P., Roy, I., & Kingdom, S. (2012). Cultivating “smart growth” leaders to outpace the global economy. New York, NY: Korn Ferry Institute.
Feldman, G., Hayes, A., Kumar, S., Greeson, J., Laurenceau, J. P. (2007). Mindfulness and emotion regulation: The development and initial validation of the Cognitive and Affective Mindfulness Scale-Revised (CAMS-R). Journal of Psychopathology and Behavioral Assessment, 29(3), 177-190.
Fiske, S. T. (1993). Controlling other people: The impact of power on stereotyping. American Psychologist, 48(6), 621-628. doi: 10.1037/0003-066X.48.6.621
Fleit, C., Hansen, P., & Butler, K. (2013). The agile CMO: Learning agility gives an edge to marketing executives who now operate in a world of constant change. New York, NY: Korn Ferry Institute.
Ford, R., Hobby, R., & Lees, A. (2000). The lessons of leadership: A comparison of head teachers in UL schools and senior executives in private enterprise. Hay Group. Retrieved from http://www.90days.co.nz/The_Lessons_of_Leadership.pdf
Forret, M. L., & Dougherty, T. W. (2001). Correlates of networking behavior for managerial and professional employees. Group & Organization Management, 26(3), 283-311. doi: 10.1177/1059601101263004
Korn Ferry’s Four Dimensional Executive Assessment • Research guide and technical manual
188 | © Korn Ferry 2015. All rights reserved.
Fracher, J. C., & Blick, K. A. (1973). Speed of motor conflict resolution as related to type of conflict and manifest anxiety. Journal of Psychology, 83(2), 277-285.
Fredrick, H., Mausner, B., & Snyderman, B. B. (1995). The motivation to work. New York, NY: John Wiley. Furnham, A., & Miller, T. (1997). Personality, absenteeism and productivity. Personality and Individual Differences,
23, 705-707. Galasso, A., & Simcoe, T. S. (2011). CEO overconfidence and innovation. Management Science, 57(8),
1469-1484. doi: 10.1287/mnsc.1110.1374 Gallo, A. (2010, November 15). How to get your idea approved. Harvard Business Review Blog Network. Retrieved
from https://hbr.org/2010/11/how-to-get-their-approval.html Gallo, A. (2011, February 1). Demystifying mentoring. Harvard Business Review Blog Network. Retrieved from
https://hbr.org/2011/02/demystifying-mentoring Gardner, J. (2011, August 31). Keep your team by keeping them learning. Business Insider. Gardner, W. L., Reithel, B. J., Cogliser, C. C., Walumbwa, F. O., & Foley, R. T. (2012). Matching personality and
organizational culture: Effects of recruitment strategy and the five-factor model on subjective person-organization fit. Management Communication Quarterly, 26, 585-622.
Gentry, W., Weber, T., Sadri, G. (2007). Empathy in the workplace: A tool for effective leadership. Center for Creative Leadership. Retrieved from http://insights.ccl.org/wp-content/uploads/2015/04/EmpathyInTheWorkplace.pdf
Georgia Perimeter College. (2011). Accountability and goal setting. Retrieved from http://www.gpc.edu/humanresources/sites/www.gpc.edu.humanresources/files/files/AccountabilityandGoalsetting.pdf
Gibson, C. B., & Birkinshaw, J. (2004). The antecedents, consequences, and mediating role of organizational ambidexterity. Academy of Management Journal, 47, 209-226.
Goff, M., & Ackerman, P. L. (1992). Personality-intelligence relations: Assessment of typical intellectual engagement. Journal of Educational Psychology, 84(4), 537-552. doi: 10.1037/0022-0663.84.4.537
Goffin, R. D., & Christiansen, N. D. (2003). Correcting personality tests for faking: A review of popular personality tests and an initial survey of researchers. International Journal of Selection and Assessment, 11(4), 340-344.
Goleman, D. (1995). Emotional intelligence. New York, NY: Bantam Books. Goleman, D. (1998). Working with emotional intelligence. New York, NY: Bantam Books. Goleman, D. (2000). Leadership that gets results. Harvard Business Review. Retrieved from
https://hbr.org/2000/03/leadership-that-gets-results Gonzalez-Roma, V., Peiro, J. M., & Tordera, N. (2002). An examination of the antecedents and moderator
influences of climate strength. Journal of Applied Psychology, 87(3), 465-473. Gopinath, R. (2014). Reduction of executive stress by development of emotional intelligence: A study with
reference to CMTS, BSNL, TN Circle. International Journal of Management Research and Development, 4(2), 23-40.
Goud, N. H. (2005). Courage: Its nature and development. Journal of Humanistic Counseling, Education and Development, 44(1), 102-116.
Grant, A. M., Gino, F., & Hofmann, D. A. (2011). Reversing the extraverted leadership advantage: The role of employee proactivity. Academy of Management Journal, 54(3), 528-550. doi: 10.5465/AMJ.2011.61968043
Gratton, L. (2010). The future of work. Business Strategy Review. 21(3), 16–23. Gratton, L., & Erickson, T. (2007). Eight ways to build collaborative teams. Harvard Business Review. Retrieved
from https://hbr.org/2007/11/eight-ways-to-build-collaborative-teams Greenhaus, J. H., & Beutell, N. J. (1985). Sources of conflict between work and family roles. Academy of
Management Review, 10, 76–88. Groysberg, B., McLean, A. N., & Nohria, N. (2006). Are leaders portable? Harvard Business Review, 84(5),
92-100. Guay, W., Taylor, D., & Xiao, J. (2014). Adapt or perish: Evidence of CEO adaptability to industry shocks [Working
paper]. University of Pennsylvania: The Wharton School. Retrieved from https://www.mccombs.utexas.edu/~/media/Files/MSB/Departments/Accounting/TARC/2014/dan_taylor_paper.pdf
Korn Ferry’s Four Dimensional Executive Assessment • Research guide and technical manual
189 | © Korn Ferry 2015. All rights reserved.
Guion, R.M. (1998). Assessment, measurement, and prediction for personnel decisions (pp. 135145). Mahwah, NJ: Lawrence Erlbaum Associates, Publishers.
Haasen, A., & Shea, G. F. (2003). New corporate cultures that motivate. Westport, CT: Praeger Publishers. Hackman, J. R., & Oldham, G. R. (1976). Motivation through the design of work: Test of a theory. Organizational
Behavior & Human Performance, 16(2), 250-279. Hagenaars, J. A., & McCutcheon, A. L. (Eds.). (2002). Applied latent class analysis. New York, NY: Cambridge
University Press. Haigh, E. A. P., Moore, M. T., Kashdan, T. B., & Fresco, D. M. (2011). Examination of the factor structure and
concurrent validity of the Langer Mindfulness/Mindlessness scale. Assessment, 18(1), 11-26. doi: 10.1177/1073191110386342
Hammerich, K., & Lewis, R. D. (2013). Fish can’t see water. West Sussex, UK: John Wiley & Sons, Ltd. Hannah, S. T., Avolio, B. J., Luthans, F., & Harms, P. S. (2008). Leadership efficacy: Review and future directions.
The Leadership Quarterly,19(6), 669-692. doi:10.1016/j.leaqua.2008.09.007 Haque, U. (2010, November 24). Making room for reflection is a strategic imperative. Harvard Business Review
Blog Network. Retrieved from https://hbr.org/2010/11/reflection-items-not-action-it/ Harms, P. D., & Credé, M. (2010). Emotional intelligence and transformational and transactional leadership: A
meta-analysis. Journal of Leadership & Organizational Studies, 17(1), 5-17. Harms, P. D., Roberts, B. W., & Wood, D. (2007). Who shall lead? An integrative personality approach to the study
of the antecedents of status in informal social organizations. Journal of Research in Personality, 41(3), 689-699. doi: 10.1016/j.jrp.2006.08.001
Harpaz, I., & Snir, R. (2015). Heavy work investment: Its nature, sources, outcomes, and future directions. New York, NY: Routledge.
Harter, J. K., Schmidt, F. L., Agrawal, S., & Plowman, S. K. (2013). The relationship between engagement at work and organizational outcomes: 2012 Q12 meta-analysis. Washington, DC: Gallup Inc.
Harter, J. K., Schmidt, F. L., & Hayes, T. L. (2002). Business-unit-level relationship between employee satisfaction, employee engagement, and business outcomes: A meta-analysis. Journal of Applied Psychology, 87(2), 268-279.
Harter, J.K., Schmidt, F. L., Kilham, E.A., & Agrawal, S. (2009). Q12 Meta-analysis: The relationship between engagement at work and organizational outcomes. USA: Gallup Inc.
Hartman, R. O. (2006). The five-factor model and career self-efficacy: General and domain-specific relationships (Doctoral dissertation). Ohio State University. Columbus, OH.
Hartnell, C. A., Ou, A. Y., & Kinicki, A. (2011). Organizational culture and organizational effectiveness: A meta-analytic investigation of the competing values framework’s theoretical suppositions. Journal of Applied Psychology, 96(4), 677-694.
Hayes, S., Bond, F., & Barnes-Holmes, D. (2006). Acceptance and mindfulness at work: Applying acceptance and commitment therapy and relational frame theory to organizational behavior management. Binghamton, NY: Haworth Press.
Heaney, R. (2005). Executive valuation of simple compensation packages: The interaction of risk aversion, leverage and volatility, Managerial Finance, 31(7), 90108.
Heggestad, E. D., Morrison, M., Reeve, C. L., & McCloy, R. A. (2006). Forced-choice assessments of personality for selection: Evaluating issues of normative assessment and faking resistance. Journal of Applied Psychology, 91(1), 9-24. doi: 10.1037/0021-9010.91.1.9
Heritage, B., Pollock, C., & Roberts, L. (2014). Validation of the organizational culture assessment instrument. PLoS ONE, 9(3): doi: 10.1371/journal.pone.0092879
Higgins, E. T. (1997). Beyond pleasure and pain. American Psychologist, 52, 1280–1300. Higgins, J. M., & McAllaster, C. (2004). If you want strategic change, don’t forget to change your artifacts. Journal
of Change Management, 4(1), 63-73. Hiller, N. J., DeChurch, L. A., Murase, T., & Doty, D. (2011). Searching for outcomes of leadership: A 25-year
review. Journal of Management, 37(4), 1137-1177. doi: 10.1177/0149206310393520 Hodgins, H. S., & Knee, C. R. (2002). The integrating self and conscious experience. Handbook of self-
determination research (pp. 87-100). Rochester, NY. University of Rochester Press.
Korn Ferry’s Four Dimensional Executive Assessment • Research guide and technical manual
190 | © Korn Ferry 2015. All rights reserved.
Hogan, R. (1983). A socioanalytic theory of personality. In M. M. Page (Ed.), 1982 Nebraska symposium on motivation (pp. 55-89). Lincoln, NE: University of Nebraska Press.
Hogan, R., & Hogan, J. (2009a). Hogan developmental survey overview guide. Tulsa, OK: Hogan Assessment Systems.
Hogan, R., & Hogan, J. (2009b). Hogan personality inventory overview guide. Tulsa, OK: Hogan Assessment Systems Inc.
Hogan, R., & Warrenfeltz, W. (2003). Educating the modern manager. Academy of Management Learning and Education, 2, 74-84.
Holden, J. E., Kelley, K., & Agarwal, R. (2008). Analyzing change: A primer on multilevel models with applications to nephrology. American Journal of Nephrology, 28(5), 792-801.
Holland, J. L. (1959). A theory of vocational choice. Journal of Counseling Psychology, 6, 35-45. Holland, J. L. (1973). Making vocational choices. Englewood Cliffs, NJ: Prentice-Hall. Holstein, D. (2015). Leaders need to show empathy during an organizational change. Retrieved from
http://www.business2community.com/leadership/leaders-need-show-empathy-organizational-change-01321200#XZE5VqMi5ft8lPFh.97
Hough, L. M. (1992). The “Big Five” personality variables—construct confusion: Description versus prediction. Human Performance, 5(1-2), 139-155.
Hough, L. M., & Ones, D. S. (2001). The structure, measurement, validity, and use of personality variables in industrial, work, and organizational psychology. In N. Anderson, D. S. Ones, H. K. Sinangil, & C. Viswesvaran (Eds.), Handbook of industrial, work & organizational psychology: Volume 1: Personnel Psychology (pp. 233-277). London: Sage.
Hough, L.M., Ones, D.S., & Viswesvaran, C. (1998). Personality correlates of managerial performance constructs. In R.C. Page (Chair), Personality determinants of managerial potential: Performance, progression and ascendancy. Symposium conducted at the 13th Annual Convention of the Society for Industrial and Organizational Psychology, Dallas, TX.
Hough, L. M., Oswald, F. L., & Ployhart, R. E. (2001). Determinants, detection and amelioration of adverse impact in personnel selection procedures: Issues, evidence and lessons learned. International Journal of Selection and Assessment, 9(1-2), 152-194.
Houlfort, N., Philippe, F.L., Vallerand, R.J., & Ménard, J. (2014). On passion and heavy work investment: Personal and organizational outcomes. Journal of Managerial Psychology, 29(1), 25-45.
Houlfort, N., & Rinfret, N. (2010). Favoriser la satisfaction au travail des directeurs généraux du réseau de la santé et des services sociaux: Impact du style de leadership adopté et dela passion envers le travail. Dans B. Raveleau et F. Ben Hassel (Eds). Management humain des organisations: grandeurs et misères de la fonction de dirigeant. Éditions L’Harmattan.
Houlfort, N., Vallerand, R. J., & Koestner, R. (2013). On the organizational and interpersonal determinants of passion [Manuscript in preparation].
Houlfort, N., Vallerand, R. J., & Laframboise, A. (2015). Heavy work investment: The role of passion. In I. Harpaz & R. Snir (Eds.), Heavy work investment: Its nature, sources, outcomes, and future directions. (pp. 47-67) New York, NY: Routledge.
House, R. J. (1977). A 1976 theory of charismatic leadership. Faculty of Management Studies, University of Toronto.
House, R. J., Shane, S. A., & Herold, D. M. (1996). Rumors of the death of dispositional research are vastly exaggerated. Academy of Management Review, 21, 203-224.
House, R. J., Spangler, W. D., & Woycke, J. (1991). Personality and charisma in the U.S. presidency: A psychological theory of leader effectiveness. Administrative Science Quarterly, 36(3), 364-396.
Howard, A., & Bray, D. (1988). Managerial lives in transition: Advancing age and changing times. New York, NY: Guilford Press.
Howard, L. W. (1998). Validating the competing values model as a representation of organizational cultures. The International Journal of Organizational Analysis, 6(3), 231250.
Howe, M. J. A. (1999). Genius explained. New York, NY: Cambridge University Press. Hurtz, G. M., & Donovan, J. J. (2000). Personality and job performance: The Big Five revisited. Journal of Applied
Psychology,85(6), 869-879. doi: /10.1037/0021-9010.85.6.869
Korn Ferry’s Four Dimensional Executive Assessment • Research guide and technical manual
191 | © Korn Ferry 2015. All rights reserved.
ILC Partners. (2014). Most desired trait by companies seeking senior executives is ability to motivate and lead others. Retrieved from http://iicpartners.com/media-centre/most-desired-trait-by-companies-seeking-senior-exe/
Ingram, D. (2015). Transformational leadership vs. transactional leadership definition. Retrieved from http://smallbusiness.chron.com/transformational-leadership-vs-transactional-leadership-definition-13834.html
Jablin, F. M. (2006). Courage and courageous communication among leaders and followers in groups, organizations, and communities. Management Communication Quarterly: McQ, 20(1), 94-110.
Jacobs, C., Pfaff, H., Lehner, B., Driller, E., Nitzsche, A., Stieler-Lorenz, B., Wasem, J., & Jung, J. (2013). The influence of transformational leadership on employee well-being: Results from a survey of companies in the information and communication technology sector in Germany. Journal of Occupational and Environmental Medicine, 55(7), 772-778.
Janis, I. L. (1982). Groupthink: Psychological studies of policy decisions and fiascoes (2nd ed.). Boston, MA: Houghton Mifflin.
Jaruzelski, B., Loehr, J., & Holman, R. (2011). The global innovation 1000: Why culture is key. Strategy + Business. Retrieved from http://www.strategy-business.com/
Johnson, A. (2008). The influence of need for achievement, need for affiliation, leadership support, and organizational culture on organizational citizenship behavior (Doctoral dissertation). Retrieved from http://ezproxy.middlebury.edu/login?url=http://search.proquest.com/docview/621756489?accountid=12447 (Order No. AAI3317760).
Johnson, J. W., & Carter, G. W. (2010). Validating synthetic validation: Comparing traditional and synthetic validity coefficients. Personnel Psychology, 63(3), 755-795.
Johnson, N. (2007). Self report measures of mindfulness: A review of the literature. (Master’s thesis, Pacific University). Retrieved from http://commons.pacificu.edu/cgi/viewcontent.cgi?article=1145&context=spp
Judge, T. A., & Bono, J. E. (2000). Five-factor model of personality and transformational leadership. Journal of Applied Psychology, 85(5), 751-765. doi: 10.1037/0021-9010.85.5.751
Judge, T. A., Bono, J. E., Ilies, R., & Gerhardt, M. W. (2002). Personality and leadership: A qualitative and quantitative review. Journal of Applied Psychology, 87, 765-780. doi: 10.1037//0021-9010.87.4.765
Judge, T. A., Colbert, A. E., & Ilies R. (2004). Intelligence and leadership: A quantitative review and test of theoretical propositions. Journal of Applied Psychology, 89(3),542-552. doi: 10.1037/0021-9010.89.3.542
Judge, T. A., Heller, D., & Mount, M. K. (2002). Five-factor model of personality and job satisfaction: A meta-analysis. Journal of Applied Psychology, 87, 530 –541.
Judge, T. A., Martocchio, J. J., & Thoresen, C. J. (1997). Five-factor model of personality and employee absence. Journal of Applied Psychology, 82, 745-755.
Judge, T. A., & Piccolo, R. F. (2004). Transformational and transactional leadership: A meta-analytic test of their relative validity. Journal of Applied Psychology, 89(5), 755-768.
Judge, T. A., Thoresen, C. J., Pucik, V., & Welbourne, T. M. (1999). Managerial coping with organizational change: A dispositional perspective. Journal of Applied Psychology, 84(1), 107-122. doi: 10.1037/0021-9010.84.1.107
Judiesch, M. K., & Lyness, K. S. (1999). Left behind? The impact of leaves of absence on managers’ career success. Academy of Management Journal, 42, 641–651.
Kaiser, H. F. (1960). The application of electronic computers to factor analysis. Educational and Psychological Measurement, 20, 141-151.
Kaler, M. (2007). Myers-Briggs type indicator. In N. Salkind (Ed.), Encyclopedia of measurement and statistics. (pp. 676-678). Thousand Oaks, CA: SAGE Publications, Inc. doi: 10.4135/9781412952644.n305
Kalliath, T. J., Bluedorn, A. C., & Gillespie, D. F. (1999). A confirmatory factor analysis of the competing values instrument. Educational and Psychological Measurement, 59, 143158.
Kanfer, R. (1990). Motivation theory and industrial and organizational psychology. In M. D. Dunnette & L. M. Hough (Eds.), Handbook of industrial and organizational psychology (pp. 75-170). Palo Alto, CA: Consulting Psychologists Press, Inc.
Kantor, S., Kram, K. E., & Sala, F. (2008). Change factor: Making the case for executive adaptability. Leadership in Action. 27(6), 8–12.
Karaevli, A., & Zajac, E. J. (2013). When is an outsider CEO a good choice. MIT Sloan Management Review, 53(4), 15-17.
Korn Ferry’s Four Dimensional Executive Assessment • Research guide and technical manual
192 | © Korn Ferry 2015. All rights reserved.
Kark, R., Shamir, B., & Chen, G. (2003). The two faces of transformational leadership: Empowerment and dependency. Journal of Applied Psychology, 88(2), 246-255.
Kass, R. E., & Raftery, A. E. (1995). Bayes factors. Journal of the American Statistical Association, 90(430), 773-795.
Katzenbach , J., & Leinwand, P. (2015). Culture eats strategy for breakfast [Webinar]. Retrieved from http://www.strategyand.pwc.com/media/file/Katzenbach-Center_Webinar_Culture-Eats-Strategy-for-Breakfast.pdf
Kegan, R. (1982). The evolving self: Problem and process in human development. Cambridge, MA: Harvard University Press.
Kerns, C. D. (2014). Fostering and managing engagement: A framework for managerial leaders. Journal of Leadership, Accountability and Ethics, 11(1), 34-49.
King, J. E., & Figueredo, A. J. (1997). The five-factor model plus dominance in chimpanzee personality. Journal of Research in Personality, 31(2), 257-271.
Kirkpatrick, S. A., & Locke, E. A. (1966). Direct and indirect effects of three core charismatic leadership components on performance and attitudes. Journal of Applied Psychology, 81(1), 36-51.
Kirkpatrick, S. A., & Locke, E. A. (1991). Leadership: Do traits matter? Academy of Management Executive, 5(2), 48-60.
Kirkpatrick, S. A., & Locke, E. A. (1996). Direct and indirect effects of three core charismatic leadership components on performance and attitudes. Journal of Applied Psychology, 81, 36-51.
Kirschkamp, A. (2007). A contingency-based view of chief executive officers’ early warning behavior: An empirical analysis of German medium-sized companies. Deutscher Universitäts-Verlag | Gabler (GWV) Fachverlage GmbH, Wiesbaden.
Kokemuller, N. (2015). Transformational leadership vs. situational leadership. Demand Media. Retrieved from http://smallbusiness.chron.com/transformational-leadership-vs-situational-leadership-18819.html
Kooij, D. T., De Lange, A. H., Jansen, P. G. W., Kanfer, R., & Dikkers, J. S. (2011). Age and work-related motives: Results of a meta-analysis. Journal of Organizational Behavior, 32(2), 197-225.
Korn Ferry (2014a). Korn Ferry Leadership Architect®: Research guide and technical manual. Los Angeles: CA. Author.
Korn Ferry (2014b). FYI® for your improvement: Competencies development guide. Minneapolis, MN: Author. Korn Ferry (2015). Korn Ferry Assessment of Leadership Potential: Research guide and technical manual. Los
Angeles: CA. Author. Kotter, J. P. (1990, May). What leaders really do. Harvard Business Review, 68(3), 103-111. Kotter, J. P., & Heskett, J. L. (1992). Corporate culture and performance. New York, NY: The Free Press. Kozlowski, S. W., Gully, S. M., Brown, K. G., Salas, E., Smith, E. M., & Nason, E. R. (2001). Effects of training
goals and goal orientation traits on multidimensional training outcomes and performance adaptability. Organizational Behavior and Human Decision Processes, 85(1), 1-31.
Kreft, I. G., Kreft, I., & de Leeuw, J. (1998). Introducing multilevel modeling. Sage. Kristof, A. L. (1996). Person-organization fit: An integrative review of its conceptualizations, measurement, and
implications. Personnel Psychology, 49, 1-49. Kristof-Brown, A. L., & Guay, R. P. (2011). Person-environment fit. In S. Zedeck (Ed.), APA handbook of industrial
and organizational psychology (Vol. 3, pp. 3-50). Washington, DC: American Psychological Association. Kristof-Brown, A. L., Zimmerman, R. D., & Johnson, E. C. (2005). Consequences of individuals’ fit at work: A meta-
analysis of person–job, person–organization, person–group, and person–supervisor fit. Personnel Psychology, 58, 281–342.
Kruse, K. (2012). Employee engagement 2.0: How to motivate your team for high performance (A real-world guide for busy managers). Richboro, PA: The Kruse Group.
Kuhnert, K.W., & Lewis, P. (1987). Transactional and transformational leadership: A constructive/developmental analysis. Academy of Management Journal, 12, 648-657.
Kumar, A., & Meenakshi, N. (2009). Organisational behavior. New Dehli: Vikas Publishing House Pvt Ltd.
Korn Ferry’s Four Dimensional Executive Assessment • Research guide and technical manual
193 | © Korn Ferry 2015. All rights reserved.
Kumar, S., Feldman, G., & Hayes, A. (2008). Changes in mindfulness and emotion regulation in an exposure-based cognitive therapy for depression. Cognitive Therapy and Research, 32(6), 734-744. doi: 10.1007/s10608-008-9190-1
Lamm, E., Gordon, J. R., & Purser, R. E. (2010). The role of value congruence in organizational change. Organization Development Journal, 28(2), 49-64.
Landers, P. (2003, November 24). Back to basics: With dry pipelines, big drug makers stock up in Japan. The Wall Street Journal, pp. A1, A7.
Landis, D., Brousseau, K., & Johnson, P. (2011). Pre-hiring assessment improves the talent pipeline. New York, NY: Korn Ferry Institute.
Langelett, G. (2014). How do I keep my employees motivated? The practice of empathy-based management. Austin, TX: River Grove Books.
Langer, E. J. (2009). Counterclockwise: Mindful health and the power of possibility. New York, NY: Ballantine Books.
Laplume, A. O., & Dass, P. (2012). Exploration and exploitation for various stages of firm growth through diversification. Paper presented at the annual meetings of the Academy of Management in Boston.
Larsen, R. J., & Ketelaar, T. (1989). Extraversion, neuroticism and susceptibility to positive and negative mood induction procedures. Personality and Individual Differences, 10(12), 1221-1228.
Larson, L., & Borgen, F. (2002). Convergence of vocational interests and personality: Examples in an adolescent gifted sample. Journal of Vocational Behavior, 60, 91-112.
Lauver, K. J., & Kristof-Brown, A. (2001). Distinguishing between employees’ perceptions of person-job and person-organization fit. Journal of Vocational Behavior, 59(3), 454-470.
Lavoie, A. (2013, October 7). Ignoring this issue could ruin your company. CEO. Retrieved from http://www.ceo.com/leadership_and_management/ignoring-this-issue-could-ruin-your-company/
Lazarus, R. S. (1999). Stress and emotion: A new synthesis. New York, NY: Springer Publishing Co. Leadership-Central.com. (2010-2015). Hersey-Blanchard Situational Leadership Theory. Leadership-Central.com.
Retrieved from http://www.leadership-central.com/situational-leadership-theory.html#axzz3g6JAvVra Lee, D. Y., & Tsang, E. W. K. (2001). The effects of entrepreneurial personality, background and network activities
on venture growth. The Journal of Management Studies, 38(4), 583602. Lee, R. A. (2012). Accelerating the development and mitigating derailment of high potential through mindfulness
training. The Industrial-Organizational Psychologist, 49(3), 23-34. Lee, S., & Xie, Y. (2006). Organizational size and IT innovation adoption: A meta-analysis. Information &
Management, 43(8), 975-985. Leigh, A., & Maynard, M. (2012). Leading the way: The seven skills to engage, inspire and motivate [Kindle
edition]. FT Publishing International. Lewicki, R. J., Saunders, D. M., & Barry, B. (2005). Negotiation (5th ed.). McGraw-Hill Higher Education. Lewin, A. Y., & Stephens, C. U. (1994). CEO attitudes as determinants of organization design: An integrated
model. Organization Studies, 15(2), 183-212. doi: 10.1177/017084069401500202 Lewin, K. (1951). Formalization and progress in psychology. In D. Cartwright (Ed.), Field theory in social science:
Selected theoretical papers by Kurt Lewis (pp. 1-29). New York, NY: Harper & Row. Lewis, J. (2012). Model-based best-in-class profiling with Decision Styles: An overview and technical report.
[Internal technical document available by request]. Los Angeles, CA: Korn Ferry International: Lewis, J. (2013). Leadership that drives profits: Management teams with two pivotal attributes are linked to 25
percent higher profit margins. New York, NY: Korn Ferry Institute. Lewis, J. (2015). When is high IQ a liability for an executive? Los Angeles, CA: Korn Ferry Institute. Lewis, J., & Landis, D. (2015). Big data and advanced analytics: Making search more precise. Korn Ferry Briefings.
New York, NY: Korn Ferry Institute. Lewis, J. L., & Ream, R. K. (2012). The criterion-related validity of the Decision Styles assessment. Los Angeles,
CA: Korn Ferry International. Liu, D., Chen, X., & Yao, X. (2011). From autonomy to creativity: A multilevel investigation of the mediating role of
harmonious passion. Journal of Applied Psychology, 96(2), 294-309. doi: http://dx.doi.org/10.1037/a0021294
Korn Ferry’s Four Dimensional Executive Assessment • Research guide and technical manual
194 | © Korn Ferry 2015. All rights reserved.
Llopis, G. (2013, November 4). The 4 most effective ways leaders solve problems. Forbes. Retrieved from http://www.forbes.com/sites/glennllopis/2013/11/04/the-4-most-effective-ways-leaders-solve-problems/
Llopis, G. (2014). 7 ways leaders maintain their composure in difficult times. Forbes. Retrieved from: http://www.forbes.com/sites/glennllopis/2014/01/20/7-ways-leaders-maintain-their-composure-in-difficult-times/
Locke, E. A. (1978). The ubiquity of the techniques of goal setting in the theories and approaches to employee motivation. Academy of Management Review, 3, 594-601.
Locke, E. A. (1996). Motivation through conscious goal setting. Applied & Preventive Psychology, 5(2), 117-124. Retrieved from http://ezproxy.middlebury.edu/login?url=http://search.proquest.com/docview/618841583?accountid=12447
Lombardi, M. (2011). Assessments 2011: Selecting and development for the future. Boston, MA: Aberdeen Group. Lombardo, M. M., & Eichinger, R. W. (2000). High potentials as high learners. Human Resource Management,
39(4), 321-329. Lombardo, M. M., & Eichinger, R. W. (2009). FYI® for your improvement: A guide for development and coaching
(5th ed.) Minneapolis, MN: Korn Ferry International. Lominger International. (2007). Choices architect technical manual (2nd ed.). Minneapolis, MN: Author. Lowe, K. B., Kroeck, K. G., & Sivasubramanian, N., (1996). Effectiveness of correlates of transformational and
transactional leadership: A meta analytic review of the MLQ literature. Leadership Quarterly, 7(3), 385-425. Lyness, K. S., & Judiesch, M. K. (2008). Can a manager have a life and a career? International and multisource
perspectives on work-life balance and career advancement potential. Journal of Applied Psychology, 93(4), 789-805.
MacCrimmon, K. R., & Wehrung, D. A. (1990). Characteristics of risk taking executives. Management Science, 36(4), 422-435. Retrieved from http://ezproxy.middlebury.edu/login?url=http://search.proquest.com/docview/213167251?accountid=12447
Mageau, G. A., Vallerand, R. J., Charest, J., Salvy, S., Lacaille, N., Bouffard, T., & Koestner, R. (2009). On the development of harmonious and obsessive passion: The role of autonomy support, activity specialization, and identification with the activity. Journal of Personality, 77(3), 601-646. doi: 10.1111/j.1467-6494.2009.00559.x
Magee, J. C., & Galinsky, A. D. (2008). Social hierarchy: The self-reinforcing nature of power and status. The Academy of Management Annals, 2(1), 351-398.
Magee, J. C., Galinsky, A. D., & Gruenfeld, D. H. (2007). Power, propensity to negotiate, and moving first in competitive interactions. Personality and Social Psychology Bulletin, 33(2), 200-212.
Mann, R. D. (1959). A review of the relationships between personality and performance in small groups. Psychological Bulletin, 56(4), 241-270. doi: 10.1037/h0044587
March, J. G. (1991). Exploration and exploitation in organizational learning. Organization Science, 2, 71-87. Marinova, S. V., Moon, H., & Kamdar, D. (2013). Getting ahead or getting along? The two-facet conceptualization
of conscientiousness and leadership emergence. Organization Science, 24(4), 1257-1276. doi: 10.1287/orsc.1120.0781
Markos, S., & Sridevi, M. S. (2010). Employee engagement: The key to improving performance. International Journal of Business and Management, 5(12), 89.
Martin, J., & Siehl, C. (1983). Organizational culture and counterculture: An uneasy symbiosis. Organizational Dynamics, 122, 52-65
Martinuzzi, B. (2014). The agile leader: Adaptability. Mind Tools. Retrieved from http://www.mindtools.com/pages/article/newLDR_49.htm
Maslow, A. H. (1954). Motivation and personality. New York, NY: Harper & Row. Maslow, A. H. (1959). New knowledge in human values. New York, NY: Harper & Row. May, K. (1996). Work in the 21st century: Implications for job analysis. The Industrial and Organizational
Psychologist, 33(4), 98-100. Maydeu-Olivares, A., Hernández, A., & McDonald, R. P. (2006). A multidimensional ideal point item response
theory model for binary data. Multivariate Behavioral Research, 41(4), 445-472. McAlister, L., Bazerman, M. H., & Fader, P. (1986). Power and goal setting in channel negotiations. Journal of
Marketing Research, 23(3), 228-236.
Korn Ferry’s Four Dimensional Executive Assessment • Research guide and technical manual
195 | © Korn Ferry 2015. All rights reserved.
McCarthy, P. (2002). Brief history outline of I/O psychology. Retrieved from http://frank.mtsu.edu/~pmccarth/io_hist.htm
McClelland, D. C. (1961). The achieving society. Princeton, NJ: D. Van Nostrand. McClelland, D. C. (1965). Toward a theory of motive acquisition. American Psychologist, 20, 321333. McClelland, D. C., & Boyatzis, R. (1982). Leadership motive pattern and long-term success in management.
Journal of Applied Psychology, 67(6), 737-743. McClelland, D.C., & Burnham, D. H., (1976). Power is the great motivator. Harvard Business Review, 54, 100-110. McCourt, W., & Eldridge, D. (2003). Global human resource management: Managing people in developing and
transitional countries. Northhampton, MA: Edward Elger Publishing. McCrae, R. R., & Costa, P. T. (1983). Social desirability scales: More substance than style. Journal of Consulting
and Clinical Psychology, 51(6), 882-888. doi: 10.1037/0022-006X.51.6.882 McCrae, R. R., & Costa, P. T. (1987). Validation of the 5-factor model of personality across instruments and
observers. Journal of Personality and Social Psychology, 52, 81-90. Merrett, R. (2012, July 31). Want project success? Engage stakeholders. CIO Magazine. Retrieved from
http://www.cio.com.au/article/432205/want_project_success_engage_stakeholders/ Miller, D., & Dröge, C. (1986). Psychological and traditional determinants of structure. Administrative Science
Quarterly, 31(4), 539-560. Miller, D., Kets de Vries, M. F., & Toulouse, J. (1982). Top executive locus of control and its relationship to
strategy-making structure, and environment. Academy of Management Journal, 25(2), 237-253. Mind Tools. (n.d.). Helping people take responsibility. Mind Tools. Retrieved from
http://www.mindtools.com/pages/article/taking-responsibility.htm Moon, H. (2001). The two faces of conscientiousness: Duty and achievement striving in escalation of commitment
dilemmas. Journal of Applied Psychology, 86(3), 533-540. doi: 10.1037/0021-9010.86.3.535 Mosier, C. I. (1943). On the reliability of a weighted composite. Psychometrika, 8(3), 161-168. Mount, M., K., & Barrick, M. R. (1995). The Big Five personality dimensions: Implications for research and practice
in human resource management. Research in Personnel and Human Resources Management, 13, 153-200. Moutafi, J., Furnham, A., & Paltiel, L. (2005). Can personality factors predict intelligence? Personality and
Individual Differences, 38(5), 1021-1033. doi: 10.1016/j.paid.2004.06.023 Murphy, P. A. (2013, March 18). Four ways to give good feedback. Time. Muthén, L. K., & Muthén, B. O. (2010). Mplus user’s guide (6th ed.). Los Angeles, CA: Muthén & Muthén. Myers, A. (2013). Top performing companies have executives who collaborate the most with IT. CMS Wire.
Retrieved from http://www.cmswire.com/cms/social-business/top-performing-companies-have-executives-who-collaborate-the-most-with-it-019648.php
Nadkarni, S., & Barr, P. S. (2008). Environmental context, managerial cognition, and strategic action: An integrated view. Strategic Management Journal, 29(13), 1395-1427. doi: http://dx.doi.org/10.1002/smj.717
Nadkarni, S., & Herrmann, P. (2010). CEO personality, strategic flexibility, and firm performance: The case of the Indian business process outsourcing industry. Academy of Management Journal, 53(5), 1050-1073. doi: 10.5465/AMJ.2010.54533196
Neisser, U., Boodoo, G., Bouchard, T. J., Jr., Boykin, A. W., Brody, N., Ceci, S. J., Halpern, D. F., Loehlin, J. C., Perloff, R., Sternberg, R. J., & Urbina, S. (1996). Intelligence: Knowns and unknowns. American Psychologist, 51(2), 77-101. doi: 10.1037/0003-066X.51.2.77
Ng, K. Y., Ang, S., & Chan, K. Y. (2008). Personality and leader effectiveness: A moderated mediation model of leadership self-efficacy, job demands, and job autonomy. Journal of Applied Psychology, 93(4), 733. doi: 10.1037/0021-9010.93.4.733
Northouse, P. G. (1997). Leadership: Theory and practice. Thousand Oaks, CA: Sage Publications, Inc. Nylund, K. L., Asparouhov, T., & Muthén, B. O. (2007). Deciding on the number of classes in latent class analysis
and growth mixture modeling: A Monte Carlo simulation study. Structural Equation Modeling, 14(4), 535-569. O’Connor, M. C., & Paunonen, S. V. (2007). Big Five personality predictors of post-secondary academic
performance. Personality and Individual Differences, 43(5), 971-990. doi: 10.1016/j.paid.2007.03.017 Oke, A., Munshi, N., & Walumbwa, F. O. (2009). The influence of leadership on innovation processes and
activities. Organizational Dynamics, 38(1), 64.
Korn Ferry’s Four Dimensional Executive Assessment • Research guide and technical manual
196 | © Korn Ferry 2015. All rights reserved.
Oldham, G. R., & Cummings, A. (1996). Employee creativity: Personal and contextual factors at work. Academy of Management Journal, 39(3), 607-634.
Ones, D. S., Dilchert, S., Viswesvaran, C., & Judge, T. A. (2007). In support of personality assessment in organizational settings. Personnel Psychology, 60(4), 995-1027. doi: 10.1111/j.1744-6570.2007.00099.x
O’Reilly, C. A., Caldwell, D. F., Chatman, J. A., & Doerr, B. (2014). The promise and problems of organizational culture: CEO personality, culture, and firm performance. Group & Organization Management, 39(6), 595-625.
O’Reilly, C., Chatman, J., & Caldwell, D. (1991). People and organizational culture: A profile comparison approach to assessing person-organization fit. Academy of Management Journal, 34, 487-516.
O’Reilly, C. A., & Tushman, M. L. (2013). Organizational ambidexterity: Past, present, and future. Academy of Management Perspectives, 27(4), 324-338.
Orr, J. (2012). Becoming an agile leader: A guide to learning from your experiences. New York, NY: Korn Ferry Institute.
Orr, J. E., & Sack, K. (2009). Setting the stage for success: Building the leadership skills that matter [White paper]. Minneapolis, MN: Korn Ferry International.
Ouchi, W. G. (1981). Theory Z: How American business can meet the Japanese challenge. Reading, MA: Addison-Wesley.
Pajares, F. (1996). Self-efficacy beliefs in academic settings. Review of Educational Research, 66(4), 543-578. Pajares, F. (1997). Current directions in self-efficacy research. In M. Maehr & P. R. Pintrich (Eds.), Advances in
motivation and achievement (Vol. 10, pp. 1-49). Greenwich, CT: JAI Press. Pajares, F., & Miller, M. D. (1994). Role of self-efficacy and self-concept beliefs in mathematical problem solving: A
path analysis. Journal of Educational Psychology, 86(2), 193-203. Pajares, F., & Miller, M. D. (1995). Mathematics self-efficacy and mathematics performances: The need for
specificity of assessment. Journal of Counseling Psychology, 42(2), 190-198. Palazzo, G., & Basu, K. (2007). The ethical backlash to corporate branding. Journal of Business Ethics, 73,
333-46. Papadakis, V., & Bourantas, D. (1998). The chief executive officer as corporate champion of technological
innovation: An empirical investigation. Technology Analysis & Strategic Management, 10(1), 89-109. Parks, L., & Guay, R. P. (2009). Personality, values, and motivation. Personality and Individual Differences, 47(7),
675-684. Parry, K. W., & Proctor-Thomson, S. B. (2002). Perceived integrity of transformational leaders in organisational
settings. Journal of Business Ethics, 35(2), 75-96. Pascale, R. T., Millemann, M., & Gioja, L. (1997). Changing the way we change. Harvard Business Review, 75(6),
127-139. Passmore , J. (2007). An integrative model for executive coaching. Consulting Psychology Journal: Practice and
Research, 59(1), 68-78. Passmore, J., & Marianetti, O. (2007, Dec). The role of mindfulness in coaching. The Coaching Psychologist, 3(3),
130-136. Pavic, I., & Vojinic, P. (2012). The influence of demographical and professional characteristics on managers’ risk-
taking propensity. Advances in Management and Applied Economics, 2(4), 171-184. Pett, M. A., Lackey, N. R., & Sullivan, J. J. (2003). Making sense of factor analysis: The use of factor analysis for
instrument development in health care research. Sage. Philippe, F. L., Vallerand, R. J., Houlfort, N., Lavigne, G. L., & Donahue, E. G. (2010). Passion for an activity and
quality of interpersonal relationships: The mediating role of emotions. Journal of Personality and Social Psychology, 98(6), 917-932. doi: 10.1037/a0018017
Phillips, R. (2004). Some key questions about stakeholder theory. Ivey Business Journal. Retrieved from http://iveybusinessjournal.com/publication/some-key-questions-about-stakeholder-theory/
Pittman, T. S., & Zeigler, K. R. (2007). Basic human needs. In A. W. Kruglanski & E. T. Higgins (Eds.), Social psychology: Handbook of basic principles (2nd ed., pp. 473-489). New York, NY: Guilford Press.
Plattner, M. (2011). Mobile elite in the Global City: International managers’ locational preference. In R. D. Schlunze, N. O. Agola, & W. W. Baber (Eds.), Spaces of international economy and management: Launching new perspectives on management and geography. Palgrave Macmillan.
Korn Ferry’s Four Dimensional Executive Assessment • Research guide and technical manual
197 | © Korn Ferry 2015. All rights reserved.
Porras, J. I., & Robertson, P. J. (1992). Organization development: Theory, practice, and research. In M.D. Dunnette & L. M. Hough (Eds.), The handbook of industrial and organizational psychology (Vol. 3, pp. 719-822). Palo Alto, CA: Consulting Psychologist Press.
Pulakos, E. D., Arad, S., Donovan, M. A., & Plamondon, K. E. (2000). Adaptability in the workplace: Development of a taxonomy of adaptive performance. Journal of Applied Psychology, 85(4), 612-624. doi: 10.1037/0021-9010.85.4.612
Quinn, R. E., & Rohrbaugh, J. (1983). A spatial model of effectiveness criteria: Towards a competing values approach to organizational analysis. Management Science, 29(3), 363377.
Reeves, M., & Deimler, M. (2011). Adaptability: The new competitive advantage. Harvard Business Review Blog. Retrieved from https://hbr.org/2011/07/adaptability-the-new-competitive-advantage
Reiter-Palmon, R., Illies, J. J., & Kobe-Cross, L. M. (2009). Conscientiousness is not always a good predictor of performance: The case of creativity. Psychology Faculty Publications [Paper 20]. Retrieved from http://digitalcommons.unomaha.edu/psychfacpub/20
Riggio, R. E., Bass, B. M., & Orr, S. S. (2004). Transformational leadership in nonprofit organizations. In R. E. Riggio & S. S. Orr (Eds.) Improving leadership in nonprofit organizations (pp. 49-62). San Francisco, CA: Jossey-Bass.
Roberts, B. W., Chernyshenko, O. S., Stark, S., & Goldberg, L. R. (2005). The structure of conscientiousness: An empirical investigation based on seven major personality questionnaires. Personnel Psychology, 58(1), 103-139. doi: 10.1111/j.1744-6570.2005.00301.x
Rokeach, M. (1973). The nature of human values. New York, NY: Free Press. Romanelli, F., Cain, J., & Smith, K. M. (2006). Emotional intelligence as a predictor of academic and/or
professional success. American Journal of Pharmaceutical Education, 70(3), 69. Rothmann, S., Scholtz, P. E., Sipsma, J. F., & Sipsma, L. (2002). Personality preferences and emotional
intelligence: Implications for small and medium-sized enterprises. Retrieved from http://www.slsglobal.com/wp-content/uploads/2012/10/Personality-preferences-and-emotional-intelligence.pdf
Roy, I. (2012). Smart growth: Is Asia ready? New York, NY: Korn Ferry Institute. Rubin, J. Z., & Brown, B. R. (1975). The social psychology of bargaining and negotiation. New York, NY: Academic
Press. Ruyle, K. E., Hallenbeck, G. S., Orr, J. E., & Swisher, V. V. (2010). FYI for Insight™: The 21 leadership
characteristics for success and the 5 that get you fired. Minneapolis, MN: Lominger International: A Korn Ferry Company.
Sackett, P. R., & Lievens, F. (2008). Personnel selection. Annual Review of Psychology, 59, 419450. Saks, A. M., & Ashforth, B. E. (1997). A longitudinal investigation of the relationships between job information
sources, applicant perceptions of fit, and work outcomes. Personnel Psychology, 50, 395-426. Salacuse, J. W. (2002). Lessons for practice. In I. W. Zartman & J. Z. Rubin (Eds.), Power and negotiation
(pp. 255-270). Ann Arbor, MI: The University of Michigan Press. Salgado, J. (2002). The Big Five personality dimensions and counterproductive behaviors. International Journal of
Selection and Assessment, 10(1-2), 117-125. doi: 10.1111/1468-2389.00198 Sandilands, T. (2015). What type of organizations employ transactional leaders? Retrieved from:
http://smallbusiness.chron.com/type-organizations-employ-transactional-leadership-38770.html Saporito, T. J., & Winum, P. (2012). Inside CEO succession: The essential guide to leadership transition. Hoboken,
NJ: John Wiley & Sons. Schaubroeck, J., Kim, Y. J., & Peng, A. C. (2012). The self-concept in organizational psychology: Clarifying and
differentiating the constructs. International Review of Industrial and Organizational Psychology, 27, 1-38. Schein, E. H. (1983). The role of the founder in creating organizational culture. Organizational Dynamics, 12,
13-28. Schein, E. H. (1985, 1992). Organizational culture and leadership. San Francisco, CA: Jossey-Bass. Schein, E. H. (1990). Organizational culture. American Psychologist, 45(2), 109-119. Schlaerth, A., Ensari, N., & Christian, J. (2013). A meta-analytical review of the relationship between emotional
intelligence and leaders’ constructive conflict management. Group Processes & Intergroup Relations, 16(1), 126-136. doi: 10.1177/1368430212439907
Korn Ferry’s Four Dimensional Executive Assessment • Research guide and technical manual
198 | © Korn Ferry 2015. All rights reserved.
Schlevogt, K. (1998). The art of Chinese management? An empirical study of the nature, causes and outcomes of organizational structure and management practices in companies from selected cities in mainland China (Doctoral dissertation). University of Oxford, UK. Available from ProQuest Central; ProQuest Dissertations & Theses Global. (Order No. 9913130).
Schmidt, F. L., Ones, D. S., & Hunter, J. E. (1992). Personnel selection. Annual Review of Psychology, 43, 627-670.
Schultz, W. (1999). The reward signal of midbrain dopamine neurons. News in Physiological Sciences, 14(6), 249-255.
Schwartz, S. H., & Bilsky, W. (1990). Toward a theory of the universal content and structure of values: Extensions and cross-cultural replications. Journal of Personality and Social Psychology, 58(5), 878-891.
Schwarzer, R., & Fuchs, R. (1995). Changing risk behaviors and adopting health behaviors: The role of self-efficacy beliefs. In A. Bandura (Ed.), Self-efficacy in changing societies (pp. 259-288). Cambridge: Cambridge University Press.
Schyns, B., & Sczesny, S. (2010). Leadership attributes valence in self-concept and occupational self-efficacy. Career Development International, 15(1), 78-92.
Scroggins, W. A., Thomas, S. L., & Morris, J. A. (2008). Psychological testing in personnel selection, Part I: A century of psychological testing. Public Personnel Management, 37(1), 99-109.
Seibert, S. E., Crant, J. M., & Kraimer, M. L. (1999). Proactive personality and career success. Journal of Applied Psychology, 84(3), 416-427. doi: 10.1037/0021-9010.84.3.416
Serewicz, L. (2013). Culture eats your structure for lunch [Blog]. Retrieved from http://thoughtmanagement.org/2013/07/10/culture-eats-your-structure-for-lunch/
Sevy, B., Swisher, V., & Orr, J. E. (2014). Seven signposts: The unmistakable markers that identify high-potential leaders [Report]. Los Angeles, CA: Korn Ferry Institute.
Seyhan, O. (2013). A primer for transformational leadership in nonprofit sector. Journal of Administrative Services, 11, 251-275.
Shamir, B., House, R. J., & Arthur, M. B. (1993). The motivational effects of charismatic leadership: A self-concept based theory. Organization Science, 4(4), 577-594.
Shapira, Z. (1995). Risk taking: A managerial perspective. New York, NY: Russell Sage Foundation. Sherrill, W. W. (2001). Tolerance of ambiguity among MD/MBA students: Implications for management potential.
Journal of Continuing Education in the Health Professions, 21, 117–122. Shin, J., Taylor, M. S., & Seo, M. (2012). Resources for change: The relationships of organizational inducements
and psychological resilience to employees’ attitudes and behaviors toward organizational change. Academy of Management Journal, 55, 727748.
Sidhu, I. (2011, January 24). Overcoming ambiguity: Three steps that every business can take. Forbes. Retrieved from http://www.forbes.com/sites/indersidhu/2011/01/24/133/2/
Simonton, D. K. (1994). Greatness: Who makes history and why. New York, NY: Guilford Press. Sims, H. P. (1977) The leader as manager of reinforcement contingencies: An empirical example and a model. In
J.G. Hunt & L. L. Larson (Eds.), Leadership: The cutting edge (pp. 121137). Carbondale: Southern Illinois University Press.
Singer, J. D. (1998). Using SAS PROC MIXED to fit multilevel models, hierarchical models, and individual growth models. Journal of Educational and Behavioral Statistics, 23(4), 323355.
Singer, J., & Willet, J. B. (2003). Applied longitudinal data analysis: Modeling change and event occurrence. New York, NY: Oxford University Press.
Singh, P. (2008). Job analysis for a changing workplace. Human Resource Management Review, 18(2), 87-99. doi: doi.org/10.1016/j.hrmr.2008.03.004
Singh, M.P. & Sinha, J. (2013). Job satisfaction in organizational executives. International Journal of Scientific and Research Publications, 3(4), 1-6.
Slaski, M., & Cartwright, S. (2003). Emotional intelligence training and its implications for stress, health and performance. Stress and Health: Journal of the International Society for the Investigation of Stress, 19(4), 233-239. doi: doi.org/10.1002/smi.979
Sliter, K. A., & Christiansen, N. D. (2012). Effects of targeted self-coaching on applicant distortion of personality measures. Journal of Personnel Psychology, 11(4), 169-175.
Korn Ferry’s Four Dimensional Executive Assessment • Research guide and technical manual
199 | © Korn Ferry 2015. All rights reserved.
Spangler, W. D. (1992). Validity of questionnaire and TAT measures of need for achievement: Two meta-analyses. Psychological Bulletin, 112(1), 140-154.
Spearman, C. B. (2005). The abilities of man: Their nature and measurement. The Blackburn Press. Spector, P. E. (1986). Perceived control by employees: A meta-analysis of studies concerning autonomy and
participation at work. Human Relations, 39(11), 1005-1016. Spokane, A. R., Meir, E. I., & Catalano, M. (2000). Person-environment congruence and Holland’s Theory: A
review and reconsideration. Journal of Vocational Behavior, 57, 137187. Stark, S., & Chernyshenko. O. S. (2007). Adaptive testing with the multi-unidimensional pairwise preference model.
In D. J. Weiss (Ed.), Proceedings of the 2007 GMAC Conference on Computerized Adaptive Testing. Retrieved from www.psych.umn.edu/psylabs/CATCentral
Stark, S., Chernyshenko, O. S., Chan, K. Y., Lee, W. C., & Drasgow, F. (2001). Effects of the testing situation on item responding: Cause for concern. Journal of Applied Psychology, 86(5), 943.
Stark, S., Chernyshenko, O. S., & Drasgow, F. (2005). An IRT approach to constructing and scoring pairwise preference items involving stimuli on different dimensions: The multi-unidimensional pairwise-preference model. Applied Psychological Measurement, 29(3), 184-203.
Stedry, A. C., & Kay, E. (1966). The effects of goal difficulty on performance: A field experiment. Behavioral Science, 11(6), 459-470.
Stogdill, R. M. (1948). Personal factors associated with leadership: A survey of the literature. Journal of Psychology, (25), 35-71.
Stogdill, R. M. (1974). Handbook of leadership: A survey of theory and research. New York, NY: Free Press. Strebel, P. (1996). Why do employees resist change? Harvard Business Review, 74(3), 86-92. Strosaker, G. (2010). Developing a tolerance for ambiguity. Constant Cogitation. Retrieved from
http://gregstrosaker.com/2010/01/developing-a-tolerance-for-ambiguity/ Stuart, G. L., & Carson, K. P. (1997). Moving beyond the mechanistic model: An alternative approach to staffing for
contemporary organizations. Human Resource Management Review, 7(2), 157-184. Stumpf, S. A. (2010). Stakeholder competency assessments as predictors of career success. Career Development
International, 15(5), 459-478. doi: 10.1108/13620431011075330 Sull, D. (2009, December 23). Competing through organizational agility. Forbes. Retrieved from
http://www.forbes.com/2009/12/23/strategy-innovation-agility-leadership-managing-mckinsey.html Sutton, S. K., & Davidson, R. J. (1997). Prefrontal brain asymmetry: A biological substrate of the behavioral
approach and inhibition systems. Psychological Science, 8, 204-210. Suurküla, J. (2015). Stress, mind and leadership: On the effect of stress on mental performance, especially
regarding leadership. Retrieved from https://drgrandville2.wordpress.com/ Swisher, V. (2012). Becoming an agile leader. New York, NY: Korn Ferry Institute. Swisher, V. V., Hallenbeck, G., Orr, J. E., Eichinger, R. W., Lombardo, M. M., & Capretta, C. C. (2012). FYI™ for
learning agility: A must-have resource for high potential development. Minneapolis, MN: Lominger International: A Korn Ferry Company.
Sy, T., & D’Annunzio, L. S. (2005). Challenges and strategies of matrix organizations: Top-level and mid-level managers’ perspectives. Human Resource Planning, 28(1), 39-48.
Takane, Y., & De Leeuw, J. (1987). On the relationship between item response theory and factor analysis of discretized variables. Psychometrika, 52(3), 393-408.
Terman, L. M., & Oden, M. H. (1947). The gifted child grows up: Twenty-five years’ follow-up of a superior group (Vol. 4). Stanford University Press.
Tett, R. P. (1998). Is conscientiousness always positively related to job performance? The Industrial-Organizational Psychologist, 36(1), 24–29.
Tett, R. P., & Burnett, D. (2003). A personality trait-based interactionist model of job performance. Journal of Applied Psychology, 88, 500-517.
Tett, R. P., & Guterman, H. A. (2000). Situation trait relevance, trait expression, and cross-situational consistency: Testing a principle of trait activation. Journal of Research in Personality, 34, 397-123.
Tett, R. P., Jackson, D. N., & Rothstein, M. (1991). Personality measures as predictors of job performance: A meta-analytic review. Personnel Psychology, 44, 703-742.
Korn Ferry’s Four Dimensional Executive Assessment • Research guide and technical manual
200 | © Korn Ferry 2015. All rights reserved.
Thomas, S., & Scroggins, W. (2006) Psychological testing in personnel selection: Contemporary issues in cognitive ability and personality testing. Journal of Business Inquiry, 5, 28-38.
Thompson, J. A. (2005). Proactive personality and job performance: A social capital perspective. Journal of Applied Psychology, 90(5), 1011-1017. doi: 10.1037/0021-9010.90.5.1011
Thompson, J. D. (1967). Organizations in action: Social sciences bases of administrative theory. New York, NY: McGraw-Hill.
Thoms, P., Dose, J. J., & Scott, S. S. (2002). Relationships between accountability, job satisfaction, and trust. Human Resource Development Quarterly, 13(3), 307-323. doi: 10.1002/hrdq.1033
Thurstone, L. L. (1927). A law of comparative judgment. Psychological Review, 79, 281-299. Tichy, N., & Bennis, W. (2008). Wise leaders. Leadership Excellence, 25(1), 3-4. Retrieved from
http://ezproxy.middlebury.edu/login?url=http://search.proquest.com/docview/204518142?accountid=12447 Tinsley, H. E. A. (2000). The congruence myth: An analysis of the efficacy of the person-environment fit model.
Journal of Vocational Behavior, 56, 147-179. Tourish, D. (2013). The dark side of transformational leadership: A critical perspective. New York, NY: Routledge. Travis, T. (2007). Doing business anywhere: The essential guide to going global. Hoboken, NJ: John Wiley &
Sons. Tropman, J., & Wooten, L. P. (2013). The 7C approach to conceptualizing administration: Executive leadership in
the 21st century. Administration in Social Work, 37(4), 325-328. Tuna, C., & Lublin, J. S. (2009, July 14). Welch: ‘No such thing as work-life balance.’ The Wall Street Journal.
Retrieved from http://www.wsj.com/articles/SB124726415198325373 Tushman, M. L., & O’Reilly, C. A. (2002). Winning through innovation: A practical guide to leading organizational
change and renewal. Boston, MA: Harvard University Press. Uttal, B. (1983, October 17). The corporate culture vultures. Forbes. Vallerand, R. J., Blanchard, C., Mageau, G. A., Koestner, R., Ratelle, C., Léonard, M., Gagne, M., & Marsolais, J.
(2003). Les passions de l’âme: On obsessive and harmonious passion. Journal of Personality and Social Psychology, 85(4), 756-767. doi: 10.1037/0022-3514.85.4.756
Vallerand, R. J., Rousseau, F. L., Grouzet, F. M. E., Dumais, A., Grenier, S., & Blanchard, C. (2006). Passion in sport: A look at determinants and affective experiences. Journal of Sport & Exercise Psychology, 28(4), 454-478.
Van Velsor, E., McCauley, C. D., & Ruderman, M. N. (2010). The Center for Creative Leadership handbook of leadership development (3rd ed.). San Francisco, CA: Jossey-Bass.
Venus, M., Mao, C., Lanaj, K., & Johnson, R. E. (2012). Collectivistic leadership requires a collective identity. Industrial and Organizational Psychology: Perspectives on Science and Practice, 5(4), 432-436.
Verquer, M. L., Beehr, T. A., & Wagner, S. H. (2003). A meta-analysis of relations between person-organization fit and work attitudes. Journal of Vocational Behavior, 63, 473-489.
Voss, Z. G., Voss, G. B., & Moorman, C. (2005). An empirical examination of the complex relationship between entrepreneurial orientation and stakeholder support. European Journal of Marketing, 39, 1132-50.
The Wall Street Journal. (n.d.). How to develop future leaders. The Wall Street Journal. Wang, J., & Verma, A. (2012). Explaining organizational responsiveness to work-life balance issues: The role of
business strategy and high-performance work system. Human Resource Management, 51(3), 407-432. Weber, M. (1947). The theory of social and economic organization. New York, NY: Free Press. Weick, K. E., & Roberts, K. H. (1993). Collective mind in organizations: Heedful interrelating on flight decks.
Administrative Science Quarterly, 38(3), 357-381. Weinzimmer, L. G., & McConoughey, J. (2013). The wisdom of failure: How to learn the tough leadership lessons
without paying the price. San Francisco, CA: Jossey-Bass. Wiggins, J. S. (Ed.). (1996). The five-factor model of personality: Theoretical perspectives. New York, NY: Guilford. Wilderom, C. P. M., Glunk, U., & Maslowski, R. (2000). Organizational culture as a predictor of organizational
performance. In N. Ashkanasy, C. P. M. Wilderom, & M. F. Petersen (Eds.), Handbook of organizational culture & climate (pp. 193-209). Thousand Oaks, CA: Sage Publications.
Wilson, E. (2015). Empathy is still lacking in the leaders who need it most. Harvard Business Review. Retrieved from https://hbr.org/2015/09/empathy-is-still-lacking-in-the-leaders-who-need-it-most
Korn Ferry’s Four Dimensional Executive Assessment • Research guide and technical manual
201 | © Korn Ferry 2015. All rights reserved.
Winter, D. G. (1987). Leader appeal, leader performance, and the motive profiles of leaders and followers: A study of American presidents and elections. Journal of Personality and Social Psychology, 52(1), 196-202.
Wolff, H., & Kim, S. (2012). The relationship between networking behaviors and the Big Five personality dimensions. Career Development International, 17(1), 43-66. doi: 10.1108/13620431211201328
Womenetics. (2014, March 23). EI trumps IQ in the C-suite. Retrieved from https://www.womenetics.com/Article/ArtMID/2681/ArticleID/2575/Robin-Ross-Emotional-Intelligence.
Woo, S. E., Harms, P. D., & Kuncel, N. R. (2007). Integrating personality and intelligence: Typical intellectual engagement and need for cognition. Personality and Individual Differences, 43(6), 1635-1639. doi: 10.1016/j.paid.2007.04.022
Worley, C. G., & Lawler, E. E., III. (2010). Agility and organization design: A diagnostic framework. Organizational Dynamics, 39(2), 194-204.
Yammarino, F. J., Salas, E., Serban, A., Shirreffs, K., & Shuffler, M. L. (2012). Collectivistic leadership approaches: Putting the “we” in leadership science and practice. Industrial and Organizational Psychology: Perspective on Science and Practice, 5(4), 382-402.
Yorks, L., & Nicolaides, A. (2012). A conceptual model for developing mindsets for strategic insight under conditions of complexity and high uncertainty. Human Resource Development Review, 11(2), 182-202. doi: 10.1177/1534484312439055
Yu, K. Y. T. (2014). Person-organization fit effects on organizational attraction: Test of an expectations-based model. Organizational Behavior and Human Decision Processes, 124(1), 75-94.
Yukl, G. A. (1998). Leadership in organizations (4th ed.). New York, NY: Prentice Hall. Yukl, G., Kim, H., & Chavez, C. (1999). Task importance, feasibility, and agent influence behavior as determinants
of target commitment. Journal of Applied Psychology, 84(1), 137-143. doi: 10.1037/0021-9010.84.1.137 Yukl, G., & Mashud, R. (2010). Why flexible and adaptive leadership is essential. Consulting Psychology Journal:
Practice and Research, 62(2), 81-93. Yukl, G., & Tracey, J. B. (1992). Consequences of influence tactics used with subordinates, peers, and the boss.
Journal of Applied Psychology, 77(4), 525-535. doi: 10.1037/0021-9010.77.4.525 Yusoof, F., Desa, A., Ibrahim, N., Kadir, N. B. A., & Rahman, R. M. A. (2013). A study of the relationship between
EQ and personality among lecturers at a research university. Procedia – Social and Behavioral Sciences, 114, 351-354. doi: 10.1016/j.sbspro.2013.12.710.
Zaccaro, S. J. (2001). The nature of executive leadership: A conceptual and empirical analysis of success. Washington, DC: American Psychological Association.
Zaccaro, S. J. (2012). Individual differences and leadership: Contributions to a third tipping point. The Leadership Quarterly, 23(4), 718-728.
Zaccaro, S. J., White, L., Kilcullen, R., Parker, C., Williams, D., & O’Connor-Boes, J. (1997). Cognitive and temperament predictors of Army civilian leadership. Bethesda, MD: Management Research Institute.
Zartman, I. W., & Rubin, J. Z. (2002). Power and negotiation. University of Michigan Press. Zenger, J., & Folkman, J. (2013). Bad leaders can change their spots. Harvard Business Review Blog Network.
Retrieved from https://hbr.org/2013/01/good-news-poor-leaders-can-cha Zenger, J., & Folkman, J. (2014, January 15). Your employees want the negative feedback you hate to give.
Harvard Business Review Blog Network. Retrieved from https://hbr.org/2014/01/your-employees-want-the-negative-feedback-you-hate-to-give/
Zhang, T., Avery, G. C., Bergsteiner, H., & More, E. (2014). The relationship between leadership paradigms and employee engagement. Journal of Global Responsibility, 5(1), 4-21. doi: 10.1108/JGR-02-2014-0006
Zhu, G., Wolff, S. B., Hall, D. T., Heras, M. L., Gutierrez, B., & Kram, K. (2013). Too much or too little? A study of the impact of career complexity on executive adaptability. Career Development International, 18(5), 457-483. doi: 10.1108/CDI-07-2012-0067
Zimmerman, M. A. (1990). Toward a theory of learned hopefulness: A structural model analysis of participation and empowerment. Journal of Research in Personality, 24(1), 71-86.
Zimmerman, M. A., & Rappaport, J. (1988). Citizen participation, perceived control, and psychological empowerment. American Journal of Community Psychology, 16(5), 725750.
Zimmerman, R. D. (2008). Understanding the impact of personality traits on individuals’ turnover decisions: A meta-analytic path model. Personnel Psychology, 61(2), 309-348. doi: 10.1111/j.1744-6570.2008.00115.x
Korn Ferry’s Four Dimensional Executive Assessment • Research guide and technical manual
202 | © Korn Ferry 2015. All rights reserved.
Zohar, D., & Luria, G. (2004). Climate as a social-cognitive construction of supervisory safety practices: Scripts as proxy of behavior patterns. Journal of Applied Psychology, 89(2), 322-333.
203 | © Korn Ferry 2015. All rights reserved.
Appendices
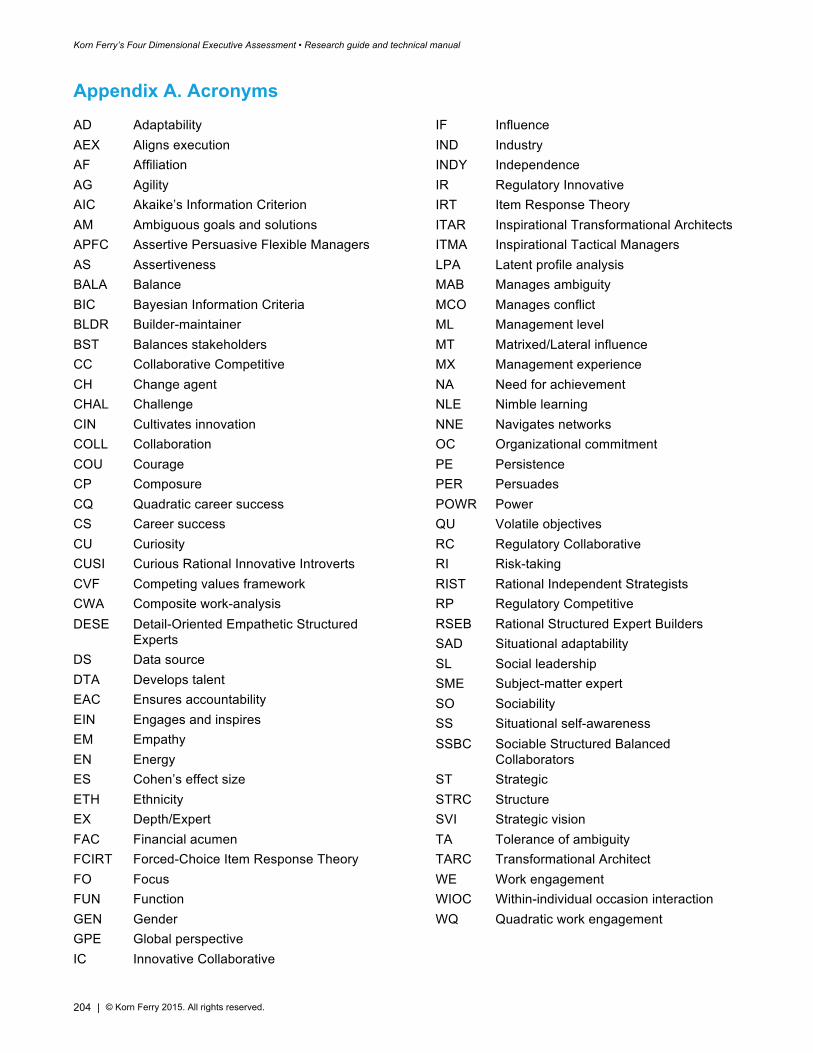
Korn Ferry’s Four Dimensional Executive Assessment • Research guide and technical manual
204 | © Korn Ferry 2015. All rights reserved.
Appendix A. Acronyms AD Adaptability AEX Aligns execution AF Affiliation AG Agility AIC Akaike’s Information Criterion AM Ambiguous goals and solutions APFC Assertive Persuasive Flexible Managers AS Assertiveness BALA Balance BIC Bayesian Information Criteria BLDR Builder-maintainer BST Balances stakeholders CC Collaborative Competitive CH Change agent CHAL Challenge CIN Cultivates innovation COLL Collaboration COU Courage CP Composure CQ Quadratic career success CS Career success CU Curiosity CUSI Curious Rational Innovative Introverts CVF Competing values framework CWA Composite work-analysis DESE Detail-Oriented Empathetic Structured
Experts DS Data source DTA Develops talent EAC Ensures accountability EIN Engages and inspires EM Empathy EN Energy ES Cohen’s effect size ETH Ethnicity EX Depth/Expert FAC Financial acumen FCIRT Forced-Choice Item Response Theory FO Focus FUN Function GEN Gender GPE Global perspective IC Innovative Collaborative
IF Influence IND Industry INDY Independence IR Regulatory Innovative IRT Item Response Theory ITAR Inspirational Transformational Architects ITMA Inspirational Tactical Managers LPA Latent profile analysis MAB Manages ambiguity MCO Manages conflict ML Management level MT Matrixed/Lateral influence MX Management experience NA Need for achievement NLE Nimble learning NNE Navigates networks OC Organizational commitment PE Persistence PER Persuades POWR Power QU Volatile objectives RC Regulatory Collaborative RI Risk-taking RIST Rational Independent Strategists RP Regulatory Competitive RSEB Rational Structured Expert Builders SAD Situational adaptability SL Social leadership SME Subject-matter expert SO Sociability SS Situational self-awareness SSBC Sociable Structured Balanced
Collaborators ST Strategic STRC Structure SVI Strategic vision TA Tolerance of ambiguity TARC Transformational Architect WE Work engagement WIOC Within-individual occasion interaction WQ Quadratic work engagement
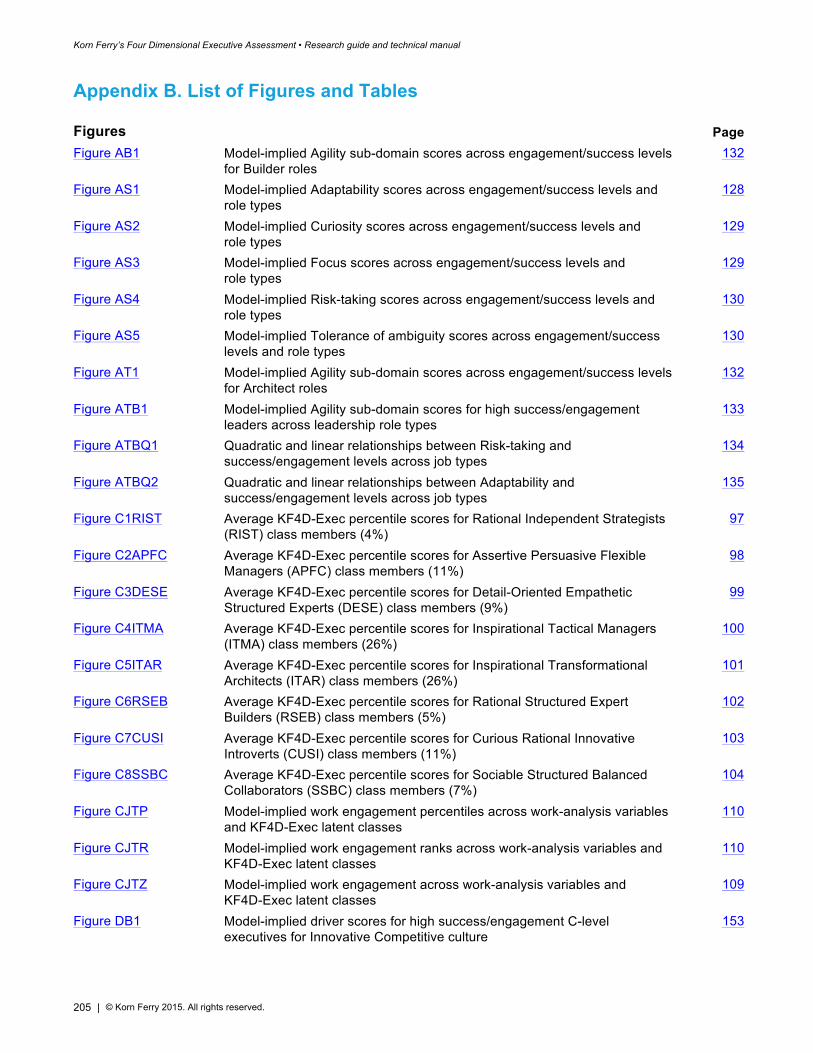
Korn Ferry’s Four Dimensional Executive Assessment • Research guide and technical manual
205 | © Korn Ferry 2015. All rights reserved.
Appendix B. List of Figures and Tables
Figures Page Figure AB1 Model-implied Agility sub-domain scores across engagement/success levels
for Builder roles 132
Figure AS1 Model-implied Adaptability scores across engagement/success levels and role types
128
Figure AS2 Model-implied Curiosity scores across engagement/success levels and role types
129
Figure AS3 Model-implied Focus scores across engagement/success levels and role types
129
Figure AS4 Model-implied Risk-taking scores across engagement/success levels and role types
130
Figure AS5 Model-implied Tolerance of ambiguity scores across engagement/success levels and role types
130
Figure AT1 Model-implied Agility sub-domain scores across engagement/success levels for Architect roles
132
Figure ATB1 Model-implied Agility sub-domain scores for high success/engagement leaders across leadership role types
133
Figure ATBQ1 Quadratic and linear relationships between Risk-taking and success/engagement levels across job types
134
Figure ATBQ2 Quadratic and linear relationships between Adaptability and success/engagement levels across job types
135
Figure C1RIST Average KF4D-Exec percentile scores for Rational Independent Strategists (RIST) class members (4%)
97
Figure C2APFC Average KF4D-Exec percentile scores for Assertive Persuasive Flexible Managers (APFC) class members (11%)
98
Figure C3DESE Average KF4D-Exec percentile scores for Detail-Oriented Empathetic Structured Experts (DESE) class members (9%)
99
Figure C4ITMA Average KF4D-Exec percentile scores for Inspirational Tactical Managers (ITMA) class members (26%)
100
Figure C5ITAR Average KF4D-Exec percentile scores for Inspirational Transformational Architects (ITAR) class members (26%)
101
Figure C6RSEB Average KF4D-Exec percentile scores for Rational Structured Expert Builders (RSEB) class members (5%)
102
Figure C7CUSI Average KF4D-Exec percentile scores for Curious Rational Innovative Introverts (CUSI) class members (11%)
103
Figure C8SSBC Average KF4D-Exec percentile scores for Sociable Structured Balanced Collaborators (SSBC) class members (7%)
104
Figure CJTP Model-implied work engagement percentiles across work-analysis variables and KF4D-Exec latent classes
110
Figure CJTR Model-implied work engagement ranks across work-analysis variables and KF4D-Exec latent classes
110
Figure CJTZ Model-implied work engagement across work-analysis variables and KF4D-Exec latent classes
109
Figure DB1 Model-implied driver scores for high success/engagement C-level executives for Innovative Competitive culture
153
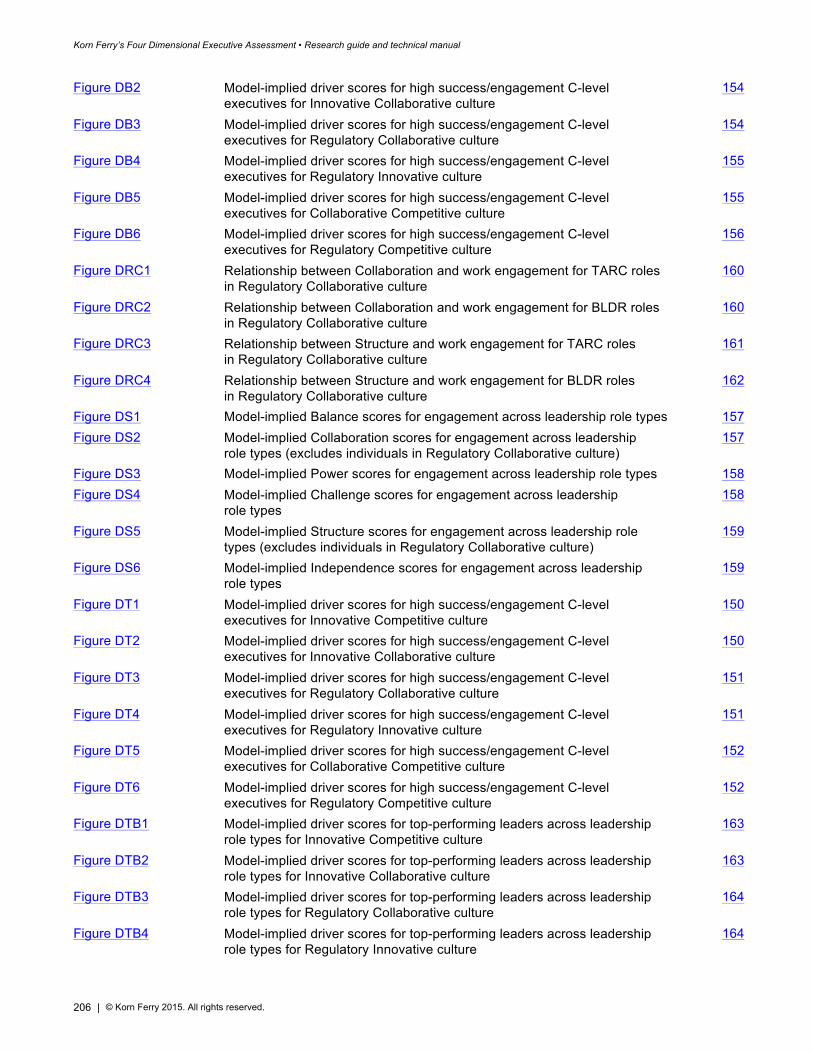
Korn Ferry’s Four Dimensional Executive Assessment • Research guide and technical manual
206 | © Korn Ferry 2015. All rights reserved.
Figure DB2 Model-implied driver scores for high success/engagement C-level executives for Innovative Collaborative culture
154
Figure DB3 Model-implied driver scores for high success/engagement C-level executives for Regulatory Collaborative culture
154
Figure DB4 Model-implied driver scores for high success/engagement C-level executives for Regulatory Innovative culture
155
Figure DB5 Model-implied driver scores for high success/engagement C-level executives for Collaborative Competitive culture
155
Figure DB6 Model-implied driver scores for high success/engagement C-level executives for Regulatory Competitive culture
156
Figure DRC1 Relationship between Collaboration and work engagement for TARC roles in Regulatory Collaborative culture
160
Figure DRC2 Relationship between Collaboration and work engagement for BLDR roles in Regulatory Collaborative culture
160
Figure DRC3 Relationship between Structure and work engagement for TARC roles in Regulatory Collaborative culture
161
Figure DRC4 Relationship between Structure and work engagement for BLDR roles in Regulatory Collaborative culture
162
Figure DS1 Model-implied Balance scores for engagement across leadership role types 157 Figure DS2 Model-implied Collaboration scores for engagement across leadership
role types (excludes individuals in Regulatory Collaborative culture) 157
Figure DS3 Model-implied Power scores for engagement across leadership role types 158 Figure DS4 Model-implied Challenge scores for engagement across leadership
role types 158
Figure DS5 Model-implied Structure scores for engagement across leadership role types (excludes individuals in Regulatory Collaborative culture)
159
Figure DS6 Model-implied Independence scores for engagement across leadership role types
159
Figure DT1 Model-implied driver scores for high success/engagement C-level executives for Innovative Competitive culture
150
Figure DT2 Model-implied driver scores for high success/engagement C-level executives for Innovative Collaborative culture
150
Figure DT3 Model-implied driver scores for high success/engagement C-level executives for Regulatory Collaborative culture
151
Figure DT4 Model-implied driver scores for high success/engagement C-level executives for Regulatory Innovative culture
151
Figure DT5 Model-implied driver scores for high success/engagement C-level executives for Collaborative Competitive culture
152
Figure DT6 Model-implied driver scores for high success/engagement C-level executives for Regulatory Competitive culture
152
Figure DTB1 Model-implied driver scores for top-performing leaders across leadership role types for Innovative Competitive culture
163
Figure DTB2 Model-implied driver scores for top-performing leaders across leadership role types for Innovative Collaborative culture
163
Figure DTB3 Model-implied driver scores for top-performing leaders across leadership role types for Regulatory Collaborative culture
164
Figure DTB4 Model-implied driver scores for top-performing leaders across leadership role types for Regulatory Innovative culture
164
Korn Ferry’s Four Dimensional Executive Assessment • Research guide and technical manual
207 | © Korn Ferry 2015. All rights reserved.
Figure DTB5 Model-implied driver scores for top-performing leaders across leadership role types for Collaborative Competitive culture
165
Figure DTB6 Model-implied driver scores for top-performing leaders across leadership role types for Regulatory Competitive culture
165
Figure EB1 Model-implied Energy sub-domain scores across engagement and success levels for Builder roles
144
Figure ES1 Model-implied Assertiveness scores across engagement/success levels and role types
142
Figure ES2 Model implied Need for achievement scores across engagement/success levels and role types
142
Figure ES3 Model-implied Persistence scores across engagement/success levels and role types
143
Figure ET1 Model-implied Energy sub-domain scores across engagement and success levels for Architect roles
144
Figure ETB1 Model-implied Energy sub-domain scores for high success/engagement leaders across leadership role types
145
Figure HB1 Model-implied higher-order trait scores across engagement/success levels for Builder roles
149
Figure HS1 Model-implied Agility scores across engagement/success levels and role types
146
Figure HS2 Model-implied Social leadership scores across engagement/success levels and role types
147
Figure HS3 Model-implied Energy scores across engagement/success levels and role types
147
Figure HTB1 Model-implied higher-order trait scores for high success/engagement leaders across leadership role types
148
Figure LPAR Average raw values on client semantic differential ratings for each latent class
71
Figure LPAS Average standardized values on client semantic differential work-analysis ratings for each latent class
71
Figure SB1 Model-implied Social leadership sub-domain scores across engagement/success levels for Builder roles
140
Figure SS1 Model-implied Affiliation scores across engagement/success levels and role types
136
Figure SS2 Model-implied Composure scores across engagement/success levels and role types
136
Figure SS3 Model-implied Empathy scores across engagement/success levels and role types
137
Figure SS4 Model-implied Influence scores across engagement/success levels and role types
137
Figure SS5 Model-implied Sociability scores across engagement/success levels and role types
138
Figure SS6 Model-implied Situational self-awareness scores across engagement/success levels and role types
138
Figure ST1 Model-implied Social leadership sub-domain scores across engagement/success levels for Architect roles
139
Figure STB1 Model-implied Social leadership sub-domain scores for high success/engagement leaders across leadership role types
140
Figure VC Relationship between strategies, culture, and employees 45
Korn Ferry’s Four Dimensional Executive Assessment • Research guide and technical manual
208 | © Korn Ferry 2015. All rights reserved.
Tables
Page Table ACORR KF4D-Exec construct intercorrelations 211 Table AGDEF Definitions for Agility sub-domain traits 11 Table AIES Mean and median effect sizes for ethnicity and gender contrasts across
KF4D-Exec groupings 168
Table AIN Sample sizes for group differences analyses across KF4D-Exec measures, ethnicity, and gender
169
Table AIVM Average target vector distances across ethnicity and gender 168 Table AQ1 Inferences from exploratory analyses concerning linear and quadratic
effects of career success and work engagement on KF4D-Exec scores 135
Table CAVG Work-analysis means across latent KF4D-Exec assessment classes 105 Table CCORR Competencies intercorrelation matrix 61 Table CGFAN Results of 4 x 8 factorial ANOVA showing average work engagement
across KF4D-Exec assessment classes and work-analysis groups 107
Table CGORT Work engagement regressed on KF4D-Exec classes, work-analysis variables, and related interactions
108
Table CLT4 Adjusted driver means and ANCOVA results across Culture types 112 Table CLT6 Adjusted driver means and ANCOVA results across hybrid Culture types 113 Table COMDEF Executive search competency names and definitions 25 Table CRMCOV Omnibus MANCOVA results evaluating the impact of covariates, gender,
and ethnicity on competencies 169–170
Table D1 KF4D-Exec driver definitions and categorizations 36 Table D2 Construct mapping of the six universal drivers to other models of motivation 37–38 Table DCORR Drivers intercorrelation matrix 60 Table DRDEF KF4D-Exec driver names and definitions 41 Table DRMCOV Omnibus MANCOVA results evaluating the impact of covariates, gender,
and ethnicity on drivers 177
Table EFACT Classification table and descriptions for created groups 106 Table EFAWAI Rotated solutions of work-analysis variables 106 Table ENDEF Definitions for Energy sub-domain traits 22 Table EQ1 Inferences from exploratory analyses concerning linear and quadratic
effects of career success and work engagement on KF4D-Exec scores 145
Table ETHCOMP Ethnic contrasts on competency variables 171 Table ETHDRIVE Ethnic contrasts on driver domains 178 Table ETHHOTRAITS Ethnic contrasts on higher-order trait variables 173 Table ETHTRAITS Ethnic contrasts on trait sub-domain variables 176 Table FC1 Example six-item block 56 Table GCOMP Gender contrasts on competency variables 170 Table GDRIVE Gender contrasts on driver domains 178 Table GHOTRAITS Gender contrasts on higher-order trait variables 173 Table GTRAITS Gender contrasts on trait sub-domains 175 Table HFTA Eigenvectors from rotated factor analysis of trait sub-domain IRT scores 58 Table HTRMCOV Omnibus MANCOVA results evaluating the impact of covariates, gender,
and ethnicity on higher-order trait composites 172
Korn Ferry’s Four Dimensional Executive Assessment • Research guide and technical manual
209 | © Korn Ferry 2015. All rights reserved.
Table LPA1 Competing latent profile models for search committee rated job expectations
70
Table LPA4D Competing latent profile models for KF4D-Exec assessment scores 96 Table LPAM Average raw values on client semantic differential ratings for each latent
class 70
Table MLM1 Multilevel repeated-measures regression model for Agility sub-domains 116–117 Table MLM2 Multilevel repeated-measures regression model for Social leadership
sub-domains 118–119
Table MLM3 Multilevel repeated-measures regression model for Energy sub-domains 120–121 Table MLM4 Multilevel repeated-measures regression model for higher-order trait factors 122 Table MLM5 Multilevel repeated-measures regression model for drivers 124–125 Table OCAG Standardized beta weights showing the relationship between Agility
constructs and organizational commitment across levels of work-analysis variables
76
Table OCDR Standardized beta weights showing the relationship between drivers constructs and organizational commitment across work-analysis variables
94
Table OCEN Standardized beta weights showing the relationship between Energy constructs and organizational commitment across levels of work-analysis variables
81–82
Table OCPPL Standardized beta weights showing the relationship between People competency constructs and organizational commitment across levels work-analysis variables
88–89
Table OCRC Standardized beta weights showing the relationship between Results competency constructs and organizational commitment across levels of work-analysis variables
86
Table OCSL Standardized beta weights showing the relationship between Social leadership constructs and binary organizational commitment across levels of work-analysis variables
79
Table OCSLF Standardized beta weights showing the relationship between Self competency constructs and organizational commitment across levels of work-analysis variables
91
Table OCTC Standardized beta weights showing the relationship between Thought competency constructs and organizational commitment across levels of work-analysis variables
84
Table RCOMP Composite reliabilities for competencies 59 Table RDRIVE Composite reliabilities for drivers 59 Table RTRAIT Composite reliabilities for traits 58 Table SLDEF Definitions for Social leadership sub-domain traits 15 Table SQ1 Inferences from exploratory analyses concerning linear and quadratic
effects of career success and work engagement on KF4D-Exec scores 141
Table TCORR Intercorrelations between traits 60 Table TCORR-IRTL Intercorrelations between traits measured with Likert-type scales and FCIRT 212 Table TRMCOV Omnibus MANCOVA results evaluating the impact of covariates, gender,
and ethnicity on trait sub-domains 174
Table VLOG Results of regressing binary engagement grouping on target vector distances
167
Table VRATIO High engagement odds ratios for various levels of fit to KF4D-Exec target profiles
167
Korn Ferry’s Four Dimensional Executive Assessment • Research guide and technical manual
210 | © Korn Ferry 2015. All rights reserved.
Table WACC Bivariate correlations between client semantic differential work-analysis variable ratings
68
Table WAIA Bivariate correlations between work-analysis and Agility trait constructs 72 Table WAIC Bivariate correlations between incumbent work-analysis variable ratings 68 Table WAID Bivariate correlations between work-analysis variables and drivers 73 Table WAIE Bivariate correlations between work-analysis variables and Energy
trait constructs 73
Table WAIM Incumbent work-analysis rating means and standard deviations across management levels
69, 72
Table WAIS Bivariate correlations between work-analysis variables and Social leadership trait constructs
73
Table WEAG Standardized beta weights showing the relationship between Agility constructs and work engagement across levels of work-analysis variables
75
Table WEDR Standardized beta weights showing the relationship between drivers constructs and work engagement across levels of work-analysis variables
93
Table WEEN Standardized beta weights showing the relationship between Energy constructs and work engagement across levels of work-analysis variables
80–81
Table WEPPL Standardized beta weights showing the relationship between People competency constructs and work engagement across levels of work-analysis variables
87–88
Table WERC Standardized beta weights showing the relationship between Results competency constructs and work engagement across levels of work-analysis variables
85
Table WESL Standardized beta weights showing the relationship between Social leadership constructs and binary work engagement across levels of work-analysis variables
78
Table WESLF Standardized beta weights showing the relationship between Self competency constructs and work engagement across levels of work-analysis variables
90
Table WETC Standardized beta weights showing the relationship between Thought competency constructs and work engagement across levels of work-analysis variables
83
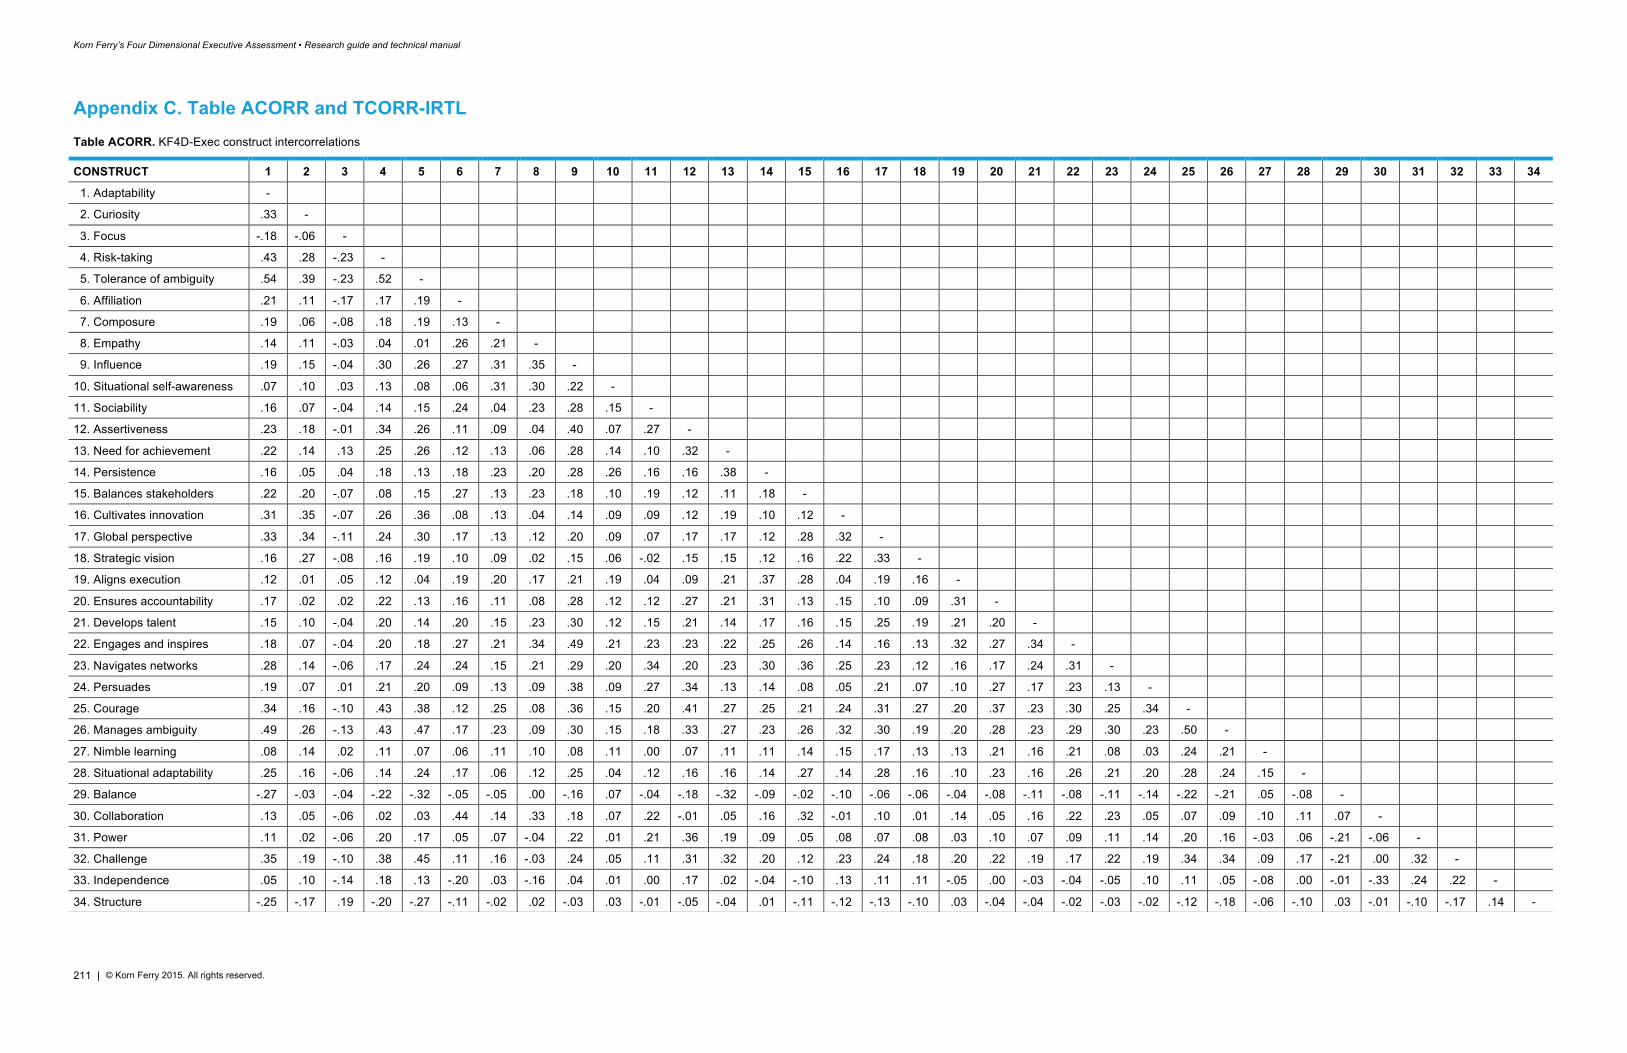
Korn Ferry’s Four Dimensional Executive Assessment • Research guide and technical manual
211 | © Korn Ferry 2015. All rights reserved.
Appendix C. Table ACORR and TCORR-IRTL Table ACORR. KF4D-Exec construct intercorrelations
CONSTRUCT 1 2 3 4 5 6 7 8 9 10 11 12 13 14 15 16 17 18 19 20 21 22 23 24 25 26 27 28 29 30 31 32 33 34
1. Adaptability - 2. Curiosity .33 - 3. Focus -.18 -.06 - 4. Risk-taking .43 .28 -.23 - 5. Tolerance of ambiguity .54 .39 -.23 .52 - 6. Affiliation .21 .11 -.17 .17 .19 - 7. Composure .19 .06 -.08 .18 .19 .13 - 8. Empathy .14 .11 -.03 .04 .01 .26 .21 - 9. Influence .19 .15 -.04 .30 .26 .27 .31 .35 - 10. Situational self-awareness .07 .10 .03 .13 .08 .06 .31 .30 .22 - 11. Sociability .16 .07 -.04 .14 .15 .24 .04 .23 .28 .15 - 12. Assertiveness .23 .18 -.01 .34 .26 .11 .09 .04 .40 .07 .27 - 13. Need for achievement .22 .14 .13 .25 .26 .12 .13 .06 .28 .14 .10 .32 - 14. Persistence .16 .05 .04 .18 .13 .18 .23 .20 .28 .26 .16 .16 .38 - 15. Balances stakeholders .22 .20 -.07 .08 .15 .27 .13 .23 .18 .10 .19 .12 .11 .18 - 16. Cultivates innovation .31 .35 -.07 .26 .36 .08 .13 .04 .14 .09 .09 .12 .19 .10 .12 - 17. Global perspective .33 .34 -.11 .24 .30 .17 .13 .12 .20 .09 .07 .17 .17 .12 .28 .32 - 18. Strategic vision .16 .27 -.08 .16 .19 .10 .09 .02 .15 .06 -.02 .15 .15 .12 .16 .22 .33 - 19. Aligns execution .12 .01 .05 .12 .04 .19 .20 .17 .21 .19 .04 .09 .21 .37 .28 .04 .19 .16 - 20. Ensures accountability .17 .02 .02 .22 .13 .16 .11 .08 .28 .12 .12 .27 .21 .31 .13 .15 .10 .09 .31 - 21. Develops talent .15 .10 -.04 .20 .14 .20 .15 .23 .30 .12 .15 .21 .14 .17 .16 .15 .25 .19 .21 .20 - 22. Engages and inspires .18 .07 -.04 .20 .18 .27 .21 .34 .49 .21 .23 .23 .22 .25 .26 .14 .16 .13 .32 .27 .34 - 23. Navigates networks .28 .14 -.06 .17 .24 .24 .15 .21 .29 .20 .34 .20 .23 .30 .36 .25 .23 .12 .16 .17 .24 .31 - 24. Persuades .19 .07 .01 .21 .20 .09 .13 .09 .38 .09 .27 .34 .13 .14 .08 .05 .21 .07 .10 .27 .17 .23 .13 - 25. Courage .34 .16 -.10 .43 .38 .12 .25 .08 .36 .15 .20 .41 .27 .25 .21 .24 .31 .27 .20 .37 .23 .30 .25 .34 - 26. Manages ambiguity .49 .26 -.13 .43 .47 .17 .23 .09 .30 .15 .18 .33 .27 .23 .26 .32 .30 .19 .20 .28 .23 .29 .30 .23 .50 - 27. Nimble learning .08 .14 .02 .11 .07 .06 .11 .10 .08 .11 .00 .07 .11 .11 .14 .15 .17 .13 .13 .21 .16 .21 .08 .03 .24 .21 - 28. Situational adaptability .25 .16 -.06 .14 .24 .17 .06 .12 .25 .04 .12 .16 .16 .14 .27 .14 .28 .16 .10 .23 .16 .26 .21 .20 .28 .24 .15 - 29. Balance -.27 -.03 -.04 -.22 -.32 -.05 -.05 .00 -.16 .07 -.04 -.18 -.32 -.09 -.02 -.10 -.06 -.06 -.04 -.08 -.11 -.08 -.11 -.14 -.22 -.21 .05 -.08 - 30. Collaboration .13 .05 -.06 .02 .03 .44 .14 .33 .18 .07 .22 -.01 .05 .16 .32 -.01 .10 .01 .14 .05 .16 .22 .23 .05 .07 .09 .10 .11 .07 - 31. Power .11 .02 -.06 .20 .17 .05 .07 -.04 .22 .01 .21 .36 .19 .09 .05 .08 .07 .08 .03 .10 .07 .09 .11 .14 .20 .16 -.03 .06 -.21 -.06 - 32. Challenge .35 .19 -.10 .38 .45 .11 .16 -.03 .24 .05 .11 .31 .32 .20 .12 .23 .24 .18 .20 .22 .19 .17 .22 .19 .34 .34 .09 .17 -.21 .00 .32 - 33. Independence .05 .10 -.14 .18 .13 -.20 .03 -.16 .04 .01 .00 .17 .02 -.04 -.10 .13 .11 .11 -.05 .00 -.03 -.04 -.05 .10 .11 .05 -.08 .00 -.01 -.33 .24 .22 - 34. Structure -.25 -.17 .19 -.20 -.27 -.11 -.02 .02 -.03 .03 -.01 -.05 -.04 .01 -.11 -.12 -.13 -.10 .03 -.04 -.04 -.02 -.03 -.02 -.12 -.18 -.06 -.10 .03 -.01 -.10 -.17 .14 -
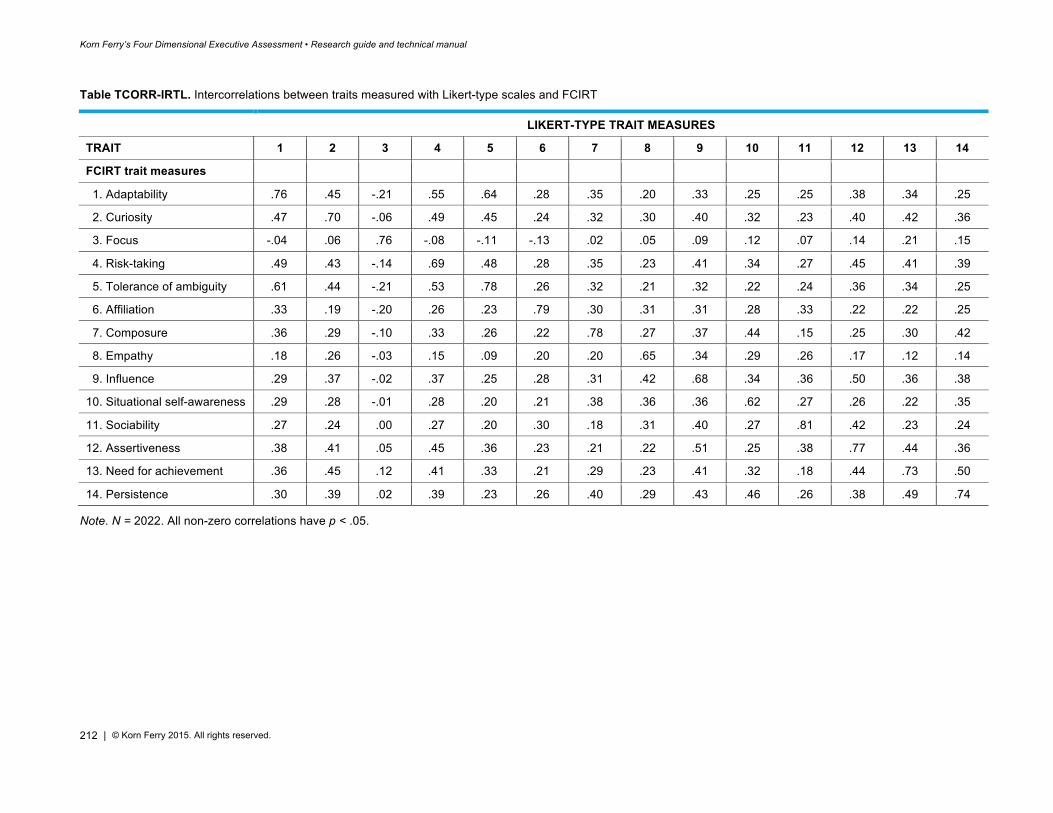
Korn Ferry’s Four Dimensional Executive Assessment • Research guide and technical manual
212 | © Korn Ferry 2015. All rights reserved.
Table TCORR-IRTL. Intercorrelations between traits measured with Likert-type scales and FCIRT
LIKERT-TYPE TRAIT MEASURES
TRAIT 1 2 3 4 5 6 7 8 9 10 11 12 13 14
FCIRT trait measures
1. Adaptability .76 .45 -.21 .55 .64 .28 .35 .20 .33 .25 .25 .38 .34 .25
2. Curiosity .47 .70 -.06 .49 .45 .24 .32 .30 .40 .32 .23 .40 .42 .36
3. Focus -.04 .06 .76 -.08 -.11 -.13 .02 .05 .09 .12 .07 .14 .21 .15
4. Risk-taking .49 .43 -.14 .69 .48 .28 .35 .23 .41 .34 .27 .45 .41 .39
5. Tolerance of ambiguity .61 .44 -.21 .53 .78 .26 .32 .21 .32 .22 .24 .36 .34 .25
6. Affiliation .33 .19 -.20 .26 .23 .79 .30 .31 .31 .28 .33 .22 .22 .25
7. Composure .36 .29 -.10 .33 .26 .22 .78 .27 .37 .44 .15 .25 .30 .42
8. Empathy .18 .26 -.03 .15 .09 .20 .20 .65 .34 .29 .26 .17 .12 .14
9. Influence .29 .37 -.02 .37 .25 .28 .31 .42 .68 .34 .36 .50 .36 .38
10. Situational self-awareness .29 .28 -.01 .28 .20 .21 .38 .36 .36 .62 .27 .26 .22 .35
11. Sociability .27 .24 .00 .27 .20 .30 .18 .31 .40 .27 .81 .42 .23 .24
12. Assertiveness .38 .41 .05 .45 .36 .23 .21 .22 .51 .25 .38 .77 .44 .36
13. Need for achievement .36 .45 .12 .41 .33 .21 .29 .23 .41 .32 .18 .44 .73 .50
14. Persistence .30 .39 .02 .39 .23 .26 .40 .29 .43 .46 .26 .38 .49 .74
Note. N = 2022. All non-zero correlations have p < .05.
About Korn FerryKorn Ferry is the preeminent global people and organizational advisory firm. We help leaders, organizations and societies succeed by releasing the full power and potential of people. Our nearly 7,000 colleagues deliver services through Korn Ferry and our Hay Group and Futurestep divisions.
Visit www.kornferry.com for more information on Korn Ferry, and www.kornferryinstitute.com for thought leadership, intellectual property and research.
www.kornferry.com/kf4d
© Korn Ferry 2015. All rights reserved.