Embed Size (px)
Citation preview
International Monetary Economics
Master d’Affaires Publiques SciencesPo Spring 2013
Pierre-Olivier Gourinchas

Slide 1-2
Roadmap
§ Administrative Trivia § A quick recap on the global financial crisis § International Economics: What is it about? § Measurement:
• The National Income Accounts • National Income Accounting for the Open Economy • Three Interpretations of the Current Account
§ Balance of Payments Accounts

Slide 1-4
§ Course web page. • Available through the SciencesPo website.
§ Grading. • Class participation: 20%. • Group presentation: 35%. • Final exam: 45%.
Administrative Trivia

Slide 1-6
Administrative Trivia § Course material.
• International economics, Krugman Obstfeld and Melitz, Pearson, 9th edition.
• The Economist and The Financial Times: weekly readings.
• Additional material on the course web page.
Slide 1-7
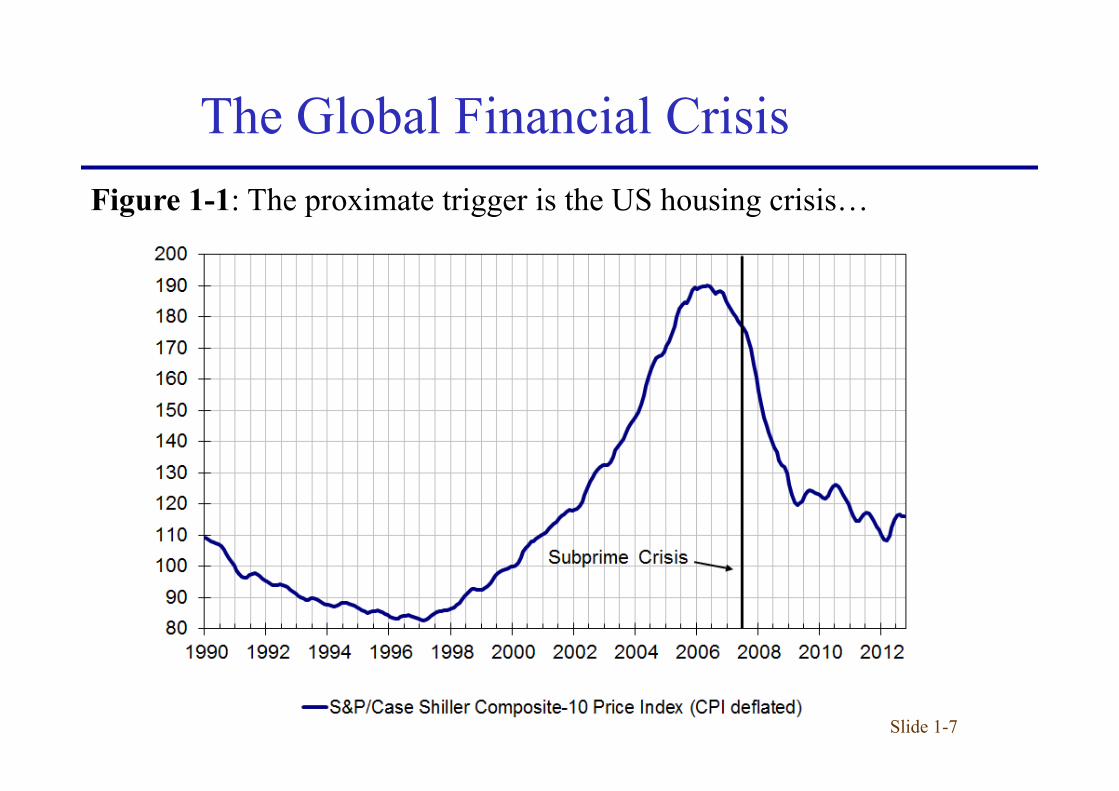
Figure 1-1: The proximate trigger is the US housing crisis…
The Global Financial Crisis
Slide 1-8
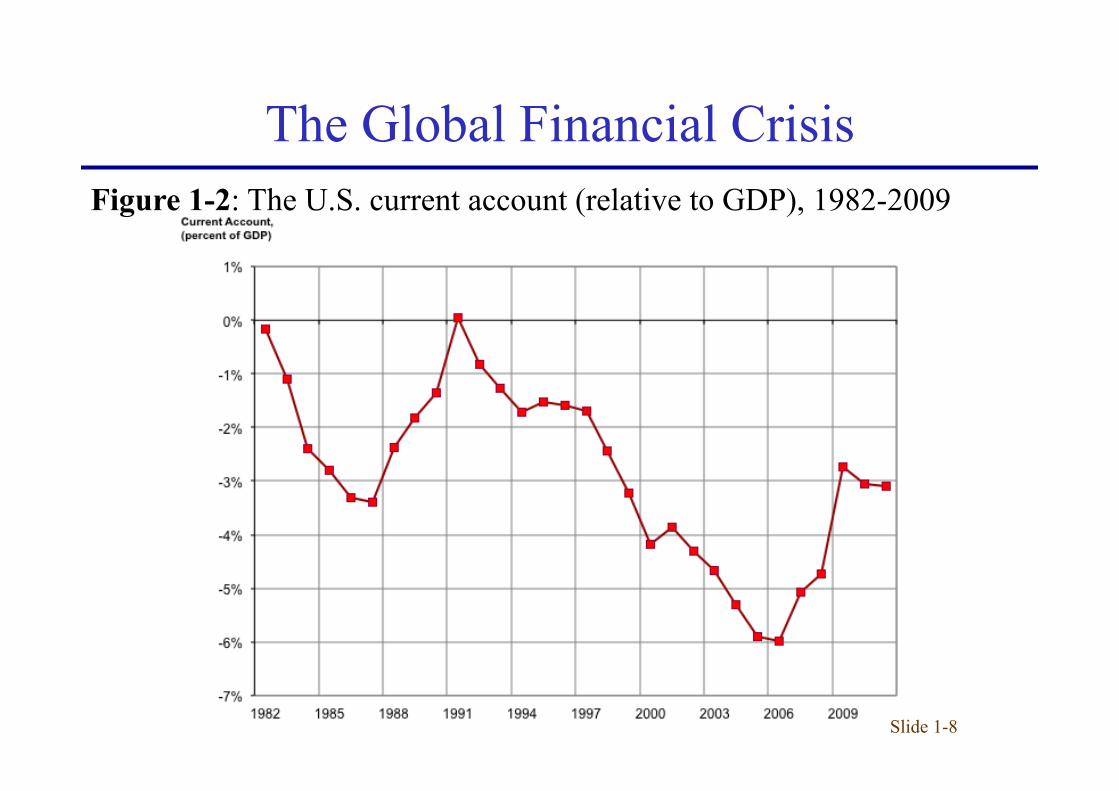
Figure 1-2: The U.S. current account (relative to GDP), 1982-2009
The Global Financial Crisis
Slide 1-9
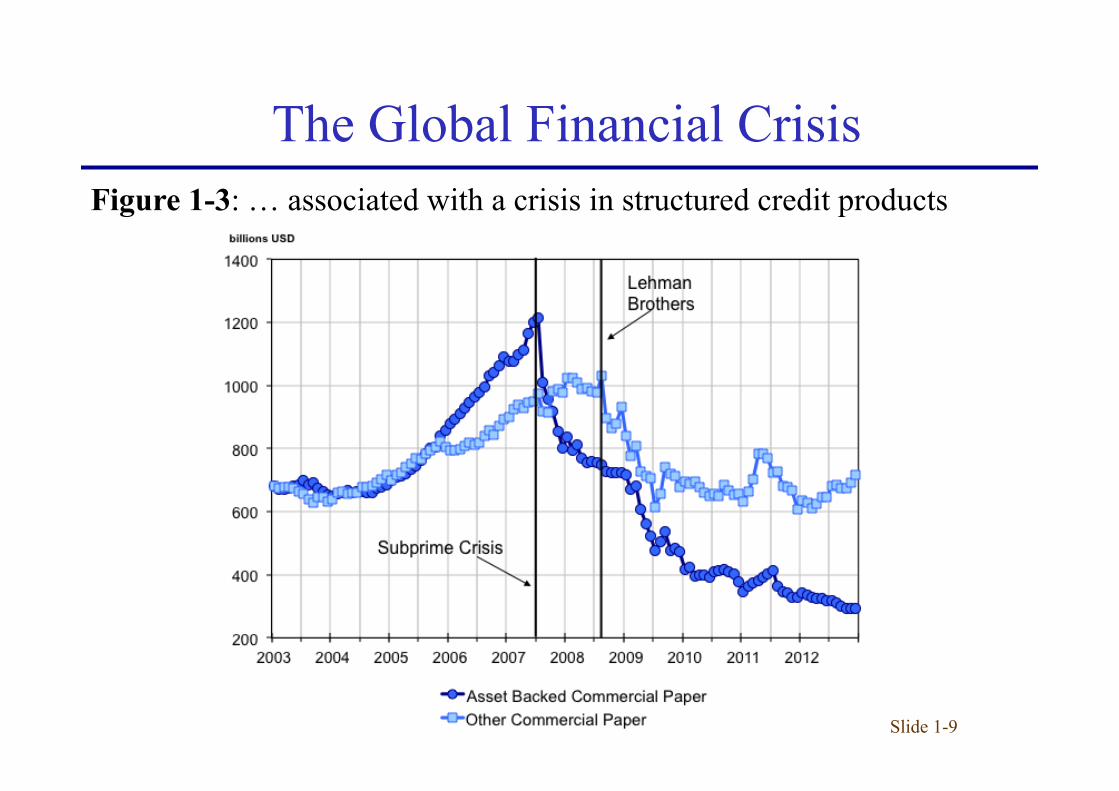
Figure 1-3: … associated with a crisis in structured credit products
The Global Financial Crisis

Slide 1-10
Figure 1-4: … and a sudden increase in counterparty risk…
The Global Financial Crisis

Slide 1-11
Figure 1-5a: … monetary policy responses in the US and in Europe
The Global Financial Crisis
Interest rates (percentage points)

Slide 1-12
Figure 1-5b: … followed by non-conventional monetary policies
The Global Financial Crisis

Slide 1-13
Figure 1-5c: … Balance Sheet of the US Federal Reserve (millions of $)
The Global Financial Crisis

Slide 1-14
Figure 1-6a: …while economic activity collapsed and rebounded…
The Global Financial Crisis

Slide 1-15
Figure 1-6b: … And world trade collapsed
The Global Financial Crisis
Slide 1-16
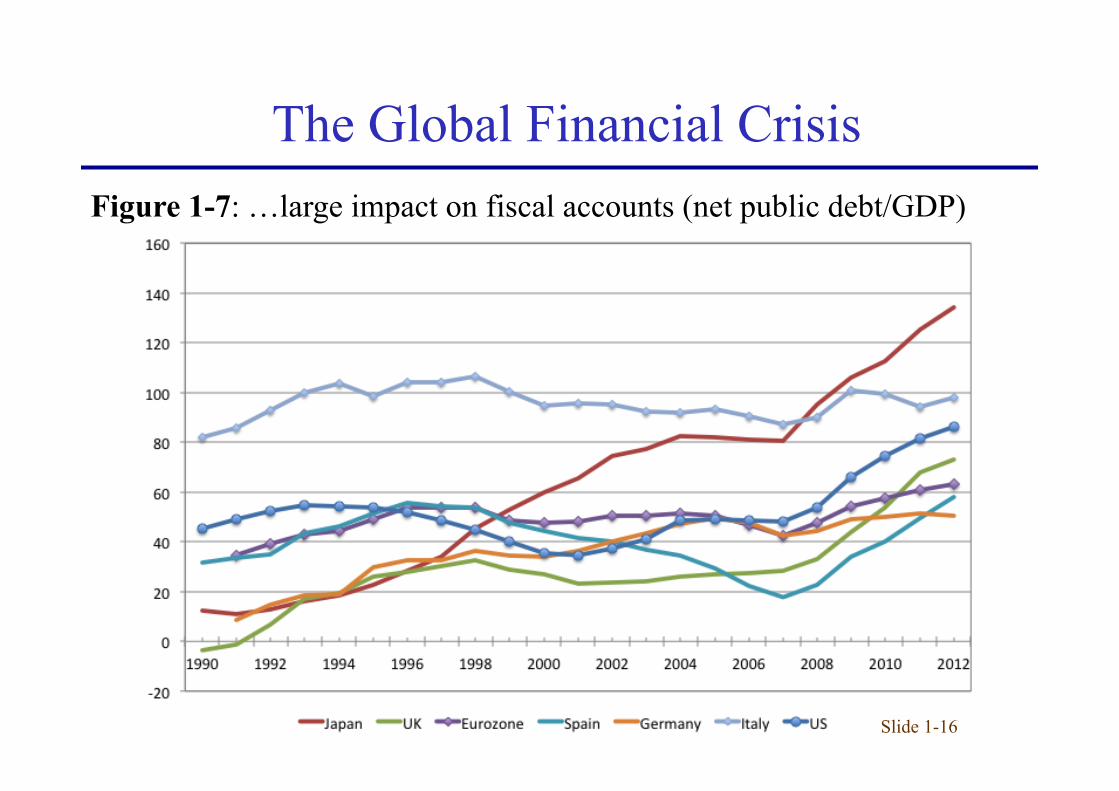
Figure 1-7: …large impact on fiscal accounts (net public debt/GDP)
The Global Financial Crisis

Slide 1-17
Figure 1-8: …and a period of severe fiscal stress for Eurozone countries (yield on 10-year government debt. Percent)
The Eurozone Crisis

Slide 1-18
Figure 1-9: ‘Eurozone’ Current Account Imbalances, 1993-2013
The Eurozone Crisis

Slide 1-19
§ Understanding international linkages
§ Understand the relevant policy choices
§ Understanding ‘global imbalances’
§ Understanding exchange rates
What is International Macro About?

slide 1-20
§ Essential tool for studying the macroeconomics of open, interdependent economies.
§ National income accounting • Records all the expenditures that contribute to a
country’s income and output § Balance of payments accounting
• Keeps track of changes in a country’s indebtedness to foreigners and of the fortunes of its export- and import-competing industries
The National Income Accounts

slide 1-21
§ Gross Domestic product (GDP, notation Y) • The value of all final goods and services produced
domestically and sold on the market in a given time period.
• It is the basic measure of a country’s output.
The National Income Accounts

slide 1-22
§ GDP is calculated by adding up the market value of all expenditures on final output:
• Consumption (C)
• Investment (I)
• Government purchases (G)
• Net Exports (NX=EX-IM)
The National Income Accounts
slide 1-23
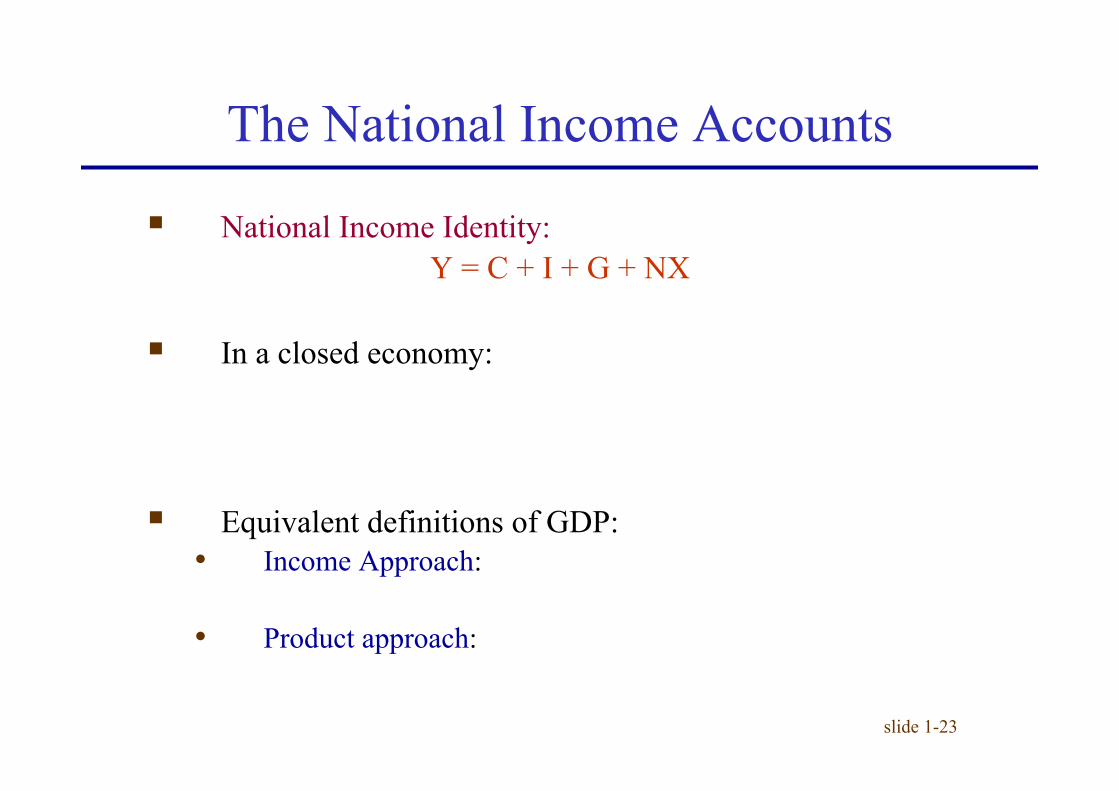
§ National Income Identity: Y = C + I + G + NX
§ In a closed economy:
§ Equivalent definitions of GDP: • Income Approach:
• Product approach:
The National Income Accounts
slide 1-24
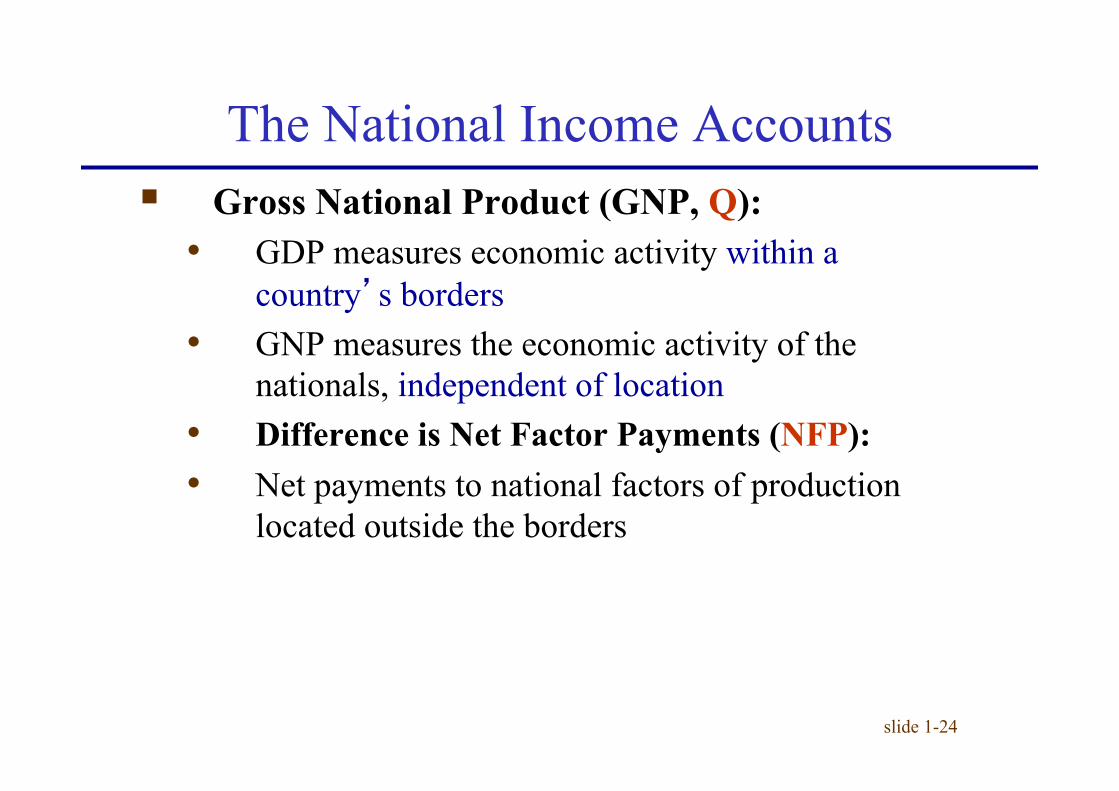
§ Gross National Product (GNP, Q): • GDP measures economic activity within a
country’s borders • GNP measures the economic activity of the
nationals, independent of location • Difference is Net Factor Payments (NFP): • Net payments to national factors of production
located outside the borders
The National Income Accounts

slide 1-25
The National Income Accounts § Formally:
Q = Y + NFP
Q = C + I + G + CA
• CA = NX + NFP : Current Account

slide 1-26
The National Income Accounts § Figure 1-10: U.S. GNP and Its Components, 2011 (source: BEA)

slide 1-27
The National Income Accounts § Figure 1-11: U.S. Current Account, Net Exports and NFP, 2011

slide 1-29
§ The Current Account and the Trade Balance • The difference between exports of goods and services
and imports of goods and services plus NFP: CA = (EX – IM) + NFP
• Ignoring NFP: CA > 0 when EX > IM CA < 0 when EX < IM
Three Interpretations of the Current Account
slide 1-30
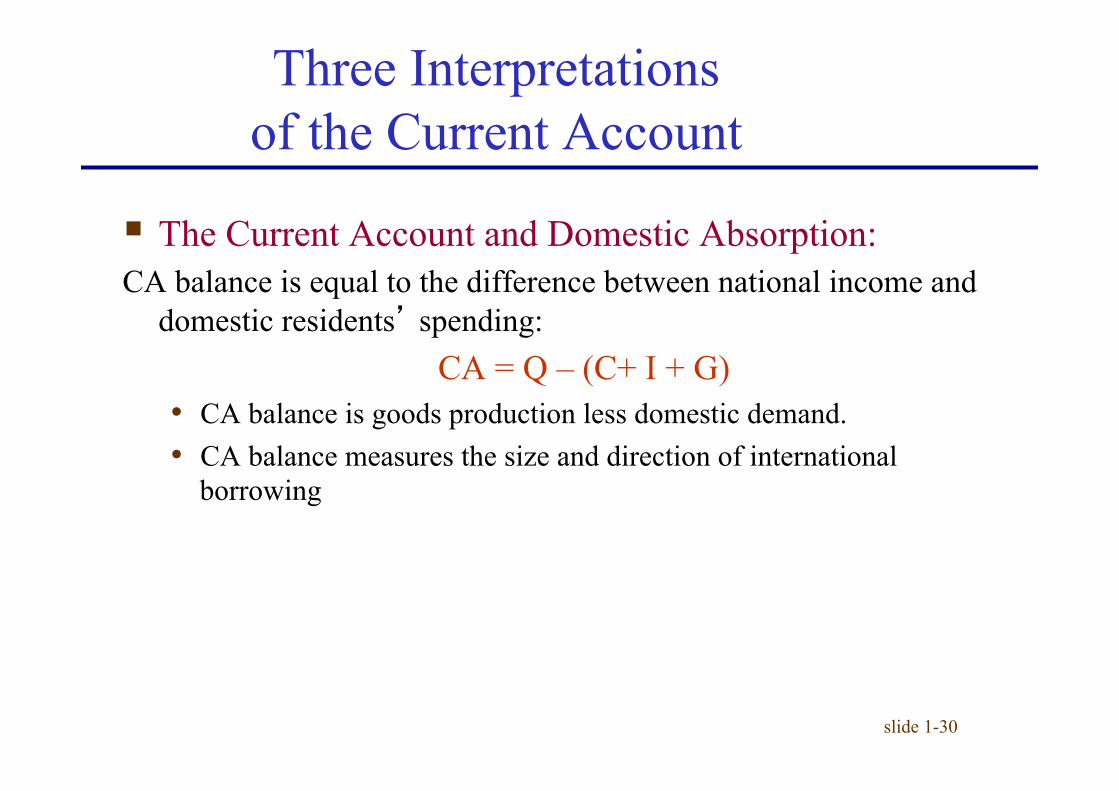
§ The Current Account and Domestic Absorption: CA balance is equal to the difference between national income and
domestic residents’ spending: CA = Q – (C+ I + G)
• CA balance is goods production less domestic demand. • CA balance measures the size and direction of international
borrowing
Three Interpretations of the Current Account

slide 1-31
§ Saving and the Current Account • National saving (S)
– The portion of output, Q, that is not devoted to household consumption, C, or government purchases, G S = S = S =
– A closed economy can save only by building up its capital stock:
– An open economy can save either by building up its capital stock or by acquiring foreign wealth
– A country’s CA surplus is referred to as its net foreign investment. CA = S - I
Three Interpretations of the Current Account

slide 1-32
§ Private and Government Saving • Private saving (Sp)
– The part of disposable income that is saved rather than consumed Sp = (Q – T) – C
– T : Taxes.
• Government saving (Sg) – T is the government's “income” (its net tax revenue) – The extent to which the government is borrowing to finance its
expenditures (opposite of government deficit) Sg = T-G
• National Saving (S) S = Sp +Sg = CA + I
– This is an identity: it must always hold!
Three Interpretations of the Current Account
slide 1-33
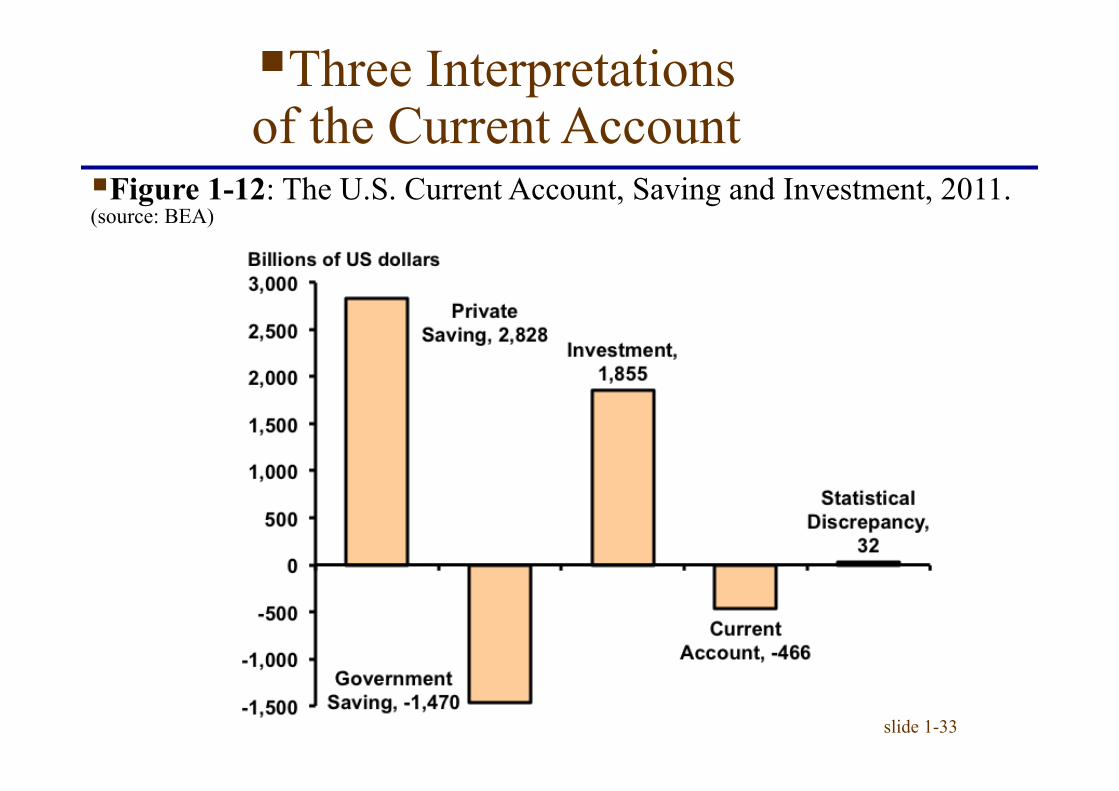
§ Figure 1-12: The U.S. Current Account, Saving and Investment, 2011. (source: BEA)
§ Three Interpretations of the Current Account
slide 1-34
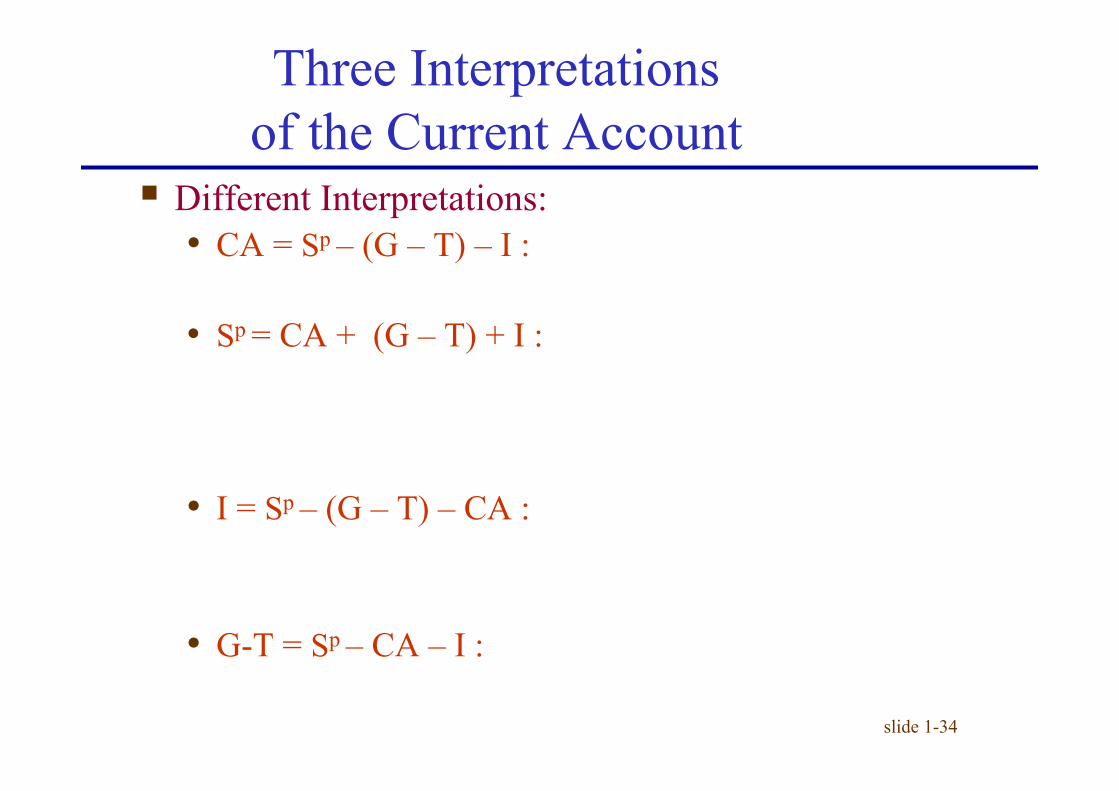
§ Different Interpretations: • CA = Sp – (G – T) – I :
• Sp = CA + (G – T) + I :
• I = Sp – (G – T) – CA :
• G-T = Sp – CA – I :
Three Interpretations of the Current Account

slide 1-35
Figure 1-13: The U.S. Current Account, Saving and Investment 1980-2011 (source BEA)
§ Three Interpretations of the Current Account
slide 1-36
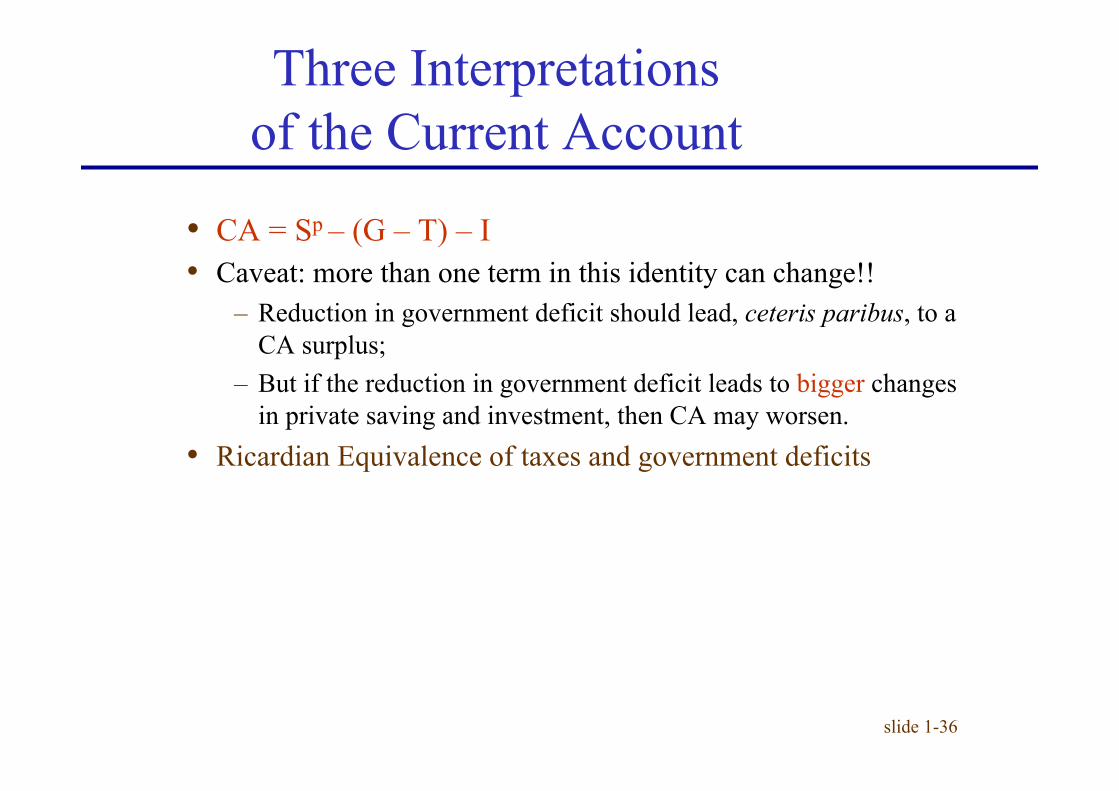
• CA = Sp – (G – T) – I • Caveat: more than one term in this identity can change!!
– Reduction in government deficit should lead, ceteris paribus, to a CA surplus;
– But if the reduction in government deficit leads to bigger changes in private saving and investment, then CA may worsen.
• Ricardian Equivalence of taxes and government deficits
Three Interpretations of the Current Account

slide 1-37
The Balance of Payments Accounts § A country’s balance of payments accounts keep track
of both its payments to and its receipts from foreigners. § Convention:
• Any payment to foreigners enters with as a debit.
• Any payment from foreigners enters as a credit.
slide 1-38
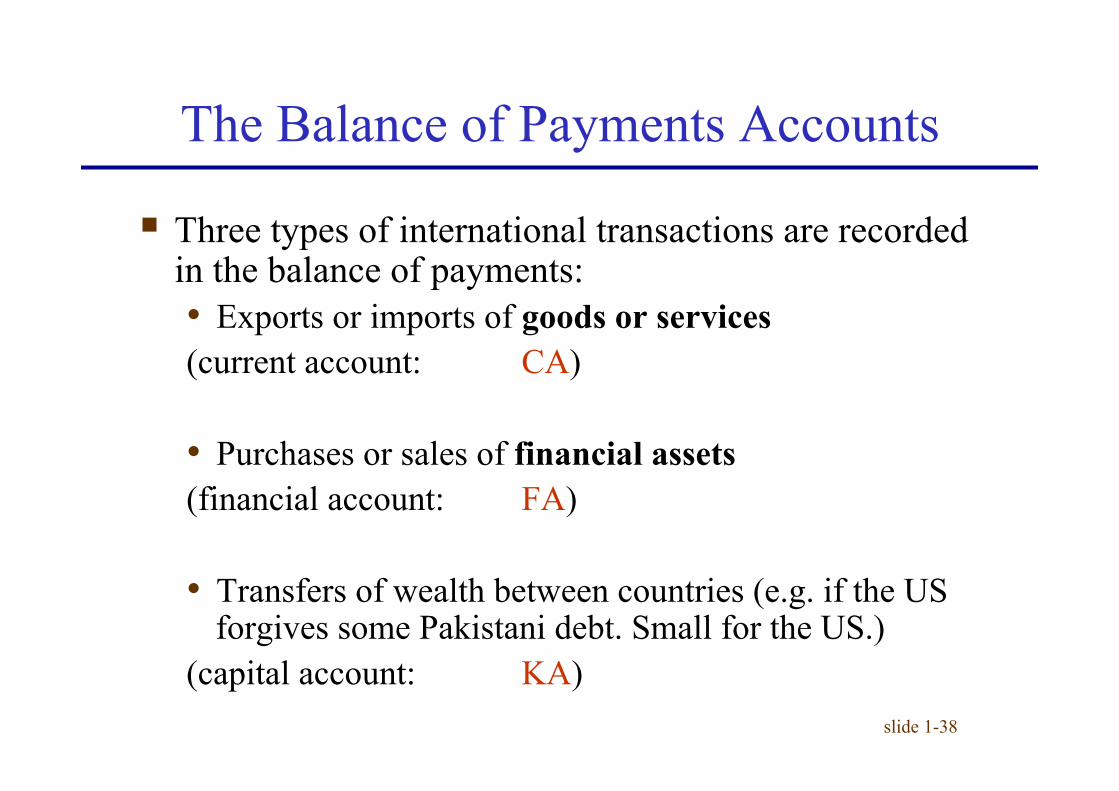
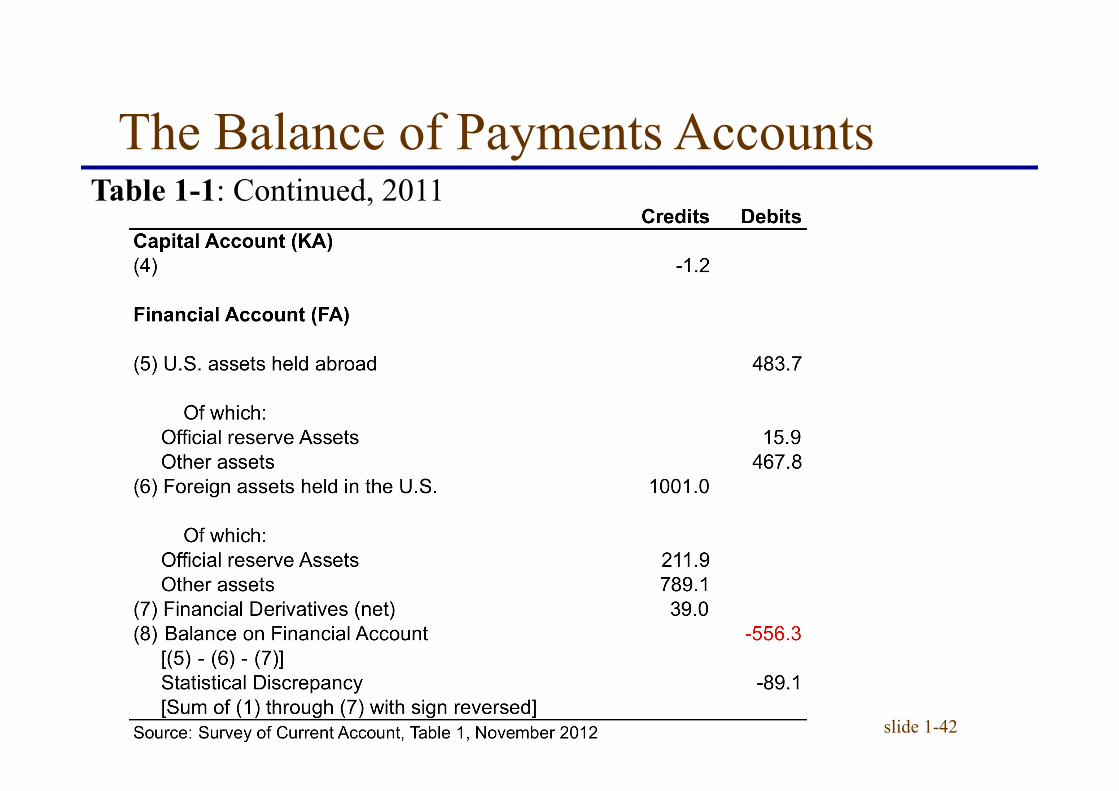
§ Three types of international transactions are recorded in the balance of payments: • Exports or imports of goods or services (current account: CA) • Purchases or sales of financial assets (financial account: FA) • Transfers of wealth between countries (e.g. if the US
forgives some Pakistani debt. Small for the US.) (capital account: KA)
The Balance of Payments Accounts
slide 1-39
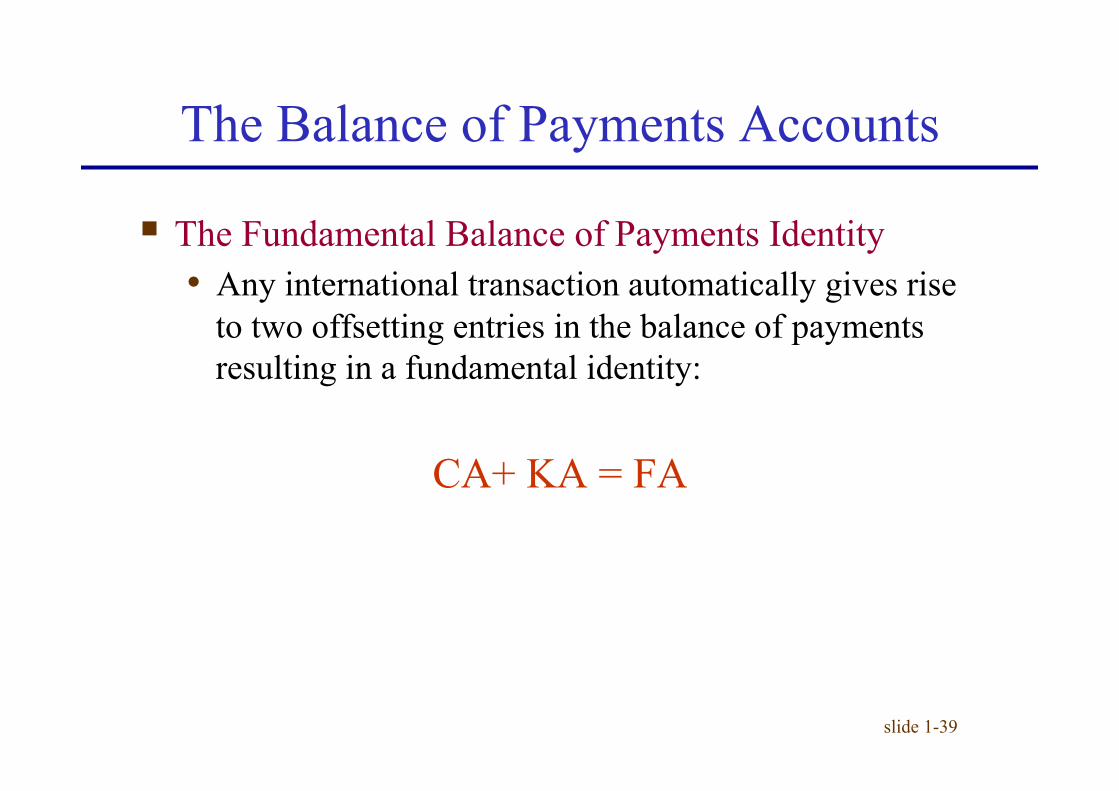
§ The Fundamental Balance of Payments Identity • Any international transaction automatically gives rise
to two offsetting entries in the balance of payments resulting in a fundamental identity:
CA+ KA = FA
The Balance of Payments Accounts

slide 1-40
§ Examples of Paired Transactions • A U.S. citizen buys a $1000 tablet PC from a Chinese
company, and the Chinese company deposits the $1000 in its account at Citibank in New York.
The Balance of Payments Accounts

slide 1-41
The Balance of Payments Accounts Table 1-1: U.S. Balance of Payments Accounts for 2011 (bn of dollars)
slide 1-42
The Balance of Payments Accounts Table 1-1: Continued, 2011

Slide 1-48
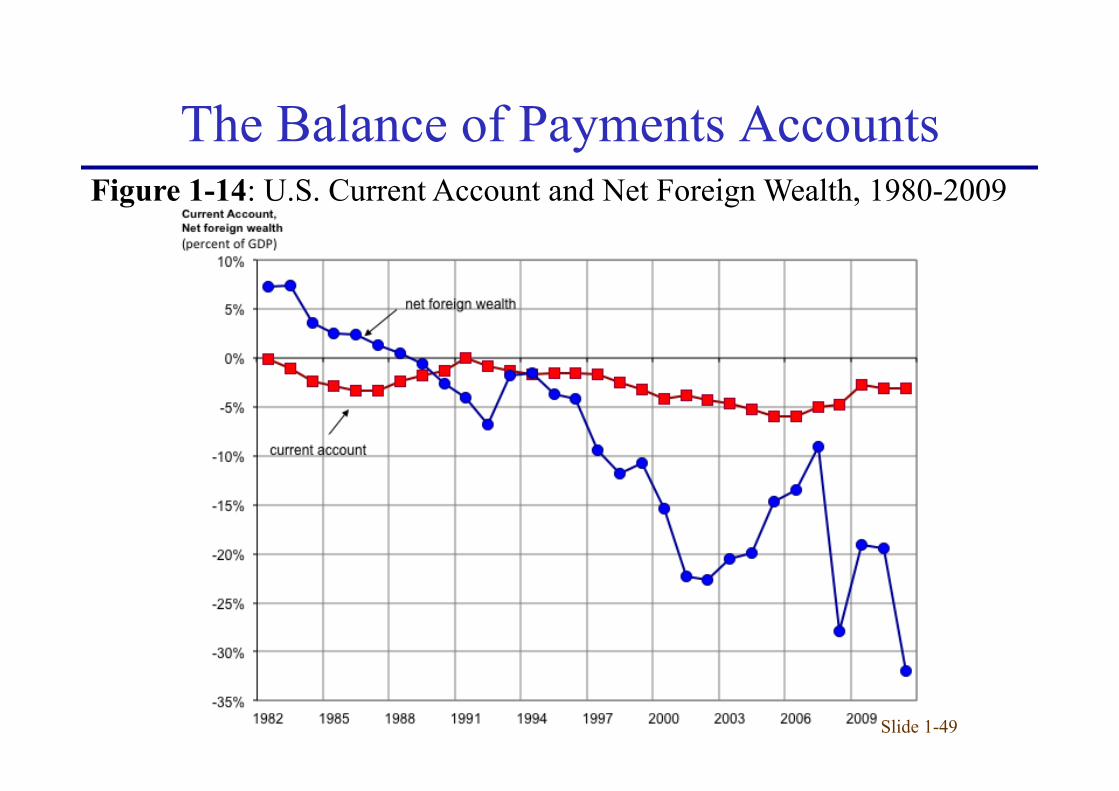
§ Is the United States the World’s Biggest Debtor? • At the end of 2011, the United States had a negative
net foreign wealth position far greater than that of any other single country.
• The United States is the world’s biggest debtor. • However, the United States has the world’s largest
GNP.
The Balance of Payments Accounts
Slide 1-49
Figure 1-14: U.S. Current Account and Net Foreign Wealth, 1980-2009
The Balance of Payments Accounts

Slide 1-50
Table 1-2: International Investment Position of the United States at Year End, 2010 and 2011 (millions of dollars)
The Balance of Payments Accounts
(a) (b) (c ) (d) (a+b+c+d)
with DI positions at current cost -2,584.0 -517.3 -802.0 -23.0 -230.1 -1,572.4 -4,156.4 with DI positions at market value -2,923.9 -517.3 -1,284.0 -41.3 -172.3 -2,014.9 -4,938.8U.S. assets owned abroad with DI positions at current cost 16,646.1 483.7 -519.5 -28.9 -153.6 -218.3 16,427.8 with DI positions at market value 17,105.9 483.7 -1,163.9 -46.7 -132.9 -859.8 16,246.1Foreign owned assets in the U.S. with DI positions at current cost 19,230.1 1,001.0 282.5 -5.9 76.5 1,354.1 20,584.2 with DI positions at market value 20,029.8 1,001.0 120.1 -5.4 39.4 1,155.1 21,184.9
Source: Survey of Current Business, July 2012, excluding derivatives. DI: direct investment. Millions of USD.
Net international investment position of the U.S.
Position 2010
Changes in position in 2011 (decrease(-))
Position 2011
Attributable to:
TotalFinancial Flows
Valuation AdjustmentsPrice
changesExchange
rate Other
slide 1-51
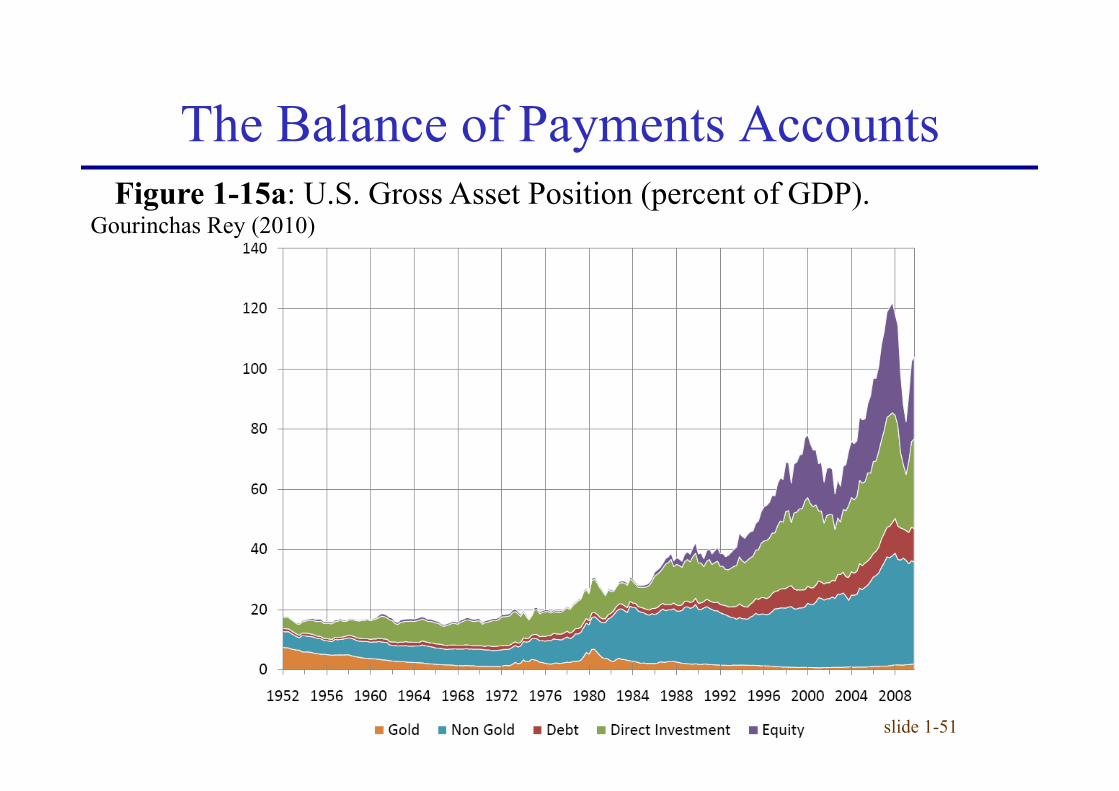
Figure 1-15a: U.S. Gross Asset Position (percent of GDP). Gourinchas Rey (2010)
The Balance of Payments Accounts

slide 1-52
Figure 1-15b: U.S. Gross Asset Position (percent of GDP). Gourinchas Rey (2010)
The Balance of Payments Accounts

slide 1-53
Table 1-3: Exorbitant Privilege? Gourinchas Rey (2007)
The Balance of Payments Accounts
slide 1-54
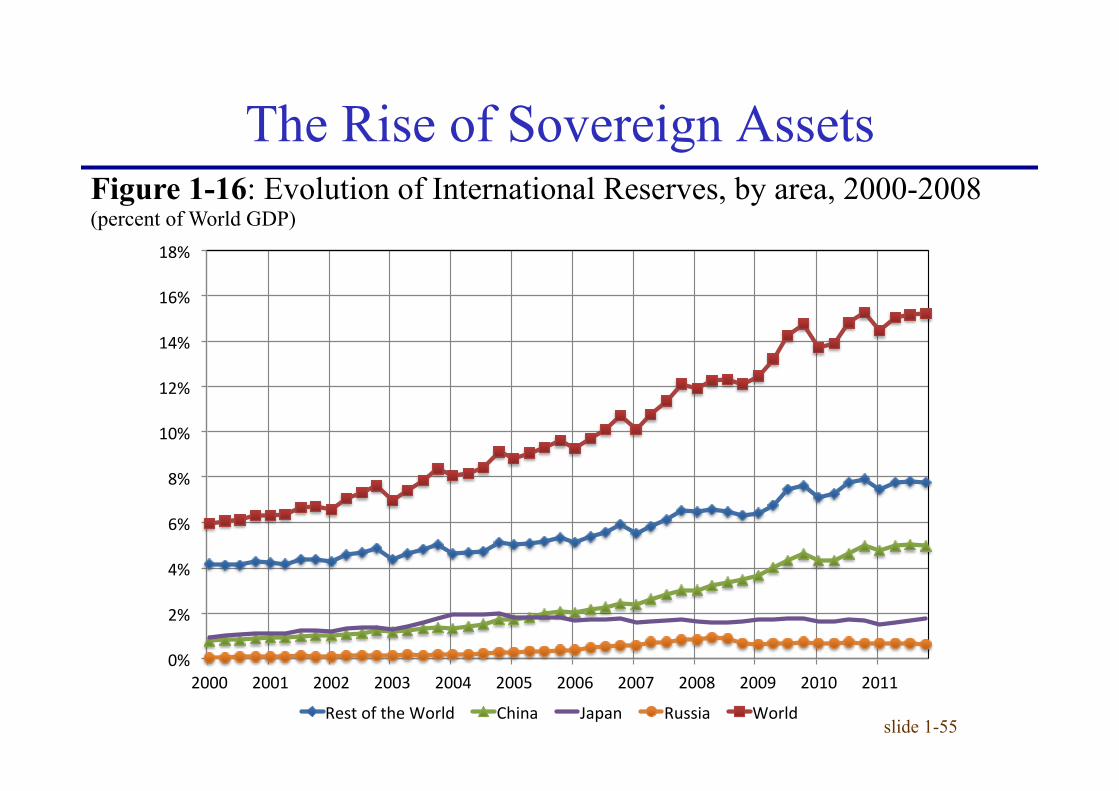
The Rise of Sovereign Assets
§ Sovereign Assets: • International Reserves (in the ORT) • Sovereign Wealth Funds
§ The rise of International Reserves • The counterpart of US CA deficits:
– Private capital inflows (especially before 2002) – But growing inflows from foreign central banks
• Over time, foreign, especially emerging, countries have accumulated vast “treasure chests” of US Treasury bills.
0%#
2%#
4%#
6%#
8%#
10%#
12%#
14%#
16%#
18%#
2000# 2001# 2002# 2003# 2004# 2005# 2006# 2007# 2008# 2009# 2010# 2011#
Rest#of#the#World# China# Japan# Russia# World#
slide 1-55
Figure 1-16: Evolution of International Reserves, by area, 2000-2008 (percent of World GDP)
The Rise of Sovereign Assets

slide 1-56
The Rise of Sovereign Assets
§ Why do countries accumulate reserves?

slide 1-57
The Rise of Sovereign Assets
§ The problem: • Typically, Central Banks invest in safe, liquid assets
(US Treasury bills and the like) • The financial return on these is quite low. • In addition, oil and commodity producing countries
want to invest in a diversified, high-return portfolio of assets (long horizon).
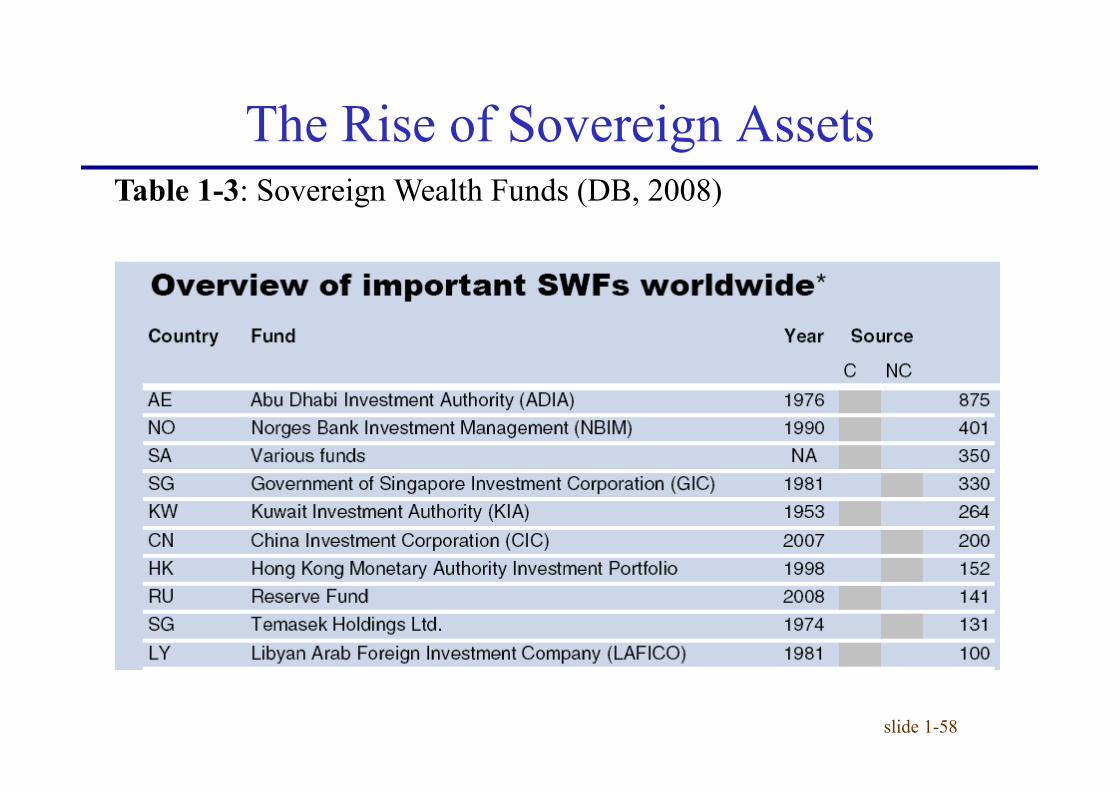
§ The answer: Sovereign Wealth Funds: • Financial vehicles owned by States which invest public
funds in a wide range of assets. • Examples: GIC (Singapore), Abu Dhabi Investment
Authority (UAE) etc…
slide 1-58
Table 1-3: Sovereign Wealth Funds (DB, 2008)
The Rise of Sovereign Assets


![Lecture 4 [0.3cm] Tax structures: production efficiency ...econ.sciences-po.fr/sites/default/files/file/laroque/lect4.pdf · Tax structures: production e ciency and ... Destructive](https://img.pdfslide.us/doc/110x75/5ab224fc7f8b9a284c8d458a/lecture-4-03cm-tax-structures-production-efficiency-econsciences-pofrsitesdefaultfilesfilelaroquelect4pdftax.jpg)