Embed Size (px)
Citation preview

31/01/17
1
Open economy national income identities and the balance of payments
Motivations: • Global imbalances and the US current account deficit • Current account imbalances and the euro zone crisis • Current accounts of emerging markets: the next crisis? • Is there an “exorbitant privilege” of the dollar? Roadmap: 1) Open economy accounting (review) 2) Balance of payments and the net foreign wealth 3) Valuation effects, the exorbitant privilege and the
adjustment mechanisms to global imbalances
Open economy national income identities : Saving, investment and the current account
• Fondamental identity Y= C + I + G + EX - IM
• Y: GDP • C: Consumption • I: Investment • G: public spending • EX: Exports of goods and services • IM: Imports • Current account (sometimes net exports):
CA= EX-IM

31/01/17
2
GDP and GNP In international accounting standards
• GDP (Gross Domestic Product): value of all final goods and services produced within national borders (on a given period)
• GNP (Gross national product): value of all final goods and services produced by national factors of production (on a given period)
• GNP = GDP + net receipts of factor income from the ROW; (income domestic residents earn on wealth held in ROW – payments domestic residents make to foreigners who own wealth located in domestic economy)
• Usually small difference (except Ireland, GNP much smaller than GDP because of multinationals)
• Here, we focus on GDP : + mostly ignore net factor payments (GNP-GDP)
Fondamental identity for US, France, China 2015 Y(GDP)= C+I+G+EX-IM; (€/$ ≈ 1.07)
France in billions € US in billions $ (% of GDP) Y: 2181 Y: 18 567
C: 1202 (55.1%) C: 12 751 (68.7%)
I: 488 (22.4%) I: 3037 (16.3%)
G: 522 (24.0%) G: 3279 (17.7%)
EX: 655 (30.0%) EX: 2232 (12.0%)
IM: 685 (31.4%) IM: 2732 (14.7%)
CA= EX-IM= - 30 (-1.4%) CA= -500 (-2.7%)
China: C=38.6% % G=13.8% I= 44.7 % ; X=22.1%; IM=18.6%
GDP (9962 billions$)
31/01/17
3
Saving, investment and the current account
S = Y- C – G and Y = C + I +G +EX -IM
S+Y=Y-C-G+C+I+G+EX-IM
so S - I = EX - IM = CA or I = S - CA - a country can finance its investment through domestic saving or through borrowing abroad if CA < 0 (net external debt increases: sale of assets to ROW) - Saving can be invested nationally (I) or abroad (if CA > 0; purchase of assets to ROW):
Budget deficit and current account
Private saving: SP = Y - T - C
Public saving: SG = T - G (budget deficit if <0 )
Y = C + I + G + EX –IM so
SP = C + I + G + EX -IM - T – C so
SP = I + G + EX - IM - T or
CA = EX - IM = SP - I + SG = S -I
Deficit of the current account if <0

31/01/17
4
CA = EX - IM = SP - I +T - G = S - I
Accounting identity (no behaviour, no explanation, no theory here) A current account deficit can reflect: - low saving rate (high consumption) (US from 2000, Spain) - High investment (US 1995-2000, Spain) - budget deficit (Greece) and « twin deficits», Reagan years (but G may SP : ricardian equivalence)
- current account surplus can reflect recession (Spain after crisis) - current account surplus may reflect large saving or restrictive fiscal policy (Germany)
NOTE: tariffs don’t matter (≠ Trump economics)
Budget deficit and current account
31/01/17
5
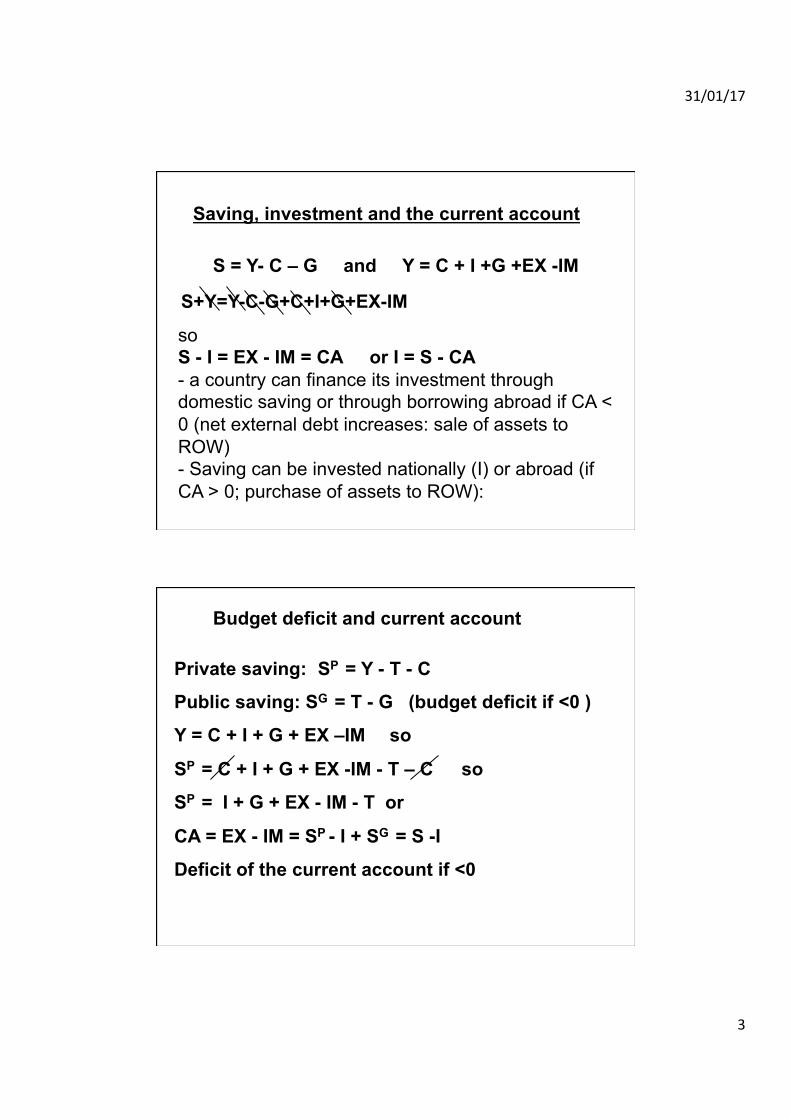
China: CA = S -I
Source IMF 2014
Global imbalances have increased before crisis and then decreased: Current account balances (in percent of world GDP)

31/01/17
6
Source IMF 2014
Eurozone imbalances have increased before crisis and then disappeared: Current account balances (in percent of eurozone GDP)
Saving and Investment Trends (in percent of domestic GDP)
31/01/17
7
« Good » and « bad » imbalances no obvious normative judgement on sign (if not size) of CA « Good » imbalances: S > I : aging countries (anticipation of later dissaving) I > S : high return to investment: finance part of I through
foreign saving But no if reflects: Domestic Distortions - High private saving (China) : lack of social insurance - Low private saving (US): asset bubbles (real estate, Spain) - Public borrowing (disaving) or excessive public saving (if
sustained CA surplus): political economy distortions
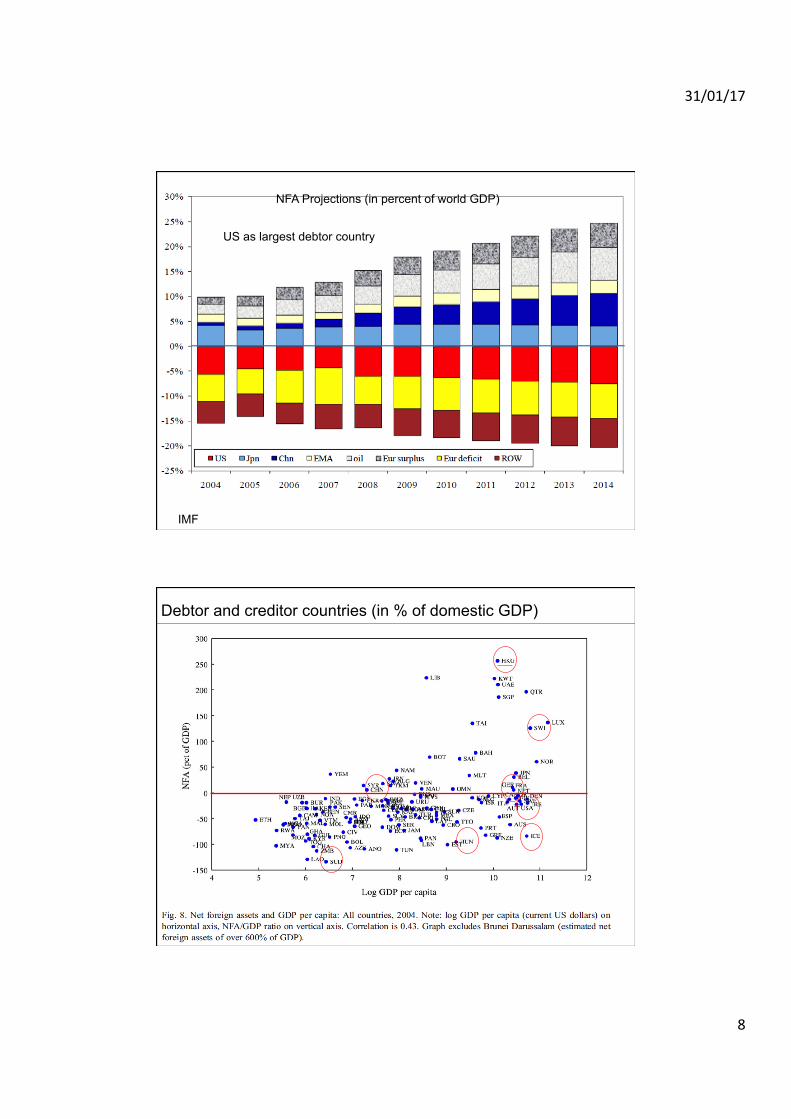
Current accounts and net foreign asset Accumulating CA deficits leads to a negative NFA (net foreign
assets) position with the ROW (also called Net international investment position (NIIP)
Accounting (forget capital gains and losses, valuation effects):
If a country in year t has a CA deficit, its net external position (or NFA) Bt deteriorates:
CAt = Bt - Bt-1 Flow
Net external position (NFA) in t is NFA in t-1 + CA value
Stock (wealth): Bt = Bt-1 + CAt
Bt < 0 if debtor country: value of the foreign assets it holds < value of domestic assets held by foreigners
31/01/17
8
NFA Projections (in percent of world GDP)
IMF
US as largest debtor country
Debtor and creditor countries (in % of domestic GDP)

31/01/17
9
Balance of Payments (BOP)
- Registers all transactions with foreign economic agents
- 3 main sorts of transactions:
- exports and imports of goods and services: current account
- sale and purchase of financial assets (money, equity, public or private debt): financial account
- certain transfers of wealth (small): capital account
All transactions enter twice in the BOP: once in debit (-) and once in credit (+)
Three types of transactions:
1) Exports (+) and imports (-) of goods and services: current account
2) Sale (+) and purchase (-) of financial assets (like exports and imports of financial assets):
Financial account
3) Some wealth transfers (migrants, debt copyrights…): small amounts
Capital account
31/01/17
10
Double entry bookkeeping: example
• A French firm buys machinery from a German firm (1M€) – Payment of French firm to foreign resident
goes in negative in current account (-1M€) – Check of French firm to German firm
deposited in French bank: German firm has bought (and French Bank has sold) an asset (a bank deposit of 1M€) : shows in positive in French financial account
Fundamental balance of payments identity
Current account + Capital account + Financial account = 0 Sum of current account (CA)+ capital account (KA) is the
change in NFA : hence necessarily it is the opposite of the financial account
A country with CA +KA <0 has to sell (export) assets abroad . Financial account in surplus. NFA deteriorates
A country with CA+KA>0 (S>I) buys (imports) assets
abroad. Financial account in deficit. NFA improves

31/01/17
11
Current account 1 Exports of goods and services and income receipts (credits) 31726932 Exports of goods and services 22611633 Goods 15103034 Services 7508605 Primary income receipts 7829156 Investment income 7758467 Compensation of employees 70698 Secondary income (current transfer) receipts /1/ 1286149 Imports of goods and services and income payments (debits) 363565810 Imports of goods and services 276152511 Goods 227286812 Services 48865713 Primary income payments 60053114 Investment income 58246615 Compensation of employees 1806516 Secondary income (current transfer) payments /1/ 273602 Capital account 17 Capital transfer receipts and other credits 018 Capital transfer payments and other debits 42 Financial account 19 Net U.S. acquisition of financial assets excluding financial derivatives (net increase in assets / financial outflow (+))22539820 Direct investment assets 34864621 Portfolio investment assets 15396822 Other investment assets -27092423 Reserve assets -629224 Net U.S. incurrence of liabilities excluding financial derivatives (net increase in liabilities / financial inflow (+))39523425 Direct investment liabilities 37943526 Portfolio investment liabilities 25093627 Other investment liabilities -23513728 Financial derivatives other than reserves, net transactions /2/ -25392 Statistical discrepancy 29 Statistical discrepancy /3/ 26778029a Of which: Seasonal adjustment discrepancy ..... Balances 30 Balance on current account (line 1 less line 9) /4/ -46296531 Balance on goods and services (line 2 less line 10) -50036132 Balance on goods (line 3 less line 11) -76256533 Balance on services (line 4 less line 12) 26220334 Balance on primary income (line 5 less line 13) 18238535 Balance on secondary income (line 8 less line 16) -14498836 Balance on capital account (line 17 less line 18) /4/ -4237 Net lending (+) or net borrowing (-) from current- and capital-account transactions (line 30 plus line 36) /5/-46300738 Net lending (+) or net borrowing (-) from financial-account transactions (line 19 less line 24 plus line 28) /5/-195227
Line 2015
US Balance of payments 2015
CA+KA+FA+ stat. disc. = 0
In billions$
-463-0+195+268 =0
2011 2012
Compte de transactions courantes -35.2 -44,4 Biens -76.6 -70.6 Services 31.5 32.6 Revenus 45.1 29.7 Transferts courants -35.2 -36.2
Compte de capital 0.03 -0.4
Compte financier 53.6 74.2 Investissements directs -15.1 -9.4 Français à l'étranger -42.8 -28.9 Etrangers en France 27.7 19.5 Investissements de portefeuille 228.5 39.2 Avoirs (résidents sur titres émis par des non-résidents) 166.6 6.3 Engagements (non-résidents sur titres émis par résidents) 61.9 32.9 Produits financiers dérivés 13.9 14.3 Autres investissements -179.3 34.1
Avoirs de réserve 5.5 -4.0
Erreurs et omissions nettes -18.4 -29.4
Source: banque de France

31/01/17
12
Valuation effects and the exorbitant privilege of the US $
• CA deficits only one factor of the evolution of the NFA position
• Valuation effects have become very large due to financial globalization and the increase in gross positions (assets and liabilities)
• Bt - Bt-1 = CAt + Change in capital gains • Change in exchange rate and/or movements in
equity markets affect value of both foreign assets held by domestic agents (assets) and domestic assets held by foreign agents (liabilities)
Valuation effects and the US deficits
• Growing divergence between accumulation of CA deficits and NFA position in US
• Period 2002-2006: with CA deficits (>5% of GDP) the US NFA position (measures the difference between the value of foreign assets held by US agents and US assets held by foreigners) barely changed: cumulative of CA deficits around $3.4 trillion ⇒ should have raised US net external liabilities to some $5.5 trillion (40% of GDP). The NFA deterioration was only $400 billion. As a ratio of GDP it actually improved.
• Where did those other $3 trillion of US net borrowing go?

31/01/17
13
US: Cumulated Current Account and Net Foreign Asset Position, Percent of GDP
US becomes net foreign debtor
Source: Gourinchas and Rey 2013
Bureau of Economic Analysis 2008
31/01/17
14
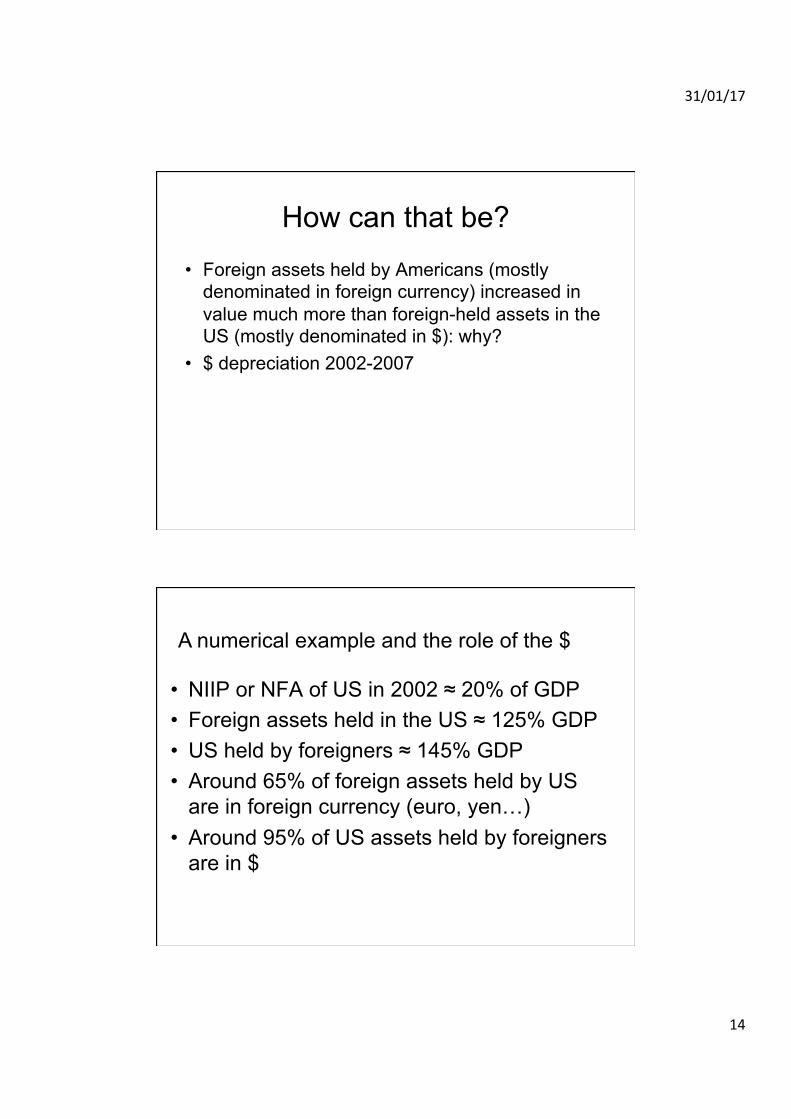
How can that be?
• Foreign assets held by Americans (mostly denominated in foreign currency) increased in value much more than foreign-held assets in the US (mostly denominated in $): why?
• $ depreciation 2002-2007
• NIIP or NFA of US in 2002 ≈ 20% of GDP • Foreign assets held in the US ≈ 125% GDP • US held by foreigners ≈ 145% GDP • Around 65% of foreign assets held by US
are in foreign currency (euro, yen…) • Around 95% of US assets held by foreigners
are in $
A numerical example and the role of the $
31/01/17
15
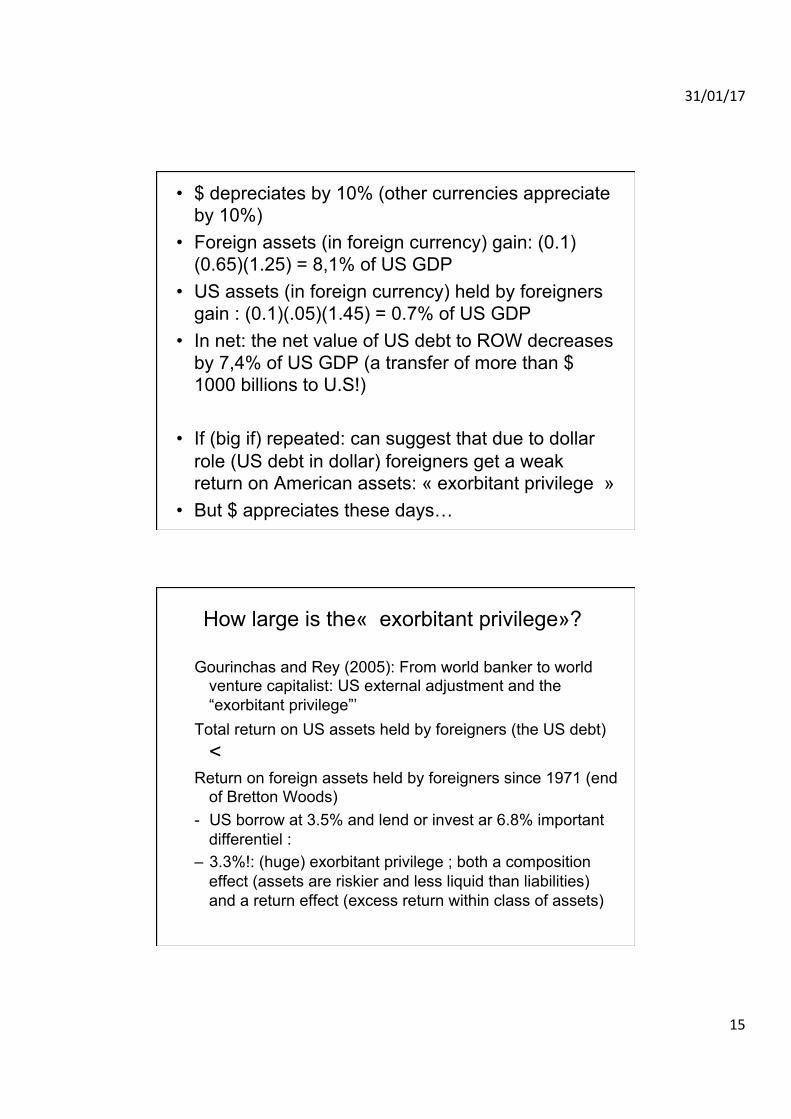
• $ depreciates by 10% (other currencies appreciate by 10%)
• Foreign assets (in foreign currency) gain: (0.1)(0.65)(1.25) = 8,1% of US GDP
• US assets (in foreign currency) held by foreigners gain : (0.1)(.05)(1.45) = 0.7% of US GDP
• In net: the net value of US debt to ROW decreases by 7,4% of US GDP (a transfer of more than $ 1000 billions to U.S!)
• If (big if) repeated: can suggest that due to dollar role (US debt in dollar) foreigners get a weak return on American assets: « exorbitant privilege »
• But $ appreciates these days…
How large is the« exorbitant privilege»?
Gourinchas and Rey (2005): From world banker to world venture capitalist: US external adjustment and the “exorbitant privilege”’
Total return on US assets held by foreigners (the US debt) <
Return on foreign assets held by foreigners since 1971 (end of Bretton Woods)
- US borrow at 3.5% and lend or invest ar 6.8% important differentiel :
– 3.3%!: (huge) exorbitant privilege ; both a composition effect (assets are riskier and less liquid than liabilities) and a return effect (excess return within class of assets)

31/01/17
16
- Returns are not equated even within classes (no arbitrage)
- could be that assets and liabilities of US of different maturities
- role of dollar as reserve currency + liquidity of US financial markets(?): foreigners are willing to hold underperforming US assets because more liquid (exorbitant privilege or dark matter)
- composition effect: assets are in risky/high return (equity/fDI), liabilities are in low returns bonds: does not play very important role