Embed Size (px)
Citation preview
Human Capital and Industrialization:
Theory and Evidence from the Enlightenment∗
Mara P. Squicciarini Nico VoigtländerKULeuven and FWO UCLA and NBER
March 2014
Abstract
While human capital is one of the strongest predictors of economic development today, its impor-tance for the Industrial Revolution is typically assessed as minor. We differentiate average humancapital (worker skills) from upper tail knowledge both theoretically and empirically. We introducethe two types of human capital in a simple multi-sector model of industrialization that differentiatesbetween traditional and modern manufacturing. While average worker skills are more importantin the former, upper tail knowledge raises efficiency in the latter. The model predicts that the localpresence of knowledge elites is unimportant in the pre-industrial era, but drives growth thereafter;worker skills, in contrast, are not crucial for growth. To measure the historical presence of knowl-edge elites, we use city-level subscriptions to the famous Encyclopédie in mid-18th century France.We show that subscriber density is a strong predictor of city growth after 1750, but not before theonset of French industrialization. Variables that proxy for the level of development confirm thispattern: soldier height and industrial activity are strongly associated with subscriber density after,but not before, 1750. Literacy, on the other hand, does not predict growth. Finally, joining data onBritish patents with a large French firm survey from 1837, we show that locations with higher sub-scriber density were significantly more productive in operating innovative industrial technology.
JEL: J24, N13, O14, O41
Keywords: Human Capital, Industrial Revolution, Regional Development
∗We would like to thank Ran Abramitzky, Quamrul Ashraf, Sascha Becker, Leonardo Bursztyn, Davide Cantoni,Matteo Cervellati, Nick Crafts, Paola Giuliano, Stelios Michalopoulos, Suresh Naidu, Nathan Nunn, Enrico Spolaore,Jo Swinnen, Joachim Voth, Fabian Waldinger, Ludger Woessmann, and Noam Yuchtman, as well as seminar audiencesat IPEG Barcelona, KU Leuven, and the University of Munich for helpful comments and suggestions. We are gratefulto Tomas E. Murphy for sharing digitized data of Annuaires Statistiques de la France, to Carles Boix for sharing dataon proto-industrialization in France, to Jeremiah Dittmar for his data on ports and navigable rivers, and to DanielHicks for sharing geo-coded data on soldier height from Komlos (2005).

The genre of modern industrial production requires extended knowledge of mechanics, no-tion of calculus, great dexterity at work, and enlightenment in the underlying principlesof the crafts. This combination of expertise . . . has only been achieved in this [18th cen-tury] period, where the study of science has spread widely, accompanied by an intimaterelationship between savants and artisans. (Chaptal, 1819, p.32)
1 Introduction
While a rich literature shows that human capital is strongly associated with economic developmentin the modern world,1 its role during the Industrial Revolution is typically described as minor. InBritain – the cradle of industrialization – education was inessential for economic growth (Mitch,1993; Clark, 2005); and referring to Europe in general, Galor (2005) points out that "in the firstphase of the Industrial Revolution . . . [h]uman capital had a limited role in the production process,and education served religious, social, and national goals."2 However, these observations are basedon education or skills of the average worker. This may veil the role of scientifically savvy engineersand entrepreneurs at the top of the skill distribution. Mokyr (2005a) stresses the importance of this"density in the upper tail" for innovation and the diffusion of technology during industrialization.Recent research on contemporaneous economies chimes in, underlining the importance of mathand science skills, or of entrepreneurial skills, in addition to average education (Hanushek andKimko, 2000; Gennaioli, La Porta, Lopez-de-Silanes, and Shleifer, 2013).
In this paper, we ask whether distinguishing between upper-tail and average skills may rein-state the importance of human capital during the transition from stagnation to growth. Answeringthis question hinges on a historical proxy for the thickness of the upper tail, i.e., the presence ofknowledge elites.3 We use a novel measure from the eve of industrialization in mid-18th centuryFrance: subscriptions to the Encyclopédie – the cornerstone of Enlightenment, representing themost important collection of scientific and technological knowledge at the time. One of the pub-lishers kept a list of all (more than 8,000) subscriptions to the most prominent edition. Based onthis information, we calculate subscriber density for almost 200 French cities and use it as a proxyfor the local concentration of knowledge elites. Figure 1 shows that regions with high and low
1See, among many others, Barro (2001), Krueger and Lindahl (2001), Cohen and Soto (2007), Hanushek andWoessmann (2008), and Ciccone and Papaioannou (2009).
2Galor (2005, p.205). The low schooling rate in Britain underlines this point: as late as 1855, at the end of the firstIndustrial Revolution, primary schooling enrollment was 11% (Flora, Kraus, and Pfenning, 1983). Focusing on analternative skill measure in a panel of European countries, Allen (2003, p.433) concludes that "literacy was generallyunimportant for growth."
3Following Mokyr (2005a), we use a broad definition of "upper tail knowledge": it reflects an interest in scientificadvances, motivated by the Baconian notion that knowledge is at the heart of material progress. This concept comprisesinnovative and entrepreneurial capabilities in adopting and improving new technology, but also lower access costs tomodern techniques; it is thus compatible with Mokyr’s notion of (economically) ‘useful knowledge’. When referringto the local presence of people embodying such knowledge, we use the term "knowledge elite".
1

values are relatively evenly distributed and often immediately adjacent. In addition, subscriberdensity is uncorrelated with literacy rates in the same period (see Figures 1 and A.4), allowing usto differentiate between average and upper tail skills.
To guide our analysis, we build a simple multi-sector, multi-region model of industrializationin the spirit of Hansen and Prescott (2002). The model features an agricultural sector, as well astraditional and modern manufacturing. Distinguishing between the latter two is crucial for ourresults; it allows upper tail and average skills to have different effects for each type of manufac-turing. We assume that upper tail knowledge raises the efficiency of entrepreneurs that operatemodern manufacturing. Average worker skills, on the other hand, raise productivity in all sectors,and this effect is particularly strong in traditional manufacturing (O’Rourke, Rahman, and Taylor,2008). Technological progress takes the form of exogenous efficiency increases in modern indus-trial technology. This makes modern manufacturing more attractive, especially so in regions witha thick upper tail of knowledge. Thus, income and industrial employment grow faster in these re-gions. However, this relationship holds only after the modern technology has reached a sufficientlyhigh level of efficiency; in pre-industrial times, there is no association between upper tail knowl-edge and growth because modern manufacturing is too inefficient to compete with its traditionalcounterpart.
The model predicts very different effects for average human capital. Because it is particu-larly useful in traditional manufacturing, high endowment with worker skills attracts employmentaway from the other sectors. This effect is strong for agriculture (the least intensive in workerskills), and it also holds to a limited degree for modern industrial production (with an intermediatedependence on worker skills). This leads to the predictions that i) pre-industrial manufacturingis predominantly located in areas with higher average worker skills; ii) this pattern prevails af-ter industrialization; and iii) because high average skills reduce the share of modern industrialproduction, they are (moderately) negatively associated with growth.
We collect a host of outcome variables to test the model predictions. First, using city size inFrance between 1400 and 1850, we find that subscriber density was strongly associated with citygrowth after 1750 – when French industrialization started – but not before that date. Figure 2 illus-trates this finding, using a consistent set of cities that are observed over our full sample period. Thecoefficient on subscriber density is almost six times larger after 1750 – it rises from 0.037 to 0.218,and the difference is highly significant, with the two 95% confidence intervals not overlapping. Incontrast, 18th century literacy (proxying for average human capital) is negatively associated withcity growth during industrialization. We obtain the same results when using pre-1750 member-ship in scientific societies as an alternative proxy for upper tail knowledge. Exploiting the paneldimension, we use city fixed effects to control for unobserved characteristics. This specification
2

confirms our results, while placebo treatments with cutoff dates prior to 1750 yield no effects ofsubscriber density on city growth. Second, soldier height – proxying for income – at the Frenchdepartment level was significantly higher in areas with more encyclopedia subscriptions in theearly 19th century; for soldier height before 1750, this relationship disappears. Literacy, on theother hand, is strongly positively correlated with soldier height both before and after industrial-ization. Third, mid-19th century census data for almost 90 French departments reveal that thosewith higher subscriber density had significantly higher disposable income, industrial wages, andindustrial employment. In addition, the wage effect is strongest within modern industries (suchas textiles), and it is muted for sectors that saw less rapid technological change before 1850, suchas food processing and agriculture. On the other hand, schooling goes hand-in-hand with higherwages in all sectors, even in agriculture. Fourth, in the pre-industrial era, proto-industrial activ-ity was higher in regions that had higher literacy as early as 1686, but it was not associated withsubscriber density. In sum, results from different sources and periods strongly support our modelpredictions: Upper tail knowledge is strongly associated with growth during industrialization. Av-erage human capital, in contrast, was associated with higher income and wage levels before andafter industrialization; but it cannot explain modern growth.
Our results can be interpreted in the context of Mokyr’s (2002; 2005b) seminal work on theimportance of upper tail knowledge for modern growth. Importantly, we do not argue that theencyclopedia caused such knowledge at the local level. In fact, knowledge elites were presentprior to 1750, and their spatial distribution was stable over time – we show that early scientificsocieties are typically found in the same locations that later saw high subscriber density.4 Ourargument is that subscriber density reflects this distribution of knowledge elites: a substantial shareof subscribers were progressively minded and scientifically interested noblemen, administrativeelites, and entrepreneurs.5 These elites, in turn, were crucially involved in industrial development.While local upper tail knowledge has deeper historical roots (that go beyond the scope of thispaper), we show that it was only ‘activated’ after it became economically useful – with the adventof modern innovative technology.
Further to the historical support for the mechanism, we also collect novel data to show thatknowledge elites were important for the adoption and diffusion of innovative industrial technol-
4The spatial dispersion of scientific activity in early modern Europe is well-documented; it was driven by a varietyof factors, most of them unrelated to pre-industrial economic activity: Livingstone (2003, p.181) observes that "theScientific Revolution bore the stamp of ... local arenas of engagement. In some cases a maritime culture was the chiefengine power behind the cultivation of scientific pursuits; in some a courtly culture predominated; in others religiousconviction was the molding agent; in yet others economic ambitions provided both impetus and constraint."
5In this dimension, our empirical analysis is similar in spirit to Voigtländer and Voth (2012), who take the spatialpattern of anti-Semitism as given and use historical persecution of Jews to measure it. In a similar vain, we take thespatial dispersion of scientific activity as given, and argue that subscriber density is a powerful proxy to capture it.
3

ogy.6 We use a survey of more than 14,000 French firms in 1837, which lists the sector of opera-tion. Based on sector-specific British patent data, we split these firms into ‘modern’ (innovative)and ‘old’ (traditional). As a first step, we confirm that the predominant share of technologies il-lustrated in the encyclopedia indeed belonged to ‘modern’ sectors. Next, we show that subscriberdensity had a particularly strong effect on firm productivity in ‘modern’ sectors, even after control-ling for sector fixed effects. This is in line with the mechanism that upper tail knowledge favoredthe adoption and diffusion of innovative industrial technology.
By exploiting variation within a centralized state, our analysis is not subject to the typicallimitations of cross-country studies, such as differences in property rights or the rule of law.7 Atthe local level – in addition to standard characteristics (e.g., proxies for trade or early book print-ing) – we control for a number of potential confounding factors. We find that the location ofproto-industrial centers is uncorrelated with subscriber density, so that pre-industrial developmentcannot explain our results. Another concern is that the encyclopedia may merely have been a deco-rative item in the bookshelves of the nobility, who also used their financial resources for industrialinvestment. Controlling for the local density of noble families does not influence our results. Thissuggests that not the nobility in general, but – in line with historical accounts – a progressive sci-entifically savvy subset of the nobility, together with lower social classes, drove industrialization.The finding that areas with a progressive elite developed faster might by confounded by the ‘Reignof Terror’ in 1792-94, when alleged reactionary individuals were executed on a massive scale. Wegeocode data on approximately 13,000 executions; our results are unchanged when controlling forthese. Finally, we control for total French book sales at the city level in the 18th century. Whilethese are strongly correlated with encyclopedia subscriber density, they do not affect growth.
Our paper is related to a large literature on the transition from stagnation to growth (for anoverview see Galor, 2011), and in particular to the role of human capital during industrializa-tion. For England – the technological leader – the consensus view is that formal education did notcontribute to economic growth (Mokyr, 1990; Mitch, 1993; Crafts, 1996; Clark, 2005). For thefollower countries, the evidence is mixed. O’Rourke and Williamson (1995) and Taylor (1999)
6Modern technology was often imported from Britain. For its implementation, French entrepreneurs would regu-larly seek advise from British technicians. In the early 19th century, 10,000-20,000 English artisans – many of themmechanics – worked in France (Kelly, Mokyr, and Ó Grada, 2014). The same authors also point out that "the Frenchlearned quickly, and as soon as local workmen had acquired the basic skills, the senior British operative became moreof a rarity." However, it is important to note that France did not merely adopt British technology. Instead, it became animportant source of innovations itself: "Technological progress became indigenous, built in to the economy, so that ...France became at mid-century a centre of invention and diffusion for modern technologies" (Crouzet, 2003, p.234).
7As Braudel (1982, p.323) documents, France was a strong centralized state, allowing for little local variation ininstitutions. In addition, while 1789 brought a dramatic change in the political regime, our results hold for both the1750-1800 and the 1800-1850 subperiods.
4

conclude from country-level cross-sectional and panel analyses that human capital was not a cru-cial driver of catch-up in the 19th century. In contrast, Becker, Hornung, and Woessmann (2011)document that elementary education predicts employment in metals and other industries, but notin textiles in 19C Prussia. This is in line with O’Rourke et al. (2008), who emphasize that in-dustrial innovation in sectors such as textiles was initially unskill-biased, reducing the demandfor skilled workers.8 We shed new light on this debate by distinguishing between average andupper-tail skills. Mokyr (2005b) underlines the role of the latter, arguing that the expansion andaccessibility of ‘useful knowledge’ during the period of Enlightenment was a cornerstone of in-dustrial development. Mokyr and Voth (2009, p.35) conclude that "the Industrial Revolution wascarried not by the skills of the average or modal worker, but by the ingenuity and technical abilityof a minority." Kelly et al. (2014) also emphasize the importance of highly skilled, technicallycapable individuals. In the contemporaneous context, Hanushek and Woessman (2012) show thatthe share of cognitively high-performing students is strongly associated with growth, independentof basic literacy. Our paper also relates to a literature showing that book production had a positiveimpact on pre-industrial economic development (Baten and van Zanden, 2008; Dittmar, 2011).9
Our main explanatory variable, encyclopedia subscriber density, offers two important advantagesover printing locations or local book production. First, it is a more precise measure, identifyingreaders within the narrow category of scientific publications.10 Second, subscriptions measure thelocal demand for knowledge, rather than the supply of books from printing locations.
Relative to this literature, we make several contributions. First, we show that differentiatingbetween modern and traditional manufacturing, as well as between average and upper tail skills,yields important novel predictions for the role of human capital in a workhorse model of unifiedgrowth (Hansen and Prescott, 2002). Second, to the best of our knowledge this paper is the first toempirically differentiate between average worker skills (literacy/schooling) and upper tail knowl-edge in the historical context of industrialization. To this effect, we introduce a novel proxy –the local density of encyclopedia subscriptions. Third, we provide strong support for the modelpredictions, using a variety of outcome variables such as city growth, soldier height, disposableincome, and local wages. We thus establish a striking novel fact: encyclopedia subscriptions arestrongly positively associated with growth and income after 1750, but not before the onset of in-
8This led to the famous incident of the Luddites – skilled textile workers – wrecking modern machinery that wasoperated by unskilled labor.
9Cantoni and Yuchtman (2014) show that universities fostered commercial activity as early as in medieval times.10Total book production, in contrast, contains books from cooking manuals to religious works. For example, books
about natural science, math, and engineering account for less than 5% of overall book sales by the large publishinghouse STN in the late 18th century, while 70% of all sales occurred in Belles lettres (e.g., romans and poetry), history,and religion.
5
dustrialization. Fourth, we shed light on the channel, showing that subscriber density predictshigher firm productivity in modern, innovative industries, but not in traditional sectors. Along thisdimension, our study is the first to provide systematic evidence for Mokyr’s (2005b) hypothesis onthe importance of the spread of ‘useful knowledge’ for industrialization. Finally, we show that –in contrast to upper tail knowledge – basic education was related to economic performance bothbefore and after industrialization, but not to growth.11
The paper is organized as follows: Section 2 discusses the historical background of industrial-ization in France, as well as encyclopedia subscriptions as a proxy for the presence of knowledgeelites. Section 3 presents a model of industrialization that illustrates our main argument. In Section4 we describe our data. Section 5 presents our empirical results. Section 6 concludes by discussingthe implications of our findings for the literature on human capital and development.
2 Historical Background: Industrialization and Upper Tail Knowledge
In this section, we discuss the role of upper tail knowledge during the French industrialization. Wealso provide background on the Encyclopédie, and discuss why its subscriptions are a good proxyfor the local presence of knowledge elites.
2.1 Industrialization in France
Starting in the mid-18th century, France experienced significant economic growth; its industrialoutput more than doubled during this century (Rostow, 1975), and machines were introduced inthe main industrial sectors – textiles and metallurgy (Ballot, 1923). By the mid-19th century,France had become "a centre of invention and diffusion of modern technology" (Crouzet, 2003,p.234).12
At the micro level, French firms were smaller than their English counterparts: most of themwere family owned; in 1865 they had 9.5 workers on average (Verley, 1985), and in 1901, 71percent had no hired employees (Nye, 1987). However, the small size of French firms is not a signalof inefficiency or lack of entrepreneurial skills, since they suited the economic and technologicalconditions of the time and "would not have stood to gain much in efficiency by being larger" (Nye,1987, p. 668). For example, firms would often not expand because the political environment made
11The cross-sectional result is in line with Hornung (2014), who shows that the migration of skilled Huguenots toPrussia had strong positive effects on the productivity of textile firms around 1800, i.e., before Prussia industrialized.
12Figure A.1 in the appendix shows that GDP per capita was relatively stable until approximately 1750, and thenstarted to grow steadily. Timing the French industrial takeoff is difficult, as it lacks a clear structural break (Roehl,1976); the predominant "moderate revisionist" view describes steady growth until the mid-19th century, only inter-rupted during the two decades after the revolution in 1789 (Crouzet, 2003). Growth was particularly strong between1815 and the 1840s, then slowed down during a depression around 1875-95, which was followed by another period ofrapid growth (Belle époque). On average, French GDP per capita grew as fast as its British counterpart over the period1820-1913, although French population grew at a markedly lower rate (Maddison, 2001).
6

investments risky. Overall, France had its own path to industrialization, which was different, butnot inferior to the British one (Crouzet, 2003).
Many French firms adopted new British technology (Milward and Saul, 1973). Even during theNapoleonic wars, they were aware of the latest British inventions and discoveries. British know-how reached France via several channels: First, scientific reports published by learned societies,an intense correspondence among "industrially minded" people in the two countries, as well asindustrial spies sending regular reports on English technology drove the rapid transfer of industrialknowledge (Mokyr, 2005b; Horn, 2006). Learned circles played a central role in the local spread ofthis knowledge. Second, there were widespread initiatives to materially import English machines,and third, thousands of British workers were hired by French producers with the specific aim togain access to technical knowledge (Horn, 2006). Finally, the state and provincial governmentsalso played an important role in French industrialization, by supporting scientific institutions, bybringing together entrepreneurs and scientists, but also by fostering adoption of machines andexpertise from abroad. These policies were put into practice at the national and local level by acommercial, industrial, and scientific elite (Chaussinand-Nogaret, 1985; Horn, 2006).
2.2 Enlightenment, Upper Tail Knowledge, and the Encyclopédie
The Enlightenment was a period of intellectual and cultural revolution in Western history, stretch-ing from the late 17th throughout the 18th century, stressing the importance of reason and science,as opposed to faith and tradition. A fundamental part was what Mokyr labeled ‘Industrial Enlight-enment’, which "bridges between the Scientific and Industrial Revolution" (Mokyr, 2005a, p.22),between the intellectual movement and economic growth.13 The link between enlightenment andgrowth followed two steps: the expansion of propositional knowledge with practical applications,and the reduction of access costs to existing knowledge – once established, knowledge had to bedisseminated as much as possible, in order to become economically useful. Despite its efforts topopularize and spread knowledge, the Enlightenment never became a mass movement. It was con-fined to a small elite that, nevertheless, played a crucial role in fostering industrial developmentand economic growth.
The Encyclopédie
In the culturally vibrant atmosphere of 18th century France, Diderot and d’Alembert launched theambitious project of the Great Encyclopédie – the "most paradigmatic Enlightenment triumph"(Mokyr, 2005b, p.285). Following Lord Francis Bacon’s conceptual framework, Diderot’s objec-
13The roots of the Industrial Enlightenment go back to the ideas of Lord Francis Bacon, who "aimed at expandingthe set of useful knowledge and applying natural philosophy to solve technological problems and bring about economicgrowth" (Mokyr, 2005b, p.326).
7

tive was to classify all domains of human knowledge in one single source, easily accessible toeverybody. The focus was on knowledge derived from empirical observation, as opposed to su-perstition.14 While mercantilistic ideas were still widespread, and artisans and guilds kept secrecyover knowledge, Diderot and the Philosophes believed that scientific knowledge should not be aprivate good, confined to a few people, but disseminated as widely as possible (Mokyr, 2005a).
The Encyclopédie went through several editions and reprints. The government initially refusedto allow official sales, and most copies went to customers outside France. Correspondingly, the first(the Encyclopédie by Diderot and d’Alembert) and the second (the Geneva reprint) editions soldtogether only 3,000 copies in France. Moreover, the first two editions were luxury items that did notpenetrate far beyond the restricted circle of courtiers, salon lions, and progressive parlementaires.This changed radically with the Quarto (1777-1780) and the Octavo editions (1778-1782).15 Thesebecame wide-spread throughout the country and largely reached middle class budgets (Darnton,1973). Since our proxy for local knowledge elites is based on subscriptions to the Quarto, wediscuss this edition in more detail.16
The Quarto edition
The Quarto edition of the Encyclopédie is particularly useful as a proxy for local knowledge elitesfor several reasons. It represents the turning point when the Encyclopédie moved to a phase ofdiffusion of Enlightenment on a massive scale. The Quarto was designed to be affordable for mid-dle class readers. Correspondingly, its format was smaller than the luxurious Folio of Diderot, thequality of the paper poorer, and the price lower. The publishers described their price discrimina-tion strategy as follows: "The in-folio format will be for ‘grands seigneurs’ and libraries, while thein-quarto will be within the reach of men of letters and interested readers [‘amateurs’] whose for-tune is less considerable."17 This strategy proved extremely successful: the Quarto had the highest
14The articles of the Encyclopédie often resulted provocative to authorities. For example, in the engraving of theTree of Knowledge, theology is considered a simple branch of Philosophy. This led to the imprisonment of the editorand the publishers; the Pope condemned the Encyclopédie, and it was suppressed by a royal decree (Vogt, 1982).
15The names Quarto and Octavo refer to the printing format: A Quarto sheet is folded twice, creating four leaves;an Octavo is folded three times, creating eight leaves. The central figure behind the Quarto edition was the Frenchentrepreneur Charles-Joseph Panckoucke (1736-1798), who had bought the plates of the Encyclopédie from the orig-inal publishers, together with the rights to future editions. Administrative obstacles in selling the Quarto appear tohave been minor. While the Encyclopédie was officially illegal until 1789, the government had relaxed its censorship.In addition, Panckoucke had good connections with the government, and did not hesitate to lobby and bribe publicofficials (Vogt, 1982).
16The Quarto edition comprised 36 volumes of text and 3 volumes of illustrative plates. Since these were typicallynot delivered in one chunk, readers of the Encyclopédie are commonly referred to as ‘subscribers’.
17Société Tipographique de Neuchâtel (the publisher) in a letter to Rudiger of Moscow, May 31, 1777; cited afterDarnton (1973, p.1349). The Quarto cost only one fifth of the first original folio. While unaffordable to lower socialclasses and workers, the lower price put it well within the reach of the provincial middle class. According to Darnton’(1973) calculations, a Quarto cost the equivalent of 10 weeks of income of a prosperous parish priest, and about 5
8
sales in France among all editions. The low cost of the Quarto rendered budget constraints lessimportant, so that scientific interest, rather than deep pockets, determined subscriptions.
Crucially for our study, one of the publishers, Duplain, secretly kept a list of subscriptions,which survived in the archives of the Société Tipographique de Neuchâtel (STN). This list containsthe name of booksellers (but not subscribers), their city, and the number of sets they purchased forretail among their local clients. Darnton (1973) provides this list, which comprises a total of8,011 subscriptions, out of which 7,081 were sold in France – in 118 cities.18 The list containsall subscriptions to the Quarto in France, so that we can safely assume that cities which are notlisted had zero subscribers. Subscriptions were not confined to major cities; instead, they weredistributed across the whole French territory (see Figure 1).
Subscriptions to the Quarto edition and local knowledge elites
Does a higher frequency of subscriptions at any one location reflect a broader interest in uppertail knowledge?19 Characteristics of individual subscribers are key to shed light on this question.While Duplain’s secret list does not allow for a systematic analysis because it only contains thenames of local booksellers, individual information exists in a few cases. For Besançon, a listof individual subscribers has survived. Darnton (1973, p.1350) summarizes these by professionand social status: 11% belonged to the first estate (clergy) and 39% to the second estate (nobil-ity); the remaining one half of the 137 subscribers belonged to lower social ranks, including thebourgeoisie.20 Professionals, merchants, and manufacturers account for 17% of the total (23 sub-scriptions). Thus, an important share of subscribers can be directly identified as economic agents(from lower ranks) involved in the French industrialization. Their share is likely a lower bound forthe importance of the encyclopedia in the business community, because many subscribers in theupper class (‘nobility’ – the largest single category) were also active businessmen (Horn, 2006).21
For example, Chaussinand-Nogaret (1985, p.87) argues thatOver a whole range of activities and enterprises nobles, either alone or in associationwith members of the greater business bourgeoisie, showed their dynamism, their taste for
weeks of income of a provincial bourgeois living off his rents.18Lyon with 1,078 and Paris with 487 subscriptions are at the top of this list; at the opposite end of the spectrum,
there are 22 towns with fewer than 5 subscriptions.19For example, it is possible that wealthy people merely bought the encyclopedia to decorate their bookshelves.
However, according to Darnton (1973, p.1352), if anything, the opposite was probably the case: "far more peoplemust have read the Encyclopédie than owned it, as would be common in an era when books were liberally loaned andwhen ‘cabinets litteraires’ were booming."
20This may be a lower bound for other locations. The second estate is probably over-represented in this sample –Besançon was a garrison town, and almost half of the subscriptions in this category went to noblemen in the army.
21This reflects the revisionist view that replaced earlier – often Marxist – interpretations of the nobility exemplifyingan aristocratic tyranny of arrogance and decadence. An impartial reading of the historical account shows that "noblesof the eighteenth century had been as modern and progressive as anyone." (Smith, 2006, p.2).
9

invention and innovation, and their ability as economic leaders: ... their ability to directcapital..., to choose investments according to their productiveness and their modernity,and ... to transmute the forms of production into an industrial revolution.
It is, however, important to note that only a progressive subset of the nobility was involved in indus-trial activities.22 The same subset was also heavily engaged in the Enlightenment (Chaussinand-Nogaret, 1985, p.73). This underlines Mokyr’s (2005b) view that upper tail knowledge and indus-trialization were closely entwined.
In addition, many subscriptions went to high public officials and parliamentarians – about 28%in Besançon (Darnton, 1973, p.1350). Enlightened elites in the provincial administration wereoften involved in fostering local industrialization. For example, in Rouen and Amiens, they es-tablished the Bureau of Encouragement that gathered businessmen, manufacturers, local savants,and provincial authorities in an effort to assist technological advance (Horn, 2006, p.81). Finally,the Encyclopédie – and especially the Quarto – also reached non-subscribers in the lower ranksof society, via indirect access (Roche, 1998). Organized lectures, symposia, and public experi-ments were booming in France during the Enlightenment, and public readings of the Encyclopédiewere organized by scientific societies, libraries, lodges, and coffeehouses (Darnton, 1979; Mokyr,2005b).23
One prominent example for the link between science and entrepreneurship in France is Jean-Antoine Chaptal. Chaptal considered science to be inseparable from technology, and the key tofoster industrial development. He was well-connected in the French network of savants, whichentertained an intensive exchange with international scientists such as James Watt, and stimulatedthe application of science to industry in France. Chaptal pursued this cause both as a public figureand as a private entrepreneur. As a public official, he created favorable economic and bureau-cratic conditions for entrepreneurs, for example by founding the Conseils d’Agriculture, des Arts
et Commerce, and the Société d’Encouragement pour l’Industrie National, where scientists, indus-trialists, and bureaucrats were brought together. He also subsidized promising artisans, engineers,and industrialists, and gave pubic lectures on chemistry and experimental physics. As a private
22As Chaussinand-Nogaret (1985, p.90) puts it: "In the economic sphere, ...it is clear that the whole of nobility wasnot involved, but only the part that can be considered its natural elite, ... because of its ... openness to the progressivetendencies of the age."
23Certainly, reading or hearing about a new technology was not sufficient to be able to adopt and operate it. However,scientific publications and lectures made technological know-how available on a large scale, breaking the exclusivetransmission from master to apprentice (Mokyr, 2005b). The details needed for actual adoption of new technologieswere then typically found elsewhere, such as embodied in ‘imported’ British experts. For example, Fox (1984, p.143)describes the case of the British engineer Job Dixon, who came from Manchester to Cernay in southern Alsace in 1820and joined the firm Risler frères. This firm had been founded only two years earlier as the first machine-builder in theregion. It subsequently became the main supplier of the latest spinning and weaving machinery for the region, servingalso as a training ground for French engineers.
10

entrepreneur, Chaptal built the largest factory for chemical products in France (Horn and Jacob,1998). The example of Chaptal illustrates that the effect of knowledge elites on local industrialdevelopment could go both via scientifically savvy public officials supporting entrepreneurship,and via savants themselves operating businesses.24
In sum, the encyclopedia had a broad spectrum of readers from the knowledge elite that wereboth directly and indirectly involved in industrialization. This supports both our use of subscriberdensity as a proxy for local upper tail knowledge, and the hypothesis that this knowledge wascrucial in fostering economic growth.
3 Model
Our model features n = 1, ..., N regions with given land endowment. In each region, there is acontinuum of households i ∈ [0, 1] that are infinitely lived and supply labor inelastically. Thereis no saving, so that all income is consumed in each period. In addition, we assume that house-holds are immobile, operating within their region of origin. Thus, wages can differ across regions.However, goods are traded so that output prices are equalized across regions. In any given period,households optimally choose between working in three sectors: agriculture (A), traditional man-ufacturing (T ), and modern manufacturing (M ). We can thus think of households as firms. Wekeep the model tractable by following Hansen and Prescott (2002) in assuming that agriculturaland (both) manufacturing goods are perfect substitutes.25
Each household’s choice between the three modes of production depends on two dimensionsof the region-specific knowledge distribution. First, average worker skills, hn, affect the efficiencyof production in each sector, but to varying degrees. The effect of hn on productivity is smallestin agriculture. In addition, in line with the historical evidence (c.f. Clark, 2005; O’Rourke et al.,2008), we assume that the effect of worker skills on productivity is stronger in traditional than mod-ern manufacturing. Second, each household receives a draw of upper tail (or scientific) knowledge,si, which affects the efficiency of operating modern manufacturing M . In other words, modernmanufacturing is relatively less intensive in average worker skills, but more intensive in upper tailknowledge. This reflects Mokyr’s (2005a) observation that modern technology was "simpler touse if more complex to build."26 To clearly distinguish between their effects on development, we
24Another example is the Duke d’Orléans, who invested in several textile firms, adopting modern machinery fromBritain. He also introduced steam-engines into cotton spinning in France (Chaussinand-Nogaret, 1985), and set up asoda-making facility together with chemist Nicolas Leblanc (1742-1806) (Horn, 2006).
25Thus, our results are driven only by the supply side. Introducing demand-side factors – such as increasing relativedemand for manufacturing as income rises – would actually strengthen our results, by further raising income in regionsthat industrialize more heavily.
26Mokyr (2005a, p.45) describes this notion in more detail: "An economy that is growing technologically moresophisticated and more productive may end up using techniques that are more difficult to invent and artefacts that are
11

model hn and si as independently distributed.27
All relevant cross-sectional predictions of our model can be derived in partial equilibrium,taking the price of output as given and normalizing it to P = 1. We use the model to analyzehow average worker skills and upper tail knowledge affect the distribution of income and laborshares across regions. The efficiency of modern manufacturing, AM , plays a central role in thisanalysis. Following Hansen and Prescott (2002) and Kelly et al. (2014), we assume that AM growsexogenously over time, and that this reflects the expansion of useful knowledge during the periodof Industrial Enlightenment.
3.1 Distribution of Scientific Knowledge
Worker skill levels hn vary across regions n. For simplicity, we assume that hn is the same forall households within a given region.28 On the other hand, scientific knowledge varies acrosshouseholds (firms) within regions, and the underlying distribution itself differs across regions. Thelocal density of scientific knowledge (i.e., the knowledge elite) is reflected by the thickness ofthe upper tail in a Pareto distribution – and thus by a single region-specific parameter βn. Theprobability that any given household i in region n draws scientific knowledge si above S is givenby
Fn (si ≥ S) =
(1
S
)βn
; βn ≥ 1 (1)
where S > 1 and βn > 1. Note that a smaller βn implies a thicker upper tail and thus a higherprobability of large si draws.
Given their human capital endowments hn and si, families optimally choose between the threetechnologies. Next, we describe these technologies (or sectors) and how they differ in their depen-dence on the two types of human capital.
3.2 Production
At the beginning of a period, each household i chooses a single sector of production. Technologyin all sectors exhibits constant returns, so that the scale of production is not important.29 Eachhousehold supplies one unit of labor. We denote total labor in sector j ∈ {A, T,M} in region n
by Lj,n. Because each region is populated by a mass one of households, sector-specific labor isequivalent to the labor shares: Lj,n = lj,n, and labor market clearing implies lA,n+ lT,n+ lM,n = 1.
more complex in design and construction, but may be easier to actually use and run on the shop floor".27This also reflects the empirical evidence presented in Figure A.4 in the appendix, which shows that our historical
proxies for the two types of human capital, literacy and subscriber density, are uncorrelated across French regions.28Using randomly distributed worker skills within regions would not yield additional insights in our analysis.29Thus, we can assume without loss of generality that each household represents a firm. This also reflects the
historical evidence discussed in Section 2 that the majority of French firms in the 19th century were family-owned(Nye, 1987).
12

Next, we characterize the production technologies used by the three sectors. In each of these,worker skills hn enter production by augmenting the efficiency of labor, but with a varying degreeacross sectors. Agricultural output in region n is given by
YA,n = AAhγAn Lα
A,nX1−αn , (2)
where XN is land endowment in region n, and γA reflects the sensitivity of agricultural produc-tivity with respect to worker skills.30 We assume that there are no property rights to land, so thathousehold income in agriculture is given by the average product yA,n = YA,n/LA,n:31
yA,n = AAhγAn
(Xn
LA,n
)1−α
= AAhγAn
(xn
lA,n
)1−α
, (3)
where xn is land per household. Note that agricultural income increases if the agricultural laborshare lA,n declines, because this leaves more land for each remaining agricultural household inregion n. Thus, growth in manufacturing can indirectly raise wages in agriculture, by boosting theland-labor ratio.
Traditional manufacturing is produced using only (skill-augmented) labor. The productionfunction is YT,n = ATh
γTn LT,n, and correspondingly, household income is given by
yT,n = AThγTn (4)
where γT is the sensitivity of productivity in sector T with respect to worker skills. Finally, we turnto modern manufacturing M . In this sector, productivity is affected by both region-specific workerskills, hn, and the operating household’s draw of scientific knowledge, si. The latter is similar inspirit to the entrepreneurial ability to adopt and run modern technology. We thus follow Gennaioliet al. (2013) in assuming that both types of human capital enter the production function in a mul-tiplicative fashion: YM,n(i) = AMs(i)hγM
n LM,n(i). Thus, household income when operating M isgiven by:
yM,n(i) = AMs(i)hγMn (5)
where γM is the elasticity of productivity with respect to worker skills. Note that, in contrast to A
and T , income in modern manufacturing is heterogenous across households (even within regions),
30In growth models and development accounting, h typically multiplies L directly, since it already reflects theimpact of schooling on productivity via Mincerian returns (c.f. Bils and Klenow, 2000). By using different γj forj ∈ {A, T,M}, we allow these returns to vary across sectors, i.e., we allow for sector-specific returns to worker skills.
31This assumption does not affect our results, but it simplifies the analysis. Alternatively, we could assume that landfor agriculture must be rented, and that households keep their wage income.
13

due to the different draws of s(i). AM in (5) reflects the state of modern technology. In this setup,AM and s(i) are complementary: increasing AM raises the return to scientific knowledge. Thus, athick upper tail in the distribution Fn(s) affects the economy more strongly if AM is larger.32 Thisis at the core of our mechanism.
The assumption that s(i) raises productivity in M reflects several possible mechanisms: first,more scientifically savvy people are more likely to know about the existence of new technologies,which reduces their search costs and raises the likelihood of adoption.33 Second, they can be ex-pected to operate modern technology more efficiently because of a better understanding of theunderlying processes. Third, higher scientific knowledge makes further innovative improvementsmore likely – this is in line with Mokyr’s (2005a) argument that technological progress often camein the form of micro-inventions by implementation of broader technological concepts. Interpret-ing s(i) broadly as entrepreneurial ability reflects all three elements mentioned above.34 For ourargument, the exact mechanism by which scientific knowledge affects the productivity of moderntechnology is not crucial.
Finally, we describe our assumptions for each sector’s sensitivity with respect to worker skillsand scientific knowledge. Given that pre-industrial manufacturing was typically performed byskilled artisans, we assume that it was more skill-intensive than agriculture, γT > γA. In addi-tion, consistent with the historical evidence that in the first phase of industrialization, industrialtechnology used unskilled workers relatively more intensively, (O’Rourke et al., 2008), we as-sume γM < γT . When comparing all three sectors, we assume that agriculture was the least skillintensive, so that γA < γM < γT . Finally, we implicitly assume that scientific knowledge af-fected productivity only in modern manufacturing – s(i) is present only in (5). While basic workerskills mattered for agriculture and traditional manufacturing, these sectors saw substantially lessinnovation during industrialization so that advanced knowledge arguably played a limited role.35
32Note that, strictly speaking, AM itself is not the technological frontier because the Pareto distribution Fn(s)delivers draws s(i) > 1. Instead, AM can be interpreted as the state of technology that adopters can build on. Savvyentrepreneurs with high s(i) profit particularly strongly from high AM .
33As Mokyr (2000, p.30) put it: "Of course I do not argue that one could learn a craft just from reading an ency-clopedia article (though some of the articles in the Encyclopédie read much like cookbook entries). But ... once thereader knew what was known, he or she could look for details elsewhere."
34Note that at the regional level, our setup is also compatible with knowledge spillovers: high draws of s(i) aremore likely where the density of scientific knowledge is larger. Part of this effect could come from households withouta scientifically savvy member nevertheless having access to modern technology via other interested people in theirenvironment. Similarly, firms may profit from an ‘enlightened’ local administration that fosters industrialization, assuggested by the historical evidence in Section 2.2.
35This pattern is clearly borne out by innovations exhibited at world fairs: Among the 6,377 British exhibits in 1851,very few belonged to traditional sectors: only 261 (or 4.1%) were agricultural machinery, and 140 (2.2%) belonged tofood processing. At the other end of the spectrum, modern sectors made up the large majority of innovations: textilesalone accounted for more than 26%, and engines and scientific instruments for another 15% (Moser, 2012, Table 3).
14

3.3 The Choice of Technology
Each household chooses a sector j of production, so as to maximize income yj,n(i), j ∈ {A, T,M}.In the following, we analyze how worker skills and scientific knowledge affect the sectoral allo-cation of labor within each regions n. This effect depends on the efficiency of modern manufac-turing, AM . We examine two regimes: initially, AM is low, representing the pre-industrial period.Subsequently, AM grows exogenously, reflecting technological improvements during the scientificrevolution and the early phases of industrialization.
Low efficiency of modern manufacturing
Low values of AM imply that modern manufacturing is unattractive, so that only households withextremely high draws s(i) will employ this technology. The main sectors in the economy are thusA and T . Within each region, labor mobility ensures that household income is equalized in thesetwo sectors, yA,n = yT,n. Using (3) and (4), this implies
lA,n =
(AA
AT
hγA−γTn
) 11−α
tn (6)
Thus, the agricultural employment share is higher in more land abundant regions, and it is lowerwhere workers have higher average skill levels hn (since γA < γT ).
Modern manufacturing is used by a household i if yM,n(i) ≥ max{yA,n, yT,n}. Since yA,n =
yT,n, we can use (4) and (5) to derive the threshold of scientific knowledge at which households inregion n are indifferent between A and M : s∗n = AT
AMhγT−γMn . Using (1), the share of households
with scientific knowledge draws above this threshold (i.e., those using M ) is given by
lM,n =
(AM
AT
hγM−γTn
)βn
(7)
The labor share in traditional manufacturing follows as lT,n = 1 − lA,n − lM,n. Finally, aver-age household income in region n is given by the employment-weighted average across the threesectors, yn = lA,nyA,n + lT,nyT,n + lM,nyM,n, where yM,n is the average income of all householdsusing modern manufacturing in region n.36
When AM rises, modern manufacturing is adopted by an increasing fraction of households,thus attracting more workers. These are initially withdrawn from traditional manufacturing.37 For
36This follows from the aggregate income from modern manufacturing in region n, divided by the mass of house-holds using M : yM,n = 1
lM,n
∫∞s∗n
AMshγMn
βn
sβn+1 ds, where the last term is the pdf of s in a Pareto distribution with
parameter βn. Solving the integral and using s∗n = (1/lM,n)1
βn yields yM,n = βn
βn−1AMhγMn
(1
lM,n
) 1βn .
37The intuition is as follows: As long as T operates, yA,n = yT,n must hold. Suppose that M attracted workers from
15

sufficiently high values of AM , traditional manufacturing disappears, while agriculture continuesto be operated. We analyze this case next.
High efficiency of modern manufacturing
When T is not operated anymore, a household i chooses M if yM,n(i) ≥ yA,n. Using (3) and (5),this implies
AMs(i)hγMn ≥ AAh
γAn
(tnlA,n
)1−α
(8)
Let sn denote the threshold level of scientific knowledge at which households are indifferent be-tween A and M . Using this in (1) determines the labor share in M : lM,n = (1/sn)
βn . Conse-quently, focusing on the household at the margin where (8) holds with equality, we can substitutes(i) = sn = (1/lM,n)
1βn . In addition, since lT,n = 0, we can substitute lA,n = 1− lM,n in (8). This
yields:AM
AA
hγM−γAn
(1− lM,n
tn
)1−α
= (lM,n)1βn (9)
This equation has a unique solution l∗M,n.38 As for the remaining variables, l∗A,n = 1− l∗M,n followsimmediately, and average household income in region n is given by yn = lA,nyA,n + lM,nyM,n,where average income from modern manufacturing in region n, yM,n, is computed as describedin footnote 36. To differentiate between the two cases where T does (or not) operate in regionn, Appendix A.1 derives the threshold level AM,n, such that below this level, (7) applies, andotherwise, (9).
3.4 Model Predictions
We now summarize the predictions of our model for manufacturing employment shares as wellas household income in a cross-section of regions with different endowments of worker skills,and different sizes of the knowledge elite (represented by the thickness of the upper tail in Fn).We define the "knowledge elite" as those households with scientific knowledge draws s ≥ 10,i.e., ten times larger than the mode of the underlying Pareto distribution Fn.39 We derive fourpropositions. The first two analyze the cross-sectional effect of knowledge elites for the cases of
A. Then lA,n would decline, and according to (3), yA would increase, while yT,n in (4) would remain unchanged.Thus, households would immediately stop operating T . Instead, rising AM leads to a slow decline of lT,n, but(initially) not of lA,n.
38The left-hand-side (LHS) of (9) is strictly decreasing in lM,n, while the right-hand-side (RHS) is strictly increas-ing. In addition, as lM,n converges to zero from above, the LHS converges to a positive number, while the RHSconverges to zero. Thus, there is a unique solution where the RHS cuts the LHS from below.
39Alternative cutoffs do not change our qualitative results. Note that higher βn in (1) imply smaller elites. Our em-pirical proxy for the knowledge elite – encyclopedia subscriber density – varies between 0 and 15 per 1,000 inhabitants(see Figure A.3). Using βn ∈ [1.8, 6] replicates this range in our model.
16

relatively low AM (before the Industrial Revolution), and for high AM (the industrial period). Thethird proposition analyzes the role of worker skills, and the fourth focuses on the predictions forgrowth. We discuss the intuition behind each proposition in the text; formal proofs are provided inAppendix A.
Proposition 1. Low AM : If modern technology M is still inefficient (low AM ), then labor sharesin manufacturing and average income in a region are not (or at best weakly) affected by the sizeof the local knowledge elite.
Proof: See Appendix A.2.
Figure 3 provides an illustration of Proposition 1. Under reasonable parameter choices, neitherlabor shares nor income are affected by the percentage of the population belonging to the knowl-edge elite.40 Intuitively, if AM is low, only households (firms) with extremely high draws s(i)
would find it profitable to operate M . However, these represent a minuscule share in the far uppertail of the distribution Fn. In other words, even within the knowledge elite essentially nobody findsit worthwhile to adopt M . The steam engine may serve as an illustration. While early designs dateback to the 17th century, they were far from being economically viable (low AM ). A continuousstream of inventions and improvements throughout the 18th century raised AM and eventually ledto the widespread use of the steam engine, beginning in the late 18th century. The next propositionrefers to this period, when the frontier of modern technology had expanded substantially, makingit competitive with traditional manufacturing.
Proposition 2. High AM : After the frontier in modern manufacturing moved out (AM becamehigh), a larger local knowledge elite is associated with:
(a) higher labor shares in modern manufacturing (lM,n), and, for sufficiently high AM , higheremployment shares in manufacturing overall (combined T and M )
(b) higher wages in modern manufacturing (yM,n), but not in traditional manufacturing (yT,n)(c) higher regional income yn, in part due to a second-order positive effect on income in agri-
culture
Proof: See Appendix A.3.
Intuitively, the larger AM the lower is the threshold sn for adopting M . Therefore, with a highstate of modern technology AM , a notable fraction of households will be above the threshold. Thisfraction (lM,n) is higher in regions with a larger knowledge elite. This is illustrated in Figure 4. Inregions with a small elite, few firms adopt M , and traditional manufacturing T still operates. For a
40We choose γA = 0.3, γM = 0.5, and γT = 0.7, as well as a labor share in agriculture α = 0.6. We normalizeland and population to 1 and choose the efficiencies AA and AT such that the labor share in (overall) manufacturingis 12% – this corresponds to the urbanization rate in France in 1700 (total city population from Bairoch, Batou, andChèvre (1988) divided by French population from McEvedy and Jones (1978)). In Figures 3 and 4, we keep averageworker skills constant at hn = 1.1 and use the range of βn ∈ [1.8, 6] explained in footnote 39.
17

larger elite (thicker knowledge upper tail), modern manufacturing crowds out its traditional coun-terpart, and it also attracts labor from agriculture. This has a positive indirect effect on agriculturalwages, because withdrawing workers from A raises the land-labor ratio. Finally, a thicker uppertail does not affect yT , but it raises the income of the average household that operates M , yM,n.41
Altogether, average incomes are therefore higher in regions with a larger knowledge elite. Next,we analyze the effect of worker skills on income and employment.
Proposition 3. Effect of worker skills: Higher average worker skills hn in region n lead to:
(a) higher overall employment shares in manufacturing (combined T and M )(b) (slightly) lower employment in modern manufacturing(c) higher regional income yn, and in particular, higher income in all sectors A, T , and M .
Proof: See Appendix A.4.
Figure 5 illustrates these predictions.42 Worker skills are most important in traditional manu-facturing. Thus, higher hn leads to a concentration of employment in this sector, crowding out bothagriculture and modern manufacturing. This effect is strong for A, but weak for M , because thelatter is more similar to traditional manufacturing in its dependence on worker skills.43 However,the effect of larger hn on overall manufacturing employment is unambiguously positive. Also,because production in all sectors is positively affected by hn, an increase in worker skills raisesincomes across the board.
Finally, we analyze the effect of an expansion of the scientific frontier, which is reflected byexogenously growing efficiency in modern manufacturing AM . The following proposition showsthat, despite production knowledge being non-rival and available to all regions, it has differentialeffects on economic growth.
Proposition 4. Suppose that AM grows exogenously. Then:
(a) Initially, when AM is still small, growing AM will not (or to a very limited extent) translateinto economic growth.
(b) For sufficiently large levels (AM/AT >> 0), further advances in AM will lead to growth inmanufacturing employment and regional income yn
41This is due to two effects: a thicker upper tail implies that there are more households above the threshold, andthese also have a larger average distance to the threshold (conditional on having passed it).
42We use the parameters described in footnote 40, but now keep βn constant at 3. The range hn ∈ (1.0, 1.3) on thehorizontal axis is chosen as follows: the average return to schooling in a cross-section of countries is about 0.1 (Bils andKlenow, 2000). In our sample, literacy in 1686 varies between 0 and 60% across French departments, and we assumethat literacy is equivalent to 5 years of schooling. With this, we obtain an upper bound of exp(0.1 · 0.6 · 5) ≈ 1.3, anda lower bound of exp(0) = 1. Changing these values does not affect our qualitative results.
43The closer γM is to γT , the weaker is the (negative) relationship between hn and lM,n – see equations (7) and (9).If we chose γM = γT , hn does not affect lM,n.
18

(c) Growth is faster where the knowledge elite is larger; however, average worker skills hn havea (small) negative effect on growth.
Proof: See Appendix A.5.
The right panels of Figures 3-5 illustrate this proposition, showing the effect of a 5% increasein AM on average household income. The basic mechanism works as follows: higher aggregateefficiency in modern manufacturing is particularly useful to regions that adopt more of this technol-ogy, i.e., those with a larger knowledge elite. However, this growth effect only sets in after AM issufficiently high to make modern manufacturing economically viable for elite entrepreneurs. Thisexplains why knowledge elites do not affect growth when AM is low (Figure 3), while they have astrong impact when AM is larger (Figure 4). On the other hand, higher average worker skills favortraditional manufacturing, binding employment in a sector that does not profit from the expandingtechnological frontier. Consequently, growth is slowed down in regions with higher hn.44
Summing up, as compared to the previous theoretical literature, our model provides a moredifferentiated view on the role of human capital during industrialization. Distinguishing betweenworker skills and upper tail (scientific) knowledge allows us to derive predictions that differ impor-tantly for the two types of human capital. To test the model’s predictions, we collect a rich datasetcovering industrialization in France.
4 Data
In this section we describe our data, beginning with our main variable – encyclopedia subscriberdensity. We then turn to a set of city-level and regional variables that reflect French develop-ment before, during, and after industrialization. We also analyze whether subscriber density variessystematically with other local characteristics.
4.1 Main Explanatory Variables: Subscriptions and Scientific Societies
Our main dataset consists of 193 French cities for which Bairoch et al. (1988) report population in1750. Among these, 85 have recorded subscriptions to the encyclopedia.45 According to Duplain’slist (see Section 2), there were 7,081 subscriptions to the Encyclopédie’s Quarto Edition in France.Altogether, we match 6,944 subscriptions (or 98% of the total) to the cities in our sample. SinceDuplain’s list covers the universe of subscriptions, we can safely assume that the 108 cities coveredby Bairoch et al. (1988), but not mentioned in Duplain’s list, had no subscribers. In the following,
44As shown in the right panel of Figure 5, the negative growth effect of hn is quantitatively small, because the(negative) effect of hn on employment in M is also minor.
45In total there are 118 cities with subscriptions to the Encyclopédie listed in Darnton (1973); 12 of these are notreported in Bairoch et al. (1988), and the remaining 21 can be matched to Bairoch et al. (1988), but population dataare not available in 1750.
19

we use Subsn to denote overall subscribers in city n. Since all subscriptions to the Quarto inDuplain’s list were sold at the same price, including shipment (Darnton, 1979, p.264), we arguablymeasure local demand rather than supply. This differentiates our empirical approach from previousstudies that build on local printing activity (c.f. Baten and van Zanden, 2008; Dittmar, 2011).
Because larger cities will mechanically tend to have more subscribers, we normalize sub-scriptions by population in 1750. Subscriptions per capita (among cities with above-zero en-tries) varied substantially, from 0.5 per 1,000 in Strasbourg to 16.3 in Valence; Paris belongedto the lower tercile of this distribution, with 0.85 subscriptions per 1,000. To reduce the influ-ence of extreme values, we use log-subscriber density as our baseline variable: lnSubDensn =
ln(Subsn/pop1750n + 1), where pop1750n is city population in 1750.46
We also use an earlier indicator for upper tail knowledge: a dummy for cities hosting a sci-entific society before 1750, as well as the number of ordinary members of scientific societies atthe city level. These data are from McClellan (1985). To proxy for average worker skills, we usedepartment-level data on male literacy in 1686 and 1786 from Furet and Ozouf (1977). Literacyrates reflect the percentage of men able to sign their wedding certificate. For 1837, department-level schooling data are available from Murphy (2010), computed as the ratio of students to school-age population (5 to 15 years).
4.2 Outcome Variables
Our first outcome variable is city growth – a widely used proxy for economic development (Ace-moglu, Johnson, and Robinson, 2005; Dittmar, 2011). We use the panel of city population fromBairoch et al. (1988), which includes cities that reached (at least once) 5,000 inhabitants between1000 and 1800. Bairoch et al. (1988) report city size for every 100 years until 1700, and for every50 years thereafter until 1850.
To test the model predictions on income levels, we need a proxy that is observed before andafter industrialization. Following a rich literature in economic history, we use soldier height (c.f.Steckel, 1983; Brinkman, Drukker, and Slot, 1988; Komlos and Baten, 1998).47 We obtain con-script height before 1750 at the department level from almost 30,000 individual records collectedby Komlos (2005). These reflect conscriptions over the first half of the 18th century. We filterout time- and age-specific patterns in recruitment by using the residual variation in height aftercontrolling for decade fixed effects and conscript age – see Appendix C.3 for more detail. As our
46Adding the number 1 ensures that the measure is also defined for cities with zero subscriptions. Appendix C.2provides further detail and distribution plots.
47Cross-sectional analyses typically document a strong positive correlation between height and per capita income(see Steckel, 2008, for a recent survey of the literature and empirical evidence). In longitudinal studies, the relationshipis less clear, since it can also be affected by income inequality, volatility, and food prices (Komlos, 1998). We thusonly exploit the variation in height across French regions, but not within regions over time.
20

first proxy for income after industrialization, we use department level soldier height from Aron,Dumont, and Le Roy Ladurie (1972) for the period 1819-1826. In addition, we use disposableincome in 1864 from Delefortrie and Morice (1959).
Next, we use wages in industry and agriculture (measured in 1852) from Goreaux (1956),employment shares in industry and agriculture (in 1876) from Service de la Statistique Général deFrance (1878), and wages in the textile and the food industry (in 1864) from Delefortrie and Morice(1959). Finally, we perform a detailed within-sector analysis, using local wages and value addedper worker as a proxy for productivity. The underlying data are from Chanut, Heffer, Mairesse,and Postel-Vinay (2000), who cleaned and digitalized a survey of 14,238 firms over the period1839-1847. The data were collected by the Statistique de la France at the arrondissement (county)level, and categorize firms into 16 industrial sectors.
4.3 Control Variables
In the following, we briefly describe our control variables. Appendix C.4 provides more detaileddescriptions and sources. Our baseline set of controls includes various geographic characteristicsof cities, such as dummies for cities with ports on the Atlantic Ocean and on the MediterraneanSea, as well as for cities located on navigable rivers. Following Dittmar (2011), we also include adummy for cities that had a university before 1750, a printing press between 1450 and 1500, andthe log number of editions printed before 1501. To control for cultural and language differences,we construct a dummy for cities located in non-French speaking departments.
We also control for a number of potential confounding factors: First, encyclopedia subscrip-tions may have been high where book sales in general were high – thus not reflecting upper tailknowledge but a broader interest in reading. We obtain book sales to each French city over theperiod 1769-1794 from the FBTEE (2012) project that reconstructed the book trade of the impor-tant Swiss publishing house STN (which also published the Encyclopédie). This source covers thesales of more than 400,000 copies, for which the location of the buyer (private or book stores, withthe vast majority located in France) is available.48 A second potential concern is that the nobilitymay have both purchased a disproportionate amount of encyclopedias and funded industrialization.We obtain the number of noble families in each department from the Almanach de Saxe Gotha, themost important classification of European royalty and nobility. Altogether, our sample containsmore than 1,000 noble families in 1750, in 88 French departments. Third, encyclopedia sales mayhave been high where industrialization was already on the way in the mid-17th century. To accountfor this possibility, we use data on proto-industrialization in France, as used by Abramson and Boix
48This data is available at http://chop.leeds.ac.uk/stn/. The STN book sales are directly comparable to our data onencyclopedia subscriptions: both occurred during the same period, are shipped from one place (Switzerland and Lyon)towards all of France, and both reflect local demand for books (sales) rather than supply (printing).
21

(2013). These allow us to compute the number of mines, forges, iron trading locations, and textilemanufactures prior to 1500 for each department. Finally, another potential concern is related to the‘Reign of Terror’ in 1792-94, when alleged counter-revolutionaries were murdered on a massivescale. If these were concentrated in less progressive areas (i.e., with low subscriptions), executionsmay explain slower economic progress there. To control for this possibility, we process data onapproximately 13,000 executions, assigning them to each department.
In order to guarantee consistency with our main explanatory variable, we calculate the localdensity of scientific society members, total book sales, noble families in 1750, proto-industriallocations, and executions during the ‘Reign of Terror’ in the same way as for subscriptions:ln(1 + x/popn,1750). Finally, Appendix C.5 describes how we aggregate city-level variables tothe arrondissement and department level.
4.4 Balancedness
Do other town characteristics vary systematically with encyclopedia subscriptions? In Table 1 weregress our main explanatory variable lnSubDens on a variety of controls (one-by-one, includinga dummy for Paris). We begin with our baseline controls in the first two columns. Column 1 usesall cities, while column 2 uses only those with above-zero subscriptions. Few control variablesshow a consistent pattern. City size is significantly positively correlated with lnSubDens in col1, but significantly negatively in col 2.49 Seaports are essentially uncorrelated with subscriberdensity. The coefficient on navigable rivers is significant in col 1, but switches signs and becomesinsignificant in col 2. The correlation with university and printing press dummies, as well as withbooks printed before 1500, are all positive (and significant in col 1), as one should expect sincethey reflect local advanced knowledge. In addition, cities in non-French speaking areas have asmaller proportion of subscribers, which is also to be expected given that the encyclopedia waspublished in French.50
Next, columns 3-5 in Table 1 report the coefficients of regressing subscriber density on ourproxies for average worker skills, as well as a variety of potentially confounding variables.51 Liter-acy rates in both 1686 and 1786, as well as schooling rates in 1837, are not significantly correlatedwith subscriber density in any specification. On the other hand, overall (STN) book purchases are
49Below, we confirm that our results hold in both the full sample and the Subsn > 0 sample. Note that thisimplicitly addresses potential unobserved factors that are associated with city size, since these should also change theway in which they affect our results between the two samples.
50There were a number of regions in 18C France that spoke different languages such as Alsacien and Basque. Thecorresponding six departments comprise 24 cities in our sample, out of which 6 had above-zero subscriptions.
51Since most of these variables are observed at the department level, we compute subscriber density at the depart-ment level in the same way as for cities (see Appendix C.5). The department-level data comprise 88 observationsin the cross-section, and 66 out of these had above-zero subscriptions. Col 3 reports coefficients for all departmentswithout controls, col 4 adds controls, and col 5 restricts the sample to departments with above-zero subscriptions.
22

strongly and positively associated with encyclopedia subscriptions. This suggests that locationswith a greater interest in reading also host more people with scientific interests. In other words, theupper tail of the knowledge distribution is thicker where the distribution in general is shifted to theright. In our empirical analysis below we show that subscriber density strongly dominates generalbook purchases as an explanatory variable for development. Next, the correlation between sub-scriber density and proto-industrialization is small and insignificant. This makes reverse causalityunlikely – the concern that encyclopedia sales may have been higher in areas with early industrialactivity. The local density of noble families is positively associated with subscriber density, witha significant coefficient in col 5. This is in line with nobles being prominent subscribers to theencyclopedia. Finally, the density of ‘counter-revolutionaries’ killed during the Reign of Terroris positively, but not significantly correlated with subscriber density. Appendix C.6 provides fur-ther tests of balancedness, comparing cities with and without subscriptions, as well as those withabove- and below-median subscriber density. These additional tests confirm the pattern describedabove: the few city characteristics that vary systematically with subscriber density are those thatone should expect if subscriptions reflect the size of the local knowledge elite.
5 Empirical Results
In this section we present our empirical results. We test the predictions of the model by estimatingequations of the form
yn = β · Sn + γhn + δXn + εn , (10)
where Sn denotes different measures for the size of the knowledge elite in location n, i.e., thedensity of encyclopedia subscribers and members of scientific societies; hn denotes proxies foraverage human capital, such as literacy and schooling; Xn is a vector of control variables, and εn
represents the error term. We use a variety of outcome variables yn, depending on the propositionthat we analyze. Propositions 1-4 imply the following expected coefficients: First, when using citygrowth as an outcome, we expect β = 0 and γ = 0 prior to 1750, as well as β > 0 and a smallnegative γ after 1750. Second, for income proxies such as soldier height, we again expect β = 0
prior to 1750 and β > 0 afterwards, but γ > 0 in both periods. Third, the same is true whenwe use measures for manufacturing activity (e.g., wages and employment) – with an additionaldimension: after 1750, we only expect β > 0 for modern manufacturing, but β = 0 for traditionalmanufacturing.
5.1 City Growth
City growth is a widely used proxy for economic development (DeLong and Shleifer, 1993; Ace-moglu et al., 2005; Dittmar, 2011). Following this approach, we use the outcome variable gpopnt,
23

the log difference in city population between two periods t and t − 1 (mostly 100-year intervals).Figure 6 shows the distribution of gpopnt for different subscriber densities. During industrializa-tion in France, cities with encyclopedia subscriptions grew substantially faster: the city growthdistribution is markedly shifted to the right. In addition, this shift is more pronounced for citieswith above-median subscriptions per capita. In the following, we analyze this pattern in moredetail and account for possible confounding factors, such as initial city size.
Cities with vs. without Subscriptions: Matching Estimation
Between 1750 and 1850, cities with above-zero subscriptions to the encyclopedia grew at ap-proximately double the rate as compared to those without subscribers (0.51 vs. 0.26 log points).However, merely comparing the two subsets is problematic, because larger cities are more likelyto have at least one subscriber. As a first pass at this issue, we use propensity score matching,comparing cities with and without subscriptions of very similar size. The results are reported inTable 2.52 Panel A shows results for a variety of specifications for the period 1750-1850. In col1, we use the full sample and match by initial population; col 2 excludes the 10% smallest andlargest cities in 1750. In cols 3 and 4 we introduce geographic latitude and longitude as additionalmatching variables.53 We thus compare nearby cities with similar population size, accounting forregional unobservables. The results are stable throughout: French cities with subscriptions grewapproximately 0.15 log points faster than those of comparable size without subscriptions. Thisdifference is statistically and economically significant: average city growth over this period was0.37 log points.
In Panel B of Table 2, we repeat the analysis for the pre-industrial period. The difference ingrowth is now substantially smaller and statistically insignificant, and for 1400-1500, the coeffi-cient is even negative and significant. The matching results support our model prediction that aknowledge elite – as proxied by encyclopedia subscriptions – fostered economic growth during,but not before industrialization.
52Following Abadie, Drukker, Herr, and Imbens (2004), we use the three nearest neighbors. Our results are robustto alternative numbers of neighbors. We define ‘treatment’ as cities with above-zero subscriptions and report averagetreatment of the treated (ATT) effects. Finally, we exclude the top and bottom 1-percentile of city growth rates for eachrespective period. This avoids that extreme outliers due to population changes of very small cities (for example, from1,000 to 4,000 or vice-versa) drive our results. In the OLS analysis below, we address this issue by using populationweights; in propensity score matching, weighting by city size is not feasible.
53The average population difference between matched cities with and without subscriptions is 6,500 inhabitants incol 1, and 500 inhabitants in col 2. When matching by geographic location (col 3), matched cities are on average lessthan 30 miles apart.
24

Subscriber Density
We now turn to our main explanatory variable, subscriber density lnSubDensn, using OLS re-gressions. This offers several advantages over the previous matching exercise: it exploits the fullvariation in subscriber density (instead of only a dummy), we can examine the coefficient on con-trols to see how they affect city growth, and we can use population-based weights to reduce thenoise in growth rates due to population changes in small cities – there is more reliable informationin a city growing from 100,000 to 200,000 inhabitants, than in one growing from 1,000 to 2,000.
Table 3, Panel A, presents our main OLS results for city growth. Subscriber density is stronglyand positively associated with city growth over the period 1750-1850 (columns 1-4). Atlantic andMediterranean ports have a similar effect; the former is in line with Acemoglu et al. (2005). Thenegative coefficient on initial population (after controlling for other characteristics) provides someevidence for conditional convergence (Barro and Sala-i-Martin, 1992). We also include a dummyfor Paris – the capital and by far the largest city. In addition, we control for the effect of locallanguages: because the Encyclopédie was written in French, subscriptions were lower in areaswith different languages: 0.50 per 1,000 inhabitants, versus 1.83 in French-speaking cities. BothParis and cities in non-French speaking areas grew faster than average between 1750 and 1850.54
Finally, we include a dummy for cities that had a printing press in 1500 and control for the lognumber of editions printed by that date. This replicates the specification in Dittmar (2011), whoshows that an early adoption of printing had strong positive effects on long-term city growth inEurope. Within France, the pattern is less robust – the dummy for cities hosting a printing presschanges signs depending on the period. In sum, including a rich set of control variables doesnot affect the size or statistical significance of the coefficient on lnSubDens. A one standarddeviation increase in subscriber density is associated with a city growth rate that is higher by 8.2-16.9 percentage points (0.17-0.35 standard deviations).
Columns 5-8 repeat the analysis for the pre-industrial period. The coefficients on lnSubDens
are now small and insignificant. In addition, where sample size and specification are comparable,the difference between the post- and pre-1750 coefficients is strongly significant: comparing thecoefficients on lnSubDens in cols 3 and 5, the 95% confidence interval does not overlap. In PanelB of Table 3 we repeat all city growth regressions for the subset of cities with above-zero subscrip-tions. The results closely resemble those of Panel A: subscriber density is strongly and significantlyassociated with city growth after 1750, but not before – in fact, in Panel B the coefficients for thetwo periods prior to industrialization are now negative (and insignificant).
54The latter is mostly due to 6 Alsacien-speaking cities in the Rhine area. This area saw rapid growth during theindustrialization. When including a separate Rhine-area dummy, the coefficient of non-French speaking falls to lessthan one half its original size, while the coefficient on lnSubDensn is unchanged.
25

Literacy and additional controls
We now turn to the role of average worker skills (measured by literacy) for city growth. Table4 reports the results; it also introduces additional controls – the potential confounding factorsdiscussed in Section 4.3.55 The coefficients on literacy are negative throughout, and statisticallysignificant in some specifications. According to the point estimates, the effect of literacy is alsoquantitatively small: a one standard deviation increase in literacy is associated with a decline incity growth by 0.11 standard deviations; for lnSubDens, the point estimates imply an increase byapproximately 0.33 standard deviations.
Among the additional controls, only proto-industrialization is positively and significantly as-sociated with city growth (col 2 in Table 4). This confirms the findings in Abramson and Boix(2013). Nevertheless, controlling for proto-industrial activity does not alter the coefficient on sub-scriber density – in fact, the two measures are (weakly) negatively correlated (see Table 1). Thestandardized beta coefficient on proto-industrial activity is 0.17, and thus half the size of the sub-scriber density effect. Nobility density is not associated with city growth (col 3). This is in linewith the historical evidence discussed in Section 2.2 that only a progressive subset of the nobilitywas involved in industrial activity. Next, while overall book purchases are strongly correlated withlnSubDens (see Table 1), they do not affect city growth (col 4). The coefficient on executionsduring the reign of terror (cols 5) is also small and insignificant. Finally, column 6 includes allpotential confounding factors together, confirming the previous results. Importantly, in all regres-sions the coefficients on lnSubDens remain highly significant and quantitatively similar to ourbaseline results in Table 3. In sum, the results in Table 4 strongly support our model predictionsthat there is a crucial difference between average worker skills and upper tail knowledge.
Alternative specifications
So far, we have shown that the association between subscriber density and city growth was strongafter 1750, and weak before that date. Next, we analyze systematically whether the observed in-crease in the coefficient was statistically significant. Table 5 replicates the specification from Nunnand Qian (2011), using log population as dependent variable in a panel setting. This specificationalso includes city fixed effects, absorbing all unobserved city characteristics that do not vary overtime. We find that the interaction of lnSubDens with a post-1750 dummy is highly significant andpositive, with a magnitude that is very similar to the previous growth regressions. This finding isrobust to including interactions of the post-1750 dummy with our baseline controls (col 2), as wellas with our additional controls (col 3). The baseline result also holds in a balanced sample that
55Standard errors are now clustered at the department level, since this is the geographical unit at which literacy andmost confounding factors are observed.
26

only includes cities where population is observed in every sample year between 1500 and 1850(col 4). Finally, columns 5 and 6 report the results for placebo ‘treatments’, when moving theindustrialization cutoff to 1600 or 1700. Both yield small and insignificant coefficients.
In Table 6 we show that our results also hold for the two sub-periods 1750-1800 (col 1) and1800-1850 (col 2). The coefficients on lnSubDens are highly significant and of a similar mag-nitude.56 Splitting the period of French industrialization into pre- and post-1800 also allows foran additional check: in col 3, we control for growth in the earlier period. This variable shouldcapture unobserved (and persistent) drivers of city growth. Including it does not change the coef-ficient on lnSubDens in the later period. This further alleviates the concern that unobserved citycharacteristics may be behind our results.
We perform a number of additional checks in Appendix C.7. First, we run our city growthregressions for the period 1750-1850, using four different sub-samples, each including those citiesfor which population data are available in the year 1400, 1500, 1600, and 1700 respectively. Thecoefficients on lnSubDens are very similar to our baseline results and are always significant at the1% level. Next, our results are almost identical when pooling growth over the period 1400-1750and comparing it with growth in 1750-1850 (as visualized in Figure 2). In addition, we use twoalternative measures of subscriber density: one that is not log-based, and another one that allowsfor variation in subscriber density across cities without subscription, assigning lower densities tolarger cities. All our results continue to hold. Finally, in line with the model predictions, we findno clear relationship between early literacy (recorded in 1686) and city growth prior to 1750.
Scientific societies
Since data on encyclopedia subscriptions are from the second half of the 18th century (1777-80),local adoption of industrial technology may already have been on the way when subscriptionsoccurred. Thus, reverse causality is a concern, because successful early industrial entrepreneursmay have been among the subscribers. In the following, we address this issue by using an earlierproxy for knowledge elites: the presence and membership of scientific societies in each city before1750 from McClellan (1985). Altogether, there are 22 cities with scientific societies foundedbefore 1750. This alternative variable is strongly associated with our main measure: cities hostinga scientific society were over three times more likely to also have encyclopedia subscriptions, andthey had almost four times more subscribers per capita (see Table A.6 in the Appendix).
Table 7 repeats our city growth regressions, using early scientific societies as explanatory vari-
56The raw correlation of city growth over the two periods is small: 0.07. One possible explanation is a structuralbreak after the French Revolution. Nevertheless, this did not change the way in which knowledge elites affected citygrowth – that is, even if the cross-sectional pattern of growth changed, cities with higher subscriber density grew fasterin both periods.
27

able. In Panel A we use propensity score matching, comparing cities of similar size and geographiclocation that hosted a scientific society prior to 1750 with cities that did not. Over the industrial-ization period (cols 1-2), French cities hosting a scientific society grew 0.2 log points faster thanthose without; the growth differential is statistically significant and is robust to adding geographiclatitude and longitude as matching variables. It is also very similar in magnitude to the results inTable 2. Throughout the pre-industrial period (cols 3-6), the growth differential is insignificant. InPanel B, we presents OLS results, using the local density of members, lnMembDens, as explana-tory variable.57 Membership density in scientific societies is strongly and positively associatedwith city growth over the period 1750-1850 (columns 1-2), but not before (columns 3-6). Theresults based on early scientific societies thus confirm our main results.
5.2 Income and Industrialization
We now turn to the effect of subscriber density on income and industrial employment in the 19thcentury, using a variety of outcome variables. The corresponding data is available at the departmentlevel, which we use as our main unit of analysis in the following.
Soldier Height
We begin by using a common proxy for income – soldier height. This variable is available inFrance before and after 1750, allowing us to test the income effects that our model predicts forworker skills and knowledge elites before and after the onset of industrialization. Columns 1-4 inTable 8 show that conscript height in 1819-26 is strongly positively associated with both subscriberdensity and literacy. This holds even when we control for historical height (cols 3-4). The pointestimates imply that a one standard deviation increase in lnSubDens is associated with an increasein average soldier height by 0.3cm (or 0.25 standard deviations). Columns 5 and 6 show thatsoldier height prior to 1750 is also positively associated with literacy, but not with lnSubDens.58
The results on soldier height are strong evidence in favor of Propositions 1-3.
Disposable Income and Employment Shares
In columns 1 and 2 of Table 9 we show that encyclopedia subscriptions in the mid-18th centurypredict disposable income in 1864, i.e., about a century later. The point estimate in col 1 impliesthat a one standard deviation increase in lnSubDens is associated with 6.5 percent (0.29 standarddeviations) higher income. To proxy for average worker skills, we can now use department-level
57This variable is calculated in the same way as lnSubDens (see Section 4.1). The two measures are stronglycorrelated, with a coefficient of 0.313 (p-value 0.0001).
58Table A.9 in the appendix reports further robustness checks, showing that all results hold when regressing con-script height separately on lnSubDens and Literacy, and when weighting regressions by the number of soldiers forwhich height is observed in each department.
28

schooling rates, which is available for 1837. This variable is positively (but not significantly)associated with income. Next, we use employment shares in 1876 as dependent variables. In linewith Proposition 2, subscriber density predicts lower employment shares in agriculture (cols 3-4in Table 9), and higher industrial employment (cols 5-6). The same pattern holds for schoolingrates, confirming Proposition 3. All regressions in Table 9 control for population density in orderto account for differences in urban vs. rural areas. As expected, industrial employment is largerin more densely populated areas. Controlling for potential confounding factors such as nobilitydensity, overall book sales, or density of proto-industrial activity (in the even columns) does notchange our results.
Sectoral Wages
In Table 10 we test our model’s predictions for wages after the onset of industrialization, usingdepartment-level data from the mid-19th century. Columns 1-4 show that subscriber density isnot associated with wages in agriculture – the coefficients are small and insignificant; however,it is a positive (and in col 3 significant) predictor of industrial wages. The industry wages incolumns 3 and 4 reflect combined traditional and modern manufacturing. In columns 5-8, weseparate the two by using wages in the textile (modern) and food (traditional) industries. Wefind that the effect of lnSubDens is positive and significant for the textile sector (and larger thanthe previous coefficient for industry overall); and it is minuscule and insignificant for the foodprocessing sector. This underlines the differential effect of upper tail knowledge – in line with ourmodel, it is important for modern industrial technology but not for traditional modes of production.Finally, the coefficient on schooling is positive and strongly significant throughout columns 1-8.59
5.3 Innovativeness and the Role of Knowledge Elites
Our results suggest that knowledge elites are strongly associated with higher firm productivity inmodern manufacturing, but not in traditional manufacturing. In the following, we analyze onemechanism that can explain this pattern: upper tail knowledge was important for the adoption,diffusion, and further improvement of innovative industrial technology (Mokyr, 2005a,b). Forentrepreneurs and scientists in France, staying up-to-date with the latest British inventions ensureda competitive advantage, and scientific publications were an important source of this information(Horn, 2006). In the following, we implement a three-step argument. We first use British patentdata to split industrial sectors into modern and traditional. We then show that the dominant shareof technologies described and illustrated in the encyclopedia was indeed modern.60 Finally, we
59In Table A.10 in the appendix we provide additional evidence in support of our model: the density of proto-industrial activity (i.e., prior to industrialization) is strongly associated with literacy, but not with subscriber density.
60We do not argue that the encyclopedia was the only publication that illustrated recent innovations. However, itssubscribers were also more likely to read other scientific publications, and to be involved in innovation. This underlines
29

show that subscriber density predicts firm productivity in modern, but not in traditional sectors.
From English Patents to Plates in the Encyclopedia
Nuvolari and Tartari (2011) provide data on the share of "inventive output" of 21 British industrialsectors for the period 1617-1841. This measure is based on reference-weighted patents, adjustedfor the sector-specific frequency of patenting rates and citations. For example, textiles have thehighest score, accounting for 16.6% of total inventive output; and pottery, bricks and stones are atthe lower end with a share of 1.4%.
We then use the British patent data to analyze whether ‘modern’ sectors were disproportion-ately represented in the encyclopedia. The encyclopedia used plates to illustrate crafts, processes,and inventions. We obtain detailed information on 2,575 illustrative plates accompanying 326encyclopedia entries (see Appendix C.9 for sources and further detail). Thus, on average eachentry was accompanied by 8 illustrative plates. About half of these describe manufacturing tech-nologies, and entries include examples such as cloth cutting and figuring or machines to evacuate
water from a mine. We match each entry to one of the 21 British industrial sectors, which allowsus to split entries and plates into ‘modern’ and ‘old’ technologies, corresponding to above- andbelow-median share of total inventive output. The share of inventive output was more than fivetimes higher in the modern category (8.4% vs. 1.6%), and more than two thirds of all plates ded-icated to manufacturing described ‘modern’ technologies (see Table A.11 in the appendix). Thus,there is strong evidence that the encyclopedia indeed spread predominantly knowledge on modern,innovative industrial technology.
Knowledge Elites and Productivity in Modern vs. Traditional Manufacturing
We now analyze the relationship between subscriber density and firm productivity (proxied bywages) in ‘modern’ versus ‘old’ manufacturing sectors. This analysis builds on data from a Frenchindustrial survey of more than 14,000 firms in 1839-47, which reports the sector and firm locationby arrondissement.61 We run the following regression separately for ‘modern’ and ‘old’ sectors:
ln (wagejn) = β · lnSubDensn + γ · schoolingn + δXn + ϕ · sizejn + αj + εjn , (11)
where wagejn is the average male wage paid by firms operating in sector j in arrondissement n,and the vector Xn includes our baseline controls used above, as well as total population and theurbanization rate in order to control for agglomeration effects. In addition, we control for sectorfixed effects (αj), and for average firm size (sizejn) to capture scale effects.
the character of our subscriber density measure as a proxy for local knowledge elites.61French arrondissements are comparable to US counties – there were altogether 356 arrondissements in 86 depart-
ments in the mid-19th century. Appendix C.10 describes the firm survey in more detail and shows how we matchFrench to British sectors. It also lists the resulting consistent 8 sectors and their share of ‘inventive output’.
30

If upper tail knowledge affected development by raising the productivity in innovative technol-ogy, we expect the coefficient β to be larger when running (11) for ‘modern’ as opposed to ‘old’sectors. Table 11 presents compelling evidence in support of this hypothesis. Subscriber densityis a strong positive predictor of firm productivity in the ‘modern’ sectors (col 1). This holds afteradding our baseline controls (col 3), and also when including additional controls and sector fixedeffects (cols 5 and 7). The last specification exploits only within-sector variation across arrondisse-ments; the point estimate can be interpreted as follows: suppose that we "move" a representativefirm in a given ‘modern’ sector from an arrondissements without subscriptions (the lower half ofsubscriber density) to one in the 90th percentile of subscriber density. Then its output per workerwould increase by 13 percent. For ‘old’ sectors, on the other hand, the coefficients on subscriberdensity are small and almost always insignificant (odd columns).62 In line with our model, school-ing is positively associated with firm wages in both ‘old’ and ‘modern’ manufacturing.
Finally, we analyze the effect of encyclopedia subscriptions on wages within individual sectors,running regression (11) separately for different sectors j. Table 12 reports the results, rankingsectors by the size of the coefficient on lnSubDens. The top four sectors are all ‘modern’, andthe bottom four are all ‘old’. In particular, the coefficient on subscriber density is large withinsectors that saw rapid innovation during industrialization, such as textiles or transportation (thefirst steamboat was built in France in 1783). For the least innovative sectors (leather, mining,ceramics and glass), subscriber density is only weakly related to wages. Column 3 shows that thenumber of observations and the R2 are similar for ‘modern’ and ‘old’ sectors. Thus, overall fit orsmall samples do not drive the differences in coefficients. Table 12 also revisits the concern thatunobserved local wealth may drive our results, i.e., that the rich could afford the encyclopedia andalso had the financial means to invest in industrial machines. We use two proxies for an industry’sdependence on up-front investment: the number of steam engines (col 4), and the number of otherengines such as wind and water mills (col 5). Interestingly, both measures for up-front investmenttend to be higher in sectors where the effect of encyclopedia subscriptions is weaker (such asmetal and leather). This makes financial abundance an unlikely confounding factor.63 In sum, ouranalysis suggests that knowledge elites supported industrialization by raising the local productivityin innovative modern technology.
62Note that this difference is not due to noisier estimates – the standard errors are very similar to those for ‘modern’sectors, and the number of observations is actually larger for ‘old’ sectors. In Table A.13 we show that these resultsare also robust to including regional fixed effects.
63Verley (1985, p.103-104) observes that the metal industry was particularly capital intensive and often operatedby the rich nobility, while textile production occurred at a smaller scale and required much less capital. Our findingthat subscriber density is particularly strongly associated with productivity in the latter is thus compatible with aknowledge-based explanation, but not with an investment-based (confounding) one.
31

5.4 Discussion: Interpretation and Limitations of Results
Our empirical analysis follows the common approach to regress growth rates on initial levels ofhuman capital (Barro, 2001). It thus also shares the common limitation that skills are not assignedexogenously to different locations, making causal inference difficult. In the following, we interpretour results accordingly.
We have documented a striking pattern: encyclopedia subscriptions are strongly associatedwith economic growth and income after 1750, but not before the onset of industrialization inFrance. Our interpretation is not that the encyclopedia turned its readers into entrepreneurs, orthat it caused local upper tail knowledge. Instead, we use subscriber density as an indicator forthe local presence of knowledge elites. This culture of knowledge was likely locally persistent andexisted prior to the encyclopedia: we documented that pre-1750 membership in scientific societiesis a strong predictor of encyclopedia subscriptions. Our analysis is thus similar to a difference-in-difference (DID) approach where the ‘treatment’ (upper tail knowledge) is a latent, persistent localcharacteristic whose effect is turned on only after the emergence of modern technology rendersupper tail knowledge economically ‘useful’ (Mokyr, 2005b).64 This limits the set of potential con-founding factors – to drive our results, they would have to be correlated with subscriber density,affect growth via channels unrelated to upper tail knowledge, and be ‘switched on’ around 1750.
We have analyzed alternative explanations that may fit this pattern – institutions, nobility, and‘Reign of Terror’ – and concluded that they are unlikely to account for our results.65 While wecannot fully exclude the possibility of yet other unobservables, we believe that the most reasonableinterpretation of our results is the one that relies on overwhelming support from the historicalliterature: knowledge elites played a crucial role for economic growth once industrial technologybecame economically viable in the 18th century. The underlying mechanism is not confined toinventors or scientists actively improving technology, but it also comprises lower access costs(e.g., via information networks in the knowledge elite) and higher efficiency at adopting complexmodern techniques (Mokyr, 2005b). Thus, our interpretation emphasizes a broad concept of uppertail knowledge – but one that is clearly distinct from ordinary worker skills.
Average worker skills also show a stable local pattern over time – the department-level literacyrate in 1686 has a correlation coefficients of 0.84 with literacy in 1786, and of 0.65 with school-
64In DID terminology: by comparing locations with high (‘treated’) and low (‘control’) subscriber density, weaccount for unobserved country-wide changes during industrialization; and by comparing the relationship betweensubscriber density and economic outcomes before and after 1750, we control for unobserved local characteristics.
65We also demonstrated that subscriber density was unrelated to most observable local characteristics at the eve ofFrench industrialization, and that it was not associated with economic performance prior to 1750. In addition, 18Csubscriber density does not predict mid-19C productivity across the board, but only where we should expect it: withininnovative modern sectors.
32

ing in 1837. We confirm the model prediction that these measures are positively associated withdevelopment both before and after industrialization began. While endogeneity is a concern forthese cross-sectional results, it can hardly explain our finding that literacy was not, or if anythingnegatively, associated with city growth during industrialization.
In sum, by predicting when the two types of human capital will and will not affect economic de-velopment, our model allows us to run a number of implicit checks. These are all confirmed by thedata. The empirical results thus strongly support our theoretical setup that differentiates betweenaverage and upper tail skills, and its prediction that only the latter was crucial for industrialization.
6 Conclusion
An ample literature has highlighted the importance of human capital for economic developmentin the modern world. However, its role during the Industrial Revolution is typically found to beminor. Thus, a crucial driver of modern growth appears to be unrelated to the onset of growth itself,and thus to the greatest structural break in economic history that led to a vast dispersion of percapita income (Galor, 2011). Previous studies have typically used literacy or elementary educationto measure human capital at the eve of the Industrial Revolution. We show that distinguishingbetween average worker skills and upper tail knowledge is crucial, reinstating the role of humancapital for industrialization.
We extend a workhorse model of the industrial revolution by splitting manufacturing into atraditional and a modern sector. This allows us to introduce two assumptions that are motivated byample historical evidence: i) worker skills were needed in both sectors, and if anything, somewhatmore so in the traditional one, ii) upper tail knowledge was only important in the modern sector.Since technological progress during industrialization was concentrated in the modern sector, themodel predicts that upper tail knowledge was crucial for economic take-off. On the other hand,spatial differences in average worker skills can explain income dispersion in the cross-section,but are unrelated to growth. We present strong empirical support for these predictions, usingliteracy and elementary schooling to proxy for average worker skills, and the novel measure of18C encyclopedia subscriptions to capture local knowledge elites. Importantly, we do not arguethat average worker skills were altogether unimportant; we show that they were strongly correlatedwith income levels before and after industrialization, but not with growth. In contrast, subscriberdensity is not associated with income or industrial activity prior to 1750, but is a strong predictorof growth thereafter, and of income levels and industrial activity in the 19th century. In line withour theoretical prediction, subscriber density is a particularly strong predictor of firm productivityin innovative modern sectors.
Our results have important implication for economic development: while improvements in ba-
33

sic schooling raise wages, greater worker skills alone are not sufficient to trigger a transition tosustained industrial growth. Instead, upper tail skills – even if confined to a small entrepreneurialelite – are crucial, fostering growth via the innovation and diffusion of modern technology. Inthis respect, our findings resemble those in today’s economies, where the existence of a socialclass with high education is crucial for development (Acemoglu, Hassan, and Robinson, 2011),entrepreneurial skills matter beyond those of workers (Gennaioli et al., 2013), and scientific edu-cation is key (Hanushek and Kimko, 2000).
ReferencesAbadie, A., D. Drukker, J. L. Herr, and G. W. Imbens (2004). Implementing Matching Estimators for
Average Treatment Effects in Stata. Stata Journal 4, 290–311.
Abramson, S. F. and C. Boix (2013). The Roots of the Industrial Revolution: Political Institutions or(Socially Embedded) Know-How? APSA 2013 Annual Meeting Paper.
Acemoglu, D., T. A. Hassan, and J. A. Robinson (2011). Social Structure and Development: A Legacy ofthe Holocaust in Russia. Quarterly Journal of Economics 126(2), 895–946.
Acemoglu, D., S. Johnson, and J. A. Robinson (2005). The Rise of Europe: Atlantic Trade, InstitutionalChange and Economic Growth. American Economic Review 95(3), 546–579.
Allen, R. C. (2003). Progress and Poverty in Early Modern Europe. Economic History Review 56(3),403–443.
Aron, J. P., P. Dumont, and E. Le Roy Ladurie (1972). Anthropologie du Conscrit Français. Paris: MoutonDe Gruyter.
Bairoch, P., J. Batou, and P. Chèvre (1988). La Population des villes Europeenees de 800 à 1850: Banquede Données et Analyse Sommaire des Résultats. Geneva: Centre d’histoire economique Internationale del’Université de Genève, Libraire Droz.
Ballot, C. (1923). L’Introduction du Machinisme dans l’Industrie Française. F. Rieder and cie, Paris.
Barro, R. J. (2001). Human Capital and Growth. American Economic Review Papers and Proceedings 91(2),12–17.
Barro, R. J. and X. Sala-i-Martin (1992). Convergence. Journal of Political Economy 100(2), 223–251.
Baten, J. and J. van Zanden (2008). Book Production and the Onset of Modern Economic Growth. Journalof Economic Growth 13(3), 217–235.
Becker, S. O., E. Hornung, and L. Woessmann (2011). Education and Catch-up in the Industrial Revolution.American Economic Journal: Macroeconomics 3(3), 92–126.
Bils, M. and P. J. Klenow (2000). Does Schooling Cause Growth? American Economic Review 90(5),1160–1183.
Braudel, F. (1982). Civilization and Capitalism, 15th–18th Century: The perspective of the world. Univer-sity of California Press.
Brinkman, H. J., J. Drukker, and B. Slot (1988). Height and Income: A New Method for the Estimation of
34

Historical National Income Series. Explorations in Economic History 25(3), 227–264.
Cantoni, D. and N. Yuchtman (2014). Medieval Universities, Legal Institutions, and the Commercial Revo-lution. Quarterly Journal of Economics. forthcoming.
Carus-Wilson, E. M. (1966). The Woollen Industry. Cambridge Economic History of Europe. Volume II.Cambridge University Press.
Chanut, J.-M., J. Heffer, J. Mairesse, and G. Postel-Vinay (2000). L’Industrie franccaise au milieu du 19esiécle: les enquêtes de la statistique générale de la France. Editions de l’école des hautes études ensciences sociales, Paris.
Chaptal, M. (1819). De l’Industrie Français, Volume 2. Paris.
Chaussinand-Nogaret, G. (1985). The French Nobility in the Eighteenth Century: From Feudalism to En-lightenment. Cambridge University Press.
Ciccone, A. and E. Papaioannou (2009). Human Capital, the Structure of Production, and Growth. Reviewof Economics and Statistics 91(1), 66–82.
Clair, C. (1976). A History of European Printing. London: Academic.
Clark, G. (2005). The Condition of the Working Class in England, 1209-2003. Journal of Political Econ-omy 113(6), 1307–1340.
Cohen, D. and M. Soto (2007). Growth and human capital: good data, good results. Journal of EconomicGrowth 12(1), 51–76.
Crafts, N. F. R. (1996). The First Industrial Revolution: A Guided Tour for Growth Economists. AmericanEconomic Review Papers and Proceedings 86(2), 197–201.
Crouzet, F. (2003). The Historiography of French Economic Growth in the Nineteenth Century. EconomicHistory Review 62(2), 215–242.
Darby, H. C. and H. Fullard (1970). The New Cambridge Modern History, Volume 14. Cambridge: Cam-bridge University Press.
Darnton, R. (1973). The Encyclopedie Wars of Prerevolutionary France. The American Historical Re-view 78(5), 1331–1352.
Darnton, R. (1979). The business of enlightenment: A publishing history of the Encyclopédie, 1775–1800.Cambridge, MA: Belknap-Harvard University Press.
de Tocqueville, A. (1856). The Old Regime and the French Revolution. Garden City, N.Y.: Doubleday.Reprinted in 1955.
Delefortrie, N. and J. Morice (1959). Les Revenus departmentaux en 1864 et en 1954. Paris, France: Colin.
DeLong, J. B. and A. Shleifer (1993). Princes and Merchants: City Growth before the Industrial Revolution.Journal of Law and Economics 36, 671–702.
Dittmar, J. E. (2011). Information Technology and Economic Change: The Impact of the Printing Press.Quarterly Journal of Economics 126, 1133–1172.
FBTEE (2012). The French Book Trade in Enlightenemnt Europe Database.
Flora, P., F. Kraus, and W. Pfenning (1983). State, Economy, and Society in Western Europe 1815-1975:The Growth of Industrial Societies and Capitalist Economies, Volume 1. St. James Press, Chicago.
Fox, R. (1984). Presidential Address: Science, Industry, and the Social Order in Mulhouse, 1798-1871. The
35
British Journal for the History of Science 17(2), 127–168.
Furet, F. and J. Ozouf (1977). Lire et écrire. L’alphabétisation des Français de Calvin à Judes Ferry. Minuit,Paris.
Galor, O. (2005). From Stagnation to Growth: Unified Growth Theory. In P. Aghion and S. Durlauf (Eds.),Handbook of Economic Growth, Volume 1, Chapter 4, pp. 171–293. Elsevier.
Galor, O. (2011). Unified Growth Theory. Princeton University Press.
Gennaioli, N., R. La Porta, F. Lopez-de-Silanes, and A. Shleifer (2013). Human Capital and RegionalDevelopment. Quarterly Journal of Economics 128(1), 105–164.
Goreaux, L. M. (1956). Les migrations agricoles en France depuis un siécle et leur relation avec certainsfacteurs économiques. Études et Conjoncture 11, 327–376.
Graham, H. (2011). Humble Petitioners? Seigneurial Courts, Royal Justice and the Role of Litigants in theEighteenth Century. French History & Civilization 4, 12–21.
Hamscher, A. N. (2012). The Royal Financial Administration and the Prosecution of Crime in France,1670–1789. Newark: University of Delaware Press.
Hansen, G. and E. Prescott (2002). Malthus to Solow. American Economic Review 92(4), 1205–1217.
Hanushek, E. A. and D. D. Kimko (2000). Schooling, Labor-Force Quality, and the Growth of Nations.American Economic Review 90(5), 1184–1208.
Hanushek, E. A. and L. Woessman (2012). Do Better Schools Lead to More Growth? Cognitive Skills,Economic Outcomes, and Causation. Journal of Economic Growth 17(4), 267–321.
Hanushek, E. A. and L. Woessmann (2008). The Role of Cognitive Skills in Economic Development.Journal of Economic Literature 46(3), 607–668.
Horn, J. (2006). The Path Not Taken: French Industrialization in the Age of Revolution, 1750-1830. Cam-bridge MA: MIT Press.
Horn, J. and M. C. Jacob (1998). Jean-Antoine Chaptal and the Cultural Roots of French Industrialization.Technology and Culture 39(4), 671–698.
Hornung, E. (2014). Immigration and the Diffusion of Technology: The Huguenot Diaspora in Prussia.American Economic Review 104(1), 84–122.
ISTC (2008). Incunabula Short-Title Catalogue. London: British Library.
Jedin, H., K. S. Latourette, and J. Martin (1970). Atlas Zur Kirchengeschichte. Freiburg: Herder.
Kelly, M., J. Mokyr, and C. Ó Grada (2014). Precocious Albion: A New Interpretation of the BritishIndustrial Revolution. Annual Reviews of Economics 6. forthcoming.
Kessler, A. (2010). Marginalization and Myth: The Corporatist Roots of FranceŠs Forgotten Elective Judi-ciaryT. American Journal of Comparative Law 58, 679–720.
Komlos, J. (1998). Shrinking in a Growing Economy? The Mystery of Physical Stature during the IndustrialRevolution. Journal of Economic History 58(3), 779–802.
Komlos, J. (2005). Height of French Soldiers, 1716–1784. [Computer file] ICPSR04363-v1.
Komlos, J. and J. Baten (1998). The Biological Standard of Living in Comparative Perspective. FranzSteiner, Stuttgart.
36

Krueger, A. B. and M. Lindahl (2001). Education for Growth: Why and for Whom? Journal of EconomicLiterature 39(4), 1101–1136.
Livingstone, D. N. (2003). Putting Science in its Place: Geographies of Scientific Knowledge. ChicagoUniversity Press.
Lucien, F. and H.-J. Martin (1958). L’Apparition du Livre. Paris: Albin Michel.
Maddison, A. (2001). The World Economy. A Millennial Perspective. Paris: OECD.
Maddison, A. (2007). Historical Statistics. University of Groningen. Webpage:http://www.ggdc.net/maddison/.
Marczewski, J. (1961). Some Aspects of the Economic Growth of France 1660-1958. Economic Develop-ment and Cultural Change 9(3), 369–386.
McClellan, J. E. (1985). Science Reorganized: Scientific Societies in the Eighteenth Century. New York:Columbia University Press.
McEvedy, C. and R. Jones (1978). Atlas of World Population History, Facts on File. New York.
Milward, A. S. and S. B. Saul (1973). The Economic Development of Continental Europe 1780–1870.George Allen and Unwin Ltd., London.
Mitch, D. (1993). The Role of Human Capital in the First Industrial Revolution. In J. Mokyr (Ed.), TheBritish Industrial Revolution: An Economic Perspective, pp. 267–307. Boulder: Westview.
Mokyr, J. (1990). The Lever of Riches. Oxford: Oxford University Press.
Mokyr, J. (2000). Knowledge, Technology, and Economic Growth During the Industrial Revolution. InB. V. Ark and G. Kuper (Eds.), Technology and Productivity Growth. Hague: Kluwert. Available athttp://faculty.wcas.northwestern.edu/~jmokyr/Groningen.pdf.
Mokyr, J. (2002). The Gifts of Athena: Historical Origins of the Knowledge Economy. Princeton, NJ:Princeton University Press.
Mokyr, J. (2005a). Long-Term Economic Growth and the History of Technology. Volume 1 of Handbookof Economic Growth, pp. 1113–80. Elsevier, Amsterdam.
Mokyr, J. (2005b). The Intellectual Origin of Modern Economic Growth. Journal of Economic His-tory 65(2), 285–351.
Mokyr, J. and H.-J. Voth (2009). Understanding Growth in Early Modern Europe. In S. Broadberry andK. O’Rourke (Eds.), The Cambridge Economic History of Europe. Cambridge: Cambridge UniversityPress.
Moser, P. (2012). Innovation without Patents: Evidence from World’s Fairs. Journal of Law and Eco-nomics 55(1), 43–74.
Mousnier, R. (1979). The Institutions of France under the Absolute Monarchy, 1598–1789. Chicago:University of Chicago Press.
Muessig, U. (2012). Judges and Judging in the History of the Common Law and Civil Law, Chapter Su-perior courts in early-modern France, England and the Holy Roman Empire, pp. 209–233. CambridgeUniversity Press.
Murphy, T. E. (2010). Old Habits Die Hard (Sometimes): What can Département Heterogeneity Tell usabout the French Fertility Decline? IGIER Working Paper 364.
37

Nunn, N. and N. Qian (2011). The Potato’s Contribution to Population and Urbanization: Evidence from anHistorical Experiment. Quarterly Journal of Economics 126(2), 593–650.
Nuvolari, A. and V. Tartari (2011). Bennet Woodcroft and the value of English patents, 1617–1841. Explo-rations in Economic History 48, 97–115.
Nye, J. V. (1987). Firm Size and Economic Backwardness: A New Look at the French IndustrializationDebate. The Journal of Economic History 47(3), 649–669.
O’Rourke, K. H., A. S. Rahman, and A. M. Taylor (2008). Luddites and the Demographic Transition. NBERworking paper 14484.
O’Rourke, K. H. and J. G. Williamson (1995). Education, Globalization and Catch-up: Scandinavia in theSwedish Mirror. Scandinavian Economic History Review 43(3), 287–309.
Roche, D. (1998). France in the Enlightenment. Harvard University Press, Cambridge, MA.
Roehl, R. (1976). French Industrialization: A Reconsideration. Explorations in Economic History 13,223–281.
Rostow, W. W. (1975). How it All Began: Origins of the Modern Economy. Methuen and Co., London.
Service de la Statistique Général de France (1878). Annuaire Statistique de la France. Paris, ImprimerieNationale.
Smith, J. M. (2006). The French Nobility in the Eighteenth Century: Reassessments and New Approaches.University Park, Pa.: Pennsylvania State University Press.
Sprandel, R. (1968). Das Eisengewerbe im Mittelalter. A. Hiersemann.
Steckel, R. H. (1983). Height and Per Capita Income. Historical Methods 16, 1–7.
Steckel, R. H. (2008). Biological Measures of the Standard of Living. Journal of Economic Perspec-tives 22(1), 129–152.
Taylor, A. M. (1999). Sources of Convergence in the Late Nineteenth Century. European Economic Re-view 43(9), 1621–1645.
Tilly, C. (1990). Coercion, Capital, and European States, 990–1990. London: Blackwell.
Verley, P. (1985). La Révolution Industrielle. MA Editions, Paris.
Vogt, W. P. (1982). Paideia for Profit. History of Education Quarterly 22(1), 89–98.
Voigtländer, N. and H.-J. Voth (2012). Persecution Perpetuated: The Medieval Origins of Anti-SemiticViolence in Nazi Germany. Quarterly Journal of Economics 127(3), 1339–1392.
38

FIGURES
Subscriber density
no data[0 − 0.2](0.2 − 1.0](1.0 − 3.5](3.5 − 15.2]
Subs. per 1,000
Literacy in 1786
no data[0 − 0.3](0.3 − 0.5](0.5 − 0.7](0.7 − 0.9]
Literacy 1786
Figure 1: Encyclopedia subscriber density and literacy rates
Notes: The left panel shows the spatial distribution of encyclopedia subscribers per 1,000 city inhabitantsin the second half of the 18th century. The right panel shows the distribution of literacy rates (percentage ofmales signing their marriage certificate) across French departments in 1786. Both variables are describedin detail in Section 4.1. Figure A.4 in the appendix plots the two variables against each other, show thatthey are not correlated.
39

1400 – 1750
−.9
−.6
−.3
0.3
.6.9
City
gro
wth
(re
sidu
al)
−1 −.5 0 .5 1 1.5Subscriber density (residual)
coef = .037, (robust) se = .034, t = 1.10
1750 – 1850
−.9
−.6
−.3
0.3
.6.9
City
gro
wth
(re
sidu
al)
−1 −.5 0 .5 1 1.5Subscriber density (residual)
coef = .218, (robust) se = .051, t = 4.28
Figure 2: Encyclopedia subscriptions and city growth – before and after 1750
Notes: The figure plots average annual city growth in France against encyclopedia subscriber density(lnSubDens), after controlling for our baseline controls (those listed in the left panel of Table 1). The leftpanel uses the pre-industrial period 1400-1750. The right panel examines the same cities over the periodof French industrialization, 1750-1850. Average annual city growth is more than twice as high in the latterperiod, from 0.23% to 0.48%.
Employment Shares
0 0.5 1 1.50
0.1
0.2
0.3
0.4
0.5
0.6
0.7
0.8
0.9
%population in knowledge elite
Em
ploy
men
t Sha
re
Traditional Manufacturing
Modern Manufacturing
Agriculture
Income
0 0.5 1 1.5
1
1.2
1.4
1.6
1.8
2
2.2
HH
inco
me
%population in knowledge elite0 0.5 1 1.5
−0.5
0
0.5
1
1.5
2
2.5
Inco
me
grow
th r
ate
AgricultureAvg. Income
Traditional Manufacturing
Income growth (right axis)
Figure 3: Low state of modern technology AM
Notes: The figure shows the employment shares (left panel), as well as sector-specific income and growth(right panel) for the case of low aggregate efficiency in modern manufacturing (low AM ). ‘Growth’corresponds to the effect of a 5% increase in AM on average household income. The horizontal axisrepresents the mass of the local knowledge elite, which is proxied by the percentage of the populationin region n with knowledge draws s ≥ 10, i.e., ten times larger than the mode of the underlying Paretodistribution given by equation (1). Due to the low AM , even households with high draws s do not findadoption of modern manufacturing profitable, so that the thickness of the upper tail does not affect laborshares or income. See Proposition 1 and the corresponding discussion in the text for further detail.
40
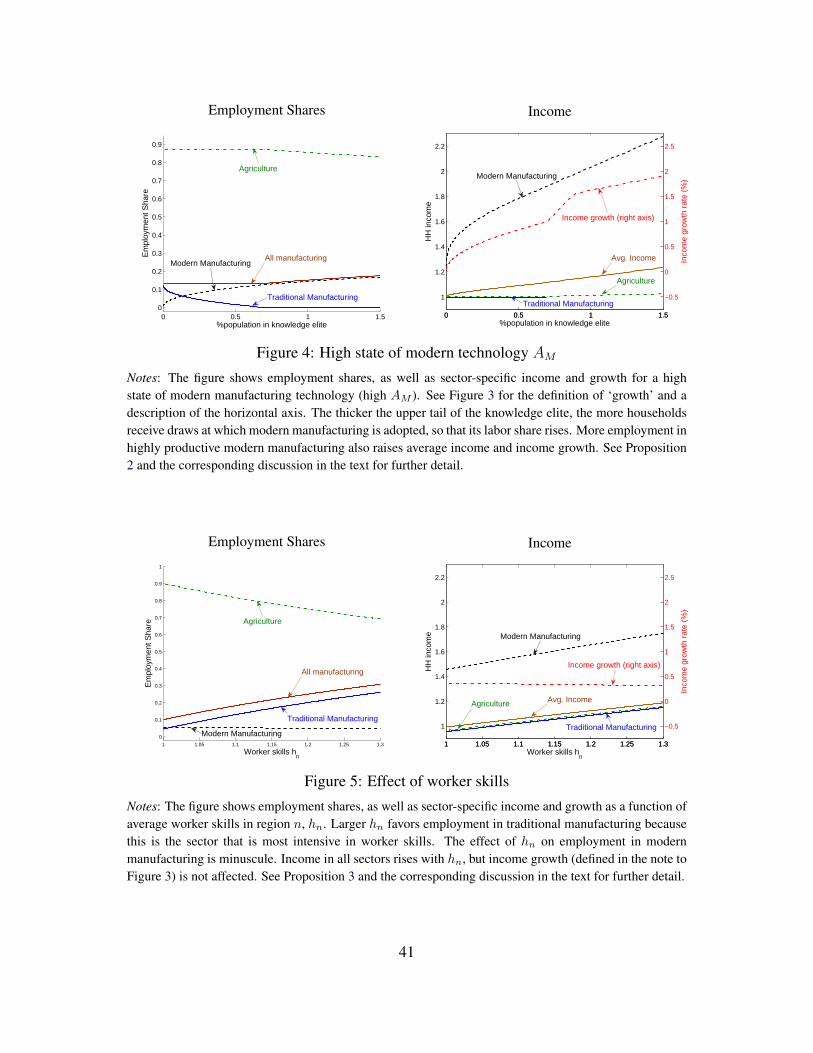
Employment Shares
0 0.5 1 1.50
0.1
0.2
0.3
0.4
0.5
0.6
0.7
0.8
0.9
%population in knowledge elite
Em
ploy
men
t Sha
re
Modern Manufacturing
Agriculture
Traditional Manufacturing
All manufacturing
Income
0 0.5 1 1.5
1
1.2
1.4
1.6
1.8
2
2.2
HH
inco
me
%population in knowledge elite0 0.5 1 1.5
−0.5
0
0.5
1
1.5
2
2.5
Inco
me
grow
th r
ate
(%)Modern Manufacturing
Income growth (right axis)
Avg. Income
Agriculture
Traditional Manufacturing
Figure 4: High state of modern technology AM
Notes: The figure shows employment shares, as well as sector-specific income and growth for a highstate of modern manufacturing technology (high AM ). See Figure 3 for the definition of ‘growth’ and adescription of the horizontal axis. The thicker the upper tail of the knowledge elite, the more householdsreceive draws at which modern manufacturing is adopted, so that its labor share rises. More employment inhighly productive modern manufacturing also raises average income and income growth. See Proposition2 and the corresponding discussion in the text for further detail.
Employment Shares
1 1.05 1.1 1.15 1.2 1.25 1.3
0
0.1
0.2
0.3
0.4
0.5
0.6
0.7
0.8
0.9
1
Worker skills hn
Em
ploy
men
t Sha
re Agriculture
All manufacturing
Traditional Manufacturing
Modern Manufacturing
Income
1 1.05 1.1 1.15 1.2 1.25 1.3
1
1.2
1.4
1.6
1.8
2
2.2
HH
inco
me
Worker skills hn
1 1.05 1.1 1.15 1.2 1.25 1.3
−0.5
0
0.5
1
1.5
2
2.5
Inco
me
grow
th r
ate
(%)
Modern Manufacturing
Income growth (right axis)
Avg. IncomeAgriculture
Traditional Manufacturing
Figure 5: Effect of worker skills
Notes: The figure shows employment shares, as well as sector-specific income and growth as a function ofaverage worker skills in region n, hn. Larger hn favors employment in traditional manufacturing becausethis is the sector that is most intensive in worker skills. The effect of hn on employment in modernmanufacturing is minuscule. Income in all sectors rises with hn, but income growth (defined in the note toFigure 3) is not affected. See Proposition 3 and the corresponding discussion in the text for further detail.
41

0.2
.4.6
.81
Ker
nel d
ensi
ty
−.5 0 .5 1 1.5City growth 1750−1850
No subscriptionsSubscriptions p.c. > 0, below−medianSubscriptions p.c. > 0, above−median
Figure 6: Subscriptions and city growth, 1750-1850
Notes: The figure shows the Kernel density of city growth over theperiod 1750-1850 for three subsets of French cities: 108 cities withoutencyclopedia subscriptions, as well as 43 (42) cities with above-zerosubscriptions and below-median (above-median) subscriber density.
42

TABLES
Table 1: Correlations with subscriber density (lnSubDens)
Baseline Controls Worker skills and additional controls
(1) (2) (3) (4)‡ (5)‡
Cities included: All Subs>0 Departments included: All All Subs>0
Population in 1750 0.374∗∗∗ -0.234∗∗ Literacy 1686 0.551 0.844 -0.132(0.073) (0.110) (0.593) (0.639) (0.721)
Atlantic Port 0.081 -0.222 Literacy 1786 0.290 0.363 0.021(0.207) (0.213) (0.345) (0.336) (0.375)
Mediterranean Port 0.022 -0.129 School Rate 1837 0.363 0.369 0.187(0.276) (0.223) (0.350) (0.340) (0.406)
Navigable River 0.422∗∗ -0.167 lnSTNBooksDens 0.232∗∗∗ 0.232∗∗∗ 0.163∗∗∗
(0.202) (0.210) (0.048) (0.055) (0.059)
University 1.030∗∗∗ 0.316 lnProtoIndDens -0.027 -0.058 -0.573(0.186) (0.194) (0.830) (0.851) (0.825)
Non French-Speaking -0.376∗∗ -0.719∗∗ lnNoblesDens 0.232 0.206 0.646∗∗∗
(0.146) (0.297) (0.278) (0.318) (0.237)
Printing Press 0.712∗∗∗ 0.203 lnExecuteDens 0.278∗∗ 0.205 0.236(0.170) (0.182) (0.118) (0.136) (0.142)
ln(Books Printed 1500) 0.171∗∗∗ 0.039(0.061) (0.066)
Observations 193 85 75/88 75/88 59/64
Notes: The table shows the coefficients of individual regression of subscriber density to the Quarto edition of theEncyclopédie, lnSubDens, on a variety of city characteristics. lnSubDens is computed as described in Section 4.1.Population in 1750 measures urban population (in thousands) for the cities in our sample. Atlantic Port, Mediter-ranean Port and Navigable River are dummies taking value 1 for cities with ports on the Atlantic Ocean or on theMediterranean Sea or located on a navigable river. University is a dummy taking value 1 for cities which hosted aUniversity before 1750. Non French Speaking is a dummy for six French departments who spoke a language otherthan French. Printing Press is a dummy taking value 1 for cities where a printing press was established before 1500.Ln(Books Printed 1500) represents the log number of editions printed before 1501. Additional controls comprise thefollowing variables (see Section 4.3 for sources and detail): Literacy in 1686 and 1786 measure the percentage ofmen signing their wedding certificate in the respective year. SchoolRate in 1837 measures the ratio of students toschool-age population (5 to 15 years) in 1836-37. lnSTNBooksDens represents the density of book sales to Francefrom the Swiss publishing house Société Typographique de Neuchâtel (STN). lnProtoIndDens is an index of proto-industrialization in France that includes the number of mines, forges, iron trading locations, and textile manufacturesbefore 1500. lnNoblesDens reflects the density of noble families in each French department. lnExecuteDens mea-sures the density of people executed during the reign of Terror. In columns 1-2, all regressions are run at the city level,in columns 3-5 at the department level. Robust standard errors in parentheses. * p<0.1, ** p<0.05, *** p<0.01.‡Includes baseline controls.
43

Table 2: Matching estimation by city size and location
Dependent variable: log city growth over the indicated period
(1) (2) (3) (4)
PANEL A: Period 1750-1850City size percentiles incl.: All 10-90 pct All 10-90 pct
ISubs>0 0.146∗∗ 0.155∗∗ 0.267∗∗∗ 0.163∗∗
(0.07) (0.07) (0.07) (0.07)
Matching variablesPopulation X X X XLocation X X
Observations 177 154 167 144
PANEL B: Pre-17501700-1750 1600-1700 1500-1600 1400-1500
ISubs>0 0.087 0.034 0.181 -0.567∗∗∗
(0.06) (0.17) (0.17) (0.21)
Matching variablesPopulation X X X XLocation X X X X
Observations 129 58 43 37
Notes: All regressions are run by propensity score matching at the city level, excluding the 1% of log city growthoutliers, and using the three nearest neighbors when there are more than 50 observations and the two nearest neighborsotherwise. Treatment variables is the indicator variable ISubs>0, which takes on value 1 if a city had above-zerosubscriptions to the encyclopedia (see the notes to Table 1 and Section 4.1 for detail). Columns 1 and 2 in Panel Ause city population as matching variable. Columns 3 and 4, as well as Panel B, add geographic longitude and latitude(location) as matching variables. Standard errors in parentheses. * p<0.1, ** p<0.05, *** p<0.01.
44
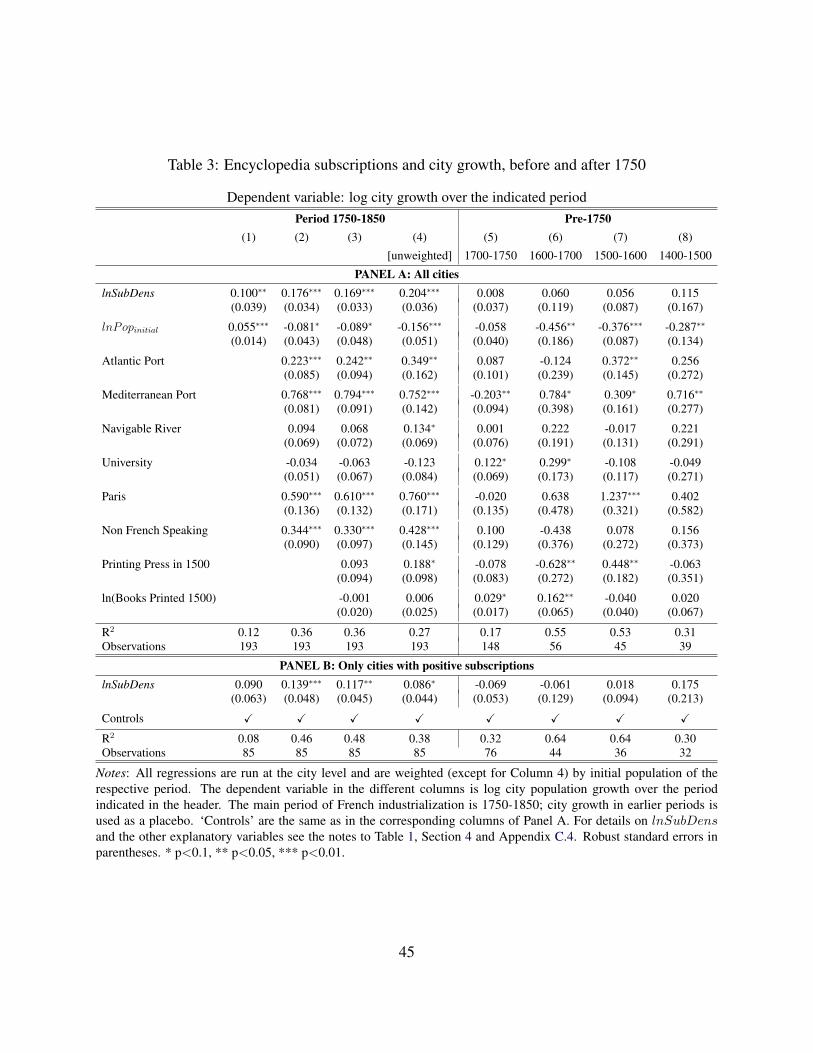
Table 3: Encyclopedia subscriptions and city growth, before and after 1750
Dependent variable: log city growth over the indicated periodPeriod 1750-1850 Pre-1750
(1) (2) (3) (4) (5) (6) (7) (8)
[unweighted] 1700-1750 1600-1700 1500-1600 1400-1500
PANEL A: All citieslnSubDens 0.100∗∗ 0.176∗∗∗ 0.169∗∗∗ 0.204∗∗∗ 0.008 0.060 0.056 0.115
(0.039) (0.034) (0.033) (0.036) (0.037) (0.119) (0.087) (0.167)
lnPopinitial 0.055∗∗∗ -0.081∗ -0.089∗ -0.156∗∗∗ -0.058 -0.456∗∗ -0.376∗∗∗ -0.287∗∗
(0.014) (0.043) (0.048) (0.051) (0.040) (0.186) (0.087) (0.134)
Atlantic Port 0.223∗∗∗ 0.242∗∗ 0.349∗∗ 0.087 -0.124 0.372∗∗ 0.256(0.085) (0.094) (0.162) (0.101) (0.239) (0.145) (0.272)
Mediterranean Port 0.768∗∗∗ 0.794∗∗∗ 0.752∗∗∗ -0.203∗∗ 0.784∗ 0.309∗ 0.716∗∗
(0.081) (0.091) (0.142) (0.094) (0.398) (0.161) (0.277)
Navigable River 0.094 0.068 0.134∗ 0.001 0.222 -0.017 0.221(0.069) (0.072) (0.069) (0.076) (0.191) (0.131) (0.291)
University -0.034 -0.063 -0.123 0.122∗ 0.299∗ -0.108 -0.049(0.051) (0.067) (0.084) (0.069) (0.173) (0.117) (0.271)
Paris 0.590∗∗∗ 0.610∗∗∗ 0.760∗∗∗ -0.020 0.638 1.237∗∗∗ 0.402(0.136) (0.132) (0.171) (0.135) (0.478) (0.321) (0.582)
Non French Speaking 0.344∗∗∗ 0.330∗∗∗ 0.428∗∗∗ 0.100 -0.438 0.078 0.156(0.090) (0.097) (0.145) (0.129) (0.376) (0.272) (0.373)
Printing Press in 1500 0.093 0.188∗ -0.078 -0.628∗∗ 0.448∗∗ -0.063(0.094) (0.098) (0.083) (0.272) (0.182) (0.351)
ln(Books Printed 1500) -0.001 0.006 0.029∗ 0.162∗∗ -0.040 0.020(0.020) (0.025) (0.017) (0.065) (0.040) (0.067)
R2 0.12 0.36 0.36 0.27 0.17 0.55 0.53 0.31Observations 193 193 193 193 148 56 45 39
PANEL B: Only cities with positive subscriptionslnSubDens 0.090 0.139∗∗∗ 0.117∗∗ 0.086∗ -0.069 -0.061 0.018 0.175
(0.063) (0.048) (0.045) (0.044) (0.053) (0.129) (0.094) (0.213)
Controls X X X X X X X XR2 0.08 0.46 0.48 0.38 0.32 0.64 0.64 0.30Observations 85 85 85 85 76 44 36 32
Notes: All regressions are run at the city level and are weighted (except for Column 4) by initial population of therespective period. The dependent variable in the different columns is log city population growth over the periodindicated in the header. The main period of French industrialization is 1750-1850; city growth in earlier periods isused as a placebo. ‘Controls’ are the same as in the corresponding columns of Panel A. For details on lnSubDensand the other explanatory variables see the notes to Table 1, Section 4 and Appendix C.4. Robust standard errors inparentheses. * p<0.1, ** p<0.05, *** p<0.01.
45

Table 4: Literacy and additional controls
Dependent variable: log city growth, 1750-1850
(1) (2) (3) (4) (5) (6)
lnSubDens 0.180∗∗∗ 0.176∗∗∗ 0.176∗∗∗ 0.198∗∗∗ 0.179∗∗∗ 0.183∗∗∗
(0.040) (0.038) (0.041) (0.042) (0.040) (0.040)Literacy 1786 -0.209 -0.276∗∗ -0.208 -0.156 -0.185 -0.209
(0.142) (0.133) (0.144) (0.135) (0.144) (0.127)lnProtoIndDens 1.107∗∗∗ 1.068∗∗∗
(0.363) (0.355)lnNoblesDens 0.085 0.114
(0.135) (0.118)lnSTNBooksDens -0.025 -0.020
(0.021) (0.021)lnExecuteDens 0.037 0.032
(0.037) (0.037)ln(Pop 1750) -0.075∗ -0.067 -0.061 -0.053 -0.072 -0.029
(0.043) (0.040) (0.055) (0.041) (0.044) (0.044)Baseline Controls X X X X X XR2 0.38 0.40 0.38 0.39 0.39 0.41Observations 166 166 166 166 166 166
Notes: All regressions are run at the city level and are weighted by city population in 1750. The dependent variable islog city population growth in 1750-1850. ‘Baseline Controls’ include all variables listed in Table 1 (left panel). Fordetails on lnSubDens and the other explanatory variables see notes to Table 1, Section 4 and Appendix C.4. Robuststandard errors in parentheses (clustered at the department level). * p<0.1, ** p<0.05, *** p<0.01.
46
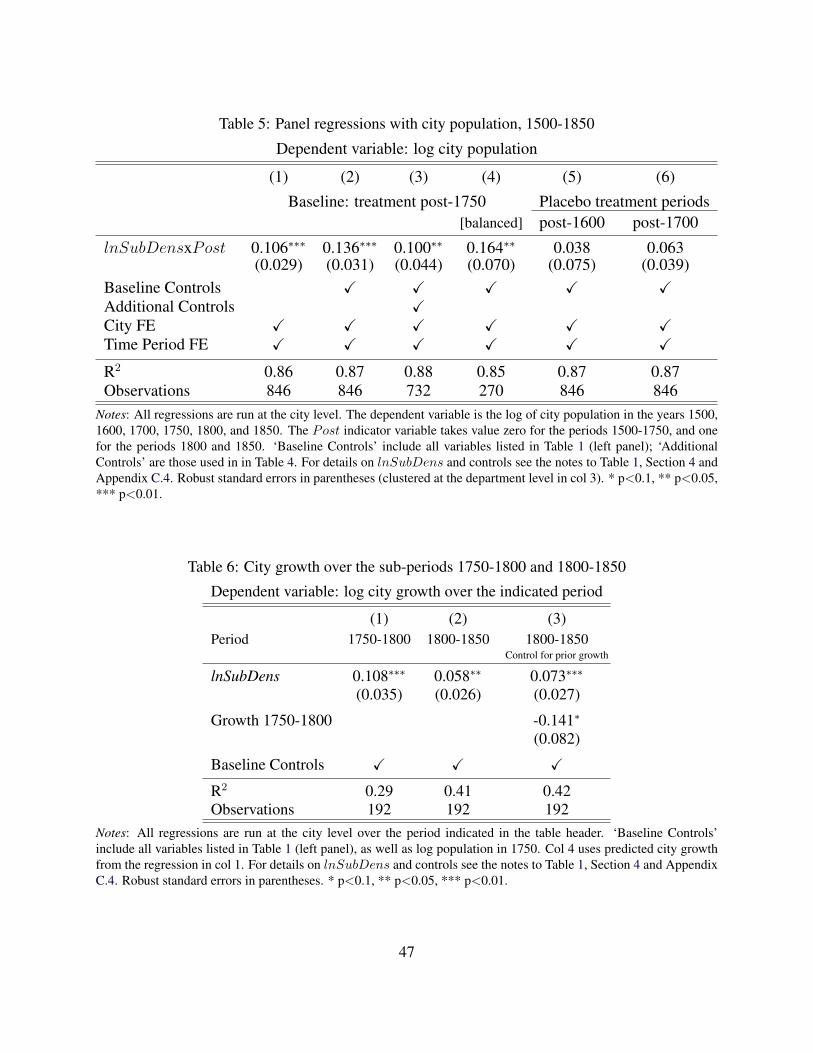
Table 5: Panel regressions with city population, 1500-1850
Dependent variable: log city population
(1) (2) (3) (4) (5) (6)
Baseline: treatment post-1750 Placebo treatment periods[balanced] post-1600 post-1700
lnSubDensxPost 0.106∗∗∗ 0.136∗∗∗ 0.100∗∗ 0.164∗∗ 0.038 0.063(0.029) (0.031) (0.044) (0.070) (0.075) (0.039)
Baseline Controls X X X X XAdditional Controls XCity FE X X X X X XTime Period FE X X X X X XR2 0.86 0.87 0.88 0.85 0.87 0.87Observations 846 846 732 270 846 846
Notes: All regressions are run at the city level. The dependent variable is the log of city population in the years 1500,1600, 1700, 1750, 1800, and 1850. The Post indicator variable takes value zero for the periods 1500-1750, and onefor the periods 1800 and 1850. ‘Baseline Controls’ include all variables listed in Table 1 (left panel); ‘AdditionalControls’ are those used in in Table 4. For details on lnSubDens and controls see the notes to Table 1, Section 4 andAppendix C.4. Robust standard errors in parentheses (clustered at the department level in col 3). * p<0.1, ** p<0.05,*** p<0.01.
Table 6: City growth over the sub-periods 1750-1800 and 1800-1850
Dependent variable: log city growth over the indicated period
(1) (2) (3)Period 1750-1800 1800-1850 1800-1850
Control for prior growth
lnSubDens 0.108∗∗∗ 0.058∗∗ 0.073∗∗∗
(0.035) (0.026) (0.027)
Growth 1750-1800 -0.141∗
(0.082)
Baseline Controls X X XR2 0.29 0.41 0.42Observations 192 192 192
Notes: All regressions are run at the city level over the period indicated in the table header. ‘Baseline Controls’include all variables listed in Table 1 (left panel), as well as log population in 1750. Col 4 uses predicted city growthfrom the regression in col 1. For details on lnSubDens and controls see the notes to Table 1, Section 4 and AppendixC.4. Robust standard errors in parentheses. * p<0.1, ** p<0.05, *** p<0.01.
47

Table 7: Scientific societies and city growth
Dependent variable: log city population
(1) (2) (3) (4) (5) (6)
1750-1850 1750-1850 1700-1750 1600-1700 1500-1600 1400-1500
PANEL A: Matching EstimationIScient.Scociety>0 0.204∗∗ 0.193∗∗ 0.028 0.167 0.195 -0.324
(0.098) (0.095) (0.083) (0.151) (0.137) (0.220)
Matching variablesPopulation X X X X X XLocation X X X X XObservations 185 175 136 58 44 41
PANEL B: OLS EstimationlnMembDens 0.171∗ 0.287∗∗∗ 0.069 0.058 0.211 -0.270
(0.088) (0.080) (0.105) (0.190) (0.179) (0.474)Baseline Controls X X X X XR2 0.10 0.32 0.19 0.56 0.53 0.32Observations 185 185 140 52 41 37
Notes: All regressions are run at the city level. The dependent variable in the different columns is log city populationgrowth over the period indicated in the header. In Panel A, all regressions are run by propensity score matching,excluding the 1% of log city growth outliers, and using the three nearest neighbors when there are more than 50observations and the two nearest neighbors otherwise. Treatment variable is the indicator IScient.Society>0, whichtakes on value 1 if a city hosted a scientific society before 1750 (see Section 4 for details). Column 1 uses citypopulation as matching variable. Columns 2–6 add geographic longitude and latitude (location) as matching variables.In Panel B, all regressions are run by OLS and are weighted by initial population of the respective period. ‘BaselineControls’ include all variables listed in Table 1 (left panel). In Column 1, only Pop 1750 is included as control. Fordetails on lnMembDens and controls see the notes to Table 1, Section 4 and Appendix C.4. Standard errors inparentheses.* p<0.1, ** p<0.05, *** p<0.01.
48

Table 8: Soldiers height before and after 1750
Dependent variable: Soldier height in cm
(1) (2) (3) (4) (5) (6)
Period 1819-1826 Pre-1750
lnSubDens 0.416∗∗∗ 0.427∗∗∗ 0.403∗∗∗ 0.423∗∗∗ 0.116 0.100(0.136) (0.139) (0.139) (0.141) (0.115) (0.111)
Literacy 2.805∗∗∗ 3.063∗∗∗ 2.463∗∗∗ 2.858∗∗∗ 1.043∗ 1.033∗
(0.398) (0.363) (0.459) (0.393) (0.525) (0.571)Height pre-1750 0.303 0.170
(0.193) (0.147)Baseline Controls X X XR2 0.42 0.60 0.46 0.61 0.06 0.16Observations 77 77 77 77 74 74
Notes: All regressions are run at the French department level and include a dummy for Paris (Department Seine). Thedependent variable in cols 1-4 is soldier height as reported by Aron et al. (1972). In Columns 5-6, the dependentvariable is average soldier height recorded over the period 1716-49 and collected by Komlos (2005). To account forvariation in height and soldier age within this period, we control for age, age squared, and birth decade (see AppendixC.3 for detail). We exclude departments with data for less than 20 soldiers (Table A.9 reports results when usingall departments and weighting by the number of soldiers). ‘Baseline Controls’ include all variables listed in Table 1(left panel); we use Literacy in 1786 in Colums 1-4 and Literacy in 1686 in Columns 5-6. For details on lnSubDens,Literacy and controls see the notes to Table 1, Section 4 and Appendix C.4. Original city-level variables are aggregatedto the department level as described in Appendix C.5. Robust standard errors in parentheses. * p<0.1, ** p<0.05, ***p<0.01.
49
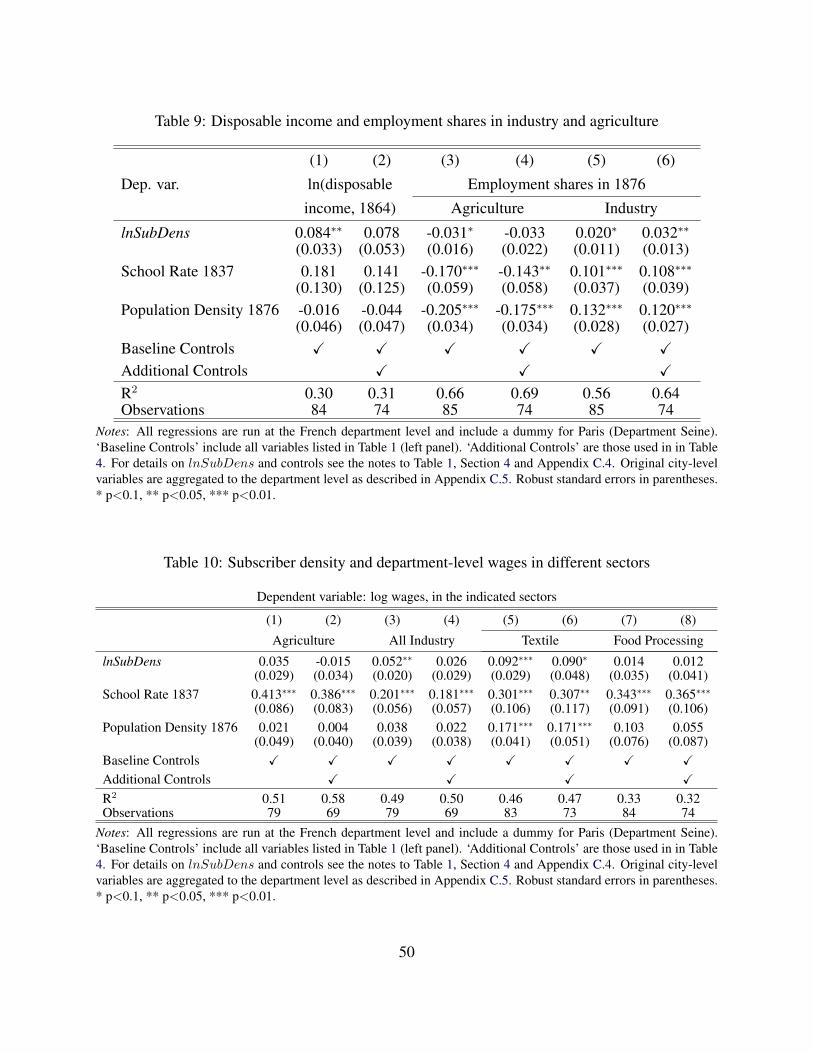
Table 9: Disposable income and employment shares in industry and agriculture
(1) (2) (3) (4) (5) (6)
Dep. var. ln(disposable Employment shares in 1876
income, 1864) Agriculture Industry
lnSubDens 0.084∗∗ 0.078 -0.031∗ -0.033 0.020∗ 0.032∗∗
(0.033) (0.053) (0.016) (0.022) (0.011) (0.013)School Rate 1837 0.181 0.141 -0.170∗∗∗ -0.143∗∗ 0.101∗∗∗ 0.108∗∗∗
(0.130) (0.125) (0.059) (0.058) (0.037) (0.039)Population Density 1876 -0.016 -0.044 -0.205∗∗∗ -0.175∗∗∗ 0.132∗∗∗ 0.120∗∗∗
(0.046) (0.047) (0.034) (0.034) (0.028) (0.027)Baseline Controls X X X X X XAdditional Controls X X XR2 0.30 0.31 0.66 0.69 0.56 0.64Observations 84 74 85 74 85 74
Notes: All regressions are run at the French department level and include a dummy for Paris (Department Seine).‘Baseline Controls’ include all variables listed in Table 1 (left panel). ‘Additional Controls’ are those used in in Table4. For details on lnSubDens and controls see the notes to Table 1, Section 4 and Appendix C.4. Original city-levelvariables are aggregated to the department level as described in Appendix C.5. Robust standard errors in parentheses.* p<0.1, ** p<0.05, *** p<0.01.
Table 10: Subscriber density and department-level wages in different sectors
Dependent variable: log wages, in the indicated sectors
(1) (2) (3) (4) (5) (6) (7) (8)
Agriculture All Industry Textile Food Processing
lnSubDens 0.035 -0.015 0.052∗∗ 0.026 0.092∗∗∗ 0.090∗ 0.014 0.012(0.029) (0.034) (0.020) (0.029) (0.029) (0.048) (0.035) (0.041)
School Rate 1837 0.413∗∗∗ 0.386∗∗∗ 0.201∗∗∗ 0.181∗∗∗ 0.301∗∗∗ 0.307∗∗ 0.343∗∗∗ 0.365∗∗∗
(0.086) (0.083) (0.056) (0.057) (0.106) (0.117) (0.091) (0.106)Population Density 1876 0.021 0.004 0.038 0.022 0.171∗∗∗ 0.171∗∗∗ 0.103 0.055
(0.049) (0.040) (0.039) (0.038) (0.041) (0.051) (0.076) (0.087)Baseline Controls X X X X X X X XAdditional Controls X X X XR2 0.51 0.58 0.49 0.50 0.46 0.47 0.33 0.32Observations 79 69 79 69 83 73 84 74
Notes: All regressions are run at the French department level and include a dummy for Paris (Department Seine).‘Baseline Controls’ include all variables listed in Table 1 (left panel). ‘Additional Controls’ are those used in in Table4. For details on lnSubDens and controls see the notes to Table 1, Section 4 and Appendix C.4. Original city-levelvariables are aggregated to the department level as described in Appendix C.5. Robust standard errors in parentheses.* p<0.1, ** p<0.05, *** p<0.01.
50

Table 11: Subscriber density and average local firm productivity in 1837
Dep. Var.: log wages (arrondissement average, for firms in ‘modern’ and ‘old’ sectors)
(1) (2) (3) (4) (5) (6) (7) (8)
Sector modern old modern old modern old modern old
lnSubDens 0.097∗∗∗ 0.032∗∗ 0.073∗∗∗ 0.025 0.068∗∗∗ 0.020 0.064∗∗∗ 0.018(0.013) (0.013) (0.019) (0.017) (0.019) (0.018) (0.019) (0.018)
School Rate 1837 0.252∗∗∗ 0.238∗∗∗ 0.249∗∗∗ 0.259∗∗∗ 0.270∗∗∗ 0.219∗∗∗ 0.259∗∗∗ 0.202∗∗∗
(0.076) (0.066) (0.073) (0.069) (0.093) (0.066) (0.085) (0.069)Size and Pop. Controls X X X X X X X XBaseline Controls X X X X X XAdditional Controls X X X XSector FE X XR2 0.22 0.22 0.28 0.28 0.30 0.29 0.43 0.32Observations 633 794 428 541 392 501 392 501
Notes: All regressions are run at the French arrondissement level and include a dummy for Paris (Department Seine).The dependent variable is the log of average male wages across all firms in a sector j in arrondissement n (see SectionC.10 for detail). ‘Baseline Controls’ include all variables listed in Table 1 (left panel). ‘Additional Controls’ are thoseused in in Table 4. For details on lnSubDens and controls see the notes to Table 1, Section 4 and Appendix C.4.Original city-level variables are aggregated to the arrondissement level as described in Appendix C.5. Standard errors(clustered at the department level) in parentheses. * p<0.1, ** p<0.05, *** p<0.01.
51

Table 12: Subscriber density and firm productivity within individual industries
(1) (2) (3) (4) (5)
Sector Name Sector Coefficient R2 Engines per 1,000type lnSubDens Obs. Steam Others
Transportation Equipment modern 0.114∗∗∗ 0.63 2 9(0.026) 39
Printing Technology, and modern 0.103∗∗∗ 0.20 1 27Scientific Instruments (0.021) 221
Textile and Clothing modern 0.067∗∗∗ 0.28 3 11(0.018) 298
Furniture and Lighting modern 0.056∗ 0.54 13 14(0.033) 75
Metal and Metal Products old 0.042∗ 0.16 6 36(0.024) 273
Leather old 0.041∗ 0.19 3 72(0.022) 165
Mining old 0.038∗∗ 0.31 3 19(0.018) 188
Ceramics and Glass old 0.003 0.27 4 16(0.020) 168
Notes: For each sector, column 1 specifies whether the sector belongs to the ‘modern’ or ‘old’ manufacturing classifi-cation (see Section 5.3 for detail). Sectors are ranked by the size of the coefficient of lnSubDens, reported in column2 – where the dependent variable is the logarithm of male wages at the arrondissement level. For each regression,column 3 reports the R2 and the number of observations. In all regressions, we control for ‘Size and Pop. Controls’,as in Table 11 (cols 1-2). For details on lnSubDens, and controls see the notes to Table 1, Section 4, and AppendixC.4 and C.10. Standard errors (clustered at the department level) in parentheses. * p<0.1, ** p<0.05, *** p<0.01.Columns 4-5 show the average number of steam engine and of other engines per 1,000 workers (see Appendix C.10for detail).
52