Embed Size (px)
Citation preview

FRACTAL SHALLOW BED IEX DECOLORIZATIONFOR CANE RAW SUGAR REFINING, LIQUID SUGAR AND FRUIT JUICE APPLICATIONS
REFINERY RUN-OFF DECOLORIZATION BY SMB CHROMATOGRAPHY
GMBH
escon_isj_title_198x198_210414_print_X1a.indd 1 21.04.15 22:44
focus: CLARIFICATION, CRYSTAL GROWTH MONITORING, CANE VARIETAL IMPACT ON MILLING CAPACITY
May 2015 Volume CXVII Issue No. 1397
Join ISJ in our Global Sugar Network
sugar processing and refining > power and cogeneration > biorenewables > agricultural production
www.internationalsugarjournal.com
JOURNAL
INTERNATIONALsugar

302 International Sugar Journal | May 2015
FIVES_CAIL_PUBLI_ISJ_210X297_23_04_VECT.indd 1 23/04/2015 12:55
303www.internationalsugarjournal.com
Exploitation of child labour in cane industry must stop
Editorial Comment
Elizabeth Abbot’s “bittersweet history” of sugar is a compelling read1. The section on "slave-sugar complex” is a testimony of crimes against humanity that history witnesses time and time again. For some two centuries (17th to 19th), when “sugar was to the geopolitics…what oil has been to the 20th and 21st”2, the sheer brutality rained on slaves by their masters as they exploited them to the hilt should always be a reminder to those work
in the industry of the relative progress made, for at least some who work in it. The lot of the indentured Indian and Chinese labourers following abolition of slavery fared little better as they got sucked into a “new system of slavery”. In many sugar industries of the world today, particularly in SE Asia and Central America, where cane production continues to be labour-intensive, throes of the past, where “the egregious exploitation of sugar labourers” are indicative reflection of “management techniques developed in slave times – including the use of disempowered migrant, bonded and child labour – to keep costs down and profits up.”3
What is particularly disquieting, that well into the 21st century, is to see children working in cane fields. This is clearly a modern phenomena. In a seminal paper by Schwarzbach and Richardson4, the authors cite a list of countries by the US Department of Labour “in which it believes sugarcane is produced using child labour. In 2013, this list included Belize, Bolivia, Burma, Colombia, the Dominican Republic, El Salvador, Guatemala, Kenya, Mexico, Panama, Paraguay, the Philippines, Thailand, and Uganda. Based on publicly available studies commissioned by The Coca-Cola Company, as well a cursory search of reports by non-governmental organizations (NGOs) and newspapers, Cambodia, Costa Rica, Honduras, Fiji, India, Nicaragua, Nepal, and Pakistan can also be added to that list.”
Schwarzbach and Richardson painstakingly note that the abuse of children in cane production comprises three types:• Hazardous work – this includes cane harvesting where the risk of “muscular-skeletal damage” is immense and spraying
pesticides and herbicides exposing them to “risk of cancer and neurological damage”• Harmful adult work – “harm caused to children as a direct result” of their parents having to migrate to work, or children taken
with their parents, where in addition to joining them to work in cane fields, also find themselves living in camps where conditions are “inhuman”
• Exploitative work – where children are “under paid” for the work they do which is similar to adults.Many of the 23 countries listed earlier are signatories to the Convention of the Rights of the Child. But indeed how many in fact
pay heed to them let alone ensure these are adhered to? In the sugar world, Brazil has commendably been both proactive and progressive in addressing the needs and rights of
children. Through, the Programa de Erradicacao do Trabalho Infantil (PETI) children are helped into mainstream education through two public policy interventions. “The first created the Jornada Ampliada, an after-school programme to complement regular school hours. The second provided a subsidy called a bolsa to poor households whose children attended the after-school programme at least 80% of the time.” This was bolstered in 1995 by the creation of The Programa Empresa Amiga da Criança (PEAC), which translates as the Child Friendly Company Programme. PEAC is funded by the Brazilian Abrinq Foundation that runs a variety of programmes designed to support children’s rights. Further, in 1996, the Brazilian sugarcane industry signed the Pacto dos Bandeirantes for the eradication of child labour in the sector. By 2007, it had awarded seventy-six companies in the sugarcane industry with the Child Friendly Company label.
My first serious job over 30 years ago was lecturing at the College of Education in Sokoto, Nigeria. Twice a year, I visited primary schools in Sokoto State to invigilate my students teaching children. It was a splendid privilege to note that these young, fresh minds were as curious to learn about their world as their counterparts all over the globe, unencumbered as they were by the burden of other pressing distractions. Alas, in more than few corners of the sugar industry some children are denied this basic right as they toil away in cane fields. It is simply unacceptable that this happens. Those who consider that only their children are precious and deny other people’s children their basic rights must be taken to task. The sugar industry, its leaders, the companies that support it can no longer, and must not, sit idly by. Arvind ChudasamaReferences 1 Elizabeth Abbott (2010) Sugar: A bittersweet history (Overlook, 453pp)2 Andrea Stuart (2010) Review of Sugar: A bittersweet history http://www.independent.co.uk/arts-entertainment/books/reviews/sugar-a-bittersweet-history-by-elizabeth-abbott-1854583.html3 Ben Richardson (2015) Still slaving over sugar. https://www.opendemocracy.net/beyondslavery/ben-richardson/still-slaving-over-sugar4 Natasha Schwarzbach and Ben Richardson (2014) A bitter harvest: Child labour in sugarcane agriculture and the role of certification systems. UC Davis Journal of International Law and Policy, 21 (1): 99-128.
International Sugar JournalChristchurch Court, 10-15 Newgate Street, London EC1A 7AZ, UK.
Editorial:Editor: Arvind Chudasama MSc., MAgSt. (Qld), MCLIP Email: [email protected]
Design and production: Snehal Sanghani
Display and online advertising:Business Development Manager: Stuart VeldenDirect: +44 (0)20 7017 7559Email: [email protected]
Marketing and circulation:Marketing Manager: Toby WebbEmail: [email protected] Subscriptions:Phone: +44 (0)20 7017 5540Email: [email protected]
www.internationalsugarjournal.com
All technical articles have been approved by our panel of distinguished referees. Other editorial material, including abstracts, appear at the discretion of the Editor.
ISSN 0020-8841
International Sugar Journal is published monthly by Informa UK Ltd.
© 2013 Informa UK Ltd. Conditions of sale: 1. All rights reserved, no part of this publication may be reproduced, stored in a retrieval system, or transmitted in any form or by any means, electronic, mechanical, photocopying, recording, or otherwise without prior written permission of the Publisher. Photocopying Licence: Informa UK Ltd. does not participate in a copying agreement with any Copyright Licensing Agency. Photocopying without permission is illegal. Contact the Marketing Department to obtain a photocopying license. 2. All abstracting of the content for republication and sale must have prior permission from the Publisher. 3. The publication must not be circulated outside the staff who work at the address to which it is sent, without prior agreement with the Publisher.
sugarJOURNALwww.internationalsugarjournal.com
INTERNATIONAL
International Sugar Journal | April 2015304
Panel of Referees
G W Ascough CEng MIAgrE, Agricultural and Irrigation Engineer, Booker Tate Ltd, UK
L. Jean Claude Autrey PhD, DSc, CBiol, FIBiol, Former Director,
Mauritius Sugar Industry Research Institute, Mauritius.
Sanjay Awasthi MSc Business Head, Isgec Heavy Engineering Ltd., India
L.S.M. Bento BSc, PhD, Formerly Audubon Sugar Institute, USA.
J.C. Comstock PhD, Research Leader, USDA-ARS-SAA, Canal Point, Florida, USA.
S. Davis MSc, Head: Processing Division, Sugar Milling Research Institute,
South Africa.
D. Day PhD, Audubon Sugar Institute, USA.
S.J. Edmé PhD, Research Geneticist, USDA-ARS Sugarcane Field Station,
Florida, USA.
G. Eggleston PhD, Lead Scientist, SRRC-ARS-USDA, USA.
C. Garson MEngSc, BE (Mech), Bundaberg Walkers Engineering Ltd, Australia.
M.A. Godshall BSc, MSc, Formerly Managing Director, SPRI, USA.
D.K. Goel BEng (Mech), Executive Vice President, ISGEC John Thompson, India.
Tere Pi Grace BS, MS, Chief Chemist and Manager of Quality Control,
Sugarcane Growers Cooperative of Florida, USA.
M. Inkson CEng, PhD, MIChemE, FEI Director, Sugar Knowledge International, UK.
P. Jackson PhD, CSIRO Plant Industry, Australia.
G.L. James PhD, DIC, CBiol, FIBiol, Retired Technical Adviser - Agronomy.
L. Jolly BAgricEcon(Hons), Senior Economist, International Sugar Organisation, UK.
J. Joyce BEChem, MBA, Sugar Process Consultant,
James Joyce & Associates, Australia.
C.A. Kimbeng PhD, Asst Prof, Dept of Agronomy and Environmental
Management, Louisiana State University, USA.
M. Krishnamurthi PhD, Chief Executive, Sadhana Agritech Services and
Consultancies Private Ltd, Bangalore, India.
V. Kochergin PhD, PE Amalgamated Research LLC, USA.
G.W. Leslie MSc, Entomologist, SASRI, South Africa.
J.A. Mariotti PhD, former Director, Tucumán Experiment Station, Argentina.
B. Muir PhD, British Sugar, UK.
H.A. Naqvi MSc, Technical Consultant, Sanghar Sugar Mills Ltd, Sanghar, Pakistan.
D. Nixon PhD, Agriculturist, Booker Tate Ltd, UK.
Y-B. Pan PhD, Research Plant Molecular Geneticist, Houma, Louisiana, USA.
C. Rhoten BSc, Director of Systems Integration and Optimization, ESCON
America Inc
M. Saska PhD, Investigador Visitante, EEAOC-Tucuman-Argentina.
G. Shannon BAppSc, Extension Leader - North BSES Limited, Qld, Australia.
F.M. Steele PhD, Assistant Professor of Food Microbiology,
Brigham Young University, USA.
P. Stevanato PhD, University of Padova, Italy.
M. Suhr CEng, BS President, MS Processes Intl, LLC, USA.
LM Talwar BSc Executive Director, Isgec Heavy Engineering Ltd., India.
J. Torres PhD, Director Agronomy Program, CENICANA, Colombia.
W. Weiss Manager, Sugars International, USA.
A. Wienese MScEng(Mech), Consultant, ‘Sugarwise’.
M.S. Wright PhD Research Microbiologist, USDA-ARS-SRRC, USA.
S. Zhang PhD, Institute of Tropical Bioscience and Biotechnology,
Chinese Academy of Tropical Agricultural Sciences (CATAS), China.
305www.internationalsugarjournal.com
ContentsMay 2015 Volume CXVII Issue No. 1397
Regular Items
Editorial Comment
Monthly Snapshot May Sugar Industry News People & Places
The Blackboard Entrainment – Sampling & Analysis
Biofuels News
Biobased Products News
Trends in Science Technology Meetings calendar
Advertisers' Index
303
306 307 318
320
322
326
329
378
378
focus: CLARIFICATION, CRYSTAL GROWTH MONITORING, CANE VARIETAL IMPACT ON MILLING CAPACITY
FRACTAL SHALLOW BED IEX DECOLORIZATION
FOR CANE RAW SUGAR REFINING, LIQUID SUGAR AND FRUIT JUICE APPLICATIONS
REFINERY RUN-OFF DECOLORIZATION BY SMB CHROMATOGRAPHY
GMBH
escon_isj_title_198x198_210414_print_X1a.indd 1
21.04.15 22:44
focus: CLARIFICATION, CRYSTAL GROWTH MONITORING, CANE VARIETAL IMPACT ON MILLING CAPACITY
May 2015
Volume CXVII Issue No. 1397
Join ISJ in our
Global Sugar Network
sugar processing and refining > power and cogeneration > biorenewables > agricultural production
www.internationalsugarjournal.com JOURNAL
INTERNATIONAL
sugar
International Sugar Journal
Direct clear juice – the production of clear juice in a sugarcane diffuser at Maidstone factory PS Jensen, SB Davis, DJ Love and A Rassol
Addressing factory needs in cane variety selection GA Kent, R Parfitt and A Jensen Further progress on crystal growth on-line monitoringC. Bouché and B. Gaillac
Effects of different types of storage and size reduction on biomethane potential of sugarbeets Samriddhi Buxy and Pratap Pullammanappallil
A retrospective analysis of genetic advance in natural ripening of sugarcane David M. Burner, Benjamin L. Legendre, Deborah
L. Boykin, and Michael J. Duet, Jr.
332
346
354
362
370
306 International Sugar Journal | May 2015
Monthly Snapshot
May
Market Overview
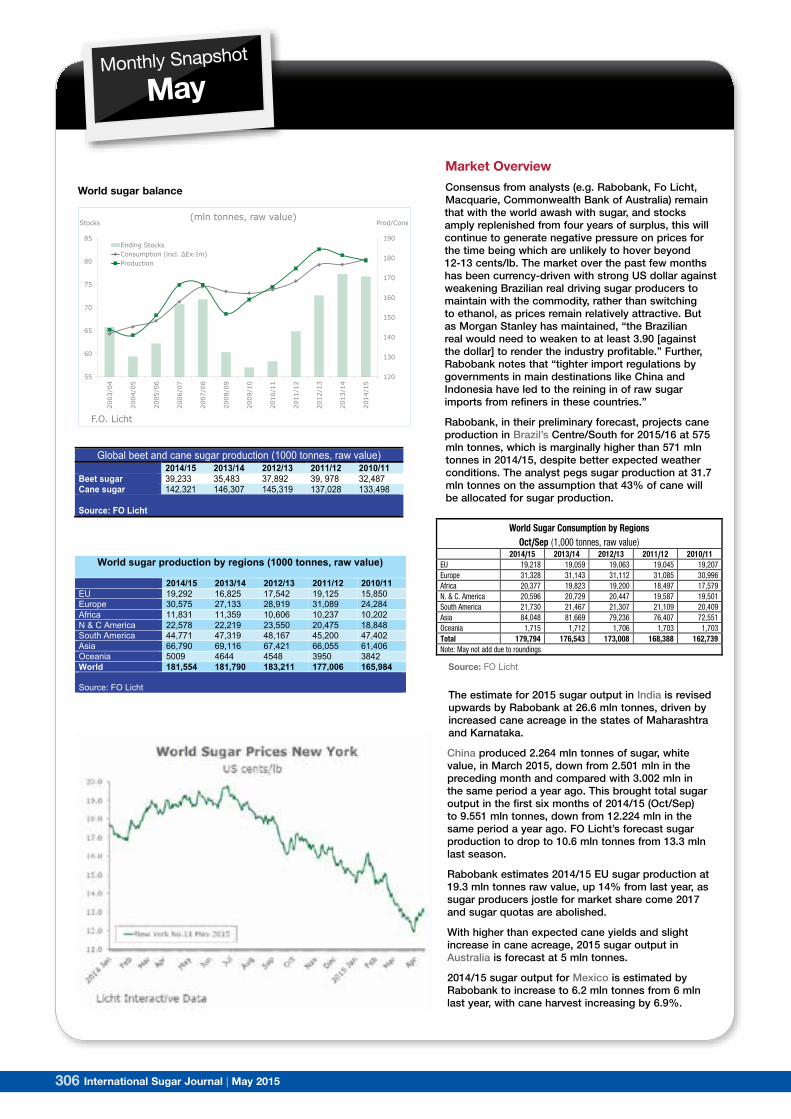
Consensus from analysts (e.g. Rabobank, Fo Licht, Macquarie, Commonwealth Bank of Australia) remain that with the world awash with sugar, and stocks amply replenished from four years of surplus, this will continue to generate negative pressure on prices for the time being which are unlikely to hover beyond 12-13 cents/lb. The market over the past few months has been currency-driven with strong US dollar against weakening Brazilian real driving sugar producers to maintain with the commodity, rather than switching to ethanol, as prices remain relatively attractive. But as Morgan Stanley has maintained, “the Brazilian real would need to weaken to at least 3.90 [against the dollar] to render the industry profitable.” Further, Rabobank notes that “tighter import regulations by governments in main destinations like China and Indonesia have led to the reining in of raw sugar imports from refiners in these countries.”
Rabobank, in their preliminary forecast, projects cane production in Brazil’s Centre/South for 2015/16 at 575 mln tonnes, which is marginally higher than 571 mln tonnes in 2014/15, despite better expected weather conditions. The analyst pegs sugar production at 31.7 mln tonnes on the assumption that 43% of cane will be allocated for sugar production.
The estimate for 2015 sugar output in India is revised upwards by Rabobank at 26.6 mln tonnes, driven by increased cane acreage in the states of Maharashtra and Karnataka.
China produced 2.264 mln tonnes of sugar, white value, in March 2015, down from 2.501 mln in the preceding month and compared with 3.002 mln in the same period a year ago. This brought total sugar output in the first six months of 2014/15 (Oct/Sep) to 9.551 mln tonnes, down from 12.224 mln in the same period a year ago. FO Licht’s forecast sugar production to drop to 10.6 mln tonnes from 13.3 mln last season.
Rabobank estimates 2014/15 EU sugar production at 19.3 mln tonnes raw value, up 14% from last year, as sugar producers jostle for market share come 2017 and sugar quotas are abolished.
With higher than expected cane yields and slight increase in cane acreage, 2015 sugar output in Australia is forecast at 5 mln tonnes.
2014/15 sugar output for Mexico is estimated by Rabobank to increase to 6.2 mln tonnes from 6 mln last year, with cane harvest increasing by 6.9%.
Monthly Snapshot February ‘15
Global sugar stock change
Source: Czarnikow
World production estimates of cane and beet
120
130
140
150
160
170
180
190
55
60
65
70
75
80
85
2003
/04
2004
/05
2005
/06
2006
/07
2007
/08
2008
/09
2009
/10
2010
/11
2011
/12
2012
/13
2013
/14
2014
/15
Ending StocksConsumption (incl. ΔEx-Im)Production
Stocks Prod/Cons
World Sugar Balance(mln tonnes, raw value)
F.O. Licht
World sugar balance
F.O.Licht's International Sugar and Sweetener Report
92 2015 F.O.Licht GmbH Vol. 147, No. 6 / 17.02.2015
mln tonnes in 2014/15 from 40.2 mln the year before, which is 1.2 tonnes above our October guidance and the highest level since 44.3 mln tonnes were produced by this group in 1999/00. In contrast, sugar output in developing countries is forecast to fall by 5.5 mln tonnes to 136.1 mln – 0.3 mln less than projected in October and largely reflecting the projected sharp drop in Brazil.
Sugar production in importing countries is expected to remain unchanged at 87.9 mln tonnes, while sugar production in exporting countries is seen falling to 91.7 mln tonnes from last year's 93.9 mln.
World sugar consumption
The level of world sugar consumption is one of the most important determinants for world sugar trade, which in the end will determine the course of market prices. The growth rate of consumption has gone down since the 1950s from an average of 5.2% to less than 2% as of late. There are numerous reasons for the decline. One major reason is the declining income elasticities of demand at higher levels of consumption, particularly in the advanced industrialised countries, which means rising per capita incomes no longer have much positive effect on sugar consumption. Another reason is the appearance of alternative sweeteners, like HFCS and aspartame, which impinge on sugar consumption, again especially in the industrialised countries. An additional factor is the slow population growth rate of the developed part of the world. Also on the negative side are changes in consumer preferences, as for example sugar-free carbonated and fruit drinks enjoy growing
popularity; and health worries about excessive sugar consumption in countries with high per capita incomes. Offtake suffered another setback in the early 1990s after the collapse of communism in eastern Europe which led to a fall in per capita incomes and higher domestic prices as consumer subsidies were phased out. Then came the financial meltdown in Asia and the near collapse of the Russian economy. Economic problems also emerged in Latin America and in some other developing countries at the time. All this reduced the annual increase rate to 1% during those years.
But the growth rate returned to between 2% and 3% in the early 2000s as the decline in eastern Europe came to a halt and demand in developing countries forged ahead. These countries have higher population growth rates and higher income elasticities, which favours consumption in a growing economy. Also, the almost steady increase in domestically produced sugar in
developing countries, which now account for 76% of world sugar production, was a positive factor as demand in many of these countries is dependent on indigenous production.
Still, the current glut is not only a question of oversupply but also of subdued demand growth in recent years due to a stumbling world economy. Specifically, the International Monetary Fund reduced its economic growth expectations for both 2015 and 2016 in its January World Economic Outlook (WEO) relative to the October 2014 projections, while leaving the estimate for growth in 2014 at 3.3%. The IMF now sees world economic growth in 2015 at 3.5% and 3.7% the following year, which both represents a reduction by 0.3 percentage points from the October outlook. The revisions reflect a reassessment of prospects in China, Russia, the euro area, and Japan as well as weaker activity in some major oil exporters because of the sharp drop in oil prices. The United States is the only major economy for which growth projections have been raised. Global growth will receive a boost from lower oil prices, but this boost is projected to be more than offset by negative factors, including investment weakness as adjustment to diminished expectations about medium-term growth continues in many advanced and emerging market economies.
In emerging market and developing
World Sugar Consumption by Regions Oct/Sep (1,000 tonnes, raw value)
2014/15 2013/14 2012/13 2011/12 2010/11 EU 19,218 19,059 19,063 19,045 19,207 Europe 31,328 31,143 31,112 31,085 30,996 Africa 20,377 19,823 19,200 18,497 17,579 N. & C. America 20,596 20,729 20,447 19,587 19,501 South America 21,730 21,467 21,307 21,109 20,409 Asia 84,048 81,669 79,236 76,407 72,551 Oceania 1,715 1,712 1,706 1,703 1,703 Total 179,794 176,543 173,008 168,388 162,739 Note: May not add due to roundings
0
20
40
60
80
100
120
140Industrialised Countries Developing Countries
World Sugar Consumption(mln tonnes, raw value)
F.O. Licht
Source: FO Licht
Monthly Snapshot April ‘15
Global beet and cane sugar production (1000 tonnes, raw value) 2014/15 2013/14 2012/13 2011/12 2010/11 Beet sugar 39,233 35,483 37,892 39, 978 32,487 Cane sugar 142,321 146,307 145,319 137,028 133,498 Source: FO Licht
World sugar production by regions (1000 tonnes, raw value)
2014/15 2013/14 2012/13 2011/12 2010/11 EU 19,292 16,825 17,542 19,125 15,850 Europe 30,575 27,133 28,919 31,089 24,284 Africa 11,831 11,359 10,606 10,237 10,202 N & C America 22,578 22,219 23,550 20,475 18,848 South America 44,771 47,319 48,167 45,200 47,402 Asia 66,790 69,116 67,421 66,055 61,406 Oceania 5009 4644 4548 3950 3842 World 181,554 181,790 183,211 177,006 165,984 Source: FO Licht
120
130
140
150
160
170
180
190
55
60
65
70
75
80
85
2003/0
4
2004/0
5
2005/0
6
2006/0
7
2007/0
8
2008/0
9
2009/1
0
2010/1
1
2011/1
2
2012/1
3
2013/1
4
2014/1
5
Ending StocksConsumption (incl. Ex-Im)Production
Stocks Prod/Cons
World Sugar Balance(mln tonnes, raw value)
F.O. Licht
C
M
Y
CM
MY
CY
CMY
K
C
M
Y
CM
MY
CY
CMY
K
Monthly Snapshot April ‘15
Global beet and cane sugar production (1000 tonnes, raw value) 2014/15 2013/14 2012/13 2011/12 2010/11 Beet sugar 39,233 35,483 37,892 39, 978 32,487 Cane sugar 142,321 146,307 145,319 137,028 133,498 Source: FO Licht
World sugar production by regions (1000 tonnes, raw value)
2014/15 2013/14 2012/13 2011/12 2010/11 EU 19,292 16,825 17,542 19,125 15,850 Europe 30,575 27,133 28,919 31,089 24,284 Africa 11,831 11,359 10,606 10,237 10,202 N & C America 22,578 22,219 23,550 20,475 18,848 South America 44,771 47,319 48,167 45,200 47,402 Asia 66,790 69,116 67,421 66,055 61,406 Oceania 5009 4644 4548 3950 3842 World 181,554 181,790 183,211 177,006 165,984 Source: FO Licht
120
130
140
150
160
170
180
190
55
60
65
70
75
80
85
2003
/04
2004
/05
2005
/06
2006
/07
2007
/08
2008
/09
2009
/10
2010
/11
2011
/12
2012
/13
2013
/14
2014
/15
Ending StocksConsumption (incl. Ex-Im)Production
Stocks Prod/Cons
World Sugar Balance(mln tonnes, raw value)
F.O. Licht
C
M
Y
CM
MY
CY
CMY
K
C
M
Y
CM
MY
CY
CMY
K
Source: FO Licht
Source: FO Licht
307www.internationalsugarjournal.com
Sugar Industry News
For the latest sugar industry news visit www.internationalsugarjournal.com
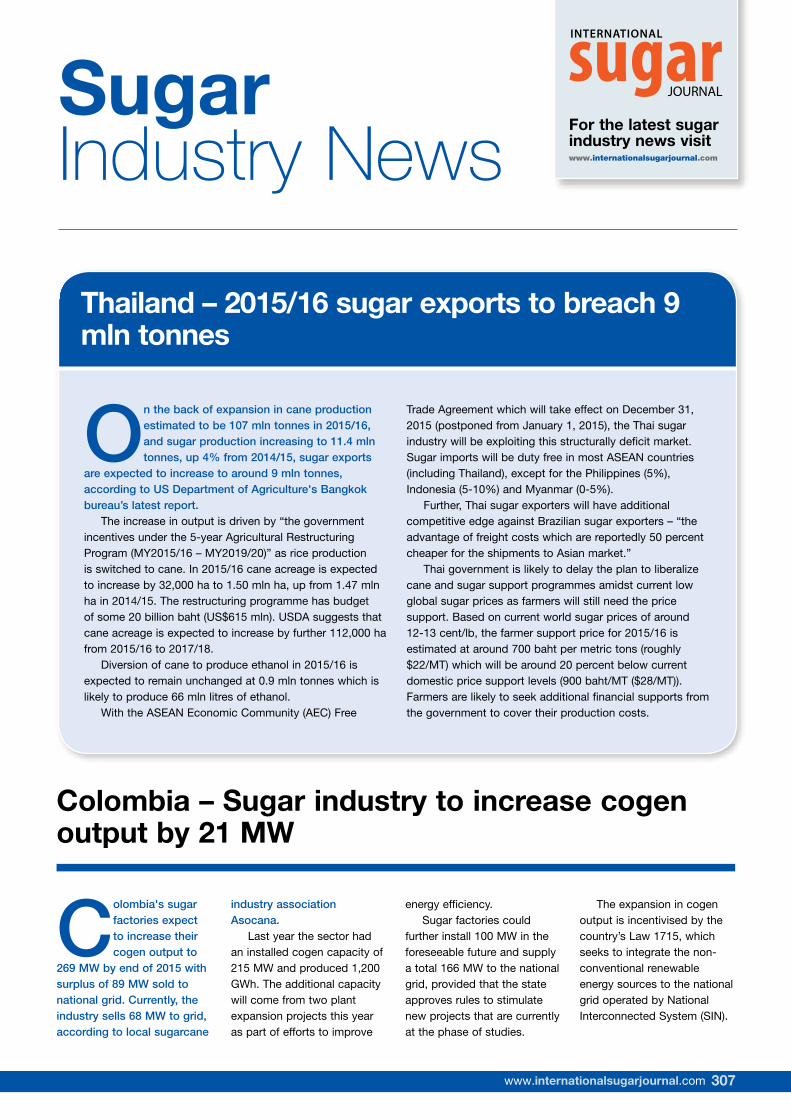
Thailand – 2015/16 sugar exports to breach 9 mln tonnes
On the back of expansion in cane production estimated to be 107 mln tonnes in 2015/16, and sugar production increasing to 11.4 mln tonnes, up 4% from 2014/15, sugar exports
are expected to increase to around 9 mln tonnes, according to US Department of Agriculture's Bangkok bureau’s latest report.
The increase in output is driven by “the government incentives under the 5-year Agricultural Restructuring Program (MY2015/16 – MY2019/20)” as rice production is switched to cane. In 2015/16 cane acreage is expected to increase by 32,000 ha to 1.50 mln ha, up from 1.47 mln ha in 2014/15. The restructuring programme has budget of some 20 billion baht (US$615 mln). USDA suggests that cane acreage is expected to increase by further 112,000 ha from 2015/16 to 2017/18.
Diversion of cane to produce ethanol in 2015/16 is expected to remain unchanged at 0.9 mln tonnes which is likely to produce 66 mln litres of ethanol.
With the ASEAN Economic Community (AEC) Free
Trade Agreement which will take effect on December 31, 2015 (postponed from January 1, 2015), the Thai sugar industry will be exploiting this structurally deficit market. Sugar imports will be duty free in most ASEAN countries (including Thailand), except for the Philippines (5%), Indonesia (5-10%) and Myanmar (0-5%).
Further, Thai sugar exporters will have additional competitive edge against Brazilian sugar exporters – “the advantage of freight costs which are reportedly 50 percent cheaper for the shipments to Asian market.”
Thai government is likely to delay the plan to liberalize cane and sugar support programmes amidst current low global sugar prices as farmers will still need the price support. Based on current world sugar prices of around 12-13 cent/lb, the farmer support price for 2015/16 is estimated at around 700 baht per metric tons (roughly $22/MT) which will be around 20 percent below current domestic price support levels (900 baht/MT ($28/MT)). Farmers are likely to seek additional financial supports from the government to cover their production costs.
JOURNAL
INTERNATIONALsugar
Colombia – Sugar industry to increase cogen output by 21 MW
Colombia's sugar factories expect to increase their cogen output to
269 MW by end of 2015 with surplus of 89 MW sold to national grid. Currently, the industry sells 68 MW to grid, according to local sugarcane
industry association Asocana.
Last year the sector had an installed cogen capacity of 215 MW and produced 1,200 GWh. The additional capacity will come from two plant expansion projects this year as part of efforts to improve
energy efficiency.Sugar factories could
further install 100 MW in the foreseeable future and supply a total 166 MW to the national grid, provided that the state approves rules to stimulate new projects that are currently at the phase of studies.
The expansion in cogen output is incentivised by the country’s Law 1715, which seeks to integrate the non-conventional renewable energy sources to the national grid operated by National Interconnected System (SIN).

308 International Sugar Journal | May 2015
Sugar Industry News
Indonesia - Indofood Agri and Tunas Baru plans to build new sugar mills
Singapore-listed plantation firm Indofood Agri Resources Ltd is
considering investing at least US$150 million to build a new sugar mill in Indonesia, according to its chief executive, reports Reuters.
Indofood Agri and other companies such as PT Tunas Baru Lampung Tbk are seeking to expand their sugar processing in Indonesia which imports which imports well over 3 million tonnes raw sugar to meet local demand. According to USDA data, Indonesia produced 2.3 million tonnes sugar in 2013/14 while the
consumption was estimated to be 5.7 million tonnes.
Indofood Agri, which already has two sugar mills in Indonesia as well as businesses in palm oil and rubber, would prefer to build a new mill as there are very few opportunities for acquisitions and a lot of the existing mills need to be upgraded, noted Mark Wakeford, CEO of Indofood Agri.
Speaking to Reuters, Wakeford said "If you look at the structure of the Indonesian sugar industry, it's dominated by government-run entities as opposed to private plantation groups. There is really no M&A
opportunity in the domestic Indonesian sugar sector."
State enterprises operate 52 sugar factories in the country, contributing around 60% of national output, according to government data, although many of these facilities have been criticised for being inefficient.
A major obstacle with proposed investment according to Wakeford is finding suitable land in Indonesia for cane production.
The government is considering offering tax allowances or tax holidays to develop the sector, the industry ministry said on 5th
April, without giving details.Indofood Agri is
developing its sugar interests elsewhere in the region, too.
In February, it partnered Hong Kong-based investment company First Pacific Co Ltd to buy an additional 16.9% in Filipino sugar producer Roxas Holdings Inc, raising their stake to 50.9%.
In Indonesia, Tunas Baru is investing around $100 million to build a sugar factory and construction is expected to finish in early 2017, corporate secretary Hardy Phan told Reuters in an email.
Details of factory capacity of the proposed new build were not supplied.
European Union - ADM acquires Eaststarch in preparation for end of sugar production quotas
Archer Daniels Midland (ADM) announced an agreement to
purchase several assets of Eaststarch C.V., its 50-50 joint venture with Tate & Lyle.
Under the terms of the agreement, ADM will take full ownership of corn wet mills in Bulgaria and Turkey, and will own a 50% stake in a wet mill in Hungary. Tate & Lyle will receive a cash consideration of EUR240 mln, subject to customary closing adjustments, including for net cash and working capital, and take full ownership of the Eaststarch facility in Slovakia.
Chris Cuddy, president
of ADM’s Corn Processing business unit, referred to the coming end of sugar production quotas in the EU, which will lift the artificial cap on cereal-based sweeteners. "There will be tremendous opportunities in the new European sweetener market, including a particularly strong opening in Eastern Europe, where there is less sugar production. By acquiring a greater ownership share in these corn assets, ADM will be able to better serve its customers as they meet this expanding European demand for sweeteners. At the same time, we are improving our capabilities to meet customer
needs in the growing market for starch in Europe.”
The Bulgaria, Turkey and Hungary facilities have a combined daily grind capacity of approximately 200,000 bushels (5,080 tonnes). They produce primarily sweeteners and starches; the Hungary facility also produces ethanol for fuel, beverage and industrial uses. This will increase ADM’s global grind capacity for corn 7.5%, to approximately 3 mln bushels (76,200 tonnes) per day.
“The value of this transaction reflects the anticipated decline in EU sugar prices,” Cuddy added.
As part of the transaction,
ADM will supply Tate & Lyle with crystalline fructose from the Turkey facility. In addition, Tate & Lyle will appoint ADM as the exclusive agent for the sale of liquid sweeteners and industrial starches produced by its EU plants.
Eaststarch, a 50-50 joint venture between ADM and Tate & Lyle, was formed in 1992. It owns three corn wet mills - one in Slovakia, one in Bulgaria and one in Turkey - and 50% of a mill in Hungary. The venture deals primarily in corn sweeteners and starches.
The transaction is subject to regulatory approval in some jurisdictions. ADM is targeting closing the deal this summer.

309www.internationalsugarjournal.comwww.bma-worldwide.com
Whether it rains at midday, whether the evenings are dry - a constant sugar quality level requires a constant temperature whatever the weather. And that‘s just what the wide range of BMA products and services are there for. Why not let your
factory make the most of its potential? For more information, just contact us.
27_01_027_BMA_AZ_Zuckerqualitaet_A4_EN_RZ.indd 1 08.04.15 15:42
310 International Sugar Journal | May 2015
Sugar Industry News
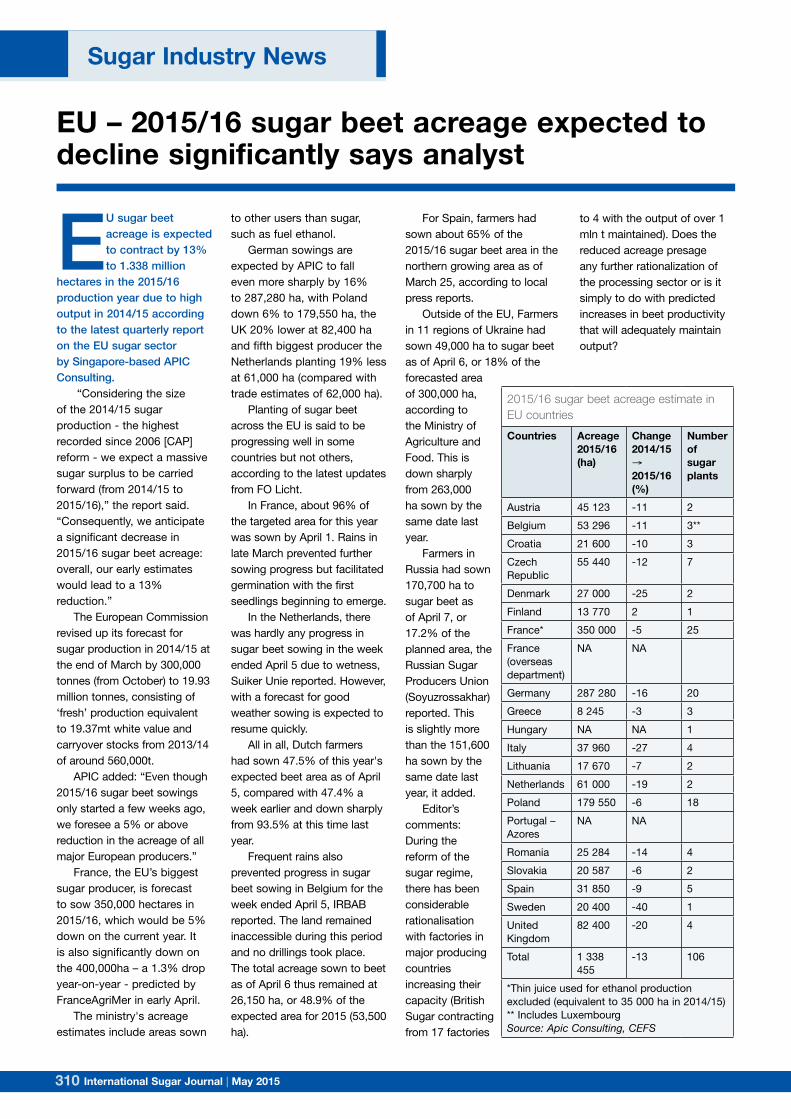
EU – 2015/16 sugar beet acreage expected to decline significantly says analyst
EU sugar beet acreage is expected to contract by 13% to 1.338 million
hectares in the 2015/16 production year due to high output in 2014/15 according to the latest quarterly report on the EU sugar sector by Singapore-based APIC Consulting.
“Considering the size of the 2014/15 sugar production - the highest recorded since 2006 [CAP] reform - we expect a massive sugar surplus to be carried forward (from 2014/15 to 2015/16),” the report said. “Consequently, we anticipate a significant decrease in 2015/16 sugar beet acreage: overall, our early estimates would lead to a 13% reduction.”
The European Commission revised up its forecast for sugar production in 2014/15 at the end of March by 300,000 tonnes (from October) to 19.93 million tonnes, consisting of ‘fresh’ production equivalent to 19.37mt white value and carryover stocks from 2013/14 of around 560,000t.
APIC added: “Even though 2015/16 sugar beet sowings only started a few weeks ago, we foresee a 5% or above reduction in the acreage of all major European producers.”
France, the EU’s biggest sugar producer, is forecast to sow 350,000 hectares in 2015/16, which would be 5% down on the current year. It is also significantly down on the 400,000ha – a 1.3% drop year-on-year - predicted by FranceAgriMer in early April.
The ministry's acreage estimates include areas sown
to other users than sugar, such as fuel ethanol.
German sowings are expected by APIC to fall even more sharply by 16% to 287,280 ha, with Poland down 6% to 179,550 ha, the UK 20% lower at 82,400 ha and fifth biggest producer the Netherlands planting 19% less at 61,000 ha (compared with trade estimates of 62,000 ha).
Planting of sugar beet across the EU is said to be progressing well in some countries but not others, according to the latest updates from FO Licht.
In France, about 96% of the targeted area for this year was sown by April 1. Rains in late March prevented further sowing progress but facilitated germination with the first seedlings beginning to emerge.
In the Netherlands, there was hardly any progress in sugar beet sowing in the week ended April 5 due to wetness, Suiker Unie reported. However, with a forecast for good weather sowing is expected to resume quickly.
All in all, Dutch farmers had sown 47.5% of this year's expected beet area as of April 5, compared with 47.4% a week earlier and down sharply from 93.5% at this time last year.
Frequent rains also prevented progress in sugar beet sowing in Belgium for the week ended April 5, IRBAB reported. The land remained inaccessible during this period and no drillings took place. The total acreage sown to beet as of April 6 thus remained at 26,150 ha, or 48.9% of the expected area for 2015 (53,500 ha).
For Spain, farmers had sown about 65% of the 2015/16 sugar beet area in the northern growing area as of March 25, according to local press reports.
Outside of the EU, Farmers in 11 regions of Ukraine had sown 49,000 ha to sugar beet as of April 6, or 18% of the forecasted area of 300,000 ha, according to the Ministry of Agriculture and Food. This is down sharply from 263,000 ha sown by the same date last year.
Farmers in Russia had sown 170,700 ha to sugar beet as of April 7, or 17.2% of the planned area, the Russian Sugar Producers Union (Soyuzrossakhar) reported. This is slightly more than the 151,600 ha sown by the same date last year, it added.
Editor’s comments: During the reform of the sugar regime, there has been considerable rationalisation with factories in major producing countries increasing their capacity (British Sugar contracting from 17 factories
to 4 with the output of over 1 mln t maintained). Does the reduced acreage presage any further rationalization of the processing sector or is it simply to do with predicted increases in beet productivity that will adequately maintain output?
2015/16 sugar beet acreage estimate in EU countries
Countries Acreage 2015/16(ha)
Change2014/15 → 2015/16(%)
Number of sugar plants
Austria 45 123 -11 2
Belgium 53 296 -11 3**
Croatia 21 600 -10 3
Czech Republic
55 440 -12 7
Denmark 27 000 -25 2
Finland 13 770 2 1
France* 350 000 -5 25
France (overseas department)
NA NA
Germany 287 280 -16 20
Greece 8 245 -3 3
Hungary NA NA 1
Italy 37 960 -27 4
Lithuania 17 670 -7 2
Netherlands 61 000 -19 2
Poland 179 550 -6 18
Portugal – Azores
NA NA
Romania 25 284 -14 4
Slovakia 20 587 -6 2
Spain 31 850 -9 5
Sweden 20 400 -40 1
United Kingdom
82 400 -20 4
Total 1 338 455
-13 106
*Thin juice used for ethanol production excluded (equivalent to 35 000 ha in 2014/15)** Includes LuxembourgSource: Apic Consulting, CEFS

311www.internationalsugarjournal.com
Saccharin found to be potentially effective for anti-cancer drug
Researchers at the University of Florida have found that saccharin,
the artificial sweetener, could potentially lead to the development of drugs capable of combating aggressive, difficult-to-treat cancers with fewer side effects.
The findings were will be presented at the 249th National Meeting & Exposition of the American Chemical Society (ACS).
The lead researcher Robert McKenna said that "This result opens up the potential to develop a novel anti-cancer drug that is derived from a common condiment that could have a lasting impact on treating several cancers."
The new work examines how saccharin binds to and deactivates carbonic anhydrase IX, a protein found in some very aggressive cancers. It is one of many driving factors in the growth and spread of such cancers in the breast, lung, liver, kidney, pancreas and brain. Carbonic anhydrase IX helps regulate pH in and around cancer cells, allowing tumors to thrive and potentially metastasize to other parts of the body. Because of this finding, the researchers wanted to develop saccharin-based drug candidates that could slow the growth of these cancers and potentially make them less resistant to chemo or radiation therapies.
Except for in the gastrointestinal tract, carbonic anhydrase IX is normally not found in healthy human cells. According to McKenna, this makes it a prime target for anti-cancer drugs that would cause little or no side effects to healthy tissue surrounding
the tumor.Unfortunately, there's a
catch.Carbonic anhydrase IX
is similar to other carbonic anhydrase proteins that our bodies need to work properly. So far, finding a substance that blocks carbonic anhydrase IX without affecting the other ones has been elusive. And that's where saccharin -- ironically, once considered a possible carcinogen-- comes in.
In earlier work, scientists from a group led by Claudiu T. Supuran, at the University of Florence, Italy, discovered that saccharin inhibits the actions of carbonic anhydrase IX, but not the 14 other carbonic anhydrase proteins that are vital to our survival. Building on this finding, a team led by Sally-Ann Poulsen, at Griffith University, Australia, created a compound in which a molecule of glucose was chemically linked to saccharin. This small change had big effects. Not only did it reduce the amount of saccharin needed to inhibit carbonic anhydrase IX, the compound was 1,000 times more likely to bind to the enzyme than saccharin.
Using X-ray crystallography, McKenna and his students Jenna Driscoll and Brian Mahon have taken this work a step further by determining how saccharin binds to carbonic anhydrase IX, and how it or other saccharin-based compounds might be tweaked to enhance this binding and boost its anti-cancer treatment potential.
McKenna's team is currently testing the effects of saccharin and saccharin-based compounds on breast and liver cancer cells. If successful, these experiments could lead to animal studies.
Sugar Refining with Purolite Resin Technology
For sugar and sweetener applications, each processand raw material offers a discreet challenge. Purolite ion exchange resins and adsorbents provide innovative solutions for every demand.
• Color, taste and odor removal with Macronet adsorbents rather than powdered and granular carbon
• Decolorization with the highest efficiency
• Sucrose demineralization without inversion
• Sucrose inversion with resin catalyst or immobilized invertase enzyme
For more information visit us at www.purolite.com.
312 International Sugar Journal | May 2015
Sugar Industry News
Brazil – 2015/16 sugar output to rise 5.0% says Conab
Brazil's 2015/16 cane campaign that commenced in April, is
expected to produce 37.35 mln tonnes of sugar, tel quel, up 5.0% from 35.56 mln a year earlier, with most of the growth coming from the main Centre/South (CS) harvest, government crop supply agency Conab said.
The main CS region will produce 33.72 mln tonnes of sugar, up 5.4% from 32.00 mln in 2014/15, Conab said in its first estimate of the new crop. North/NorthEast (NNE) sugar output is seen up 2.0%
at 3.63 mln tonnes from 3.56 mln.
The country's combined CS and NNE cane output will rise 3.1% to 654.6 mln tonnes from 642.1 mln in 2014/15 as fields recover from drought, Conab said. The worst drought in decades in 2014 in São Paulo state hurt production of the crop in 2014/15, when it declined 3.7% from 658.8 mln tonnes in 2013/14. The amount of rain so far this year, which will affect the 2015/16 harvest, has been less than normal, but still better than last year, the agency said. Conab sees
the CS cane crush up 3.0% at 592.7 mln tonnes from 575.4 mln, while NNE crushing is seen rising by 4.3% to 61.9 mln tonnes from 59.4 mln.
The CS cane yield is estimated to rise to 73.9 tonnes per ha from 72.1, with acreage increasing by 0.5% to 8.016 mln ha. The NNE cane yield is forecast to increase by 1.6% to 58.7 t/ ha from 57.8 t, with acreage up 2.7% at 1.054 mln ha. The CS ATR level in 2015/16 was put at 137.8 kg per tonne of cane, while it is seen at 126.4 kg in the NNE region.
Conab said it expected
Brazil's ethanol output to increase by only 1.9% to 29.20 bln litres (of which 12.73 bln anhydrous and 16.46 bln hydrous), from the 28.66 bln (11.73 bln anhydrous and 16.93 bln hydrous) estimated for 2014/15. CS ethanol output is seen up 1.4% on the year at 26.89 bln litres from 26.52 bln, with NNE ethanol production up 8.0% at 2.31 bln litres from 2.14 bln.
Conab's forecast of the CS cane crop is more in line with private-sector outlooks than in past years, when it had been at the high end of the range of estimates.
Guatemala – 2015/16 sugar output forecast to increase to record 3 mln tonnes
Guatemalan sugar production for marketing year (MY) 2015-2016
(October 2015 to September 2016) is forecast at 2.96 mln tonnes, up from 2.90 mln t from previous year, reports US Department of Agriculture bureau in Guatemala.
The forecast output is a record high for the third consecutive year.
Total exports for MY 2015-2016 are forecast at 2.35 mln tonnes, with a major share of refined sugar for the first time in history. Guatemala, during MY 2013-2014, positioned itself as the third major producer and third biggest exporter in Latin American and the Caribbean, fifth major exporter worldwide.
While the cane sector has been expanding cane acreage by 3% annually for the past years (acreage is forecast at 270,000 ha for 2015/16), it is the significant improvement in productivity that catapulted cane production. Sugar yield has increased from 6.6 t/ha, in 1990, to 10.8 t/ha during the last harvest season.
Cane productivity increases have been informed via the industry’s research body CENGICAÑA through focus on:• improved genetics:
Guatemala participates in the improved sugar genetics exchange program in between producing countries. Guatemala’s sugar cane varieties have come mainly from Canal
Point (Florida), but materials have also been introduced from Australia, South Africa, Maurice, India, Thailand, Argentina, Brazil, Colombia, Ecuador, Mexico, Cuba, Puerto Rico, and Barbados. Prior to the establishment of the Center for Sugar Cane Research (CENGICAÑA) in 1992, Guatemala’s production relied exclusively on selection of foreign developed materials.
• in tegra ted pest management: From the 1960’s till the 1990’s, six major pests impacted the sugar cane production, and chemical control was the most important control strategy. Over the past ten years, combination of breeding for pest and
disease resistance along with the use of biological controls with natural predators and microbial parasites has reduced the use of chemical control
• irrigation efficiency: Water use in 2015 is twice as effective as in 1990. During the 90’s, the sugar sector’s irrigation efficiency was 0.90 ha/ML (mega litre). By 2015, the efficiency had increased to 1.80 ha/ML, and
• environmental sustainability: : In 2012 the sugar industry founded the first private-sector research group, the Climate Change Institute (ICC) which focuses on climate and water, ecosystems, riverbanks integrated management, disaster risk management,
313www.internationalsugarjournal.com
Engineers & Contractors
Brussels • BelgiumTel.: +32 (0)2 634 25 00Fax: +32 (0)2 634 25 [email protected]
Reliability through Experience
Sugar Plant • Sugar RefineryBio-based Industry & Chemistry
Agro-Chemistry Bioethanol Plant
Cogeneration Plant
From Basic Engineeringto
Full Turnkey Project
Single Point Responsibility throughEPC or EPCM+® with guaranteed:
✔ Process Performances
✔ Time Schedule
✔ Budget
www.dsengineers.com
Pub-DSEC-103x297-2015.indd 1 3/27/15 11:31 AM
Australia – Yellow canopy syndrome has reduced cane yields by 10 t/ha
The still unknown cause and impact of yellow canopy syndrome is
heightening concerns in North Queensland, after a difficult growing season in which some sugar districts have received less than half of their long-term rainfall average for the wet season, according to ABC.
With weather and climate forecasts also indicating a low rainfall probability between April and June, growers are worried the double whammy of weather and yellow canopy will hit productivity hard.
A cane grower, Michael Waring, in Ingham, about 100 kilometres north of Townsville, estimates his crop has suffered to the tune of 10 tons a hectare. He believes it's a similar story across the region, which produces about four million tons of sugar
cane."In 2014, the district only
averaged 73 tons a hectare which is not very good in the Herbert in the year we had which was a reasonable year. It wasn't a good year and it wasn't a bad year, I think the Herbert should've been averaging in the low 80 tons a hectare. So, there's something holding us back," Mr Waring said.
So far, the industry's research and development arm, Sugar Research Australia admits it is no closer to finding definitive answers as to the cause or effect of yellow canopy syndrome (YCS). But Dr Andrew Ward, from the Professional Extension and Communication unit, said its molecular work has resulted in a much better understanding of the physiological processes of the mysterious syndrome.
and climate change capacity building. The cane sector presently co-generates 412 MW (21% of the national grid) and produces 272 million litres of ethanol from molasses (alcohol during MY2013-2014 Other environmental friendly actions undertaken include energy forests incorporation into the sugar cane processing at the mills and ethanol by-production from
the molasses (not from main juices – therefore does not compete with sugar production). Guatemala is presently co-generating 412 MW (21% of the national grid) and produced 272 million litres of alcohol during MY2013-2014 (all of which is presently exported). The productivity goal for
2020 is for sugar yields to increase to 12.0 t/ha on raw sugar terms.
314 International Sugar Journal | May 2015
Sugar Industry News
Morocco's Cosumar will develop a sugar complex
in the east of Cameroon, according to local press reports.
A committee that met on February 25, 2015 decided to award the tender to Cosumar and not to Somdiaa group, which owns Cameroon's sole sugar producer Sosucam.
When the tender was issued on November 20, 2014 the Minister of Mines, Industry and Technological Development, Emmanuel Bonde, noted that the winner would build a sugar mill between Batouri and Bertoua with the potential cane area put at 32,000 ha. Cosumar reportedly proposed to invest around 60 bln CFA francs (€ 90 mln), the same amount as Justin Sugar Mills, the initial
developer of the complex who has been unable to complete the project.
On 13 April 2012, Justin Sugar Mills along with its Indian partners had signed a Memorandum of Understanding, to build the sugar factory with a capacity of 60,000 tonnes and a 16 MW cogen plant. This was terminated by Mr Bonde following an audit by Ernst & Young two years later,
reporting little progress with the project.
Despite having won the tender, Cosumar still needs to sign a contract with Cameroon's government to proceed.
Sosucam plans to produce between 150,000 and 160,000 tonnes of sugar this year, while the Ministry of Commerce puts domestic consumption at between 180,000 and 200,000 tonnes.
Chile - Beet acreage stable in 2014/15 despite lower prices
Chile's sole beet sugar producer Iansa has 18,449 ha under beet for
the 2014/15 harvest (which is due to start soon), similar to a year earlier but below the five-year average (2010- 2014) of 19,600 ha, the company announced.
It had agreed with the National Beet Growers Association (Fenare) in May 2014 to pay growers a fixed maximum price of $57.50 per tonne of beet (at 16% sugar content) for the upcoming harvest, somewhat below the previous season's $60.50.
The company commented that the stable acreage under contract, despite the decrease in the contract price, reflected the commitment of farmers to the company as well as the fact that beet still offer farmers the highest profitability compared to alternative crops.
However, the company
previously reported (in late October) that it had contracted 19,500 ha for 2014/15 by the end of September 2014, representing an increase of 5% over the previous season. The 2013/14 harvest had begun in the second quarter of 2014 and only ended in early October 2014 in the Los Ángeles zone as heavy rains in the south central region during the winter made it difficult to harvest some fields. This came on top of frost which hit the crop during the second half of 2013 and a summer period of high temperatures.
The average beet yield therefore dropped to 90 tonnes per ha (at 16%) from 104 tonnes in 2013/14 when the harvested acreage was 18,290 ha. Beet yields in 2014/15 are seen recovering only modestly to 96 tonnes per ha due to an unusally dry summer, the company said.
The cultivated beet
acreage with surface irrigation technology increased to 63% in 2013/14 from 58% a year earlier. The short-term objective is to increase the area under irrigation further to improve yields, Iansa said.
Iansa is Chile's market leader in sugar sales with a share of about 70% of the market. Chile's total sugar consumption in 2014 is estimated at 761,000 tonnes and Iansa accounted for 530,000 tonnes of that (down from 534,000 a year ago). Chile's per capita consumption is slowly contracting with a decrease to 42.4 kg observed in 2014 from 42.8 kg in 2013. Per capita consumption has now fallen for three years in a row, from 43.5 kg in 2011.
In contrast, sales of non-caloric sweeteners have seen sales growth of around 10% in recent years, and Iansa has a market share of 17.4% in this market (as of October 2014)
with its product Iansa Cero K which is currently available in four versions (Cero K Sucralosa; Cero K Stevia Sens, Cero K 100% Stevia and Cero K Agave). Iansa's market share in sucralose is 24% while it is at 16.2% for stevia, it said.
To meet rising demand for non-caloric sweeteners the company on June 24, 2014 opened in Chillán its $8 mln Iansa Cero K plant, which potentially enables it to triple sales of these sweeteners. The plant has been added to a sugar factory that is in operation since 1967 and was already expanded by a raw sugar refinery in November 2012.
Iansa's total revenue fell by 1.2% in 2014 to $597.1 mln from $604.4 mln in 2013. Operating profit fell by 44.0% to $18.2 mln from $32.5 mln, and EBITDA decreased to $35.6 mln, down 26.35 from $48.3 mln the year before.
Cameroon - Morocco's Cosumar wins tender to develop sugar complex

315www.internationalsugarjournal.com
SPONSORED BY AMERICAN SUGAR ALLIANCE
Plan now to attend the 32nd International Sweetener Symposium, to be held July 31 – August 5, 2015, at the Hyatt Regency Tamaya Resort & Spa in New Mexico. Attendance at this important industry meeting is an absolute must for all industry stakeholders as we explore the complex and critical issues facing the industry today. What is the latest on North American sugar trade? Will regional and global supplies continue to outpace demand, or will the market tighten? What should we expect from the government’s renewed trade agenda? What impact will global sugar subsidies have on the market and domestic producers? How has sugar policy performed and what’s next with Farm Bill administration? What new developments are taking shape in the food manufacturing industry? Join us in New Mexico to be part of this active discussion. This is one sweetener industry meeting you can’t miss!
This year’s site, the Hyatt Regency Tamaya Resort & Spa, is a truly special place. While the state of New Mexico is known as the Land of Enchantment, this resort embodies that enchantment like no other. Located in central New Mexico, between Albuquerque (ABQ) and Santa Fe (SAF), the resort rests in the sacred lands of the Santa Ana Pueblo. Its ideal location at the base of the Sandia Mountains offers sweeping mountain vistas, perfect sunsets and piercing blue skies. This 4-diamond resort uniquely weaves modern day luxury with the architecture, history, culture and cuisine of the people of Tamaya. Since the Symposium main hotel has sold out the last several years, make your lodging reservations now to ensure your stay at the main resort. Visit www.sugaralliance.org/symposium for a link to make your hotel reservations or call 888-421-1442 and reference group code G-ASAA to receive ASA’s special group rates. Symposium registration materials will be available in May 2015.
Hyatt Regency TamayaResort & Spa
Santa Ana Pueblo, New MexicoJuly 31– August 5, 2015
For more information visit www.sugaralliance.org/symposium.
HYA
TT
RE
GE
NC
Y T
AM
AYA
ASA_ISJ Ad.indd 1 4/24/15 10:07 AM
316 International Sugar Journal | May 2015
Sugar Industry News
Guyana - GuySuCo ordered to pay Booker Tate US$994,630
Guyana's High Court has ruled in favour of the UK-based sugar
management firm Booker Tate, ordering the Guyana Sugar Corporation to pay GBP664,750.91 US$994,630) for fees owed during the period it managed the industry, according to local press reports.
In a ruling by Justice Rishi Persaud, GuySuCo lost two cases and the judge also dismissed the corporation's counterclaim for damages due to insufficient evidence. Justice Persaud made the judgements against GuySuCo on March 17th and March 19th, 2015.
The legal battle has been ongoing since October 2010 when Booker Tate took legal
action, suing GuySuCo for failing to pay up for services rendered. Booker Tate had managed the sugar industry for around 20 years from 1990 but relations between it and the miller soured around 2009 amid the construction woes surrounding the newly built Skeldon sugar factory – the contract was terminated.
Booket Tate filed two
claims in September 2010. One for the project management service contract for the Skeldon Sugar Modernization Project and the other for corporate management services it provide to the sugar corporation for an agreed period.
There is a stay of execution of six months on both orders.
Ceres makes progress with field trials of its GM cane varieties
Ceres recently announced that initial field trials with its biotech
sugarcane in Latin America have produced positive data. Selected genetically modified (GM) varieties from the initial evaluation are currently being multiplied for wider-scale field testing which is scheduled to begin in May and June 2015.
Ceres reported that the GM varieties were high yielding, faster growing and increased biomass than conventional cultivars. In
addition, variety with one of the company's drought tolerance traits maintained biomass yields under water stress conditions, and in certain cases, maintained yields with as little as half the water normally required during production.
Roger Pennell, vice president of trait development for Ceres explained that faster growth, higher yield and greater resilience to drought and other stress conditions would not only increase output, but also lower production costs for
the industry. "This could revolutionize
the industry," Pennell said, noting that such traits could potentially increase the number of harvests during the lifetime of a sugarcane stand, extend the growing season and expand the area where economically attractive yields can be achieved.
Favourable results from a research setting are not a guarantee of future commercial performance, and further evaluations will be necessary to confirm these results. The next stage of
research field trials, which will provide more definitive results, is expected to be completed by June 2016. At the current pace, commercial sugarcane cultivars with Ceres' traits could be ready for commercial scale-up as early as 2018.
According to the U.N. Food and Agriculture Organization, 65 million acres (26 million hectares) of sugarcane were harvested worldwide in 2013, including 32 million acres (13 million hectares) in Latin America.
Thailand – Industry minister calls for changes to the Cane and Sugar Act to foster building of new sugar mills
Thailand’s industry Minister Chakramon Phasukavanich stated in late March
that would ask the Cabinet to amend the Cane and Sugar Act to facilitate building of about 50 sugar mills this year.
The Cane and Sugar Act does not allow sugar factories to be located within 80 km of each other. This
regulation is preventing some sugar companies from expanding their operations and discouraging some rice
317www.internationalsugarjournal.com
Russia - Import duty for raw sugar to rise to maximum $250/ tonne
The raw sugar import duty charged by the customs union comprising Russia,
Kazakhstan and Belarus will rise to $250 a tonne in May from $240 in April.
The raw sugar import duty in May is based on the average monthly front month
raw sugar price in New York in March, which was 12.84 cents/lb. A duty of $250 a tonne, the highest possible under the tariff schedule, is applied for an average raw sugar price of between 13.00 cents/lb or less.
Sugar refiners in Russia have warned the government
that there may be domestic shortages of the sweetener if the import duty on raw sugar is not lowered, according to officials at the Russian sugar producers' association (Soyuzrossakhar). Last year the country imported 642,000 tonnes of raw sugar but that is expected to fall to around
500,000-550,000 tonnes in the current year, as a result of the higher tariff, according to Soyuzrossakhar.
More than 70% of the amount of raw sugar expected to be imported this year arrived in the country in January- March.
operators from switching to sugar production.
"More than 50 sugar factories are waiting for construction approval and we're aiming to clear them within 90 days so that we can know which factory will be allowed to open," Chakramon told the Federation of Thai Industries' annual meeting on 23rd March.
"The zoning plan that Commerce Minister Chatchai Sarikalaya is managing will increase the number of sugarcane plantations to replace rice fields in the central and northeast regions, so the current 80-km zoning will be too far and it could be reduced down to around 50 km, which is one of the options that we will propose to the Cabinet," he said.

318 International Sugar Journal | May 2015
People and Places
At the annual British Society of Sugar Technologists meeting in London
on 16th April, Amélia de Andrade Ferraz received the Mike Bennett Award
for the paper “On-Line Sugar Colour Measurement Needs and Benefits”
she presented at the last year’s annual meeting. The paper described and
discussed Neltec’s online colorimeter with reference to several case studies.
Amélia de Andrade Ferraz awarded best paper prize at BSST
A former Head of Agriculture for Booker Tate and Group Agriculture Manager
for Dangote Sugar, Patrick is a sugarcane agriculturist with over 30 years’
experience. Patrick has worked in Malawi, Papua New Guinea, Australia,
Swaziland, Barbados and Nigeria in sugar estate management and new project
development. He has also provided technical inputs into bioethanol projects,
agronomy and extension in Latin America, Africa and Asia. He is currently
UK-based and working as an independent agriculture consultant to international
sugar businesses. Patrick can be contacted at [email protected].
Patrick Malein commences consulting
Amélia de Andrade Ferraz awarded best paper prize at BSST At the annual British Society of Sugar Technologists meeting in London on 16th April, Amélia de Andrade Ferraz received the Mike Bennett Award for the paper “On-Line Sugar Colour Measurement Needs and Benefits” she presented at the last year’s annual meeting. The paper described and discussed Neltec’s online colorimeter with reference to several case studies. Patrick Malein commences consulting
A sugarcane agriculturist for over 30 years, Patrick has worked in Malawi, Papua New Guinea, Australia, Swaziland, Barbados and Nigeria in sugar estate management and new project development. He has also provided technical inputs into bioethanol projects, agronomy and extension in Latin America, Africa and Asia. He is currently UK-based and working as an independent agriculture consultant to international sugar businesses. Patrick can be contacted at [email protected].
Board of Cosan elects new CEO
The board of Cosan SA elected Nelson Gomes Neto as its new chief executive after current leaders resigned, according to an April 1 filing. The company's former CEO Marcos Lutz and the chief financial officer Marcelo Eduardo Martins resigned, the filing said.
The board of Cosan SA elected Nelson Gomes Neto as its new chief
executive after current leaders resigned, according to an April 1 filing. The
company's former CEO Marcos Lutz and the chief financial officer Marcelo
Eduardo Martins resigned, the filing said.
Board of Cosan elects new CEO
319www.internationalsugarjournal.com
320 International Sugar Journal | May 2015
Sampling condensed vapours and condenser waters is never easy. Beale (1959, 1962) and Claire (1965, 1967) mention practical difficulties encountered. Vapour sampling involves iso-kinetic (constant
velocity) principles which require sophisticated equipment to obtain representative condensed vapour samples. Most workers have sampled condensates and condenser waters, using simplified sampling equipment. One of the problems associated with condenser waters is that the inlet water usually contains sugar. The large volumes of water and low concentrations of sugar can cause serious errors. A simple calculation illustrates the difficulty; we assume that the condenser inlet and outlet waters contain 70ppm of sugar, that 1 ton of vapour requires 30 tons of inlet water, and that the analytical precision is ±1ppm. The concentrations in the vapour are shown in the table: the correct value is 70ppm; assuming the two worst cases gives severe errors. Fowler (1977) notes that in pans the results depend entirely on sampling frequency. Dale & Lamusse (1977) and Schäffler (1978) describe systems for sampling and analysing factory waters. Humm (1980) used continuous sampling and gives an analytical precision of ±2ppm.Schäffler gives details of the procedures to prevent the deterioration of samples of factory waters. Samples are collected manually at the required frequency; an aliquot of 20 mL is placed in a labelled sample container and 10 drops of basic lead acetate solution added. This prevents the microbiological deterioration of the sugar and has the added advantage that it clarifies turbid samples, yielding a water white solution. The samples were then analysed in a Technicon Auto Analyser by the resorcinol method. The analysis of water for sugar traces has been a subject of investigations since 1887 (Browne & Zerban, 1948) when the resorcinol/HCl method was investigated. It is well known that distinctive colours are produced when phenols (resorcinol, alpha-naphthol, thymol, etc.) react with sugars in the presence of concentrated
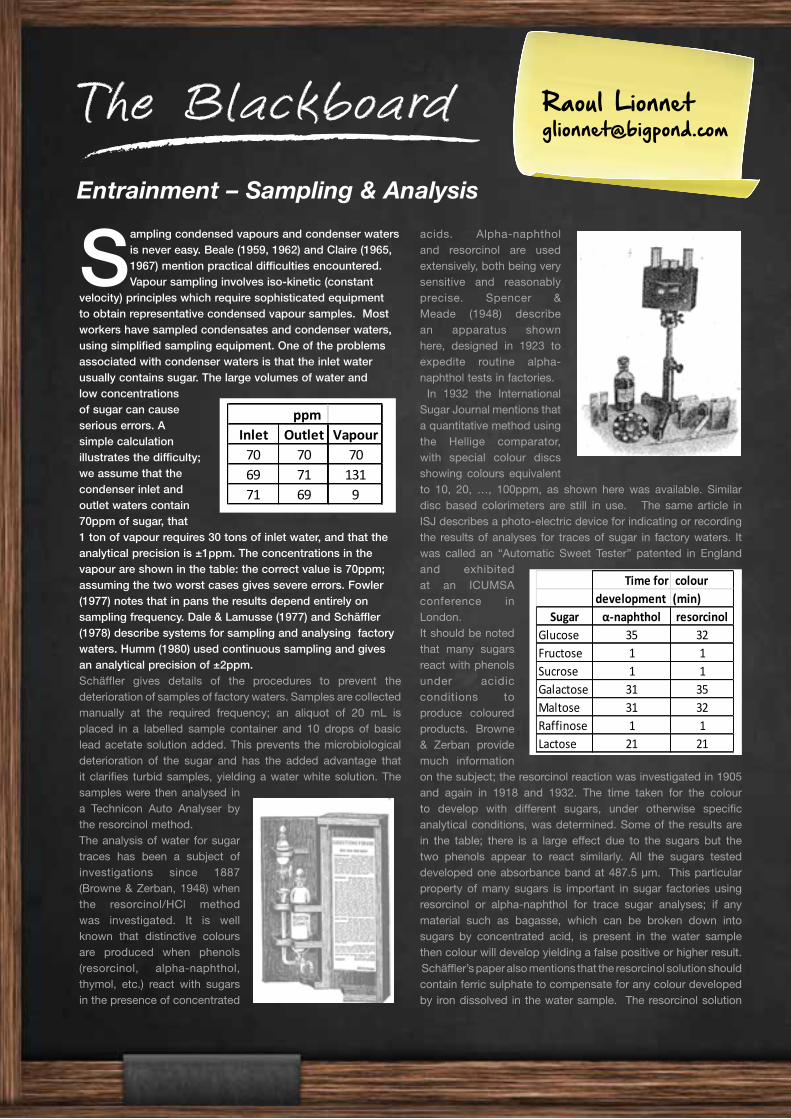
acids. Alpha-naphthol and resorcinol are used extensively, both being very sensitive and reasonably precise. Spencer & Meade (1948) describe an apparatus shown here, designed in 1923 to expedite routine alpha-naphthol tests in factories. In 1932 the International Sugar Journal mentions that a quantitative method using the Hellige comparator, with special colour discs showing colours equivalent to 10, 20, …, 100ppm, as shown here was available. Similar disc based colorimeters are still in use. The same article in ISJ describes a photo-electric device for indicating or recording the results of analyses for traces of sugar in factory waters. It was called an “Automatic Sweet Tester” patented in England and exhibited at an ICUMSA conference in London. It should be noted that many sugars react with phenols under acidic conditions to produce coloured products. Browne & Zerban provide much information on the subject; the resorcinol reaction was investigated in 1905 and again in 1918 and 1932. The time taken for the colour to develop with different sugars, under otherwise specific analytical conditions, was determined. Some of the results are in the table; there is a large effect due to the sugars but the two phenols appear to react similarly. All the sugars tested developed one absorbance band at 487.5 µm. This particular property of many sugars is important in sugar factories using resorcinol or alpha-naphthol for trace sugar analyses; if any material such as bagasse, which can be broken down into sugars by concentrated acid, is present in the water sample then colour will develop yielding a false positive or higher result. Schäffler’s paper also mentions that the resorcinol solution should contain ferric sulphate to compensate for any colour developed by iron dissolved in the water sample. The resorcinol solution
Entrainment – Sampling & Analysis
Raoul Lionnet [email protected]
1
ppmInlet Outlet Vapour70 70 7069 71 13171 69 9
Time for colourdevelopment (min)
Sugar α-‐naphthol resorcinolGlucose 35 32Fructose 1 1Sucrose 1 1Galactose 31 35Maltose 31 32Raffinose 1 1Lactose 21 21
THE BLACKBOARD
Raoul Lionnet
Entrainment – Sampling & Analysis
Sampling condensed vapours and condenser waters is never easy. Beale (1959, 1962) and Claire (1965, 1967) mention practical difficulties encountered. Vapour sampling involves iso-‐kinetic (constant velocity) principles which require sophisticated equipment to obtain representative condensed vapour samples. Most workers have sampled condensates and condenser waters, using simplified sampling equipment. One of the problems associated with condenser waters is that the inlet water usually contains sugar. The large volumes of water and low concentrations of sugar can cause serious errors. A simple calculation illustrates the difficulty; we assume that the condenser inlet and outlet waters contain 70ppm of sugar, that 1 ton of vapour requires 30 tons of inlet water, and that the analytical precision is ±1ppm. The concentrations in the vapour are shown in the table: the correct value is 70ppm; assuming the two worst cases gives severe errors. Fowler (1977) notes that in pans the results depend entirely on sampling frequency. Dale & Lamusse (1977) and Schäffler (1978) describe systems for sampling and analysing factory waters. Humm (1980) used continuous sampling and gives an analytical precision of ±2ppm.
Schäffler gives details of the procedures to prevent the deterioration of samples of factory waters. Samples are collected manually at the required frequency; an aliquot of 20 mL is placed in a labelled sample container and 10 drops of basic lead acetate solution added. This prevents the microbiological deterioration of the sugar and has the added advantage that it clarifies turbid samples, yielding a water white solution. The samples were then analysed in a Technicon Auto Analyser by the resorcinol method.
The analysis of water for sugar traces has been a subject of investigations since 1887 (Browne &
Zerban, 1948) when the resorcinol/HCl method was investigated. It is well known that distinctive colours are produced when phenols (resorcinol, alpha-‐naphthol, thymol, etc.) react with sugars in the presence of concentrated acids. Alpha-‐naphthol and resorcinol are used extensively, both being very sensitive and reasonably precise. Spencer & Meade (1948) describe an apparatus shown here, designed in 1923 to expedite routine alpha-‐naphthol tests in factories.
In 1932 the International Sugar Journal mentions that a quantitative method using the Hellige comparator, with special colour discs showing
colours equivalent to 10, 20, …, 100ppm, as shown here was available. Similar disc based colorimeters are still in use. The same article in ISJ describes a photo-‐electric device for indicating or recording the results of analyses for traces of sugar in factory waters.
It was called an “Automatic Sweet Tester” patented in England and exhibited at an ICUMSA conference in London.
It should be noted that many sugars react with phenols under acidic conditions to produce coloured products. Browne & Zerban provide much information on the subject; the resorcinol reaction was investigated in 1905 and again in 1918 and 1932. The time taken for the colour to develop with different sugars, under otherwise specific analytical conditions, was

321www.internationalsugarjournal.com
c o n t a i n i n g the iron salt is then calibrated using sucrose solutions from 10 to 50ppm. A calibration obtained by this author is shown. It is evident that the calibration worked well.
References
Anon. (1932). New laboratory methods and reports. ISJ.
Beale RF & Stewart PN (1962). Entrainment separation.
QSSCT Proc.
Beale RF (1959). Entrainment prevention at Gin Gin. QSSCT
Proc
Browne CA & Zerban FW (1948). Physical and chemical
methods of sugar analysis. J Wiley.
Claire AG & Mulvena TC (1967). Entrainment separation at
Racecourse Mill. QSSCT Proc.
Claire AG (1965). A method for detecting and measuring
entrainment. ISSCT Proc
Dale TB & Lamusse JP (1977). Monitoring of entrainment by
vapour sampling and the use of a flame photometer. SASTA
Proc.
Fowler MJ (1977). Continuous sugar detection in refinery pans.
SIT Proc.
Humm DM (1980). Entrainment separators for vacuum pans
and evaporators. SIT 1980.
Schäffler KJ (1978). Sugar entrainment monitoring. SASTA
Proc.
Spencer GL & Meade GP (1948). Cane Sugar Handbook. John
Wiley & Sons.
2
determined. Some of the results are in the table; there is a large effect due to the sugars but the two phenols appear to react similarly. All the sugars tested developed one absorbance band at 487.5 µm. This particular property of many sugars is important in sugar factories using resorcinol or alpha-‐naphthol for trace sugar analyses; if any material such as bagasse, which can be broken down into sugars by concentrated acid, is present in the water sample then colour will develop yielding a false positive or higher result.
Schäffler’s paper also mentions that the resorcinol solution should contain ferric sulphate
to compensate for any colour developed by iron dissolved in the water sample. The
resorcinol solution
containing the iron salt is then calibrated using sucrose solutions from 10 to 50ppm. A calibration obtained by this author is shown. It is evident that the calibration
worked well.
References
Anon. (1932). New laboratory methods and reports. ISJ.
Beale RF & Stewart PN (1962). Entrainment separation. QSSCT Proc. Beale RF (1959). Entrainment prevention at Gin Gin. QSSCT Proc
Browne CA & Zerban FW (1948). Physical and chemical methods of sugar analysis. J Wiley. Claire AG & Mulvena TC (1967). Entrainment separation at Racecourse Mill. QSSCT Proc. Claire AG (1965). A method for detecting and measuring entrainment. ISSCT Proc Dale TB & Lamusse JP (1977). Monitoring of entrainment by vapour sampling and the use of a flame photometer. SASTA Proc. Fowler MJ (1977). Continuous sugar detection in refinery pans. SIT Proc. Humm DM (1980). Entrainment separators for vacuum pans and evaporators. SIT 1980. Schäffler KJ (1978). Sugar entrainment monitoring. SASTA Proc. Spencer GL & Meade GP (1948). Cane Sugar Handbook. John Wiley & Sons.

322 International Sugar Journal | May 2015
BioFuels News
For the latest sugar industry news visit www.internationalsugarjournal.com
sugarJOURNAL
INTERNATIONAL
State regulators have approved Coastal Zone permit to build a new
US$170 million bioethanol plant along the Delaware River at Croda Inc.’s specialty chemical site north of New Castle, reported Delawareonline recently.
The new plant will create 28 new jobs and protect 47 existing jobs that could have been transferred elsewhere without the project, company officials said.
When completed in about
two years, the company will begin converting between 10 million and 14 million
gallons of ethanol each year into ethylene oxide, opening a new market for U.S. ethanol. Ethylene oxide is the primary chemical used in the manufacture of nonionic surfactants.
Delaware Department of Natural Resources and Environmental Control
(DNREC) Secretary David Small said that Croda's project will end the need for long-distance rail shipments of hazardous ethylene oxide from the Gulf Coast to the company's Atlas Point plant
near the Delaware Memorial Bridge.
Croda plans to use corn-based ethanol to make the ethylene oxide instead of using oil-based products as the feedstock. The company is a leading manufacturer of surfactants, emulsifiers and demulsifiers, with about half its production bound for consumer products and the other half for industrial uses. Consumer end products include shampoos, lotions and cleaning products.
USA – Croda to build new US$170 million bioethanol plant in Delaware
The company will begin converting between 10 million and 14 million gallons of ethanol each year into ethylene oxide
Researchers in the Cockrell School of Engineering at The University
of Texas at Austin have used a combination of metabolic engineering and directed evolution to develop a new, mutant yeast strain that could lead to a more efficient biofuel production process that would make biofuels more economically competitive with conventional fuels.
Their findings are published in the journal
Metabolic Engineering.Beyond biofuels, the new
yeast strain could be used in biochemical production to produce oleochemicals, chemicals traditionally derived from plant and animal fats and petroleum, which are used to make a variety of household products.
The lead researcher Hal Alper and his team have engineered a special type of yeast cell, Yarrowia lipolytica, and significantly enhanced its ability to convert simple sugars into oils and fats,
known as lipids, that can then be used in place of petroleum-derived products.
Previously, the Alper team successfully combined genetically engineered yeast cells with ordinary table sugar to produce what Alper described as "a renewable version of sweet crude," the premium form of petroleum. Building upon this approach, the team used a combination of evolutionary engineering strategies to create the new, mutant strain of Yarrowia that produces 1.6 times as many
lipids as their previous strain in a shorter time, reaching levels of 40 grams per liter, a concentration that could make yeast cells a viable platform in the creation of biofuels. The strain's high lipid yield makes it one of the most efficient organisms for turning sugar into lipids. In addition, the resulting cells produced these lipids at a rate that was more than 2.5 times as fast as the previous strain.
"This significant improvement in our cell-based platform enables
Biofuel production enhanced by bioengineered yeast
323www.internationalsugarjournal.com
these cells to compete in the biofuels industry," Alper said. "We have moved to concentration values that begin to align with those in other industrial fuel processes."
Alper and his team improved the performance of Yarrowia through a combination of metabolic engineering and directed evolution, which, like the process of natural selection, seeks to identify and cultivate the high-performing cells. In this work, the researchers recognized that cells with high lipid content would float to the top of a tube, whereas cells with lower lipid content would settle down to the bottom. The researchers used this "floating cell scheme" to identify the best-performing cells.
The researchers used these high-performing cells, cells that produced more lipids and at a faster rate, to obtain the final yeast with improved function.
"We were able to iterate the strain through a process of directed evolution, which involves mutation and selection, and with each cycle we were able to get things better and better," Alper said.
In addition to using lipids for biofuels, the cell-based platform is able to produce oleochemicals, including nutritional polyunsaturated fatty acids, waxes, lubricants, oils, industrial
solvents, cosmetics and a type of vitamin supplements called nutraceuticals.
The researchers' method and platform are patent pending. Alper's lab is continuing to work on ways to improve how the yeast strain converts sugar into lipids, and on the types of lipid products they can produce.
Sugar Knowledge International - SKIL brings extensive technical knowledge and practical capability to the beet, cane and refining sectors. We help our clients with all aspects of the industry from agriculture to packed product.
We are totally independent and not associated with any sugar manufacturer or any equipment supplier.
Sugar Knowledge International Ltd
From concept to finished project - in this case a refinery: SKIL has the knowledge to help the world’s sugar industry Call us on: +44 (0)1689 852 811 or email: [email protected]
www.sucrose.com

324 International Sugar Journal | May 2015
BioFuels News
Logum Logistica's BRL7 bln ($1=BRL3.20) ethanol pipeline project
is in serious trouble. The network, which is to connect the ethanol producing regions of São Paulo, Minas Gerais, Goiás and Mato Grosso do Sul with the distribution hubs in Paulínia, São Paulo and Duque de Caxias, Rio de Janeiro, was launched in 2010. Reportedly, construction
company Camargo Corrêa Construções and Participações, which holds a 10% share in the project, is preparing to leave while national development bank BNDES stopped payments under a BRL5.8 bln loan facility due to a lack of progress. Logum is currently undergoing an audit the results of which are expected soon.
In the first phase of the project, finished in autumn
2014, Ribeirão Preto in São Paulo was connected with Uberaba in Minas Gerais. While the maximum capacity of this section is 750 m³ per hour, actual utilisation is reportedly very low. In a next step, Uberaba would be connected with Itumbiara in Goiás. Camargo Corrêa's leave would not affect the latter.
Other shareholders include Petrobras and a unit of industrial conglomerate
Odebrecht (20% each) as well as Copersucar, Raízen Energia and Uniduto Logística.
Banking houses Bradesco and Santander refinanced a BRL1.7 bln payment to BNDES.
Last summer, Copersucar started operations at the Terminal Copersucar de Etanol (TCE) in Paulínia in which it invested BRL150 mln and which is also to be connected to the Logum pipeline.
Brazil – Major setback with ethanol pipeline project
Edinburgh Napier University spin-out Celtic Renewables has secured
£500,000(US$750,000) in new investment for its patented process to produce biobutanol from whisky industry waste products.
Celtic Renewables, in partnership with the Ghent-based BioBase Europe Pilot Plant (BBEPP), produced the first samples of biobutanol from waste products generated from Scotland's £4 billion a year malt whisky industry, namely pot ale (copper-containing liquid from the stills) and draff (spent barley grains)..
The technology was proven following a year of development work as part of a £1 million programme funded by the Department for Energy and Climate Change (DECC)
from its Energy Entrepreneurs Fund.
The new investment includes a £250,000 equity stake investment with the Scottish Investment Bank, the investment arm of Scottish enterprise, matched by a further £250,000 equity stake acquired by an existing but unnamed private investor.
The company uses the conventional manufacturing ABE process whereby Clostridium bacteria ferments sugars into 3 parts acetone, 6 parts butanol and 1 part ethanol. ABE fermentation
was first developed in the UK a century ago, but died out in competition with the
petrochemical industry.Biobutanol, unlike ethanol,
can be used as a direct replacement for petrol, or as a blend, without the need for engine modification.
The company is now
looking to secure funding from the Department for Transport’s (DfT’s) £25 million advanced
biofuel demonstration competition and, if successful, will move to build its first demonstration facility at the Grangemouth petrochemical plant by 2018.
Celtic Renewables secures US$750,000 for its pilot biobutanol plant
Biobutanol, unlike ethanol, can be used as a direct replacement for petrol, or as a blend, without the need for engine modification.
The company is now looking to secure funding from the Department for Transport’s (DfT’s) £25 million advanced biofuel demonstration competition and, if successful, will move to build its first demonstration facility at the Grangemouth petrochemical plant by 2018.
Biobased Products News
Researchers make progress with lignin-based asphalt sealant to replace bitumen
Researchers at TNO, a non-profit organization in the Netherlands have been successful in reducing bitumen content in asphalt sealant by replacing it with lignin.
The lead researcher Ted Slaghek says that for the mixtures to work, lignin must be integrated into the bitumen on the molecular level, not just mixed into it. By integrating the lignin, the amount of bitumen needed can be reduced by as much as half, although he found that the best-performing mixtures required less.
Lignin shares many characteristics with bitumen. Like bitumen, lignin is a large molecule with a number of carbon rings. The researchers first thought that this similarity meant that they could just add lignin to the bitumen, like other polymer additives that are already used to improve sealants.
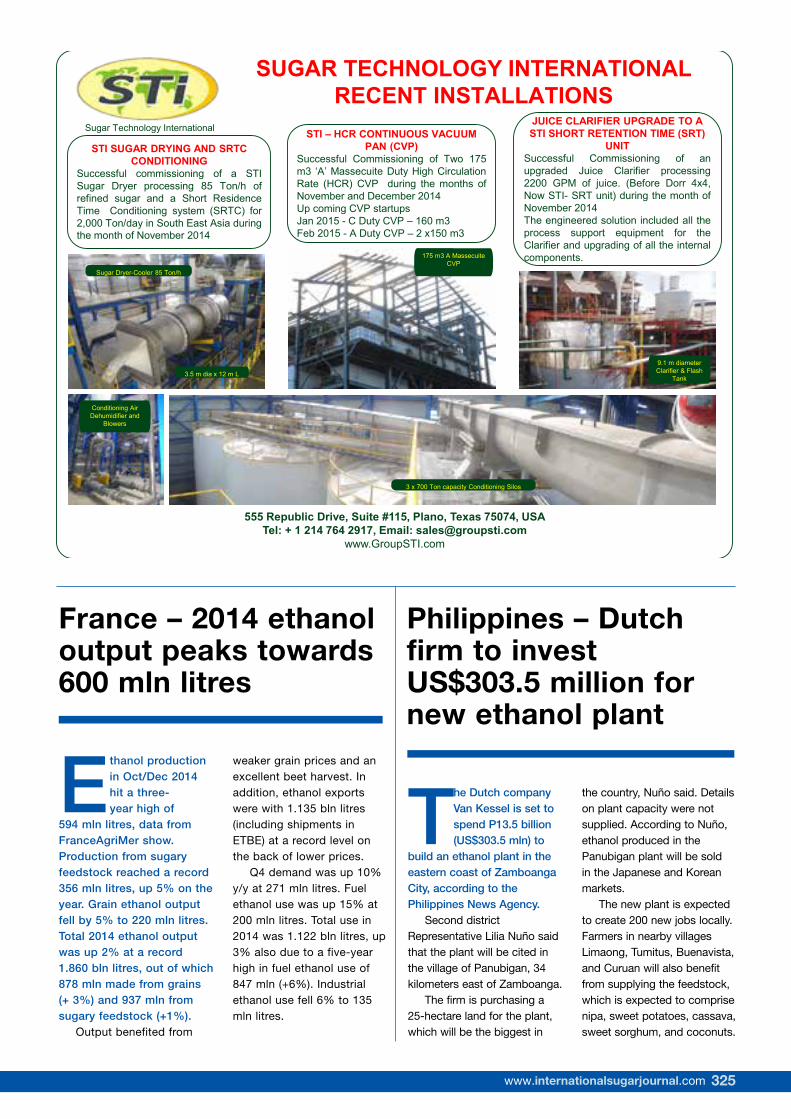
325www.internationalsugarjournal.com
Ethanol production in Oct/Dec 2014 hit a three-year high of
594 mln litres, data from FranceAgriMer show. Production from sugary feedstock reached a record 356 mln litres, up 5% on the year. Grain ethanol output fell by 5% to 220 mln litres. Total 2014 ethanol output was up 2% at a record 1.860 bln litres, out of which 878 mln made from grains (+ 3%) and 937 mln from sugary feedstock (+1%).
Output benefited from
weaker grain prices and an excellent beet harvest. In addition, ethanol exports were with 1.135 bln litres (including shipments in ETBE) at a record level on the back of lower prices.
Q4 demand was up 10% y/y at 271 mln litres. Fuel ethanol use was up 15% at 200 mln litres. Total use in 2014 was 1.122 bln litres, up 3% also due to a five-year high in fuel ethanol use of 847 mln (+6%). Industrial ethanol use fell 6% to 135 mln litres.
France – 2014 ethanol output peaks towards 600 mln litres
The Dutch company Van Kessel is set to spend P13.5 billion (US$303.5 mln) to
build an ethanol plant in the eastern coast of Zamboanga City, according to the Philippines News Agency.
Second district Representative Lilia Nuño said that the plant will be cited in the village of Panubigan, 34 kilometers east of Zamboanga.
The firm is purchasing a 25-hectare land for the plant, which will be the biggest in
the country, Nuño said. Details on plant capacity were not supplied. According to Nuño, ethanol produced in the Panubigan plant will be sold in the Japanese and Korean markets.
The new plant is expected to create 200 new jobs locally. Farmers in nearby villages Limaong, Tumitus, Buenavista, and Curuan will also benefit from supplying the feedstock, which is expected to comprise nipa, sweet potatoes, cassava, sweet sorghum, and coconuts.
Philippines – Dutch firm to invest US$303.5 million for new ethanol plant
555 Republic Drive, Suite #115, Plano, Texas 75074, USATel: + 1 214 764 2917, Email: [email protected]
www.GroupSTI.com
SUGAR TECHNOLOGY INTERNATIONAL RECENT INSTALLATIONS
Sugar Technology International
STI SUGAR DRYING AND SRTC CONDITIONING
Successful commissioning of a STISugar Dryer processing 85 Ton/h ofrefined sugar and a Short ResidenceTime Conditioning system (SRTC) for2,000 Ton/day in South East Asia duringthe month of November 2014
Sugar Dryer-Cooler 85 Ton/h
3.5 m dia x 12 m L
STI – HCR CONTINUOUS VACUUM PAN (CVP)
Successful Commissioning of Two 175m3 ‘A’ Massecuite Duty High CirculationRate (HCR) CVP during the months ofNovember and December 2014Up coming CVP startups Jan 2015 - C Duty CVP – 160 m3 Feb 2015 - A Duty CVP – 2 x150 m3
JUICE CLARIFIER UPGRADE TO A STI SHORT RETENTION TIME (SRT)
UNITSuccessful Commissioning of anupgraded Juice Clarifier processing2200 GPM of juice. (Before Dorr 4x4,Now STI- SRT unit) during the month ofNovember 2014The engineered solution included all theprocess support equipment for theClarifier and upgrading of all the internalcomponents.175 m3 A Massecuite
CVP
9.1 m diameter ClarifierConditioning Air Dehumidifier and
Blowers
3 x 700 Ton capacity Conditioning Silos
9.1 m diameter Clarifier & Flash
Tank
326 International Sugar Journal | May 2015
Biobased Products News
For the latest sugar industry news visit www.internationalsugarjournal.com
sugarJOURNAL
INTERNATIONAL
Researchers make progress with lignin-based asphalt sealant to replace bitumen
Researchers at TNO, a non-profit organization in the Netherlands have
been successful in reducing bitumen content in asphalt sealant by replacing it with lignin.
The lead researcher Ted Slaghek says that for the mixtures to work, lignin must be integrated into the bitumen on the molecular level, not just mixed into it. By integrating the lignin, the amount of bitumen needed can be reduced by as much
as half, although he found that the best-performing mixtures required less.
Lignin shares many characteristics with bitumen. Like bitumen, lignin is a large molecule with a number of carbon rings. The researchers first thought that this similarity meant that they could just add lignin to the bitumen, like other polymer additives that are already used to improve sealants.
As with other additives, lignin makes sealants perform even better — but those
polymer additives come from petroleum sources, making them just as problematic as bitumen. Slaghek's team has developed a number of lignin-bitumen mixtures that make the asphalt harder in warm weather, preventing rutting and adding a few years to a road’s lifespan. "On the other hand, if you have roads where the temperatures tend to be lower, bitumen can become too hard and brittle, increasing the chance that rocks and pebbles will come loose and damage
your car," says Slaghek. "We have also developed lignin-bitumen mixtures that keep the bitumen more tacky, so at lower temperatures it's still a good road." The mixtures contain differing amounts of lignin, as well as lignin with various chemical modifications.
To demonstrate how well these mixtures can work in the real world, Slaghek and partners are planning to build a 100-meter stretch of bicycle path this year using one of the lignin-based asphalt mixtures.
Commercial scale biobased levulinic acid production in sight
Couple of start-ups, GFBiochemicals and Bio-On, are extending their
interest in biobased levulinic acid production.
GFBiochemicals recently announced that it will commence operations at its 2,000 MT per year levulinic acid production facility in Caserta, Italy in summer 2015. The company’s proprietary chemical catalytic process technology has been operating
at demonstration scale since 2008 and it intends to scale up to 8,000 MT per year by 2017.
GFBiochemicals will begin with a starch-based feedstock and aim to switch to cellulosic-based feedstock next year. According to a company spokesperson “GFBiochemicals' process is feedstock flexible which allows production of levulinic acid directly from biomass within the Caserta plant.”
In another levulinic acid
news, Italian companies, Bio-On announced that Eridanis Sadam have announced collaboration on developing and optimizing production of levulinic acid. Eridanis Sadam, an Italian agro-industrial group, will invest €1.8 million in the development of the Bio-On technology process to produce levulinic acid.
Italian company Bio-On announced that Eridanis Sadam, an Italian agro-industrial group, will invest
€1.8 million in the development of the Bio-On technology process to produce levulinic acid.
Information on process conversion technology that Bio-On is working on is not provided, just that feedstock used will be “by-products of the sugar industry”.
Commenting on these announcements, Lux Research said that “like similar intermediate chemicals such as succinic acid, the
327www.internationalsugarjournal.com
BASF produces biobased polyTHF
The chemical giant BASF has begun commercial production of
biobased Polytetrahydrofuran 1000 (PolyTHF 1000) for the first time and is providing this intermediate to selected partners for large-scale testing in various applications.
PolyTHF is derived entirely from biomass feedstocks. The process hinges on a microbial fermentation of sugars to produce 1,4-butanediol (BDO), which is then purified and polymerised.
PolyTHF is a hygroscopic polymer made up of linear diols with a backbone of
repeating tetramethylene units connected by ether linkages. The chains are capped with primary hydroxyl units and are produced by polymerizing tetrahydrofuran. It is a white solid that melts into a clear, colorless liquid when heated to between -15° and 30°C, depending on its
molecular weight. PolyTHF is especially beneficial when used as a building block for soft segment elastomers such as polyurethanes, co-polyetheresters and co-polyetheramides. Its hydroxyl groups react with other functional groups such as organic
levulinic acid space is gaining momentum, and there are parallels to be drawn between levulinic acid and succinic acid. Levulinic acid, like succinic acid, is often referred to as a building block chemical, and levulinic acid can serve as a stepping stone in the production of acrylic acid, succinate, 1,4-pentanediol, and 2-methyl-tetrahydrofuran. Succinic acid can similarly be converted
to 1,4-butanediol or PBS, and can be used to replace adipic acid. Like succinic acid, the levulinic acid space is small, with just a handful of companies like Biofine Technology, Segetis, and Arzeda currently producing the chemical.”
Demand is likely to increase for levulinic acid Lux Research says “given the opportunities it provides as a building block chemical.
Developing supply agreements will be important for any company within this space, as success will be dependent on off-takers applications of levulinic acid. With that in mind, it will be important for GFBiochemicals to carve a niche for its technology by securing partnerships with other companies within its value chain. While not as commercially advanced as GFBiochemicals, Bio-On
should focus on securing technology development partners and further funding, presenting an opportunity for clients to play a larger role within this growth of this company. Downstream off-takers looking for levulinic acid as feedstock for further processing should monitor the progress of both companies and should consider engaging for off-take agreements and partnerships.”
For over 30 years Veco has been producing high-quality electroformed screens for continuous centrifuges. This experiencewas used to develop a sugar screen with superior characteristics: VecoFlux. Featuring all the benefi ts of our standard screens, such as conical holes to reduce blinding and clogging, the thicker VecoFlux screen has a much higher open area for more throughputand is available with smaller slots for capturing even the tiniest sugar crystals. www.vecoprecision.com
VecoFlux screen. Maximize separation, optimize throughput.
Continuous centrifuge screens
A member of SPGPrints Group
Veco ad 182x130.indd 1 28-10-13 16:43

328 International Sugar Journal | May 2015
Biobased Products News
Via its Technical Research Centre VTT, Finland is investing in building
a plant to support research products in biobased products developed in lab to the next stage of piloting on a bigger scale.
The piloting center is based at Kivenlahti, Espoo.
This facility is claimed to be the largest bioeconomy research unit in Nordic countries. It will serve the needs of process and product
development operations of companies and projects
implemented by VTT and its research partners.
VTT carries out bioeconomy and cleantech research at Bioruukki. Through Bioruukki, VTT can make available its entire research volume for bioeconomy and circular economy, which amounts to more than EUR 60 million and almost 500 man-years annually. In the next few years, Bioruukki is estimated to employ some 40 researchers.
So far, VTT has invested EUR 10 million in Bioruukki and the planned further
measures are estimated to be EUR 10–15 million. In the first phase, Bioruukki will launch gasification and pyrolysis piloting operations. The installation of other pilot equipment in the 8,000 square meters Bioruukki will be carried out in the next two years.
The value of bioeconomy in Finland is currently 10% of the national economy – it hopes to double this by 2025.
Finland invests in a new plant to pilot biobased products
Mitsubishi commences production and sale of biobased polycarbonatediol
Mitsubishi Chemical Corporation (MCC) claims
to have developed the world's first bio-based polycarbonatediol, a type of high-performance polyols.
MCC uses proprietary manufacturing processes to produce the new product, which, the company says is of an entirely different
composition than any other currently available polycarbonatediols.
The company currently has the capacity to produce some 1,000 tons per year of the new polycarbonatediol, and plans to expand production capacity as demand increases.
MCC commenced selling the product in April 2015.
Polycarbonatediol is the raw material mainly used
to produce resins such as polyurethane, acrylic, and polyester. With its superior durability, it can be used for automotive interior materials such as synthetic leather for seat covers and instrument panels, automotive exterior coating, and resin coatings for electronic products such as smartphones and PCs. MCC also anticipates strong demand for this
new polycarbonatediol in eco-friendly water-borne polyurethane resins.
By using this new technology, the company will produce new products with superior mechanical properties, flexibility at low-temperatures, chemical-resistance, abrasion resistance, and high hardness, among other special characteristics.
acids or isocyanates. The most significant reactions are polyaddition and polycondensation.
The company says the bio-based PolyTHF 1000 is identical in quality to the petrochemical-based product. PolyTHF is derived from 1,4 butanediol (BDO), which BASF has produced under license
from Genomatica. BASF began production of 1,4-butanediol based on Genomatica's patented one-step fermentation process plant sugars involving genetically engineered the bacteria to produce and excrete BDO in sufficient quantity and purity.
PolyTHF is primarily used to make elastic Spandex
fibers for a large variety of textiles, including underwear, outerwear, sportswear and swimsuits. PolyTHF 1000 is mainly applied as a chemical building block for thermoplastic polyurethane (TPU), which is used to make parts of ski boots and skates, shoe soles and instrument-panel skin for automotive
applications as well as hoses, films and cable sheathing. It is also used as a component of thermoplastic polyetheresters and polyetheramides. Other applications include cast elastomers, which are used, for example, for the production of wheels for skateboards and inline skates.
This facility is claimed to be the largest bioeconomy research unit in Nordic countries
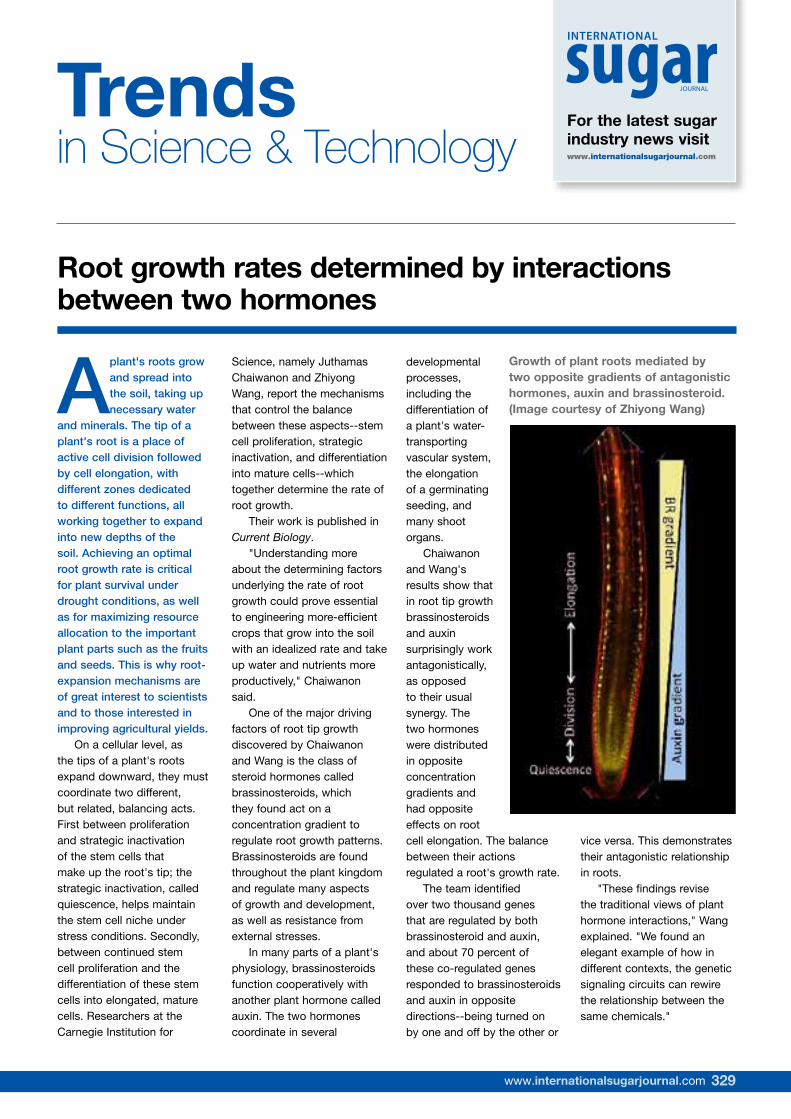
329www.internationalsugarjournal.com
Trends in Science & Technology For the latest sugar
industry news visit www.internationalsugarjournal.com
sugarJOURNAL
INTERNATIONAL
Root growth rates determined by interactions between two hormones
A plant's roots grow and spread into the soil, taking up necessary water
and minerals. The tip of a plant's root is a place of active cell division followed by cell elongation, with different zones dedicated to different functions, all working together to expand into new depths of the soil. Achieving an optimal root growth rate is critical for plant survival under drought conditions, as well as for maximizing resource allocation to the important plant parts such as the fruits and seeds. This is why root-expansion mechanisms are of great interest to scientists and to those interested in improving agricultural yields.
On a cellular level, as the tips of a plant's roots expand downward, they must coordinate two different, but related, balancing acts. First between proliferation and strategic inactivation of the stem cells that make up the root's tip; the strategic inactivation, called quiescence, helps maintain the stem cell niche under stress conditions. Secondly, between continued stem cell proliferation and the differentiation of these stem cells into elongated, mature cells. Researchers at the Carnegie Institution for
Science, namely Juthamas Chaiwanon and Zhiyong Wang, report the mechanisms that control the balance between these aspects--stem cell proliferation, strategic inactivation, and differentiation into mature cells--which together determine the rate of root growth.
Their work is published in Current Biology.
"Understanding more about the determining factors underlying the rate of root growth could prove essential to engineering more-efficient crops that grow into the soil with an idealized rate and take up water and nutrients more productively," Chaiwanon said.
One of the major driving factors of root tip growth discovered by Chaiwanon and Wang is the class of steroid hormones called brassinosteroids, which they found act on a concentration gradient to regulate root growth patterns. Brassinosteroids are found throughout the plant kingdom and regulate many aspects of growth and development, as well as resistance from external stresses.
In many parts of a plant's physiology, brassinosteroids function cooperatively with another plant hormone called auxin. The two hormones coordinate in several
developmental processes, including the differentiation of a plant's water-transporting vascular system, the elongation of a germinating seeding, and many shoot organs.
Chaiwanon and Wang's results show that in root tip growth brassinosteroids and auxin surprisingly work antagonistically, as opposed to their usual synergy. The two hormones were distributed in opposite concentration gradients and had opposite effects on root cell elongation. The balance between their actions regulated a root's growth rate.
The team identified over two thousand genes that are regulated by both brassinosteroid and auxin, and about 70 percent of these co-regulated genes responded to brassinosteroids and auxin in opposite directions--being turned on by one and off by the other or
vice versa. This demonstrates their antagonistic relationship in roots.
"These findings revise the traditional views of plant hormone interactions," Wang explained. "We found an elegant example of how in different contexts, the genetic signaling circuits can rewire the relationship between the same chemicals."
Growth of plant roots mediated by two opposite gradients of antagonistic hormones, auxin and brassinosteroid. (Image courtesy of Zhiyong Wang)
Their work is published in Current Biology.
"Understanding more about the determining factors underlying the rate of root growth could prove essential to engineering more-efficient crops that grow into the soil with an idealized rate and take up water and nutrients more productively," Chaiwanon said.
One of the major driving factors of root tip growth discovered by Chaiwanon and Wang is the class of steroid hormones called brassinosteroids, which they found act on a concentration gradient to regulate root growth patterns. Brassinosteroids are found throughout the plant kingdom and regulate many aspects of growth and development, as well as resistance from external stresses.
In many parts of a plant's physiology, brassinosteroids function cooperatively with another plant hormone called auxin. The two hormones coordinate in several developmental processes, including the differentiation of a plant's water-transporting vascular system, the elongation of a germinating seeding, and many shoot organs.
Chaiwanon and Wang's results show that in root tip growth brassinosteroids and auxin surprisingly work antagonistically, as opposed to their usual synergy. The two
Growth of plant roots mediated by two opposite gradients of antagonistic hormones, auxin and brassinosteroid. (Image courtesy of Zhiyong Wang)

330 International Sugar Journal | May 2015
Graphene-based photodetector capable of ultrafast light to electricity conversion
The efficient conversion of light into electricity plays a crucial role in many technologies, ranging from cameras to solar cells. It also forms an essential step in data communication applications, since it allows for information carried by light to be converted into electrical information that can be processed in electrical circuits. Graphene is an excellent material for ultrafast conversion of light to electrical signals, but so far it was not known how fast graphene responds to ultrashort flashes of light.
Researchers from ICFO-The Institute of Photonic Sciences (Spain) in
collaboration with scientists from MIT and University of California, Riverside have now demonstrated that a graphene-based photodetector converts absorbed light into an electrical voltage at an extremely high speed.
Findings are published in Nature Nanotechnology.
The new device that the researchers developed is capable of converting light into electricity in less than 50 femtoseconds (a twentieth of a millionth of a millionth of a second). To do this, the researchers used a combination of ultrafast pulse-shaped laser excitation and highly sensitive electrical
readout. ICFO researcher Klaas-Jan Tielrooij says "the experiment uniquely combined the ultrafast pulse shaping expertise obtained from single molecule ultrafast photonics with the expertise in graphene electronics. Facilitated by graphene's nonlinear photo-thermoelectric response, these elements enabled the observation of femtosecond photodetection response times."
The ultrafast creation of a photovoltage in graphene is possible due to the extremely fast and efficient interaction between all conduction band carriers in graphene. This interaction leads to a rapid creation of an electron
distribution with an elevated electron temperature. Thus, the energy absorbed from light is efficiently and rapidly converted into electron heat. Next, the electron heat is converted into a voltage at the interface of two graphene regions with different doping. This photo-thermoelectric effect turns out to occur almost instantaneously, thus enabling the ultrafast conversion of absorbed light into electrical signals.
The lead researcher at ICFO Prof. Frank Koppens notes, "Graphene photodetectors keep showing fascinating performances addressing a wide range of applications".
Trends in Science & Technology
Advances in the development of efficient electrical energy storage system
Lawrence Livermore researchers have identified electrical charge-induced changes in the structure and bonding of graphitic carbon electrodes that may one day affect the way energy is stored.
The research could lead to an improvement in the capacity and efficiency of electrical energy storage systems, such as batteries and supercapacitors.
Future technology requires energy storage systems to have much larger storage capability, rapid charge/discharge cycling and improved endurance. Progress in these areas demands a
more complete understanding of energy storage processes from atomic through micron-length scales. Because these complex processes can change significantly as the system is charged and discharged, researchers have increasingly focused on how to look inside an operating energy storage system. While computational approaches have advanced over the last few decades, the development of experimental approaches has been very challenging, particularly for studying the light elements that are prevalent in energy storage materials.
Recent work by an LLNL-
led team developed a new X-ray adsorption spectroscopy capability that is tightly coupled with a modeling effort to provide key information about how the structure and bonding of graphitic carbon supercapacitor electrodes are affected by polarization of the electrode - electrolyte interfaces during charging.
Graphitic supercapacitors are ideal model systems to probe interfacial phenomena because they are relatively chemically stable, extensively characterized experimentally and theoretically and are interesting technologically. The team used its recently developed 3D nanographene
(3D-NG) bulk electrode material as a model graphitic material.
"Our newly developed X-ray adsorption spectroscopy capability allowed us to detect the complex, electric-field induced changes in electronic structure that graphene-based supercapacitor electrodes undergo during operation. Analysis of these changes provided information on how the structure and bonding of the electrodes evolve during charging and discharging. The integration of unique modeling capabilities for studying the charged electrode-electrolyte interface played a crucial role in our interpretation of the

331www.internationalsugarjournal.com
experimental data," said the lead researcher Jonathan Lee.
Discovering that the electronic structure of graphitic carbon supercapacitor
electrodes can be tailored by charge-induced electrode-electrolyte interactions opens a new window toward more efficient electrochemical
energy storage systems. In addition, the experimental and modeling techniques developed during the research are readily applicable to other
energy storage materials and technologies.
Findings are published in Advanced Materials.
Advances in development of quantum computer – Google shows interest
When scientists develop a full quantum computer, the world of computing will undergo a revolution of sophistication, speed and energy efficiency that will make conventional machines on the market today seem like Stone Age clunkers by comparison.
But, before that happens, quantum physicists like the ones in University of California Santa Barbara's physics professor John Martinis' lab will have to create circuitry that takes advantage of the marvelous computing prowess promised by the quantum bit ("qubit"), while compensating for its high vulnerability to environmentally-induced error.
In what they are calling a major milestone, the researchers in the Martinis Lab have developed quantum circuitry that self-checks for errors and suppresses them, preserving the qubits' state(s) and imbuing the system with the highly sought-after reliability that will prove foundational for the building of large-scale superconducting quantum computers.
It turns out keeping qubits error-free, or stable enough to reproduce the same result time and time again, is one of the major hurdles scientists on the forefront of quantum computing face.
"One of the biggest challenges in quantum computing is that qubits are inherently faulty," said the
researcher Julian Kelly. "So if you store some information in them, they'll forget it."
Unlike classical computing, in which the computer bits exist on one of two binary ("yes/no", or "true/false") positions, qubits can exist at any and all positions simultaneously, in various dimensions. It is this property, called "superpositioning," that gives quantum computers their phenomenal computational power, but it is also this characteristic which makes qubits prone to "flipping," especially when in unstable environments, and thus difficult to work with.
"It's hard to process information if it disappears," said Kelly.
However, that obstacle may just have been cleared by Kelly and fellow researchers Rami Barends, Austin Fowler and others in the Martinis Group.
The error process involves creating a scheme in which several qubits work together to preserve the information, said Kelly. To do this, information is stored across several qubits.
"And the idea is that we build this system of nine qubits, which can then look for errors," he said. Qubits in the grid are responsible for safeguarding the information contained in their neighbors, he explained, in a repetitive error detection and correction system that can protect
the appropriate information and store it longer than any individual qubit can.
"This is the first time a quantum device has been built that is capable of correcting its own errors," said Fowler. For the kind of complex calculations the researchers envision for an actual quantum computer, something up to a hundred million qubits would be needed, but before that a robust self-check and error prevention system is necessary.
Key to this quantum error detection and correction system is a scheme developed by Fowler, called the surface code. It uses parity information -- the measurement of change from the original data (if any) -- as opposed to the duplication of the original information that is part of the process of error detection in classical computing. That way, the actual original information that is being preserved in the qubits remains unobserved.
Why? Because quantum physics.
"You can't measure a quantum state, and expect it to still be quantum," explained Barends. The very act of measurement locks the qubit into a single state and it then loses its superpositioning power, he said. Therefore, in something akin to a Sudoku puzzle, the parity values of data qubits
in a qubit array are taken by adjacent measurement qubits, which essentially assess the information in the data qubits by measuring around them.
"So you pull out just enough information to detect errors, but not enough to peek under the hood and destroy the quantum-ness," said Kelly.
This development represents a meeting of the best in the science behind the physical and the theoretical in quantum computing -- the latest in qubit stabilization and advances in the algorithms behind the logic of quantum computing.
"It's a major milestone," said Barends. "Because it means that the ideas people have had for decades are actually doable in a real system."
The Martinis Group continues to refine its research to develop this important new tool. This particular quantum error correction has been proved to protect against the "bit-flip" error, however the researchers have their eye on correcting the complimentary error called a "phase-flip," as well as running the error correction cycles for longer periods to see what behaviors might emerge.
Martinis and the senior members of his research group have, since this research was performed, entered into a partnership with Google.
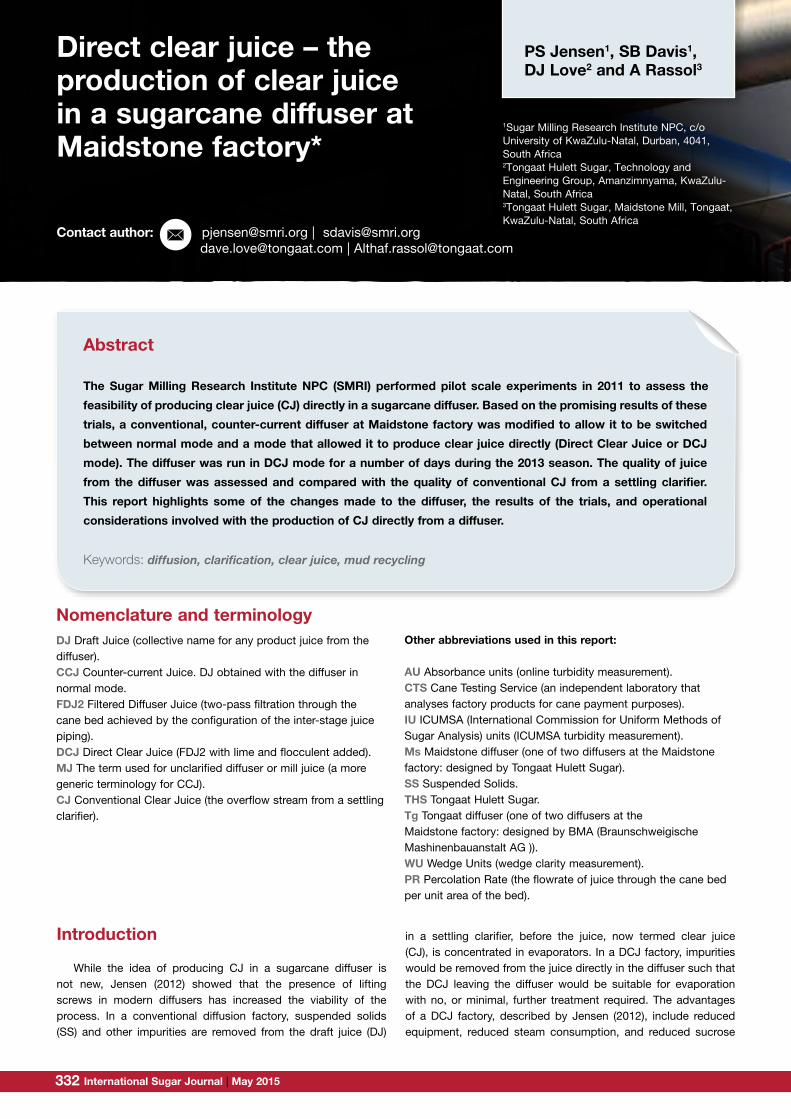
International Sugar Journal | May 2015332 333www.internationalsugarjournal.com
Direct clear juice – the production of clear juice in a sugarcane diffuser at Maidstone factory*
Abstract The Sugar Milling Research Institute NPC (SMRI) performed pilot scale experiments in 2011 to assess the
feasibility of producing clear juice (CJ) directly in a sugarcane diffuser. Based on the promising results of these
trials, a conventional, counter-current diffuser at Maidstone factory was modified to allow it to be switched
between normal mode and a mode that allowed it to produce clear juice directly (Direct Clear Juice or DCJ
mode). The diffuser was run in DCJ mode for a number of days during the 2013 season. The quality of juice
from the diffuser was assessed and compared with the quality of conventional CJ from a settling clarifier.
This report highlights some of the changes made to the diffuser, the results of the trials, and operational
considerations involved with the production of CJ directly from a diffuser.
Keywords: diffusion, clarification, clear juice, mud recycling
1Sugar Milling Research Institute NPC, c/o University of KwaZulu-Natal, Durban, 4041, South Africa2Tongaat Hulett Sugar, Technology and Engineering Group, Amanzimnyama, KwaZulu-Natal, South Africa3Tongaat Hulett Sugar, Maidstone Mill, Tongaat, KwaZulu-Natal, South Africa
PS Jensen1, SB Davis1, DJ Love2 and A Rassol3
Introduction
While the idea of producing CJ in a sugarcane diffuser is not new, Jensen (2012) showed that the presence of lifting screws in modern diffusers has increased the viability of the process. In a conventional diffusion factory, suspended solids (SS) and other impurities are removed from the draft juice (DJ)
in a settling clarifier, before the juice, now termed clear juice (CJ), is concentrated in evaporators. In a DCJ factory, impurities would be removed from the juice directly in the diffuser such that the DCJ leaving the diffuser would be suitable for evaporation with no, or minimal, further treatment required. The advantages of a DCJ factory, described by Jensen (2012), include reduced equipment, reduced steam consumption, and reduced sucrose
Contact author: [email protected] | [email protected] [email protected] | [email protected]
Nomenclature and terminologyDJ Draft Juice (collective name for any product juice from the diffuser).CCJ Counter-current Juice. DJ obtained with the diffuser in normal mode.FDJ2 Filtered Diffuser Juice (two-pass filtration through the cane bed achieved by the configuration of the inter-stage juice piping).DCJ Direct Clear Juice (FDJ2 with lime and flocculent added).MJ The term used for unclarified diffuser or mill juice (a more generic terminology for CCJ).CJ Conventional Clear Juice (the overflow stream from a settling clarifier).
Other abbreviations used in this report:
AU Absorbance units (online turbidity measurement).CTS Cane Testing Service (an independent laboratory that analyses factory products for cane payment purposes).IU ICUMSA (International Commission for Uniform Methods of Sugar Analysis) units (ICUMSA turbidity measurement).Ms Maidstone diffuser (one of two diffusers at the Maidstone factory: designed by Tongaat Hulett Sugar).SS Suspended Solids.THS Tongaat Hulett Sugar.Tg Tongaat diffuser (one of two diffusers at the Maidstone factory: designed by BMA (Braunschweigische Mashinenbauanstalt AG )).WU Wedge Units (wedge clarity measurement).PR Percolation Rate (the flowrate of juice through the cane bed per unit area of the bed).

International Sugar Journal | May 2015332 333www.internationalsugarjournal.com
loss. The Maidstone (Ms) diffuser was modified in 2013 to enable the production of DCJ in the diffuser. As a safety precaution, the clarifiers remained in operation while the trials were in progress. This report highlights some of the changes made to the diffuser, the results of the trials, and operational considerations involved with the production of CJ directly in a diffuser.
Experimental
Maidstone factory has two diffusers: a 6.4 m wide ‘Tongaat (Tg)’ diffuser (BMA design), and a 9 m wide ‘Maidstone (Ms)’ diffuser (THS design). Both diffusers were in operation during the 2013 season. A schematic diagram of Ms diffuser in conventional, counter-current mode, is shown in Figure 1.
Maidstone factory allowed the SMRI to oversee the reconfiguration of their Ms diffuser in order to test the DCJ process. Figure 2 shows the Ms diffuser configured in DCJ mode.
The modifications enabled:• Lime and flocculant to be added directly to the diffuser, thereby facilitating the agglomeration of suspended solids contained within the juice, and raising its pH.• The treated juice to be directed through the cane bed co-currently, thereby removing the agglomerated suspended solids from the juice by filtration through the cane bed itself.• The DJ temperature to be increased from ~70°C for CCJ to ~80°C for DCJ, which facilitates the removal of protein and other organic components from the juice.
At times the diffuser was operated with the
DCJ co-current configuration shown in Figure 2, but without the addition of lime and flocculant. The draft juice from the diffuser in this mode was termed FDJ2.
The initial goal of the trial was to ensure that the reconfiguration did not upset normal factory operations, or increase losses. Only after this goal was achieved could the diffuser be run for extended periods of time in DCJ mode, allowing a comparison between DCJ and conventional CJ.
Methods of assessing juice quality
Sugar quality is the main quality parameter for raw sugar factories. It was not possible to bypass the Maidstone clarifiers when the diffuser was operating in DCJ mode and a comparison of sugars produced from DCJ and CJ was therefore not possible. Instead, it was decided that if the quality of DCJ was similar to
IU ICUMSA (International Commission for Uniform Methods of Sugar Analysis) units (ICUMSA turbidity measurement). Ms Maidstone diffuser (one of two diffusers at the Maidstone factory: designed by
Tongaat Hulett Sugar). SS Suspended Solids. THS Tongaat Hulett Sugar. Tg Tongaat diffuser (one of two diffusers at the Maidstone factory: designed by BMA
(Braunschweigische Mashinenbauanstalt AG )). WU Wedge Units (wedge clarity measurement). PR Percolation Rate (the flowrate of juice through the cane bed per unit area of the bed). Introduction and history While the idea of producing CJ in a sugarcane diffuser is not new, Jensen (2012) showed that the presence of lifting screws in modern diffusers has increased the viability of the process. In a conventional diffusion factory, suspended solids (SS) and other impurities are removed from the draft juice (DJ) in a settling clarifier, before the juice, now termed clear juice (CJ), is concentrated in evaporators. In a DCJ factory, impurities would be removed from the juice directly in the diffuser such that the DCJ leaving the diffuser would be suitable for evaporation with no, or minimal, further treatment required. The advantages of a DCJ factory, described by Jensen (2012), include reduced equipment, reduced steam consumption, and reduced sucrose loss. The Maidstone (Ms) diffuser was modified in 2013 to enable the production of DCJ in the diffuser. As a safety precaution, the clarifiers remained in operation while the trials were in progress. This report highlights some of the changes made to the diffuser, the results of the trials, and operational considerations involved with the production of CJ directly in a diffuser. Experimental Maidstone factory has two diffusers: a 6.4 m wide ‘Tongaat (Tg)’ diffuser (BMA design), and a 9 m wide ‘Maidstone (Ms)’ diffuser (THS design). Both diffusers were in operation during the 2013 season. A schematic diagram of Ms diffuser in conventional, counter-current mode, is shown in Figure 1.
Figure 1. Schematic diagramme of Maidstone diffuser in counter-current mode. Maidstone factory allowed the SMRI to oversee the reconfiguration of their Ms diffuser in order to test the DCJ process. Figure 2 shows the Ms diffuser configured in DCJ mode.
Figure 2. Schematic diagramme of Maidstone diffuser in DCJ mode. The modifications enabled: • Lime and flocculant to be added directly to the diffuser, thereby facilitating the
agglomeration of suspended solids contained within the juice, and raising its pH. • The treated juice to be directed through the cane bed co-currently, thereby removing the
agglomerated suspended solids from the juice by filtration through the cane bed itself. • The DJ temperature to be increased from ~70°C for CCJ to ~80°C for DCJ, which
facilitates the removal of protein and other organic components from the juice. At times the diffuser was operated with the DCJ co-current configuration shown in Figure 2, but without the addition of lime and flocculant. The draft juice from the diffuser in this mode was termed FDJ2. The initial goal of the trial was to ensure that the reconfiguration did not upset normal factory operations, or increase losses. Only after this goal was achieved could the diffuser be run for extended periods of time in DCJ mode, allowing a comparison between DCJ and conventional CJ. Methods of assessing juice quality Sugar quality is the main quality parameter for raw sugar factories. It was not possible to bypass the Maidstone clarifiers when the diffuser was operating in DCJ mode and a comparison of sugars produced from DCJ and CJ was therefore not possible. Instead, it was decided that if the quality of DCJ was similar to that of conventional CJ, then the effect on sugar quality was likely to be negligible. Draft juice contains impurities of differing size and nature, as described in Table 1.
Figure 1. Schematic diagramme of Maidstone diffuser in counter-current mode
Figure 2. Schematic diagramme of Maidstone diffuser in DCJ mode
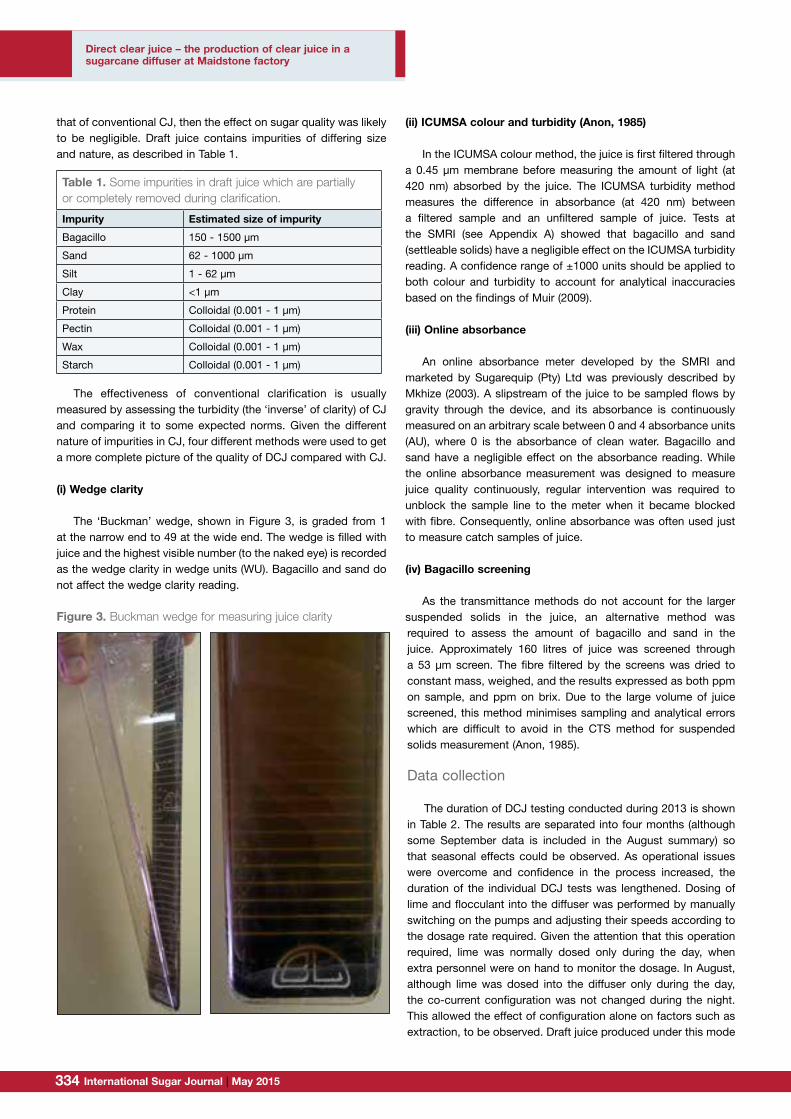
International Sugar Journal | May 2015334 335www.internationalsugarjournal.com
that of conventional CJ, then the effect on sugar quality was likely to be negligible. Draft juice contains impurities of differing size and nature, as described in Table 1.
The effectiveness of conventional clarification is usually measured by assessing the turbidity (the ‘inverse’ of clarity) of CJ and comparing it to some expected norms. Given the different nature of impurities in CJ, four different methods were used to get a more complete picture of the quality of DCJ compared with CJ.
(i) Wedge clarity
The ‘Buckman’ wedge, shown in Figure 3, is graded from 1 at the narrow end to 49 at the wide end. The wedge is filled with juice and the highest visible number (to the naked eye) is recorded as the wedge clarity in wedge units (WU). Bagacillo and sand do not affect the wedge clarity reading.
(ii) ICUMSA colour and turbidity (Anon, 1985)
In the ICUMSA colour method, the juice is first filtered through a 0.45 μm membrane before measuring the amount of light (at 420 nm) absorbed by the juice. The ICUMSA turbidity method measures the difference in absorbance (at 420 nm) between a filtered sample and an unfiltered sample of juice. Tests at the SMRI (see Appendix A) showed that bagacillo and sand (settleable solids) have a negligible effect on the ICUMSA turbidity reading. A confidence range of ±1000 units should be applied to both colour and turbidity to account for analytical inaccuracies based on the findings of Muir (2009).
(iii) Online absorbance
An online absorbance meter developed by the SMRI and marketed by Sugarequip (Pty) Ltd was previously described by Mkhize (2003). A slipstream of the juice to be sampled flows by gravity through the device, and its absorbance is continuously measured on an arbitrary scale between 0 and 4 absorbance units (AU), where 0 is the absorbance of clean water. Bagacillo and sand have a negligible effect on the absorbance reading. While the online absorbance measurement was designed to measure juice quality continuously, regular intervention was required to unblock the sample line to the meter when it became blocked with fibre. Consequently, online absorbance was often used just to measure catch samples of juice.
(iv) Bagacillo screening
As the transmittance methods do not account for the larger suspended solids in the juice, an alternative method was required to assess the amount of bagacillo and sand in the juice. Approximately 160 litres of juice was screened through a 53 μm screen. The fibre filtered by the screens was dried to constant mass, weighed, and the results expressed as both ppm on sample, and ppm on brix. Due to the large volume of juice screened, this method minimises sampling and analytical errors which are difficult to avoid in the CTS method for suspended solids measurement (Anon, 1985).
Data collection
The duration of DCJ testing conducted during 2013 is shown in Table 2. The results are separated into four months (although some September data is included in the August summary) so that seasonal effects could be observed. As operational issues were overcome and confidence in the process increased, the duration of the individual DCJ tests was lengthened. Dosing of lime and flocculant into the diffuser was performed by manually switching on the pumps and adjusting their speeds according to the dosage rate required. Given the attention that this operation required, lime was normally dosed only during the day, when extra personnel were on hand to monitor the dosage. In August, although lime was dosed into the diffuser only during the day, the co-current configuration was not changed during the night. This allowed the effect of configuration alone on factors such as extraction, to be observed. Draft juice produced under this mode
Direct clear juice – the production of clear juice in a sugarcane diffuser at Maidstone factory
Table 1. Some impurities in draft juice which are partiallyor completely removed during clarification.
Impurity Estimated size of impurity
Bagacillo 150 - 1500 μm
Sand 62 - 1000 μm
Silt 1 - 62 μm
Clay <1 μm
Protein Colloidal (0.001 - 1 μm)
Pectin Colloidal (0.001 - 1 μm)
Wax Colloidal (0.001 - 1 μm)
Starch Colloidal (0.001 - 1 μm)
Table 1. Some impurities in draft juice which are partially or completely removed during clarification.
Impurity Estimated size of impurity Bagacillo 150 - 1500 µm Sand 62 - 1000 µm Silt 1 - 62 µm Clay <1 µm Protein Colloidal (0.001 - 1 µm) Pectin Colloidal (0.001 - 1 µm) Wax Colloidal (0.001 - 1 µm) Starch Colloidal (0.001 - 1 µm)
The effectiveness of conventional clarification is usually measured by assessing the turbidity (the ‘inverse’ of clarity) of CJ and comparing it to some expected norms. Given the different nature of impurities in CJ, four different methods were used to get a more complete picture of the quality of DCJ compared with CJ. (i) Wedge clarity The ‘Buckman’ wedge, shown in Figure 3, is graded from 1 at the narrow end to 49 at the wide end. The wedge is filled with juice and the highest visible number (to the naked eye) is recorded as the wedge clarity in wedge units (WU). Bagacillo and sand do not affect the wedge clarity reading.
Figure 3. Buckman wedge for measuring juice clarity. (ii) ICUMSA colour and turbidity (Anon, 1985) In the ICUMSA colour method, the juice is first filtered through a 0.45 µm membrane before measuring the amount of light (at 420 nm) absorbed by the juice. The ICUMSA turbidity method measures the difference in absorbance (at 420 nm) between a filtered sample and an unfiltered sample of juice. Tests at the SMRI (see Appendix A) showed that bagacillo and sand (settleable solids) have a negligible effect on the ICUMSA turbidity reading. A confidence range of ±1000 units should be applied to both colour and turbidity to account for analytical inaccuracies based on the findings of Muir (2009).
Figure 3. Buckman wedge for measuring juice clarity
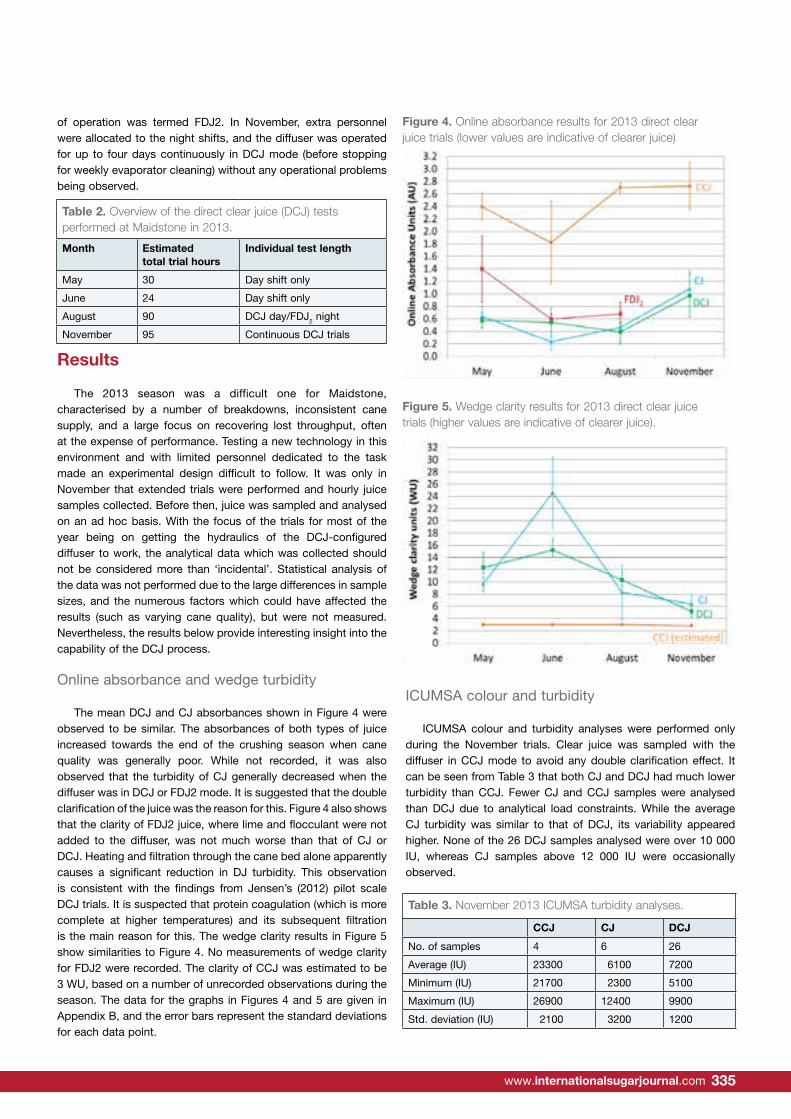
International Sugar Journal | May 2015334 335www.internationalsugarjournal.com
of operation was termed FDJ2. In November, extra personnel were allocated to the night shifts, and the diffuser was operated for up to four days continuously in DCJ mode (before stopping for weekly evaporator cleaning) without any operational problems being observed.
Results
The 2013 season was a difficult one for Maidstone, characterised by a number of breakdowns, inconsistent cane supply, and a large focus on recovering lost throughput, often at the expense of performance. Testing a new technology in this environment and with limited personnel dedicated to the task made an experimental design difficult to follow. It was only in November that extended trials were performed and hourly juice samples collected. Before then, juice was sampled and analysed on an ad hoc basis. With the focus of the trials for most of the year being on getting the hydraulics of the DCJ-configured diffuser to work, the analytical data which was collected should not be considered more than ‘incidental’. Statistical analysis of the data was not performed due to the large differences in sample sizes, and the numerous factors which could have affected the results (such as varying cane quality), but were not measured. Nevertheless, the results below provide interesting insight into the capability of the DCJ process.
Online absorbance and wedge turbidity
The mean DCJ and CJ absorbances shown in Figure 4 were observed to be similar. The absorbances of both types of juice increased towards the end of the crushing season when cane quality was generally poor. While not recorded, it was also observed that the turbidity of CJ generally decreased when the diffuser was in DCJ or FDJ2 mode. It is suggested that the double clarification of the juice was the reason for this. Figure 4 also shows that the clarity of FDJ2 juice, where lime and flocculant were not added to the diffuser, was not much worse than that of CJ or DCJ. Heating and filtration through the cane bed alone apparently causes a significant reduction in DJ turbidity. This observation is consistent with the findings from Jensen’s (2012) pilot scale DCJ trials. It is suspected that protein coagulation (which is more complete at higher temperatures) and its subsequent filtration is the main reason for this. The wedge clarity results in Figure 5 show similarities to Figure 4. No measurements of wedge clarity for FDJ2 were recorded. The clarity of CCJ was estimated to be 3 WU, based on a number of unrecorded observations during the season. The data for the graphs in Figures 4 and 5 are given in Appendix B, and the error bars represent the standard deviations for each data point.
ICUMSA colour and turbidity
ICUMSA colour and turbidity analyses were performed only during the November trials. Clear juice was sampled with the diffuser in CCJ mode to avoid any double clarification effect. It can be seen from Table 3 that both CJ and DCJ had much lower turbidity than CCJ. Fewer CJ and CCJ samples were analysed than DCJ due to analytical load constraints. While the average CJ turbidity was similar to that of DCJ, its variability appeared higher. None of the 26 DCJ samples analysed were over 10 000 IU, whereas CJ samples above 12 000 IU were occasionally observed.
Table 2. Overview of the direct clear juice (DCJ) testsperformed at Maidstone in 2013.
Month Estimatedtotal trial hours
Individual test length
May 30 Day shift only
June 24 Day shift only
August 90 DCJ day/FDJ2 night
November 95 Continuous DCJ trials
limited personnel dedicated to the task made an experimental design difficult to follow. It was only in November that extended trials were performed and hourly juice samples collected. Before then, juice was sampled and analysed on an ad hoc basis. With the focus of the trials for most of the year being on getting the hydraulics of the DCJ-configured diffuser to work, the analytical data which was collected should not be considered more than ‘incidental’. Statistical analysis of the data was not performed due to the large differences in sample sizes, and the numerous factors which could have affected the results (such as varying cane quality), but were not measured. Nevertheless, the results below provide interesting insight into the capability of the DCJ process. Online absorbance and wedge turbidity The mean DCJ and CJ absorbances shown in Figure 4 were observed to be similar. The absorbances of both types of juice increased towards the end of the crushing season when cane quality was generally poor. While not recorded, it was also observed that the turbidity of CJ generally decreased when the diffuser was in DCJ or FDJ2 mode. It is suggested that the double clarification of the juice was the reason for this. Figure 4 also shows that the clarity of FDJ2 juice, where lime and flocculant were not added to the diffuser, was not much worse than that of CJ or DCJ. Heating and filtration through the cane bed alone apparently causes a significant reduction in DJ turbidity. This observation is consistent with the findings from Jensen’s (2012) pilot scale DCJ trials. It is suspected that protein coagulation (which is more complete at higher temperatures) and its subsequent filtration is the main reason for this. The wedge clarity results in Figure 5 show similarities to Figure 4. No measurements of wedge clarity for FDJ2 were recorded. The clarity of CCJ was estimated to be 3 WU, based on a number of unrecorded observations during the season. The data for the graphs in Figures 4 and 5 are given in Appendix B, and the error bars represent the standard deviations for each data point.
Figure 4. Online absorbance results for 2013 direct clear juice trials (lower values are indicative of clearer juice).
Figure 5. Wedge clarity results for 2013 direct clear juice trials (higher values are indicative of clearer juice). ICUMSA colour and turbidity ICUMSA colour and turbidity analyses were performed only during the November trials. Clear juice was sampled with the diffuser in CCJ mode to avoid any double clarification effect. It can be seen from Table 3 that both CJ and DCJ had much lower turbidity than CCJ. Fewer CJ and CCJ samples were analysed than DCJ due to analytical load constraints. While the average CJ turbidity was similar to that of DCJ, its variability appeared higher. None of the 26 DCJ samples analysed were over 10 000 IU, whereas CJ samples above 12 000 IU were occasionally observed. Table 3. November 2013 ICUMSA turbidity analyses.
CCJ CJ DCJ No. of samples 4 6 26 Average (IU) 23300 6100 7200 Minimum (IU) 21700 2300 5100 Maximum (IU) 26900 12400 9900 Std. deviation (IU) 2100 3200 1200
Table 4 shows that the ICUMSA colours of CJ and DCJ were similar, and about 14% higher than the CCJ colour. The increase in colour was expected as a result of lime addition to the juice. It is expected that automated lime dosing, which should avoid the higher pH peaks periodically encountered with manual liming, would reduce the formation of colour in DCJ. A more detailed study, taking into account cane quality, is required to gain more insight into the formation of colour during the DCJ process. Table 4. November 2013 ICUMSA colour analyses.
CCJ CJ DCJ No. of samples 4 6 26 Average (IU) 24200 27700 27100 Minimum (IU) 22500 26400 22500 Maximum (IU) 25500 28900 29400 Std. deviation (IU) 1200 800 1500
Figure 4. Online absorbance results for 2013 direct clear juice trials (lower values are indicative of clearer juice)
Figure 5. Wedge clarity results for 2013 direct clear juice trials (higher values are indicative of clearer juice).
Table 3. November 2013 ICUMSA turbidity analyses.
CCJ CJ DCJ
No. of samples 4 6 26
Average (IU) 23300 6100 7200
Minimum (IU) 21700 2300 5100
Maximum (IU) 26900 12400 9900
Std. deviation (IU) 2100 3200 1200
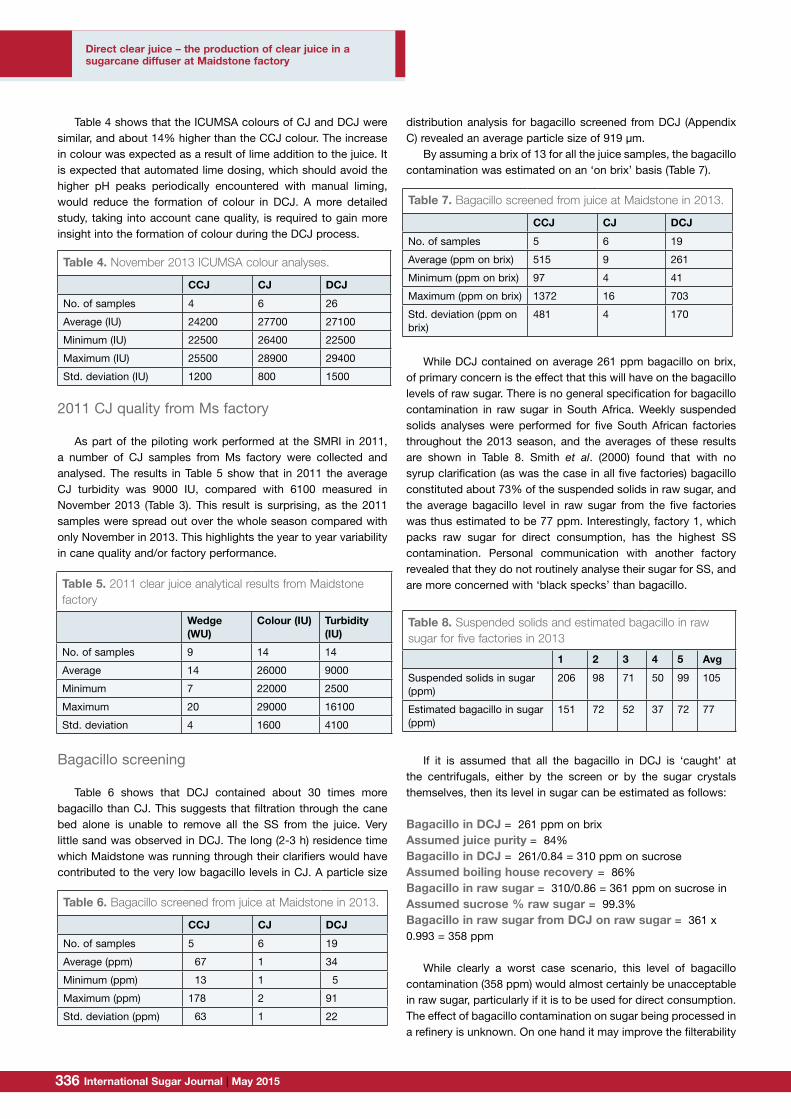
International Sugar Journal | May 2015336 337www.internationalsugarjournal.com
Table 4 shows that the ICUMSA colours of CJ and DCJ were similar, and about 14% higher than the CCJ colour. The increase in colour was expected as a result of lime addition to the juice. It is expected that automated lime dosing, which should avoid the higher pH peaks periodically encountered with manual liming, would reduce the formation of colour in DCJ. A more detailed study, taking into account cane quality, is required to gain more insight into the formation of colour during the DCJ process.
2011 CJ quality from Ms factory
As part of the piloting work performed at the SMRI in 2011, a number of CJ samples from Ms factory were collected and analysed. The results in Table 5 show that in 2011 the average CJ turbidity was 9000 IU, compared with 6100 measured in November 2013 (Table 3). This result is surprising, as the 2011 samples were spread out over the whole season compared with only November in 2013. This highlights the year to year variability in cane quality and/or factory performance.
Bagacillo screening
Table 6 shows that DCJ contained about 30 times more bagacillo than CJ. This suggests that filtration through the cane bed alone is unable to remove all the SS from the juice. Very little sand was observed in DCJ. The long (2-3 h) residence time which Maidstone was running through their clarifiers would have contributed to the very low bagacillo levels in CJ. A particle size
distribution analysis for bagacillo screened from DCJ (Appendix C) revealed an average particle size of 919 μm.
By assuming a brix of 13 for all the juice samples, the bagacillo contamination was estimated on an ‘on brix’ basis (Table 7).
While DCJ contained on average 261 ppm bagacillo on brix, of primary concern is the effect that this will have on the bagacillo levels of raw sugar. There is no general specification for bagacillo contamination in raw sugar in South Africa. Weekly suspended solids analyses were performed for five South African factories throughout the 2013 season, and the averages of these results are shown in Table 8. Smith et al. (2000) found that with no syrup clarification (as was the case in all five factories) bagacillo constituted about 73% of the suspended solids in raw sugar, and the average bagacillo level in raw sugar from the five factories was thus estimated to be 77 ppm. Interestingly, factory 1, which packs raw sugar for direct consumption, has the highest SS contamination. Personal communication with another factory revealed that they do not routinely analyse their sugar for SS, and are more concerned with ‘black specks’ than bagacillo.
If it is assumed that all the bagacillo in DCJ is ‘caught’ at the centrifugals, either by the screen or by the sugar crystals themselves, then its level in sugar can be estimated as follows:
Bagacillo in DCJ = 261 ppm on brixAssumed juice purity = 84%Bagacillo in DCJ = 261/0.84 = 310 ppm on sucroseAssumed boiling house recovery = 86%Bagacillo in raw sugar = 310/0.86 = 361 ppm on sucrose in Assumed sucrose % raw sugar = 99.3%Bagacillo in raw sugar from DCJ on raw sugar = 361 x 0.993 = 358 ppm
While clearly a worst case scenario, this level of bagacillo contamination (358 ppm) would almost certainly be unacceptable in raw sugar, particularly if it is to be used for direct consumption. The effect of bagacillo contamination on sugar being processed in a refinery is unknown. On one hand it may improve the filterability
Table 4. November 2013 ICUMSA colour analyses.
CCJ CJ DCJ
No. of samples 4 6 26
Average (IU) 24200 27700 27100
Minimum (IU) 22500 26400 22500
Maximum (IU) 25500 28900 29400
Std. deviation (IU) 1200 800 1500
Table 5. 2011 clear juice analytical results from Maidstone factory
Wedge (WU)
Colour (IU) Turbidity (IU)
No. of samples 9 14 14
Average 14 26000 9000
Minimum 7 22000 2500
Maximum 20 29000 16100
Std. deviation 4 1600 4100
Table 6. Bagacillo screened from juice at Maidstone in 2013.
CCJ CJ DCJ
No. of samples 5 6 19
Average (ppm) 67 1 34
Minimum (ppm) 13 1 5
Maximum (ppm) 178 2 91
Std. deviation (ppm) 63 1 22
Table 7. Bagacillo screened from juice at Maidstone in 2013.
CCJ CJ DCJ
No. of samples 5 6 19
Average (ppm on brix) 515 9 261
Minimum (ppm on brix) 97 4 41
Maximum (ppm on brix) 1372 16 703
Std. deviation (ppm on brix)
481 4 170
Table 8. Suspended solids and estimated bagacillo in raw sugar for five factories in 2013
1 2 3 4 5 Avg
Suspended solids in sugar (ppm)
206 98 71 50 99 105
Estimated bagacillo in sugar (ppm)
151 72 52 37 72 77
Direct clear juice – the production of clear juice in a sugarcane diffuser at Maidstone factory
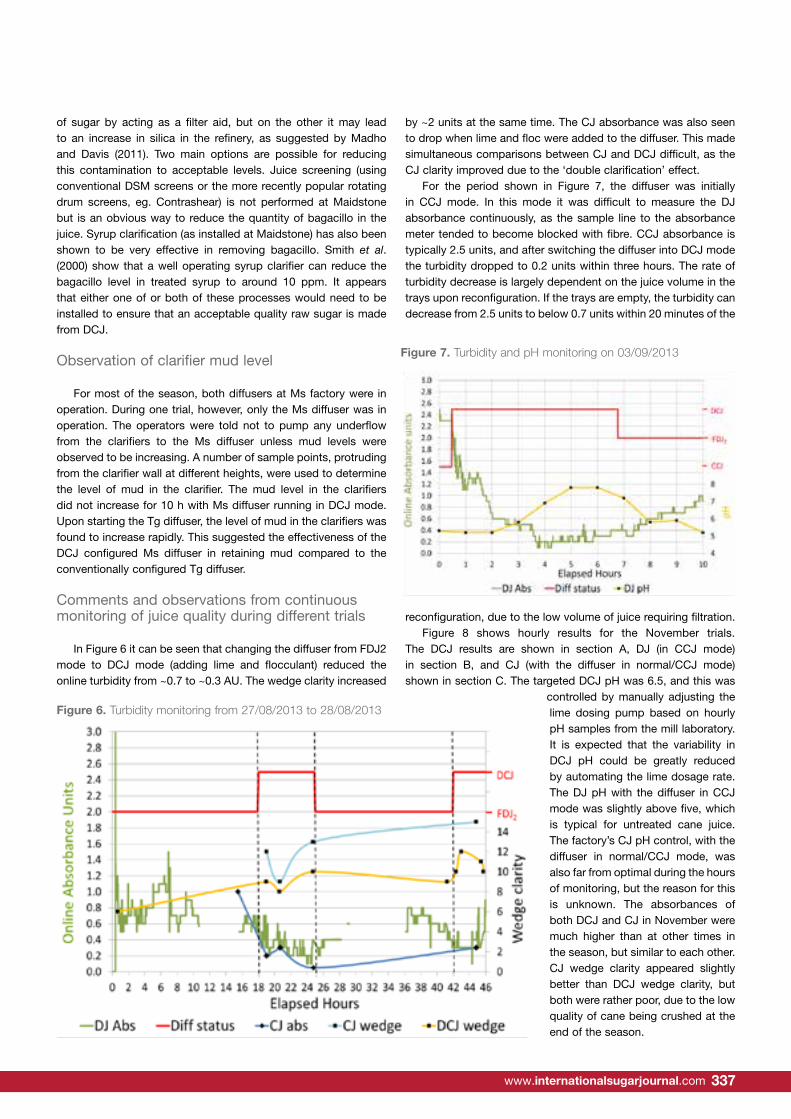
International Sugar Journal | May 2015336 337www.internationalsugarjournal.com
of sugar by acting as a filter aid, but on the other it may lead to an increase in silica in the refinery, as suggested by Madho and Davis (2011). Two main options are possible for reducing this contamination to acceptable levels. Juice screening (using conventional DSM screens or the more recently popular rotating drum screens, eg. Contrashear) is not performed at Maidstone but is an obvious way to reduce the quantity of bagacillo in the juice. Syrup clarification (as installed at Maidstone) has also been shown to be very effective in removing bagacillo. Smith et al. (2000) show that a well operating syrup clarifier can reduce the bagacillo level in treated syrup to around 10 ppm. It appears that either one of or both of these processes would need to be installed to ensure that an acceptable quality raw sugar is made from DCJ.
Observation of clarifier mud level
For most of the season, both diffusers at Ms factory were in operation. During one trial, however, only the Ms diffuser was in operation. The operators were told not to pump any underflow from the clarifiers to the Ms diffuser unless mud levels were observed to be increasing. A number of sample points, protruding from the clarifier wall at different heights, were used to determine the level of mud in the clarifier. The mud level in the clarifiers did not increase for 10 h with Ms diffuser running in DCJ mode. Upon starting the Tg diffuser, the level of mud in the clarifiers was found to increase rapidly. This suggested the effectiveness of the DCJ configured Ms diffuser in retaining mud compared to the conventionally configured Tg diffuser.
Comments and observations from continuous monitoring of juice quality during different trials
In Figure 6 it can be seen that changing the diffuser from FDJ2 mode to DCJ mode (adding lime and flocculant) reduced the online turbidity from ~0.7 to ~0.3 AU. The wedge clarity increased
by ~2 units at the same time. The CJ absorbance was also seen to drop when lime and floc were added to the diffuser. This made simultaneous comparisons between CJ and DCJ difficult, as the CJ clarity improved due to the ‘double clarification’ effect.
For the period shown in Figure 7, the diffuser was initially in CCJ mode. In this mode it was difficult to measure the DJ absorbance continuously, as the sample line to the absorbance meter tended to become blocked with fibre. CCJ absorbance is typically 2.5 units, and after switching the diffuser into DCJ mode the turbidity dropped to 0.2 units within three hours. The rate of turbidity decrease is largely dependent on the juice volume in the trays upon reconfiguration. If the trays are empty, the turbidity can decrease from 2.5 units to below 0.7 units within 20 minutes of the
reconfiguration, due to the low volume of juice requiring filtration.Figure 8 shows hourly results for the November trials.
The DCJ results are shown in section A, DJ (in CCJ mode) in section B, and CJ (with the diffuser in normal/CCJ mode) shown in section C. The targeted DCJ pH was 6.5, and this was
controlled by manually adjusting the lime dosing pump based on hourly pH samples from the mill laboratory. It is expected that the variability in DCJ pH could be greatly reduced by automating the lime dosage rate. The DJ pH with the diffuser in CCJ mode was slightly above five, which is typical for untreated cane juice. The factory’s CJ pH control, with the diffuser in normal/CCJ mode, was also far from optimal during the hours of monitoring, but the reason for this is unknown. The absorbances of both DCJ and CJ in November were much higher than at other times in the season, but similar to each other. CJ wedge clarity appeared slightly better than DCJ wedge clarity, but both were rather poor, due to the low quality of cane being crushed at the end of the season.
Comments and observations from continuous monitoring of juice quality during different trials In Figure 6 it can be seen that changing the diffuser from FDJ2 mode to DCJ mode (adding lime and flocculant) reduced the online turbidity from ~0.7 to ~0.3 AU. The wedge clarity increased by ~2 units at the same time. The CJ absorbance was also seen to drop when lime and floc were added to the diffuser. This made simultaneous comparisons between CJ and DCJ difficult, as the CJ clarity improved due to the ‘double clarification’ effect.
Figure 6. Turbidity monitoring from 27/08/2013 to 28/08/2013. For the period shown in Figure 7, the diffuser was initially in CCJ mode. In this mode it was difficult to measure the DJ absorbance continuously, as the sample line to the absorbance meter tended to become blocked with fibre. CCJ absorbance is typically 2.5 units, and after switching the diffuser into DCJ mode the turbidity dropped to 0.2 units within three hours. The rate of turbidity decrease is largely dependent on the juice volume in the trays upon reconfiguration. If the trays are empty, the turbidity can decrease from 2.5 units to below 0.7 units within 20 minutes of the reconfiguration, due to the low volume of juice requiring filtration.
Figure 7. Turbidity and pH monitoring on 03/09/2013.
Figure 6. Turbidity monitoring from 27/08/2013 to 28/08/2013
Figure 7. Turbidity and pH monitoring on 03/09/2013
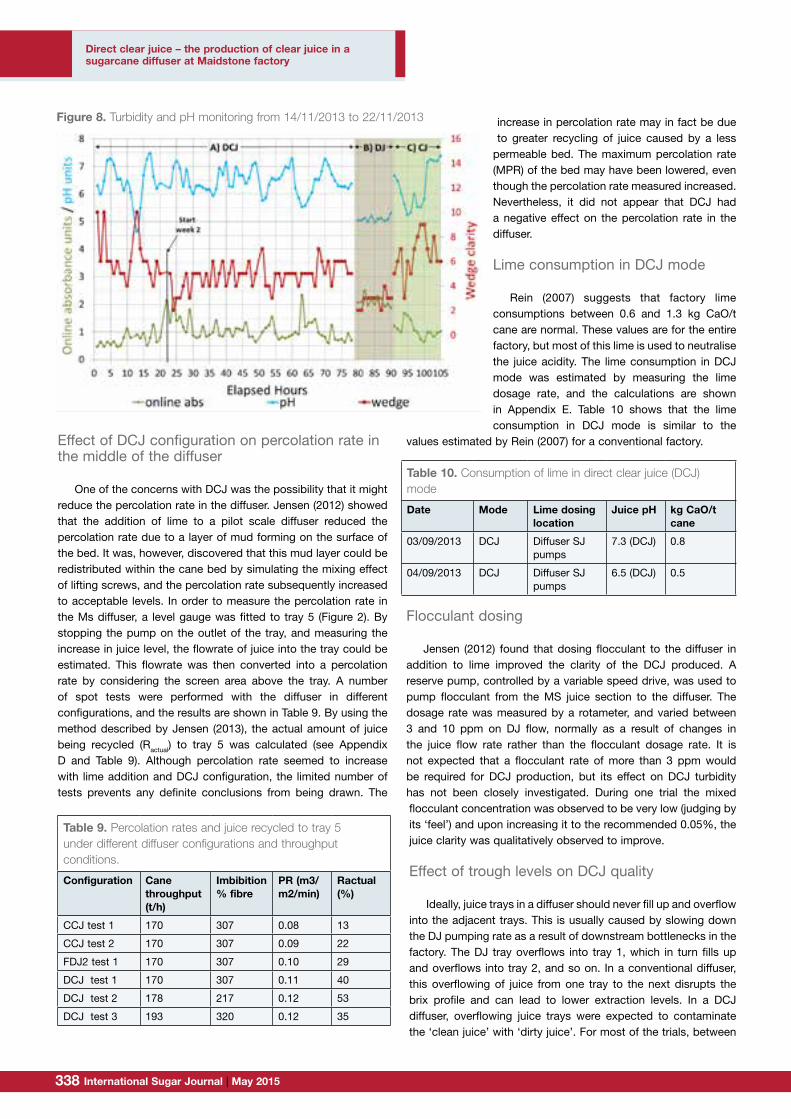
International Sugar Journal | May 2015338 339www.internationalsugarjournal.com
Effect of DCJ configuration on percolation rate in the middle of the diffuser
One of the concerns with DCJ was the possibility that it might reduce the percolation rate in the diffuser. Jensen (2012) showed that the addition of lime to a pilot scale diffuser reduced the percolation rate due to a layer of mud forming on the surface of the bed. It was, however, discovered that this mud layer could be redistributed within the cane bed by simulating the mixing effect of lifting screws, and the percolation rate subsequently increased to acceptable levels. In order to measure the percolation rate in the Ms diffuser, a level gauge was fitted to tray 5 (Figure 2). By stopping the pump on the outlet of the tray, and measuring the increase in juice level, the flowrate of juice into the tray could be estimated. This flowrate was then converted into a percolation rate by considering the screen area above the tray. A number of spot tests were performed with the diffuser in different configurations, and the results are shown in Table 9. By using the method described by Jensen (2013), the actual amount of juice being recycled (Ractual) to tray 5 was calculated (see Appendix D and Table 9). Although percolation rate seemed to increase with lime addition and DCJ configuration, the limited number of tests prevents any definite conclusions from being drawn. The
increase in percolation rate may in fact be due to greater recycling of juice caused by a less
permeable bed. The maximum percolation rate (MPR) of the bed may have been lowered, even though the percolation rate measured increased. Nevertheless, it did not appear that DCJ had a negative effect on the percolation rate in the diffuser.
Lime consumption in DCJ mode
Rein (2007) suggests that factory lime consumptions between 0.6 and 1.3 kg CaO/t cane are normal. These values are for the entire factory, but most of this lime is used to neutralise the juice acidity. The lime consumption in DCJ mode was estimated by measuring the lime dosage rate, and the calculations are shown in Appendix E. Table 10 shows that the lime consumption in DCJ mode is similar to the
values estimated by Rein (2007) for a conventional factory.
Flocculant dosing
Jensen (2012) found that dosing flocculant to the diffuser in addition to lime improved the clarity of the DCJ produced. A reserve pump, controlled by a variable speed drive, was used to pump flocculant from the MS juice section to the diffuser. The dosage rate was measured by a rotameter, and varied between 3 and 10 ppm on DJ flow, normally as a result of changes in the juice flow rate rather than the flocculant dosage rate. It is not expected that a flocculant rate of more than 3 ppm would be required for DCJ production, but its effect on DCJ turbidity has not been closely investigated. During one trial the mixed flocculant concentration was observed to be very low (judging by its ‘feel’) and upon increasing it to the recommended 0.05%, the juice clarity was qualitatively observed to improve.
Effect of trough levels on DCJ quality
Ideally, juice trays in a diffuser should never fill up and overflow into the adjacent trays. This is usually caused by slowing down the DJ pumping rate as a result of downstream bottlenecks in the factory. The DJ tray overflows into tray 1, which in turn fills up and overflows into tray 2, and so on. In a conventional diffuser, this overflowing of juice from one tray to the next disrupts the brix profile and can lead to lower extraction levels. In a DCJ diffuser, overflowing juice trays were expected to contaminate the ‘clean juice’ with ‘dirty juice’. For most of the trials, between
Figure 8 shows hourly results for the November trials. The DCJ results are shown in section A, DJ (in CCJ mode) in section B, and CJ (with the diffuser in normal/CCJ mode) shown in section C. The targeted DCJ pH was 6.5, and this was controlled by manually adjusting the lime dosing pump based on hourly pH samples from the mill laboratory. It is expected that the variability in DCJ pH could be greatly reduced by automating the lime dosage rate. The DJ pH with the diffuser in CCJ mode was slightly above five, which is typical for untreated cane juice. The factory’s CJ pH control, with the diffuser in normal/CCJ mode, was also far from optimal during the hours of monitoring, but the reason for this is unknown. The absorbances of both DCJ and CJ in November were much higher than at other times in the season, but similar to each other. CJ wedge clarity appeared slightly better than DCJ wedge clarity, but both were rather poor, due to the low quality of cane being crushed at the end of the season.
Figure 8: Turbidity and pH monitoring from 14/11/2013 to 22/11/2013. Effect of DCJ configuration on percolation rate in the middle of the diffuser One of the concerns with DCJ was the possibility that it might reduce the percolation rate in the diffuser. Jensen (2012) showed that the addition of lime to a pilot scale diffuser reduced the percolation rate due to a layer of mud forming on the surface of the bed. It was, however, discovered that this mud layer could be redistributed within the cane bed by simulating the mixing effect of lifting screws, and the percolation rate subsequently increased to acceptable levels. In order to measure the percolation rate in the Ms diffuser, a level gauge was fitted to tray 5 (Figure 2). By stopping the pump on the outlet of the tray, and measuring the increase in juice level, the flowrate of juice into the tray could be estimated. This flowrate was then converted into a percolation rate by considering the screen area above the tray. A number of spot tests were performed with the diffuser in different configurations, and the results are shown in Table 9. By using the method described by Jensen (2013), the actual amount of juice being recycled (Ractual) to tray 5 was calculated (see Appendix D and Table 9). Although percolation rate seemed to increase with lime addition and DCJ configuration, the limited number of tests prevents any definite conclusions from being drawn. The increase in percolation rate may in fact be due to greater recycling of juice caused by a less permeable bed. The maximum percolation rate (MPR) of the bed may have been lowered, even though
Figure 8. Turbidity and pH monitoring from 14/11/2013 to 22/11/2013
Table 9. Percolation rates and juice recycled to tray 5under different diffuser configurations and throughput conditions.
Configuration Cane throughput (t/h)
Imbibition % fibre
PR (m3/m2/min)
Ractual(%)
CCJ test 1 170 307 0.08 13
CCJ test 2 170 307 0.09 22
FDJ2 test 1 170 307 0.10 29
DCJ test 1 170 307 0.11 40
DCJ test 2 178 217 0.12 53
DCJ test 3 193 320 0.12 35
Table 10. Consumption of lime in direct clear juice (DCJ) mode
Date Mode Lime dosing location
Juice pH kg CaO/t cane
03/09/2013 DCJ Diffuser SJ pumps
7.3 (DCJ) 0.8
04/09/2013 DCJ Diffuser SJ pumps
6.5 (DCJ) 0.5
Direct clear juice – the production of clear juice in a sugarcane diffuser at Maidstone factory
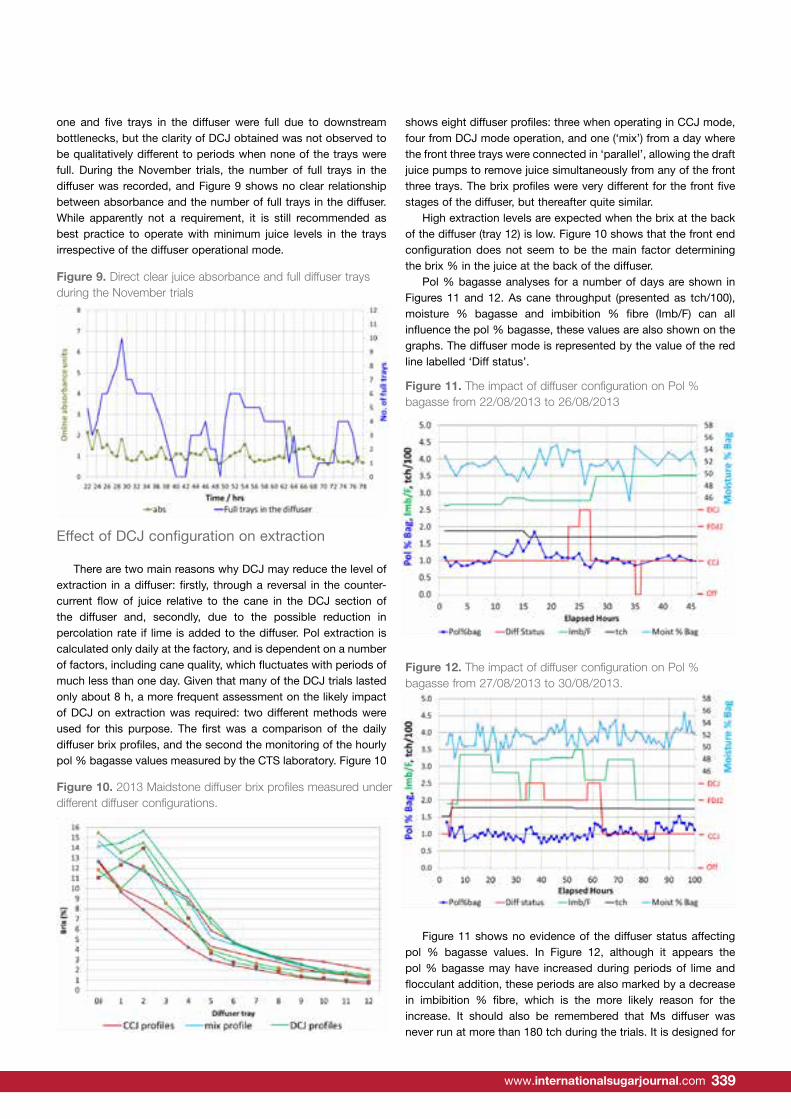
International Sugar Journal | May 2015338 339www.internationalsugarjournal.com
one and five trays in the diffuser were full due to downstream bottlenecks, but the clarity of DCJ obtained was not observed to be qualitatively different to periods when none of the trays were full. During the November trials, the number of full trays in the diffuser was recorded, and Figure 9 shows no clear relationship between absorbance and the number of full trays in the diffuser. While apparently not a requirement, it is still recommended as best practice to operate with minimum juice levels in the trays irrespective of the diffuser operational mode.
Effect of DCJ configuration on extraction
There are two main reasons why DCJ may reduce the level of extraction in a diffuser: firstly, through a reversal in the counter-current flow of juice relative to the cane in the DCJ section of the diffuser and, secondly, due to the possible reduction in percolation rate if lime is added to the diffuser. Pol extraction is calculated only daily at the factory, and is dependent on a number of factors, including cane quality, which fluctuates with periods of much less than one day. Given that many of the DCJ trials lasted only about 8 h, a more frequent assessment on the likely impact of DCJ on extraction was required: two different methods were used for this purpose. The first was a comparison of the daily diffuser brix profiles, and the second the monitoring of the hourly pol % bagasse values measured by the CTS laboratory. Figure 10
shows eight diffuser profiles: three when operating in CCJ mode, four from DCJ mode operation, and one (‘mix’) from a day where the front three trays were connected in ‘parallel’, allowing the draft juice pumps to remove juice simultaneously from any of the front three trays. The brix profiles were very different for the front five stages of the diffuser, but thereafter quite similar.
High extraction levels are expected when the brix at the back of the diffuser (tray 12) is low. Figure 10 shows that the front end configuration does not seem to be the main factor determining the brix % in the juice at the back of the diffuser.
Pol % bagasse analyses for a number of days are shown in Figures 11 and 12. As cane throughput (presented as tch/100), moisture % bagasse and imbibition % fibre (Imb/F) can all influence the pol % bagasse, these values are also shown on the graphs. The diffuser mode is represented by the value of the red line labelled ‘Diff status’.
Figure 11 shows no evidence of the diffuser status affecting pol % bagasse values. In Figure 12, although it appears the pol % bagasse may have increased during periods of lime and flocculant addition, these periods are also marked by a decrease in imbibition % fibre, which is the more likely reason for the increase. It should also be remembered that Ms diffuser was never run at more than 180 tch during the trials. It is designed for
next disrupts the brix profile and can lead to lower extraction levels. In a DCJ diffuser, overflowing juice trays were expected to contaminate the ‘clean juice’ with ‘dirty juice’. For most of the trials, between one and five trays in the diffuser were full due to downstream bottlenecks, but the clarity of DCJ obtained was not observed to be qualitatively different to periods when none of the trays were full. During the November trials, the number of full trays in the diffuser was recorded, and Figure 9 shows no clear relationship between absorbance and the number of full trays in the diffuser. While apparently not a requirement, it is still recommended as best practice to operate with minimum juice levels in the trays irrespective of the diffuser operational mode.
Figure 9. Direct clear juice absorbance and full diffuser trays during the November trials. Effect of DCJ configuration on extraction There are two main reasons why DCJ may reduce the level of extraction in a diffuser: firstly, through a reversal in the counter-current flow of juice relative to the cane in the DCJ section of the diffuser and, secondly, due to the possible reduction in percolation rate if lime is added to the diffuser. Pol extraction is calculated only daily at the factory, and is dependent on a number of factors, including cane quality, which fluctuates with periods of much less than one day. Given that many of the DCJ trials lasted only about 8 h, a more frequent assessment on the likely impact of DCJ on extraction was required: two different methods were used for this purpose. The first was a comparison of the daily diffuser brix profiles, and the second the monitoring of the hourly pol % bagasse values measured by the CTS laboratory. Figure 10 shows eight diffuser profiles: three when operating in CCJ mode, four from DCJ mode operation, and one (‘mix’) from a day where the front three trays were connected in ‘parallel’, allowing the draft juice pumps to remove juice simultaneously from any of the front three trays. The brix profiles were very different for the front five stages of the diffuser, but thereafter quite similar.
Figure 9. Direct clear juice absorbance and full diffuser traysduring the November trials
Figure 10. 2013 Maidstone diffuser brix profiles measured under different diffuser configurations. High extraction levels are expected when the brix at the back of the diffuser (tray 12) is low. Figure 10 shows that the front end configuration does not seem to be the main factor determining the brix % in the juice at the back of the diffuser. Pol % bagasse analyses for a number of days are shown in Figures 11 and 12. As cane throughput (presented as tch/100), moisture % bagasse and imbibition % fibre (Imb/F) can all influence the pol % bagasse, these values are also shown on the graphs. The diffuser mode is represented by the value of the red line labelled ‘Diff status’.
Figure 11. The impact of diffuser configuration on Pol % bagasse from 22/08/2013 to 26/08/2013.
Figure 10. 2013 Maidstone diffuser brix profiles measured under different diffuser configurations.
Figure 11. The impact of diffuser configuration on Pol % bagasse from 22/08/2013 to 26/08/2013
Figure 12. The impact of diffuser configuration on Pol % bagasse from 27/08/2013 to 30/08/2013. Figure 11 shows no evidence of the diffuser status affecting pol % bagasse values. In Figure 12, although it appears the pol % bagasse may have increased during periods of lime and flocculant addition, these periods are also marked by a decrease in imbibition % fibre, which is the more likely reason for the increase. It should also be remembered that Ms diffuser was never run at more than 180 tch during the trials. It is designed for a throughput of 350 tch and, if DCJ does have a negative effect on extraction, it would be more pronounced at higher throughputs. Effect of temperature and mud on turbidity Temperature During the trials, Ms was experiencing variable steam pressures, which impacted on the temperature in the diffuser. While adequate quality DCJ was achieved with DCJ temperatures as low as 70°C, it seemed that higher temperatures produced better quality juice. This observation is consistent with the findings of Jensen (2012) from pilot scale trials. The maximum DCJ temperatures that were achieved were around 82°C. It is thought that turbidity improved as temperature increased due to the enhanced removal of both protein and starch granules. Starch granules are gelatinised above 70°C, rendering them available for breakdown by enzymes which exist in the cane juice (Rein, 2007). A study by Arnold (1996) showed that not all protein in juice is denatured, even above 76°C. It is expected that the optimum DCJ temperature range would fall between 80 and 85°C. At too high temperatures (bearing in mind the juice in the front stage of the diffuser is always ~65°C due to the cold cane) the enzymes which break down the gelatinised starch would themselves be destroyed. The temperature plot in Figure 13 shows that the temperature in November was seldom above 75°C. There may be something of a mirror image relationship between the temperature and turbidity curves shown in Figure 13, but the suspension of mud recycling to the diffuser is also contributing to this effect.
Figure 12. The impact of diffuser configuration on Pol % bagasse from 27/08/2013 to 30/08/2013.
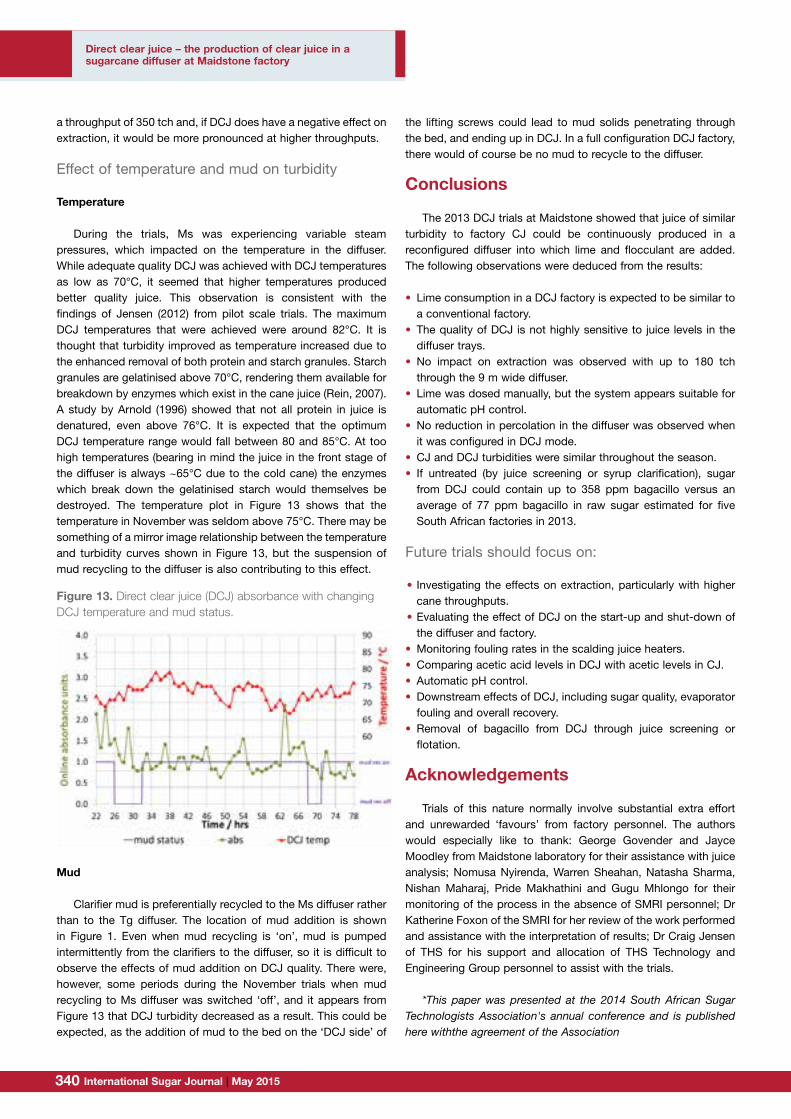
International Sugar Journal | May 2015340 341www.internationalsugarjournal.com
a throughput of 350 tch and, if DCJ does have a negative effect on extraction, it would be more pronounced at higher throughputs.
Effect of temperature and mud on turbidity
Temperature
During the trials, Ms was experiencing variable steam pressures, which impacted on the temperature in the diffuser. While adequate quality DCJ was achieved with DCJ temperatures as low as 70°C, it seemed that higher temperatures produced better quality juice. This observation is consistent with the findings of Jensen (2012) from pilot scale trials. The maximum DCJ temperatures that were achieved were around 82°C. It is thought that turbidity improved as temperature increased due to the enhanced removal of both protein and starch granules. Starch granules are gelatinised above 70°C, rendering them available for breakdown by enzymes which exist in the cane juice (Rein, 2007). A study by Arnold (1996) showed that not all protein in juice is denatured, even above 76°C. It is expected that the optimum DCJ temperature range would fall between 80 and 85°C. At too high temperatures (bearing in mind the juice in the front stage of the diffuser is always ~65°C due to the cold cane) the enzymes which break down the gelatinised starch would themselves be destroyed. The temperature plot in Figure 13 shows that the temperature in November was seldom above 75°C. There may be something of a mirror image relationship between the temperature and turbidity curves shown in Figure 13, but the suspension of mud recycling to the diffuser is also contributing to this effect.
Mud
Clarifier mud is preferentially recycled to the Ms diffuser rather than to the Tg diffuser. The location of mud addition is shown in Figure 1. Even when mud recycling is ‘on’, mud is pumped intermittently from the clarifiers to the diffuser, so it is difficult to observe the effects of mud addition on DCJ quality. There were, however, some periods during the November trials when mud recycling to Ms diffuser was switched ‘off’, and it appears from Figure 13 that DCJ turbidity decreased as a result. This could be expected, as the addition of mud to the bed on the ‘DCJ side’ of
the lifting screws could lead to mud solids penetrating through the bed, and ending up in DCJ. In a full configuration DCJ factory, there would of course be no mud to recycle to the diffuser.
Conclusions
The 2013 DCJ trials at Maidstone showed that juice of similar turbidity to factory CJ could be continuously produced in a reconfigured diffuser into which lime and flocculant are added. The following observations were deduced from the results:
• Lime consumption in a DCJ factory is expected to be similar to a conventional factory.
• The quality of DCJ is not highly sensitive to juice levels in the diffuser trays.
• No impact on extraction was observed with up to 180 tch through the 9 m wide diffuser.
• Lime was dosed manually, but the system appears suitable for automatic pH control.
• No reduction in percolation in the diffuser was observed when it was configured in DCJ mode.
• CJ and DCJ turbidities were similar throughout the season.• If untreated (by juice screening or syrup clarification), sugar
from DCJ could contain up to 358 ppm bagacillo versus an average of 77 ppm bagacillo in raw sugar estimated for five South African factories in 2013.
Future trials should focus on:
• Investigating the effects on extraction, particularly with higher cane throughputs.
• Evaluating the effect of DCJ on the start-up and shut-down of the diffuser and factory.
• Monitoring fouling rates in the scalding juice heaters.• Comparing acetic acid levels in DCJ with acetic levels in CJ.• Automatic pH control.• Downstream effects of DCJ, including sugar quality, evaporator
fouling and overall recovery.• Removal of bagacillo from DCJ through juice screening or
flotation.
Acknowledgements
Trials of this nature normally involve substantial extra effort and unrewarded ‘favours’ from factory personnel. The authors would especially like to thank: George Govender and Jayce Moodley from Maidstone laboratory for their assistance with juice analysis; Nomusa Nyirenda, Warren Sheahan, Natasha Sharma, Nishan Maharaj, Pride Makhathini and Gugu Mhlongo for their monitoring of the process in the absence of SMRI personnel; Dr Katherine Foxon of the SMRI for her review of the work performed and assistance with the interpretation of results; Dr Craig Jensen of THS for his support and allocation of THS Technology and Engineering Group personnel to assist with the trials.
*This paper was presented at the 2014 South African Sugar Technologists Association's annual conference and is published here withthe agreement of the Association
Figure 13. Direct clear juice (DCJ) absorbance with changing DCJ temperature and mud status. Mud Clarifier mud is preferentially recycled to the Ms diffuser rather than to the Tg diffuser. The location of mud addition is shown in Figure 1. Even when mud recycling is ‘on’, mud is pumped intermittently from the clarifiers to the diffuser, so it is difficult to observe the effects of mud addition on DCJ quality. There were, however, some periods during the November trials when mud recycling to Ms diffuser was switched ‘off’, and it appears from Figure 13 that DCJ turbidity decreased as a result. This could be expected, as the addition of mud to the bed on the ‘DCJ side’ of the lifting screws could lead to mud solids penetrating through the bed, and ending up in DCJ. In a full configuration DCJ factory, there would of course be no mud to recycle to the diffuser. Conclusions The 2013 DCJ trials at Maidstone showed that juice of similar turbidity to factory CJ could be continuously produced in a reconfigured diffuser into which lime and flocculant are added. The following observations were deduced from the results: • Lime consumption in a DCJ factory is expected to be similar to a conventional factory. • The quality of DCJ is not highly sensitive to juice levels in the diffuser trays. • No impact on extraction was observed with up to 180 tch through the 9 m wide diffuser. • Lime was dosed manually, but the system appears suitable for automatic pH control. • No reduction in percolation in the diffuser was observed when it was configured in DCJ
mode. • CJ and DCJ turbidities were similar throughout the season. • If untreated (by juice screening or syrup clarification), sugar from DCJ could contain up to
358 ppm bagacillo versus an average of 77 ppm bagacillo in raw sugar estimated for five South African factories in 2013.
Figure 13. Direct clear juice (DCJ) absorbance with changing DCJ temperature and mud status.
Direct clear juice – the production of clear juice in a sugarcane diffuser at Maidstone factory

International Sugar Journal | May 2015340 341www.internationalsugarjournal.com
References
Anon (1985). Laboratory Manual for South African Sugar Factories. 3rd
Edition, South African Sugar Technologists’ Association, Mount Edgecombe,
South Africa. pp 259-260, 262-263.
Arnold K (1996). A study into the removal of protein from sugar cane juice
by froth flotation. Proc Aust Soc Sug Cane Technol 18 and NZ Chemical
Engineering Conf 24.
Jensen PS (2012). Direct clear juice: A feasibility study and piloting
investigation into the production of clear juice in a sugarcane diffuser. Proc
S Afr Sug Technol Ass 85: 344-367.
Jensen PS (2013). Continuous percolation rate measurement in a sugarcane
diffuser. Proc S Afr Sug Technol Ass 86: 404-421
Madho S and Davis SB (2011). Silica in low grade refinery sugars. Proc S Afr.
Sug Technol Ass 84: 516-527.
Mkhize SC (2003). Clear juice turbidity monitoring for sugar quality. Proc S
Afr Sug Technol Ass 77: 414-422.
Muir B (2009). Evaluation of the SMRI juice colour analysis and laboratory-
scale clarification procedure. Technical Report No. 2066, Sugar Milling
Research Institute, Durban, South Africa.
Rein PW (2007). Cane Sugar Engineering. Verlag Dr Albert Bartens. pp 171,
226.
Smith IA, Schumann GT and Walthew DC (2000). Some developments in
flotation clarification. Proc S Afr Sug Technol Ass 74: 263-266.
Appendix A
Effect of Bagacillo of different size ranges on ICUMSA turbidity
A sample of MJ juice was diluted to 5 brix, and its ICUMSA turbidity was measured as the control in Table A1. The control sample was divided into four subsamples, and into each subsample, 200 ppm of bagacillo (of different sizes) was added. The turbidities of the samples were then measured:
• by recording the absorbance as soon as the sample was added to the spectrophotometer.
• by recording the absorbance once the spectrophotometer reading had stabilised after 15 seconds.
The purpose in the two turbidities measured for each sample was to assess whether giving the SS a chance to settle in the sample vial would change the absorbance reading. It is expected that most of the SS had settled anyway by the time the initial reading was taken. It was thus concluded that bagacillo has
minimal effect on ICUMSA turbidity readings.
Table A1. ICUMSA turbidities of juice contaminated with 200 ppm of bagacillo of various sizes.
Bagacillo particle size Initial T(IU)
Final T(IU)
Control 15100
Below 250 µm 16300 15500
250 - 500 µm 15300 15200
500 - 850 µm 17700 16000
850 - 1000 µm 13441 12555
New proprietary grade of PAC withhigh pH to minimize invert formation
BENEFITS:
❊ pH 5.5 with no NaOH treatment
❊ Minimal invert formation
❊ Excellent decolorizing performance
❊ Treat high color sugar up to 500 IU
❊ Food grade quality, low impurities
❊ Good filtration properties
❊ Improved decolorizing performance
❊ Comparable invert formation
❊ Better reactivation efficiency
❊ Longer operating cycles
❊ Greater hardness
❊ Lower operating costs
❊ Direct replacement for magnesite GAC
Carbochem has developed a special grade of non-magnesite GAC
BENEFITS:
308 E. Lancaster Avenue • Wynnewood, PA 19096 • USATelephone: +1-610-645-9200 • Fax +1-610-645-5501
E-Mail: [email protected] • www.carbochem.com
Guaranteed Quality, Reliability and
Value
FOR MORE INFORMATION CONTACT:
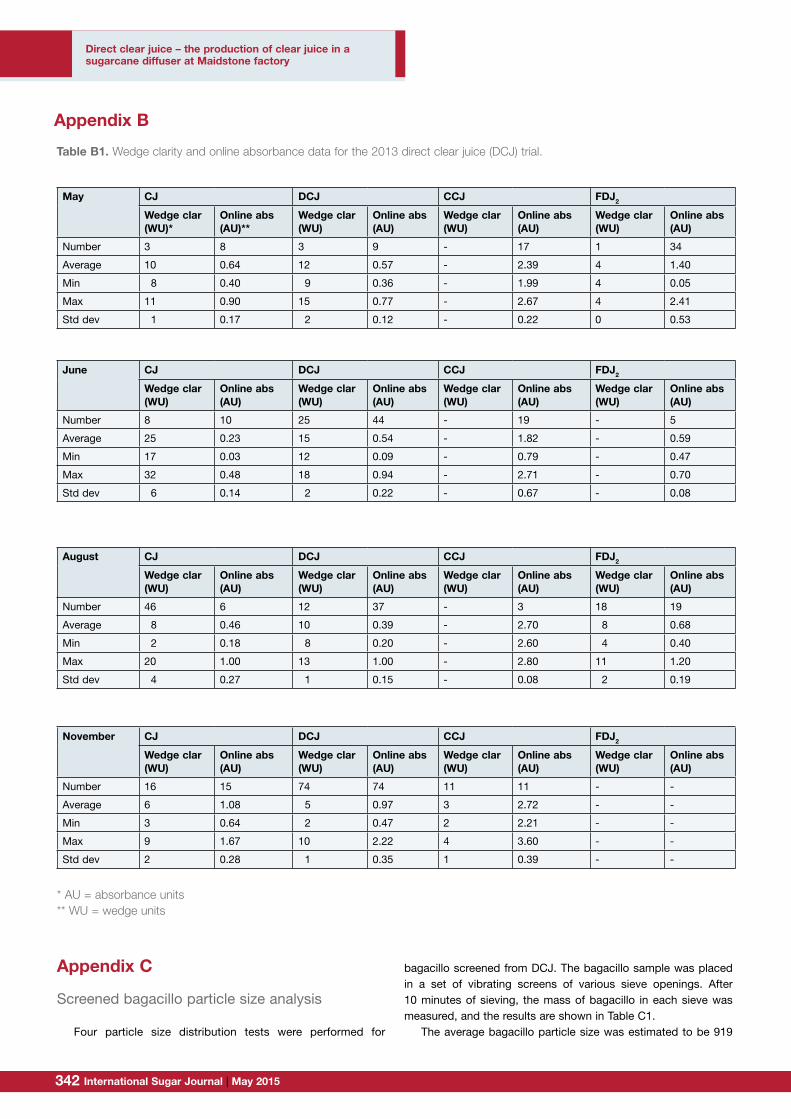
International Sugar Journal | May 2015342 343www.internationalsugarjournal.com
Appendix B
May CJ DCJ CCJ FDJ2
Wedge clar (WU)*
Online abs (AU)**
Wedge clar (WU)
Online abs (AU)
Wedge clar (WU)
Online abs (AU)
Wedge clar (WU)
Online abs (AU)
Number 3 8 3 9 - 17 1 34
Average 10 0.64 12 0.57 - 2.39 4 1.40
Min 8 0.40 9 0.36 - 1.99 4 0.05
Max 11 0.90 15 0.77 - 2.67 4 2.41
Std dev 1 0.17 2 0.12 - 0.22 0 0.53
June CJ DCJ CCJ FDJ2
Wedge clar (WU)
Online abs (AU)
Wedge clar (WU)
Online abs (AU)
Wedge clar (WU)
Online abs (AU)
Wedge clar (WU)
Online abs (AU)
Number 8 10 25 44 - 19 - 5
Average 25 0.23 15 0.54 - 1.82 - 0.59
Min 17 0.03 12 0.09 - 0.79 - 0.47
Max 32 0.48 18 0.94 - 2.71 - 0.70
Std dev 6 0.14 2 0.22 - 0.67 - 0.08
August CJ DCJ CCJ FDJ2
Wedge clar (WU)
Online abs (AU)
Wedge clar (WU)
Online abs (AU)
Wedge clar (WU)
Online abs (AU)
Wedge clar (WU)
Online abs (AU)
Number 46 6 12 37 - 3 18 19
Average 8 0.46 10 0.39 - 2.70 8 0.68
Min 2 0.18 8 0.20 - 2.60 4 0.40
Max 20 1.00 13 1.00 - 2.80 11 1.20
Std dev 4 0.27 1 0.15 - 0.08 2 0.19
November CJ DCJ CCJ FDJ2
Wedge clar (WU)
Online abs (AU)
Wedge clar (WU)
Online abs (AU)
Wedge clar (WU)
Online abs (AU)
Wedge clar (WU)
Online abs (AU)
Number 16 15 74 74 11 11 - -
Average 6 1.08 5 0.97 3 2.72 - -
Min 3 0.64 2 0.47 2 2.21 - -
Max 9 1.67 10 2.22 4 3.60 - -
Std dev 2 0.28 1 0.35 1 0.39 - -
* AU = absorbance units** WU = wedge units
Appendix C
Screened bagacillo particle size analysis
Four particle size distribution tests were performed for
bagacillo screened from DCJ. The bagacillo sample was placed in a set of vibrating screens of various sieve openings. After 10 minutes of sieving, the mass of bagacillo in each sieve was measured, and the results are shown in Table C1.
The average bagacillo particle size was estimated to be 919
Table B1. Wedge clarity and online absorbance data for the 2013 direct clear juice (DCJ) trial.
Direct clear juice – the production of clear juice in a sugarcane diffuser at Maidstone factory
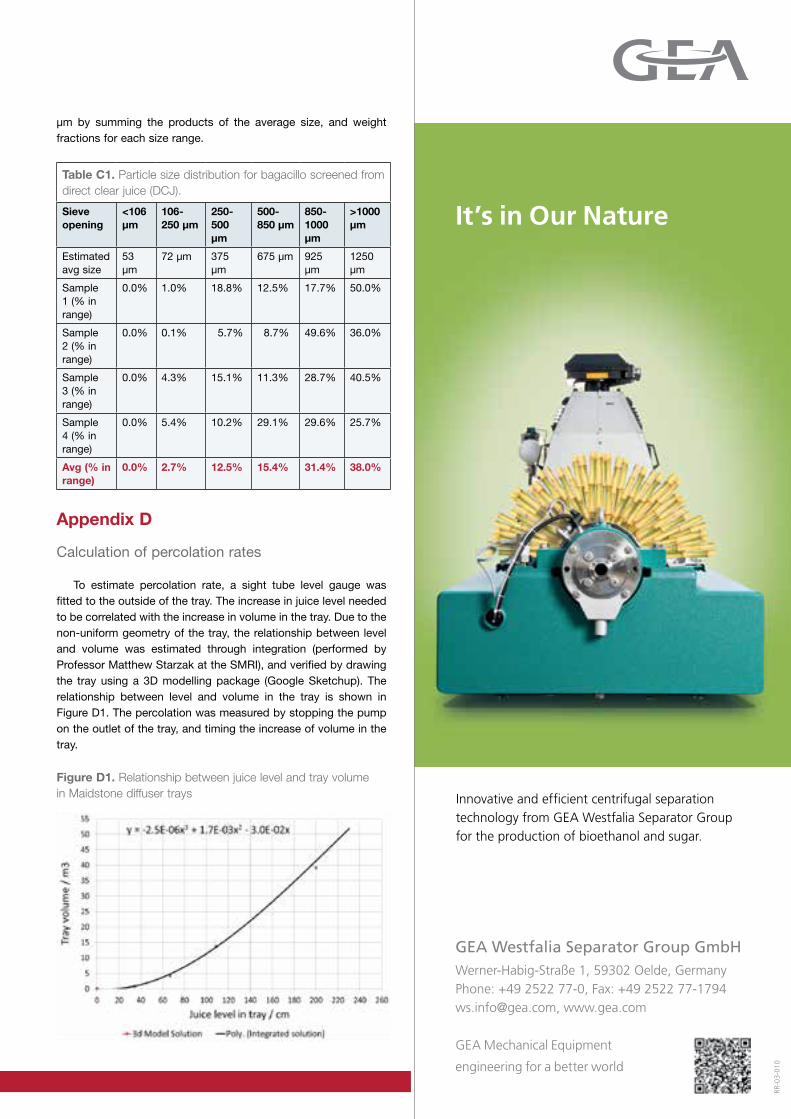
International Sugar Journal | May 2015342 343www.internationalsugarjournal.com
µm by summing the products of the average size, and weight fractions for each size range.
Appendix D
Calculation of percolation rates
To estimate percolation rate, a sight tube level gauge was fitted to the outside of the tray. The increase in juice level needed to be correlated with the increase in volume in the tray. Due to the non-uniform geometry of the tray, the relationship between level and volume was estimated through integration (performed by Professor Matthew Starzak at the SMRI), and verified by drawing the tray using a 3D modelling package (Google Sketchup). The relationship between level and volume in the tray is shown in Figure D1. The percolation was measured by stopping the pump on the outlet of the tray, and timing the increase of volume in the tray.
Table C1. Particle size distribution for bagacillo screened from direct clear juice (DCJ).
Sieve opening
<106µm
106-250 µm
250-500 µm
500-850 µm
850-1000 µm
>1000 µm
Estimated avg size
53 µm
72 µm 375 µm
675 µm 925 µm
1250 µm
Sample 1 (% in range)
0.0% 1.0% 18.8% 12.5% 17.7% 50.0%
Sample 2 (% in range)
0.0% 0.1% 5.7% 8.7% 49.6% 36.0%
Sample 3 (% in range)
0.0% 4.3% 15.1% 11.3% 28.7% 40.5%
Sample 4 (% in range)
0.0% 5.4% 10.2% 29.1% 29.6% 25.7%
Avg (% in range)
0.0% 2.7% 12.5% 15.4% 31.4% 38.0%
APPENDIX D Calculation of percolation rates To estimate percolation rate, a sight tube level gauge was fitted to the outside of the tray. The increase in juice level needed to be correlated with the increase in volume in the tray. Due to the non-uniform geometry of the tray, the relationship between level and volume was estimated through integration (performed by Professor Matthew Starzak at the SMRI), and verified by drawing the tray using a 3D modelling package (Google Sketchup). The relationship between level and volume in the tray is shown in Figure D1. The percolation was measured by stopping the pump on the outlet of the tray, and timing the increase of volume in the tray.
Figure D1. Relationship between juice level and tray volume in Maidstone diffuser trays. The percentage recycle was then calculated using the method of Jensen (2013). The calculations are shown in Table D1.
Figure D1. Relationship between juice level and tray volumein Maidstone diffuser trays
engineering for a better world
GEA Mechanical Equipment
It’s in Our Nature
Innovative and efficient centrifugal separation technology from GEA Westfalia Separator Group for the production of bioethanol and sugar.
GEA Westfalia Separator Group GmbHWerner-Habig-Straße 1, 59302 Oelde, Germany Phone: +49 2522 77-0, Fax: +49 2522 77-1794 [email protected], www.gea.com
RR-0
3-01
0
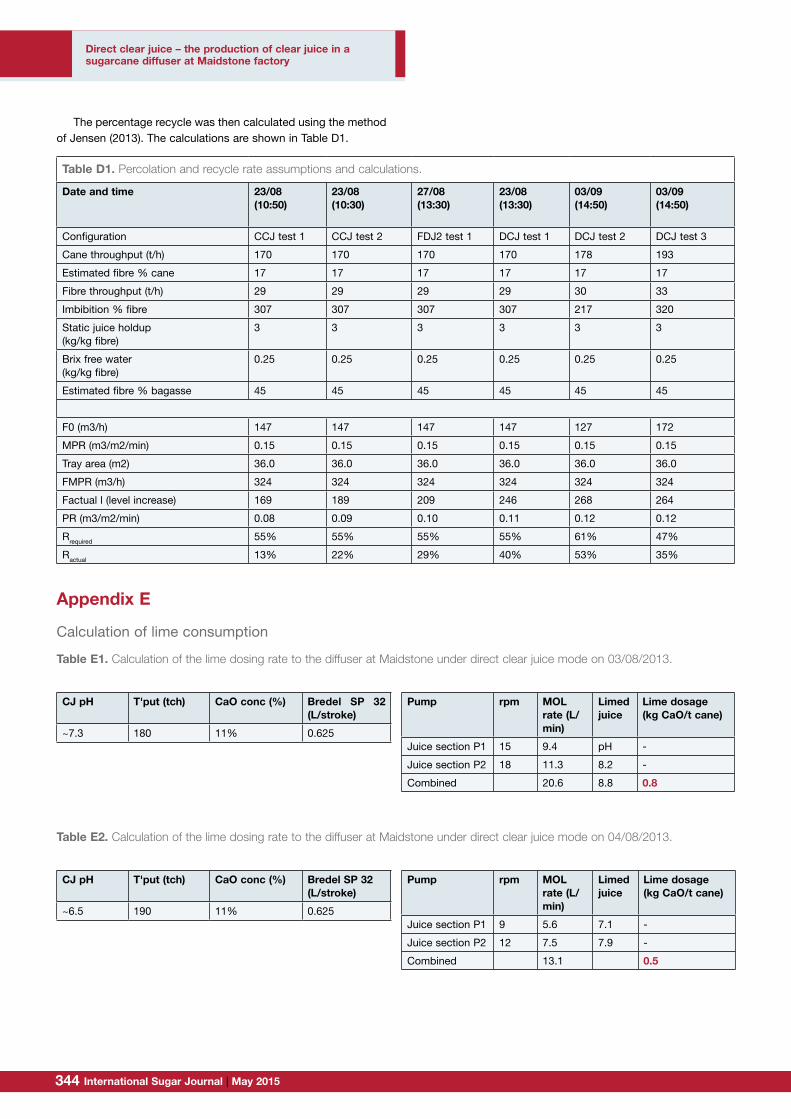
International Sugar Journal | May 2015344 345www.internationalsugarjournal.com
The percentage recycle was then calculated using the method of Jensen (2013). The calculations are shown in Table D1.
Appendix E
Calculation of lime consumption
Table D1. Percolation and recycle rate assumptions and calculations.
Date and time 23/08(10:50)
23/08(10:30)
27/08(13:30)
23/08(13:30)
03/09(14:50)
03/09(14:50)
Configuration CCJ test 1 CCJ test 2 FDJ2 test 1 DCJ test 1 DCJ test 2 DCJ test 3
Cane throughput (t/h) 170 170 170 170 178 193
Estimated fibre % cane 17 17 17 17 17 17
Fibre throughput (t/h) 29 29 29 29 30 33
Imbibition % fibre 307 307 307 307 217 320
Static juice holdup(kg/kg fibre)
3 3 3 3 3 3
Brix free water(kg/kg fibre)
0.25 0.25 0.25 0.25 0.25 0.25
Estimated fibre % bagasse 45 45 45 45 45 45
F0 (m3/h) 147 147 147 147 127 172
MPR (m3/m2/min) 0.15 0.15 0.15 0.15 0.15 0.15
Tray area (m2) 36.0 36.0 36.0 36.0 36.0 36.0
FMPR (m3/h) 324 324 324 324 324 324
Factual l (level increase) 169 189 209 246 268 264
PR (m3/m2/min) 0.08 0.09 0.10 0.11 0.12 0.12
Rrequired 55% 55% 55% 55% 61% 47%
Ractual 13% 22% 29% 40% 53% 35%
CJ pH T'put (tch) CaO conc (%) Bredel SP 32 (L/stroke)
~7.3 180 11% 0.625
Table E1. Calculation of the lime dosing rate to the diffuser at Maidstone under direct clear juice mode on 03/08/2013.
CJ pH T'put (tch) CaO conc (%) Bredel SP 32 (L/stroke)
~6.5 190 11% 0.625
Pump rpm MOL rate (L/min)
Limed juice
Lime dosage(kg CaO/t cane)
Juice section P1 9 5.6 7.1 -
Juice section P2 12 7.5 7.9 -
Combined 13.1 0.5
Table E2. Calculation of the lime dosing rate to the diffuser at Maidstone under direct clear juice mode on 04/08/2013.
Pump rpm MOL rate (L/min)
Limed juice
Lime dosage(kg CaO/t cane)
Juice section P1 15 9.4 pH -
Juice section P2 18 11.3 8.2 -
Combined 20.6 8.8 0.8
Direct clear juice – the production of clear juice in a sugarcane diffuser at Maidstone factory

International Sugar Journal | May 2015344 345www.internationalsugarjournal.com
Pump rpm MOL rate (L/min)
Limed juice
Lime dosage(kg CaO/t cane)
Juice section P1 9 5.6 7.1 -
Juice section P2 12 7.5 7.9 -
Combined 13.1 0.5
Pump rpm MOL rate (L/min)
Limed juice
Lime dosage(kg CaO/t cane)
Juice section P1 15 9.4 pH -
Juice section P2 18 11.3 8.2 -
Combined 20.6 8.8 0.8
Get the best from nature
Thanks to our purification processes and technologies, each day around the world:
• 50,000 tons of cane sugar are refined using our decolorization technology
• 250,000 tons of sugar beet per day are softened using our NRS technology
• 2,500 tons of high grade liquid sugar are produced from beet and cane sugar
Efficient and green processes for sugar purification
- P
hoto
cre
dit:
Dol
lar
Pho
to C
lub
Novasep_charte_presse_Avril_V5.indd 1 24/04/2015 11:51
International Sugar Journal | May 2015346 347www.internationalsugarjournal.com
Addressing factory needs in cane variety selection*
Contact authors: [email protected]
1Queensland University of Technology, Brisbane, Australia2Sugar Research Australia, Bundaberg, Australia
GA Kent1, R Parfitt2 and A Jensen2
Abstract Cane fibre content has increased over the past ten years. Some of that increase can be attributed to new
varieties selected for release. This paper reviews the existing methods for quantifying the fibre characteristics of
a variety, including fibre content and fibre quality measurements – shear strength, impact resistance and short
fibre content. The variety selection process is presented and it is reported that fibre content has zero weighting in
the current selection index. An updated variety selection approach is proposed, potentially replacing the existing
selection process relating to fibre. This alternative approach involves the use of a more complex mill area level
model that accounts for harvesting, transport and processing equipment, taking into account capacity, efficiency
and operational impacts, along with the end use for the bagasse. The approach will ultimately determine a
net economic value for the variety. The methodology lends itself to a determination of the fibre properties that
have a significant impact on the economic value so that variety tests can better target the critical properties. A
low-pressure compression test is proposed as a good test to provide an assessment of the impact of a variety
on milling capacity. NIR methodology is proposed as a technology to lead to a more rapid assessment of fibre
properties, and hence the opportunity to more comprehensively test for fibre impacts at an earlier stage of variety
development.
Keywords: variety, fibre, quality, selection, sugarcane
Introduction
There is a rigorous and well defined process in place that manages the selection and release of new varieties in each region. Australian sugarcane variety breeding programs consist of four main stages, from seedlings through to propagation for release. During the second and third trial stages, varieties are assessed for disease resistance, sugar quality, fibre content, CCS and tonnes of cane produced (Cox et al., 2000). Variety performance characteristics are weighted according to their economic importance in each regional area and incorporated into a relative Economic Genetic Value (rEGV). In calculating rEGV, traits are weighted on the basis of their economic benefit over the whole sugar production process, from harvesting to marketing (Wei et al., 2008). This value allows plant breeders to select clones on the basis of their overall economic benefit for the whole of the Australian sugarcane industry, in comparison to the average performance of standard commercial varieties (Wei et al. 2008).
Fibre content was originally given a negative weighting in the Sugar Research Australia (SRA) selection index (Wei et al., 2006). Since 2010, fibre content has had a zero weighting in the selection index. Only the most advanced varieties are tested for fibre quality characteristics, prior to release. Although the process is well defined, there is a regular need to review the methodology to ensure that it meets the needs of each region.
The current methodology has seen some criticism that it does not adequately reflect the costs of processing in the factory. While high fibre is desirable in some mill areas that have adequate processing capacity and can benefit from the fibre in terms of cogeneration income or steam supply, high fibre in other mill areas is a processing rate limitation and/or causes a bagasse disposal problem (Kent, 2007).
This paper sets out to review the emphasis placed on fibre content and fibre qualities in variety selection and the impact of these factors on factory income and factory costs. Revisions to the current process and methodology are proposed to better match industry income and production costs.
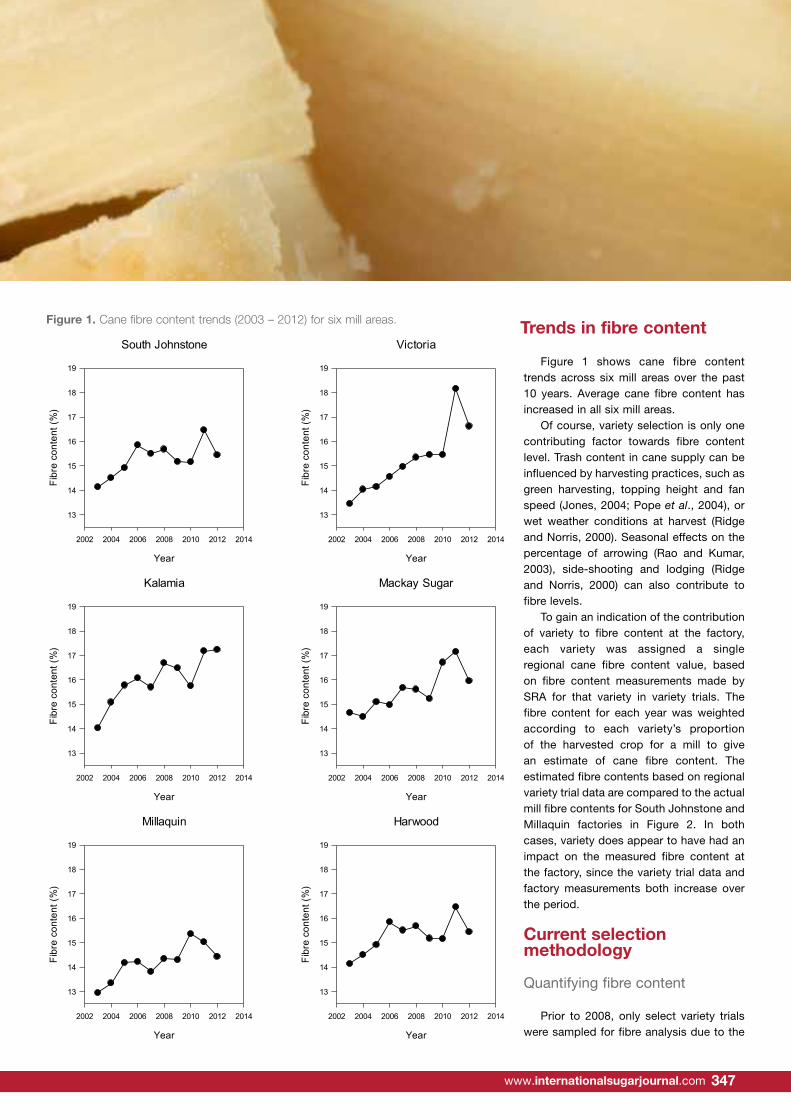
International Sugar Journal | May 2015346 347www.internationalsugarjournal.com
Trends in fibre content
Figure 1 shows cane fibre content trends across six mill areas over the past 10 years. Average cane fibre content has increased in all six mill areas.
Of course, variety selection is only one contributing factor towards fibre content level. Trash content in cane supply can be influenced by harvesting practices, such as green harvesting, topping height and fan speed (Jones, 2004; Pope et al., 2004), or wet weather conditions at harvest (Ridge and Norris, 2000). Seasonal effects on the percentage of arrowing (Rao and Kumar, 2003), side-shooting and lodging (Ridge and Norris, 2000) can also contribute to fibre levels.
To gain an indication of the contribution of variety to fibre content at the factory, each variety was assigned a single regional cane fibre content value, based on fibre content measurements made by SRA for that variety in variety trials. The fibre content for each year was weighted according to each variety’s proportion of the harvested crop for a mill to give an estimate of cane fibre content. The estimated fibre contents based on regional variety trial data are compared to the actual mill fibre contents for South Johnstone and Millaquin factories in Figure 2. In both cases, variety does appear to have had an impact on the measured fibre content at the factory, since the variety trial data and factory measurements both increase over the period.
Current selection methodology
Quantifying fibre content
Prior to 2008, only select variety trials were sampled for fibre analysis due to the
Kent GA et al. Proc Aust Soc Sugar Cane Technol Vol 36 2014 ______________________________________________________________________________________
13
Kalamia
Year
2002 2004 2006 2008 2010 2012 2014
Fibr
e co
nten
t (%
)
13
14
15
16
17
18
19
Millaquin
Year
2002 2004 2006 2008 2010 2012 2014
Fibr
e co
nten
t (%
)
13
14
15
16
17
18
19
Harwood
Year
2002 2004 2006 2008 2010 2012 2014
Fibr
e co
nten
t (%
)
13
14
15
16
17
18
19
Mackay Sugar
Year
2002 2004 2006 2008 2010 2012 2014
Fibr
e co
nten
t (%
)
13
14
15
16
17
18
19
South Johnstone
Year
2002 2004 2006 2008 2010 2012 2014
Fibr
e co
nten
t (%
)
13
14
15
16
17
18
19
Victoria
Year
2002 2004 2006 2008 2010 2012 2014
Fibr
e co
nten
t (%
)
13
14
15
16
17
18
19
Fig. 1—Cane fibre content trends (2003 – 2012) for six mill areas.
Of course, variety selection is only one contributing factor towards fibre content level. Trash content in cane supply can be influenced by harvesting practices, such as green harvesting, topping height and fan speed (Jones, 2004; Pope et al., 2004), or wet weather conditions at harvest (Ridge and Norris, 2000). Seasonal effects on the percentage of arrowing (Rao and Kumar, 2003), side-shooting and lodging (Ridge and Norris, 2000) can also contribute to fibre levels.
To gain an indication of the contribution of variety to fibre content at the factory, each variety was assigned a single regional cane fibre content value, based on fibre content measurements made by SRA for that variety in variety trials. The fibre content for each year was weighted according to each variety’s proportion of the harvested crop for a mill to give an estimate of cane fibre content. The estimated fibre contents based on regional variety trial data are compared to the actual mill fibre contents for South Johnstone and Millaquin factories in Figure 2. In both cases, variety does appear to have had an impact on the measured fibre content at the factory, since
Figure 1. Cane fibre content trends (2003 – 2012) for six mill areas.
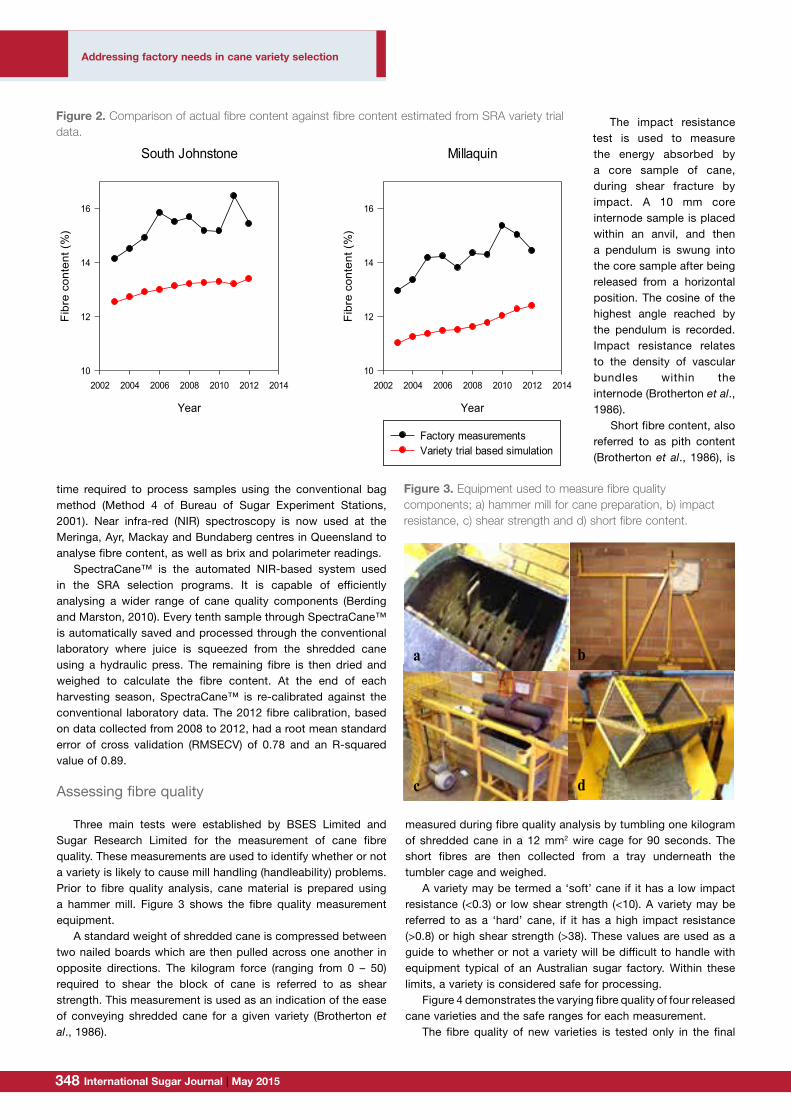
International Sugar Journal | May 2015348 349www.internationalsugarjournal.com
Addressing factory needs in cane variety selection
time required to process samples using the conventional bag method (Method 4 of Bureau of Sugar Experiment Stations, 2001). Near infra-red (NIR) spectroscopy is now used at the Meringa, Ayr, Mackay and Bundaberg centres in Queensland to analyse fibre content, as well as brix and polarimeter readings.
SpectraCane™ is the automated NIR-based system used in the SRA selection programs. It is capable of efficiently analysing a wider range of cane quality components (Berding and Marston, 2010). Every tenth sample through SpectraCane™ is automatically saved and processed through the conventional laboratory where juice is squeezed from the shredded cane using a hydraulic press. The remaining fibre is then dried and weighed to calculate the fibre content. At the end of each harvesting season, SpectraCane™ is re-calibrated against the conventional laboratory data. The 2012 fibre calibration, based on data collected from 2008 to 2012, had a root mean standard error of cross validation (RMSECV) of 0.78 and an R-squared value of 0.89.
Assessing fibre quality
Three main tests were established by BSES Limited and Sugar Research Limited for the measurement of cane fibre quality. These measurements are used to identify whether or not a variety is likely to cause mill handling (handleability) problems. Prior to fibre quality analysis, cane material is prepared using a hammer mill. Figure 3 shows the fibre quality measurement equipment.
A standard weight of shredded cane is compressed between two nailed boards which are then pulled across one another in opposite directions. The kilogram force (ranging from 0 – 50) required to shear the block of cane is referred to as shear strength. This measurement is used as an indication of the ease of conveying shredded cane for a given variety (Brotherton et al., 1986).
The impact resistance test is used to measure the energy absorbed by a core sample of cane, during shear fracture by impact. A 10 mm core internode sample is placed within an anvil, and then a pendulum is swung into the core sample after being released from a horizontal position. The cosine of the highest angle reached by the pendulum is recorded. Impact resistance relates to the density of vascular bundles within the internode (Brotherton et al., 1986).
Short fibre content, also referred to as pith content (Brotherton et al., 1986), is
measured during fibre quality analysis by tumbling one kilogram of shredded cane in a 12 mm2 wire cage for 90 seconds. The short fibres are then collected from a tray underneath the tumbler cage and weighed.
A variety may be termed a ‘soft’ cane if it has a low impact resistance (<0.3) or low shear strength (<10). A variety may be referred to as a ‘hard’ cane, if it has a high impact resistance (>0.8) or high shear strength (>38). These values are used as a guide to whether or not a variety will be difficult to handle with equipment typical of an Australian sugar factory. Within these limits, a variety is considered safe for processing.
Figure 4 demonstrates the varying fibre quality of four released cane varieties and the safe ranges for each measurement.
The fibre quality of new varieties is tested only in the final
Kent GA et al. Proc Aust Soc Sugar Cane Technol Vol 36 2014 ______________________________________________________________________________________
14
the variety trial data and factory measurements both increase over the period.
South Johnstone
Year
2002 2004 2006 2008 2010 2012 2014
Fib
re c
onte
nt (
%)
10
12
14
16
Millaquin
Year
2002 2004 2006 2008 2010 2012 2014
Fib
re c
onte
nt (
%)
10
12
14
16
Factory measurementsVariety trial based simulation
Fig. 2—Comparison of actual fibre content against fibre content estimated from SRA variety trial data.
Current selection methodology
Quantifying fibre content Prior to 2008, only select variety trials were sampled for fibre analysis due to the time
required to process samples using the conventional bag method (Method 4 of Bureau of Sugar Experiment Stations, 2001). Near infra-red (NIR) spectroscopy is now used at the Meringa, Ayr, Mackay and Bundaberg centres in Queensland to analyse fibre content, as well as brix and polarimeter readings.
SpectraCane™ is the automated NIR-based system used in the SRA selection programs. It is capable of efficiently analysing a wider range of cane quality components (Berding and Marston, 2010). Every tenth sample through SpectraCane™ is automatically saved and processed through the conventional laboratory where juice is squeezed from the shredded cane using a hydraulic press. The remaining fibre is then dried and weighed to calculate the fibre content. At the end of each harvesting season, SpectraCane™ is re-calibrated against the conventional laboratory data. The 2012 fibre calibration, based on data collected from 2008 to 2012, had a root mean standard error of cross validation (RMSECV) of 0.78 and an R-squared value of 0.89.
Assessing fibre quality Three main tests were established by BSES Limited and Sugar Research Limited for the
measurement of cane fibre quality. These measurements are used to identify whether or not a variety is likely to cause mill handling (handleability) problems. Prior to fibre quality analysis, cane material is prepared using a hammer mill. Figure 3 shows the fibre quality measurement equipment.
A standard weight of shredded cane is compressed between two nailed boards which are then pulled across one another in opposite directions. The kilogram force (ranging from 0 – 50) required to shear the block of cane is referred to as shear strength. This measurement is used as an indication of the ease of conveying shredded cane for a given variety (Brotherton et al., 1986).
The impact resistance test is used to measure the energy absorbed by a core sample of cane, during shear fracture by impact. A 10 mm core internode sample is placed within an anvil, and then
Figure 2. Comparison of actual fibre content against fibre content estimated from SRA variety trial data.
Kent GA et al. Proc Aust Soc Sugar Cane Technol Vol 36 2014 ______________________________________________________________________________________
15
a pendulum is swung into the core sample after being released from a horizontal position. The cosine of the highest angle reached by the pendulum is recorded. Impact resistance relates to the density of vascular bundles within the internode (Brotherton et al., 1986).
Short fibre content, also referred to as pith content (Brotherton et al., 1986), is measured during fibre quality analysis by tumbling one kilogram of shredded cane in a 12 mm2 wire cage for 90 seconds. The short fibres are then collected from a tray underneath the tumbler cage and weighed.
Fig. 3—Equipment used to measure fibre quality components; a) hammer mill for cane preparation, b) impact resistance, c) shear strength and d) short fibre content.
A variety may be termed a ‘soft’ cane if it has a low impact resistance (<0.3) or low shear strength (<10). A variety may be referred to as a ‘hard’ cane, if it has a high impact resistance (>0.8) or high shear strength (>38). These values are used as a guide to whether or not a variety will be difficult to handle with equipment typical of an Australian sugar factory. Within these limits, a variety is considered safe for processing.
Figure 4 demonstrates the varying fibre quality of four released cane varieties and the safe ranges for each measurement.
The fibre quality of new varieties is tested only in the final two years prior to release due to the expense of the sampling procedure. If a variety exceeds the safe ranges for either measurement (Figure 4), then it is usually monitored closely during the first few years of production and shredding and milling equipment may be adjusted to ensure efficient handling of the cane (Brotherton et al., 1986).
d c
b a
Figure 3. Equipment used to measure fibre quality components; a) hammer mill for cane preparation, b) impact resistance, c) shear strength and d) short fibre content.
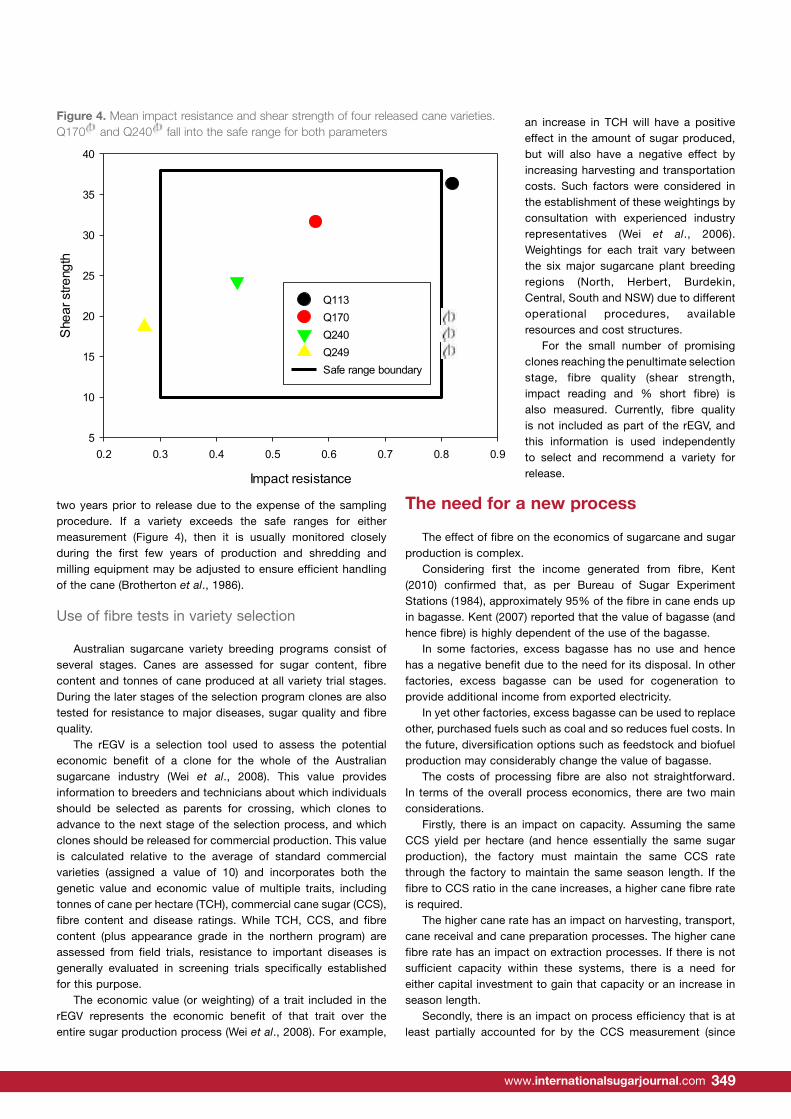
International Sugar Journal | May 2015348 349www.internationalsugarjournal.com
two years prior to release due to the expense of the sampling procedure. If a variety exceeds the safe ranges for either measurement (Figure 4), then it is usually monitored closely during the first few years of production and shredding and milling equipment may be adjusted to ensure efficient handling of the cane (Brotherton et al., 1986).
Use of fibre tests in variety selection
Australian sugarcane variety breeding programs consist of several stages. Canes are assessed for sugar content, fibre content and tonnes of cane produced at all variety trial stages. During the later stages of the selection program clones are also tested for resistance to major diseases, sugar quality and fibre quality.
The rEGV is a selection tool used to assess the potential economic benefit of a clone for the whole of the Australian sugarcane industry (Wei et al., 2008). This value provides information to breeders and technicians about which individuals should be selected as parents for crossing, which clones to advance to the next stage of the selection process, and which clones should be released for commercial production. This value is calculated relative to the average of standard commercial varieties (assigned a value of 10) and incorporates both the genetic value and economic value of multiple traits, including tonnes of cane per hectare (TCH), commercial cane sugar (CCS), fibre content and disease ratings. While TCH, CCS, and fibre content (plus appearance grade in the northern program) are assessed from field trials, resistance to important diseases is generally evaluated in screening trials specifically established for this purpose.
The economic value (or weighting) of a trait included in the rEGV represents the economic benefit of that trait over the entire sugar production process (Wei et al., 2008). For example,
an increase in TCH will have a positive effect in the amount of sugar produced, but will also have a negative effect by increasing harvesting and transportation costs. Such factors were considered in the establishment of these weightings by consultation with experienced industry representatives (Wei et al., 2006). Weightings for each trait vary between the six major sugarcane plant breeding regions (North, Herbert, Burdekin, Central, South and NSW) due to different operational procedures, available resources and cost structures.
For the small number of promising clones reaching the penultimate selection stage, fibre quality (shear strength, impact reading and % short fibre) is also measured. Currently, fibre quality is not included as part of the rEGV, and this information is used independently to select and recommend a variety for release.
The need for a new process
The effect of fibre on the economics of sugarcane and sugar production is complex.
Considering first the income generated from fibre, Kent (2010) confirmed that, as per Bureau of Sugar Experiment Stations (1984), approximately 95% of the fibre in cane ends up in bagasse. Kent (2007) reported that the value of bagasse (and hence fibre) is highly dependent of the use of the bagasse.
In some factories, excess bagasse has no use and hence has a negative benefit due to the need for its disposal. In other factories, excess bagasse can be used for cogeneration to provide additional income from exported electricity.
In yet other factories, excess bagasse can be used to replace other, purchased fuels such as coal and so reduces fuel costs. In the future, diversification options such as feedstock and biofuel production may considerably change the value of bagasse.
The costs of processing fibre are also not straightforward. In terms of the overall process economics, there are two main considerations.
Firstly, there is an impact on capacity. Assuming the same CCS yield per hectare (and hence essentially the same sugar production), the factory must maintain the same CCS rate through the factory to maintain the same season length. If the fibre to CCS ratio in the cane increases, a higher cane fibre rate is required.
The higher cane rate has an impact on harvesting, transport, cane receival and cane preparation processes. The higher cane fibre rate has an impact on extraction processes. If there is not sufficient capacity within these systems, there is a need for either capital investment to gain that capacity or an increase in season length.
Secondly, there is an impact on process efficiency that is at least partially accounted for by the CCS measurement (since
Kent GA et al. Proc Aust Soc Sugar Cane Technol Vol 36 2014 ______________________________________________________________________________________
16
Impact resistance
0.2 0.3 0.4 0.5 0.6 0.7 0.8 0.9
She
ar s
treng
th
5
10
15
20
25
30
35
40
Q113Q170Q240Q249Safe range boundary
Fig. 4—Mean impact resistance and shear strength of four released cane varieties. Q170 and Q240 fall into the safe range for both parameters.
Use of fibre tests in variety selection Australian sugarcane variety breeding programs consist of several stages. Canes are assessed
for sugar content, fibre content and tonnes of cane produced at all variety trial stages. During the later stages of the selection program clones are also tested for resistance to major diseases, sugar quality and fibre quality.
The rEGV is a selection tool used to assess the potential economic benefit of a clone for the whole of the Australian sugarcane industry (Wei et al., 2008). This value provides information to breeders and technicians about which individuals should be selected as parents for crossing, which clones to advance to the next stage of the selection process, and which clones should be released for commercial production. This value is calculated relative to the average of standard commercial varieties (assigned a value of 10) and incorporates both the genetic value and economic value of multiple traits, including tonnes of cane per hectare (TCH), commercial cane sugar (CCS), fibre content and disease ratings. While TCH, CCS, and fibre content (plus appearance grade in the northern program) are assessed from field trials, resistance to important diseases is generally evaluated in screening trials specifically established for this purpose.
The economic value (or weighting) of a trait included in the rEGV represents the economic benefit of that trait over the entire sugar production process (Wei et al., 2008). For example, an increase in TCH will have a positive effect in the amount of sugar produced, but will also have a negative effect by increasing harvesting and transportation costs. Such factors were considered in the establishment of these weightings by consultation with experienced industry representatives (Wei et al., 2006). Weightings for each trait vary between the six major sugarcane plant breeding regions (North, Herbert, Burdekin, Central, South and NSW) due to different operational procedures, available resources and cost structures.
For the small number of promising clones reaching the penultimate selection stage, fibre quality (shear strength, impact reading and % short fibre) is also measured. Currently, fibre quality
Figure 4. Mean impact resistance and shear strength of four released cane varieties. Q170 and Q240 fall into the safe range for both parameters
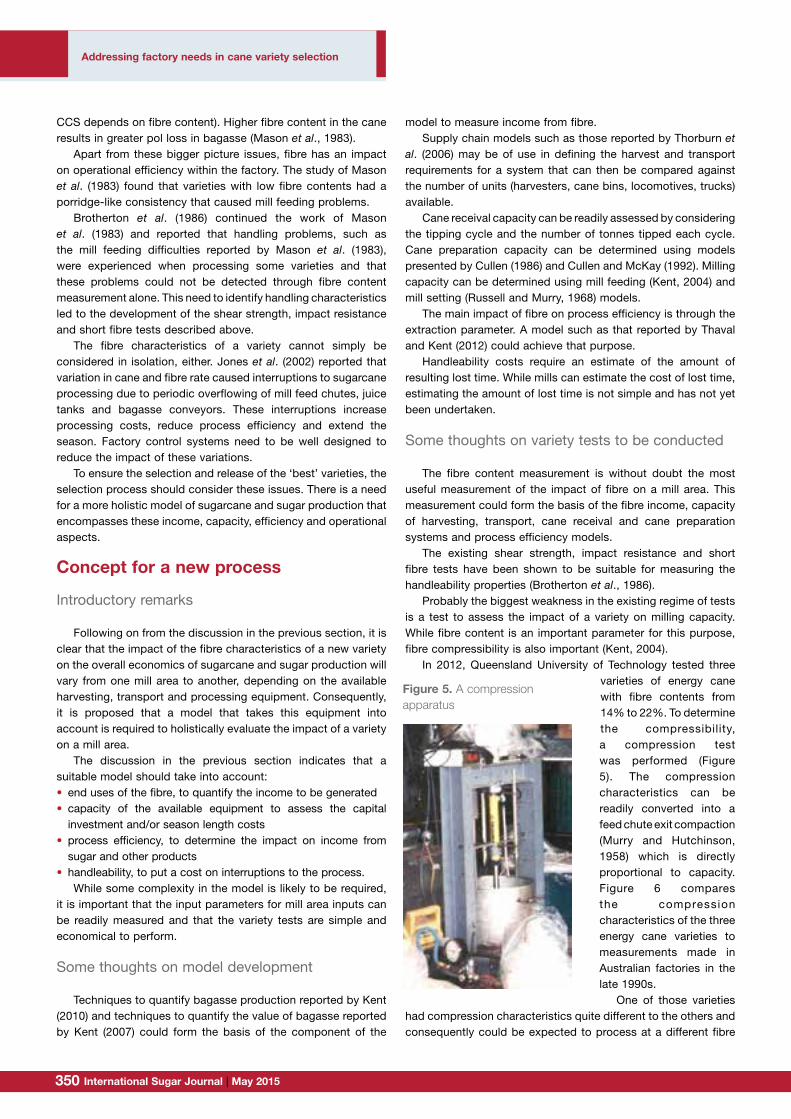
International Sugar Journal | May 2015350 351www.internationalsugarjournal.com
CCS depends on fibre content). Higher fibre content in the cane results in greater pol loss in bagasse (Mason et al., 1983).
Apart from these bigger picture issues, fibre has an impact on operational efficiency within the factory. The study of Mason et al. (1983) found that varieties with low fibre contents had a porridge-like consistency that caused mill feeding problems.
Brotherton et al. (1986) continued the work of Mason et al. (1983) and reported that handling problems, such as the mill feeding difficulties reported by Mason et al. (1983), were experienced when processing some varieties and that these problems could not be detected through fibre content measurement alone. This need to identify handling characteristics led to the development of the shear strength, impact resistance and short fibre tests described above.
The fibre characteristics of a variety cannot simply be considered in isolation, either. Jones et al. (2002) reported that variation in cane and fibre rate caused interruptions to sugarcane processing due to periodic overflowing of mill feed chutes, juice tanks and bagasse conveyors. These interruptions increase processing costs, reduce process efficiency and extend the season. Factory control systems need to be well designed to reduce the impact of these variations.
To ensure the selection and release of the ‘best’ varieties, the selection process should consider these issues. There is a need for a more holistic model of sugarcane and sugar production that encompasses these income, capacity, efficiency and operational aspects.
Concept for a new process
Introductory remarks
Following on from the discussion in the previous section, it is clear that the impact of the fibre characteristics of a new variety on the overall economics of sugarcane and sugar production will vary from one mill area to another, depending on the available harvesting, transport and processing equipment. Consequently, it is proposed that a model that takes this equipment into account is required to holistically evaluate the impact of a variety on a mill area.
The discussion in the previous section indicates that a suitable model should take into account:• end uses of the fibre, to quantify the income to be generated• capacity of the available equipment to assess the capital
investment and/or season length costs• process efficiency, to determine the impact on income from
sugar and other products• handleability, to put a cost on interruptions to the process.
While some complexity in the model is likely to be required, it is important that the input parameters for mill area inputs can be readily measured and that the variety tests are simple and economical to perform.
Some thoughts on model development
Techniques to quantify bagasse production reported by Kent (2010) and techniques to quantify the value of bagasse reported by Kent (2007) could form the basis of the component of the
model to measure income from fibre.Supply chain models such as those reported by Thorburn et
al. (2006) may be of use in defining the harvest and transport requirements for a system that can then be compared against the number of units (harvesters, cane bins, locomotives, trucks) available.
Cane receival capacity can be readily assessed by considering the tipping cycle and the number of tonnes tipped each cycle. Cane preparation capacity can be determined using models presented by Cullen (1986) and Cullen and McKay (1992). Milling capacity can be determined using mill feeding (Kent, 2004) and mill setting (Russell and Murry, 1968) models.
The main impact of fibre on process efficiency is through the extraction parameter. A model such as that reported by Thaval and Kent (2012) could achieve that purpose.
Handleability costs require an estimate of the amount of resulting lost time. While mills can estimate the cost of lost time, estimating the amount of lost time is not simple and has not yet been undertaken.
Some thoughts on variety tests to be conducted
The fibre content measurement is without doubt the most useful measurement of the impact of fibre on a mill area. This measurement could form the basis of the fibre income, capacity of harvesting, transport, cane receival and cane preparation systems and process efficiency models.
The existing shear strength, impact resistance and short fibre tests have been shown to be suitable for measuring the handleability properties (Brotherton et al., 1986).
Probably the biggest weakness in the existing regime of tests is a test to assess the impact of a variety on milling capacity. While fibre content is an important parameter for this purpose, fibre compressibility is also important (Kent, 2004).
In 2012, Queensland University of Technology tested three varieties of energy cane with fibre contents from 14% to 22%. To determine the compressibility, a compression test was performed (Figure 5). The compression characteristics can be readily converted into a feed chute exit compaction (Murry and Hutchinson, 1958) which is directly proportional to capacity. Figure 6 compares the compression characteristics of the three energy cane varieties to measurements made in Australian factories in the late 1990s.
One of those varieties had compression characteristics quite different to the others and consequently could be expected to process at a different fibre
Kent GA et al. Proc Aust Soc Sugar Cane Technol Vol 36 2014 ______________________________________________________________________________________
19
Fig. 5—A compression apparatus.
Pressure (kPa)
0 2 4 6 8 10 12
Com
pact
ion
(kg/
m3 )
30
40
50
60
70
80
90
100
110
SugarcaneKQB07-33281QN05-441QA00-3
Fig. 6—Compression characteristics of three energy cane varieties compared against factory sugarcane supplies.
If bagasse is to be used for other value adding opportunities in the future, it may be
necessary to consider measurements of fibre components such as cellulose, hemicellulose and lignin (O’Shea et al., 2010).
Conducting fibre tests efficiently The fibre quality and compression tests described above are time-consuming and costly to
perform. It is also sometimes difficult to determine the shearing point of a cane mat and inaccuracies can occur particularly at extreme ends of the range (Brotherton et al., 1986). A more efficient, safer and more consistent method of measuring fibre quality components is required.
Figure 5. A compression apparatus
Addressing factory needs in cane variety selection
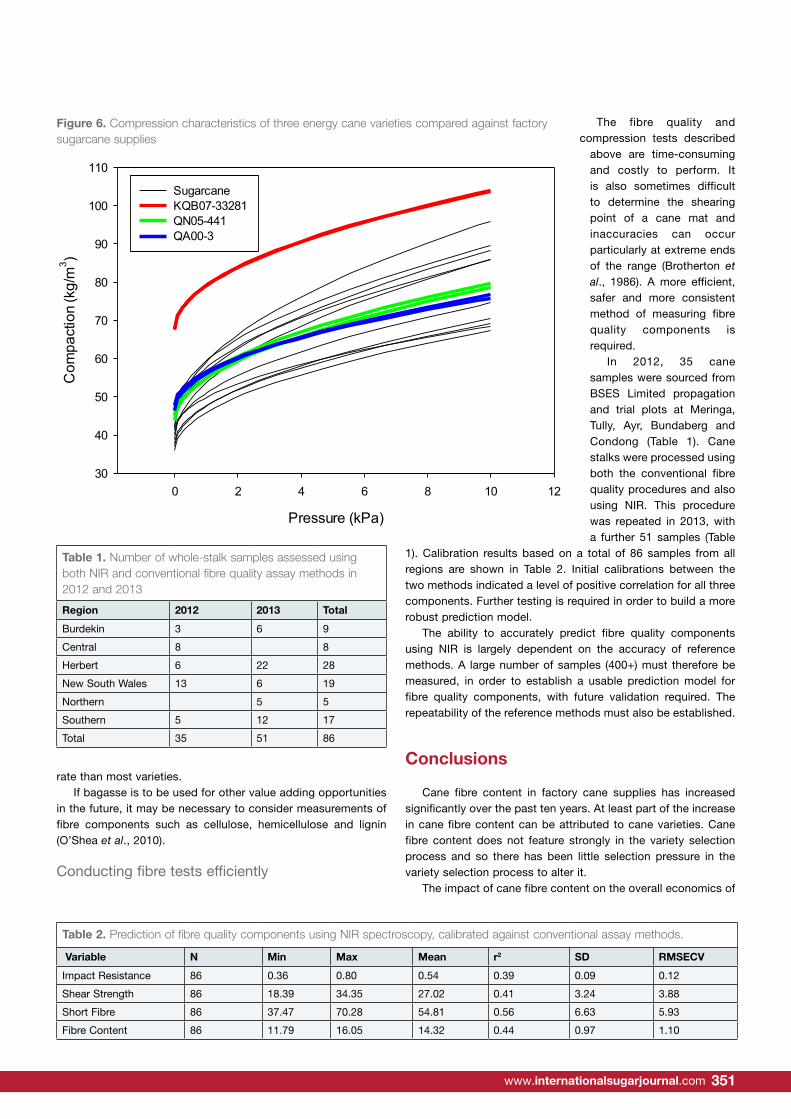
International Sugar Journal | May 2015350 351www.internationalsugarjournal.com
rate than most varieties.If bagasse is to be used for other value adding opportunities
in the future, it may be necessary to consider measurements of fibre components such as cellulose, hemicellulose and lignin (O’Shea et al., 2010).
Conducting fibre tests efficiently
The fibre quality and compression tests described
above are time-consuming and costly to perform. It is also sometimes difficult to determine the shearing point of a cane mat and inaccuracies can occur particularly at extreme ends of the range (Brotherton et al., 1986). A more efficient, safer and more consistent method of measuring fibre quality components is required.
In 2012, 35 cane samples were sourced from BSES Limited propagation and trial plots at Meringa, Tully, Ayr, Bundaberg and Condong (Table 1). Cane stalks were processed using both the conventional fibre quality procedures and also using NIR. This procedure was repeated in 2013, with a further 51 samples (Table
1). Calibration results based on a total of 86 samples from all regions are shown in Table 2. Initial calibrations between the two methods indicated a level of positive correlation for all three components. Further testing is required in order to build a more robust prediction model.
The ability to accurately predict fibre quality components using NIR is largely dependent on the accuracy of reference methods. A large number of samples (400+) must therefore be measured, in order to establish a usable prediction model for fibre quality components, with future validation required. The repeatability of the reference methods must also be established.
Conclusions
Cane fibre content in factory cane supplies has increased significantly over the past ten years. At least part of the increase in cane fibre content can be attributed to cane varieties. Cane fibre content does not feature strongly in the variety selection process and so there has been little selection pressure in the variety selection process to alter it.
The impact of cane fibre content on the overall economics of
Kent GA et al. Proc Aust Soc Sugar Cane Technol Vol 36 2014 ______________________________________________________________________________________
19
Fig. 5—A compression apparatus.
Pressure (kPa)
0 2 4 6 8 10 12
Com
pact
ion
(kg/
m3 )
30
40
50
60
70
80
90
100
110
SugarcaneKQB07-33281QN05-441QA00-3
Fig. 6—Compression characteristics of three energy cane varieties compared against factory sugarcane supplies.
If bagasse is to be used for other value adding opportunities in the future, it may be
necessary to consider measurements of fibre components such as cellulose, hemicellulose and lignin (O’Shea et al., 2010).
Conducting fibre tests efficiently The fibre quality and compression tests described above are time-consuming and costly to
perform. It is also sometimes difficult to determine the shearing point of a cane mat and inaccuracies can occur particularly at extreme ends of the range (Brotherton et al., 1986). A more efficient, safer and more consistent method of measuring fibre quality components is required.
Figure 6. Compression characteristics of three energy cane varieties compared against factory sugarcane supplies
Table 2. Prediction of fibre quality components using NIR spectroscopy, calibrated against conventional assay methods.
Variable N Min Max Mean r2 SD RMSECV
Impact Resistance 86 0.36 0.80 0.54 0.39 0.09 0.12
Shear Strength 86 18.39 34.35 27.02 0.41 3.24 3.88
Short Fibre 86 37.47 70.28 54.81 0.56 6.63 5.93
Fibre Content 86 11.79 16.05 14.32 0.44 0.97 1.10
Table 1. Number of whole-stalk samples assessed using both NIR and conventional fibre quality assay methods in 2012 and 2013
Region 2012 2013 Total
Burdekin 3 6 9
Central 8 8
Herbert 6 22 28
New South Wales 13 6 19
Northern 5 5
Southern 5 12 17
Total 35 51 86
International Sugar Journal | May 2015352 353www.internationalsugarjournal.com
sugarcane and sugar production is quite variable and depends largely on the available harvesting, transport and processing equipment, along with the end use for the bagasse. As a consequence, a favourable variety (from a fibre point of view) in one mill area will not necessarily be favourable in another.
A more detailed approach to variety selection that more completely takes into account the major cost and benefit impacts is proposed. The approach is based on the development and use of a more comprehensive mill area model that accounts for the income from the resulting bagasse, the impact on equipment capacity and season length, sugar and other products income and handleability impacts.
Once this model is developed, sensitivity analysis can determine which variety traits have the most impact on profitability and appropriate variety tests can be chosen.
The existing cane fibre content and at least some of the various fibre quality measurements will be most likely required. A compressibility test to measure milling capacity impacts also may be important.
Although this paper has focussed on cane fibre characteristics, this same methodology could be applied to other variety traits.
There is expected to be benefits to be gained by considering all traits in a holistic fashion rather than each trait individually to obtain a mill area value for a variety.
Acknowledgements
The authors gratefully acknowledge Neil McKenzie and Floren Plaza of QUT for their work in characterising the milling behaviour of energy canes and David Donald of SRA for his work in applying models for the NIR prediction of fibre quality against conventional tests.
MSF Sugar, Wilmar Sugar, Mackay Sugar, Bundaberg Sugar and NSW Sugar are acknowledged for the provision of fibre data that have been presented in the paper.
*This paper was presented at the 2014 Australian Society of Sugar Cane Technologists annual conference and is published here with the agreement of the Society.
References
Berding N, Marston DH (2010) Operational validation of the efficacy of
SpectraCane™, a high-speed analytical system for sugarcane quality
components. Proceedings of the Australian Society of Sugar Cane
Technologists 32, 445–459.
Brotherton GA, Cross KWV, Stewart PN (1986) Development of test
methods to predict the handling characteristics of cane fibre during the
milling process. Proceedings of the Australian Society of Sugar Cane
Technologists 8, 17–24.
Bureau of Sugar Experiment Stations (1984) The laboratory manual for
Australian sugar mills, Volume 1: Principles and practices.
Bureau of Sugar Experiment Stations (2001) The laboratory manual for
Australian sugar mills, Volume 2: Analytical methods and tables.
Cox M, Hogarth M, Smith G (2000) Cane breeding and improvement. In
‘Manual of Cane Growing’. (Eds DM Hogarth, PG Allsopp) pp. 91–108.
(Bureau of Sugar Experiment Stations, Indooroopilly).
Cullen RN (1986). The influence of shredder design on cane preparation.
Proceedings of the International Society of Sugar Cane Technologists 19,
831–838.
Cullen RN, McKay BR (1992) A review of the influence of mill size on
milling capacity. Proceedings of the International Society of Sugar Cane
Technologists 21, 688–701.
Jones JN, Schofield W, McKenzie NJ, Olson BC (2002) Factory rate control
based on more constant fibre rate. Proceedings of the Australian Society
of Sugar Cane Technologists 24, (electronic format) 7 pp.
Jones RK (2004) Cane harvesting to improve industry performance. SRDC
Technical Report 2/2004, Sugar Research and Development Corporation,
Brisbane.
Kent GA (2004) Predicting mill speed. Proceedings of the Australian
Society of Sugar Cane Technologists 26, (electronic format) 10 pp.
Kent GA (2007) The value of bagasse to an Australian raw sugar factory.
Proceedings of the Australian Society of Sugar Cane Technologists 29,
453–459.
Kent GA (2010) Estimating bagasse production. Proceedings of the
Australian Society of Sugar Cane Technologists 32, (electronic format) 13
pp.
Mason V, Edwards BP, Cullen RN (1983) The effects of varying cane fibre
characteristics on milling performance. Proceedings of the Australian
Society of Sugar Cane Technologists 5, 289–295.
Murry CR, Hutchinson R (1958) Movement of bagasse in long chutes.
Proceedings of the Queensland Society of Sugar Cane Technologists 25,
75–81.
O’Shea MG, Staunton SP, Burleigh M (2010) Implementation of on-line
near infrared (NIR) technologies for the analysis of cane, bagasse and
raw sugar in sugar factories to improve performance. Proceedings of the
International Society of Sugar Cane Technologists 27, 1–15.
Pope G, McDowall R, Massey W, Staunton S (2004) The use of NIR
spectroscopy in a cane quality incentive scheme. Proceedings of the
Australian Society of Sugar Cane Technologists 26, (electronic format) 8
pp.
Rao PNG, Kumar KN (2003) Effect of flowering on juice quality and fibre
content in sugarcane. Sugar Tech 5, 185–187.
Ridge R, Norris C (2000) Harvesting and transport. In ‘Manual of Cane
Growing’. (Eds DM Hogarth, PG Allsopp) pp. 353–367. (Bureau of Sugar
Experiment Stations, Indooroopilly).
Russell GE, Murry CR (1968) A method of determining settings for
three-roll mills. Proceedings of the Queensland Society of Sugar Cane
Technologists 35, 81–93.
Thaval OP, Kent GA (2012) An enhanced mill extraction model. Proceedings
of the Australian Society of Sugar Cane Technologists 34, (electronic
format) 11 pp.
Thorburn PJ, Archer AA, Hobson PA, Higgins AJ, Sandel GR, Prestwidge
DB, Andrew B, Antony G, McDonald LM, Downs P, Juffs R (2006) Value
chain analyses of whole crop harvesting to maximise co-generation.
Proceedings of the Australian Society of Sugar Cane Technologists 28,
(electronic format) 12 pp.
Wei X, Jackson P, Cox M, Stringer J (2006) Maximising economic benefits
to the whole sugarcane industry from the BSES-CSIRO sugarcane
improvement program. Proceedings of the Australian Society of Sugar
Cane Technologists 28, 181–186.
Wei X, Jackson P, Stringer J, Cox M (2008) Relative Economic Genetic Value
(rEGV) – an improved selection index to replace Net Merit Grade (NMG) in
the Australian sugarcane variety improvement program. Proceedings of
the Australian Society of Sugar Cane Technologists 30, 174–181.
Addressing factory needs in cane variety selection

International Sugar Journal | May 2015352 353www.internationalsugarjournal.com
International Sugar Journal | May 2015354 355www.internationalsugarjournal.com
Further progress on crystal growth on-line monitoring
Contact author: [email protected] SOCADEI. France
C. Bouché and B. Gaillac
Abstract A good characterization of the main variables affecting a strike can lead to an improved operation of any type
of pan. On-line monitoring of crystal growth performed by ITECA’ new generation of microscopes provides a
better knowledge of those variables, which are essential for achieving highest yield and cost effective production
of homogeneous crystals. The paper describes and discusses digital microscope operation at different stages
of the process (i.e. before seeding, at the seeding stage and during graining phase). A particular attention must
be paid to the location of the microscope onto the pan: it has to be mounted in front of a representative area to
provide good monitoring of the crystallization and valuable statistical information, especially in the first stages of
the process. This new tool has become indispensable for creating standard strikes - the ultimate goal being to
achieve full automation of the pan operation.
Keywords: crystal growth; batch pan; seeding; microscope; strike; statistical information; CV; MA, ITECA, online
monitoring
Introduction
There are many different parameters affecting a batch pan sugar boiling operation: some of them are fixed by the original design (type of pan or circulation inside it) while others are constantly evolving and interacting between each other (syrup purity, seed size and quality, steam supply, temperature, vacuum, concentration, level of super saturation, duration of each step, etc…). To get a massecuite of good quality, it is essential to establish the best possible sequence of operations involving these parameters and make sure the chosen strategy is correctly applied for every type of pan and for each strike.
Crystal growth on-line monitoring using ITECA MCC3000 microscope gives a very good knowledge of the sugar boiling process. The number of crystals, the Coefficient of Variation (CV) and the Mean Aperture (MA) real-time measurements provide the operator with the information necessary to ensure that the graining is focused, on schedule and moving toward the goal: a cost effective production of homogeneous crystals with the required size. In order to homogenize and stabilize the production regardless of the type of pan or of the operator, standard strikes can be set up while ensuring optimum operating points.
This paper describes how the pan microscope can play an important role at different stages of the process, especially when it is well positioned on the pan. Before seeding it checks the syrup quality and potentially detects contaminants or super coarse crystals that will limit the production of high quality crystals. At the seeding stage, it counts and measures the crystals to make sure the good volume with the correct size have entered the pan at the right time. During the graining phase, the CV and the MA are monitored to check normal crystal crop. Any non conformity (air bubbles, bad circulation, bad crystal size, etc…) can trigger alarms.
On the whole, every single data is registered for future analysis and complete traceability. On batch pans, different strikes can be compared at fixed intervals or at predefined key-points to easily follow the global trends of the measured data over time and closely run the pan.
Measurement principle
Crystal growth is analyzed using a pan microscope coupled to a high-resolution digital camera placed in front of a sight glass of the pan (figure 1).
A controlled LED light source illuminates the crystals moving
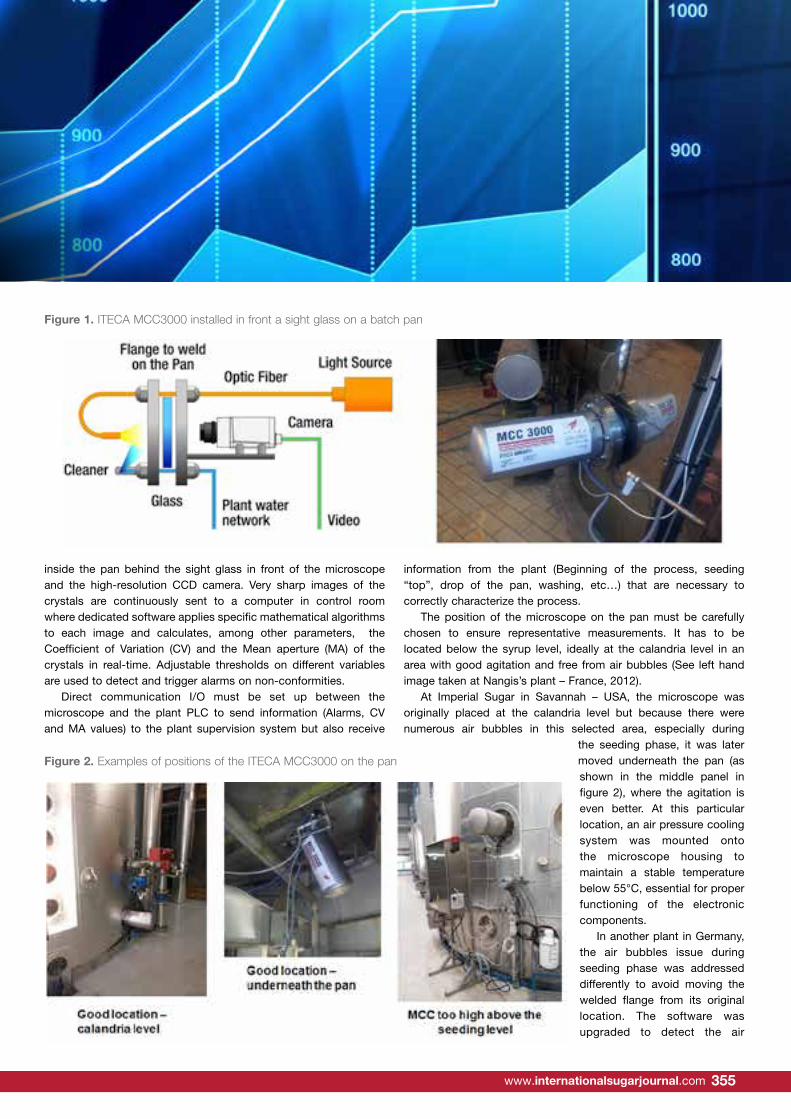
International Sugar Journal | May 2015354 355www.internationalsugarjournal.com
inside the pan behind the sight glass in front of the microscope and the high-resolution CCD camera. Very sharp images of the crystals are continuously sent to a computer in control room where dedicated software applies specific mathematical algorithms to each image and calculates, among other parameters, the Coefficient of Variation (CV) and the Mean aperture (MA) of the crystals in real-time. Adjustable thresholds on different variables are used to detect and trigger alarms on non-conformities.
Direct communication I/O must be set up between the microscope and the plant PLC to send information (Alarms, CV and MA values) to the plant supervision system but also receive
information from the plant (Beginning of the process, seeding “top”, drop of the pan, washing, etc…) that are necessary to correctly characterize the process.
The position of the microscope on the pan must be carefully chosen to ensure representative measurements. It has to be located below the syrup level, ideally at the calandria level in an area with good agitation and free from air bubbles (See left hand image taken at Nangis’s plant – France, 2012).
At Imperial Sugar in Savannah – USA, the microscope was originally placed at the calandria level but because there were numerous air bubbles in this selected area, especially during
the seeding phase, it was later moved underneath the pan (as shown in the middle panel in figure 2), where the agitation is even better. At this particular location, an air pressure cooling system was mounted onto the microscope housing to maintain a stable temperature below 55°C, essential for proper functioning of the electronic components.
In another plant in Germany, the air bubbles issue during seeding phase was addressed differently to avoid moving the welded flange from its original location. The software was upgraded to detect the air
2
the goal: a cost effective production of homogeneous crystals with the required size. In order to homogenize and stabilize the production regardless of the type of pan or of the operator, standard strikes can be set up while ensuring optimum operating points.
This paper describes how the pan microscope can play an important role at different stages of the process, especially when it is well positioned on the pan. Before seeding it checks the syrup quality and potentially detects contaminants or super coarse crystals that will limit the production of high quality crystals. At the seeding stage, it counts and measures the crystals to make sure the good volume with the correct size have entered the pan at the right time. During the graining phase, the CV and the MA are monitored to check normal crystal crop. Any non conformity (air bubbles, bad circulation, bad crystal size, etc…) can trigger alarms.
On the whole, every single data is registered for future analysis and complete traceability. On batch pans, different strikes can be compared at fixed intervals or at predefined key-points to easily follow the global trends of the measured data over time and closely run the pan.
2 – Measurement principle
Crystal growth is analyzed using a pan microscope coupled to a high-resolution digital camera placed in front of a sight glass of the pan (figure 1).
Figure 1. ITECA MCC3000 installed in front a sight glass on a batch pan
A controlled LED light source illuminates the crystals moving inside the pan behind the sight glass in front of the microscope and the high-resolution CCD camera. Very sharp images of the
Figure 1. ITECA MCC3000 installed in front a sight glass on a batch pan
3
crystals are continuously sent to a computer in control room where dedicated software applies specific mathematical algorithms to each image and calculates, among other parameters, the Coefficient of Variation (CV) and the Mean aperture (MA) of the crystals in real-time. Adjustable thresholds on different variables are used to detect and trigger alarms on non-conformities.
Direct communication I/O must be set up between the microscope and the plant PLC to send information (Alarms, CV and MA values) to the plant supervision system but also receive information from the plant (Beginning of the process, seeding “top”, drop of the pan, washing, etc…) that are necessary to correctly characterize the process.
The position of the microscope on the pan must be carefully chosen to ensure representative measurements. It has to be located below the syrup level, ideally at the calandria level in an area with good agitation and free from air bubbles (See left hand image taken at Nangis’s plant – France, 2012).
Figure 2. Examples of positions of the ITECA MCC3000 on the pan
At Imperial Sugar in Savannah – USA, the microscope was originally placed at the calandria level but because there were numerous air bubbles in this selected area, especially during the seeding phase, it was later moved underneath the pan (as shown in the middle panel in figure 2), where the agitation is even better. At this particular location, an air pressure cooling system was mounted onto the microscope housing to maintain a stable temperature below 55°C, essential for proper functioning of the electronic components.
In another plant in Germany, the air bubbles issue during seeding phase was addressed differently to avoid moving the welded flange from its original location. The software was upgraded to detect the air bubbles and take them out of the crystal size calculation.
Figure 2. Examples of positions of the ITECA MCC3000 on the pan
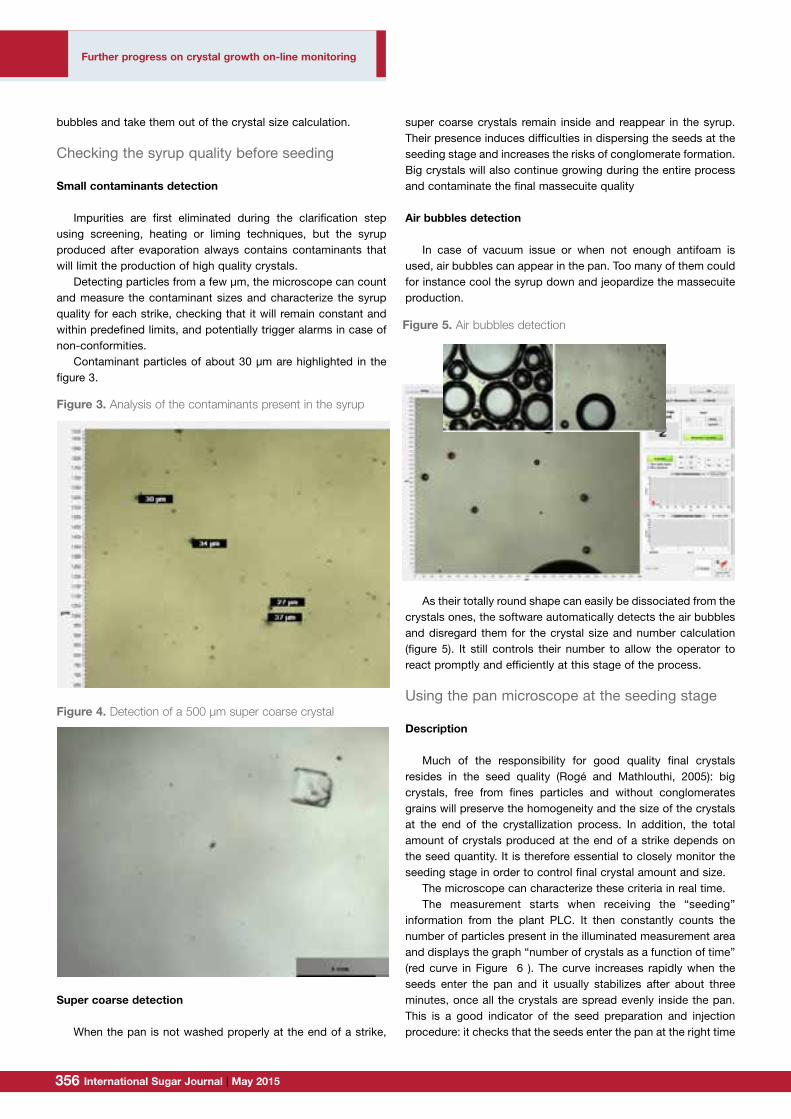
International Sugar Journal | May 2015356 357www.internationalsugarjournal.com
Further progress on crystal growth on-line monitoring
bubbles and take them out of the crystal size calculation.
Checking the syrup quality before seeding
Small contaminants detection
Impurities are first eliminated during the clarification step using screening, heating or liming techniques, but the syrup produced after evaporation always contains contaminants that will limit the production of high quality crystals.
Detecting particles from a few µm, the microscope can count and measure the contaminant sizes and characterize the syrup quality for each strike, checking that it will remain constant and within predefined limits, and potentially trigger alarms in case of non-conformities.
Contaminant particles of about 30 µm are highlighted in the figure 3.
Super coarse detection
When the pan is not washed properly at the end of a strike,
super coarse crystals remain inside and reappear in the syrup. Their presence induces difficulties in dispersing the seeds at the seeding stage and increases the risks of conglomerate formation. Big crystals will also continue growing during the entire process and contaminate the final massecuite quality
Air bubbles detection
In case of vacuum issue or when not enough antifoam is used, air bubbles can appear in the pan. Too many of them could for instance cool the syrup down and jeopardize the massecuite production.
As their totally round shape can easily be dissociated from the crystals ones, the software automatically detects the air bubbles and disregard them for the crystal size and number calculation (figure 5). It still controls their number to allow the operator to react promptly and efficiently at this stage of the process.
Using the pan microscope at the seeding stage
Description
Much of the responsibility for good quality final crystals resides in the seed quality (Rogé and Mathlouthi, 2005): big crystals, free from fines particles and without conglomerates grains will preserve the homogeneity and the size of the crystals at the end of the crystallization process. In addition, the total amount of crystals produced at the end of a strike depends on the seed quantity. It is therefore essential to closely monitor the seeding stage in order to control final crystal amount and size.
The microscope can characterize these criteria in real time. The measurement starts when receiving the “seeding”
information from the plant PLC. It then constantly counts the number of particles present in the illuminated measurement area and displays the graph “number of crystals as a function of time” (red curve in Figure 6 ). The curve increases rapidly when the seeds enter the pan and it usually stabilizes after about three minutes, once all the crystals are spread evenly inside the pan. This is a good indicator of the seed preparation and injection procedure: it checks that the seeds enter the pan at the right time
4
3 – Checking the syrup quality before seeding
3.1 Small contaminants detection Impurities are first eliminated during the clarification step using screening, heating or
liming techniques, but the syrup produced after evaporation always contains contaminants that will limit the production of high quality crystals.
Detecting particles from a few µm, the microscope can count and measure the contaminant sizes and characterize the syrup quality for each strike, checking that it will remain constant and within predefined limits, and potentially trigger alarms in case of non-conformities.
Figure 3. Analysis of the contaminants present in the syrup
Contaminant particles of about 30 µm are highlighted in the figure 3.
3.2 Super coarse detection When the pan is not washed properly at the end of a strike, super coarse crystals remain inside and reappear in the syrup. Their presence induces difficulties in dispersing the seeds at the seeding stage and increases the risks of conglomerate formation. Big crystals will also continue growing during the entire process and contaminate the final massecuite quality (figure 4).
Figure 3. Analysis of the contaminants present in the syrup
5
Figure 4. Detection of a 500 µm super coarse crystal
3.3 Air bubbles detection In case of vacuum issue or when not enough antifoam is used, air bubbles can appear in the pan. Too many of them could for instance cool the syrup down and jeopardize the massecuite production.
Figure 4. Detection of a 500 µm super coarse crystal
Figure 5. Air bubbles detection
3.3 Air bubbles detection In case of vacuum issue or when not enough antifoam is used, air bubbles can appear in the pan. Too many of them could for instance cool the syrup down and jeopardize the massecuite production.
Figure 5. Air bubbles detection
As their totally round shape can easily be dissociated from the crystals ones, the software automatically detects the air bubbles and disregard them for the crystal size and number calculation (figure 5). It still controls their number to allow the operator to react promptly and efficiently at this stage of the process.
4 – Using the pan microscope MCC3000 at the seeding stage
4.1 Description Much of the responsibility for good quality final crystals resides in the seed quality [Rogé and Mathlouthi, 2005]: big crystals, free from fines particles and without conglomerates grains will preserve the homogeneity and the size of the crystals at the end of the
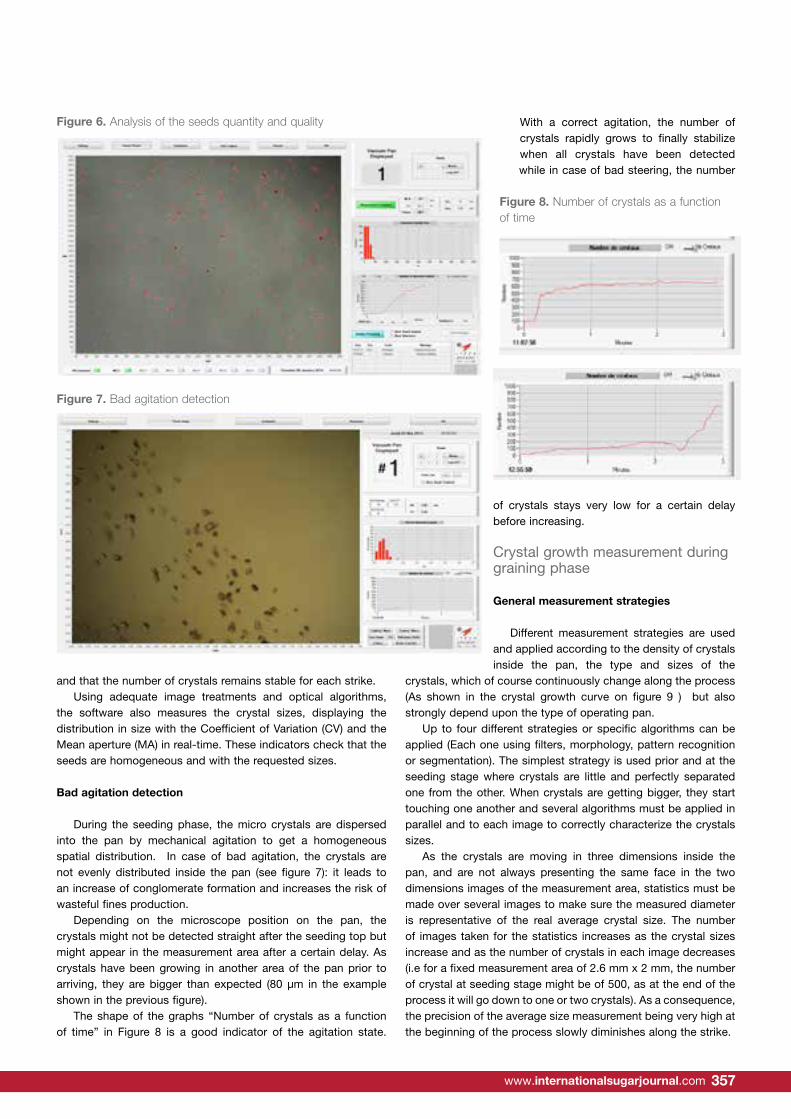
International Sugar Journal | May 2015356 357www.internationalsugarjournal.com
and that the number of crystals remains stable for each strike. Using adequate image treatments and optical algorithms,
the software also measures the crystal sizes, displaying the distribution in size with the Coefficient of Variation (CV) and the Mean aperture (MA) in real-time. These indicators check that the seeds are homogeneous and with the requested sizes.
Bad agitation detection
During the seeding phase, the micro crystals are dispersed into the pan by mechanical agitation to get a homogeneous spatial distribution. In case of bad agitation, the crystals are not evenly distributed inside the pan (see figure 7): it leads to an increase of conglomerate formation and increases the risk of wasteful fines production.
Depending on the microscope position on the pan, the crystals might not be detected straight after the seeding top but might appear in the measurement area after a certain delay. As crystals have been growing in another area of the pan prior to arriving, they are bigger than expected (80 µm in the example shown in the previous figure).
The shape of the graphs “Number of crystals as a function of time” in Figure 8 is a good indicator of the agitation state.
With a correct agitation, the number of crystals rapidly grows to finally stabilize when all crystals have been detected while in case of bad steering, the number
of crystals stays very low for a certain delay before increasing.
Crystal growth measurement during graining phase
General measurement strategies
Different measurement strategies are used and applied according to the density of crystals inside the pan, the type and sizes of the
crystals, which of course continuously change along the process (As shown in the crystal growth curve on figure 9 ) but also strongly depend upon the type of operating pan.
Up to four different strategies or specific algorithms can be applied (Each one using filters, morphology, pattern recognition or segmentation). The simplest strategy is used prior and at the seeding stage where crystals are little and perfectly separated one from the other. When crystals are getting bigger, they start touching one another and several algorithms must be applied in parallel and to each image to correctly characterize the crystals sizes.
As the crystals are moving in three dimensions inside the pan, and are not always presenting the same face in the two dimensions images of the measurement area, statistics must be made over several images to make sure the measured diameter is representative of the real average crystal size. The number of images taken for the statistics increases as the crystal sizes increase and as the number of crystals in each image decreases (i.e for a fixed measurement area of 2.6 mm x 2 mm, the number of crystal at seeding stage might be of 500, as at the end of the process it will go down to one or two crystals). As a consequence, the precision of the average size measurement being very high at the beginning of the process slowly diminishes along the strike.
7
displays the graph “number of crystals as a function of time” (red curve in Figure 6 ). The curve increases rapidly when the seeds enter the pan and it usually stabilizes after about three minutes, once all the crystals are spread evenly inside the pan. This is a good indicator of the seed preparation and injection procedure: it checks that the seeds enter the pan at the right time and that the number of crystals remains stable for each strike.
Using adequate image treatments and optical algorithms, the software also measures the crystal sizes, displaying the distribution in size with the Coefficient of Variation (CV) and the Mean aperture (MA) in real-time. These indicators check that the seeds are homogeneous and with the requested sizes.
Figure 6. Analysis of the seeds quantity and quality
4.2 Bad agitation detection During the seeding phase, the micro crystals are dispersed into the pan by mechanical agitation to get a homogeneous spatial distribution. In case of bad agitation, the crystals are not evenly distributed inside the pan (see figure 7): it leads to an increase of conglomerate formation and increases the risk of wasteful fines production.
Figure 6. Analysis of the seeds quantity and quality
8
Figure 7. Bad agitation detection
Depending on the microscope position on the pan, the crystals might not be detected straight after the seeding top but might appear in the measurement area after a certain delay. As crystals have been growing in another area of the pan prior to arriving, they are bigger than expected (80 µm in the example shown in the previous figure).
Figure 8. Number of crystals as a function of time
The shape of the graphs “Number of crystals as a function of time” in Figure 8 is a good indicator of the agitation state. With a correct agitation, the number of crystals rapidly grows to finally stabilize when all crystals have been detected while in case of bad steering, the number of crystals stays very low for a certain delay before increasing.
Figure 7. Bad agitation detection
8
Figure 7. Bad agitation detection
Depending on the microscope position on the pan, the crystals might not be detected straight after the seeding top but might appear in the measurement area after a certain delay. As crystals have been growing in another area of the pan prior to arriving, they are bigger than expected (80 µm in the example shown in the previous figure).
Figure 8. Number of crystals as a function of time
The shape of the graphs “Number of crystals as a function of time” in Figure 8 is a good indicator of the agitation state. With a correct agitation, the number of crystals rapidly grows to finally stabilize when all crystals have been detected while in case of bad steering, the number of crystals stays very low for a certain delay before increasing.
Figure 8. Number of crystals as a function of time
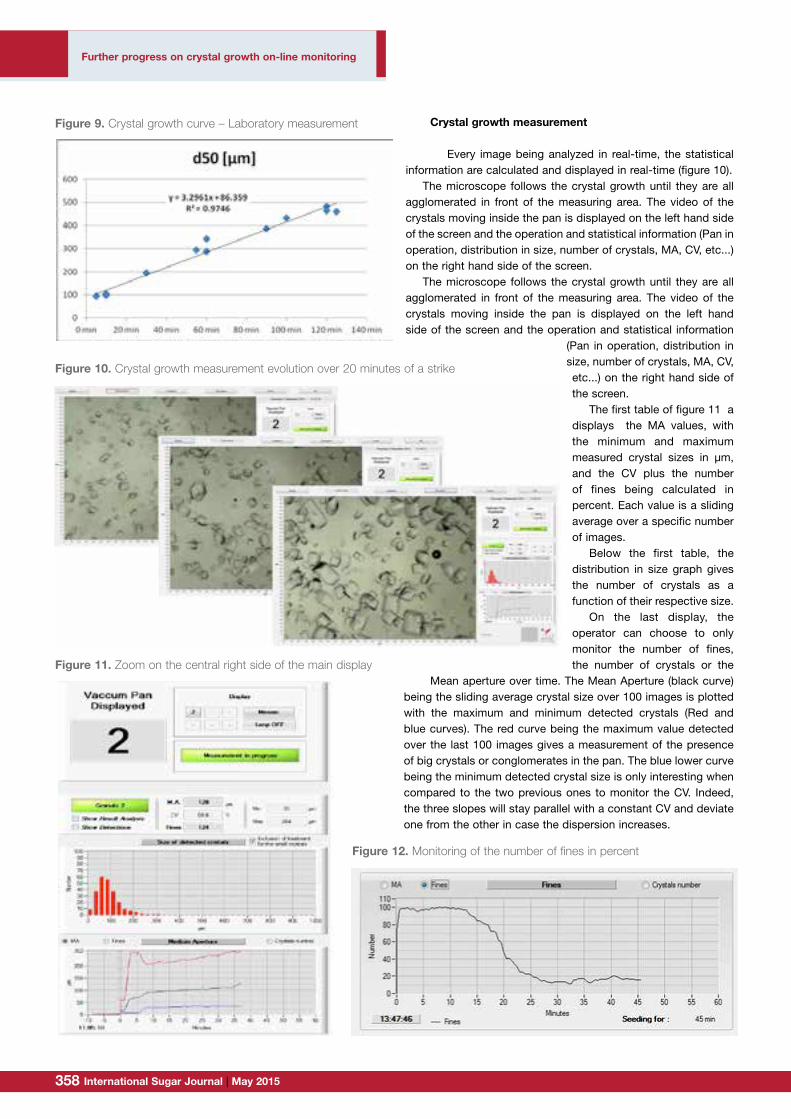
International Sugar Journal | May 2015358 359www.internationalsugarjournal.com
Crystal growth measurement
Every image being analyzed in real-time, the statistical information are calculated and displayed in real-time (figure 10).
The microscope follows the crystal growth until they are all agglomerated in front of the measuring area. The video of the crystals moving inside the pan is displayed on the left hand side of the screen and the operation and statistical information (Pan in operation, distribution in size, number of crystals, MA, CV, etc...) on the right hand side of the screen.
The microscope follows the crystal growth until they are all agglomerated in front of the measuring area. The video of the crystals moving inside the pan is displayed on the left hand side of the screen and the operation and statistical information
(Pan in operation, distribution in size, number of crystals, MA, CV, etc...) on the right hand side of the screen.
The first table of figure 11 a displays the MA values, with the minimum and maximum measured crystal sizes in µm, and the CV plus the number of fines being calculated in percent. Each value is a sliding average over a specific number of images.
Below the first table, the distribution in size graph gives the number of crystals as a function of their respective size.
On the last display, the operator can choose to only monitor the number of fines, the number of crystals or the
Mean aperture over time. The Mean Aperture (black curve) being the sliding average crystal size over 100 images is plotted with the maximum and minimum detected crystals (Red and blue curves). The red curve being the maximum value detected over the last 100 images gives a measurement of the presence of big crystals or conglomerates in the pan. The blue lower curve being the minimum detected crystal size is only interesting when compared to the two previous ones to monitor the CV. Indeed, the three slopes will stay parallel with a constant CV and deviate one from the other in case the dispersion increases.
9
5 – Crystal growth measurement during graining phase
5.1 General measurement strategies Different measurement strategies are used and applied according to the density of crystals inside the pan, the type and sizes of the crystals, which of course continuously change along the process (As shown in the crystal growth curve on figure 9 ) but also strongly depend upon the type of operating pan.
Figure 9. Crystal growth curve – Laboratory measurement
Up to four different strategies or specific algorithms can be applied (Each one using filters, morphology, pattern recognition or segmentation). The simplest strategy is used prior and at the seeding stage where crystals are little and perfectly separated one from the other. When crystals are getting bigger, they start touching one another and several algorithms must be applied in parallel and to each image to correctly characterize the crystals sizes. As the crystals are moving in three dimensions inside the pan, and are not always presenting the same face in the two dimensions images of the measurement area, statistics must be made over several images to make sure the measured diameter is representative of the real average crystal size. The number of images taken for the statistics increases as the crystal sizes increase and as the number of crystals in each image decreases (i.e for a fixed measurement area of 2.6 mm x 2 mm, the number of crystal at seeding stage might be of 500, as at the end of the process it will go
Figure 9. Crystal growth curve – Laboratory measurement
10
down to one or two crystals). As a consequence, the precision of the average size measurement being very high at the beginning of the process slowly diminishes along the strike.
5.2 Crystal growth measurement Every image being analyzed in real-time, the statistical information are calculated and displayed in real-time (figure 10).
Figure 10. Crystal growth measurement evolution over 20 minutes of a strike
The microscope follows the crystal growth until they are all agglomerated in front of the measuring area. The video of the crystals moving inside the pan is displayed on the left hand side of the screen and the operation and statistical information (Pan in operation, distribution in size, number of crystals, MA, CV, etc...) on the right hand side of the screen.
Figure 10. Crystal growth measurement evolution over 20 minutes of a strike
11
Figure 11. Zoom on the central right side of the main display
The first table of figure 11 a displays the MA values, with the minimum and maximum measured crystal sizes in µm, and the CV plus the number of fines being calculated in percent. Each value is a sliding average over a specific number of images.
Below the first table, the distribution in size graph gives the number of crystals as a function of their respective size.
On the last display, the operator can choose to only monitor the number of fines, the number of crystals or the Mean aperture over time. The Mean Aperture (black curve) being the sliding average crystal size over 100 images is plotted with the maximum and minimum detected crystals (Red and blue curves). The red curve being the maximum value detected over the last 100 images gives a measurement of the presence of big crystals or conglomerates in the pan. The blue lower curve being the minimum detected crystal size is only interesting when compared to the two previous ones to monitor the CV. Indeed, the three slopes will stay parallel with a constant CV and deviate one from the other in case the dispersion increases.
Figure 11. Zoom on the central right side of the main display
12
Operational limits of the system are reached when all the crystals are agglomerated in front of the sight glass. They strongly depend upon the original crystal density inside the pan and the duration of the different steps of the process.
5.3 Fines detection When the super saturation is not properly contained, it can lead to the spontaneous formation of crystals or false grains that will have a significant influence on the massecuite production (Libelle, 2007).
The software has a dedicated section that continuously monitors the presence of fines particles. In figure 12 the number of fines is plotted as a percentage of the overall crystal sizes.
Figure 12. Monitoring of the number of fines in percent
The “fines” definition is easily adjusted for every pan (i.e it is the number of crystals with size lower than x µm; x being configurable by the operator).
Typical shape is shown in Figure 12 : the number of fines is optimum during the first minutes of the process because the crystals are still small. The proportion of fines decreases steadily as the crystals size rises before stabilizing to about 15% (The number of fines can never be zero due to the residual noise and because there is always a certain amount of fines remaining in the pan).
Figure 12. Monitoring of the number of fines in percent
Further progress on crystal growth on-line monitoring
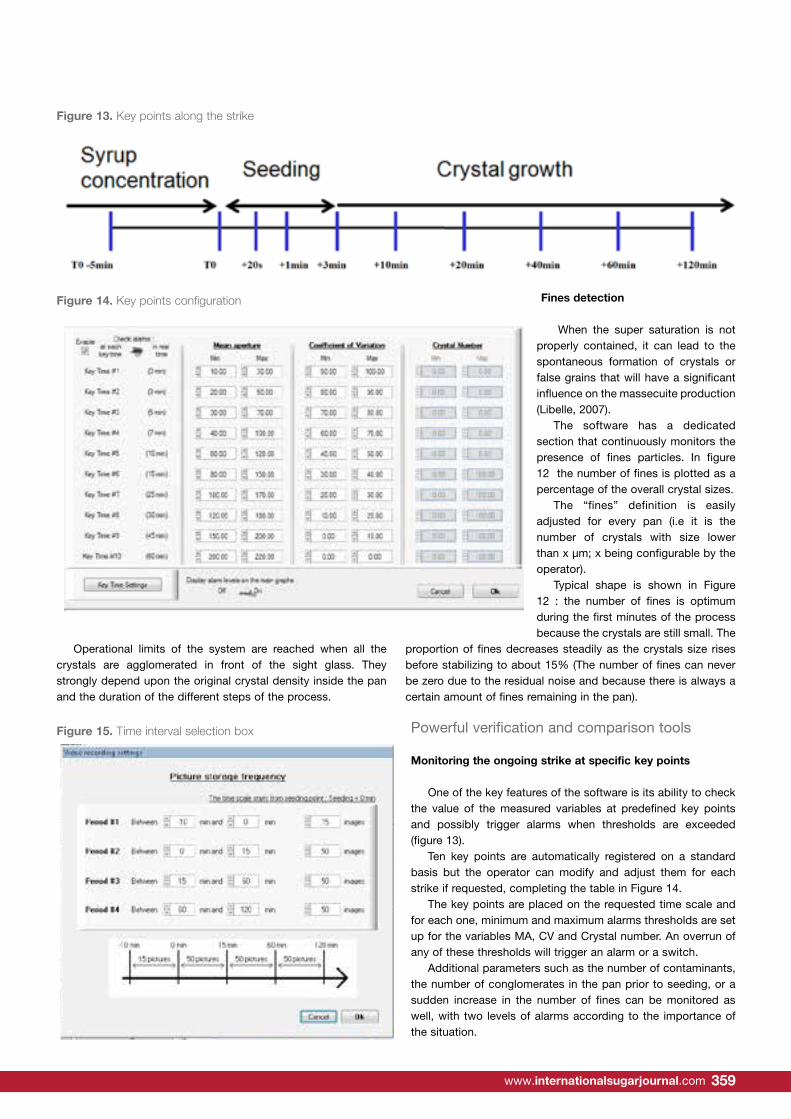
International Sugar Journal | May 2015358 359www.internationalsugarjournal.com
Operational limits of the system are reached when all the crystals are agglomerated in front of the sight glass. They strongly depend upon the original crystal density inside the pan and the duration of the different steps of the process.
Fines detection
When the super saturation is not properly contained, it can lead to the spontaneous formation of crystals or false grains that will have a significant influence on the massecuite production (Libelle, 2007).
The software has a dedicated section that continuously monitors the presence of fines particles. In figure 12 the number of fines is plotted as a percentage of the overall crystal sizes.
The “fines” definition is easily adjusted for every pan (i.e it is the number of crystals with size lower than x µm; x being configurable by the operator).
Typical shape is shown in Figure 12 : the number of fines is optimum during the first minutes of the process because the crystals are still small. The
proportion of fines decreases steadily as the crystals size rises before stabilizing to about 15% (The number of fines can never be zero due to the residual noise and because there is always a certain amount of fines remaining in the pan).
Powerful verification and comparison tools
Monitoring the ongoing strike at specific key points
One of the key features of the software is its ability to check the value of the measured variables at predefined key points and possibly trigger alarms when thresholds are exceeded (figure 13).
Ten key points are automatically registered on a standard basis but the operator can modify and adjust them for each strike if requested, completing the table in Figure 14.
The key points are placed on the requested time scale and for each one, minimum and maximum alarms thresholds are set up for the variables MA, CV and Crystal number. An overrun of any of these thresholds will trigger an alarm or a switch.
Additional parameters such as the number of contaminants, the number of conglomerates in the pan prior to seeding, or a sudden increase in the number of fines can be monitored as well, with two levels of alarms according to the importance of the situation.
Figure 13
Figure 14
Figure 13
Figure 14
Figure 13. Key points along the strike
Figure 14. Key points configuration
14
Additional parameters such as the number of contaminants, the number of conglomerates in the pan prior to seeding, or a sudden increase in the number of fines can be monitored as well, with two levels of alarms according to the importance of the situation.
6.2 Comparing various strikes between them or to a standard one All the data being stored in a SQL database, it can be easily accessed and manipulated to be analyzed. Another key feature of the software is its ability to compare up to three strikes over a common time axis, starting at their own seeding point.
The videos of each strike being fully recorded from minus 10 mn before seeding until the end of the strike, the first step of the comparison consists in sampling the images within four preselected time intervals (cf figure 15 ) in order to streamline and accelerate the treatment of the selected images.
Figure 15. Time interval selection box
The user can choose a specific number of images to be used in each interval: a larger number of images for a close monitoring in a certain time interval; a lower number of images when less precision is needed in another time interval.
The videos of the three strikes can then be run in parallel and compared over the same time scale starting ten minutes before each seeding points until the end of the process (figure 16).
Figure 15. Time interval selection box
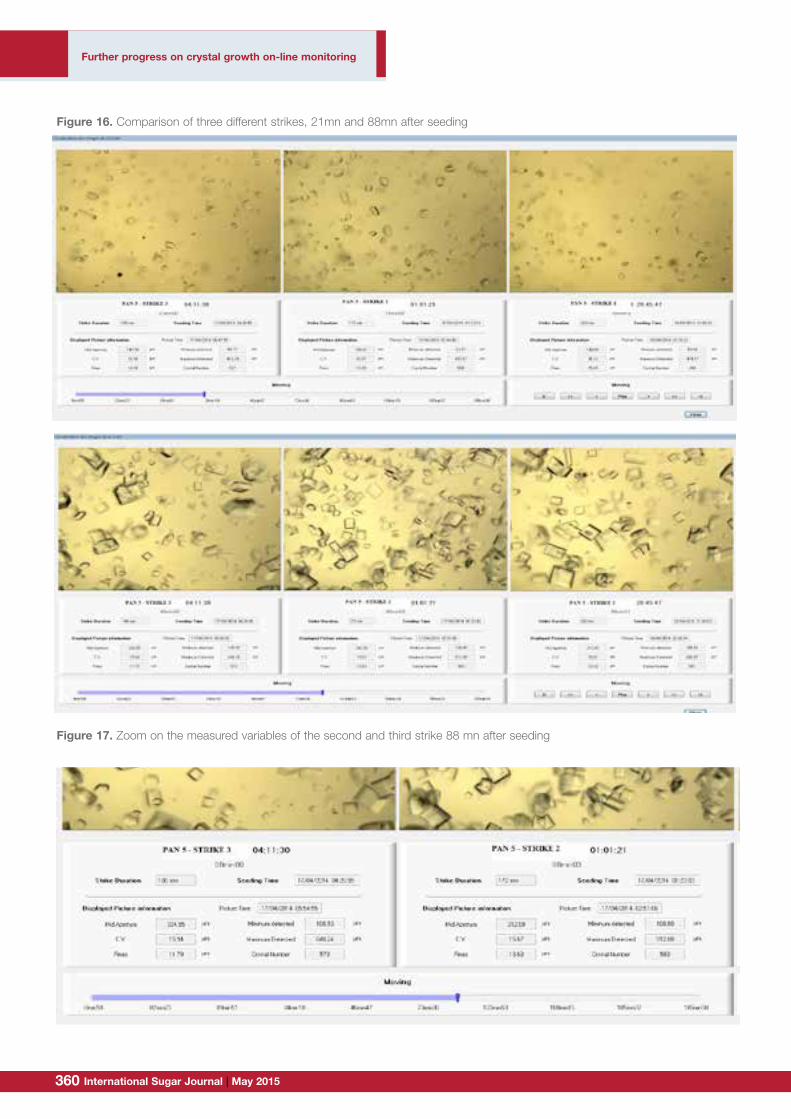
International Sugar Journal | May 2015360 361www.internationalsugarjournal.com
15
Figure 16. Comparison of three different strikes, 21mn and 88mn after seeding
The videos are either played in a single run over the entire length of the strikes or the cursor can be moved anywhere along the time axis to visualize the three videos at the same specific times, each strike being synchronized at their seeding point. The indicators are displayed in parallel and compared with each other.
The images themselves give a lot of information as it is easy to check whether the crystals are similar and distributed evenly inside the pan at the same time for each strike, but the value of each variable is also displayed for more precise monitoring and comparison (figure 17).
Figure 16. Comparison of three different strikes, 21mn and 88mn after seeding
16
Figure 17. Zoom on the measured variables of the second and third strike 88 mn after seeding
The MA, the crystal number or the number of fines can be compared at specific times.
The information makes even more sense when compared to the pan operation flow sheet as any change in the process is tracked and its impact directly measured on the crystal growth.
Another major use of this feature is to set a standard strike and compare it to the other strikes to make sure that the pan operation remains stable and within predefined limits, which will ensure a stable and good quality massecuite production.
5 – Conclusion
This new generation of digital pan microscope will soon become indispensable in sugar factories and refineries. Considerable benefits have already been demonstrated in optimizing the crystallization process. The ability of creating standard strikes now helps stabilizing the massecuite production irrespective of the type of pan or of the operator in charge of the operation, the ultimate goal being to achieve full automation of the pan operation.
Figure 17. Zoom on the measured variables of the second and third strike 88 mn after seeding
Further progress on crystal growth on-line monitoring
International Sugar Journal | May 2015360 361www.internationalsugarjournal.com
Comparing various strikes between them or to a standard one
All the data being stored in a SQL database, it can be easily accessed and manipulated to be analyzed. Another key feature of the software is its ability to compare up to three strikes over a common time axis, starting at their own seeding point.
The videos of each strike being fully recorded from minus 10 mn before seeding until the end of the strike, the first step of the comparison consists in sampling the images within four preselected time intervals (cf figure 15 ) in order to streamline and accelerate the treatment of the selected images.
The user can choose a specific number of images to be used in each interval: a larger number of images for a close monitoring in a certain time interval; a lower number of images when less precision is needed in another time interval.
The videos of the three strikes can then be run in parallel and compared over the same time scale starting ten minutes before each seeding points until the end of the process (figure 16).
The videos are either played in a single run over the entire length of the strikes or the cursor can be moved anywhere along the time axis to visualize the three videos at the same specific times, each strike being synchronized at their seeding point. The indicators are displayed in parallel and compared with each other.
The images themselves give a lot of information as it is easy to check whether the crystals are similar and distributed evenly inside the pan at the same time for each strike, but the value of each variable is also displayed for more precise monitoring and comparison (figure 17).
The MA, the crystal number or the number of fines can be compared at specific times.
The information makes even more sense when compared to the pan operation flow sheet as any change in the process is tracked and its impact directly measured on the crystal growth.
Another major use of this feature is to set a standard strike and compare it to the other strikes to make sure that the pan operation remains stable and within predefined limits, which will ensure a stable and good quality massecuite production.
Conclusion
This new generation of digital pan microscope will soon become indispensable in sugar factories and refineries. Considerable benefits have already been demonstrated in optimizing the crystallization process. The ability of creating standard strikes now helps stabilizing the massecuite production irrespective of the type of pan or of the operator in charge of the operation, the ultimate goal being to achieve full automation of the pan operation.
References
Barbara Rogé, Mohamed Mathlouthi (2005) Qualité de la semence,
contrôle de l’ensemencement et de la qualité des cristaux de sucre.
Proceedings of the AVH Association – 12th Symposium.
Teddy Jeannick Libelle (2007) Modèles de connaissance de la cristallisation
de troisième jet en sucrerie de cannes – Expérimentations et simulations.
PhD Thesis presented on September the 28th, 2007 by– Université de la
Réunion – UFR de Sciences et Technologies
Ferguson Screens Increase Productivity and Sweeten Profits Improve the efficiency
and performance of your sugar processing operation with Ferguson screens for improved crystal retention, faster purging and less clogging. Longer screen life means fewer changeovers and less downtime for machinery, resulting in greater profits for your sugar processing operation.
Tubular Slit (Staggered)
Backing Screen
Conical Slot Centrifugal Screens
Conical Slot Centrifugal Screens
Round Hole Centrifugal
Screens
130 Ernest Street ● Providence, RI 02905
Mud Filter Screens
Visit: www.isj.perfnow.comEmail: [email protected]
For more information:
FP-26796 ISJ QuarterPageAD.indd 1 1/23/12 4:22 PM
International Sugar Journal | May 2015362 363www.internationalsugarjournal.com
Effects of different types of storage and size reduction on biomethane potential of sugarbeets
Abstract Due to its high sugar content, sugarbeets are excellent feedstock for biogas production. Its limited annual
harvests necessitate appropriate yet economic storage prior to anaerobic digestion. In present study,
biomethane potential of frozen and freshly harvested sugarbeets was compared with low cost airtight ambient
temperature storage. For airtight stored sugarbeets, the maximum rate of methane production was 12.4 L
CH4 STP/kg/d, which was the highest amongst the three types of storage studied, and methane yield was
360.8 LCH4 STP/kg VS which was lower than frozen sugarbeets 423.4 L CH4 STP/kg VS but higher than fresh
sugarbeets 220.2 L CH4 STP/kg VS. It was also observed that size reduction increases the rate of production
of biogas but not biomethane yield. Duration of digestion of frozen beets was decreased by 40% when the
beets were coarsely shredded to 3 cm in size. Rate of methane production from airtight stored sugarbeets
was higher than that from size-reduced frozen sugarbeets, consequently the duration of digestion of airtight-
stored beets was only about 75% of the duration required for digesting shredded sugarbeets. Simple airtight
ambient temperature storage may be a viable option for uninterrupted utilization of sugar beets as feedstock
for anaerobic digestion between annual harvests of the crop.
Keywords: sugar beet, anaerobic digestion, methane, biogas
1Agricultural and Biological Engineering Department, University of Florida, Gainesville, FL, U.S.A.
Introduction
Anaerobic digestion is a biochemical process in which a syntrophic mixed culture of microorganisms convert organic matter (like carbohydrates, proteins and fats) to biogas, which is a mixture of methane and carbon dioxide, under near ambient conditions. Biogas can be used as a fuel for process heat or electricity generation. The process has found wide applications for municipal, industrial and agricultural waste treatment and pollution control. Nowadays, the process is also being applied for renewable energy generation using specifically grown energy crops. Usually crops that can be readily anaerobically digested are characterized by high sugar or starch content. Since crops are harvested once annually, a challenge in utilization of these crops for energy generation would be economical storage. Sugar beet is a potential energy crop containing around 16 % sugar by weight. Storage technologies like freezing or cold storage are used to preserve the sugar beets. These are
expensive and demands labor and maintenance (Sapp 2013). In North America, since the climate is cold where sugar beets are cultivated, it is possible to naturally freeze the sugar beets in outdoor piles. The sugar factories are operated for almost eight to nine months. However in Europe, the sugar beet factories are operated for around three months in a year during which period all the harvested beets are processed before spoilage. The choice of storage technique is dependent on the biofuel that will be produced. For example, if sugar beets are used for ethanol production then storage techniques that preserve the sugars need to be employed. However for anaerobic digestion it is not necessary for the sugars to be preserved. Inexpensive storage like ensilage (O’Kiely and Moloney 1999), storage in plastic containers (drums) with anti-fungal solutions (Wagner et al. 2010), and room temperature storage (Burba et al. 1975) which may not preserve the sugars but are used to store sugar beets for animal fodder, may be applicable for biogasification as well.
Effects of ensiling of crops like corn, sugarbeet pulp, sugarcane
Contact author: [email protected] (352) 392-1864 ext. 203
Samriddhi Buxy1 and Pratap Pullammanappallil1*
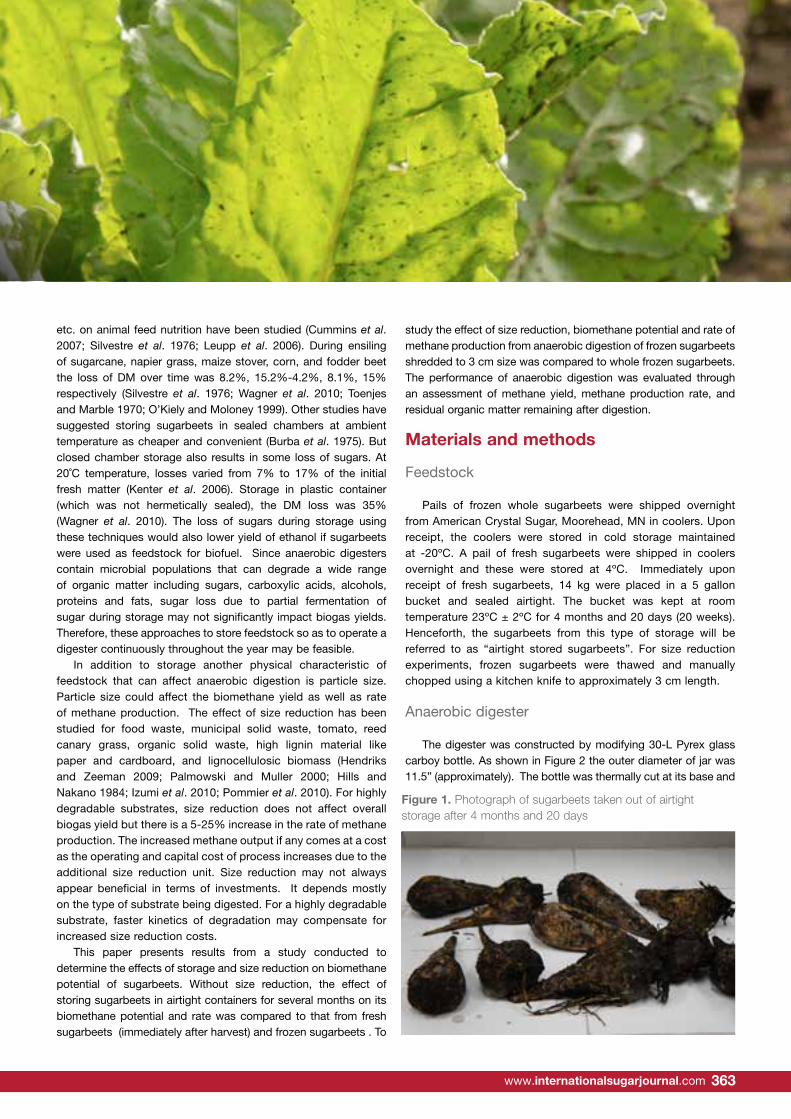
International Sugar Journal | May 2015362 363www.internationalsugarjournal.com
etc. on animal feed nutrition have been studied (Cummins et al. 2007; Silvestre et al. 1976; Leupp et al. 2006). During ensiling of sugarcane, napier grass, maize stover, corn, and fodder beet the loss of DM over time was 8.2%, 15.2%-4.2%, 8.1%, 15% respectively (Silvestre et al. 1976; Wagner et al. 2010; Toenjes and Marble 1970; O’Kiely and Moloney 1999). Other studies have suggested storing sugarbeets in sealed chambers at ambient temperature as cheaper and convenient (Burba et al. 1975). But closed chamber storage also results in some loss of sugars. At 20˚C temperature, losses varied from 7% to 17% of the initial fresh matter (Kenter et al. 2006). Storage in plastic container (which was not hermetically sealed), the DM loss was 35% (Wagner et al. 2010). The loss of sugars during storage using these techniques would also lower yield of ethanol if sugarbeets were used as feedstock for biofuel. Since anaerobic digesters contain microbial populations that can degrade a wide range of organic matter including sugars, carboxylic acids, alcohols, proteins and fats, sugar loss due to partial fermentation of sugar during storage may not significantly impact biogas yields. Therefore, these approaches to store feedstock so as to operate a digester continuously throughout the year may be feasible.
In addition to storage another physical characteristic of feedstock that can affect anaerobic digestion is particle size. Particle size could affect the biomethane yield as well as rate of methane production. The effect of size reduction has been studied for food waste, municipal solid waste, tomato, reed canary grass, organic solid waste, high lignin material like paper and cardboard, and lignocellulosic biomass (Hendriks and Zeeman 2009; Palmowski and Muller 2000; Hills and Nakano 1984; Izumi et al. 2010; Pommier et al. 2010). For highly degradable substrates, size reduction does not affect overall biogas yield but there is a 5-25% increase in the rate of methane production. The increased methane output if any comes at a cost as the operating and capital cost of process increases due to the additional size reduction unit. Size reduction may not always appear beneficial in terms of investments. It depends mostly on the type of substrate being digested. For a highly degradable substrate, faster kinetics of degradation may compensate for increased size reduction costs.
This paper presents results from a study conducted to determine the effects of storage and size reduction on biomethane potential of sugarbeets. Without size reduction, the effect of storing sugarbeets in airtight containers for several months on its biomethane potential and rate was compared to that from fresh sugarbeets (immediately after harvest) and frozen sugarbeets . To
study the effect of size reduction, biomethane potential and rate of methane production from anaerobic digestion of frozen sugarbeets shredded to 3 cm size was compared to whole frozen sugarbeets. The performance of anaerobic digestion was evaluated through an assessment of methane yield, methane production rate, and residual organic matter remaining after digestion.
Materials and methods
Feedstock
Pails of frozen whole sugarbeets were shipped overnight from American Crystal Sugar, Moorehead, MN in coolers. Upon receipt, the coolers were stored in cold storage maintained at -20ºC. A pail of fresh sugarbeets were shipped in coolers overnight and these were stored at 4ºC. Immediately upon receipt of fresh sugarbeets, 14 kg were placed in a 5 gallon bucket and sealed airtight. The bucket was kept at room temperature 23ºC ± 2ºC for 4 months and 20 days (20 weeks). Henceforth, the sugarbeets from this type of storage will be referred to as “airtight stored sugarbeets”. For size reduction experiments, frozen sugarbeets were thawed and manually chopped using a kitchen knife to approximately 3 cm length.
Anaerobic digester
The digester was constructed by modifying 30-L Pyrex glass carboy bottle. As shown in Figure 2 the outer diameter of jar was 11.5” (approximately). The bottle was thermally cut at its base and
Figure 1. Photograph of sugarbeets taken out of airtight storage after 4 months and 20
days
Figure 1. Photograph of sugarbeets taken out of airtight storage after 4 months and 20 days
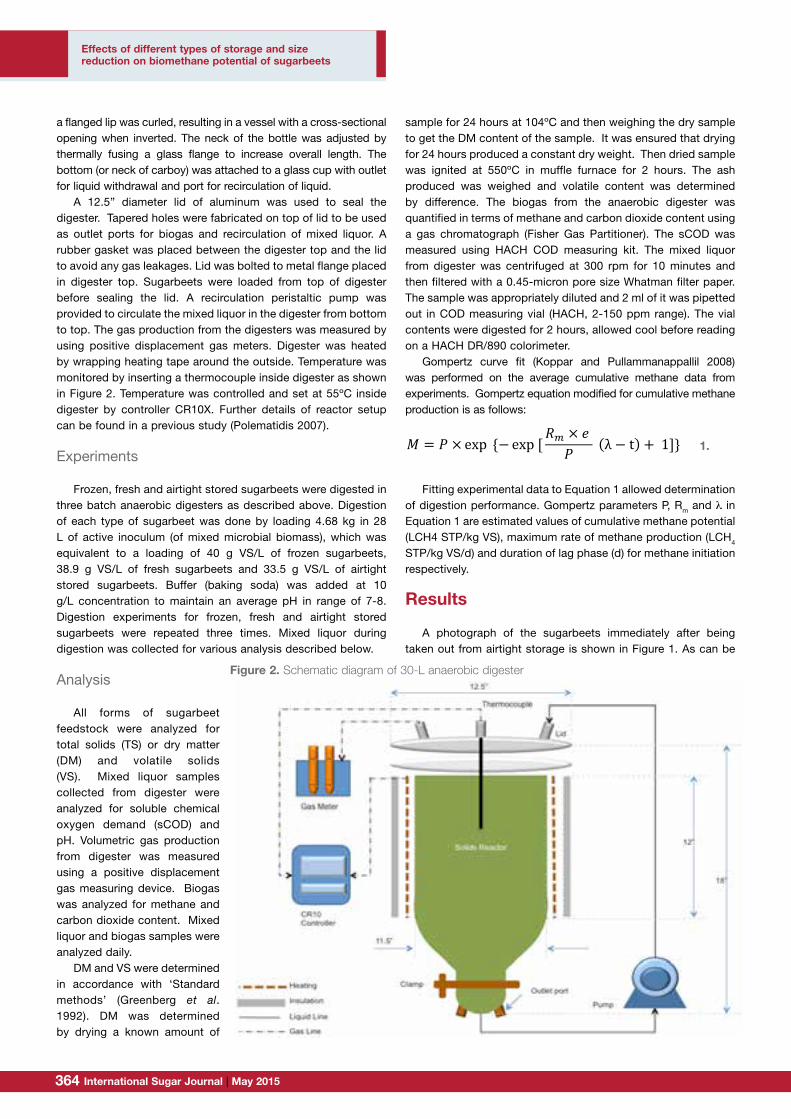
International Sugar Journal | May 2015364 365www.internationalsugarjournal.com
Effects of different types of storage and size reduction on biomethane potential of sugarbeets
a flanged lip was curled, resulting in a vessel with a cross-sectional opening when inverted. The neck of the bottle was adjusted by thermally fusing a glass flange to increase overall length. The bottom (or neck of carboy) was attached to a glass cup with outlet for liquid withdrawal and port for recirculation of liquid.
A 12.5” diameter lid of aluminum was used to seal the digester. Tapered holes were fabricated on top of lid to be used as outlet ports for biogas and recirculation of mixed liquor. A rubber gasket was placed between the digester top and the lid to avoid any gas leakages. Lid was bolted to metal flange placed in digester top. Sugarbeets were loaded from top of digester before sealing the lid. A recirculation peristaltic pump was provided to circulate the mixed liquor in the digester from bottom to top. The gas production from the digesters was measured by using positive displacement gas meters. Digester was heated by wrapping heating tape around the outside. Temperature was monitored by inserting a thermocouple inside digester as shown in Figure 2. Temperature was controlled and set at 55ºC inside digester by controller CR10X. Further details of reactor setup can be found in a previous study (Polematidis 2007).
Experiments
Frozen, fresh and airtight stored sugarbeets were digested in three batch anaerobic digesters as described above. Digestion of each type of sugarbeet was done by loading 4.68 kg in 28 L of active inoculum (of mixed microbial biomass), which was equivalent to a loading of 40 g VS/L of frozen sugarbeets, 38.9 g VS/L of fresh sugarbeets and 33.5 g VS/L of airtight stored sugarbeets. Buffer (baking soda) was added at 10 g/L concentration to maintain an average pH in range of 7-8. Digestion experiments for frozen, fresh and airtight stored sugarbeets were repeated three times. Mixed liquor during digestion was collected for various analysis described below.
Analysis
All forms of sugarbeet feedstock were analyzed for total solids (TS) or dry matter (DM) and volatile solids (VS). Mixed liquor samples collected from digester were analyzed for soluble chemical oxygen demand (sCOD) and pH. Volumetric gas production from digester was measured using a positive displacement gas measuring device. Biogas was analyzed for methane and carbon dioxide content. Mixed liquor and biogas samples were analyzed daily.
DM and VS were determined in accordance with ‘Standard methods’ (Greenberg et al. 1992). DM was determined by drying a known amount of
sample for 24 hours at 104ºC and then weighing the dry sample to get the DM content of the sample. It was ensured that drying for 24 hours produced a constant dry weight. Then dried sample was ignited at 550ºC in muffle furnace for 2 hours. The ash produced was weighed and volatile content was determined by difference. The biogas from the anaerobic digester was quantified in terms of methane and carbon dioxide content using a gas chromatograph (Fisher Gas Partitioner). The sCOD was measured using HACH COD measuring kit. The mixed liquor from digester was centrifuged at 300 rpm for 10 minutes and then filtered with a 0.45-micron pore size Whatman filter paper. The sample was appropriately diluted and 2 ml of it was pipetted out in COD measuring vial (HACH, 2-150 ppm range). The vial contents were digested for 2 hours, allowed cool before reading on a HACH DR/890 colorimeter.
Gompertz curve fit (Koppar and Pullammanappallil 2008) was performed on the average cumulative methane data from experiments. Gompertz equation modified for cumulative methane production is as follows:
Fitting experimental data to Equation 1 allowed determination of digestion performance. Gompertz parameters P, Rm and λ in Equation 1 are estimated values of cumulative methane potential (LCH4 STP/kg VS), maximum rate of methane production (LCH4 STP/kg VS/d) and duration of lag phase (d) for methane initiation respectively.
Results
A photograph of the sugarbeets immediately after being taken out from airtight storage is shown in Figure 1. As can be
appropriately diluted and 2 ml of it was pipetted out in COD measuring vial (HACH, 2-
150 ppm range). The vial contents were digested for 2 hours, allowed cool before reading
on a HACH DR/890 colorimeter.
Gompertz curve fit (Koppar and Pullammanappallil 2008) was performed on the
average cumulative methane data from experiments using whole frozen sugarbeet,
shredded frozen sugarbeet, airtight stored sugarbeet and fresh sugarbeet. Gompertz
equation modified for cumulative methane production is as follows:
𝑀𝑀 = 𝑃𝑃 × exp {− exp [𝑅𝑅! × 𝑒𝑒 𝑃𝑃 λ− t + 1]} 1
Fitting experimental data to Equation 1 allowed determination of digestion
performance. Gompertz parameters P, Rm and 𝜆𝜆 in Equation 1 are estimated cumulative
methane potential (LCH4 STP/kg VS), maximum rate of methane production (LCH4
STP/kg VS/d) and duration of lag phase (d) for methane initiation respectively.
3. Results
A photograph of the sugarbeets immediately after being taken out from airtight
storage is shown in Figure 2. As can be seen, sugarbeets were found intact, non-bruised
and no microbial/fungal growth on the surface. There was no leachate (free liquid)
accumulation in the container. The sugarbeets after being taken out of airtight storage
weighed 12.25 kg, which was 87.5% of initial weight loaded into the bucket. This
corresponded to a weight loss of 12.5% during airtight storage.
The results for DM content (or total solids, TS) and VS of the sugarbeets stored
under different conditions are summarized in Table 1. The DM and VS content of fresh
sugarbeets were (24.8±0.54) %, (94±2.31) % respectively. The DM and VS content of
1.
Figure 2. Schematic diagram of 30-L anaerobic digester
Figure 2. Schematic diagram of 30-L anaerobic digester
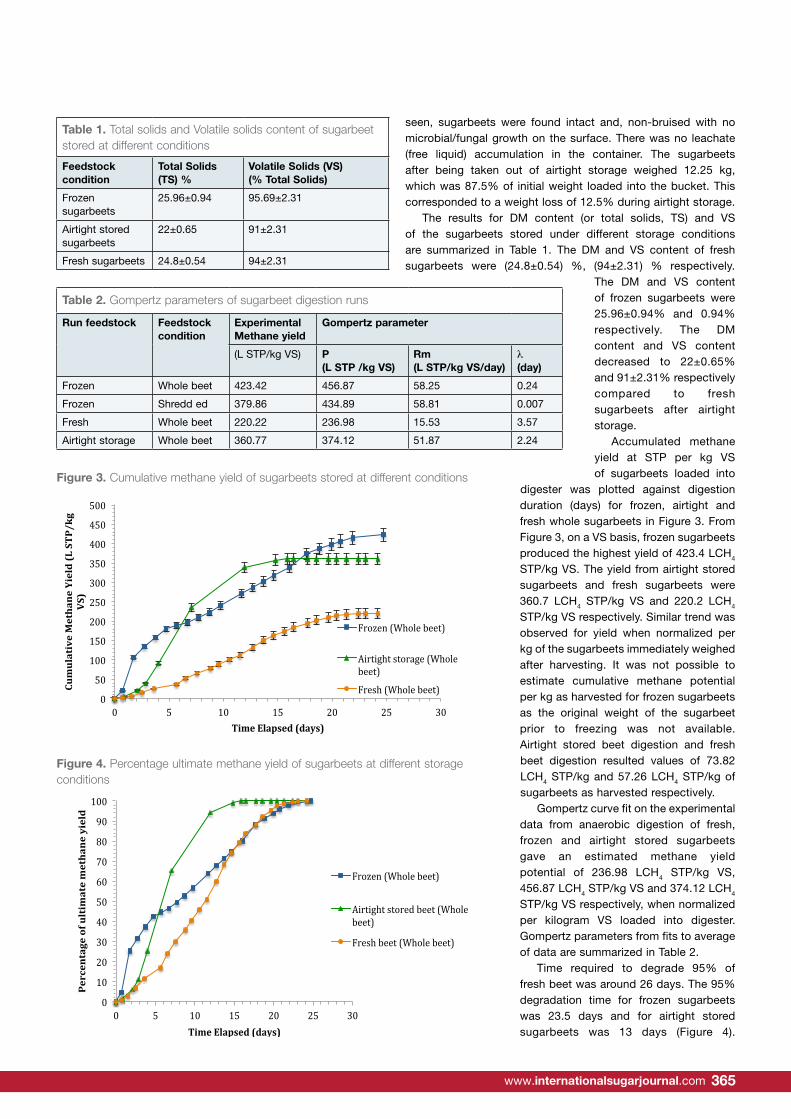
International Sugar Journal | May 2015364 365www.internationalsugarjournal.com
seen, sugarbeets were found intact and, non-bruised with no microbial/fungal growth on the surface. There was no leachate (free liquid) accumulation in the container. The sugarbeets after being taken out of airtight storage weighed 12.25 kg, which was 87.5% of initial weight loaded into the bucket. This corresponded to a weight loss of 12.5% during airtight storage.
The results for DM content (or total solids, TS) and VS of the sugarbeets stored under different storage conditions are summarized in Table 1. The DM and VS content of fresh sugarbeets were (24.8±0.54) %, (94±2.31) % respectively.
The DM and VS content of frozen sugarbeets were 25.96±0.94% and 0.94% respectively. The DM content and VS content decreased to 22±0.65% and 91±2.31% respectively compared to fresh sugarbeets after airtight storage.
Accumulated methane yield at STP per kg VS of sugarbeets loaded into
digester was plotted against digestion duration (days) for frozen, airtight and fresh whole sugarbeets in Figure 3. From Figure 3, on a VS basis, frozen sugarbeets produced the highest yield of 423.4 LCH4 STP/kg VS. The yield from airtight stored sugarbeets and fresh sugarbeets were 360.7 LCH4 STP/kg VS and 220.2 LCH4 STP/kg VS respectively. Similar trend was observed for yield when normalized per kg of the sugarbeets immediately weighed after harvesting. It was not possible to estimate cumulative methane potential per kg as harvested for frozen sugarbeets as the original weight of the sugarbeet prior to freezing was not available. Airtight stored beet digestion and fresh beet digestion resulted values of 73.82 LCH4 STP/kg and 57.26 LCH4 STP/kg of sugarbeets as harvested respectively.
Gompertz curve fit on the experimental data from anaerobic digestion of fresh, frozen and airtight stored sugarbeets gave an estimated methane yield potential of 236.98 LCH4 STP/kg VS, 456.87 LCH4 STP/kg VS and 374.12 LCH4 STP/kg VS respectively, when normalized per kilogram VS loaded into digester. Gompertz parameters from fits to average of data are summarized in Table 2.
Time required to degrade 95% of fresh beet was around 26 days. The 95% degradation time for frozen sugarbeets was 23.5 days and for airtight stored sugarbeets was 13 days (Figure 4).
Table 1. Total solids and Volatile solids content of sugarbeet stored at different conditions
Feedstock condition
Total Solids (TS) %
Volatile Solids (VS) (% Total Solids)
Frozen sugarbeets
25.96±0.94 95.69±2.31
Airtight stored sugarbeets
22±0.65 91±2.31
Fresh sugarbeets 24.8±0.54 94±2.31
Figure 3. Cumulative methane yield of sugarbeets stored at different conditions
Figure 4. Percentage ultimate methane yield of sugarbeets at different storage conditions
0
50
100
150
200
250
300
350
400
450
500
0 5 10 15 20 25 30
Cumulative Metha
ne Yield (L ST
P/kg
VS)
Time Elapsed (days)
Frozen (Whole beet)
Airtight storage (Whole beet)
Fresh (Whole beet)
0
10
20
30
40
50
60
70
80
90
100
0 5 10 15 20 25 30
Percen
tage of u
ltim
ate metha
ne yield
Time Elapsed (days)
Frozen (Whole beet)
Airtight stored beet (Whole beet)
Fresh beet (Whole beet)
Figure 3. Cumulative methane yield of sugarbeets stored at different conditions
Figure 4. Percentage ultimate methane yield of sugarbeets at different storage conditions
Table 2. Gompertz parameters of sugarbeet digestion runs
Run feedstock Feedstock condition
Experimental Methane yield
Gompertz parameter
(L STP/kg VS) P (L STP /kg VS)
Rm (L STP/kg VS/day)
λ (day)
Frozen Whole beet 423.42 456.87 58.25 0.24
Frozen Shredd ed 379.86 434.89 58.81 0.007
Fresh Whole beet 220.22 236.98 15.53 3.57
Airtight storage Whole beet 360.77 374.12 51.87 2.24
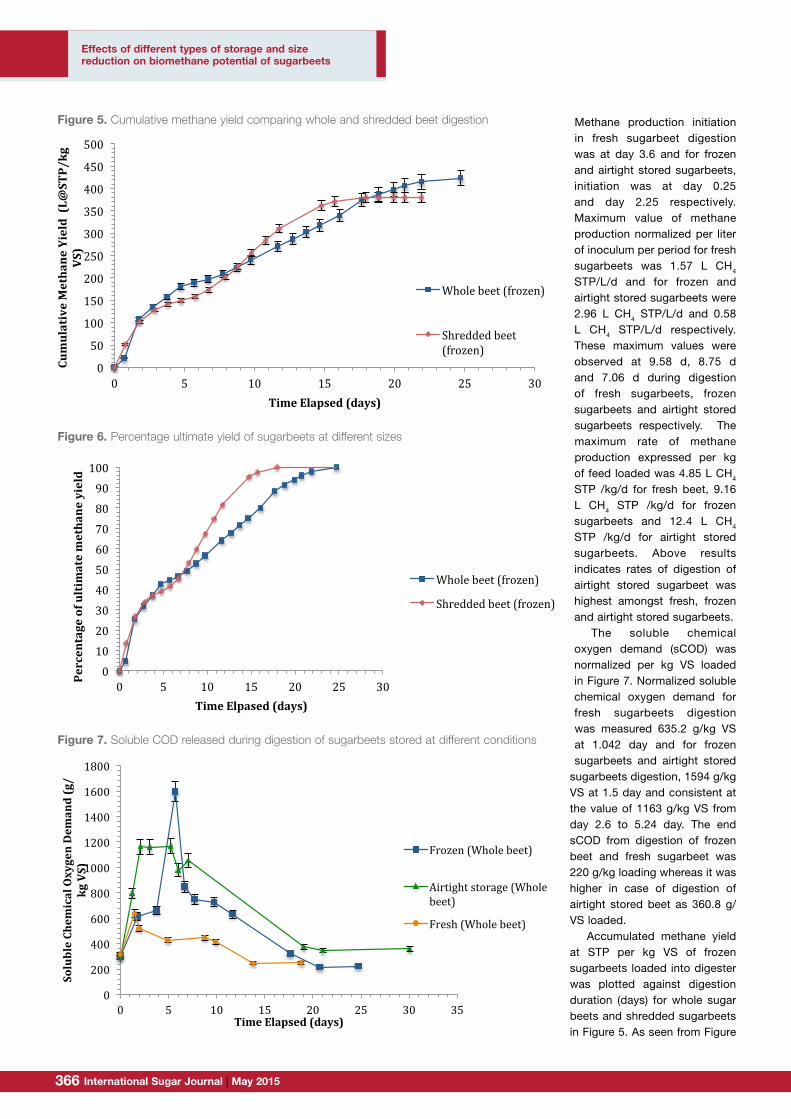
International Sugar Journal | May 2015366 367www.internationalsugarjournal.com
Methane production initiation in fresh sugarbeet digestion was at day 3.6 and for frozen and airtight stored sugarbeets, initiation was at day 0.25 and day 2.25 respectively. Maximum value of methane production normalized per liter of inoculum per period for fresh sugarbeets was 1.57 L CH4 STP/L/d and for frozen and airtight stored sugarbeets were 2.96 L CH4 STP/L/d and 0.58 L CH4 STP/L/d respectively. These maximum values were observed at 9.58 d, 8.75 d and 7.06 d during digestion of fresh sugarbeets, frozen sugarbeets and airtight stored sugarbeets respectively. The maximum rate of methane production expressed per kg of feed loaded was 4.85 L CH4 STP /kg/d for fresh beet, 9.16 L CH4 STP /kg/d for frozen sugarbeets and 12.4 L CH4 STP /kg/d for airtight stored sugarbeets. Above results indicates rates of digestion of airtight stored sugarbeet was highest amongst fresh, frozen and airtight stored sugarbeets.
The soluble chemical oxygen demand (sCOD) was normalized per kg VS loaded in Figure 7. Normalized soluble chemical oxygen demand for fresh sugarbeets digestion was measured 635.2 g/kg VS at 1.042 day and for frozen sugarbeets and airtight stored
sugarbeets digestion, 1594 g/kg VS at 1.5 day and consistent at the value of 1163 g/kg VS from day 2.6 to 5.24 day. The end sCOD from digestion of frozen beet and fresh sugarbeet was 220 g/kg loading whereas it was higher in case of digestion of airtight stored beet as 360.8 g/VS loaded.
Accumulated methane yield at STP per kg VS of frozen sugarbeets loaded into digester was plotted against digestion duration (days) for whole sugar beets and shredded sugarbeets in Figure 5. As seen from Figure
Figure 5. Cumulative methane yield comparing whole and shredded beet digestion
Figure 6. Percentage ultimate yield of sugarbeets at different sizes
0
50
100
150
200
250
300
350
400
450
500
0 5 10 15 20 25 30
Cumulative Metha
ne Yield (L@
STP/
kg
VS)
Time Elapsed (days)
Whole beet (frozen)
Shredded beet (frozen)
0 10 20 30 40 50 60 70 80 90
100
0 5 10 15 20 25 30
Percen
tage of u
ltim
ate metha
ne yield
Time Elpased (days)
Whole beet (frozen)
Shredded beet (frozen)
Figure 5. Cumulative methane yield comparing whole and shredded beet digestion
Figure 6. Percentage ultimate yield of sugarbeets at different sizes
Figure 7. Soluble COD released during digestion of sugarbeets stored at different
conditions
Figure 8. Soluble COD release from whole and shredded sugarbeet digestion
0
200
400
600
800
1000
1200
1400
1600
1800
0 5 10 15 20 25 30 35
Soluble Ch
emical Oxygen Dem
and (g/
kg VS)
Time Elapsed (days)
Frozen (Whole beet)
Airtight storage (Whole beet)
Fresh (Whole beet)
0
200
400
600
800
1000
1200
1400
1600
1800
0 5 10 15 20 25 30
Soluble Ch
emical Oxygen Dem
and (g/
kg VS)
Time Elapsed (days)
Whole beet (frozen)
Shredded beet (frozen)
Figure 7. Soluble COD released during digestion of sugarbeets stored at different conditions
Effects of different types of storage and size reduction on biomethane potential of sugarbeets
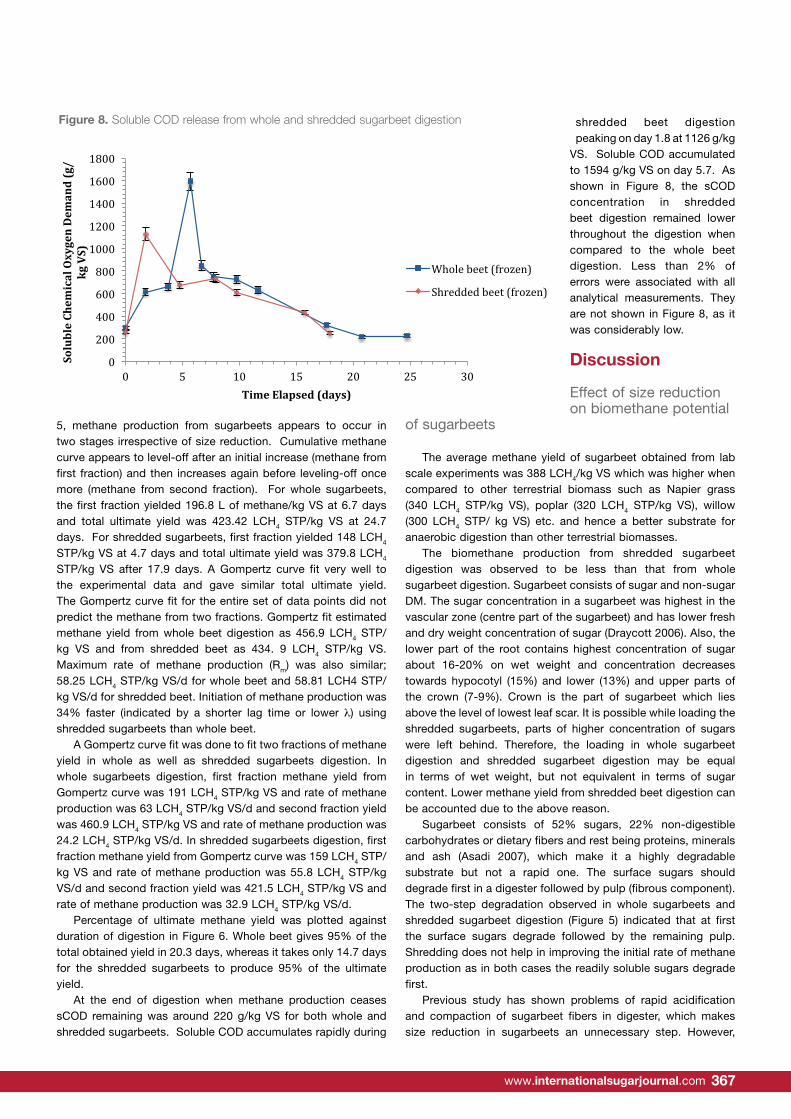
International Sugar Journal | May 2015366 367www.internationalsugarjournal.com
5, methane production from sugarbeets appears to occur in two stages irrespective of size reduction. Cumulative methane curve appears to level-off after an initial increase (methane from first fraction) and then increases again before leveling-off once more (methane from second fraction). For whole sugarbeets, the first fraction yielded 196.8 L of methane/kg VS at 6.7 days and total ultimate yield was 423.42 LCH4 STP/kg VS at 24.7 days. For shredded sugarbeets, first fraction yielded 148 LCH4 STP/kg VS at 4.7 days and total ultimate yield was 379.8 LCH4 STP/kg VS after 17.9 days. A Gompertz curve fit very well to the experimental data and gave similar total ultimate yield. The Gompertz curve fit for the entire set of data points did not predict the methane from two fractions. Gompertz fit estimated methane yield from whole beet digestion as 456.9 LCH4 STP/kg VS and from shredded beet as 434. 9 LCH4 STP/kg VS. Maximum rate of methane production (Rm) was also similar; 58.25 LCH4 STP/kg VS/d for whole beet and 58.81 LCH4 STP/kg VS/d for shredded beet. Initiation of methane production was 34% faster (indicated by a shorter lag time or lower λ) using shredded sugarbeets than whole beet.
A Gompertz curve fit was done to fit two fractions of methane yield in whole as well as shredded sugarbeets digestion. In whole sugarbeets digestion, first fraction methane yield from Gompertz curve was 191 LCH4 STP/kg VS and rate of methane production was 63 LCH4 STP/kg VS/d and second fraction yield was 460.9 LCH4 STP/kg VS and rate of methane production was 24.2 LCH4 STP/kg VS/d. In shredded sugarbeets digestion, first fraction methane yield from Gompertz curve was 159 LCH4 STP/kg VS and rate of methane production was 55.8 LCH4 STP/kg VS/d and second fraction yield was 421.5 LCH4 STP/kg VS and rate of methane production was 32.9 LCH4 STP/kg VS/d.
Percentage of ultimate methane yield was plotted against duration of digestion in Figure 6. Whole beet gives 95% of the total obtained yield in 20.3 days, whereas it takes only 14.7 days for the shredded sugarbeets to produce 95% of the ultimate yield.
At the end of digestion when methane production ceases sCOD remaining was around 220 g/kg VS for both whole and shredded sugarbeets. Soluble COD accumulates rapidly during
shredded beet digestion peaking on day 1.8 at 1126 g/kg
VS. Soluble COD accumulated to 1594 g/kg VS on day 5.7. As shown in Figure 8, the sCOD concentration in shredded beet digestion remained lower throughout the digestion when compared to the whole beet digestion. Less than 2% of errors were associated with all analytical measurements. They are not shown in Figure 8, as it was considerably low.
Discussion
Effect of size reduction on biomethane potential
of sugarbeets
The average methane yield of sugarbeet obtained from lab scale experiments was 388 LCH4/kg VS which was higher when compared to other terrestrial biomass such as Napier grass (340 LCH4 STP/kg VS), poplar (320 LCH4 STP/kg VS), willow (300 LCH4 STP/ kg VS) etc. and hence a better substrate for anaerobic digestion than other terrestrial biomasses.
The biomethane production from shredded sugarbeet digestion was observed to be less than that from whole sugarbeet digestion. Sugarbeet consists of sugar and non-sugar DM. The sugar concentration in a sugarbeet was highest in the vascular zone (centre part of the sugarbeet) and has lower fresh and dry weight concentration of sugar (Draycott 2006). Also, the lower part of the root contains highest concentration of sugar about 16-20% on wet weight and concentration decreases towards hypocotyl (15%) and lower (13%) and upper parts of the crown (7-9%). Crown is the part of sugarbeet which lies above the level of lowest leaf scar. It is possible while loading the shredded sugarbeets, parts of higher concentration of sugars were left behind. Therefore, the loading in whole sugarbeet digestion and shredded sugarbeet digestion may be equal in terms of wet weight, but not equivalent in terms of sugar content. Lower methane yield from shredded beet digestion can be accounted due to the above reason.
Sugarbeet consists of 52% sugars, 22% non-digestible carbohydrates or dietary fibers and rest being proteins, minerals and ash (Asadi 2007), which make it a highly degradable substrate but not a rapid one. The surface sugars should degrade first in a digester followed by pulp (fibrous component). The two-step degradation observed in whole sugarbeets and shredded sugarbeet digestion (Figure 5) indicated that at first the surface sugars degrade followed by the remaining pulp. Shredding does not help in improving the initial rate of methane production as in both cases the readily soluble sugars degrade first.
Previous study has shown problems of rapid acidification and compaction of sugarbeet fibers in digester, which makes size reduction in sugarbeets an unnecessary step. However,
Figure 7. Soluble COD released during digestion of sugarbeets stored at different
conditions
Figure 8. Soluble COD release from whole and shredded sugarbeet digestion
0
200
400
600
800
1000
1200
1400
1600
1800
0 5 10 15 20 25 30 35 So
luble Ch
emical Oxygen Dem
and (g/
kg VS)
Time Elapsed (days)
Frozen (Whole beet)
Airtight storage (Whole beet)
Fresh (Whole beet)
0
200
400
600
800
1000
1200
1400
1600
1800
0 5 10 15 20 25 30
Soluble Ch
emical Oxygen Dem
and (g/
kg VS)
Time Elapsed (days)
Whole beet (frozen)
Shredded beet (frozen)
Figure 8. Soluble COD release from whole and shredded sugarbeet digestion
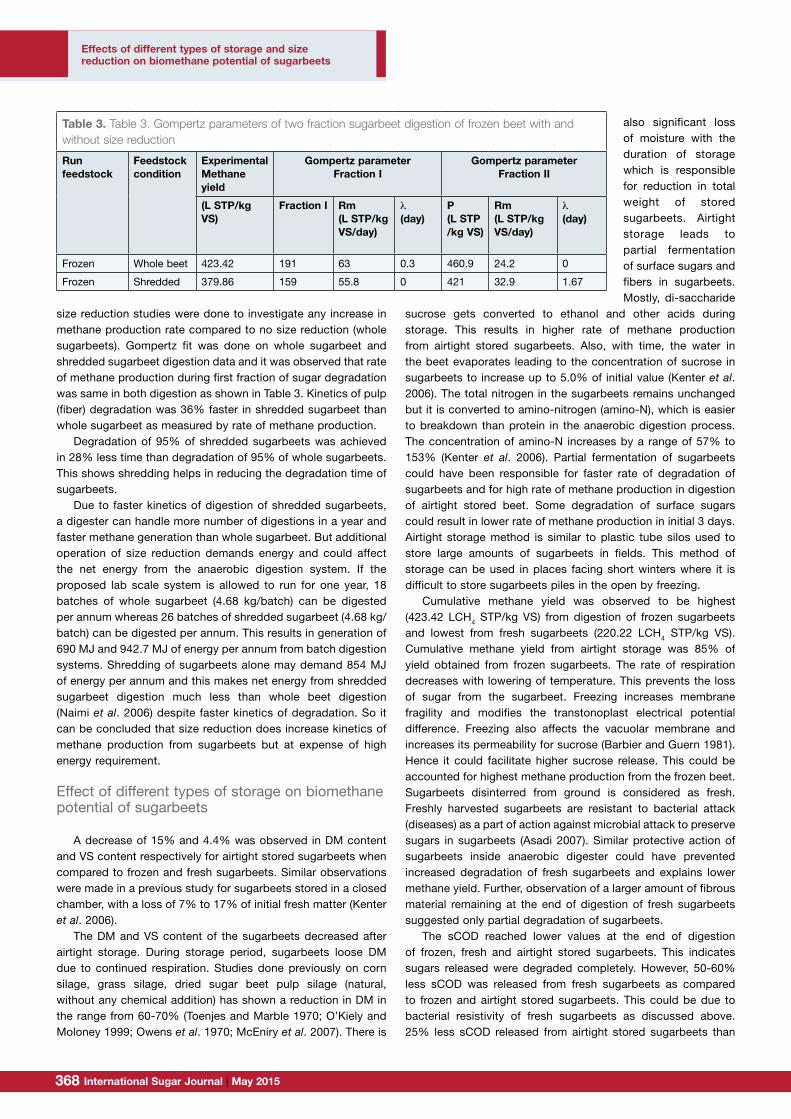
International Sugar Journal | May 2015368 369www.internationalsugarjournal.com
size reduction studies were done to investigate any increase in methane production rate compared to no size reduction (whole sugarbeets). Gompertz fit was done on whole sugarbeet and shredded sugarbeet digestion data and it was observed that rate of methane production during first fraction of sugar degradation was same in both digestion as shown in Table 3. Kinetics of pulp (fiber) degradation was 36% faster in shredded sugarbeet than whole sugarbeet as measured by rate of methane production.
Degradation of 95% of shredded sugarbeets was achieved in 28% less time than degradation of 95% of whole sugarbeets. This shows shredding helps in reducing the degradation time of sugarbeets.
Due to faster kinetics of digestion of shredded sugarbeets, a digester can handle more number of digestions in a year and faster methane generation than whole sugarbeet. But additional operation of size reduction demands energy and could affect the net energy from the anaerobic digestion system. If the proposed lab scale system is allowed to run for one year, 18 batches of whole sugarbeet (4.68 kg/batch) can be digested per annum whereas 26 batches of shredded sugarbeet (4.68 kg/batch) can be digested per annum. This results in generation of 690 MJ and 942.7 MJ of energy per annum from batch digestion systems. Shredding of sugarbeets alone may demand 854 MJ of energy per annum and this makes net energy from shredded sugarbeet digestion much less than whole beet digestion (Naimi et al. 2006) despite faster kinetics of degradation. So it can be concluded that size reduction does increase kinetics of methane production from sugarbeets but at expense of high energy requirement.
Effect of different types of storage on biomethane potential of sugarbeets
A decrease of 15% and 4.4% was observed in DM content and VS content respectively for airtight stored sugarbeets when compared to frozen and fresh sugarbeets. Similar observations were made in a previous study for sugarbeets stored in a closed chamber, with a loss of 7% to 17% of initial fresh matter (Kenter et al. 2006).
The DM and VS content of the sugarbeets decreased after airtight storage. During storage period, sugarbeets loose DM due to continued respiration. Studies done previously on corn silage, grass silage, dried sugar beet pulp silage (natural, without any chemical addition) has shown a reduction in DM in the range from 60-70% (Toenjes and Marble 1970; O’Kiely and Moloney 1999; Owens et al. 1970; McEniry et al. 2007). There is
also significant loss of moisture with the duration of storage which is responsible for reduction in total weight of stored sugarbeets. Airtight storage leads to partial fermentation of surface sugars and fibers in sugarbeets. Mostly, di-saccharide
sucrose gets converted to ethanol and other acids during storage. This results in higher rate of methane production from airtight stored sugarbeets. Also, with time, the water in the beet evaporates leading to the concentration of sucrose in sugarbeets to increase up to 5.0% of initial value (Kenter et al. 2006). The total nitrogen in the sugarbeets remains unchanged but it is converted to amino-nitrogen (amino-N), which is easier to breakdown than protein in the anaerobic digestion process. The concentration of amino-N increases by a range of 57% to 153% (Kenter et al. 2006). Partial fermentation of sugarbeets could have been responsible for faster rate of degradation of sugarbeets and for high rate of methane production in digestion of airtight stored beet. Some degradation of surface sugars could result in lower rate of methane production in initial 3 days. Airtight storage method is similar to plastic tube silos used to store large amounts of sugarbeets in fields. This method of storage can be used in places facing short winters where it is difficult to store sugarbeets piles in the open by freezing.
Cumulative methane yield was observed to be highest (423.42 LCH4 STP/kg VS) from digestion of frozen sugarbeets and lowest from fresh sugarbeets (220.22 LCH4 STP/kg VS). Cumulative methane yield from airtight storage was 85% of yield obtained from frozen sugarbeets. The rate of respiration decreases with lowering of temperature. This prevents the loss of sugar from the sugarbeet. Freezing increases membrane fragility and modifies the transtonoplast electrical potential difference. Freezing also affects the vacuolar membrane and increases its permeability for sucrose (Barbier and Guern 1981). Hence it could facilitate higher sucrose release. This could be accounted for highest methane production from the frozen beet. Sugarbeets disinterred from ground is considered as fresh. Freshly harvested sugarbeets are resistant to bacterial attack (diseases) as a part of action against microbial attack to preserve sugars in sugarbeets (Asadi 2007). Similar protective action of sugarbeets inside anaerobic digester could have prevented increased degradation of fresh sugarbeets and explains lower methane yield. Further, observation of a larger amount of fibrous material remaining at the end of digestion of fresh sugarbeets suggested only partial degradation of sugarbeets.
The sCOD reached lower values at the end of digestion of frozen, fresh and airtight stored sugarbeets. This indicates sugars released were degraded completely. However, 50-60% less sCOD was released from fresh sugarbeets as compared to frozen and airtight stored sugarbeets. This could be due to bacterial resistivity of fresh sugarbeets as discussed above. 25% less sCOD released from airtight stored sugarbeets than
Table 3. Table 3. Gompertz parameters of two fraction sugarbeet digestion of frozen beet with and without size reduction
Run feedstock
Feedstock condition
Experimental Methane yield
Gompertz parameter Fraction I
Gompertz parameter Fraction II
(L STP/kg VS)
Fraction I Rm (L STP/kg VS/day)
λ (day)
P (L STP /kg VS)
Rm (L STP/kg VS/day)
λ (day)
Frozen Whole beet 423.42 191 63 0.3 460.9 24.2 0
Frozen Shredded 379.86 159 55.8 0 421 32.9 1.67
Effects of different types of storage and size reduction on biomethane potential of sugarbeets
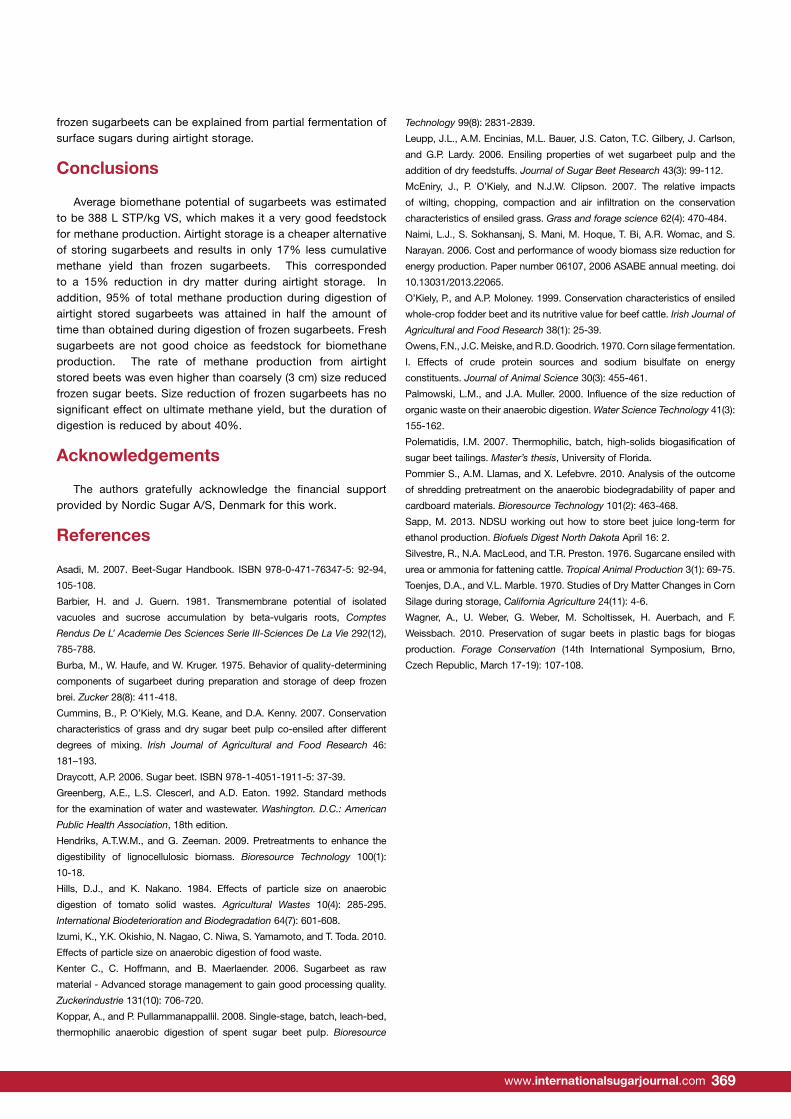
International Sugar Journal | May 2015368 369www.internationalsugarjournal.com
frozen sugarbeets can be explained from partial fermentation of surface sugars during airtight storage.
Conclusions
Average biomethane potential of sugarbeets was estimated to be 388 L STP/kg VS, which makes it a very good feedstock for methane production. Airtight storage is a cheaper alternative of storing sugarbeets and results in only 17% less cumulative methane yield than frozen sugarbeets. This corresponded to a 15% reduction in dry matter during airtight storage. In addition, 95% of total methane production during digestion of airtight stored sugarbeets was attained in half the amount of time than obtained during digestion of frozen sugarbeets. Fresh sugarbeets are not good choice as feedstock for biomethane production. The rate of methane production from airtight stored beets was even higher than coarsely (3 cm) size reduced frozen sugar beets. Size reduction of frozen sugarbeets has no significant effect on ultimate methane yield, but the duration of digestion is reduced by about 40%.
Acknowledgements
The authors gratefully acknowledge the financial support provided by Nordic Sugar A/S, Denmark for this work.
References
Asadi, M. 2007. Beet-Sugar Handbook. ISBN 978-0-471-76347-5: 92-94,
105-108.
Barbier, H. and J. Guern. 1981. Transmembrane potential of isolated
vacuoles and sucrose accumulation by beta-vulgaris roots, Comptes
Rendus De L’ Academie Des Sciences Serie III-Sciences De La Vie 292(12),
785-788.
Burba, M., W. Haufe, and W. Kruger. 1975. Behavior of quality-determining
components of sugarbeet during preparation and storage of deep frozen
brei. Zucker 28(8): 411-418.
Cummins, B., P. O’Kiely, M.G. Keane, and D.A. Kenny. 2007. Conservation
characteristics of grass and dry sugar beet pulp co-ensiled after different
degrees of mixing. Irish Journal of Agricultural and Food Research 46:
181–193.
Draycott, A.P. 2006. Sugar beet. ISBN 978-1-4051-1911-5: 37-39.
Greenberg, A.E., L.S. Clescerl, and A.D. Eaton. 1992. Standard methods
for the examination of water and wastewater. Washington. D.C.: American
Public Health Association, 18th edition.
Hendriks, A.T.W.M., and G. Zeeman. 2009. Pretreatments to enhance the
digestibility of lignocellulosic biomass. Bioresource Technology 100(1):
10-18.
Hills, D.J., and K. Nakano. 1984. Effects of particle size on anaerobic
digestion of tomato solid wastes. Agricultural Wastes 10(4): 285-295.
International Biodeterioration and Biodegradation 64(7): 601-608.
Izumi, K., Y.K. Okishio, N. Nagao, C. Niwa, S. Yamamoto, and T. Toda. 2010.
Effects of particle size on anaerobic digestion of food waste.
Kenter C., C. Hoffmann, and B. Maerlaender. 2006. Sugarbeet as raw
material - Advanced storage management to gain good processing quality.
Zuckerindustrie 131(10): 706-720.
Koppar, A., and P. Pullammanappallil. 2008. Single-stage, batch, leach-bed,
thermophilic anaerobic digestion of spent sugar beet pulp. Bioresource
Technology 99(8): 2831-2839.
Leupp, J.L., A.M. Encinias, M.L. Bauer, J.S. Caton, T.C. Gilbery, J. Carlson,
and G.P. Lardy. 2006. Ensiling properties of wet sugarbeet pulp and the
addition of dry feedstuffs. Journal of Sugar Beet Research 43(3): 99-112.
McEniry, J., P. O’Kiely, and N.J.W. Clipson. 2007. The relative impacts
of wilting, chopping, compaction and air infiltration on the conservation
characteristics of ensiled grass. Grass and forage science 62(4): 470-484.
Naimi, L.J., S. Sokhansanj, S. Mani, M. Hoque, T. Bi, A.R. Womac, and S.
Narayan. 2006. Cost and performance of woody biomass size reduction for
energy production. Paper number 06107, 2006 ASABE annual meeting. doi
10.13031/2013.22065.
O’Kiely, P., and A.P. Moloney. 1999. Conservation characteristics of ensiled
whole-crop fodder beet and its nutritive value for beef cattle. Irish Journal of
Agricultural and Food Research 38(1): 25-39.
Owens, F.N., J.C. Meiske, and R.D. Goodrich. 1970. Corn silage fermentation.
I. Effects of crude protein sources and sodium bisulfate on energy
constituents. Journal of Animal Science 30(3): 455-461.
Palmowski, L.M., and J.A. Muller. 2000. Influence of the size reduction of
organic waste on their anaerobic digestion. Water Science Technology 41(3):
155-162.
Polematidis, I.M. 2007. Thermophilic, batch, high-solids biogasification of
sugar beet tailings. Master’s thesis, University of Florida.
Pommier S., A.M. Llamas, and X. Lefebvre. 2010. Analysis of the outcome
of shredding pretreatment on the anaerobic biodegradability of paper and
cardboard materials. Bioresource Technology 101(2): 463-468.
Sapp, M. 2013. NDSU working out how to store beet juice long-term for
ethanol production. Biofuels Digest North Dakota April 16: 2.
Silvestre, R., N.A. MacLeod, and T.R. Preston. 1976. Sugarcane ensiled with
urea or ammonia for fattening cattle. Tropical Animal Production 3(1): 69-75.
Toenjes, D.A., and V.L. Marble. 1970. Studies of Dry Matter Changes in Corn
Silage during storage, California Agriculture 24(11): 4-6.
Wagner, A., U. Weber, G. Weber, M. Scholtissek, H. Auerbach, and F.
Weissbach. 2010. Preservation of sugar beets in plastic bags for biogas
production. Forage Conservation (14th International Symposium, Brno,
Czech Republic, March 17-19): 107-108.
International Sugar Journal | May 2015370 371www.internationalsugarjournal.com
A retrospective analysis of genetic advance in natural ripening of sugarcane
David M. Burner1, Benjamin L. Legendre2*, Deborah L. Boykin3, and Michael J. Duet, Jr.1
Contact author: [email protected]
1USDA-ARS, Sugarcane Research Unit, 5883 USDA Road, Houma, LA 70360; USA2Audubon Sugar Institute, LSU AgCenter, 3845 Highway 75, St. Gabriel, LA 70776; USA3USDA-ARS, Southeast Area, 141 Experiment Station Road, Stoneville, MS 38776; USA
Abstract Natural ripening of sugarcane (Saccharum L. spp. hybrids) during late-summer and autumn is coincident
with selection and harvesting, making ripening important from breeding and industrial perspectives.
Our objective was to determine if natural ripening of sugarcane cultivars was affected by generation of
recurrent selection. A retrospective analysis was conducted of field trials conducted annually from 1972 to
2012 near Houma, Louisiana. The significance and impact of the sampling date by generation interaction
on stalk weight, Brix, sucrose and purity of normal juice (juice expressed by the mills or retained in the
bagasse corrected for imbibition water) and sucrose yield (expressed as theoretical recoverable sucrose
or simply, TRS) was examined in the first-ratoon crop sampled eight times yr-1 at 2-wk intervals from
late-August to early-December. Stalk weight did not respond to selection. For any given sampling date,
the most recent generation, Generation 7, had significantly greater normal juice Brix (NJB), normal juice
sucrose (NJS) and normal juice purity (NJP) than Generation 2, but was not consistently greater than
other generations of selection. There was no significant advance in mid- and late-season juice traits.
Generation 7 was significantly greater than Generations 2 to 5 for TRS at each sampling date. Depending
on the trait, comparable levels of NJB, NJS and NJP and TRS were expressed 2- to 8-wk earlier in
Generation 7 than earlier generations, demonstrating a shift toward earlier natural ripening. Continued
genetic advance seems likely for early-season NJB, NJS and NJP and early-, mid-, and late-season TRS.
Keywords: Sugarcane, Fusarium sacchari, simulation techniques
Introduction
Given its tropical origin, the developmental transition of sugarcane (Saccharum L. spp. hybrids) from vegetative to mature reproductive growth, i.e., flowering, tends to occur more readily at tropical and subtropical latitudes rather than at temperate latitudes (Moore, 1985). Sugarcane cultivars almost never flower naturally in Louisiana (approx. 30.0 oN latitude), while natural flowering is more common in sub-tropical south Florida (approx. 26.5 oN latitude). Regardless of flowering and latitude, sugarcane cultivars exhibit a developmental phase in natural ripening, characterized by an accumulation of sucrose concentration in
stalk internodes during the approach towards sexual maturity (Alexander, 1973; and Julien et al., 1989). Compared to the tropics with a 12 mo growing season, the relatively short (9 mo) growing season of Louisiana is thought to limit the ability of sugarcane to fully ripen or achieve its maximum genetic potential in sucrose accumulation (Breaux, 1984; Ebrahim, et al. 1998; Lofton et al., 2012). Various climatic factors, primarily solar interception, affect natural ripening, but temperate sugarcane seldom achieves its full ripening potential even in a year with ‘ideal’ weather (Legendre, 1975).
Variety testing has been conducted at least since ancient man discovered that stems of noble sugarcane (S. officinarum
Abbreviations: NJB, normal juice Brix, NJS, normal juice sucrose; NJP, normal juice purity; TRS, theoretical recoverable sucrose.
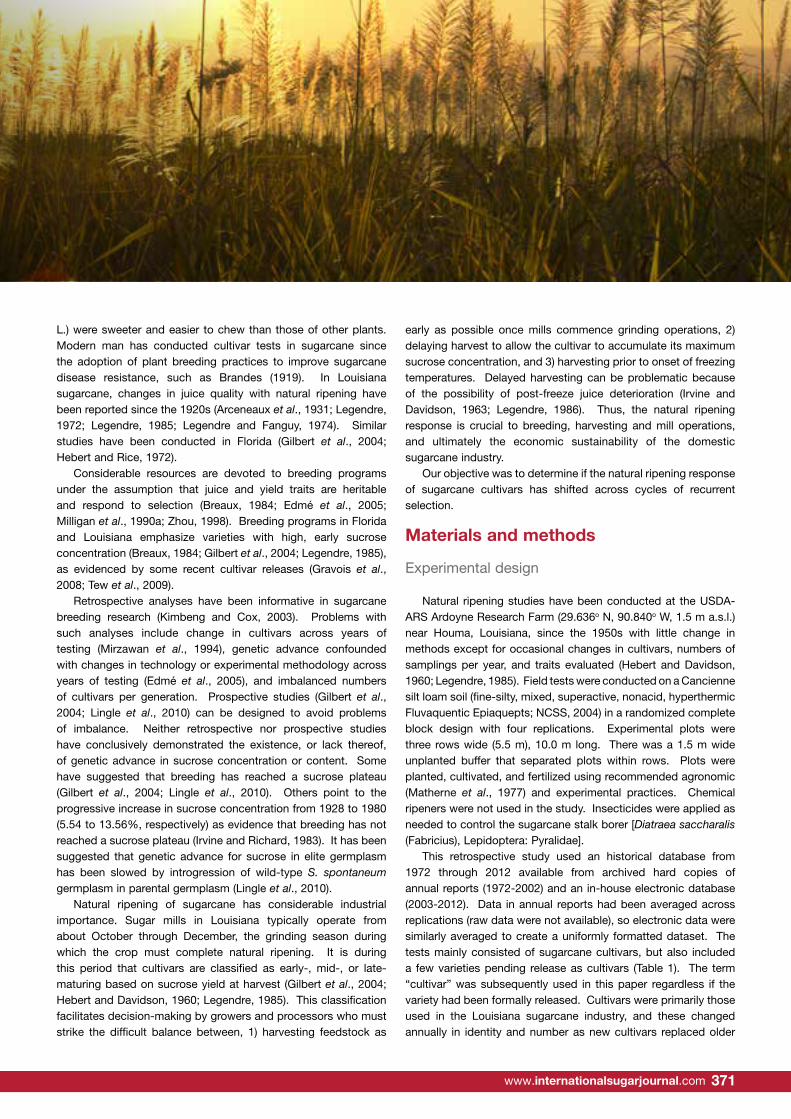
International Sugar Journal | May 2015370 371www.internationalsugarjournal.com
L.) were sweeter and easier to chew than those of other plants. Modern man has conducted cultivar tests in sugarcane since the adoption of plant breeding practices to improve sugarcane disease resistance, such as Brandes (1919). In Louisiana sugarcane, changes in juice quality with natural ripening have been reported since the 1920s (Arceneaux et al., 1931; Legendre, 1972; Legendre, 1985; Legendre and Fanguy, 1974). Similar studies have been conducted in Florida (Gilbert et al., 2004; Hebert and Rice, 1972).
Considerable resources are devoted to breeding programs under the assumption that juice and yield traits are heritable and respond to selection (Breaux, 1984; Edmé et al., 2005; Milligan et al., 1990a; Zhou, 1998). Breeding programs in Florida and Louisiana emphasize varieties with high, early sucrose concentration (Breaux, 1984; Gilbert et al., 2004; Legendre, 1985), as evidenced by some recent cultivar releases (Gravois et al., 2008; Tew et al., 2009).
Retrospective analyses have been informative in sugarcane breeding research (Kimbeng and Cox, 2003). Problems with such analyses include change in cultivars across years of testing (Mirzawan et al., 1994), genetic advance confounded with changes in technology or experimental methodology across years of testing (Edmé et al., 2005), and imbalanced numbers of cultivars per generation. Prospective studies (Gilbert et al., 2004; Lingle et al., 2010) can be designed to avoid problems of imbalance. Neither retrospective nor prospective studies have conclusively demonstrated the existence, or lack thereof, of genetic advance in sucrose concentration or content. Some have suggested that breeding has reached a sucrose plateau (Gilbert et al., 2004; Lingle et al., 2010). Others point to the progressive increase in sucrose concentration from 1928 to 1980 (5.54 to 13.56%, respectively) as evidence that breeding has not reached a sucrose plateau (Irvine and Richard, 1983). It has been suggested that genetic advance for sucrose in elite germplasm has been slowed by introgression of wild-type S. spontaneum germplasm in parental germplasm (Lingle et al., 2010).
Natural ripening of sugarcane has considerable industrial importance. Sugar mills in Louisiana typically operate from about October through December, the grinding season during which the crop must complete natural ripening. It is during this period that cultivars are classified as early-, mid-, or late-maturing based on sucrose yield at harvest (Gilbert et al., 2004; Hebert and Davidson, 1960; Legendre, 1985). This classification facilitates decision-making by growers and processors who must strike the difficult balance between, 1) harvesting feedstock as
early as possible once mills commence grinding operations, 2) delaying harvest to allow the cultivar to accumulate its maximum sucrose concentration, and 3) harvesting prior to onset of freezing temperatures. Delayed harvesting can be problematic because of the possibility of post-freeze juice deterioration (Irvine and Davidson, 1963; Legendre, 1986). Thus, the natural ripening response is crucial to breeding, harvesting and mill operations, and ultimately the economic sustainability of the domestic sugarcane industry.
Our objective was to determine if the natural ripening response of sugarcane cultivars has shifted across cycles of recurrent selection.
Materials and methods
Experimental design
Natural ripening studies have been conducted at the USDA-ARS Ardoyne Research Farm (29.636o N, 90.840o W, 1.5 m a.s.l.) near Houma, Louisiana, since the 1950s with little change in methods except for occasional changes in cultivars, numbers of samplings per year, and traits evaluated (Hebert and Davidson, 1960; Legendre, 1985). Field tests were conducted on a Cancienne silt loam soil (fine-silty, mixed, superactive, nonacid, hyperthermic Fluvaquentic Epiaquepts; NCSS, 2004) in a randomized complete block design with four replications. Experimental plots were three rows wide (5.5 m), 10.0 m long. There was a 1.5 m wide unplanted buffer that separated plots within rows. Plots were planted, cultivated, and fertilized using recommended agronomic (Matherne et al., 1977) and experimental practices. Chemical ripeners were not used in the study. Insecticides were applied as needed to control the sugarcane stalk borer [Diatraea saccharalis (Fabricius), Lepidoptera: Pyralidae].
This retrospective study used an historical database from 1972 through 2012 available from archived hard copies of annual reports (1972-2002) and an in-house electronic database (2003-2012). Data in annual reports had been averaged across replications (raw data were not available), so electronic data were similarly averaged to create a uniformly formatted dataset. The tests mainly consisted of sugarcane cultivars, but also included a few varieties pending release as cultivars (Table 1). The term “cultivar” was subsequently used in this paper regardless if the variety had been formally released. Cultivars were primarily those used in the Louisiana sugarcane industry, and these changed annually in identity and number as new cultivars replaced older
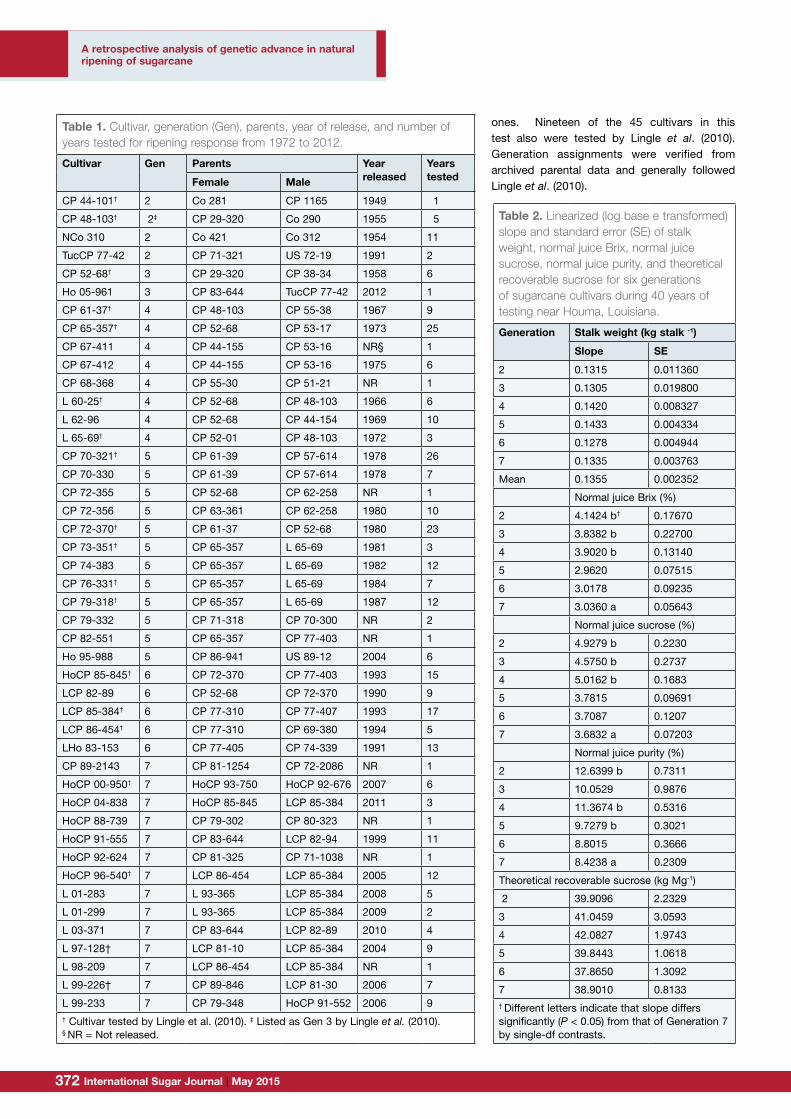
International Sugar Journal | May 2015372 373www.internationalsugarjournal.com
A retrospective analysis of genetic advance in natural ripening of sugarcane
ones. Nineteen of the 45 cultivars in this test also were tested by Lingle et al. (2010). Generation assignments were verified from archived parental data and generally followed Lingle et al. (2010).
Table 1. Cultivar, generation (Gen), parents, year of release, and number of years tested for ripening response from 1972 to 2012.
Cultivar Gen Parents Year released
Years testedFemale Male
CP 44-101† 2 Co 281 CP 1165 1949 1
CP 48-103† 2‡ CP 29-320 Co 290 1955 5
NCo 310 2 Co 421 Co 312 1954 11
TucCP 77-42 2 CP 71-321 US 72-19 1991 2
CP 52-68† 3 CP 29-320 CP 38-34 1958 6
Ho 05-961 3 CP 83-644 TucCP 77-42 2012 1
CP 61-37† 4 CP 48-103 CP 55-38 1967 9
CP 65-357† 4 CP 52-68 CP 53-17 1973 25
CP 67-411 4 CP 44-155 CP 53-16 NR§ 1
CP 67-412 4 CP 44-155 CP 53-16 1975 6
CP 68-368 4 CP 55-30 CP 51-21 NR 1
L 60-25† 4 CP 52-68 CP 48-103 1966 6
L 62-96 4 CP 52-68 CP 44-154 1969 10
L 65-69† 4 CP 52-01 CP 48-103 1972 3
CP 70-321† 5 CP 61-39 CP 57-614 1978 26
CP 70-330 5 CP 61-39 CP 57-614 1978 7
CP 72-355 5 CP 52-68 CP 62-258 NR 1
CP 72-356 5 CP 63-361 CP 62-258 1980 10
CP 72-370† 5 CP 61-37 CP 52-68 1980 23
CP 73-351† 5 CP 65-357 L 65-69 1981 3
CP 74-383 5 CP 65-357 L 65-69 1982 12
CP 76-331† 5 CP 65-357 L 65-69 1984 7
CP 79-318† 5 CP 65-357 L 65-69 1987 12
CP 79-332 5 CP 71-318 CP 70-300 NR 2
CP 82-551 5 CP 65-357 CP 77-403 NR 1
Ho 95-988 5 CP 86-941 US 89-12 2004 6
HoCP 85-845† 6 CP 72-370 CP 77-403 1993 15
LCP 82-89 6 CP 52-68 CP 72-370 1990 9
LCP 85-384† 6 CP 77-310 CP 77-407 1993 17
LCP 86-454† 6 CP 77-310 CP 69-380 1994 5
LHo 83-153 6 CP 77-405 CP 74-339 1991 13
CP 89-2143 7 CP 81-1254 CP 72-2086 NR 1
HoCP 00-950† 7 HoCP 93-750 HoCP 92-676 2007 6
HoCP 04-838 7 HoCP 85-845 LCP 85-384 2011 3
HoCP 88-739 7 CP 79-302 CP 80-323 NR 1
HoCP 91-555 7 CP 83-644 LCP 82-94 1999 11
HoCP 92-624 7 CP 81-325 CP 71-1038 NR 1
HoCP 96-540† 7 LCP 86-454 LCP 85-384 2005 12
L 01-283 7 L 93-365 LCP 85-384 2008 5
L 01-299 7 L 93-365 LCP 85-384 2009 2
L 03-371 7 CP 83-644 LCP 82-89 2010 4
L 97-128† 7 LCP 81-10 LCP 85-384 2004 9
L 98-209 7 LCP 86-454 LCP 85-384 NR 1
L 99-226† 7 CP 89-846 LCP 81-30 2006 7
L 99-233 7 CP 79-348 HoCP 91-552 2006 9† Cultivar tested by Lingle et al. (2010). ‡ Listed as Gen 3 by Lingle et al. (2010).§ NR = Not released.
Table 2. Linearized (log base e transformed) slope and standard error (SE) of stalk weight, normal juice Brix, normal juice sucrose, normal juice purity, and theoretical recoverable sucrose for six generations of sugarcane cultivars during 40 years of testing near Houma, Louisiana.
Generation Stalk weight (kg stalk -1)
Slope SE
2 0.1315 0.011360
3 0.1305 0.019800
4 0.1420 0.008327
5 0.1433 0.004334
6 0.1278 0.004944
7 0.1335 0.003763
Mean 0.1355 0.002352
Normal juice Brix (%)
2 4.1424 b† 0.17670
3 3.8382 b 0.22700
4 3.9020 b 0.13140
5 2.9620 0.07515
6 3.0178 0.09235
7 3.0360 a 0.05643
Normal juice sucrose (%)
2 4.9279 b 0.2230
3 4.5750 b 0.2737
4 5.0162 b 0.1683
5 3.7815 0.09691
6 3.7087 0.1207
7 3.6832 a 0.07203
Normal juice purity (%)
2 12.6399 b 0.7311
3 10.0529 0.9876
4 11.3674 b 0.5316
5 9.7279 b 0.3021
6 8.8015 0.3666
7 8.4238 a 0.2309
Theoretical recoverable sucrose (kg Mg-1)
2 39.9096 2.2329
3 41.0459 3.0593
4 42.0827 1.9743
5 39.8443 1.0618
6 37.8650 1.3092
7 38.9010 0.8133† Different letters indicate that slope differs significantly (P < 0.05) from that of Generation 7 by single-df contrasts.
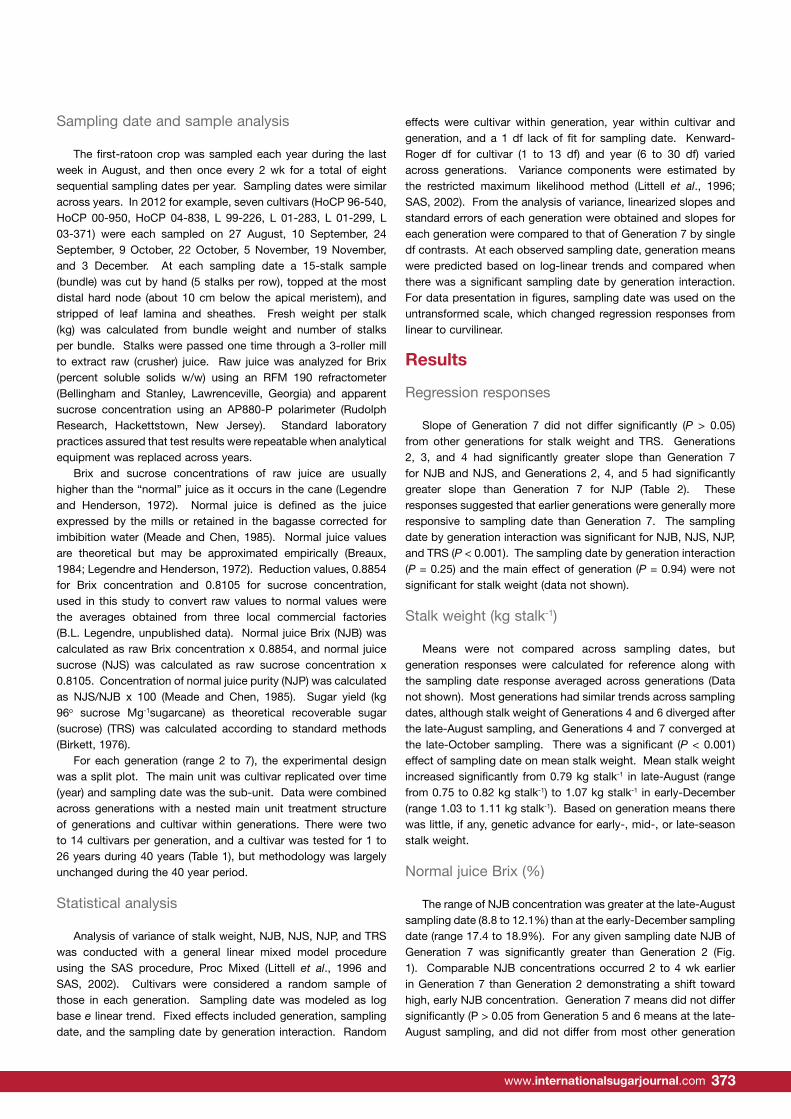
International Sugar Journal | May 2015372 373www.internationalsugarjournal.com
Sampling date and sample analysis
The first-ratoon crop was sampled each year during the last week in August, and then once every 2 wk for a total of eight sequential sampling dates per year. Sampling dates were similar across years. In 2012 for example, seven cultivars (HoCP 96-540, HoCP 00-950, HoCP 04-838, L 99-226, L 01-283, L 01-299, L 03-371) were each sampled on 27 August, 10 September, 24 September, 9 October, 22 October, 5 November, 19 November, and 3 December. At each sampling date a 15-stalk sample (bundle) was cut by hand (5 stalks per row), topped at the most distal hard node (about 10 cm below the apical meristem), and stripped of leaf lamina and sheathes. Fresh weight per stalk (kg) was calculated from bundle weight and number of stalks per bundle. Stalks were passed one time through a 3-roller mill to extract raw (crusher) juice. Raw juice was analyzed for Brix (percent soluble solids w/w) using an RFM 190 refractometer (Bellingham and Stanley, Lawrenceville, Georgia) and apparent sucrose concentration using an AP880-P polarimeter (Rudolph Research, Hackettstown, New Jersey). Standard laboratory practices assured that test results were repeatable when analytical equipment was replaced across years.
Brix and sucrose concentrations of raw juice are usually higher than the “normal” juice as it occurs in the cane (Legendre and Henderson, 1972). Normal juice is defined as the juice expressed by the mills or retained in the bagasse corrected for imbibition water (Meade and Chen, 1985). Normal juice values are theoretical but may be approximated empirically (Breaux, 1984; Legendre and Henderson, 1972). Reduction values, 0.8854 for Brix concentration and 0.8105 for sucrose concentration, used in this study to convert raw values to normal values were the averages obtained from three local commercial factories (B.L. Legendre, unpublished data). Normal juice Brix (NJB) was calculated as raw Brix concentration x 0.8854, and normal juice sucrose (NJS) was calculated as raw sucrose concentration x 0.8105. Concentration of normal juice purity (NJP) was calculated as NJS/NJB x 100 (Meade and Chen, 1985). Sugar yield (kg 96o sucrose Mg-1sugarcane) as theoretical recoverable sugar (sucrose) (TRS) was calculated according to standard methods (Birkett, 1976).
For each generation (range 2 to 7), the experimental design was a split plot. The main unit was cultivar replicated over time (year) and sampling date was the sub-unit. Data were combined across generations with a nested main unit treatment structure of generations and cultivar within generations. There were two to 14 cultivars per generation, and a cultivar was tested for 1 to 26 years during 40 years (Table 1), but methodology was largely unchanged during the 40 year period.
Statistical analysis
Analysis of variance of stalk weight, NJB, NJS, NJP, and TRS was conducted with a general linear mixed model procedure using the SAS procedure, Proc Mixed (Littell et al., 1996 and SAS, 2002). Cultivars were considered a random sample of those in each generation. Sampling date was modeled as log base e linear trend. Fixed effects included generation, sampling date, and the sampling date by generation interaction. Random
effects were cultivar within generation, year within cultivar and generation, and a 1 df lack of fit for sampling date. Kenward-Roger df for cultivar (1 to 13 df) and year (6 to 30 df) varied across generations. Variance components were estimated by the restricted maximum likelihood method (Littell et al., 1996; SAS, 2002). From the analysis of variance, linearized slopes and standard errors of each generation were obtained and slopes for each generation were compared to that of Generation 7 by single df contrasts. At each observed sampling date, generation means were predicted based on log-linear trends and compared when there was a significant sampling date by generation interaction. For data presentation in figures, sampling date was used on the untransformed scale, which changed regression responses from linear to curvilinear.
Results
Regression responses
Slope of Generation 7 did not differ significantly (P > 0.05) from other generations for stalk weight and TRS. Generations 2, 3, and 4 had significantly greater slope than Generation 7 for NJB and NJS, and Generations 2, 4, and 5 had significantly greater slope than Generation 7 for NJP (Table 2). These responses suggested that earlier generations were generally more responsive to sampling date than Generation 7. The sampling date by generation interaction was significant for NJB, NJS, NJP, and TRS (P < 0.001). The sampling date by generation interaction (P = 0.25) and the main effect of generation (P = 0.94) were not significant for stalk weight (data not shown).
Stalk weight (kg stalk-1)
Means were not compared across sampling dates, but generation responses were calculated for reference along with the sampling date response averaged across generations (Data not shown). Most generations had similar trends across sampling dates, although stalk weight of Generations 4 and 6 diverged after the late-August sampling, and Generations 4 and 7 converged at the late-October sampling. There was a significant (P < 0.001) effect of sampling date on mean stalk weight. Mean stalk weight increased significantly from 0.79 kg stalk-1 in late-August (range from 0.75 to 0.82 kg stalk-1) to 1.07 kg stalk-1 in early-December (range 1.03 to 1.11 kg stalk-1). Based on generation means there was little, if any, genetic advance for early-, mid-, or late-season stalk weight.
Normal juice Brix (%)
The range of NJB concentration was greater at the late-August sampling date (8.8 to 12.1%) than at the early-December sampling date (range 17.4 to 18.9%). For any given sampling date NJB of Generation 7 was significantly greater than Generation 2 (Fig. 1). Comparable NJB concentrations occurred 2 to 4 wk earlier in Generation 7 than Generation 2 demonstrating a shift toward high, early NJB concentration. Generation 7 means did not differ significantly (P > 0.05 from Generation 5 and 6 means at the late-August sampling, and did not differ from most other generation
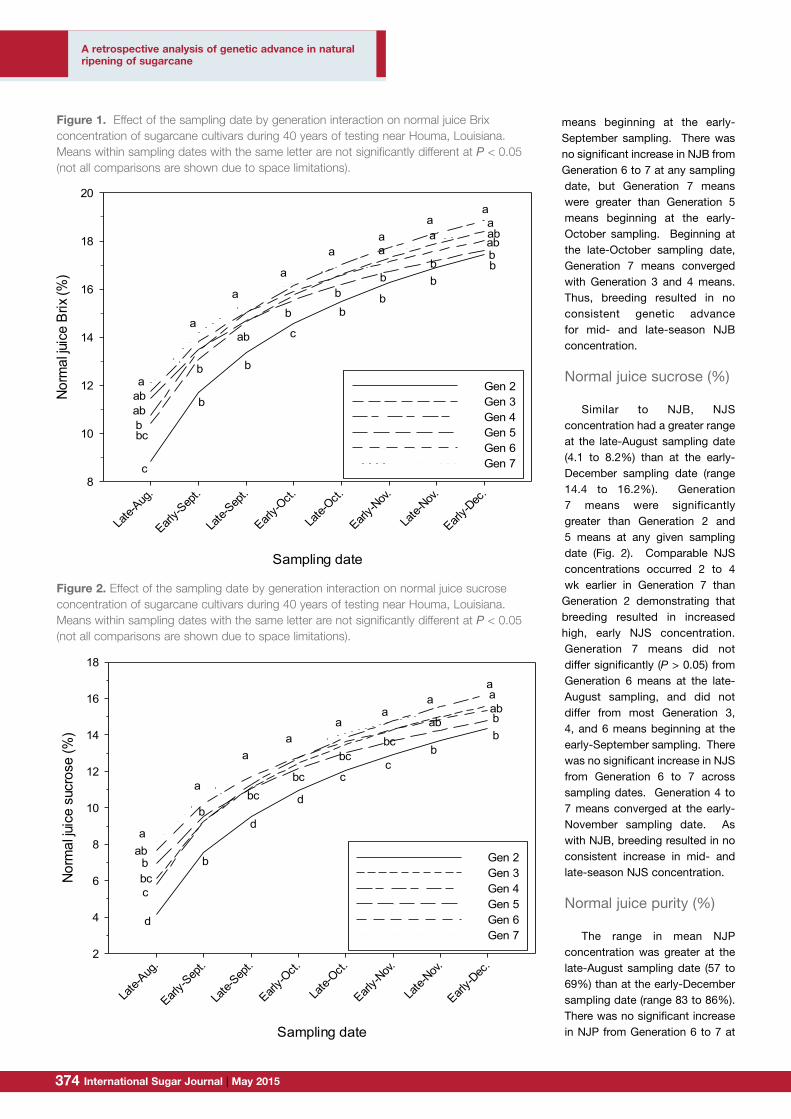
International Sugar Journal | May 2015374 375www.internationalsugarjournal.com
means beginning at the early-September sampling. There was no significant increase in NJB from Generation 6 to 7 at any sampling date, but Generation 7 means were greater than Generation 5 means beginning at the early-October sampling. Beginning at the late-October sampling date, Generation 7 means converged with Generation 3 and 4 means. Thus, breeding resulted in no consistent genetic advance for mid- and late-season NJB concentration.
Normal juice sucrose (%)
Similar to NJB, NJS concentration had a greater range at the late-August sampling date (4.1 to 8.2%) than at the early-December sampling date (range 14.4 to 16.2%). Generation 7 means were significantly greater than Generation 2 and 5 means at any given sampling date (Fig. 2). Comparable NJS concentrations occurred 2 to 4 wk earlier in Generation 7 than Generation 2 demonstrating that breeding resulted in increased high, early NJS concentration. Generation 7 means did not differ significantly (P > 0.05) from Generation 6 means at the late-August sampling, and did not differ from most Generation 3, 4, and 6 means beginning at the early-September sampling. There was no significant increase in NJS from Generation 6 to 7 across sampling dates. Generation 4 to 7 means converged at the early-November sampling date. As with NJB, breeding resulted in no consistent increase in mid- and late-season NJS concentration.
Normal juice purity (%)
The range in mean NJP concentration was greater at the late-August sampling date (57 to 69%) than at the early-December sampling date (range 83 to 86%). There was no significant increase in NJP from Generation 6 to 7 at
23
Figure 1. Effect of the sampling date by generation interaction on normal juice Brix 371
concentration of sugarcane cultivars during 40 years of testing near Houma, Louisiana. Means 372
within sampling dates with the same letter are not significantly different at P < 0.05 (not all 373
comparisons are shown due to space limitations). 374
375
Sampling date
Late-
Aug.
Early-S
ept.
Late-
Sept.
Early-O
ct.
Late-
Oct.
Early-N
ov.
Late-
Nov.
Early-D
ec.
Norm
al ju
ice
Brix
(%)
8
10
12
14
16
18
20
Gen 2Gen 3Gen 4Gen 5Gen 6Gen 7
aabab
bc
c
a
b
b
a
ab
b
a
c
b
a
bb
a
b
b
aa
bb
a
ab
bb
b
a
a
ab
376
Figure 1. Effect of the sampling date by generation interaction on normal juice Brix concentration of sugarcane cultivars during 40 years of testing near Houma, Louisiana. Means within sampling dates with the same letter are not significantly different at P < 0.05 (not all comparisons are shown due to space limitations).
24
Figure 2. Effect of the sampling date by generation interaction on normal juice sucrose 377
concentration of sugarcane cultivars during 40 years of testing near Houma, Louisiana. Means 378
within sampling dates with the same letter are not significantly different at P < 0.05 (not all 379
comparisons are shown due to space limitations). 380
381
Sampling date
Late-
Aug.
Early-S
ept.
Late-
Sept.
Early-O
ct.
Late-
Oct.
Early-N
ov.
Late-
Nov.
Early-D
ec.
Nor
mal
juic
e su
cros
e (%
)
2
4
6
8
10
12
14
16
18
Gen 2Gen 3Gen 4Gen 5Gen 6Gen 7
aab
d
cbcb
a
b
b
a
d
bc
a
bc
d
a
c
bc
a
c
bc
a
b
ab
aaabbb
382
Figure 2. Effect of the sampling date by generation interaction on normal juice sucrose concentration of sugarcane cultivars during 40 years of testing near Houma, Louisiana. Means within sampling dates with the same letter are not significantly different at P < 0.05 (not all comparisons are shown due to space limitations).
A retrospective analysis of genetic advance in natural ripening of sugarcane
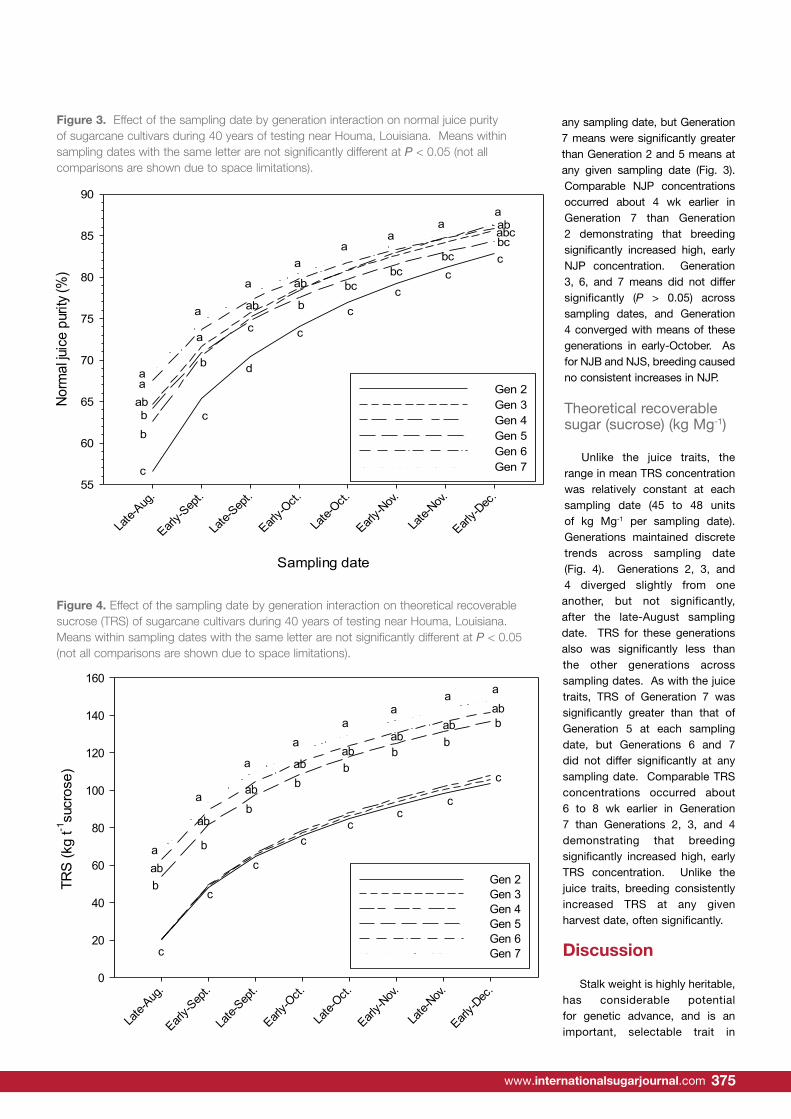
International Sugar Journal | May 2015374 375www.internationalsugarjournal.com
any sampling date, but Generation 7 means were significantly greater than Generation 2 and 5 means at any given sampling date (Fig. 3). Comparable NJP concentrations occurred about 4 wk earlier in Generation 7 than Generation 2 demonstrating that breeding significantly increased high, early NJP concentration. Generation 3, 6, and 7 means did not differ significantly (P > 0.05) across sampling dates, and Generation 4 converged with means of these generations in early-October. As for NJB and NJS, breeding caused no consistent increases in NJP.
Theoretical recoverable sugar (sucrose) (kg Mg-1)
Unlike the juice traits, the range in mean TRS concentration was relatively constant at each sampling date (45 to 48 units of kg Mg-1 per sampling date). Generations maintained discrete trends across sampling date (Fig. 4). Generations 2, 3, and 4 diverged slightly from one another, but not significantly, after the late-August sampling date. TRS for these generations also was significantly less than the other generations across sampling dates. As with the juice traits, TRS of Generation 7 was significantly greater than that of Generation 5 at each sampling date, but Generations 6 and 7 did not differ significantly at any sampling date. Comparable TRS concentrations occurred about 6 to 8 wk earlier in Generation 7 than Generations 2, 3, and 4 demonstrating that breeding significantly increased high, early TRS concentration. Unlike the juice traits, breeding consistently increased TRS at any given harvest date, often significantly.
Discussion
Stalk weight is highly heritable, has considerable potential for genetic advance, and is an important, selectable trait in
25
Figure 3. Effect of the sampling date by generation interaction on normal juice purity of 383
sugarcane cultivars during 40 years of testing near Houma, Louisiana. Means within sampling 384
dates with the same letter are not significantly different at P < 0.05 (not all comparisons are 385
shown due to space limitations). 386
387
Sampling date
Late-
Aug.
Early-S
ept.
Late-
Sept.
Early-O
ct.
Late-
Oct.
Early-N
ov.
Late-
Nov.
Early-D
ec.
Norm
al ju
ice
purit
y (%
)
55
60
65
70
75
80
85
90
Gen 2Gen 3Gen 4Gen 5Gen 6Gen 7
aa
abbb
c
a
c
b
a
a
d
c
ab
a
c
b
ab
a
c
bc
a
c
bc
a
cbc
a
cbcababc
388
Figure 3. Effect of the sampling date by generation interaction on normal juice purity of sugarcane cultivars during 40 years of testing near Houma, Louisiana. Means within sampling dates with the same letter are not significantly different at P < 0.05 (not all comparisons are shown due to space limitations).
26
Figure 4. Effect of the sampling date by generation interaction on theoretical recoverable 389
sucrose (TRS) of sugarcane cultivars during 40 years of testing near Houma, Louisiana. Means 390
within sampling dates with the same letter are not significantly different at P < 0.05 (not all 391
comparisons are shown due to space limitations). 392
393
Sampling date
Late-
Aug.
Early-S
ept.
Late-
Sept.
Early-O
ct.
Late-
Oct.
Early-N
ov.
Late-
Nov.
Early-D
ec.
TRS
(kg
t-1su
cros
e)
0
20
40
60
80
100
120
140
160
Gen 2Gen 3Gen 4Gen 5Gen 6Gen 7
aabb
c
a
b
c
ab
a
abb
c
a
abb
c
a
abb
c
a
abb
c
a
abb
c
aabb
c
394
395
Figure 4. Effect of the sampling date by generation interaction on theoretical recoverable sucrose (TRS) of sugarcane cultivars during 40 years of testing near Houma, Louisiana. Means within sampling dates with the same letter are not significantly different at P < 0.05 (not all comparisons are shown due to space limitations).
International Sugar Journal | May 2015376 377www.internationalsugarjournal.com
early stages of selection (Milligan et al., 1990a). Louisiana cultivars tend to have lower stalk weight (0.96 kg stalk-1) than Florida cultivars (1.30 kg stalk-1) (calculated from Gilbert et al., 2007). Since molecular variance between Florida and Louisiana populations is small relative to that within populations (Glynn et al., 2009), breeding programs in either state could probably shift mean stalk weight if that were advantageous to their respective industries. Stalk weight is significantly correlated (r = 0.39 to 0.59) with sugarcane yield (Milligan et al., 1990b), and there has been no obvious technology-related increasing yield trend in Louisiana sugarcane since 1963 (Greenland, 2005). The lack of significant genetic advance in stalk weight (Fig. 1) does not reflect its lack of importance in breeding, but that sugarcane breeders have conserved a general stalk weight phenotype during late-stage selection that they believe is most advantageous to the industry.
There was progressive genetic advance in early-season expression of NJB, NJS, and NJP, but no significant increase in mid- or late-season responses (Figs. 2 to 4). Lingle et al. (2010) reported that genetic advance of these traits has been negligible since about Generation 4. Contrary to their finding, however, the trend toward early-season expression suggested that these traits have not reached a plateau. Conversely, a retrospective analysis of Louisiana cultivars indicated that Generations 2, 3, and 4 had 10.9, 12.5, and 14.1% NJS, respectively (Breaux, 1984). These values were somewhat comparable to corresponding generation means of the present study, which were 10.7, 12.2, and 12.4%, respectively, when averaged across sampling date.
NJB, NJS, and NJP are highly correlated with each other, r > 0.79, and moderately heritable (Milligan et al., 1990a). While NJB, NJS, and NJP are not strongly correlated with TRS, r = 0.11 to 0.42 (Milligan et al., 1990b), NJB is an important early-stage selection criterion and, despite the rather low correlation, effectively resulted in increased TRS across generations of breeding. Selection in an ascending ripening curve, as typified in Louisiana sugarcane breeding, probably facilitated expression of genetic variability in sucrose concentration (Breaux, 1984) particularly in light of the greater early- vs. late-season variability we observed for juice traits.
In conclusion, stalk weight did not respond to selection. Depending on the trait, comparable values of NJB, NJS, NJP, and TRS were expressed 2- to 8-wk earlier across generations of selection. However, there appeared to be little potential for genetic improvement of mid- to late-season juice traits. Sugarcane breeding in Louisiana does not appear to have reached a plateau in sucrose juice traits or sucrose yield. Sugarcane breeders in temperate regions should expect further genetic advances in early-season responses of juice traits, and early-, mid-, and late-season advances in TRS.
Acknowledgments
USDA is an equal opportunity provider and employer. Mention of trade names or commercial products in this article is solely for the purpose of providing specific information and does not imply recommendation or endorsement by the USDA. Technical expertise provided by field and juice laboratory personnel was greatly appreciated. Principle funding for the research was provided by USDA-ARS through Project 6052-21000-015-00D.
References
Alexander, A.G. 1973. Sugarcane Physiology. Elsevier, Amsterdam, 752 p.
Arceneaux, G., I.E. Stokes, and R.B. Bisland. 1931. Variety tests of
sugarcanes in Louisiana during the crop year 1929-30. USDA, Bur. Plant
Industry, Circ. 187. U.S. Gov. Print. Off., Washington, DC.
Birkett, H.S. 1976. Preliminary report on the 1974 factory scale core
studies. Proc. Am. Soc. Sugar Cane Technol. 5: 202-207.
Brandes, E.W. 1919. The mosaic disease of sugar cane and other grasses.
USDA, Bur. Plant Industry, Bull. 829. Washington, DC.
Breaux, R.D. 1984. Breeding to enhance sucrose content of sugarcane
varieties in Louisiana. Field Crops Res. 9: 59-67.
Ebrahim, M.K., O. Zingsheim, M.N. El-Shourbagy, P.H. Moore, and
Ewald Komor. 1998. Growth and sugar storage in sugarcane grown at
temperatures below and above optimum. J. Plant Physiology 153(5):593-
602.
Edmé, S.J., J.D. Miller, B. Glaz, P.Y.P. Tai, and J.C. Comstock. 2005.
Genetic contribution to yield gains in the Florida sugarcane industry across
33 years. Crop Sci. 45: 92-97.
Gilbert, R.A., J.D. Miller, J.C. Comstock, B. Glaz, and S.J. Edme. 2007.
Performance of exogenous sugarcane germplasm on mineral soils of
Florida, USA. Proc. Int. Soc. Sugar Cane Technol. 26: 388-393.
Gilbert, R.A., J.M. Shine, Jr., J.D. Miller, and R.W. Rice. 2004. Sucrose
accumulation and harvest schedule recommendations for CP sugarcane
cultivars. Crop Manage. doi: 10.1094/CM-2004-0402-01-RS
Glynn, N.C., K. McCorkle, and J.C. Comstock. 2009. Diversity among
mainland USA sugarcane cultivars examined by SSR genotyping. J. Am.
Soc. Sugar Cane Technol. 29: 36-52.
Gravois, K.A., K.P. Bischoff, S.B. Milligan, F.A. Martin, J.W. Hoy, T.E. Reagan,
C.A. Kimbeng, C.M. LaBorde, and G.L. Hawkins. 2008. Registration of ‘L
97-128’ sugarcane. J. Plant Reg. 2: 24-28.
Greenland, D. 2005. Climate variability and sugarcane yield in Louisiana. J.
Appl. Meteorol. 44: 1655-1666.
Hebert, L.P., and L.G. Davidson. 1960. Effect of time of harvest on yields
of sugarcane and sugar at Houma, Louisiana from 1953 to 1956. Sugar
Bull. 38: 215-219.
Hebert, L. P., and Rice, E. R. 1972. Maturity studies of commercial
sugarcane varieties in Florida. Proc. Int. Soc. Sugar Cane Technol., 1971.
14: 137-144.
Irvine, J.E., and L.G. Davidson. 1963. Effects of severe freezing on quality
of mill cane. Sugar Bull. 42(5): 54-58.
Irvine, J.E., and C.A. Richard. 1983. Production statistics as evidence of
technological improvement: the Louisiana sugarcane industry as a case
study. Sugar Cane 1: 13-18.
Julien, M.H.R., J.E. Irvine, and G.T.A. Benda. 1989. Sugarcane anatomy,
morphology and physiology. In: C. Ricaud, B.T. Egan, A.G. Gillaspie,
Jr., and C.G. Hughes, editors, Diseases of sugarcane, major diseases.
Elsevier, Amsterdam. p. 1-17.
Kimbeng, C.A., and M.C. Cox. 2003. Early generation selection of
sugarcane families and clones in Australia: a review. J. Am. Soc. Sugar
Cane Technol. 23: 20-39.
Legendre, B.L. 1972. Relative maturity of sugarcane varieties grown in
Louisiana. Sugar Bull. 51(3): 6-12.
Legendre, B.L. 1975. Ripening of sugarcane: effects of sunlight,
temperature, and rainfall. Crop Sci. 15: 349-352.
Legendre, B.L. 1985. Changes in juice quality of nine commercial
sugarcane varieties grown in Louisiana. J. Am. Soc. Sugar Cane Technol.
4: 54-57.
A retrospective analysis of genetic advance in natural ripening of sugarcane
International Sugar Journal | May 2015376 377www.internationalsugarjournal.com
Legendre, B.L. 1986. Composition of sugarcane juice as affected by post-
freeze deterioration of stalks. J. Am. Soc. Sugar Cane Technol. 6: 11-18.
Legendre, B.L., and H.P. Fanguy. 1974. Relative maturity of six commercial
sugar cane varieties grown in Louisiana during 1973. Sugar Bull. 53(2):
6-11.
Legendre, B.L., and M.T. Henderson. 1972. The history and development
of sugar yield calculations. Proc. Am. Soc. Sugar Cane Technol. 2(NS):
10-18.
Lingle, S.E., R.M. Johnson, T.L. Tew, and R.P. Viator. 2010. Changes in
juice quality and sugarcane yield with recurrent selection for sucrose. Field
Crops Res. 118: 152-157.
Littell R.C., G.A. Milliken, W.W. Stroup, and R.D. Wolfinger. 1996. SAS
system for mixed models. SAS Institute Inc., Cary, NC.
Lofton, J., B.S. Tubana, Y. Kanke, J. Teboh, H. Viator, and M. Dalen. 2012.
Estimating sugarcane yield potential using an in-season determination of
normalized difference vegetative index. Sensors 12: 7529-7547.
Mirzawan, P.D.N., M. Cooper, I. H. DeLacy, and D.M. Hogarth. 1994.
Retrospective analysis of the relationships among the test environments
of the Southern Queensland sugarcane breeding programme. Theor. Appl.
Genet. 88: 707-716.
Matherne, R.J., R.D. Breaux, R.W. Millhollon, and R.D. Jackson. 1977.
Culture of sugarcane for sugar production in the Mississippi Delta. USDA-
ARS Agric. Handb. 417. U.S. Gov. Print. Office, Washington, DC.
Meade, G.P., and J.C.P. Chen. 1985. Cane sugar handbook. 11th ed.
Wiley-Interscience, NY.
Milligan, S.B., K.A. Gravois, K.P. Bischoff, and F.A. Martin. 1990a. Crop
effects on broad-sense heritabilities and genetic variances of sugarcane
yield components. Crop Sci. 30: 344-349.
Milligan, S.B., K.A. Gravois, K.P. Bischoff, and F.A. Martin. 1990b. Crop
effects on genetic relationships among sugarcane traits. Crop Sci. 30:
927-931.
Moore, P.H. 1985. Saccharum. In: A.H. Halevy, editor, CRC handbook of
flowering, Vol. 4. CRC Press, Inc., Boca Raton, FL. p. 243-262.
National Cooperative Soil Survey (NCSS). 2004. Cancienne series. USDA-
NRCS, USDA official soil series descriptions. https://soilseries.sc.egov.
usda.gov/OSD_Docs/C/CANCIENNE.html (accessed 27 Sept. 2013).
SAS Institute. 2002. SAS/STAT user’s guide. Release 9.1. Windows
version 5.1.2600. SAS Inst., Cary, NC.
Tew, T.L., E.O. Dufrene, D.D. Garrison, W.H. White, M.P. Grisham, Y.-B.
Pan, E.P. Richard, Jr., B.L. Legendre, and J.D. Miller. 2009. Registration of
‘HoCP 00-950’ sugarcane. J. Plant Reg. 3: 42-50.
Van Dillewijn, C. 1952. Botany of sugarcane. Chronica Botanica Co.,
Waltham, MA.
Zhou, M. 1998. Trends in yield, sucrose, stalk population and smut
tolerance over 20 years of sugarcane selection: 1. N. Zimbabwe. Proc. S.
Afr. Sugar Technol. Assn. 72: 47-50.

378 International Sugar Journal | May 2015
For the latest updates visit: www.internationalsugarjournal.comMeetings Calendar
ASA - American Sugar Alliance 315
BMA AG 309
Carbochem Inc 341
De Smet Engineers & Contractors 313
Escon Engineering Services Cover i
Ferguson Perforating & Wire Co 361
Fives Cail Cover ii
Gaudfrin SA 319
GEA Westfalia Separator Group GmbH 343
IPRO Industrieprojekt GmbH Cover iv
J. P. Mukherji & Associates Pvt Ltd 377
Novasep Group 345
Praj Industries Ltd 321
Purolite Corporation 311
SKIL - Sugar Knowledge International Ltd 323
Sugar Technology International 325
Thomas Broadbent & Sons Ltd 317
Veco bv 327
Western States 353
Advertisers' Index
10-13 May 20154th European Society of Sugar Technology Conference Reims, France Contact: Dr. Jürgen Bruhns Tel: + 49 30 803 56 78 Fax: + 49 30 803 20 49 Email: [email protected] www.esst-sugar.org
17-20 May 2015Sugar Industry Technologists Inc Annual Conference Osaka, Japan Contact: Edgar Aguirre Tel: +1 863 983 3637 Fax +1 863 983 7855 Email: [email protected], www.sucrose.com/sit
1-5 June 2015The 11th Germplasm & Breeding and 8th Molecular Biology joint ISSCT Workshop
Reunion Island Contact: Audrey THONG-CHANE Tel: (+262) 262 28 21 29 Email: [email protected], [email protected], [email protected]
www.reunion2015issct.com
June 22 - 24, 2015Annual Joint Meeting of the American Society of Sugar Cane Technologists
New Orleans, Louisiana, , USA Contact: Freddie Martin Tel: +1 225 578 6930 Fax: +1 225 578 1403 Email: [email protected] www.assct.org
31 July – 5 August 201531st American Sugar Alliance International Sweetener SymposiumHyatt Tamaya Resort & Spa Santa Ana Pueblo, New Mexico, USA Contact: Vickie Myers Tel: +1 703 351 5055 Fax: +1 703 351 6698 Email: [email protected] www.sugaralliance.org
14-18 September, 2015ISSCT XI Pathology and IX Entomology Workshops Guayaquil-Ecuador Contacts: Francisco X. Aleman, Raul O. Castillo, Email: [email protected] [email protected] www.issct.org/pdf/SecondAnnouncementPathologyEntomologyWrkSept2015.pdf
8 - 13 November 2015ISSCT Development of Co-Products from Sugar Mill Streams Baton Rouge, Louisiana, USA Contacts: Benjamin L. Legendre, Donal F. Day, E-mail: Email: [email protected], [email protected] Tel: +1 225 642 0135 Ext. 202 www.issct.org/pdf/1stannouncementcoprowrkusanov15.pdf

Not currently an ISJ subscriber?
The complete value chain from sugarcane and beet production right through to sugar processing and sugar refining PLUS the latest developments in the biofuelsand biobased sectors
How you will benefi t from an ISJ subscription:• The latest in-depth news, analysis and intelligence from your
industry in one place • Reliable information that could improve your efficiency and save
your company money • React quickest with the latest issue available online at
www.internationalsugarjournal.com
The World’s Leading Sugar Industry Magazine• Cane sugar manufacturing • Beet sugar manufacturing • Sugar refining • Equipment and machinery • Alternative sweeteners • Biofuels • Cogeneration
• Nutrition and health
• Environmental issues
sesu doof-non dna dooF •of sugar
,sessalom - stcudorp-yB •alcohol and vinasse
• Economics, trade and legislation
From time to time we may wish to send you information and offers about Informa plc products and services. If you do not wish to receive this information, please tick the following box. In some circumstances we may wish to pass on your details to carefully selected 3rd parties, in order for them to send you relevant information and offers. If you would like us to pass on your details in this way, please tick the following box. Data Protection: Personal Data supplied is subject to the Data Protection Act 1998. The personal information shown on this form, and/or provided by you, will be held on a database and may be shared with companies in the Informa Group in the UK and internationally. It may be used to keep you, or any additional names provided by you, up to date with developments in your industry. If you have any questions about Informa’s use of your data please write to the Database Manager, PO Box 461, West Byfl eet, KT14 9BN. Tel: +44 (0)20 7017 5239 Fax: +44 (0) 20 7017 6241 or email [email protected]
International Sugar Journal one year sub:UK £600 Europe €750 Rest of World US$955
To enquire about advertising in ISJ, please contact [email protected]
or call +44 (20) 701 77559
3 easy ways to subscribe...1. To order online, please visit
https://store.agra-net.com/isj.html2. 76057 7107 )02( 44+ no tsaC xelA llaC 3. Or email [email protected]
for a FREE sample copy
www.internationalsugarjournal.com
1010_TW_ISJ Subs ad update.indd 1 21/03/2013 07:52
Why subscribe to ISJ?
3 easy ways to subscribe...
1. To order online, please visit www.internationalsugarjournal.com2. Email Toby Webb [email protected]. Or email [email protected] for a FREE sample copy
International Sugar Journal one year sub:
UK £650 Europe €850 Rest of World US $1025

process engineering • plant layout • architecture • structural design • electrical / C&I engineering
IPRO Industrieprojekt GmbH Braunschweig, Germanywww.ipro-bs.de
IPRO Polska Sp. z o. o.Warszawa, Polandwww.ipropolska.pl
IPROSUCAR Consultoria e Engenharia Ltda.Piracicaba/SP, Brazilwww.iprosucar.com.br
IPRO INDIA Private LimitedChandigarh, Indiawww.ipro-india.com
nternational and fessional for your sugar project