Embed Size (px)
Citation preview
0
HALF-YEAR FINANCIAL REPORT JUNE 30, 2021
European company
Share capital: 132,962,091 euros Registered Office: 10, rue Marcel Dassault – 78140 Vélizy-Villacoublay – France
Versailles Commercial Register under No. 322 306 440
This document is comprised of the English language translation of Dassault Systèmes’ Half Year Report, which was filed with the AMF (French Financial Markets Authority) on July 27, 2021 in accordance with Article L.451-1-2 III of the French Monetary and
Financial Code. Only the French version of the Half Year Report is legally binding.
1
Table of Contents
1 RESPONSIBILITY ............................................................................................................................................................ 2 1.1 Person Responsible for the Half Year Financial Report ..................................................................................................................... 2 1.2 Statement by the Person Responsible for the Half Year Financial Report ......................................................................................... 2
2 HALF YEAR ACTIVITY REPORT..................................................................................................................................... 3 2.1 Profile of Dassault Systèmes, the 3DEXPERIENCE Company ......................................................................................................... 3 2.2 Risk Factors ...................................................................................................................................................................................... 3 2.3 Financial Performance Review.......................................................................................................................................................... 3
2.3.1 First Half 2021 Executive Overview .................................................................................................................................................................................. 3 2.3.2 Definitions of Key Metrics We Use .................................................................................................................................................................................... 4 2.3.3 Revenue ............................................................................................................................................................................................................................. 5 2.3.4 Operating expenses........................................................................................................................................................................................................... 7 2.3.5 Operating income .............................................................................................................................................................................................................. 8 2.3.6 Financial loss, net .............................................................................................................................................................................................................. 8 2.3.7 Income tax expense........................................................................................................................................................................................................... 8 2.3.8 Net income and net income per diluted share ................................................................................................................................................................... 8 2.3.9 Supplemental non-IFRS Financial Information ................................................................................................................................................................. 9 2.3.10 Variability in Quarterly Financial Results ....................................................................................................................................................................... 10 2.3.11 Capital Resources ......................................................................................................................................................................................................... 11
2.4 Related party transactions .............................................................................................................................................................. 11 2.5 2021 First Half Significant Events ................................................................................................................................................... 11 2.6 2021 Financial Objectives ............................................................................................................................................................... 12
3 CONDENSED CONSOLIDATED FINANCIAL STATEMENTS FOR THE HALF-YEAR ENDED JUNE 30, 2021 ............... 13 Consolidated Statements of Income......................................................................................................................................................................................... 13 Consolidated Statements of Comprehensive Income .............................................................................................................................................................. 14 Consolidated Balance Sheets .................................................................................................................................................................................................. 15 Consolidated Statements of Cash Flows ................................................................................................................................................................................. 16 Consolidated Statements of Shareholders’ Equity ................................................................................................................................................................... 17 Notes to the Condensed Consolidated Financial Statements for the Half-Year Ended June 30, 2021 .................................................................................. 18 Note 1 Description of Business ........................................................................................................................................................................................... 19 Note 2 Summary of Significant Accounting Policies ........................................................................................................................................................... 19 Note 3 Seasonality .............................................................................................................................................................................................................. 19 Note 4 Segment Information ............................................................................................................................................................................................... 19 Note 5 Software Revenue ................................................................................................................................................................................................... 20 Note 6 Government Grants ................................................................................................................................................................................................. 21 Note 7 Share-based Compensation .................................................................................................................................................................................... 21 Note 8 Other Operating Income and Expense, Net ............................................................................................................................................................ 23 Note 9 Financial Loss, Net .................................................................................................................................................................................................. 23 Note 10 Trade Accounts Receivable, Net ....................................................................................................................................................................... 24 Note 11 Intangible Assets and Goodwill .......................................................................................................................................................................... 24 Note 12 Borrowings ......................................................................................................................................................................................................... 25 Note 13 Derivatives and Currency and Interest Rate Risk Management ....................................................................................................................... 25 Note 14 Shareholders’ Equity .......................................................................................................................................................................................... 26 Note 15 Consolidated Statements of Cash Flows ........................................................................................................................................................... 27 Note 16 Commitments and Contingencies ...................................................................................................................................................................... 28
4 STATUTORY AUDITORS’ REVIEW REPORT ON THE 2021 HALF-YEARLY FINANCIAL INFORMATION..................... 29
2
1 RESPONSIBILITY 1.1 Person Responsible for the Half Year Financial Report Bernard Charlès, Vice-Chairman of the Board of Directors and Chief Executive Officer.
1.2 Statement by the Person Responsible for the Half Year Financial Report Vélizy-Villacoublay, July 27, 2021
“I hereby declare that, to the best of my knowledge, the 2021 half-year condensed financial statements have been prepared in accordance with the applicable generally accepted accounting standards and provide a true and fair view of the Company’s financial position and results of operations and those of all companies included within the scope of consolidation, and that the half year activity report reflects a true view of important events which occurred during the first six months of the year and of their impact on the half year financial statements, of the principal transactions between related parties, as well as the main risks and uncertainties for the remaining six months of the year.”
Bernard Charlès
Vice-Chairman of the Board of Directors and Chief Executive Officer
3
2 HALF YEAR ACTIVITY REPORT As used herein, “Dassault Systèmes”, the “Company”, the “Group” and “we” refers to Dassault Systèmes SE and all the companies included in the scope of consolidation. “Dassault Systèmes SE” refers only to the European parent company governed by French law of the Group.
2.1 Profile of Dassault Systèmes, the 3DEXPERIENCE Company Dassault Systèmes, the “3DEXPERIENCE Company”, is a global leader in sustainable innovation. Since 1981, the software solutions of Dassault Systèmes transform the way products are designed, simulated, produced, marketed and used, leveraging the virtual world to improve the real world. Dassault Systèmes provides a virtual experience platform that allows customers to create innovative products and services, and ultimately address the major challenges facing the world today: cities for people; energy and resources for the long term; food and personalized healthcare; how to supply and produce; and inspirational education and research.
Dassault Systèmes is a science-based, innovation-driven, business-minded and long-term oriented company. The 20,000 Group’s employees are driven by this ambition. This also translates into a high level of market confidence and trust among our 290,000 enterprise customers in almost 150 countries. We are a European company with a global presence and market reach.
2.2 Risk Factors The main risks and uncertainties to which the Group may be exposed during the remaining six months of fiscal year 2021 are presented in Section 1.9 “Risk Factors” of the Company’s 2020 Document d’enregistrement universel filed with the Autorité des marchés financiers (“AMF”, the French Financial Markets Authority) on March 19, 2021 and also available on our website www.3ds.com, it being specified that certain information relating to foreign currency and interest rate risks mentioned in said Document d’enregistrement universel are updated in Note 13 to the Condensed consolidated financial statements for the half-year ended June 30, 2021 under Chapter 3 of this Half Year Report.
2.3 Financial Performance Review The executive overview in paragraph 2.3.1. “First Half 2021 Executive Overview” highlights selected aspects of our business during the first six months of 2021. The First Half 2021 Executive Overview and Supplemental non-IFRS Financial Information should be read in conjunction with the Condensed consolidated financial statements of the Group for the half-year ended June 30, 2021 and the related notes included under Chapter 3 of this Half Year Report. Figures presented in the tables below are under IFRS, unless otherwise stated.
2.3.1 First Half 2021 Executive Overview
(in millions of euros, except per share data and percentages)
IFRS Non-IFRS
H1 2021 H1 2020 Change Change in
cc(2) H1 2021 H1 2020 Change Change in
cc(2) Total Revenue € 2,333.7 € 2,203.3 6% 11% € 2,335.1 € 2,215.0 5% 11% Software Revenue 2,118.5 1,973.0 7% 13% 2,119.7 1,983.5 7% 12% Services Revenue 215.2 230.4 (7%) (2%) 215.4 231.5 (7%) (2%) Operating Margin 19.9% 11.9% +8.0 pt 33.0% 28.0% +5.0 pt
Diluted net earnings per share ("EPS")(1)
€ 0.27 € 0.15 81%
€ 0.44 € 0.35 27% 35%
(1) 2020 figures have been restated and 2021 presented in order to reflect the five-for-one share split on Dassault Systèmes’ share effected on July 7, 2021. (2) in constant currencies.
4
2.3.2 Definitions of Key Metrics We Use Supplemental Non-IFRS Financial Information
In discussing and analyzing the results of its operations, our Management considers supplemental non-IFRS financial information: (i) non-IFRS revenue data excludes the effect of adjusting the carrying value of acquired companies’ contract liabilities (deferred revenue) ; and non-IFRS expense data excludes, (ii) the amortization of acquired intangibles assets and of tangible assets revaluation, (iii) share-based compensation expense and related social charges, (iv) lease incentives of acquired companies, (v) and other operating income and expense, net, including acquisition, integration and restructuring expenses, and impairment of goodwill and acquired intangible assets, (vi) certain one-time items included in financial loss, net, and (vii) certain one-time tax effects and the income tax expense of the above adjustments. A reconciliation of this supplemental non-IFRS financial information with information set forth in the Company’s consolidated financial statements and the notes thereto is presented below under paragraph 2.3.9 “Supplemental non-IFRS Financial Information”. Our management uses the supplemental non-IFRS financial information, together with the IFRS financial information, for financial planning and analysis, evaluation of our operating performance, mergers and acquisition analysis and valuation, operational decision-making and for setting financial objectives for future periods. Compensation of our senior management is based in part on the performance of our business measured with the supplemental non-IFRS information. We believe that the supplemental non-IFRS data also provides meaningful information to investors and financial analysts who use the information for comparing the Group’s operating performance to its historical trends and to other companies in the software industry, as well as for valuation purposes.
Readers are cautioned that the supplemental non-IFRS financial information is subject to inherent limitations. It is not based on any comprehensive set of accounting rules or principles and should not be considered in isolation from or as a substitute for IFRS measurements. The supplemental non-IFRS financial information should be read only in conjunction with the Company’s consolidated financial statements prepared in accordance with IFRS. Furthermore, the Group’s supplemental non-IFRS financial information may not be comparable to similarly titled “non-IFRS” measures used by other companies. Specific limitations for individual non-IFRS measures are set forth in the Company’s 2020 Document d’enregistrement universel.
Information in Constant Currencies
We have followed a long-standing policy of measuring our revenue performance and setting our revenue objectives exclusive of currency in order to measure in a transparent manner the underlying level of improvement in our total revenue and software revenue by activity, industry, geography and product line. We believe it is helpful to evaluate our growth exclusive of currency impacts, particularly to help understand revenue trends in our business. Therefore, we provide percentage increases or decreases in our revenue, expenses and EPS (in both IFRS as well as non-IFRS) to eliminate the effect of changes in currency values, particularly the U.S. dollar and the Japanese yen, relative to the euro. Variations in constant currencies are obtained by comparing the performances of the current period with those of the comparable period recalculated using the average exchange rates of the current period.
While constant currency calculations are not considered to be an IFRS measure, we do believe these measures are critical to understanding our global revenue results and to compare with many of our competitors who report their financial results in U.S. dollars. Therefore, we are including this calculation for comparing IFRS revenue figures for comparable periods as well as for comparing non-IFRS revenue figures for comparable periods. All constant currency information is provided on an approximate basis.
Information on Growth excluding acquisitions (“organic growth”)
In addition to financial indicators on the entire Group’s scope, Dassault Systèmes provides growth excluding the impact of acquisitions, also named organic growth. The related growth rate is determined by restating the scope of activity as follows: for entities entering the consolidation scope in the current year, subtracting the contribution of the acquisition from the aggregates of the current year and, for entities entering the consolidation scope in the previous year, subtracting the contribution of the acquisition from January 1st of the current year, until the last day of the month of the current year when the acquisition was made the previous year.
Information on Industrial Sectors
Dassault Systèmes’ Industries develop Solution Experiences, industry-focused offerings that deliver specific value to companies and users in a particular industry. We serve eleven industries structured into three sectors:
• Manufacturing Industries: Transportation & Mobility; Aerospace & Defense; Marine & Offshore; Industrial Equipment; High-Tech; Home & Lifestyle; Consumer Packaged Goods & Retail and a portion of Business Services;
• Life Sciences & Healthcare: Life Sciences & Healthcare;
• Infrastructure & Cities: Energy & Materials; Construction, Cities and Territories; Business Services.
5
Information on Product Lines
Our product lines financial reporting include: 1) Industrial Innovation software revenue, comprised of our CATIA, ENOVIA, SIMULIA, DELMIA, GEOVIA, NETVIBES, and 3DEXCITE brands; 2) Life Sciences software revenue, comprised of our MEDIDATA and BIOVIA brands; and 3) Mainstream Innovation software revenue, comprised of CENTRIC PLM and 3DVIA brands as well as our 3DEXPERIENCE WORKS family which includes our SOLIDWORKS brand.
3DEXPERIENCE Licenses and Software Contribution
To measure the progressive penetration of 3DEXPERIENCE software, we use the following ratios: a) for Licenses revenue, we calculate the percentage contribution by comparing total 3DEXPERIENCE Licenses revenue to Licenses revenue for all product lines except SOLIDWORKS and acquisitions (“related Licenses revenue”); and, b) for software revenue, the Group calculates the percentage contribution by comparing total 3DEXPERIENCE software revenue to software revenue for all product lines except SOLIDWORKS and acquisitions (“related software revenue”).
2.3.3 Revenue
(in millions of euros, except per share data and percentages)
IFRS Non-IFRS For the First Half Ended
June 30, Change Change in cc(3)
For the First Half Ended June 30, Change Change
in cc(3) 2021 2020 2021 2020
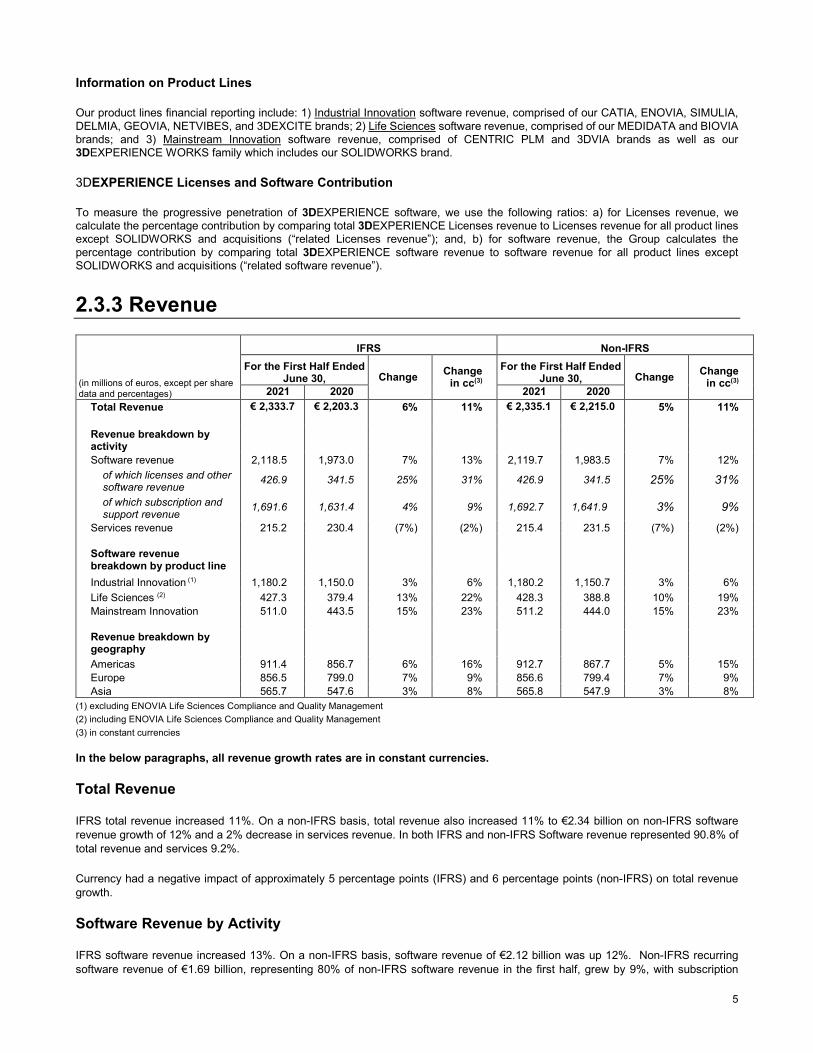
Total Revenue € 2,333.7 € 2,203.3 6% 11% € 2,335.1 € 2,215.0 5% 11% Revenue breakdown by activity Software revenue 2,118.5 1,973.0 7% 13% 2,119.7 1,983.5 7% 12%
of which licenses and other software revenue
426.9 341.5 25% 31% 426.9 341.5 25% 31%
of which subscription and support revenue
1,691.6 1,631.4 4% 9% 1,692.7 1,641.9 3% 9%
Services revenue 215.2 230.4 (7%) (2%) 215.4 231.5 (7%) (2%) Software revenue breakdown by product line Industrial Innovation (1) 1,180.2 1,150.0 3% 6% 1,180.2 1,150.7 3% 6% Life Sciences (2) 427.3 379.4 13% 22% 428.3 388.8 10% 19% Mainstream Innovation 511.0 443.5 15% 23% 511.2 444.0 15% 23% Revenue breakdown by geography Americas 911.4 856.7 6% 16% 912.7 867.7 5% 15% Europe 856.5 799.0 7% 9% 856.6 799.4 7% 9% Asia 565.7 547.6 3% 8% 565.8 547.9 3% 8%
(1) excluding ENOVIA Life Sciences Compliance and Quality Management (2) including ENOVIA Life Sciences Compliance and Quality Management (3) in constant currencies In the below paragraphs, all revenue growth rates are in constant currencies.
Total Revenue
IFRS total revenue increased 11%. On a non-IFRS basis, total revenue also increased 11% to €2.34 billion on non-IFRS software revenue growth of 12% and a 2% decrease in services revenue. In both IFRS and non-IFRS Software revenue represented 90.8% of total revenue and services 9.2%.
Currency had a negative impact of approximately 5 percentage points (IFRS) and 6 percentage points (non-IFRS) on total revenue growth.
Software Revenue by Activity
IFRS software revenue increased 13%. On a non-IFRS basis, software revenue of €2.12 billion was up 12%. Non-IFRS recurring software revenue of €1.69 billion, representing 80% of non-IFRS software revenue in the first half, grew by 9%, with subscription
6
revenue up double-digits. Licenses and other software revenue increased 31% (IFRS and non-IFRS on an organic basis) to €426.9 million.
3DEXPERIENCE non-IFRS software revenue increased 20% with licenses and other software revenue sharply up. The 3DEXPERIENCE Platform is an important contributor to key wins across large accounts during the period.
Non-IFRS Cloud revenue grew 24%, to represent 19.0% of non-IFRS software revenue, and benefited from a number of significant wins, reflecting the accelerating trend towards collaborative and inclusive innovation.
Software Revenue by Product Line
Industrial Innovation IFRS and non-IFRS software revenue grew 6% to €1.2 billion, representing 55.7% of software revenue in both IFRS and non-IFRS.
• In Industrial Innovation, CATIA, with its world-leading solutions in product design and modeling experience, delivered strong results punctuated by CATIA Cyber Systems. NETVIBES, in data intelligence, also benefited from positive business trends into the second quarter.
• Transportation and Mobility revenue were a significant contributor to segment returns. The increased complexity of developing more sustainable vehicles, including EVs, aerospace and urban transportation infrastructure should be a secular tailwind. The High Tech and Home & Lifestyle industries also boosted revenue during the period.
• CIMdata’s 2021 Annual PLM Market Report recognized Dassault Systèmes as the market leader across a number of categories including PLM, cPDM and CAD.
Life Sciences software revenue was €427.3 million (IFRS) and €428.3 million (non-IFRS), up 22% (IFRS) and 19% (non-IFRS), and representing 20.2% of software revenue (IFRS and non-IFRS).
• Life Sciences & Healthcare industry experienced strong business momentum across its product portfolio including Rave EDC, Patient Cloud, Acorn AI as well as in attach rates. We see the platformization as a structural driver.
• MEDIDATA continued to deliver compelling innovation. With MEDIDATA’s Decentralized Clinical Trials (DCT), Dassault Systèmes became the first company in the world to unify direct patient data capture technology, direct-to-patient services, and study oversight and monitoring, on a single platform.
• MEDIDATA’s Acorn AI Synthetic Control Arm was named “Best AI-based Solution for Healthcare” by 2021 AI Breakthrough Awards. This capability, which leverages our proprietary and unique dataset, will be an important category driver.
Mainstream Innovation software revenue totaled €511.0 million (IFRS) and €511.2 million (non-IFRS), representing for both IFRS and non-IFRS an increase of 23% and 24.1% of software revenue.
• SOLIDWORKS non-IFRS software revenue rose 21% on broad-based global demand. SOLIDWORKS cloud solutions revenue was up sharply during the period.
• CENTRIC PLM continued to see strong business momentum.
Software Revenue by Geography
IFRS software revenue increased 17% (non-IFRS 16%) in the Americas, led by a strong performance in Life Sciences & Healthcare and growth in Transportation and Mobility. IFRS and non-IFRS software revenue increased 11% in Asia on strong growth of China. In Europe, software revenue increased 10% both in IFRS and non-IFRS.
7
2.3.4 Operating expenses
(in millions of euros, except percentages)
IFRS Non-IFRS For the First Half Ended
June 30, Change For the First Half Ended
June 30, Change 2021 2020 2021 2020
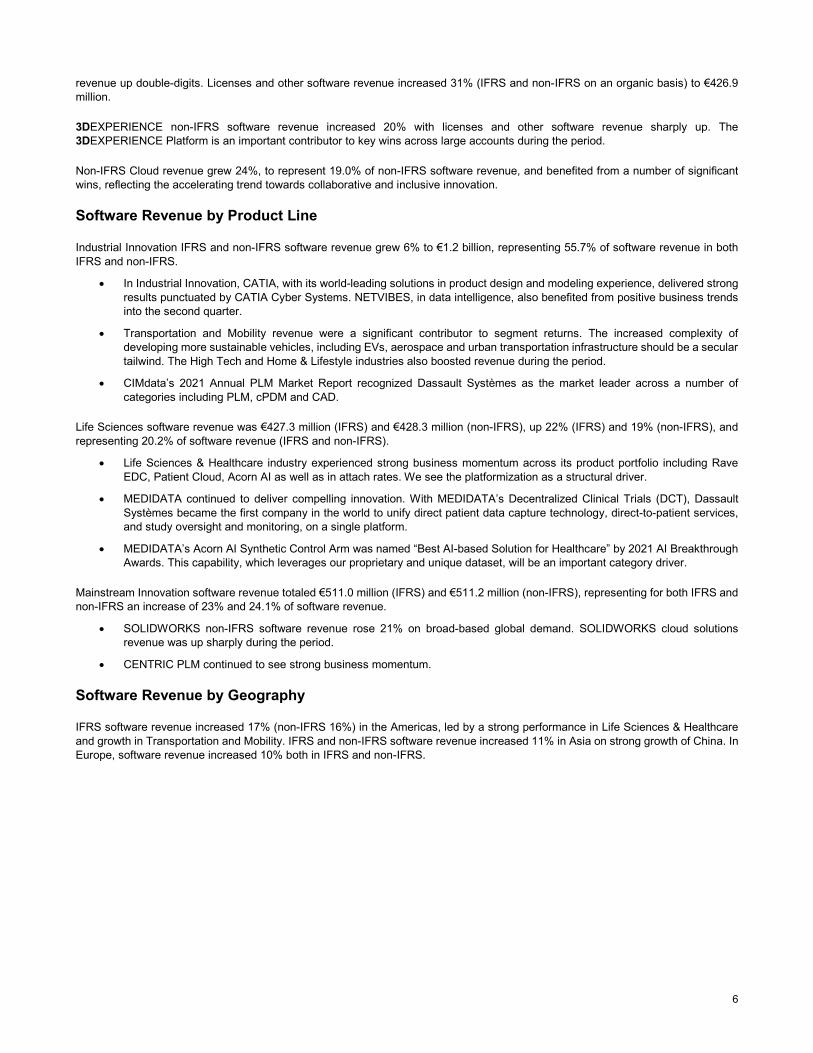
Cost of software revenue (excluding amortization of acquired intangibles and of tangible assets revaluation)
€(197.7) €(152.8) 29% €(192.9) €(151.1) 28%
(as % of total revenue) (8%) (7%) (8%) (7%) Cost of services revenue €(193.4) €(227.9) (15%) €(190.9) €(223.1) (14%) (as % of total revenue) (8%) (10%) (8%) (10%) Research and development expenses €(466.4) €(473.6) (2%) €(431.7) €(436.2) (1%) (as % of total revenue) (20%) (21%) (18%) (20%) Marketing and sales expenses €(619.3) €(647.2) (4%) €(591.2) €(616.8) (4%) (as % of total revenue) (27%) (29%) (25%) (28%) General and administrative expenses €(189.8) €(198.4) (4%) €(157.2) €(167.3) (6%) (as % of total revenue) (8%) (9%) (7%) (8%) Amortization of acquired intangible assets and of tangible assets revaluation €(178.8) €(209.9) (15%) € - € - N/A
Other operating income and (expense), net €(24.1) €(31.8) (24%) € - € - N/A
The increase in cost of software revenue (excluding amortization of acquired intangibles) mostly reflected organic headcount growth and related costs, higher professional fees and an increase in IT and cloud hosting costs partially offset by a positive currency effect of 8.7 percentage points (IFRS) and 8.4 percentage points (non-IFRS). On an organic basis and at constant currency, IFRS cost of sotware revenue increased 38% (36% in non-IFRS).
The decrease in cost of services was largely due to subcontracting services optimization, lower travel expenses in connection with the COVID-19 restrictions and to a positive currency effect of 4.1 percentage points (IFRS) and 3.5 percentage points (non-IFRS). On an organic basis and at constant currency, cost of services revenue decreased 12% in both IFRS and non-IFRS.
Costs for R&D of software are expensed in the period in which they are incurred. We do not capitalize any R&D costs. For the 2021 First Half, the decrease in R&D expenses was largely due to a currency positive effect of 4.5 percentage points (IFRS) and 4.0 percentage points (non-IFRS) offsetting organic headcount growth and related costs. On an organic basis and at constant currency, IFRS and non-IFRS R&D expenses increased respectively 2% and 3%.
The decrease in marketing and sales expenses was largely due to a currency positive effect of 4.1 percentage points (IFRS) and 4.2 percentage points (non-IFRS). On an organic basis and at constant currency, IFRS and non-IFRS sales and marketing expenses remained stable.
The decrease in general and administrative expenses was largely due to a currency positive effect of 4.3 percentage points (IFRS) and 4.1 percentage points (non-IFRS) and to a slight headcount decrease. On an organic basis and at constant currency, IFRS and non-IFRS general and administrative expenses decreased, respectively by 1% and 3%.
IFRS Amortization of acquired intangibles decreased in the 2021 First Half, in relation with several ends of amortization in 2020. IFRS Other operating income and (expense), net decrease is mainly explained by a voluntary early retirement and end of career management multi-year plan effective in February 2020, which is integrated in a job and career paths agreement in France, partially offset by more significant costs in 2021 related to reorganization of Medidata Solution Inc. premises.
8
2.3.5 Operating income
(in millions of euros, except percentages)
IFRS Non-IFRS For the First Half Ended
June 30, Change For the First Half Ended
June 30, Change 2021 2020 2021 2020
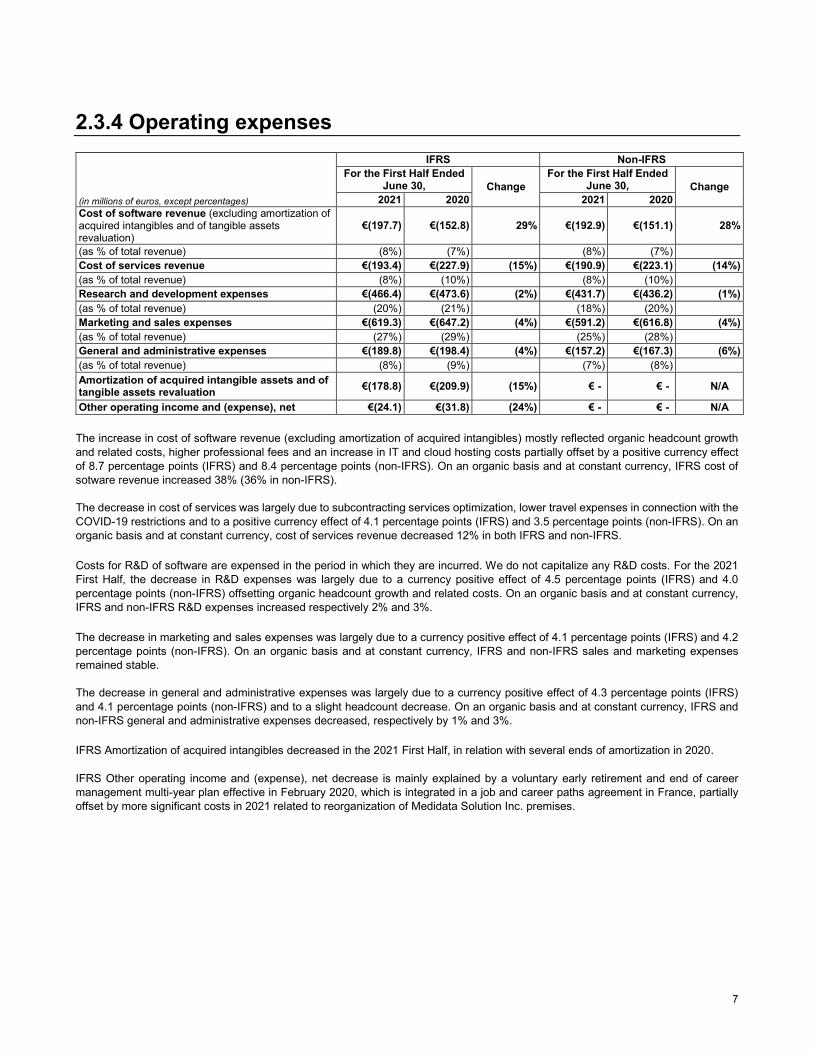
Operating Income € 464.2 € 261.7 77% € 771.2 € 620.4 24% Operating margin (as % of total revenue) 19.9% 11.9% 33.0% 28.0%
The increase in IFRS and non-IFRS operating margin was largely due to organic growth reflecting the combined effect of higher total revenue and lower operating expenses.
The increase in non-IFRS operating margin reflected an organic growth of about 560 basis points offset in part by a net negative currency impact of about 40 basis points and to a lesser extent by acquisition dilution of about 20 basis points. The increase in IFRS operating margin reflected the same factors and benefited from the decrease in amortization of acquired intangibles.
2.3.6 Financial loss, net
(in millions of euros, except percentages)
IFRS Non-IFRS For the First Half Ended
June 30, Change For the First Half Ended
June 30, Change 2021 2020 2021 2020
Financial loss, net €(8.0) €(13.0) (39%) €(7.2) €(12.5) (42%)
IFRS and non-IFRS financial loss, net increased principally due to decrease in interest expenses, mainly related to the partial repayment in October 2020 of the debt to fund a portion of the acquisition of Medidata Solutions, Inc., partially offset by the decrease in average yield rates on cash and cash equivalents.
2.3.7 Income tax expense
(in millions of euros, except percentages)
IFRS Non-IFRS For the First Half Ended
June 30, Change For the First Half Ended
June 30, Change 2021 2020 2021 2020
Income tax expense € 99.7 € 59.4 68% € 173.3 € 150.1 15% Effective consolidated tax rate 21.9% 23.9% 22.7% 24.7%
IFRS and non-IFRS tax expense increased mainly related to the profit before tax growth, partially offset by the effective tax rate decrease, mainly due to the lower corporate tax rate applicable in France.
2.3.8 Net income and net income per diluted share
(in millions of euros, except per share data and percentages)
IFRS Non-IFRS For the First Half Ended
June 30, Change For the First Half Ended
June 30, Change 2021 2020 2021 2020
Net Income attributable to Equity holders of the Group € 357.1 € 195.4 83% € 588.6 € 461.4 28%
Diluted earnings per share* € 0.27 € 0.15 81% € 0.44 € 0.35 27% Diluted weighted average number of shares outstanding (in millions)* 1,323.6 1,314.1 - 1,323.6 1,314.1 -
*2020 figures have been restated and 2021 presented in order to reflect the five-for-one share split on Dassault Systèmes’ share effected on July 7, 2021.
Non-IFRS diluted earnings per share is above the Group’s objectives and grew 35% in constant currencies.
9
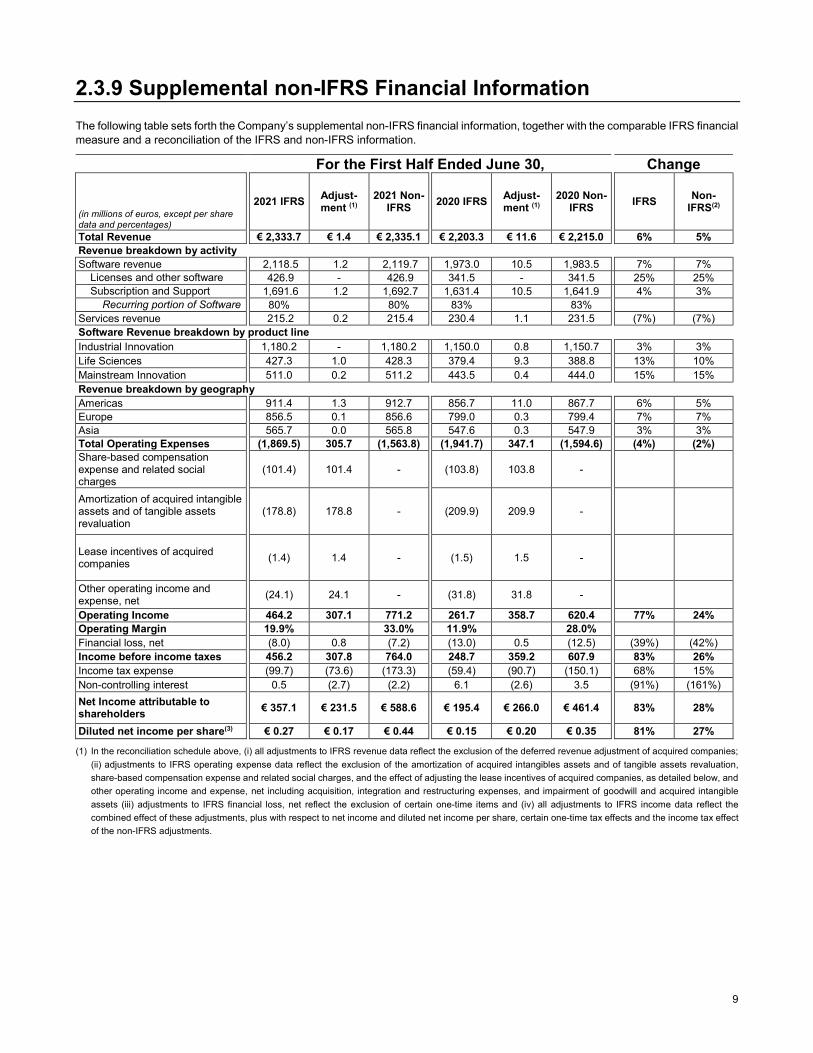
2.3.9 Supplemental non-IFRS Financial Information The following table sets forth the Company’s supplemental non-IFRS financial information, together with the comparable IFRS financial measure and a reconciliation of the IFRS and non-IFRS information.
For the First Half Ended June 30, Change
(in millions of euros, except per share data and percentages)
2021 IFRS Adjust- ment (1)
2021 Non-IFRS 2020 IFRS Adjust-
ment (1) 2020 Non-
IFRS IFRS Non-IFRS(2)
Total Revenue € 2,333.7 € 1.4 € 2,335.1 € 2,203.3 € 11.6 € 2,215.0 6% 5% Revenue breakdown by activity Software revenue 2,118.5 1.2 2,119.7 1,973.0 10.5 1,983.5 7% 7%
Licenses and other software
426.9 - 426.9 341.5 - 341.5 25% 25% Subscription and Support
1,691.6 1.2 1,692.7 1,631.4 10.5 1,641.9 4% 3%
Recurring portion of Software
80% 80% 83% 83% Services revenue 215.2 0.2 215.4 230.4 1.1 231.5 (7%) (7%) Software Revenue breakdown by product line Industrial Innovation 1,180.2 - 1,180.2 1,150.0 0.8 1,150.7 3% 3% Life Sciences 427.3 1.0 428.3 379.4 9.3 388.8 13% 10% Mainstream Innovation 511.0 0.2 511.2 443.5 0.4 444.0 15% 15% Revenue breakdown by geography Americas 911.4 1.3 912.7 856.7 11.0 867.7 6% 5% Europe 856.5 0.1 856.6 799.0 0.3 799.4 7% 7% Asia 565.7 0.0 565.8 547.6 0.3 547.9 3% 3% Total Operating Expenses (1,869.5) 305.7 (1,563.8) (1,941.7) 347.1 (1,594.6) (4%) (2%) Share-based compensation expense and related social charges
(101.4) 101.4 -
(103.8) 103.8 -
Amortization of acquired intangible assets and of tangible assets revaluation
(178.8) 178.8 -
(209.9) 209.9 -
Lease incentives of acquired companies
(1.4) 1.4 -
(1.5) 1.5 -
Other operating income and expense, net
(24.1) 24.1 -
(31.8) 31.8 -
Operating Income 464.2 307.1 771.2 261.7 358.7 620.4 77% 24% Operating Margin 19.9% 33.0% 11.9% 28.0% Financial loss, net (8.0) 0.8 (7.2) (13.0) 0.5 (12.5) (39%) (42%) Income before income taxes 456.2 307.8 764.0 248.7 359.2 607.9 83% 26% Income tax expense (99.7) (73.6) (173.3) (59.4) (90.7) (150.1) 68% 15% Non-controlling interest 0.5 (2.7) (2.2) 6.1 (2.6) 3.5 (91%) (161%) Net Income attributable to shareholders
€ 357.1 € 231.5 € 588.6
€ 195.4 € 266.0 € 461.4
83% 28%
Diluted net income per share(3) € 0.27 € 0.17 € 0.44 € 0.15 € 0.20 € 0.35 81% 27%
(1) In the reconciliation schedule above, (i) all adjustments to IFRS revenue data reflect the exclusion of the deferred revenue adjustment of acquired companies; (ii) adjustments to IFRS operating expense data reflect the exclusion of the amortization of acquired intangibles assets and of tangible assets revaluation, share-based compensation expense and related social charges, and the effect of adjusting the lease incentives of acquired companies, as detailed below, and other operating income and expense, net including acquisition, integration and restructuring expenses, and impairment of goodwill and acquired intangible assets (iii) adjustments to IFRS financial loss, net reflect the exclusion of certain one-time items and (iv) all adjustments to IFRS income data reflect the combined effect of these adjustments, plus with respect to net income and diluted net income per share, certain one-time tax effects and the income tax effect of the non-IFRS adjustments.

10
For the First Half Ended June 30,
(in millions of euros)
2021 IFRS
Share-based
compensation
expense and
related social
charges
Lease incentives
of acquired companie
s
2021 non-IFRS
2020 IFRS
Share-based
compensation
expense and
related social
charges
Lease incentives
of acquired companie
s
2020 non-IFRS
Cost of revenue (391.1) 6.9 0.4 (383.8) (380.7) 6.0 0.4 (374.3) Research and development expenses (466.4) 34.1 0.6 (431.7) (473.6) 36.8 0.7 (436.2)
Marketing and sales expenses (619.3) 27.9 0.2 (591.2) (647.2) 30.2 0.2 (616.8) General and administrative expenses (189.8) 32.5 0.1 (157.2) (198.4) 30.9 0.2 (167.3)
Total 101.4 1.4 103.8 1.5
(2) The non-IFRS percentage change compares non-IFRS measures for the two different periods. In the event there is an adjustment to the relevant measure for only one of the periods under comparison, the non-IFRS change compares the non-IFRS measure to the relevant IFRS measure.
(3) Based on a weighted average of 1,323.6 diluted shares for the 2021 First Half and 1,314.1 million diluted shares for the 2020 First Half. 2020 figures have been restated and 2021 presented in order to reflect the five-for-one share split on Dassault Systèmes’ share effected on July 7, 2021.
2.3.10 Variability in Quarterly Financial Results Our quarterly licenses revenue growth may have varied significantly in the past and may vary significantly in the future. In addition, quarterly licensing revenue growth reflects business seasonality, clients’ decision processes and licenses and subscription licensing mix. Services revenue activity also vary significantly by quarter reflecting clients’ decision processes as well as our decisions regarding service engagements to be performed by us or by system integrators we work with.
Our total software revenue growth has generally been less sensitive to quarterly variation due to the significant level of recurring software revenue, which is comprised of subscription revenue and support revenue. IFRS and non-IFRS Recurring software revenue represented 80% and 83% of total software revenue for the First Half of 2021 and 2020, respectively but could be subject to renewal delays. With the implementation of IFRS 15 effective as of January 1, 2018, sequential comparisons of our recurring software revenue growth need, however, to take into account the fact that a high proportion of on-premise, subscription software contracts renew for an annual period as of January 1. Therefore, under IFRS 15 we record a higher percentage of the annual amount of the on-premise subscription in the first quarter of our fiscal year. In addition, year-over-year growth comparisons may be impacted by changes in the duration of on-premise subscriptions upon renewals. Revenue from cloud subscriptions are generally recognized ratably over the contractual terms.
(in millions of euros) 1Q 2020 2Q 2020 3Q 2020 4Q 2020 1Q 2021 2Q 2021 Subscription&Support revenue (IFRS) 841.9 789.5 767.3 806.4 864.0 827.6 Subscription&Support revenue (Non-IFRS) 850.7 791.2 767.9 806.7 864.6 828.2
A significant portion of license revenue typically occurs in the last month of each quarter, and we normally experience our highest licenses revenue for the year in our fiscal fourth quarter. In addition, software revenue, total revenue, operating income, operating margin and net income have generally been higher in the fourth quarter.
Acquisitions and divestitures can also cause the different elements of our revenue to vary from quarter to quarter. Rapid changes in currency exchange rates could also cause reported revenue, operating income and earnings per share and their respective reported growth rates to vary from quarter to quarter.
Therefore, it is possible that our quarterly total revenue could vary significantly and that our net income could vary significantly, reflecting the change in revenues, together with the effects of our investment plans. See paragraphs 1.9.1.1 “Uncertain Global Economic Environment” and 1.9.1.11 “Variability in Dassault Systèmes’ Quarterly Operating Income” in Risk Factors in our 2020 Document d’enregistrement universel.
11
2.3.11 Capital Resources We have significant financial flexibility thanks to our available cash and short-term investments positions and strong level of annual cash flow. Principal uses of cash are for select acquisitions, repayment of debt, cash dividends and treasury share repurchases to minimize share count dilution from performance share plans.
Our net financial position improved to €(1.27) billion on June 30, 2021, compared to €(2.04) billion on December 31, 2020, with an increase in cash and cash equivalents of €0.77 billion to €2.92 billion from €2.15 billion, less debt related to borrowings of €4.19 billion.
For the 2021 First Half, our principal sources of liquidity were cash from operations aggregating €1,03 billion (H1 2020: €855.0 million), and proceeds from the exercise of stock options totaling €74.9 million (H1 2020: €47.3 million). During the 2021 First Half, cash obtained from operations was used principally for cash dividends of €147.1 million (H1 2020: €182.5 million), repurchase of treasury shares for €94.4 million (H1 2020: €104.7 million) in relation with share-based compensation plans, capital expenditures of €56.8 million (H1 2020: €87.4 million), payment for lease obligations of €49.2 million (H1 2020: €47.4 million) and borrowing repayment of €11.3 million (H1 2020: nil).
Exchange rate fluctuations had a positive translation effect on cash and cash equivalent balances, of €29.9 million as of June 30, 2021, and a negative translation effect of €(10.5) million as of June 30, 2020.
We follow a conservative policy for investing our cash resources, mostly relying on investment grade short-term maturity investments from major banks and financial institutions counter-parties.
See also the Consolidated Statements of Cash Flows presented in the Condensed Consolidated Financial Statements for the half-year ended June 30, 2021.
2.4 Related party transactions Related party transactions were identified and described in the 2020 Document d’enregistrement universel, in Chapter 4.1.1 “Consolidated Financial Statements”, Note 26. No new related party transaction occurred during the 2021 First Half.
The transactions entered into with Dassault Aviation and mentioned in the 2020 Document d’enregistrement universel continued during the first six months of 2021. There was no modification which could significantly impact the financial position or the income of Dassault Systèmes during the 2021 First Half.
2.5 2021 First Half Significant Events Significant events
Dassault Systèmes Commits for Sustainability: Science-Based Targets Approved and Net Zero Emissions Timeline Set
Dassault Systèmes announced that the Science Based Targets initiative (SBTi) has approved its greenhouse gas emissions reduction targets, which are in line with the Paris Agreement and SBTi best practice guidance. The company has also committed to achieve net zero emissions by 2040 to help drive sustainability at a global scale and high pace with the use of Virtual Twin Experiences.
Other information
On May 26, 2021, at the Annual Shareholders’ Meeting, Dassault Systèmes’ shareholders approved a dividend for the fiscal year 2020 equivalent to €0.56 per share. On June 1, 2021, the dividend was fully paid in cash in an aggregate amount of €147.1 million.
On July 7, 2021, at the opening of the financial market in Paris, a five-for one split of the par value of the Company’s common stock became effective. As a result, the par value decreased from €0.50 to €0.10 per share, and total number of shares comprising the capital were multiplied by five. The share split had previously been approved by shareholders at the Annual Shareholders’ Meeting held on May 26, 2021.
12
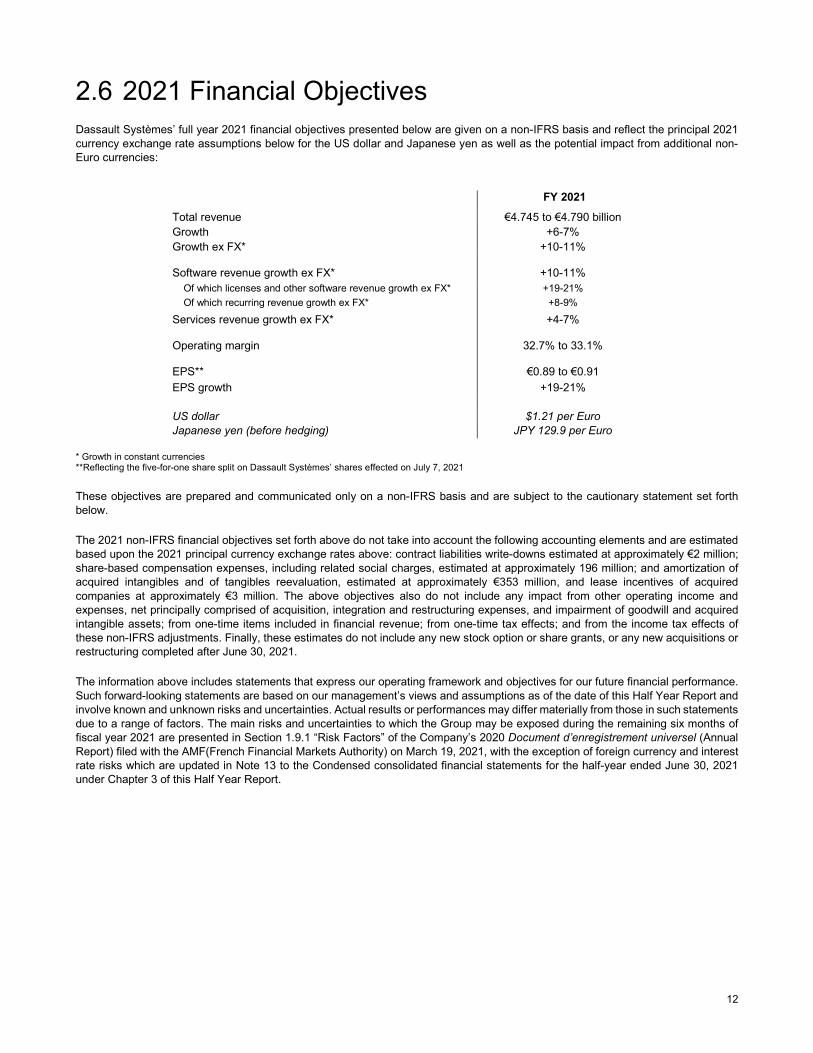
2.6 2021 Financial Objectives Dassault Systèmes’ full year 2021 financial objectives presented below are given on a non-IFRS basis and reflect the principal 2021 currency exchange rate assumptions below for the US dollar and Japanese yen as well as the potential impact from additional non-Euro currencies:
FY 2021 Total revenue €4.745 to €4.790 billion Growth +6-7% Growth ex FX* +10-11% Software revenue growth ex FX* +10-11% Of which licenses and other software revenue growth ex FX* +19-21% Of which recurring revenue growth ex FX* +8-9%
Services revenue growth ex FX* +4-7% Operating margin 32.7% to 33.1% EPS** €0.89 to €0.91 EPS growth +19-21% US dollar $1.21 per Euro Japanese yen (before hedging) JPY 129.9 per Euro
* Growth in constant currencies **Reflecting the five-for-one share split on Dassault Systèmes’ shares effected on July 7, 2021
These objectives are prepared and communicated only on a non-IFRS basis and are subject to the cautionary statement set forth below.
The 2021 non-IFRS financial objectives set forth above do not take into account the following accounting elements and are estimated based upon the 2021 principal currency exchange rates above: contract liabilities write-downs estimated at approximately €2 million; share-based compensation expenses, including related social charges, estimated at approximately 196 million; and amortization of acquired intangibles and of tangibles reevaluation, estimated at approximately €353 million, and lease incentives of acquired companies at approximately €3 million. The above objectives also do not include any impact from other operating income and expenses, net principally comprised of acquisition, integration and restructuring expenses, and impairment of goodwill and acquired intangible assets; from one-time items included in financial revenue; from one-time tax effects; and from the income tax effects of these non-IFRS adjustments. Finally, these estimates do not include any new stock option or share grants, or any new acquisitions or restructuring completed after June 30, 2021.
The information above includes statements that express our operating framework and objectives for our future financial performance. Such forward-looking statements are based on our management’s views and assumptions as of the date of this Half Year Report and involve known and unknown risks and uncertainties. Actual results or performances may differ materially from those in such statements due to a range of factors. The main risks and uncertainties to which the Group may be exposed during the remaining six months of fiscal year 2021 are presented in Section 1.9.1 “Risk Factors” of the Company’s 2020 Document d’enregistrement universel (Annual Report) filed with the AMF(French Financial Markets Authority) on March 19, 2021, with the exception of foreign currency and interest rate risks which are updated in Note 13 to the Condensed consolidated financial statements for the half-year ended June 30, 2021 under Chapter 3 of this Half Year Report.
13
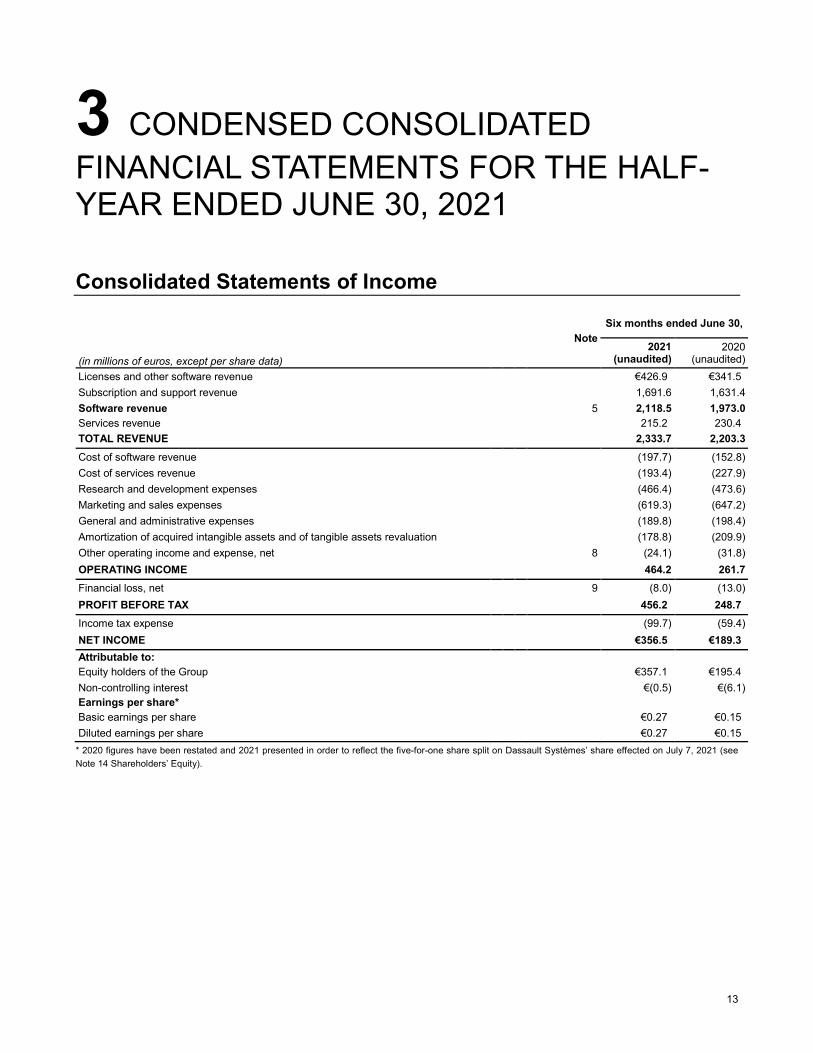
3 CONDENSED CONSOLIDATED FINANCIAL STATEMENTS FOR THE HALF-YEAR ENDED JUNE 30, 2021
Consolidated Statements of Income
(in millions of euros, except per share data)
Note Six months ended June 30,
2021
(unaudited) 2020
(unaudited) Licenses and other software revenue €426.9 €341.5 Subscription and support revenue 1,691.6 1,631.4 Software revenue 5 2,118.5 1,973.0 Services revenue 215.2 230.4 TOTAL REVENUE 2,333.7 2,203.3 Cost of software revenue (197.7) (152.8) Cost of services revenue (193.4) (227.9) Research and development expenses (466.4) (473.6) Marketing and sales expenses (619.3) (647.2) General and administrative expenses (189.8) (198.4) Amortization of acquired intangible assets and of tangible assets revaluation (178.8) (209.9) Other operating income and expense, net 8 (24.1) (31.8) OPERATING INCOME 464.2 261.7 Financial loss, net 9 (8.0) (13.0) PROFIT BEFORE TAX 456.2 248.7 Income tax expense (99.7) (59.4) NET INCOME €356.5 €189.3 Attributable to: Equity holders of the Group €357.1 €195.4 Non-controlling interest €(0.5) €(6.1) Earnings per share* Basic earnings per share €0.27 €0.15 Diluted earnings per share €0.27 €0.15
* 2020 figures have been restated and 2021 presented in order to reflect the five-for-one share split on Dassault Systèmes’ share effected on July 7, 2021 (see Note 14 Shareholders’ Equity).
14
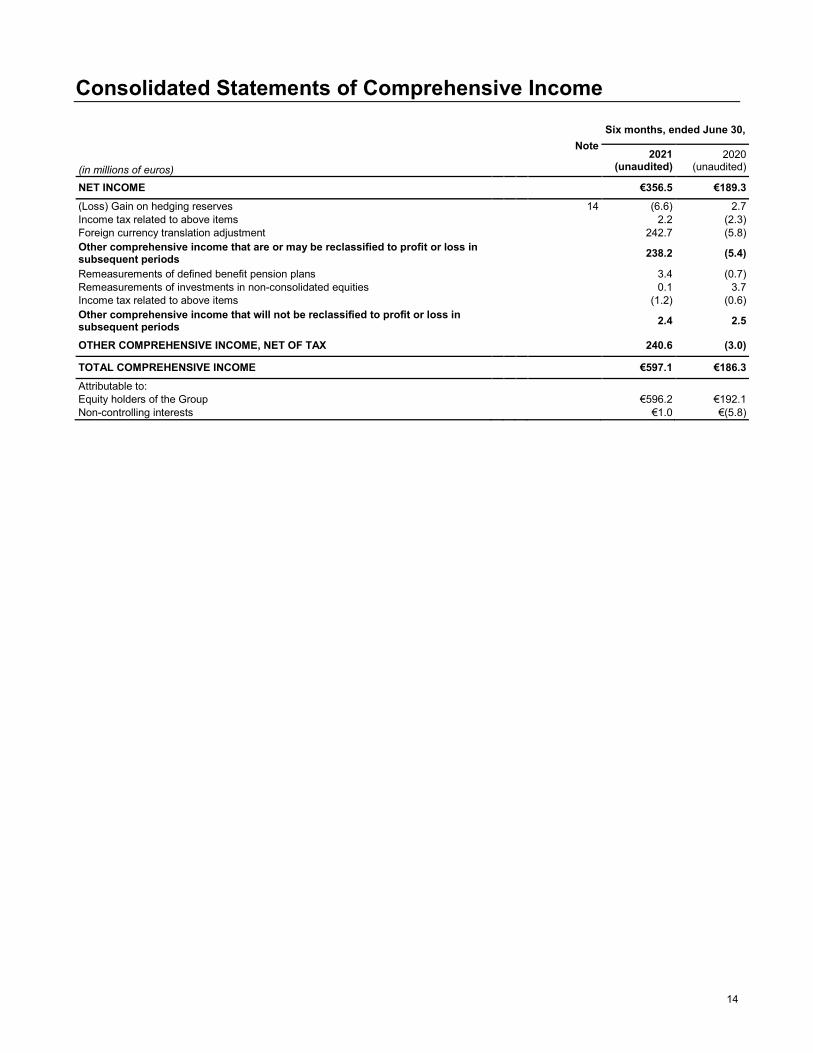
Consolidated Statements of Comprehensive Income
(in millions of euros)
Note
Six months, ended June 30,
2021
(unaudited) 2020
(unaudited)
NET INCOME €356.5 €189.3 (Loss) Gain on hedging reserves 14 (6.6) 2.7 Income tax related to above items 2.2 (2.3) Foreign currency translation adjustment 242.7 (5.8) Other comprehensive income that are or may be reclassified to profit or loss in subsequent periods 238.2 (5.4)
Remeasurements of defined benefit pension plans 3.4 (0.7) Remeasurements of investments in non-consolidated equities 0.1 3.7 Income tax related to above items (1.2) (0.6) Other comprehensive income that will not be reclassified to profit or loss in subsequent periods 2.4 2.5
OTHER COMPREHENSIVE INCOME, NET OF TAX 240.6 (3.0)
TOTAL COMPREHENSIVE INCOME €597.1 €186.3 Attributable to: Equity holders of the Group €596.2 €192.1 Non-controlling interests €1.0 €(5.8)

15
Consolidated Balance Sheets
(in millions of euros) Note
June 30, 2021
(unaudited)
December 31, 2020
(audited) Assets Cash and cash equivalents €2,919.0 €2,148.9 Trade accounts receivable, net 10 1,050.0 1,229.1 Contract assets 18.8 27.0 Income tax receivable 84.3 152.7 Other current assets 240.2 202.7 TOTAL CURRENT ASSETS 4,312.3 3,760.3 Property and equipment, net 833.6 861.1 Other non-current assets 264.8 252.4 Deferred tax assets 177.8 153.1 Intangible assets, net 11 3,477.7 3,546.8 Goodwill 11 4,512.3 4,390.5 TOTAL NON-CURRENT ASSETS 9,266.2 9,203.9
TOTAL ASSETS
€13,578.5 €12,964.2
(in millions of euros) Liabilities and equity Trade accounts payable €132.8 €171.7 Accrued compensation and other personnel costs 516.6 496.1 Contract liabilities 1,303.5 1,169.1 Borrowings, current 12 333.5 16.0 Income tax payable 2.4 17.2 Other current liabilities 196.4 216.7 TOTAL CURRENT LIABILITIES 2,485.2 2,086.9 Deferred tax liabilities 630.6 625.3 Borrowings, non-current 12 3,858.6 4,174.3 Other non-current liabilities 957.4 971.5 TOTAL NON-CURRENT LIABILITIES 5,446.7 5,771.2
Common stock 133.0 132.6 Share premium 1,034.4 954.0 Treasury stock (351.9) (442.1) Retained earnings and other reserves 5,172.7 5,043.7 Other comprehensive income, net of tax (387.8) (626.9)
Total parent shareholders’ equity 5,600.4 5,061.3 Non-controlling interests 46.2 44.8 TOTAL EQUITY 14 5,646.6 5,106.1
TOTAL LIABILITIES AND EQUITY
€13,578.5 €12,964.2
16
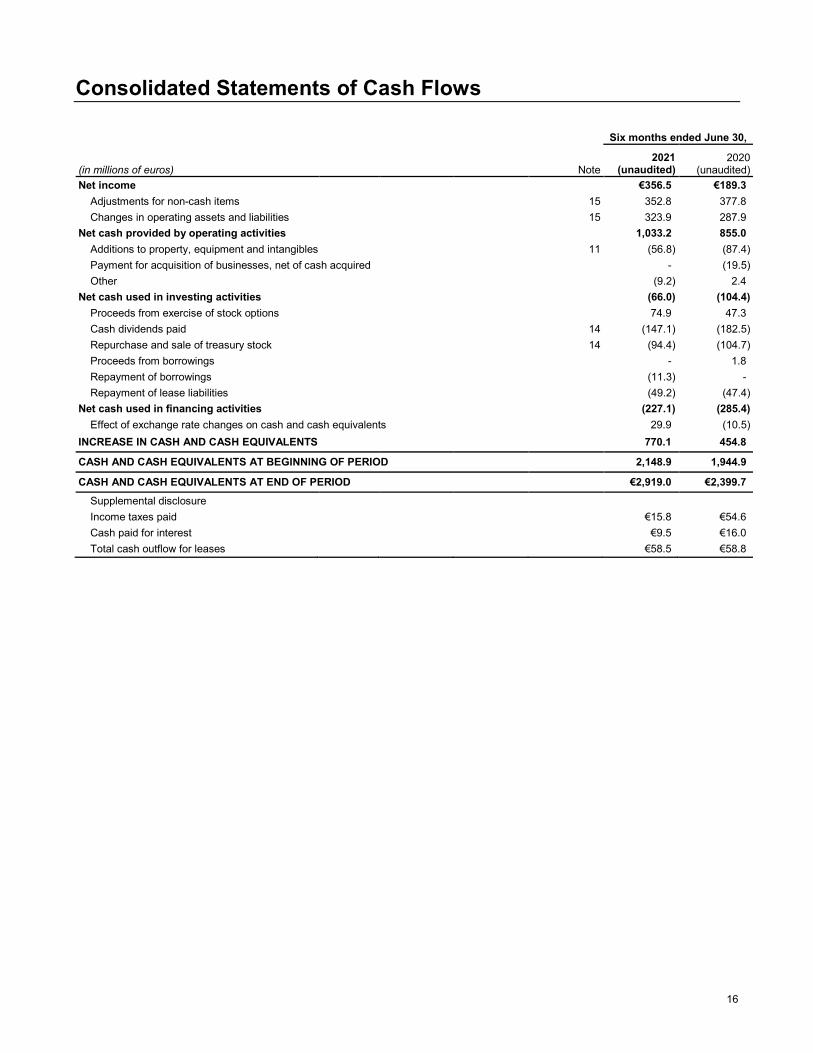
Consolidated Statements of Cash Flows
(in millions of euros)
Note
Six months ended June 30,
2021
(unaudited) 2020
(unaudited) Net income €356.5 €189.3
Adjustments for non-cash items 15 352.8 377.8 Changes in operating assets and liabilities 15 323.9 287.9
Net cash provided by operating activities 1,033.2 855.0 Additions to property, equipment and intangibles 11 (56.8) (87.4) Payment for acquisition of businesses, net of cash acquired - (19.5) Other (9.2) 2.4
Net cash used in investing activities (66.0) (104.4) Proceeds from exercise of stock options 74.9 47.3 Cash dividends paid 14 (147.1) (182.5) Repurchase and sale of treasury stock 14 (94.4) (104.7) Proceeds from borrowings - 1.8 Repayment of borrowings (11.3) - Repayment of lease liabilities (49.2) (47.4)
Net cash used in financing activities (227.1) (285.4) Effect of exchange rate changes on cash and cash equivalents 29.9 (10.5)
INCREASE IN CASH AND CASH EQUIVALENTS 770.1 454.8 CASH AND CASH EQUIVALENTS AT BEGINNING OF PERIOD 2,148.9 1,944.9 CASH AND CASH EQUIVALENTS AT END OF PERIOD €2,919.0 €2,399.7
Supplemental disclosure Income taxes paid €15.8 €54.6 Cash paid for interest €9.5 €16.0 Total cash outflow for leases €58.5 €58.8

17
Consolidated Statements of Shareholders’ Equity
(in millions of euros) Note Common
stock Share
premium Treasury
stock
Retained earnings
and other reserves
Other comprehensive income, net of
tax
Total parent shareholders’
equity
Non-controlling
interest Total Equity
DECEMBER 31, 2019 €132.0 €863.3 €(450.2) €4,653.2 €10.4 €5,208.7 €53.9 €5,262.6 Net income - - - 195.4 - 195.4 (6.1) 189.3 Other comprehensive income, net of tax - - - - (3.3) (3.3) 0.3 (3.0)
TOTAL COMPREHENSIVE INCOME - - - 195.4 (3.3) 192.1 (5.8) 186.3 Dividends - - - (182.5) - (182.5) - (182.5) Exercise of stock options 0.3 53.0 - - - 53.3 - 53.3 Treasury stock transactions - - 58.2 (162.8) - (104.7) - (104.7) Share-based compensation - - - 85.7 - 85.7 - 85.7 Transactions with non-controlling interests - - - 50.5 - 50.5 - 50.5
Other changes - - - 12.5 - 12.5 - 12.5
JUNE 30, 2020 (UNAUDITED) €132.3 €916.3 €(392.1) €4,652.0 €7.2 €5,315.7 €48.2 €5,363.9
DECEMBER 31, 2020 €132.6 €954.0 €(442.1) €5,043.7 €(626.9) €5,061.3 €44.8 €5,106.1 Net income - - - 357.1 - 357.1 (0.5) 356.5 Other comprehensive income, net of tax - - - - 239.1 239.1 1.5 240.6
TOTAL COMPREHENSIVE INCOME - - - 357.1 239.1 596.2 1.0 597.1 Dividends 14 - - - (147.1) - (147.1) - (147.1) Exercise of stock options 0.4 80.4 - - - 80.8 - 80.8 Treasury stock transactions - - 90.2 (184.7) - (94.4) - (94.4) Share-based compensation 7 - - - 71.7 - 71.7 0.5 72.2 Transactions with non-controlling interests - - - - - - - -
Other changes - - - 31.9 - 31.9 - 31.9
JUNE 30, 2021 (UNAUDITED) €133.0 €1,034.4 €(351.9) €5,172.7 €(387.8) €5,600.4 €46.2 €5,646.6
Analysis of changes in shareholders’ equity related to components of the other comprehensive income
(in millions of euros)
Investments in non-consolidated
equities Hedging reserves
Foreign currency
translation adjustment
Actuarial gains and losses
Total attributable to
parent shareholders
Non-controlling
interest
Other comprehensive income, net of
tax DECEMBER 31, 2019 €3.4 €4.1 €82.6 €(79.6) €10.4 €1.1 €11.6 Variations 2.9 0.4 (6.1) (0.5) (3.3) 0.3 (3.0) JUNE 30, 2020 (UNAUDITED) €6.3 €4.4 €76.5 €(80.1) €7.2 €1.4 €8.6 DECEMBER 31, 2020 €- €26.4 €(577.6) €(75.6) €(626.9) €(2.8) €(629.6) Variations 0.1 (4.4) 241.2 2.3 239.1 1.5 240.6 JUNE 30, 2021 (UNAUDITED) €0.1 €22.0 €(336.5) €(73.4) €(387.8) €(1.3) €(389.0)
18
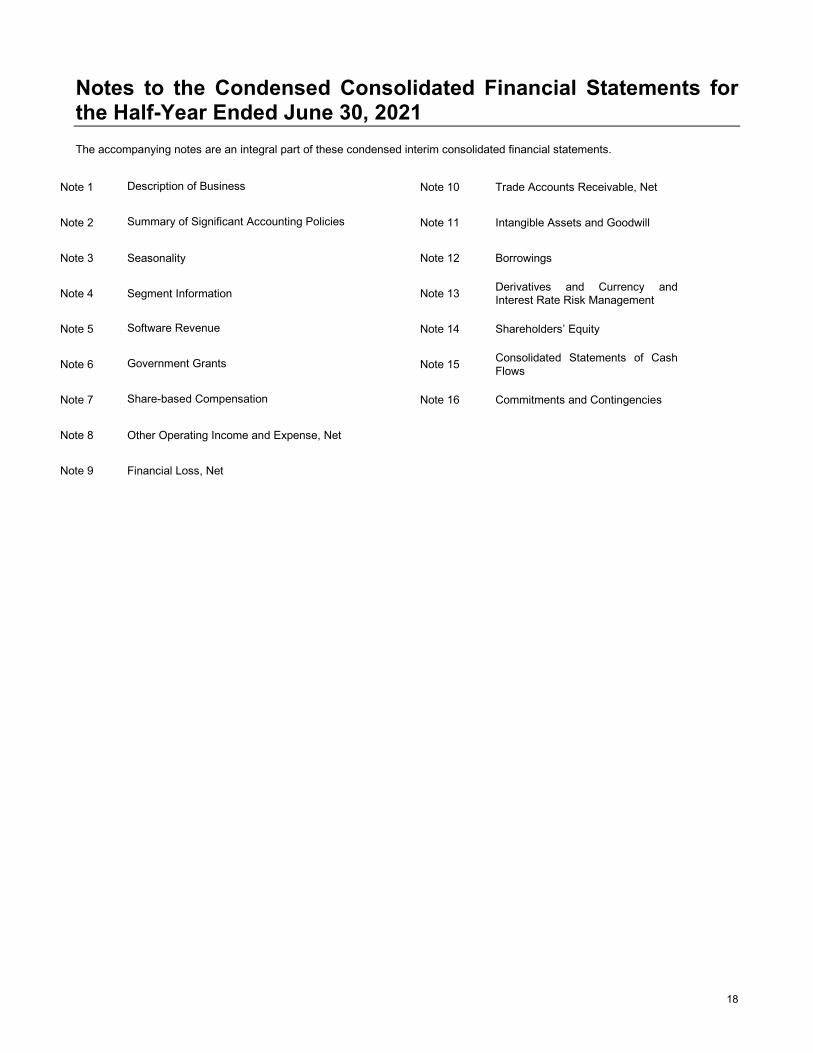
Notes to the Condensed Consolidated Financial Statements for the Half-Year Ended June 30, 2021 The accompanying notes are an integral part of these condensed interim consolidated financial statements.
Note 1 Description of Business Note 10 Trade Accounts Receivable, Net
Note 2 Summary of Significant Accounting Policies Note 11 Intangible Assets and Goodwill
Note 3 Seasonality Note 12 Borrowings
Note 4 Segment Information Note 13 Derivatives and Currency and Interest Rate Risk Management
Note 5 Software Revenue Note 14 Shareholders’ Equity
Note 6 Government Grants Note 15 Consolidated Statements of Cash Flows
Note 7 Share-based Compensation Note 16 Commitments and Contingencies
Note 8 Other Operating Income and Expense, Net
Note 9 Financial Loss, Net
19
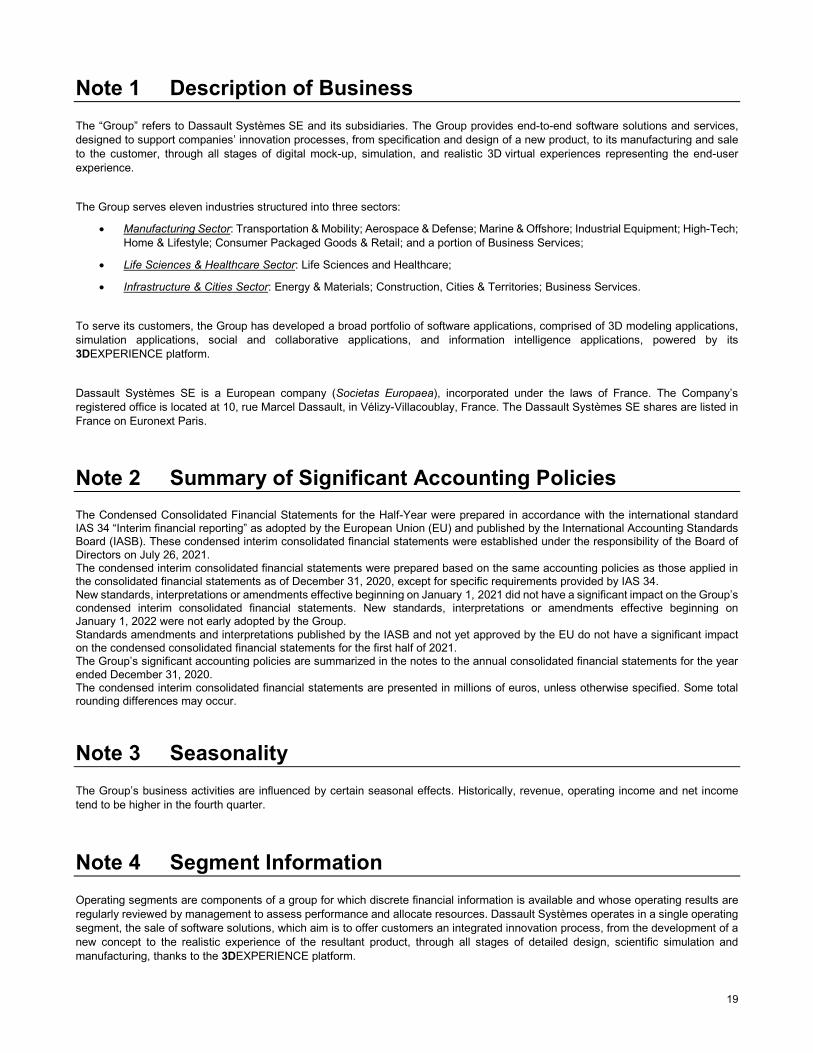
Note 1 Description of Business The “Group” refers to Dassault Systèmes SE and its subsidiaries. The Group provides end-to-end software solutions and services, designed to support companies’ innovation processes, from specification and design of a new product, to its manufacturing and sale to the customer, through all stages of digital mock-up, simulation, and realistic 3D virtual experiences representing the end-user experience.
The Group serves eleven industries structured into three sectors:
• Manufacturing Sector: Transportation & Mobility; Aerospace & Defense; Marine & Offshore; Industrial Equipment; High-Tech; Home & Lifestyle; Consumer Packaged Goods & Retail; and a portion of Business Services;
• Life Sciences & Healthcare Sector: Life Sciences and Healthcare;
• Infrastructure & Cities Sector: Energy & Materials; Construction, Cities & Territories; Business Services.
To serve its customers, the Group has developed a broad portfolio of software applications, comprised of 3D modeling applications, simulation applications, social and collaborative applications, and information intelligence applications, powered by its 3DEXPERIENCE platform.
Dassault Systèmes SE is a European company (Societas Europaea), incorporated under the laws of France. The Company’s registered office is located at 10, rue Marcel Dassault, in Vélizy-Villacoublay, France. The Dassault Systèmes SE shares are listed in France on Euronext Paris.
Note 2 Summary of Significant Accounting Policies The Condensed Consolidated Financial Statements for the Half-Year were prepared in accordance with the international standard IAS 34 “Interim financial reporting” as adopted by the European Union (EU) and published by the International Accounting Standards Board (IASB). These condensed interim consolidated financial statements were established under the responsibility of the Board of Directors on July 26, 2021. The condensed interim consolidated financial statements were prepared based on the same accounting policies as those applied in the consolidated financial statements as of December 31, 2020, except for specific requirements provided by IAS 34. New standards, interpretations or amendments effective beginning on January 1, 2021 did not have a significant impact on the Group’s condensed interim consolidated financial statements. New standards, interpretations or amendments effective beginning on January 1, 2022 were not early adopted by the Group. Standards amendments and interpretations published by the IASB and not yet approved by the EU do not have a significant impact on the condensed consolidated financial statements for the first half of 2021. The Group’s significant accounting policies are summarized in the notes to the annual consolidated financial statements for the year ended December 31, 2020. The condensed interim consolidated financial statements are presented in millions of euros, unless otherwise specified. Some total rounding differences may occur.
Note 3 Seasonality The Group’s business activities are influenced by certain seasonal effects. Historically, revenue, operating income and net income tend to be higher in the fourth quarter.
Note 4 Segment Information Operating segments are components of a group for which discrete financial information is available and whose operating results are regularly reviewed by management to assess performance and allocate resources. Dassault Systèmes operates in a single operating segment, the sale of software solutions, which aim is to offer customers an integrated innovation process, from the development of a new concept to the realistic experience of the resultant product, through all stages of detailed design, scientific simulation and manufacturing, thanks to the 3DEXPERIENCE platform.

20
The assessment of the operating segment’s performance is based on the Group’s supplemental non-IFRS financial information (see paragraph 2.3.9 “Supplemental non-IFRS Financial Information” of this Half Year Report). The accounting policies used differ from those described in Note 2 Summary of Significant Accounting Policies as follows:
o the measures of operating segment revenue and income include the whole revenue that would have been recognized by acquired companies had they remained stand-alone entities but which is partially excluded from Group revenue to reflect the fair value of obligations assumed;
o the measure of operating segment income excludes:
- share-based compensation expense and associated payroll taxes (see Note 7 Share-based Compensation),
- amortization of acquired intangible assets and of tangible assets revaluation,
- and other operating income and expense, net (see Note 8 Other Operating Income and Expense, Net);
o the measure of operating segment income takes into account the impact of the lease incentives, including rent-free periods, which are not recognized in the right-of-use asset under a business combination.
Six months ended June 30,
(in millions of euros) 2021 2020
TOTAL REVENUE FOR OPERATING SEGMENT €2,335.1 €2,215.0
Adjustment for unearned revenue of acquired companies (1.4) (11.6) REPORTED TOTAL REVENUE €2,333.7 €2,203.3
Six months ended June 30,
(in millions of euros) 2021 2020
INCOME FOR OPERATING SEGMENT €771.2 €620.4
Adjustment for unearned revenue of acquired companies (1.4) (11.6) Share-based compensation expense and related payroll taxes (101.4) (103.8) Amortization of acquired intangibles assets and of tangible assets revaluation (178.8) (209.9) Lease incentives of acquired companies (1.4) (1.5) Other operating income and expense, net (24.1) (31.8) REPORTED OPERATING INCOME €464.2 €261.7
Note 5 Software Revenue Software revenue is comprised of the following:
Six months ended June 30,
(in millions of euros) 2021 2020 Licenses and other software revenue €426.9 €341.5 Subscription and support revenue* 1,691.6 1,631.4 SOFTWARE REVENUE €2,118.5 €1,973.0
∗ In 2021, corresponds to €209.9 million at a point in time and €1, 481.6 million over time, to be compared to €217.0 million and €1,414.4 million respectively in 2020.
21
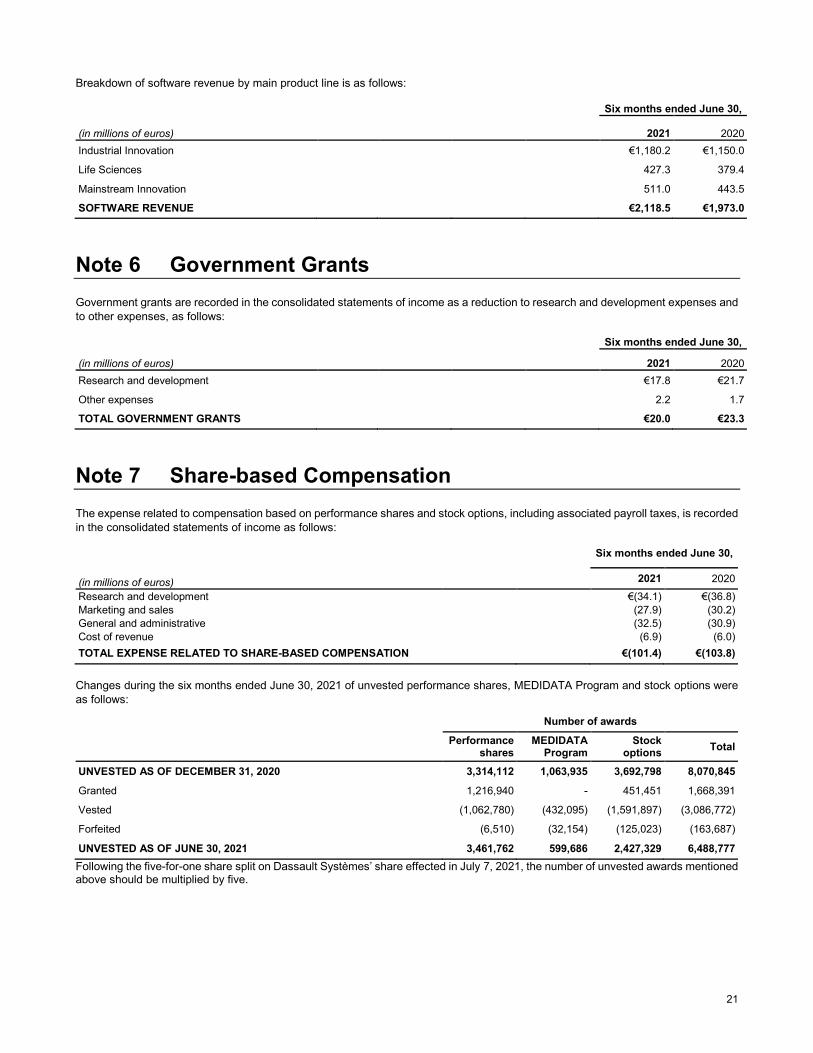
Breakdown of software revenue by main product line is as follows:
(in millions of euros)
Six months ended June 30, 2021 2020
Industrial Innovation €1,180.2 €1,150.0 Life Sciences 427.3 379.4 Mainstream Innovation 511.0 443.5 SOFTWARE REVENUE €2,118.5 €1,973.0
Note 6 Government Grants Government grants are recorded in the consolidated statements of income as a reduction to research and development expenses and to other expenses, as follows:
Six months ended June 30,
(in millions of euros) 2021 2020 Research and development €17.8 €21.7 Other expenses 2.2 1.7 TOTAL GOVERNMENT GRANTS €20.0 €23.3
Note 7 Share-based Compensation The expense related to compensation based on performance shares and stock options, including associated payroll taxes, is recorded in the consolidated statements of income as follows:
(in millions of euros)
Six months ended June 30,
2021 2020 Research and development €(34.1) €(36.8) Marketing and sales (27.9) (30.2) General and administrative (32.5) (30.9) Cost of revenue (6.9) (6.0) TOTAL EXPENSE RELATED TO SHARE-BASED COMPENSATION €(101.4) €(103.8) Changes during the six months ended June 30, 2021 of unvested performance shares, MEDIDATA Program and stock options were as follows:
Number of awards
Performance shares
MEDIDATA Program
Stock options Total
UNVESTED AS OF DECEMBER 31, 2020 3,314,112 1,063,935 3,692,798 8,070,845 Granted 1,216,940 - 451,451 1,668,391 Vested (1,062,780) (432,095) (1,591,897) (3,086,772) Forfeited (6,510) (32,154) (125,023) (163,687)
UNVESTED AS OF JUNE 30, 2021 3,461,762 599,686 2,427,329 6,488,777 Following the five-for-one share split on Dassault Systèmes’ share effected in July 7, 2021, the number of unvested awards mentioned above should be multiplied by five.
22
Performance shares
New plans granted in 2021 Pursuant to an authorization granted by the General Meeting of Shareholders held on May 26, 2021, the Board of Directors decided on June 29, 2021 to grant 741,569 performance shares (Plan 2021-A) (3,707,845 after the five-for-one share split on Dassault Systèmes’ share) to some employees and executives of the Group, and 300,000 performance shares (Plan 2021-B) (1,500,000 after the five-for-one share split on Dassault Systèmes’ share) to Mr. Bernard Charlès, Vice Chairman of the Board of Directors and Chief Executive Officer as part of a plan of progressively associating him with the Company’s capital implemented since several years.
Such shares shall be acquired subject to the end of a period of two years (tranche 1) and four years (tranche 2). They shall vest if a performance criteria is achieved, and the beneficiary is still an employee, an executive or a corporate officer of the Group at the end of a service period ending on December 29, 2022 (tranche 1) and on June 29, 2024 (tranche 2).
The performance condition will be measured based on the growth of the non-IFRS diluted earnings per share (“EPS”) of the Group for the year 2022 (tranche 1) and the year 2024 (tranche 2), neutralized from currency effects, compared to that of the year 2020 (non-vesting condition).
The Board of Directors also decided on June 29, 2021 to grant 175,371 performance shares (Plan 2021-M1) (876,855 after the five-for-one share split on Dassault Systèmes’ share) to some employees and executives of the Group.
Such shares shall be acquired at the end of a period of one year (tranche 1), two years (tranche 2), three years (tranche 3) and four years (tranche 4), if the beneficiary is still an employee or an executive of the Group at the end of these periods and that certain performance conditions are achieved. These performance conditions will be measured based on the average performance of the following two conditions, neutralized from currency effects:
- The growth of the non-IFRS diluted earnings per share (“EPS”) of the Group for the years 2021 (tranche 1), 2022 (tranche 2), 2023 (tranche 3) and 2024 (tranche 4), compared to that of the year 2020 (non-market vesting condition);
- The growth of the non-IFRS revenue and on the non-IFRS operating margin of the MEDIDATA brand (double criteria) for the years 2021 (tranche 1), 2022 (tranche 2), 2023 (tranche 3) and 2024 (tranche 4), compared to that of the year 2020 (non-market vesting condition).
Stock options
The main features of the Group stock option plans are as follows: options vest over various periods ranging from one to four years, subject to continued employment, options expire eight to ten years from grant date, or after termination of employment or term of office, whichever is earlier (except for plan 2020-01 and plan 2021-01 detailed below), options have generally been granted at an exercise price equal to or greater than the grant date market value (or the market value the day before the grant) of Dassault Systèmes SE share. New plan granted in 2021 Pursuant to an authorization granted by the General Meeting of Shareholders held on May 26, 2020, the Board of Directors decided on June 29, 2021 to grant 451,451 options to subscribe to Dassault Systèmes SE shares (2,257,255 after the five-for-one share split on Dassault Systèmes’ share) to certain employees and executives of the Group, at an exercise price of €206.60 (Plan 2021-01), equal to the closing value of the Dassault Systèmes SE share the day before the grant.
Such options are divided in four tranches. They shall vest if the beneficiary is an employee or an executive of the Group at the end of a service period of one year (tranche 1), one year and a half (tranche 2), two years and a half (tranche 3), and three years and a half (tranche 4), and subject to the achievement of certain performance conditions. The performance condition, for most of the beneficiaries, will be measured based on the growth of non-IFRS diluted EPS for the years 2021 (tranche 1), 2022 (tranche 2), 2023 (tranche 3) and 2024 (tranche 4) neutralized from currency effects compared to that of the year 2020 (non-market vesting condition for the tranche 1 and non-vesting condition for the tranches 2, 3 and 4).
The options expire ten years from grant date or in case of termination of employment before the end of the service period.

23
Note 8 Other Operating Income and Expense, Net Other operating income and expense, net are comprised of the following:
(in millions of euros)
Six months ended June 30,
2021 2020
Costs incurred in connection with relocation activities(1) €(12.7) €(6.8) Restructuring costs and other(2) (4.2) (3.2) Acquisition costs(3) (3.8) (0.3) Costs incurred in connection with voluntary early retirement and end of career multi-year plan(4) (3.4) (21.6)
OTHER OPERATING INCOME AND EXPENSE, NET €(24.1) €(31.8) (1) In 2021 and 2020, primarily composed of right-of-use impairments for vacant leasehold properties related to the reorganization of Medidata Solutions, Inc.
premises. (2) In 2021 and 2020, primarily related to redundancies costs regarding restructuring plans at Medidata Solutions, Inc. (3) In 2021, primarily related to the direct costs incurred in connection with the NuoDB, Inc. acquisition. (4) The Group implemented in France a job and career paths agreement for a period of 3 years. This agreement comprises a voluntary early retirement and end
of career management multi-year plan, effective since February 2020, which is accounted for as a post-employment benefit. The estimated costs are especially based on an assumption of expected proportion of employees to enter the plan and of the estimated residual service period for such employees.
Note 9 Financial Loss, Net Financial loss, net for the six months ended June 30, 2021 and 2020 are as follows:
(in millions of euros)
Six months ended June 30,
2021 2020
Interest income(1) €5.3 €8.6 Interest expense(2) (14.5) (19.6) INTEREST INCOME AND EXPENSE, NET €(9.2) €(11.0)
Foreign exchange gains (losses), net 0.7 (2.1) Other, net 0.6 0.2 OTHER FINANCIAL INCOME AND EXPENSE, NET €1.2 €(2.0)
FINANCIAL LOSS, NET €(8.0) €(13.0) (1) Interest income is primarily composed of interests on cash, cash equivalents and short-term investments. (2) Mainly includes:
(i) interest expenses of €4.1 million in 2021 related to the bonds (€4.1 million in 2020) and €2.7 million in 2021 related to the borrowings from banking institutions (€6.9 million in 2020).
(ii) interest expenses related to lease liabilities for €7.1 million in 2021 and €8.3 million in 2020.
24
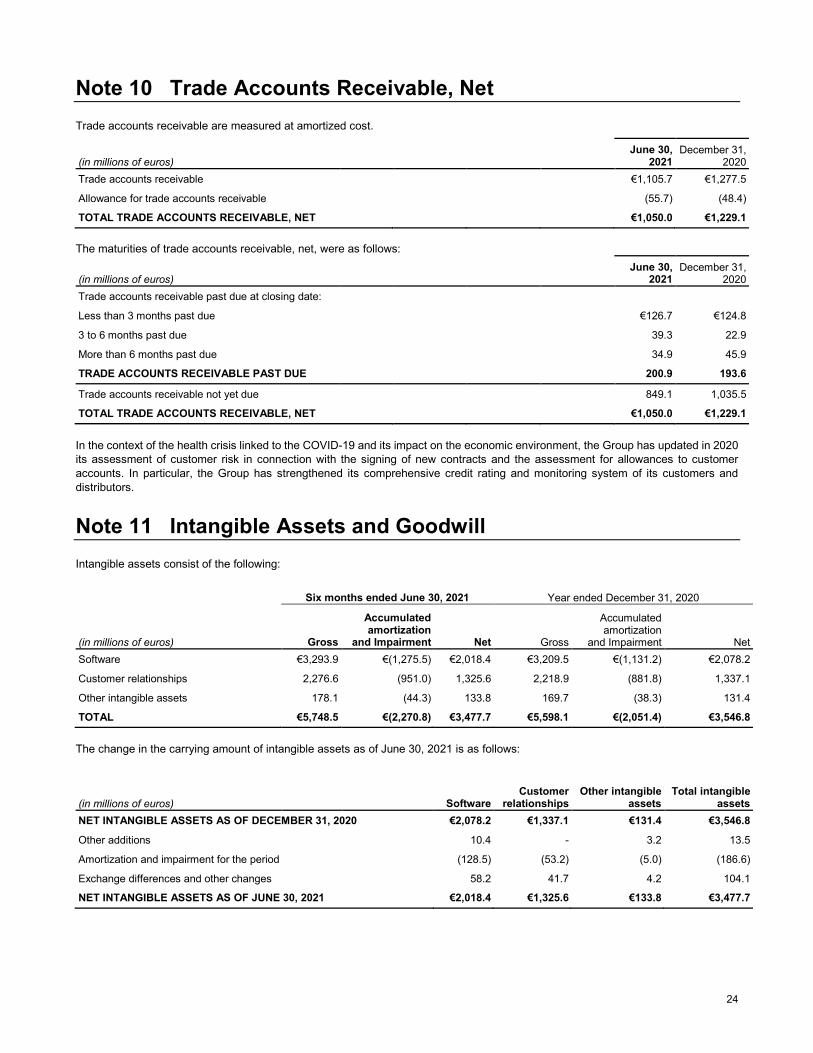
Note 10 Trade Accounts Receivable, Net Trade accounts receivable are measured at amortized cost.
(in millions of euros) June 30,
2021 December 31,
2020 Trade accounts receivable €1,105.7 €1,277.5 Allowance for trade accounts receivable (55.7) (48.4) TOTAL TRADE ACCOUNTS RECEIVABLE, NET €1,050.0 €1,229.1 The maturities of trade accounts receivable, net, were as follows:
(in millions of euros) June 30,
2021 December 31,
2020 Trade accounts receivable past due at closing date: Less than 3 months past due €126.7 €124.8 3 to 6 months past due 39.3 22.9 More than 6 months past due 34.9 45.9 TRADE ACCOUNTS RECEIVABLE PAST DUE 200.9 193.6
Trade accounts receivable not yet due 849.1 1,035.5 TOTAL TRADE ACCOUNTS RECEIVABLE, NET €1,050.0 €1,229.1
In the context of the health crisis linked to the COVID-19 and its impact on the economic environment, the Group has updated in 2020 its assessment of customer risk in connection with the signing of new contracts and the assessment for allowances to customer accounts. In particular, the Group has strengthened its comprehensive credit rating and monitoring system of its customers and distributors.
Note 11 Intangible Assets and Goodwill Intangible assets consist of the following:
(in millions of euros)
Six months ended June 30, 2021 Year ended December 31, 2020
Gross
Accumulated amortization
and Impairment Net Gross
Accumulated amortization
and Impairment Net Software €3,293.9 €(1,275.5) €2,018.4 €3,209.5 €(1,131.2) €2,078.2 Customer relationships 2,276.6 (951.0) 1,325.6 2,218.9 (881.8) 1,337.1 Other intangible assets 178.1 (44.3) 133.8 169.7 (38.3) 131.4 TOTAL €5,748.5 €(2,270.8) €3,477.7 €5,598.1 €(2,051.4) €3,546.8 The change in the carrying amount of intangible assets as of June 30, 2021 is as follows:
(in millions of euros) Software Customer
relationships Other intangible
assets Total intangible
assets NET INTANGIBLE ASSETS AS OF DECEMBER 31, 2020 €2,078.2 €1,337.1 €131.4 €3,546.8 Other additions 10.4 - 3.2 13.5 Amortization and impairment for the period (128.5) (53.2) (5.0) (186.6) Exchange differences and other changes 58.2 41.7 4.2 104.1 NET INTANGIBLE ASSETS AS OF JUNE 30, 2021 €2,018.4 €1,325.6 €133.8 €3,477.7
25
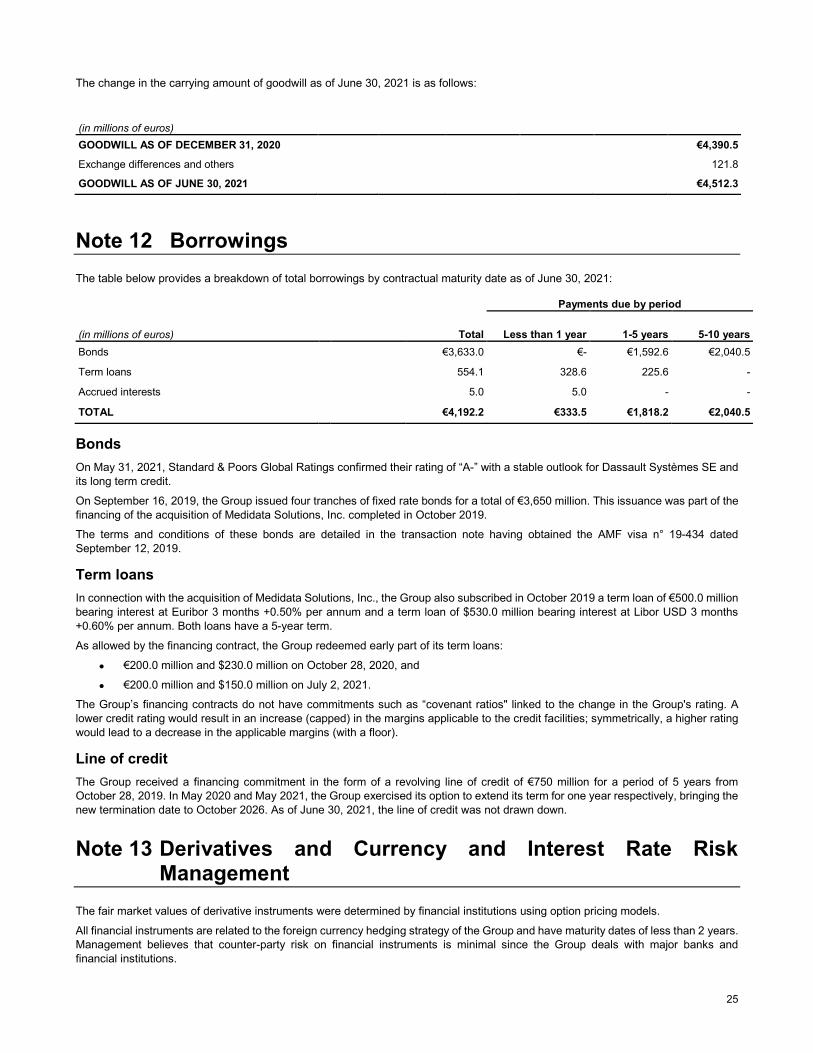
The change in the carrying amount of goodwill as of June 30, 2021 is as follows:
(in millions of euros)
GOODWILL AS OF DECEMBER 31, 2020 €4,390.5 Exchange differences and others 121.8 GOODWILL AS OF JUNE 30, 2021 €4,512.3
Note 12 Borrowings The table below provides a breakdown of total borrowings by contractual maturity date as of June 30, 2021:
Total
Payments due by period
(in millions of euros) Less than 1 year 1-5 years 5-10 years Bonds €3,633.0 €- €1,592.6 €2,040.5
Term loans 554.1 328.6 225.6 -
Accrued interests 5.0 5.0 - -
TOTAL €4,192.2 €333.5 €1,818.2 €2,040.5
Bonds On May 31, 2021, Standard & Poors Global Ratings confirmed their rating of “A-” with a stable outlook for Dassault Systèmes SE and its long term credit.
On September 16, 2019, the Group issued four tranches of fixed rate bonds for a total of €3,650 million. This issuance was part of the financing of the acquisition of Medidata Solutions, Inc. completed in October 2019.
The terms and conditions of these bonds are detailed in the transaction note having obtained the AMF visa n° 19-434 dated September 12, 2019.
Term loans In connection with the acquisition of Medidata Solutions, Inc., the Group also subscribed in October 2019 a term loan of €500.0 million bearing interest at Euribor 3 months +0.50% per annum and a term loan of $530.0 million bearing interest at Libor USD 3 months +0.60% per annum. Both loans have a 5-year term.
As allowed by the financing contract, the Group redeemed early part of its term loans:
• €200.0 million and $230.0 million on October 28, 2020, and
• €200.0 million and $150.0 million on July 2, 2021.
The Group’s financing contracts do not have commitments such as “covenant ratios" linked to the change in the Group's rating. A lower credit rating would result in an increase (capped) in the margins applicable to the credit facilities; symmetrically, a higher rating would lead to a decrease in the applicable margins (with a floor).
Line of credit The Group received a financing commitment in the form of a revolving line of credit of €750 million for a period of 5 years from October 28, 2019. In May 2020 and May 2021, the Group exercised its option to extend its term for one year respectively, bringing the new termination date to October 2026. As of June 30, 2021, the line of credit was not drawn down.
Note 13 Derivatives and Currency and Interest Rate Risk Management
The fair market values of derivative instruments were determined by financial institutions using option pricing models.
All financial instruments are related to the foreign currency hedging strategy of the Group and have maturity dates of less than 2 years. Management believes that counter-party risk on financial instruments is minimal since the Group deals with major banks and financial institutions.

26
A description of the Group market risks exposure is provided in paragraph 1.9.2 “Financial and Market Risks” of the 2020 Universal registration document.
Foreign currency risk The Group operates internationally and transacts in various foreign currencies, primarily U.S. dollar and Japanese yen.
The Group usually hedges exchange rate risk related to its revenues and expenses coming from usual and predictable activity arising in the normal course of operations. The Group may also cover occasional exchange rate risks arising from specific transactions, such as acquisitions paid for in foreign currencies. Hedging activities are generally carried out and managed by Dassault Systèmes SE for its own account and on behalf of its subsidiaries.
At June 30, 2021 and December 31, 2020, the fair value of instruments used to manage the currency exposure (excluding the net investment hedge) was as follows: Six months ended June 30,
2021 Year ended December 31,
2020
(in millions of euros) Nominal
amount Fair value Nominal amount Fair value
Forward exchange contract JPY/USD - sale⁽¹ ⁾ €86.4 €4.0 €73.0 €(0.1) Forward exchange contract JPY/EUR - sale⁽¹ ⁾ 97.5 2.9 63.8 4.7 Forward exchange contract EUR/INR - sale⁽¹ ⁾ 39.4 0.3 47.0 (1.5) Forward exchange contract USD/INR - sale⁽¹ ⁾ 40.6 0.5 31.8 0.8 Forward exchange contract GBP/EUR - sale⁽¹ ⁾ 36.9 (0.7) 22.5 0.7 Forward exchange contract EUR/USD - sale⁽¹ ⁾ - - 9.0 - Forward exchange contract CNY/EUR - sale⁽¹ ⁾ 35.2 (1.2) 3.1 - Other instruments⁽²⁾ 4.3 - 30.4 (0.2)
(1) Instruments entered into by the Group to hedge the foreign currency exchange risk of forecasted royalty flows.
(2) Mainly derivatives not designated as hedging instruments. Changes in the derivatives’ fair value are recorded in other financial income and expense, net in the consolidated income statement.
Interest rate risk The Group believes that changes in interest rates during the first half of 2021 did not materially affect its business and operating income and that it would be the same in the future. Therefore, the Group’s interest rate risk is primarily a risk related to a reduction in financial income.
Note 14 Shareholders’ Equity Shareholders’ equity activity As of June 30, 2021, Dassault Systèmes SE had 265,924,182 common shares issued with a nominal value of €0.50 per share, fully paid up.
Changes in shares outstanding are as follows (before the share split):
(in number of shares) SHARES ISSUED AS OF DECEMBER 31, 2020 265,136,237
Exercise of stock options 787,945 SHARES ISSUED AS OF JUNE 30, 2021 265,924,182 Treasury stock as of June 30, 2021 (3,118,303) SHARES OUTSTANDING AS OF JUNE 30, 2021 262,805,879
The General Meeting of Shareholders held on May 26, 2021 decided to split the par value of the Dassault Systèmes’ share by five. The Board of Directors held on the same day decided that the share split is effective on July 7, 2021. Thus, for all former shares of €0.50 par value held as of July 7, the shareholders receive five new shares of €0.10 par value each and the total number of shares comprising the capital is multiplied by five.
The primary objective of the Company’s capital management is to ensure that it maintains a strong credit rating and healthy capital ratios in order to support its capital market access and for the purpose of increasing the profitability of shareholders’ equity and
27
earnings per share. The Company manages its capital structure and adjusts it in light of changes in economic conditions. To maintain or adjust the capital structure, the Company may adjust the dividend payment to shareholders, return capital to shareholders or issue new shares.
Dividend rights The total dividend distributed for the year ended December 31, 2020 amounts to €147.1 million, in accordance with the third resolution of the General Meeting of Shareholders held on May 26, 2021.
Stock repurchase programs The General Meeting of Shareholders of May 26, 2021 authorized the Board of Directors to implement a share repurchase program limited to 5,000,000 Dassault Systèmes SE shares. Under this authorization, the Company may not buy shares above a maximum annual aggregate amount of €800 million.
The Group signed a liquidity agreement for an initial period until December 31, 2015, automatically renewable for subsequent 12-month terms. On June 30, 2021, 289,516 shares were acquired, at an average price of €183.07 and 277,180 shares were sold, at an average price of €185.77.
Furthermore, the Group signed with Société Générale a liquidity agreement on December 11, 2020 for a period covering from December 14, 2020 to February 4, 2021, another liquidity agreement on March 11, 2021 for a period covering from March 12, 2021 to April 28, 2021, and another liquidity agreement on June 10, 2021 for a period covering from June 11, 2021 to July 27, 2021.
Components of other comprehensive income
(in millions of euros)
Six months ended June 30,
2021 2020 HEDGING RESERVES: (Losses) arising during the year €(2.0) - Less: Gains (Losses) reclassified to the income statement 4.6 (2.7) €(6.6) €2.7
Note 15 Consolidated Statements of Cash Flows Adjustments for non-cash items consist of the following:
(in millions of euros) Note
Six months ended June 30,
2021 2020 Depreciation and impairment of property and equipment €99.5 €98.5 Amortization and impairment of intangible assets 11 186.6 216.2 Non-cash share-based compensation expense 73.3 87.3 Deferred taxes (16.4) (31.1) Other 9.8 6.9 Adjustments for non-cash items €352.8 €377.8 Changes in operating assets and liabilities consist of the following:
(in millions of euros)
Six months ended June 30,
2021 2020 Decrease in trade accounts receivable and contract assets €214.9 €352.3 (Decrease) in accounts payable (40.6) (70.1) Increase (Decrease) in accrued compensation 6.2 (52.2) Increase (Decrease) in income tax payable 60.7 (4.4) Increase in contract liabilities 110.2 58.1 Changes in other assets and liabilities (27.5) 4.2 Changes in operating assets and liabilities €323.9 €287.9
28
Note 16 Commitments and Contingencies Litigation and other proceedings The Group is involved in litigation and other proceedings, such as civil, commercial and tax proceedings, incidental to normal operations.
The Group is subject to ongoing tax audits and tax reassessments in jurisdictions in which it has or had operations. Certain of these reassessments, in particular those related to acquisition financing, are being challenged by the Group which is strongly confident in the technical merits of its positions and will continue to defend them with the relevant tax authorities. In this context, the Group has made payments to the French tax authorities for a total amount of €144.9 million from 2014 to 2020, but has disputed them with the relevant authorities. In June 2019, following the decision of the Court of Appeal during the second quarter of 2019, the Group lodged an Appeal before the High Court in relation to this dispute. The High Court has denied the Court of Appeal’s decision and referred the litigation to a new Chamber of the Court of Appeal. The Court of Appeal has adopted a new argumentation, based on the scope of article 145 of the General Tax Code, to reject the Group’s position. In this context, an appeal is being prepared as the Group disagrees with the Court of Appeal’s analysis.
It is not possible to determine with certainty the outcome of the dispute and notably the resulting expense for the Group, if any. The total amount paid to the tax authorities represents the current Group’s maximum exposure. However, in the opinion of management, after consultation with its lawyers, the resolution of such litigation and on going proceedings should not have a material effect on the consolidated financial statements of the Group.
Future lease commitments In December 2019, the Group signed a new lease contract for a fixed term of 10 years from the delivery of an additional building for its Vélizy-Villacoublay campus of approximately 28,000 square meters of office space, scheduled to be delivered during the second quarter of 2023. The minimum future lease payments over the lease term amount to approximately €81.1 million.
In accordance with IFRS 16, the right-of-use asset and the lease liability will be recognized upon the delivery of the new offices.
Bank guarantees The Group has a central cash management operated by a banking institution. In this context, the parent company of the bank offered a guarantee to the Group for an amount of $500 million, at the same time the Group offered a guarantee to the bank for the same amount.
29
4 STATUTORY AUDITORS’ REVIEW REPORT ON THE 2021 HALF-YEARLY FINANCIAL INFORMATION This is a free translation into English of the Statutory Auditors' review report issued in French and is provided solely for the convenience of English speaking readers. This report should be read in conjunction with, and construed in accordance with, French law and professional auditing standards applicable in France. To the Shareholders,
In compliance with the assignment entrusted to us by your General Meeting of Shareholders and in accordance with the requirements of Article L. 451-1-2 III of the French Monetary and Financial Code (Code monétaire et financier), we hereby report to you on:
- the review of the accompanying condensed consolidated financial statements for the half-year ended June 30, 2021;
- the verification of the information contained in the interim management report.
Due to the global crisis related to the Covid-19 pandemic, the condensed consolidated financial statements of this period have been prepared and reviewed under specific conditions. Indeed, this crisis and the exceptional measures taken in the context of the state of sanitary emergency have had numerous consequences for companies, particularly on their operations and their financing, and have led to greater uncertainties on their future prospects. Those measures, such as travel restrictions and remote working, have also had an impact on the companies' internal organization and the performance of our work.
These condensed consolidated financial statements are the responsibility of your Board of Directors. Our role is to express a conclusion on these financial statements based on our review.
1. Conclusion on the financial statements
We conducted our review in accordance with professional standards applicable in France.
A review of interim financial information consists of making inquiries, primarily of persons responsible for financial and accounting matters, and applying analytical and other review procedures. A review is substantially less in scope than an audit conducted in accordance with professional standards applicable in France and consequently does not enable us to obtain assurance that we would become aware of all significant matters that might be identified in an audit. Accordingly, we do not express an audit opinion.
Based on our review, nothing has come to our attention that causes us to believe that the accompanying condensed consolidated financial statements have not been prepared, in all material respects, in accordance with IAS 34, Interim Financial Reporting, as adopted by the European Union.
2. Specific verification
We have also verified the information given in the interim management report on the condensed consolidated financial statements subject to our review.
We have no matters to report as to its fair presentation and its consistency with the condensed consolidated financial statements.
Neuilly-sur-Seine and Paris-La Défense, July 27, 2021
The Statutory Auditors
PricewaterhouseCoopers Audit ERNST & YOUNG et Autres
Thierry Leroux Nour-Eddine Zanouda