Embed Size (px)
Citation preview

Q2 Half-Year Financial Report 31 March 2021Infineon Technologies AG
Infineon Technologies Half-Year Financial Report 31 March 2021
Content
Selected Consolidated Financial Data ....................................................... 1
Interim Group Management Report ........................................................... 2
Operating performance of the segments in first half of the
2021 fiscal year ........................................................................................ 2
The Infineon Share .................................................................................. 5
Review of Business Environment ............................................................ 6
Review of Results of Operations in the first half of the
2021 fiscal year ........................................................................................ 6
Review of Financial Condition .............................................................. 10
Review of Liquidity ................................................................................ 11
Employees ............................................................................................. 13
Outlook .................................................................................................. 13
Risks and Opportunities ........................................................................ 14
Consolidated Statement of Profit or Loss ................................................ 15
Consolidated Statement of Comprehensive Income ............................... 15
Consolidated Statement of Financial Position ........................................ 16
Consolidated Statement of Cash Flows ................................................... 17
Consolidated Statement of Changes in Equity ........................................ 18
Notes to the condensed Consolidated Interim Financial Statements .... 19
Responsibility Statement by the Management Board ............................. 31
Review Report............................................................................................ 32
Supplementary Information ..................................................................... 33
Infineon Technologies Half-Year Financial Report 31 March 2021
1
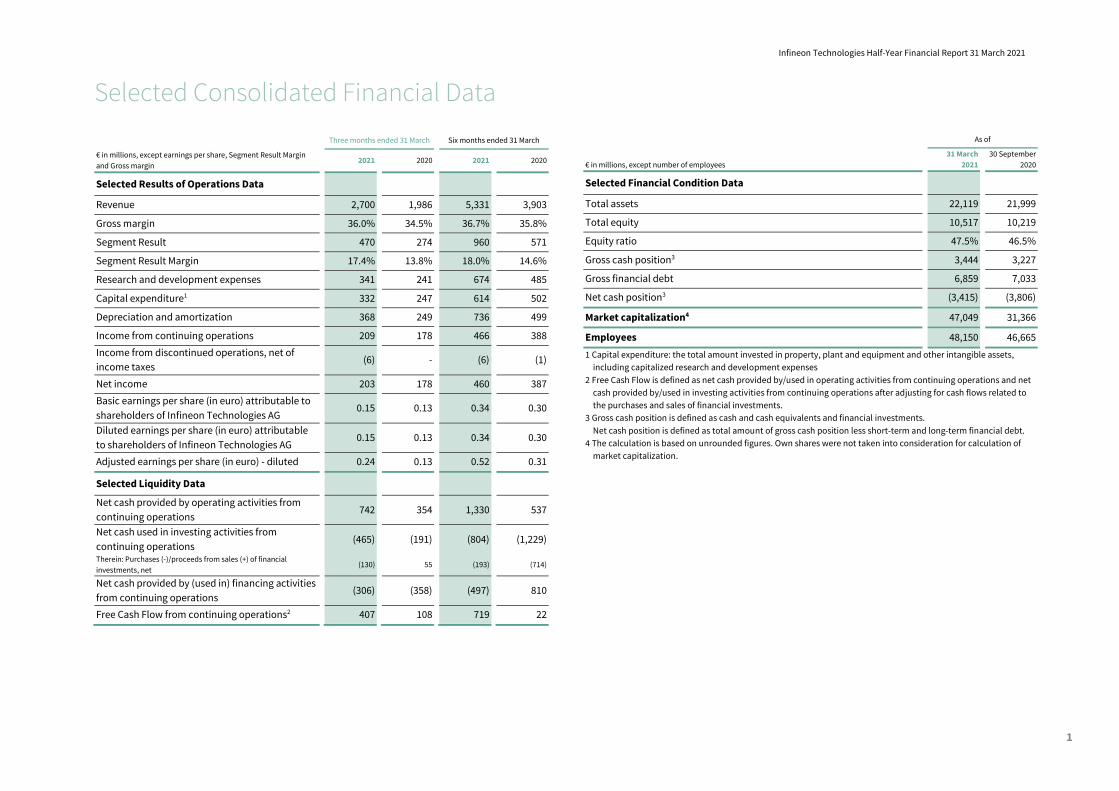
Selected Consolidated Financial Data
Three months ended 31 March Six months ended 31 March € in millions, except earnings per share, Segment Result Margin
and Gross margin 2021 2020 2021 2020
Selected Results of Operations Data
Revenue 2,700 1,986 5,331 3,903
Gross margin 36.0% 34.5% 36.7% 35.8%
Segment Result 470 274 960 571
Segment Result Margin 17.4% 13.8% 18.0% 14.6%
Research and development expenses 341 241 674 485
Capital expenditure1 332 247 614 502
Depreciation and amortization 368 249 736 499
Income from continuing operations 209 178 466 388 Income from discontinued operations, net of
income taxes (6) - (6) (1)
Net income 203 178 460 387 Basic earnings per share (in euro) attributable to
shareholders of Infineon Technologies AG 0.15 0.13 0.34 0.30
Diluted earnings per share (in euro) attributable
to shareholders of Infineon Technologies AG 0.15 0.13 0.34 0.30
Adjusted earnings per share (in euro) - diluted 0.24 0.13 0.52 0.31
Selected Liquidity Data
Net cash provided by operating activities from
continuing operations 742 354 1,330 537
Net cash used in investing activities from
continuing operations (465) (191) (804) (1,229)
Therein: Purchases (-)/proceeds from sales (+) of financial
investments, net (130) 55 (193) (714)
Net cash provided by (used in) financing activities
from continuing operations (306) (358) (497) 810
Free Cash Flow from continuing operations2 407 108 719 22
As of
€ in millions, except number of employees 31 March
2021 30 September
2020
Selected Financial Condition Data
Total assets 22,119 21,999
Total equity 10,517 10,219
Equity ratio 47.5% 46.5%
Gross cash position3 3,444 3,227
Gross financial debt 6,859 7,033
Net cash position3 (3,415) (3,806)
Market capitalization4 47,049 31,366
Employees 48,150 46,665 1 Capital expenditure: the total amount invested in property, plant and equipment and other intangible assets,
including capitalized research and development expenses 2 Free Cash Flow is defined as net cash provided by/used in operating activities from continuing operations and net
cash provided by/used in investing activities from continuing operations after adjusting for cash flows related to
the purchases and sales of financial investments. 3 Gross cash position is defined as cash and cash equivalents and financial investments.
Net cash position is defined as total amount of gross cash position less short-term and long-term financial debt. 4 The calculation is based on unrounded figures. Own shares were not taken into consideration for calculation of
market capitalization.

Infineon Technologies Half-Year Financial Report 31 March 2021
2
Interim Group Management Report
_______________________________________________
› Acquisition of Cypress and strong demand for semiconductors
lead to revenue and earnings increase compared to the first
half of the 2020 fiscal year
› Strong free cash flow of €719 million
› Outlook for the 2021 fiscal year:
› Revenue of around €11 billion plus or minus 3 percent
expected
› At mid-point of guided revenue range, Segment Result
Margin expected at around 18 percent
› Free cash flow likely to exceed €1.2 billion
_______________________________________________
“The semiconductor market is booming; electronics that help accelerate the energy
transition and make work and home life easier remain in high demand. The push for
digitalization continues unabated. Infineon is firmly on course to meet its targets for the
current fiscal year,” says Dr. Reinhard Ploss, CEO of Infineon. “Demand greatly exceeds
supply for the majority of applications. Infineon's manufacturing facilities are running at
full speed and we continue to invest in additional capacity. We see bottlenecks in those
segments where we depend on chips supplied by foundries, especially in the case of
automotive microcontrollers and IoT products. We are doing everything we can to
provide our customers with the best possible support in this situation.”
Operating performance of the segments in first half of the
2021 fiscal year
Cypress Semiconductor Corporation (“Cypress”) has been fully consolidated since
16 April 2020 (see note 3 to the consolidated financial statements for the 2020 fiscal
year). For this reason, comparability with prior period is limited. The business with the
XMC family of industrial microcontrollers was transferred from the Automotive segment
to the Connected Secure Systems segment with effect from 1 October 2020. The
previous year’s figures have been adjusted accordingly.
In the second quarter of the 2021 fiscal year, Group revenue rose by €69 million to
€2,700 million compared to €2,631 million in the preceding three-month period. The
3 percent growth in revenue was driven by brisk demand, particularly in the Automotive
and Power & Sensor Systems segments, whereas revenue generated in the Industrial
Power Control and Connected Secure Systems segments declined slightly.
Compared to the first half of the previous fiscal year, revenue increased by
€1,428 million to €5,331 million in the first half of the 2021 fiscal year (2020:
€3,903 million). In addition to the rising demand for semiconductors, the increase in
revenue was primarily due to the consolidation of Cypress. The largest share of revenue
growth was accordingly accounted for the Automotive segment (€703 million), the
Power & Sensor Systems segment (€356 million) and the Connected Secure Systems
segment (€335 million), who benefit from the integration of Cypress. The Industrial
Power Control segment rose revenue by €32 million.
Infineon Technologies Half-Year Financial Report 31 March 2021
3
The Segment Result for the six-month period increased from €571 million in the
previous-year period to €960 million in the first half of the 2021 fiscal year, while the
Segment Result Margin improved from 14.6 percent in the previous-year period to
18.0 percent.
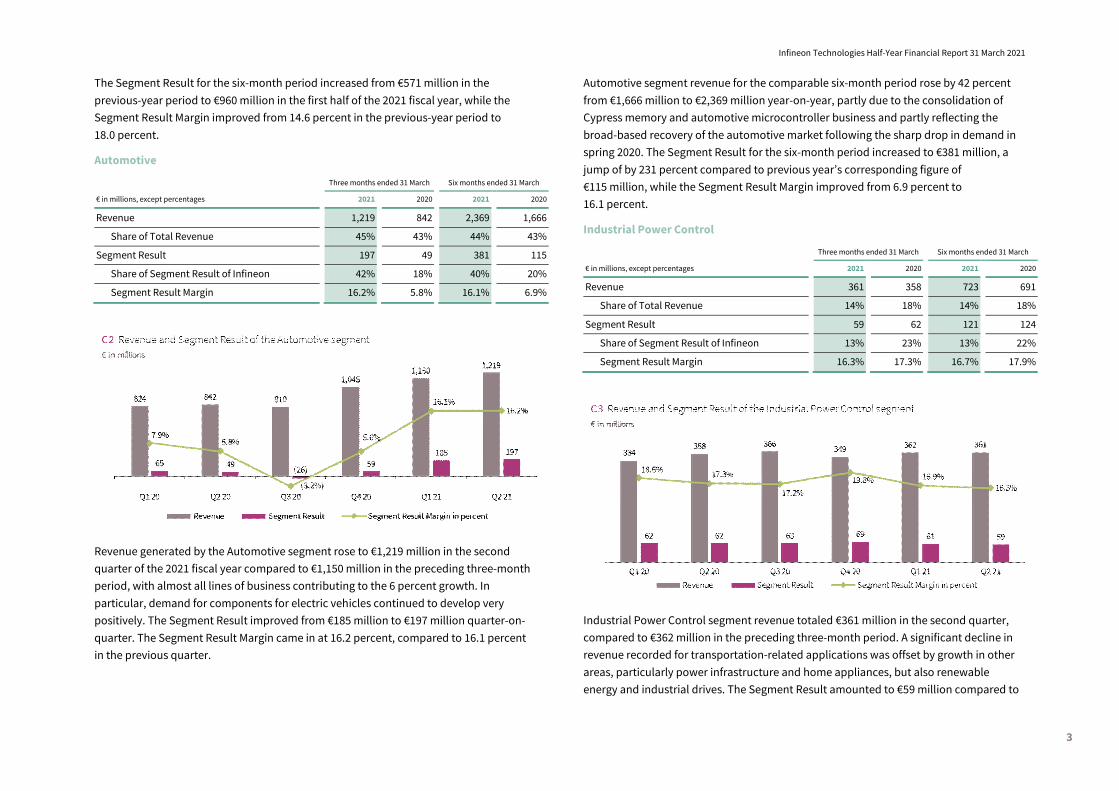
Automotive
Three months ended 31 March Six months ended 31 March € in millions, except percentages 2021 2020 2021 2020
Revenue 1,219 842 2,369 1,666
Share of Total Revenue 45% 43% 44% 43%
Segment Result 197 49 381 115
Share of Segment Result of Infineon 42% 18% 40% 20%
Segment Result Margin 16.2% 5.8% 16.1% 6.9%
Revenue generated by the Automotive segment rose to €1,219 million in the second
quarter of the 2021 fiscal year compared to €1,150 million in the preceding three-month
period, with almost all lines of business contributing to the 6 percent growth. In
particular, demand for components for electric vehicles continued to develop very
positively. The Segment Result improved from €185 million to €197 million quarter-on-
quarter. The Segment Result Margin came in at 16.2 percent, compared to 16.1 percent
in the previous quarter.
Automotive segment revenue for the comparable six-month period rose by 42 percent
from €1,666 million to €2,369 million year-on-year, partly due to the consolidation of
Cypress memory and automotive microcontroller business and partly reflecting the
broad-based recovery of the automotive market following the sharp drop in demand in
spring 2020. The Segment Result for the six-month period increased to €381 million, a
jump of by 231 percent compared to previous year’s corresponding figure of
€115 million, while the Segment Result Margin improved from 6.9 percent to
16.1 percent.
Industrial Power Control
Three months ended 31 March Six months ended 31 March € in millions, except percentages 2021 2020 2021 2020
Revenue 361 358 723 691
Share of Total Revenue 14% 18% 14% 18%
Segment Result 59 62 121 124
Share of Segment Result of Infineon 13% 23% 13% 22%
Segment Result Margin 16.3% 17.3% 16.7% 17.9%
Industrial Power Control segment revenue totaled €361 million in the second quarter,
compared to €362 million in the preceding three-month period. A significant decline in
revenue recorded for transportation-related applications was offset by growth in other
areas, particularly power infrastructure and home appliances, but also renewable
energy and industrial drives. The Segment Result amounted to €59 million compared to
Infineon Technologies Half-Year Financial Report 31 March 2021
4
€61 million in the first quarter, while the Segment Result Margin fell from 16.9 percent to
16.3 percent quarter-on-quarter.
Industrial Power Control segment revenue for the first six months of the fiscal year went
up from €691 million to €723 million year-on-year, up 5 percent on the back of greater
demand for industrial and renewable energy drives as well as home appliances. Power
infrastructure-related revenue remained stable, while demand for transportation-
related applications fell sharply once again. The Segment Result for the six-month
period fell from €124 million to €121 million, with the Segment Result Margin dropping
from 17.9 percent to 16.7 percent.
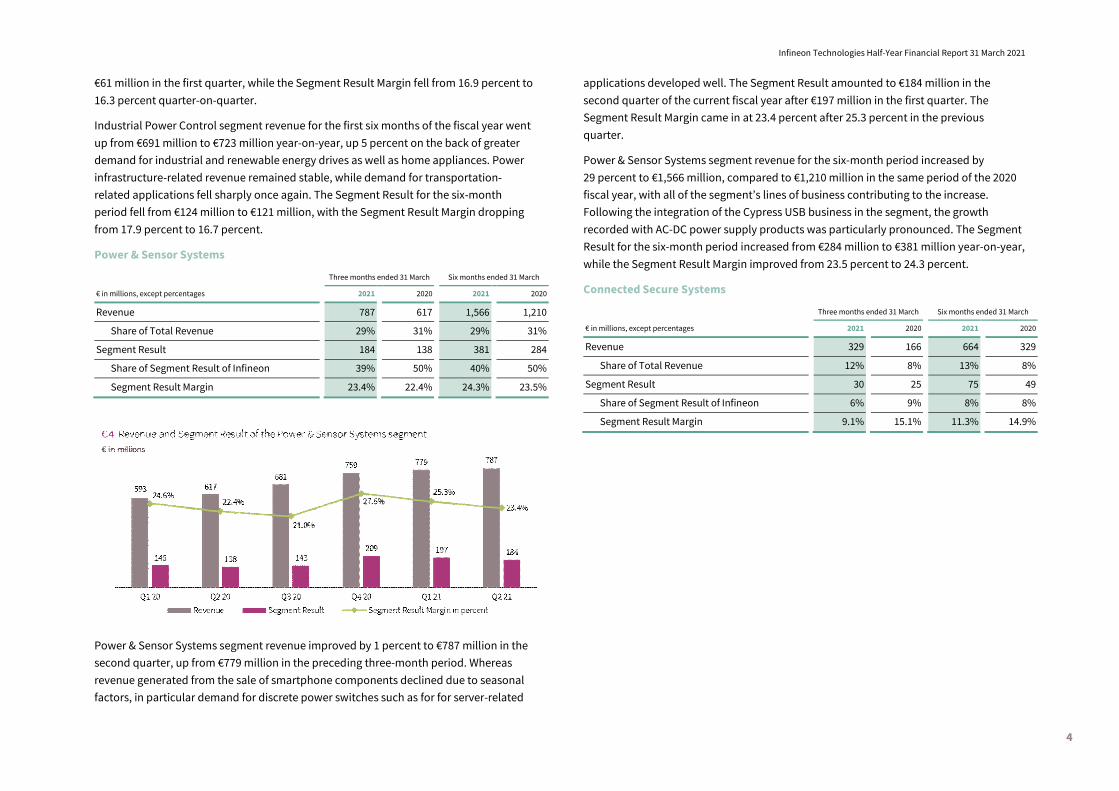
Power & Sensor Systems
Three months ended 31 March Six months ended 31 March € in millions, except percentages 2021 2020 2021 2020
Revenue 787 617 1,566 1,210
Share of Total Revenue 29% 31% 29% 31%
Segment Result 184 138 381 284
Share of Segment Result of Infineon 39% 50% 40% 50%
Segment Result Margin 23.4% 22.4% 24.3% 23.5%
Power & Sensor Systems segment revenue improved by 1 percent to €787 million in the
second quarter, up from €779 million in the preceding three-month period. Whereas
revenue generated from the sale of smartphone components declined due to seasonal
factors, in particular demand for discrete power switches such as for for server-related
applications developed well. The Segment Result amounted to €184 million in the
second quarter of the current fiscal year after €197 million in the first quarter. The
Segment Result Margin came in at 23.4 percent after 25.3 percent in the previous
quarter.
Power & Sensor Systems segment revenue for the six-month period increased by
29 percent to €1,566 million, compared to €1,210 million in the same period of the 2020
fiscal year, with all of the segment’s lines of business contributing to the increase.
Following the integration of the Cypress USB business in the segment, the growth
recorded with AC-DC power supply products was particularly pronounced. The Segment
Result for the six-month period increased from €284 million to €381 million year-on-year,
while the Segment Result Margin improved from 23.5 percent to 24.3 percent.
Connected Secure Systems
Three months ended 31 March Six months ended 31 March € in millions, except percentages 2021 2020 2021 2020
Revenue 329 166 664 329
Share of Total Revenue 12% 8% 13% 8%
Segment Result 30 25 75 49
Share of Segment Result of Infineon 6% 9% 8% 8%
Segment Result Margin 9.1% 15.1% 11.3% 14.9%

Infineon Technologies Half-Year Financial Report 31 March 2021
5
Connected Secure Systems segment revenue totaled €329 million in the second quarter
after €335 million in the preceding three-month period. The 2 percent decline in revenue
was attributable to capacity-related decreases in revenue generated for
microcontrollers and connectivity (including for IoT applications), which were not fully
offset by revenue growth recorded for contactless payment cards, government ID,
authentication and embedded SIM. The Segment Result fell from €45 million to
€30 million for the second quarter and the Segment Result Margin from 13.4 percent to
9.1 percent.
Connected Secure Systems segment revenue increased 102 percent from €329 million in
the first half of the 2020 fiscal year to €664 million in the first six months of the current
fiscal year. The significant rise in revenue is attributable to the consolidation of the IoT
Compute & Wireless line of business area in conjunction with the integration of Cypress.
The Segment Result for the six-month period improved from €49 million to €75 million
year-on-year, whereas the Segment Result Margin fell from 14.9 percent to 11.3 percent.
The Infineon Share
The Infineon share finished the first half of the 2021 fiscal year at €36.16 and was
therefore 50 percent up on the Xetra closing price of €24.12 recorded on 30 September
2020. The company was included in the EURO STOXX 50 index on 22 March 2021.
Performance of the Infineon share, the DAX, the Philadelphia Semiconductor Index
(SOX) and the Dow Jones US Semiconductor Index during the first six months of the
2021 fiscal year (daily closing prices)
At the Annual General Meeting held on 25 February 2021, the Management Board and
the Supervisory Board proposed the payment of a dividend of €0.22 per share for the
2020 fiscal year. The shareholders approved the proposal and an amount of €286 million
was duly disbursed to them during the first half of the 2021 fiscal year.
On the final day of business of the first half-year, a total of 1,305,921,137 Infineon shares
were in issue. This figure includes 4,606,673 shares owned by the company, which are
not entitled to a dividend.
Infineon Technologies Half-Year Financial Report 31 March 2021
6
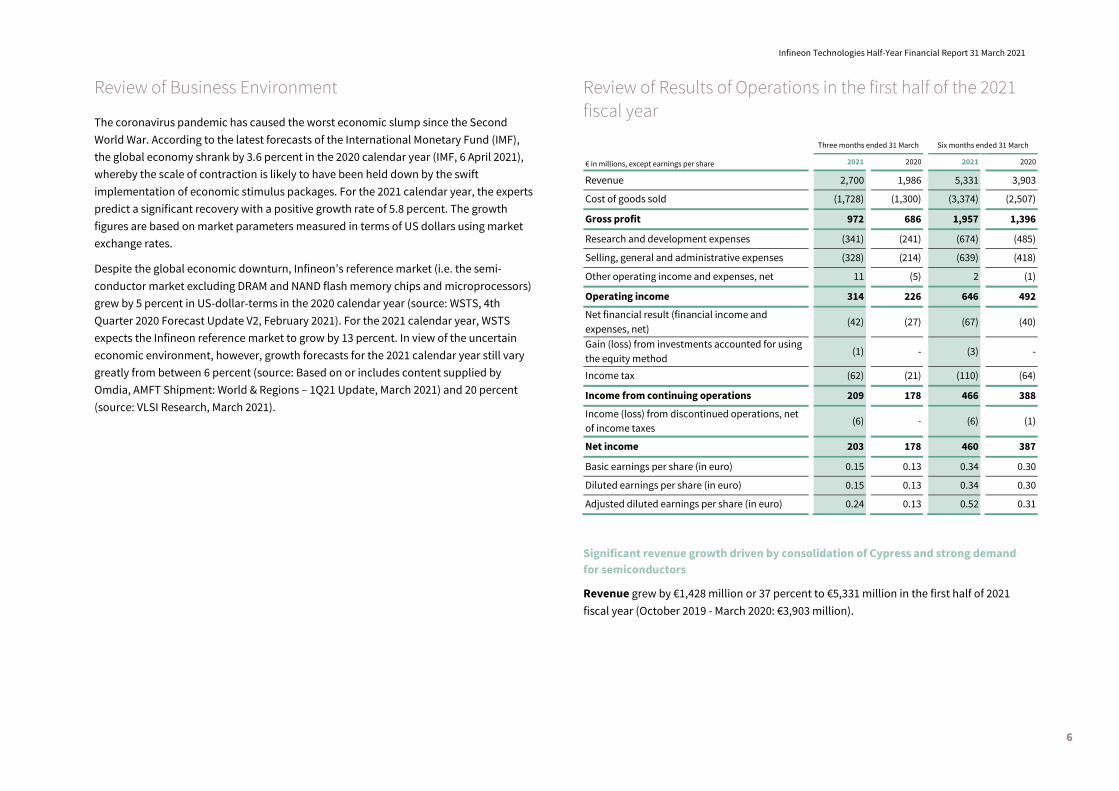
Review of Business Environment
The coronavirus pandemic has caused the worst economic slump since the Second
World War. According to the latest forecasts of the International Monetary Fund (IMF),
the global economy shrank by 3.6 percent in the 2020 calendar year (IMF, 6 April 2021),
whereby the scale of contraction is likely to have been held down by the swift
implementation of economic stimulus packages. For the 2021 calendar year, the experts
predict a significant recovery with a positive growth rate of 5.8 percent. The growth
figures are based on market parameters measured in terms of US dollars using market
exchange rates.
Despite the global economic downturn, Infineon’s reference market (i.e. the semi-
conductor market excluding DRAM and NAND flash memory chips and microprocessors)
grew by 5 percent in US-dollar-terms in the 2020 calendar year (source: WSTS, 4th
Quarter 2020 Forecast Update V2, February 2021). For the 2021 calendar year, WSTS
expects the Infineon reference market to grow by 13 percent. In view of the uncertain
economic environment, however, growth forecasts for the 2021 calendar year still vary
greatly from between 6 percent (source: Based on or includes content supplied by
Omdia, AMFT Shipment: World & Regions – 1Q21 Update, March 2021) and 20 percent
(source: VLSI Research, March 2021).
Review of Results of Operations in the first half of the 2021
fiscal year
Three months ended 31 March Six months ended 31 March
€ in millions, except earnings per share 2021 2020 2021 2020
Revenue 2,700 1,986 5,331 3,903
Cost of goods sold (1,728) (1,300) (3,374) (2,507)
Gross profit 972 686 1,957 1,396
Research and development expenses (341) (241) (674) (485)
Selling, general and administrative expenses (328) (214) (639) (418)
Other operating income and expenses, net 11 (5) 2 (1)
Operating income 314 226 646 492 Net financial result (financial income and
expenses, net) (42) (27) (67) (40)
Gain (loss) from investments accounted for using
the equity method (1) - (3) -
Income tax (62) (21) (110) (64)
Income from continuing operations 209 178 466 388
Income (loss) from discontinued operations, net
of income taxes (6) - (6) (1)
Net income 203 178 460 387
Basic earnings per share (in euro) 0.15 0.13 0.34 0.30
Diluted earnings per share (in euro) 0.15 0.13 0.34 0.30
Adjusted diluted earnings per share (in euro) 0.24 0.13 0.52 0.31
Significant revenue growth driven by consolidation of Cypress and strong demand
for semiconductors
Revenue grew by €1,428 million or 37 percent to €5,331 million in the first half of 2021
fiscal year (October 2019 - March 2020: €3,903 million).
Infineon Technologies Half-Year Financial Report 31 March 2021
7
The dual impact of the acquisition of Cypress (completed on 16 April 2020) and strong
demand for semiconductors meant that all four operating segments reported revenue
growth compared to the corresponding period of the previous fiscal year (see
“Operating performance of the segments in first half of 2021 fiscal year”). In particular,
revenue generated with power semiconductors and embedded control and connectivity
products was significantly higher than one year earlier (see note 11 to the consolidated
financial statements).
The weaker US dollar compared to the equivalent period of the previous year had an
offsetting effect. The average euro/US dollar exchange rate was 1.20 compared to 1.11 in
the corresponding period of the previous fiscal year.
More than one third of revenue generated in Greater China
At €2,014 million or 38 percent, more than one third of revenue generated in the six-
month period under report was attributable to the Greater China region, followed by the
Europe, Middle East and Africa region with €1,356 million or 25 percent.
The main contributors to revenue growth in the first half of the 2021 fiscal year were the
Greater China region (up by €657 million or 46 percent), followed by the Japan region
(up by €264 million) and the Asia-Pacific region (up by €239 million).
For information on revenue by region, see note 11 to the consolidated financial
statements.
Gross margin improved
At €3,374 million, cost of goods sold recorded for the six-month reporting period was
€867 million or 35 percent higher than the figure of €2,507 million in the first half of the
2020 fiscal year, whereby the increase was slightly less pronounced than the 37 percent
growth in revenue.
The higher figure reported for cost of goods sold was mainly attributable to Cypress-
related business. Cost of goods sold also includes amortization of other intangible assets
and depreciation of property, plant and equipment based on fair values recognized on
the basis of purchase price allocations as well as other acquisition-related expenses
totaling €152 million (October 2019 – March 2020: €21 million).
The cost of goods sold also includes expenses that were incurred in connection with a
production standstill in Austin, Texas (USA). The officially ordered shutdown of
production facilities became necessary after a severe winter storm and the resulting
long-lasting power outages in the region.
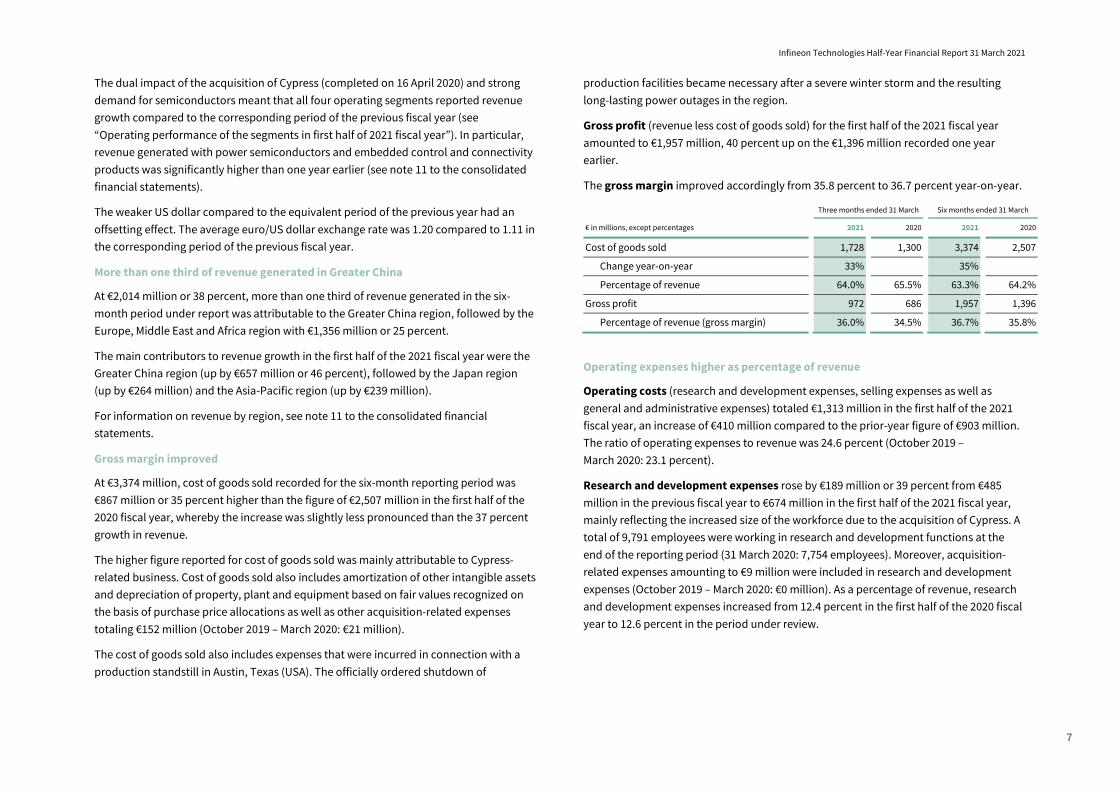
Gross profit (revenue less cost of goods sold) for the first half of the 2021 fiscal year
amounted to €1,957 million, 40 percent up on the €1,396 million recorded one year
earlier.
The gross margin improved accordingly from 35.8 percent to 36.7 percent year-on-year.
Three months ended 31 March Six months ended 31 March € in millions, except percentages 2021 2020 2021 2020
Cost of goods sold 1,728 1,300 3,374 2,507
Change year-on-year 33% 35%
Percentage of revenue 64.0% 65.5% 63.3% 64.2%
Gross profit 972 686 1,957 1,396
Percentage of revenue (gross margin) 36.0% 34.5% 36.7% 35.8%
Operating expenses higher as percentage of revenue
Operating costs (research and development expenses, selling expenses as well as
general and administrative expenses) totaled €1,313 million in the first half of the 2021
fiscal year, an increase of €410 million compared to the prior-year figure of €903 million.
The ratio of operating expenses to revenue was 24.6 percent (October 2019 –
March 2020: 23.1 percent).
Research and development expenses rose by €189 million or 39 percent from €485
million in the previous fiscal year to €674 million in the first half of the 2021 fiscal year,
mainly reflecting the increased size of the workforce due to the acquisition of Cypress. A
total of 9,791 employees were working in research and development functions at the
end of the reporting period (31 March 2020: 7,754 employees). Moreover, acquisition-
related expenses amounting to €9 million were included in research and development
expenses (October 2019 – March 2020: €0 million). As a percentage of revenue, research
and development expenses increased from 12.4 percent in the first half of the 2020 fiscal
year to 12.6 percent in the period under review.

Infineon Technologies Half-Year Financial Report 31 March 2021
8
Three months ended 31 March Six months ended 31 March € in millions, except percentages 2021 2020 2021 2020
Research and development expenses 341 241 674 485
Change year-on-year 41% 39%
Percentage of revenue 12.6% 12.1% 12.6% 12.4%
Selling, general and administrative expenses increased by €221 million or 53 percent
and amounted to €639 million (October 2019 – March 2020: €418 million). Alongside the
cost contribution from Cypress, the figure also included the earnings impact of purchase
price allocations and acquisition-related expenses totaling €115 million (October 2019 –
March 2020: €22 million). Furthermore, the number of employees rose by 1,344 to 5,965
during the period under report (31 March 2020: 4,621), primarily due to the acquisition of
Cypress.
The ratio of selling, general and administrative expenses to revenue for the six-month
period increased from 10.7 percent in the first half of the 2020 fiscal year to 12.0 percent.
Three months ended 31 March Six months ended 31 March € in millions, except percentages 2021 2020 2021 2020
Selling, general and administrative expenses 328 214 639 418
Change year-on-year 53% 53%
Percentage of revenue 12.1% 10.8% 12.0% 10.7%
Net financial result
The change in the financial result from negative €40 million to negative €67 million
mainly reflects the higher interest expense incurred as well as the amortization of
transaction costs relating to the financing and refinancing of the Cypress acquisition.
Effective tax rate up to 19.1 percent
Income tax expense for the six-month period amounted to €110 million (October 2019 –
March 2020: €64 million). The increase in income tax expense resulted on the one hand
from the increase in income before taxes and on the other hand from a higher expected
tax rate. In relation to income before taxes amounting to €576 million (October 2019 –
March 2020: €452 million), the effective tax rate for the reporting period was 19.1 percent
(October 2019 – March 2020: 14.2 percent). See note 2 to the consolidated financial
statements.
Net income and earnings per share higher
After deducting income taxes and the loss from discontinued operations amounting to
€6 million (October 2019 – March 2020: loss of €1 million), Infineon reports net income of
€460 million or the first half of the 2020 fiscal year (October 2019 – March 2020: €387
million).
The higher net income resulted in a corresponding increase in earnings per share even
if the number of shares was increased by 4 percent as a result of a capital measure in
May 2020.
Basic and diluted earnings per share for the first half of the 2020 fiscal year amounted to
€0.34 (October 2019 – March 2020: €0.30).
Infineon Technologies Half-Year Financial Report 31 March 2021
9
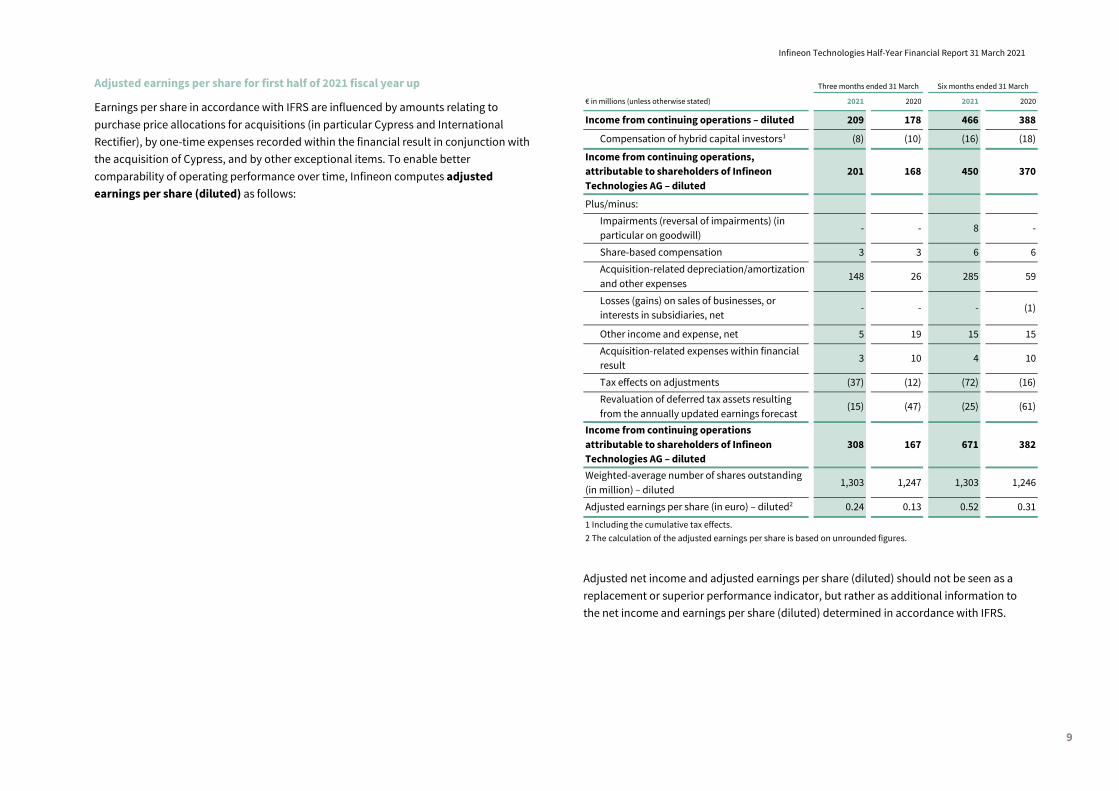
Adjusted earnings per share for first half of 2021 fiscal year up
Earnings per share in accordance with IFRS are influenced by amounts relating to
purchase price allocations for acquisitions (in particular Cypress and International
Rectifier), by one-time expenses recorded within the financial result in conjunction with
the acquisition of Cypress, and by other exceptional items. To enable better
comparability of operating performance over time, Infineon computes adjusted
earnings per share (diluted) as follows:
Three months ended 31 March
Six months ended 31 March € in millions (unless otherwise stated) 2021 2020 2021 2020
Income from continuing operations – diluted 209 178 466 388
Compensation of hybrid capital investors1 (8) (10) (16) (18) Income from continuing operations,
attributable to shareholders of Infineon
Technologies AG – diluted 201 168 450 370
Plus/minus:
Impairments (reversal of impairments) (in
particular on goodwill) - - 8 -
Share-based compensation 3 3 6 6 Acquisition-related depreciation/amortization
and other expenses 148 26 285 59
Losses (gains) on sales of businesses, or
interests in subsidiaries, net - - - (1)
Other income and expense, net 5 19 15 15 Acquisition-related expenses within financial
result 3 10 4 10
Tax effects on adjustments (37) (12) (72) (16) Revaluation of deferred tax assets resulting
from the annually updated earnings forecast (15) (47) (25) (61)
Income from continuing operations
attributable to shareholders of Infineon
Technologies AG – diluted 308 167 671 382
Weighted-average number of shares outstanding
(in million) – diluted 1,303 1,247 1,303 1,246
Adjusted earnings per share (in euro) – diluted2 0.24 0.13 0.52 0.31 1 Including the cumulative tax effects. 2 The calculation of the adjusted earnings per share is based on unrounded figures.
Adjusted net income and adjusted earnings per share (diluted) should not be seen as a
replacement or superior performance indicator, but rather as additional information to
the net income and earnings per share (diluted) determined in accordance with IFRS.

Infineon Technologies Half-Year Financial Report 31 March 2021
10
Review of Financial Condition
€ in millions, except percentages 31. March
2021 30 September
2020
Change Current assets 7,399 7,179 3%
Non-current assets 14,720 14,820 (1%)
Total assets 22,119 21,999 1%
Current liabilities 3,841 3,450 11%
Non-current liabilities 7,761 8,330 (7%)
Total liabilities 11,602 11,780 (2%)
Total equity 10,517 10,219 3%
Slight increase in current assets mainly due to gross cash position
Current assets went up by €220 million to stand at €7,399 million as of 31 March 2021,
compared to €7,179 million as of 30 September 2020, mainly due to the €217 million
increase in the gross cash position (see “Gross cash position and net cash position” in
the “Review of liquidity” section). Trade receivables increased by €152 million in line
with revenue growth, while inventories decreased by €115 million.
Slight decrease in non-current assets primarily due to lower other intangible assets
Non-current assets went down by €100 million from €14,820 million at the end of the
previous fiscal year to stand at €14,720 million as of 31 March 2021. The decrease was
mainly attributable to the lower carrying amount of other intangible assets (down by
€151 million), reflecting the fact that amortization exceeded additions. Property, plant
and equipment increased slightly to €4,149 million over the six-month period
(30 September 2020: €4,110 million), with additions exceeding depreciation. Invest-
ments related primarily to the manufacturing sites in Villach (Austria) and Dresden
(Germany), Kulim and Melaka (both Malaysia) as well as Cegléd (Hungary).
Liabilities down mainly due to loan repayments
Liabilities stood at €11,602 million as of 31 March 2021, €178 million lower than as of
30 September 2020 (€11,780 million). The main reason for the decrease was the
€174 million reduction in financial debt as a result of loan repayments (see note 4 to the
consolidated financial statements). Pensions and similar commitments went down by
€71 million, primarily due to an actuarial gain of €71 million after tax arising on the
measurement of net pension obligations and as a consequence of interest rate and
credit spread developments on financial markets during the past six months (see note 6
to the consolidated financial statements). By contrast, trade payables increased by
€113 million.
Equity up mainly due to net income
Equity increased by €298 million (3 percent) to stand at €10,517 million at the end of the
reporting period (30 September 2020: €10,219 million), mainly due to net income for the
six-month period amounting to €460 million. Actuarial gains arising on the measurement
of pensions and similar commitments totaling €71 million after tax recognized through
other comprehensive income also had a positive impact on equity. Items reducing
equity included in particular the payment of the dividend for the 2020 fiscal year
amounting to €286 million.
As a result, the equity ratio improved to 47.5 percent at the end of the reporting period
(30 September 2020: 46.5 percent).
Infineon Technologies Half-Year Financial Report 31 March 2021
11
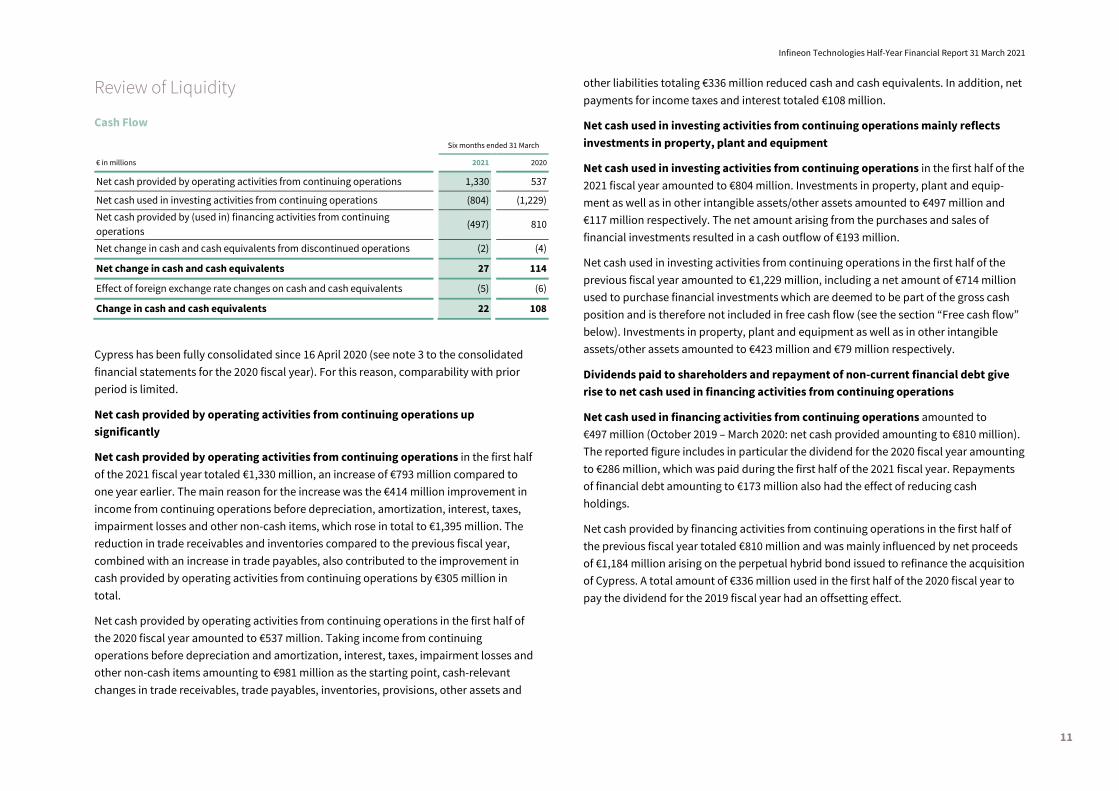
Review of Liquidity
Cash Flow
Six months ended 31 March € in millions 2021 2020
Net cash provided by operating activities from continuing operations 1,330 537
Net cash used in investing activities from continuing operations (804) (1,229) Net cash provided by (used in) financing activities from continuing
operations (497) 810
Net change in cash and cash equivalents from discontinued operations (2) (4)
Net change in cash and cash equivalents 27 114
Effect of foreign exchange rate changes on cash and cash equivalents (5) (6)
Change in cash and cash equivalents 22 108
Cypress has been fully consolidated since 16 April 2020 (see note 3 to the consolidated
financial statements for the 2020 fiscal year). For this reason, comparability with prior
period is limited.
Net cash provided by operating activities from continuing operations up
significantly
Net cash provided by operating activities from continuing operations in the first half
of the 2021 fiscal year totaled €1,330 million, an increase of €793 million compared to
one year earlier. The main reason for the increase was the €414 million improvement in
income from continuing operations before depreciation, amortization, interest, taxes,
impairment losses and other non-cash items, which rose in total to €1,395 million. The
reduction in trade receivables and inventories compared to the previous fiscal year,
combined with an increase in trade payables, also contributed to the improvement in
cash provided by operating activities from continuing operations by €305 million in
total.
Net cash provided by operating activities from continuing operations in the first half of
the 2020 fiscal year amounted to €537 million. Taking income from continuing
operations before depreciation and amortization, interest, taxes, impairment losses and
other non-cash items amounting to €981 million as the starting point, cash-relevant
changes in trade receivables, trade payables, inventories, provisions, other assets and
other liabilities totaling €336 million reduced cash and cash equivalents. In addition, net
payments for income taxes and interest totaled €108 million.
Net cash used in investing activities from continuing operations mainly reflects
investments in property, plant and equipment
Net cash used in investing activities from continuing operations in the first half of the
2021 fiscal year amounted to €804 million. Investments in property, plant and equip-
ment as well as in other intangible assets/other assets amounted to €497 million and
€117 million respectively. The net amount arising from the purchases and sales of
financial investments resulted in a cash outflow of €193 million.
Net cash used in investing activities from continuing operations in the first half of the
previous fiscal year amounted to €1,229 million, including a net amount of €714 million
used to purchase financial investments which are deemed to be part of the gross cash
position and is therefore not included in free cash flow (see the section “Free cash flow”
below). Investments in property, plant and equipment as well as in other intangible
assets/other assets amounted to €423 million and €79 million respectively.
Dividends paid to shareholders and repayment of non-current financial debt give
rise to net cash used in financing activities from continuing operations
Net cash used in financing activities from continuing operations amounted to
€497 million (October 2019 – March 2020: net cash provided amounting to €810 million).
The reported figure includes in particular the dividend for the 2020 fiscal year amounting
to €286 million, which was paid during the first half of the 2021 fiscal year. Repayments
of financial debt amounting to €173 million also had the effect of reducing cash
holdings.
Net cash provided by financing activities from continuing operations in the first half of
the previous fiscal year totaled €810 million and was mainly influenced by net proceeds
of €1,184 million arising on the perpetual hybrid bond issued to refinance the acquisition
of Cypress. A total amount of €336 million used in the first half of the 2020 fiscal year to
pay the dividend for the 2019 fiscal year had an offsetting effect.
Infineon Technologies Half-Year Financial Report 31 March 2021
12
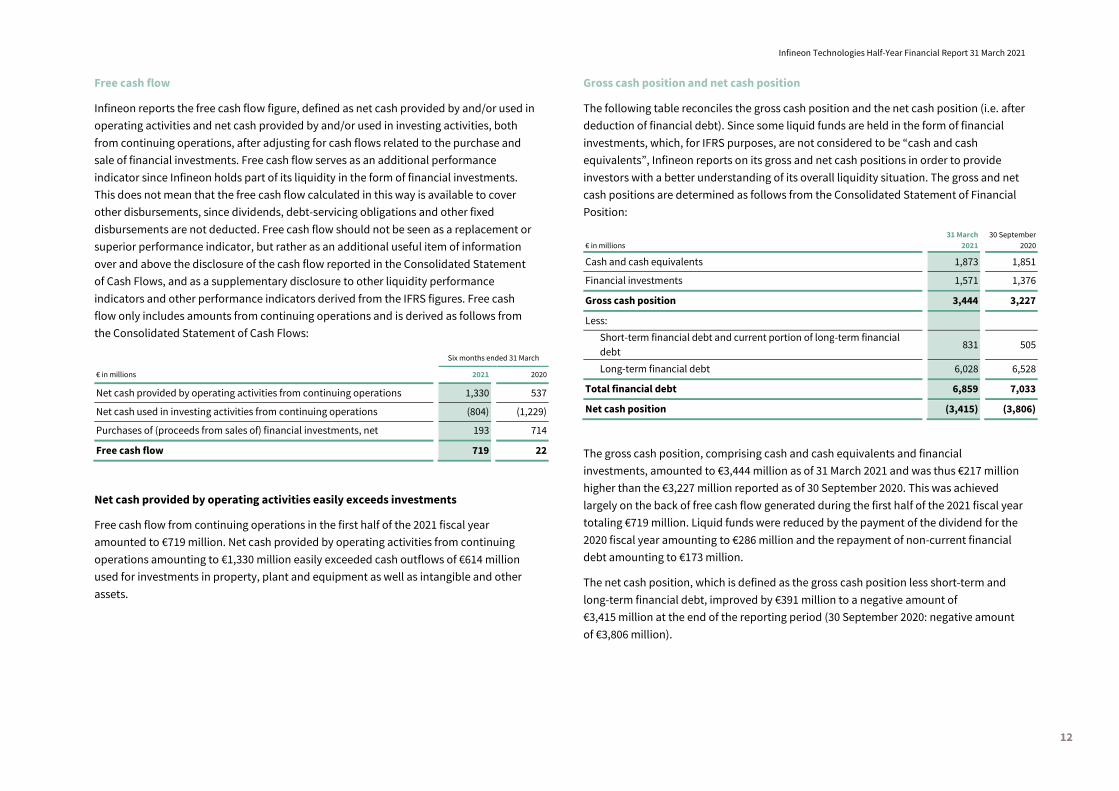
Free cash flow
Infineon reports the free cash flow figure, defined as net cash provided by and/or used in
operating activities and net cash provided by and/or used in investing activities, both
from continuing operations, after adjusting for cash flows related to the purchase and
sale of financial investments. Free cash flow serves as an additional performance
indicator since Infineon holds part of its liquidity in the form of financial investments.
This does not mean that the free cash flow calculated in this way is available to cover
other disbursements, since dividends, debt-servicing obligations and other fixed
disbursements are not deducted. Free cash flow should not be seen as a replacement or
superior performance indicator, but rather as an additional useful item of information
over and above the disclosure of the cash flow reported in the Consolidated Statement
of Cash Flows, and as a supplementary disclosure to other liquidity performance
indicators and other performance indicators derived from the IFRS figures. Free cash
flow only includes amounts from continuing operations and is derived as follows from
the Consolidated Statement of Cash Flows:
Six months ended 31 March € in millions 2021 2020
Net cash provided by operating activities from continuing operations 1,330 537
Net cash used in investing activities from continuing operations (804) (1,229)
Purchases of (proceeds from sales of) financial investments, net 193 714
Free cash flow 719 22
Net cash provided by operating activities easily exceeds investments
Free cash flow from continuing operations in the first half of the 2021 fiscal year
amounted to €719 million. Net cash provided by operating activities from continuing
operations amounting to €1,330 million easily exceeded cash outflows of €614 million
used for investments in property, plant and equipment as well as intangible and other
assets.
Gross cash position and net cash position
The following table reconciles the gross cash position and the net cash position (i.e. after
deduction of financial debt). Since some liquid funds are held in the form of financial
investments, which, for IFRS purposes, are not considered to be “cash and cash
equivalents”, Infineon reports on its gross and net cash positions in order to provide
investors with a better understanding of its overall liquidity situation. The gross and net
cash positions are determined as follows from the Consolidated Statement of Financial
Position:
€ in millions 31 March
2021 30 September
2020 Cash and cash equivalents 1,873 1,851
Financial investments 1,571 1,376
Gross cash position 3,444 3,227
Less:
Short-term financial debt and current portion of long-term financial
debt 831 505
Long-term financial debt 6,028 6,528
Total financial debt 6,859 7,033
Net cash position (3,415) (3,806)
The gross cash position, comprising cash and cash equivalents and financial
investments, amounted to €3,444 million as of 31 March 2021 and was thus €217 million
higher than the €3,227 million reported as of 30 September 2020. This was achieved
largely on the back of free cash flow generated during the first half of the 2021 fiscal year
totaling €719 million. Liquid funds were reduced by the payment of the dividend for the
2020 fiscal year amounting to €286 million and the repayment of non-current financial
debt amounting to €173 million.
The net cash position, which is defined as the gross cash position less short-term and
long-term financial debt, improved by €391 million to a negative amount of
€3,415 million at the end of the reporting period (30 September 2020: negative amount
of €3,806 million).
Infineon Technologies Half-Year Financial Report 31 March 2021
13
Employees
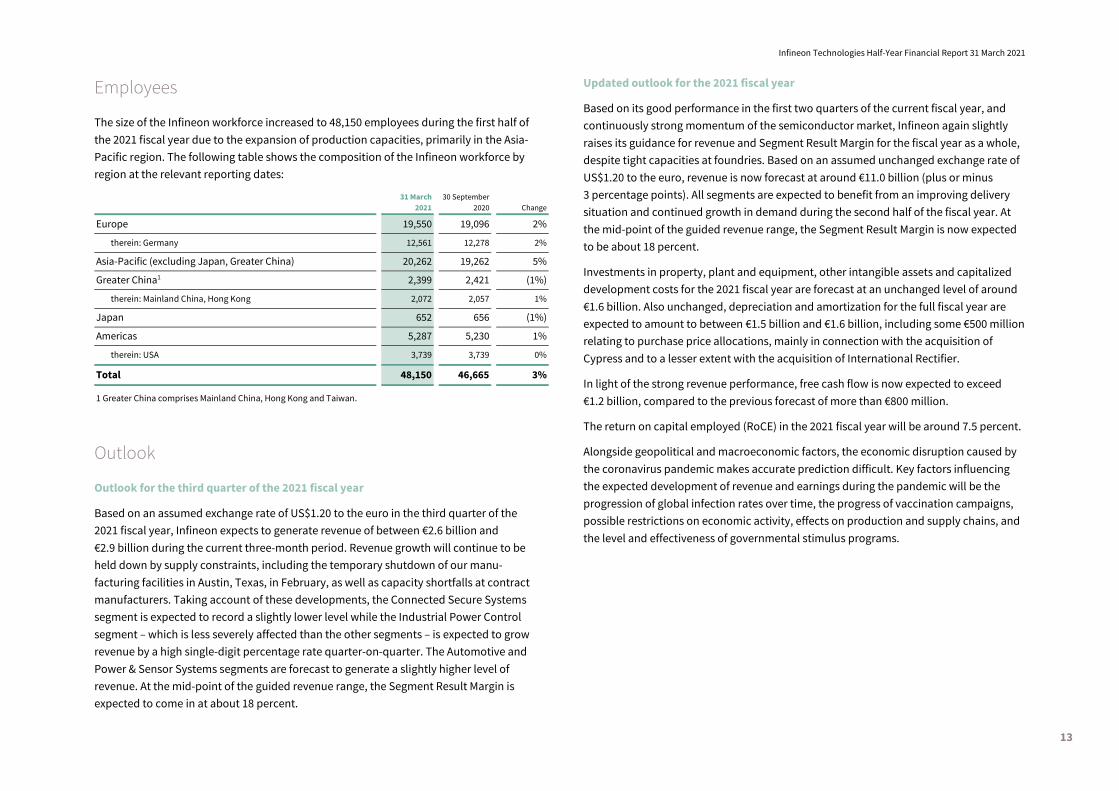
The size of the Infineon workforce increased to 48,150 employees during the first half of
the 2021 fiscal year due to the expansion of production capacities, primarily in the Asia-
Pacific region. The following table shows the composition of the Infineon workforce by
region at the relevant reporting dates:
31 March
2021 30 September
2020
Change Europe 19,550 19,096 2%
therein: Germany 12,561 12,278 2%
Asia-Pacific (excluding Japan, Greater China) 20,262 19,262 5%
Greater China1 2,399 2,421 (1%)
therein: Mainland China, Hong Kong 2,072 2,057 1%
Japan 652 656 (1%)
Americas 5,287 5,230 1%
therein: USA 3,739 3,739 0%
Total 48,150 46,665 3%
1 Greater China comprises Mainland China, Hong Kong and Taiwan.
Outlook
Outlook for the third quarter of the 2021 fiscal year
Based on an assumed exchange rate of US$1.20 to the euro in the third quarter of the
2021 fiscal year, Infineon expects to generate revenue of between €2.6 billion and
€2.9 billion during the current three-month period. Revenue growth will continue to be
held down by supply constraints, including the temporary shutdown of our manu-
facturing facilities in Austin, Texas, in February, as well as capacity shortfalls at contract
manufacturers. Taking account of these developments, the Connected Secure Systems
segment is expected to record a slightly lower level while the Industrial Power Control
segment – which is less severely affected than the other segments – is expected to grow
revenue by a high single-digit percentage rate quarter-on-quarter. The Automotive and
Power & Sensor Systems segments are forecast to generate a slightly higher level of
revenue. At the mid-point of the guided revenue range, the Segment Result Margin is
expected to come in at about 18 percent.
Updated outlook for the 2021 fiscal year
Based on its good performance in the first two quarters of the current fiscal year, and
continuously strong momentum of the semiconductor market, Infineon again slightly
raises its guidance for revenue and Segment Result Margin for the fiscal year as a whole,
despite tight capacities at foundries. Based on an assumed unchanged exchange rate of
US$1.20 to the euro, revenue is now forecast at around €11.0 billion (plus or minus
3 percentage points). All segments are expected to benefit from an improving delivery
situation and continued growth in demand during the second half of the fiscal year. At
the mid-point of the guided revenue range, the Segment Result Margin is now expected
to be about 18 percent.
Investments in property, plant and equipment, other intangible assets and capitalized
development costs for the 2021 fiscal year are forecast at an unchanged level of around
€1.6 billion. Also unchanged, depreciation and amortization for the full fiscal year are
expected to amount to between €1.5 billion and €1.6 billion, including some €500 million
relating to purchase price allocations, mainly in connection with the acquisition of
Cypress and to a lesser extent with the acquisition of International Rectifier.
In light of the strong revenue performance, free cash flow is now expected to exceed
€1.2 billion, compared to the previous forecast of more than €800 million.
The return on capital employed (RoCE) in the 2021 fiscal year will be around 7.5 percent.
Alongside geopolitical and macroeconomic factors, the economic disruption caused by
the coronavirus pandemic makes accurate prediction difficult. Key factors influencing
the expected development of revenue and earnings during the pandemic will be the
progression of global infection rates over time, the progress of vaccination campaigns,
possible restrictions on economic activity, effects on production and supply chains, and
the level and effectiveness of governmental stimulus programs.

Infineon Technologies Half-Year Financial Report 31 March 2021
14
Risks and Opportunities
Infineon's international structure and its broad range of products offer a multitude of
opportunities, whilst also exposing it to numerous risks. Coordinated risk management
and control systems are in place to identify relevant risks and opportunities at an early
stage and manage them to Infineon's advantage. Risk management at Infineon is
integrated in the Group's planning systems, playing a key role in all entrepreneurial
decisions and business processes. As such, it is a vital aspect of securing sustainable
success for the business.
Specific risks that could have a materially adverse effect on Infineon's financial
condition, liquidity position and results of operations, specific opportunities and the
concept behind Infineon's risk management system are described in the Group
Management Report for the 2020 fiscal year (pages 110 to 122).
Compared to that description, the risk of dependence on individual suppliers was
upgraded from medium to high during the first half of the 2021 fiscal year. The
unexpectedly high demand for semiconductor products – especially for the automotive
market, renewable energy, data centers, expansion of the mobile communications
infrastructure, digitalization in many areas as well as electronics for work and home life
in general – is resulting in delivery problems, particularly for our contract manufacturers.
As a consequence, there is a risk of delays in deliveries to our customers, with the
potential for lost revenue. Simultaneously, we are currently being confronted with price
increases from suppliers, which it may not be possible to fully pass on to our customers.
The Management Board is monitoring and assessing developments continuously and is
in the process of initiating appropriate measures.
During the first six months of the 2021 fiscal year, Infineon has not identified any other
material changes to the opportunities and risks described in the 2020 Annual Report.
Further risks – of which Infineon is not currently aware or which are not currently
considered material – could also impair business activities in the future. At the date of
this report, Infineon is not aware of any substantial risks, which could jeopardize its
going-concern status.
Infineon Technologies Half-Year Financial Report 31 March 2021
15
Consolidated Statement of Profit or Loss
Three months ended
31 March Six months ended
31 March € in millions Note 2021 2020 2021 2020
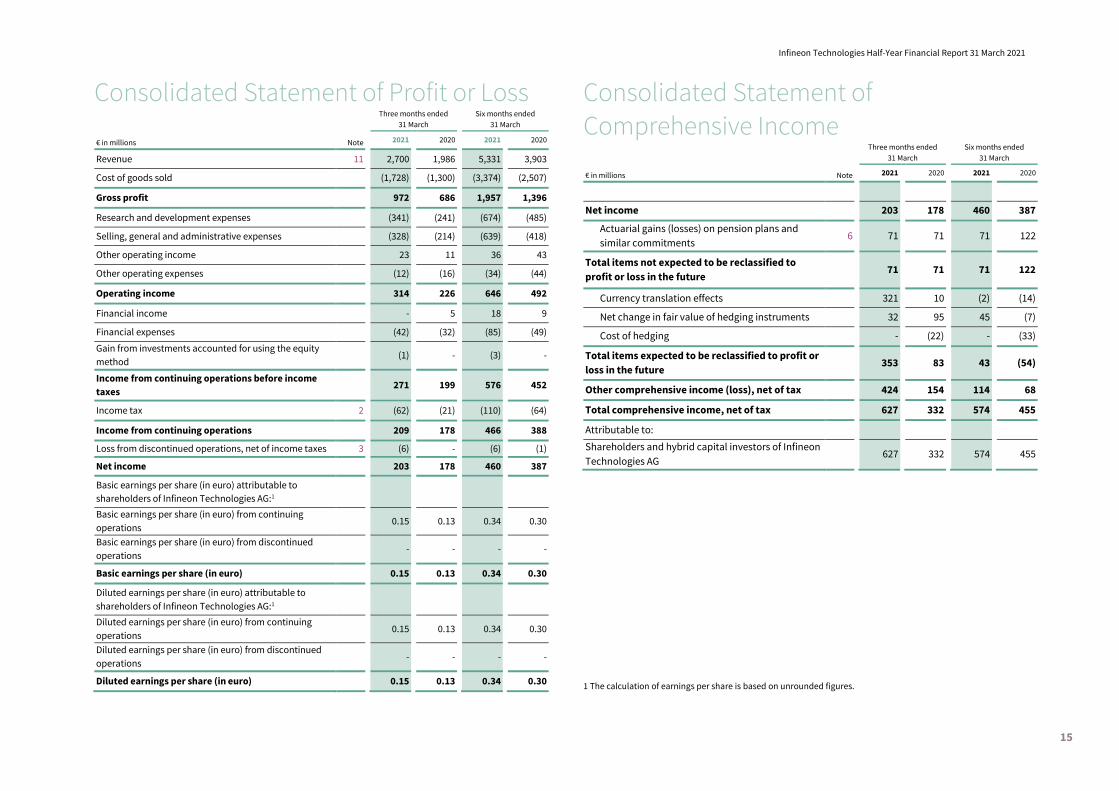
Revenue 11 2,700 1,986 5,331 3,903
Cost of goods sold (1,728) (1,300) (3,374) (2,507)
Gross profit 972 686 1,957 1,396
Research and development expenses (341) (241) (674) (485)
Selling, general and administrative expenses (328) (214) (639) (418)
Other operating income 23 11 36 43
Other operating expenses (12) (16) (34) (44)
Operating income 314 226 646 492
Financial income - 5 18 9
Financial expenses (42) (32) (85) (49)
Gain from investments accounted for using the equity
method (1) - (3) -
Income from continuing operations before income
taxes 271 199 576 452
Income tax 2 (62) (21) (110) (64)
Income from continuing operations 209 178 466 388
Loss from discontinued operations, net of income taxes 3 (6) - (6) (1)
Net income 203 178 460 387
Basic earnings per share (in euro) attributable to
shareholders of Infineon Technologies AG:1
Basic earnings per share (in euro) from continuing
operations 0.15 0.13 0.34 0.30
Basic earnings per share (in euro) from discontinued
operations - - - -
Basic earnings per share (in euro) 0.15 0.13 0.34 0.30
Diluted earnings per share (in euro) attributable to
shareholders of Infineon Technologies AG:1
Diluted earnings per share (in euro) from continuing
operations 0.15 0.13 0.34 0.30
Diluted earnings per share (in euro) from discontinued
operations - - - -
Diluted earnings per share (in euro) 0.15 0.13 0.34 0.30
Consolidated Statement of
Comprehensive Income
Three months ended
31 March Six months ended
31 March € in millions Note 2021 2020 2021 2020
Net income 203 178 460 387
Actuarial gains (losses) on pension plans and
similar commitments 6 71 71 71 122
Total items not expected to be reclassified to
profit or loss in the future 71 71 71 122
Currency translation effects 321 10 (2) (14)
Net change in fair value of hedging instruments 32 95 45 (7)
Cost of hedging - (22) - (33)
Total items expected to be reclassified to profit or
loss in the future 353 83 43 (54)
Other comprehensive income (loss), net of tax 424 154 114 68
Total comprehensive income, net of tax 627 332 574 455
Attributable to:
Shareholders and hybrid capital investors of Infineon
Technologies AG 627 332 574 455
1 The calculation of earnings per share is based on unrounded figures.
Infineon Technologies Half-Year Financial Report 31 March 2021
16
Consolidated Statement of Financial
Position
€ in millions
Note: 31 March
2021 31 March
2020 30 September
2020 ASSETS
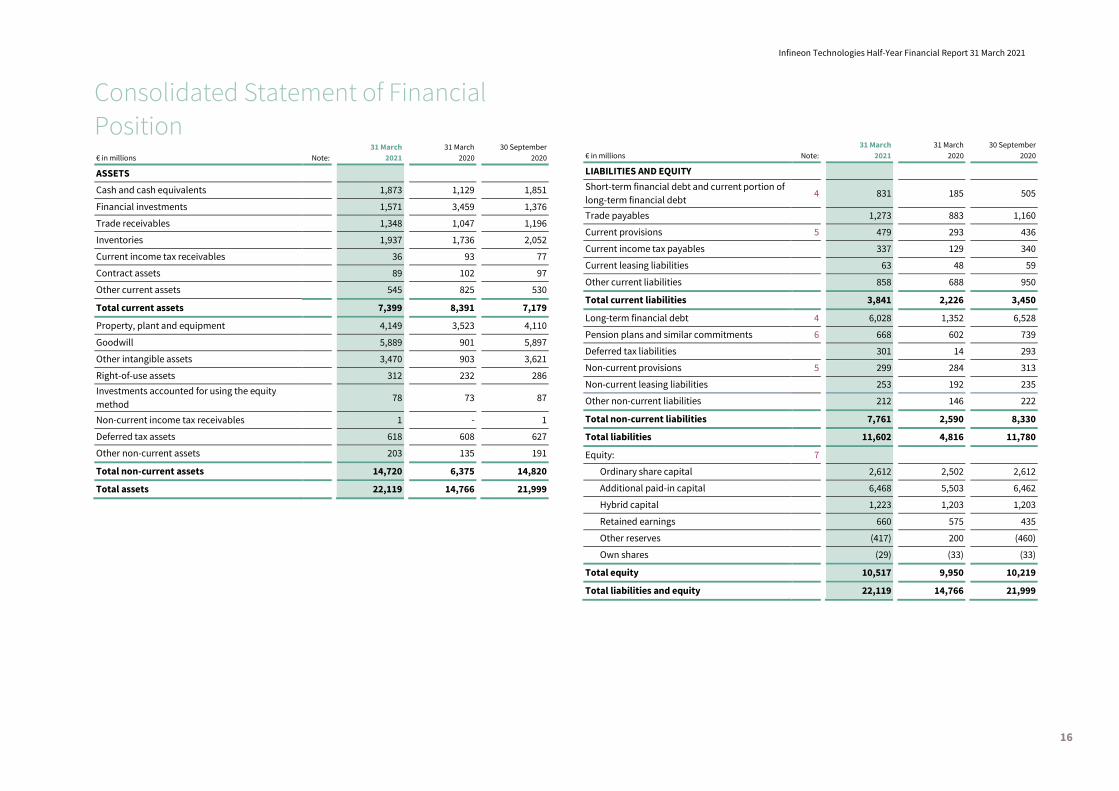
Cash and cash equivalents 1,873 1,129 1,851 Financial investments 1,571 3,459 1,376 Trade receivables 1,348 1,047 1,196 Inventories 1,937 1,736 2,052 Current income tax receivables 36 93 77 Contract assets 89 102 97 Other current assets 545 825 530 Total current assets 7,399 8,391 7,179 Property, plant and equipment 4,149 3,523 4,110 Goodwill 5,889 901 5,897 Other intangible assets 3,470 903 3,621 Right-of-use assets 312 232 286 Investments accounted for using the equity
method 78 73 87
Non-current income tax receivables 1 - 1 Deferred tax assets 618 608 627 Other non-current assets 203 135 191 Total non-current assets 14,720 6,375 14,820 Total assets 22,119 14,766 21,999
€ in millions
Note: 31 March
2021 31 March
2020 30 September
2020 LIABILITIES AND EQUITY
Short-term financial debt and current portion of
long-term financial debt 4 831 185 505
Trade payables 1,273 883 1,160 Current provisions 5 479 293 436 Current income tax payables 337 129 340 Current leasing liabilities 63 48 59 Other current liabilities 858 688 950 Total current liabilities 3,841 2,226 3,450 Long-term financial debt 4 6,028 1,352 6,528 Pension plans and similar commitments 6 668 602 739 Deferred tax liabilities 301 14 293 Non-current provisions 5 299 284 313 Non-current leasing liabilities 253 192 235 Other non-current liabilities 212 146 222 Total non-current liabilities 7,761 2,590 8,330 Total liabilities 11,602 4,816 11,780 Equity: 7
Ordinary share capital 2,612 2,502 2,612 Additional paid-in capital 6,468 5,503 6,462 Hybrid capital 1,223 1,203 1,203 Retained earnings 660 575 435 Other reserves (417) 200 (460) Own shares (29) (33) (33)
Total equity 10,517 9,950 10,219 Total liabilities and equity 22,119 14,766 21,999
Infineon Technologies Half-Year Financial Report 31 March 2021
17
Consolidated Statement of Cash Flows
Three months ended
31 March Six months ended
31 March € in millions Note 2021 2020 2021 2020
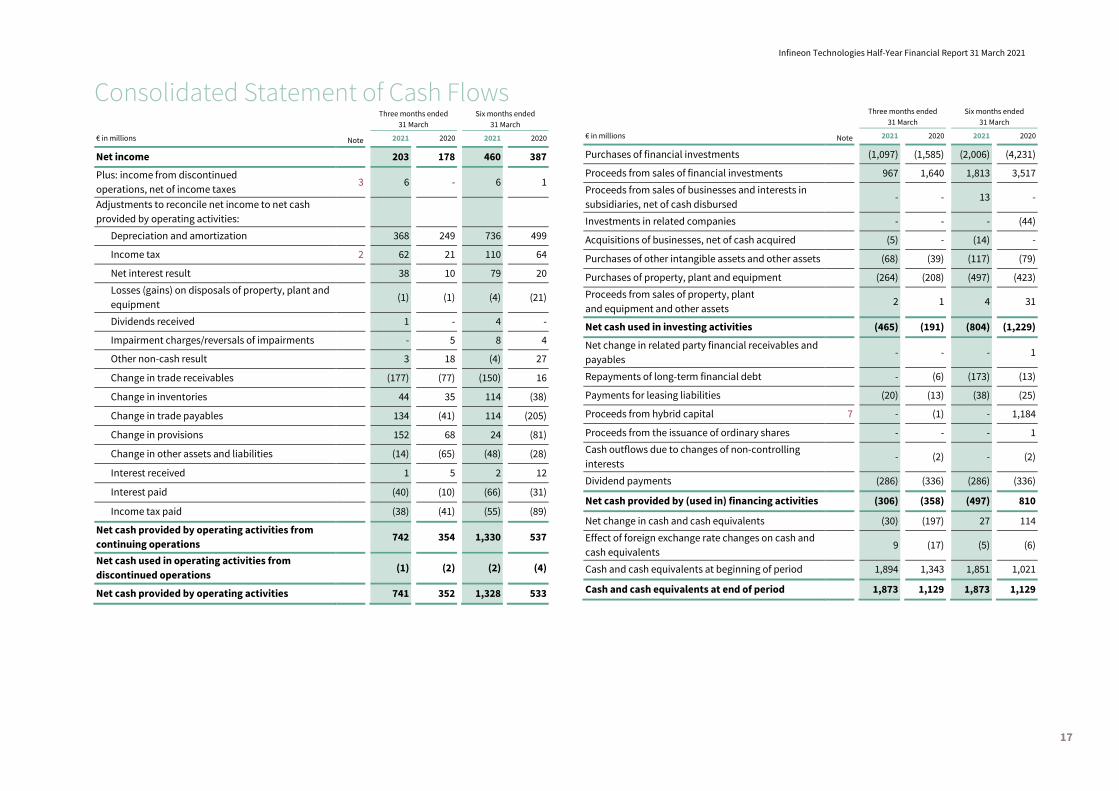
Net income 203 178 460 387 Plus: income from discontinued
operations, net of income taxes 3 6 - 6 1
Adjustments to reconcile net income to net cash
provided by operating activities:
Depreciation and amortization 368 249 736 499
Income tax 2 62 21 110 64
Net interest result 38 10 79 20 Losses (gains) on disposals of property, plant and
equipment (1) (1) (4) (21)
Dividends received 1 - 4 -
Impairment charges/reversals of impairments - 5 8 4
Other non-cash result 3 18 (4) 27
Change in trade receivables (177) (77) (150) 16
Change in inventories 44 35 114 (38)
Change in trade payables 134 (41) 114 (205)
Change in provisions 152 68 24 (81)
Change in other assets and liabilities (14) (65) (48) (28)
Interest received 1 5 2 12
Interest paid (40) (10) (66) (31)
Income tax paid (38) (41) (55) (89)
Net cash provided by operating activities from
continuing operations 742 354 1,330 537
Net cash used in operating activities from
discontinued operations (1) (2) (2) (4)
Net cash provided by operating activities 741 352 1,328 533
Three months ended
31 March Six months ended
31 March € in millions Note 2021 2020 2021 2020
Purchases of financial investments (1,097) (1,585) (2,006) (4,231)
Proceeds from sales of financial investments 967 1,640 1,813 3,517 Proceeds from sales of businesses and interests in
subsidiaries, net of cash disbursed - - 13 -
Investments in related companies - - - (44)
Acquisitions of businesses, net of cash acquired (5) - (14) -
Purchases of other intangible assets and other assets (68) (39) (117) (79)
Purchases of property, plant and equipment (264) (208) (497) (423) Proceeds from sales of property, plant
and equipment and other assets 2 1 4 31
Net cash used in investing activities (465) (191) (804) (1,229)
Net change in related party financial receivables and
payables - - - 1
Repayments of long-term financial debt - (6) (173) (13)
Payments for leasing liabilities (20) (13) (38) (25)
Proceeds from hybrid capital 7 - (1) - 1,184
Proceeds from the issuance of ordinary shares - - - 1 Cash outflows due to changes of non-controlling
interests - (2) - (2)
Dividend payments (286) (336) (286) (336)
Net cash provided by (used in) financing activities (306) (358) (497) 810
Net change in cash and cash equivalents (30) (197) 27 114 Effect of foreign exchange rate changes on cash and
cash equivalents 9 (17) (5) (6)
Cash and cash equivalents at beginning of period 1,894 1,343 1,851 1,021
Cash and cash equivalents at end of period 1,873 1,129 1,873 1,129
Infineon Technologies Half-Year Financial Report 31 March 2021
18
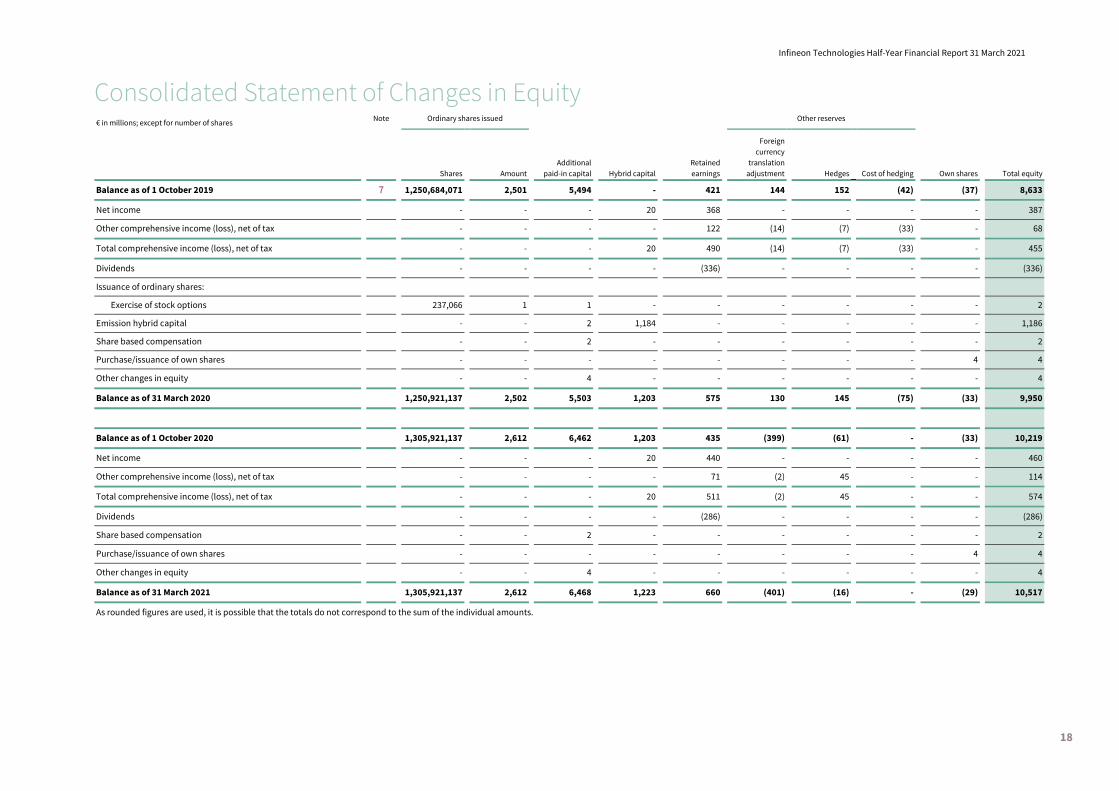
Consolidated Statement of Changes in Equity € in millions; except for number of shares Note Ordinary shares issued Other reserves
Shares Amount
Additional
paid-in capital Hybrid capital
Retained
earnings
Foreign
currency
translation
adjustment Hedges Cost of hedging Own shares Total equity Balance as of 1 October 2019 7 1,250,684,071 2,501 5,494 - 421 144 152 (42) (37) 8,633
Net income - - - 20 368 - - - - 387
Other comprehensive income (loss), net of tax - - - - 122 (14) (7) (33) - 68
Total comprehensive income (loss), net of tax - - - 20 490 (14) (7) (33) - 455
Dividends - - - - (336) - - - - (336)
Issuance of ordinary shares:
Exercise of stock options 237,066 1 1 - - - - - - 2 Emission hybrid capital - - 2 1,184 - - - - - 1,186 Share based compensation - - 2 - - - - - - 2 Purchase/issuance of own shares - - - - - - - - 4 4
Other changes in equity - - 4 - - - - - - 4
Balance as of 31 March 2020 1,250,921,137 2,502 5,503 1,203 575 130 145 (75) (33) 9,950
Balance as of 1 October 2020 1,305,921,137 2,612 6,462 1,203 435 (399) (61) - (33) 10,219
Net income - - - 20 440 - - - - 460
Other comprehensive income (loss), net of tax - - - - 71 (2) 45 - - 114
Total comprehensive income (loss), net of tax - - - 20 511 (2) 45 - - 574
Dividends - - - - (286) - - - - (286)
Share based compensation - - 2 - - - - - - 2
Purchase/issuance of own shares - - - - - - - - 4 4
Other changes in equity - - 4 - - - - - - 4
Balance as of 31 March 2021 1,305,921,137 2,612 6,468 1,223 660 (401) (16) - (29) 10,517
As rounded figures are used, it is possible that the totals do not correspond to the sum of the individual amounts.
Infineon Technologies Half-Year Financial Report 31 March 2021
19
Notes to the condensed Consolidated
Interim Financial Statements
1 Basis of Presentation
The condensed Consolidated Interim Financial Statements of the Infineon Group
(“Infineon”) comprising Infineon Technologies AG (hereafter also “the Company”) and its
subsidiaries for the three and six months ended 31 March 2021 and 2020, have been
prepared in accordance with International Financial Reporting Standards (IFRS) issued
by the International Accounting Standards Board (IASB), as adopted by the European
Union (EU). The condensed Consolidated Interim Financial Statements have been
prepared in compliance with IAS 34, “Interim Financial Reporting”. Accordingly, certain
information and footnote disclosures normally included in consolidated financial
statements have been condensed or omitted. Although the Consolidated Statement of
Financial Position as of 30 September 2020 presented herein was derived from the
audited consolidated financial statements, not all related disclosures required by IFRS
for these are included. The condensed Consolidated Interim Financial Statements
should be read in conjunction with the audited Consolidated Financial Statements for
the 2020 fiscal year. They have been prepared in accordance with IFRS, as adopted by
the EU. In interim periods, tax expense is calculated based on the current estimated
effective tax rate for the full year.
The accounting policies applied in the preparation of the accompanying condensed
Consolidated Interim Financial Statements are consistent with those used for the 2020
fiscal year. An exemption to this principle is the application of new or revised standards
and interpretations, which are effective for fiscal years starting from 1 January 2020 and
1 June 2020, respectively. The application of these new or revised standards does not
have any material impact on Infineon`s financial position, results of operations and cash
flows.
As a result of the adjustment to the presentation of reimbursement obligations to
customers, made during the 2020 fiscal year (see notes 10 and 19 to the 2020
Consolidated Financial Statements), the previous year half-year figures for trade
receivables and other current liabilities have been adjusted for better comparability.
These condensed Consolidated Interim Financial Statements contain all necessary
adjustments and present, in the opinion of the management, a true and fair view of the
financial position, results of operations and cash flows. All accruals recorded are of a
normal recurring nature. The results of operations for any interim period are not
necessarily indicative of results for the full fiscal year.
All amounts presented in these condensed Consolidated Interim Financial Statements
are shown in euro (€) unless stated otherwise.
Deviations between amounts presented are possible due to rounding. Negative amounts
are presented in parentheses.
The Company’s Management Board presented the condensed Consolidated Interim
Financial Statements on 28 April 2021.
Estimates and assumptions
The preparation of the condensed Consolidated Interim Financial Statements requires
management to make estimates and assumptions that have an impact on the presented
amounts and the associated disclosures.
Estimates and assumptions undergo regular review and must be adjusted where
appropriate.
Although these estimates and assumptions are applied by management to the best of its
knowledge based on current events and circumstances, actual events may result in
deviations from these estimates. This applies in particular against the background of the
coronavirus pandemic, which is causing distortions in global supply chains, markets and
general economic trends. Developments in the wake of the pandemic are dynamic, so it
cannot be ruled out that the actual results deviate significantly from the estimates and
assumptions made in the preparation of these condensed Consolidated Interim
Financial Statements, or that the estimates and assumptions made will have to be
adjusted in future periods and this will have a significant impact on Infineon’s financial
position, results of operations and cash flows.
Areas that contain estimates and assumptions and are therefore most likely to be
affected if the actual results deviate from the estimates and assumptions, or if the
estimates and assumptions made need to be adjusted in future periods, are explained in
more detail in note 2 to the 2020 Consolidated Financial Statements, and mainly relate
Infineon Technologies Half-Year Financial Report 31 March 2021
20
to the following items in the Consolidated Interim Financial Statements as of
31 March 2021: recognition and measurement at fair value of acquired assets resulting
from the purchase price allocation of Cypress Semiconductor Corporation (“Cypress”),
recognition and measurement of deferred tax assets and uncertain tax positions,
valuation of inventory, revenue recognized over time as well as revenue where the
transaction price includes a variable component, the recoverability of non-financial
assets, in particular goodwill, recognition and valuation of provisions and valuation of
defined benefit pension plans. If there have been significant changes to the estimates
and assumptions or the underlying parameters in the interim reporting period, this are
dealt with separately as part of these condensed Consolidated Interim Financial
Statements.
All assumptions and estimates are based on the circumstances and assessments as of
the balance sheet date, and taking into account knowledge gained up to the approval by
the Management Board of the condensed Consolidated Interim Financial Statements on
28 April 2021.
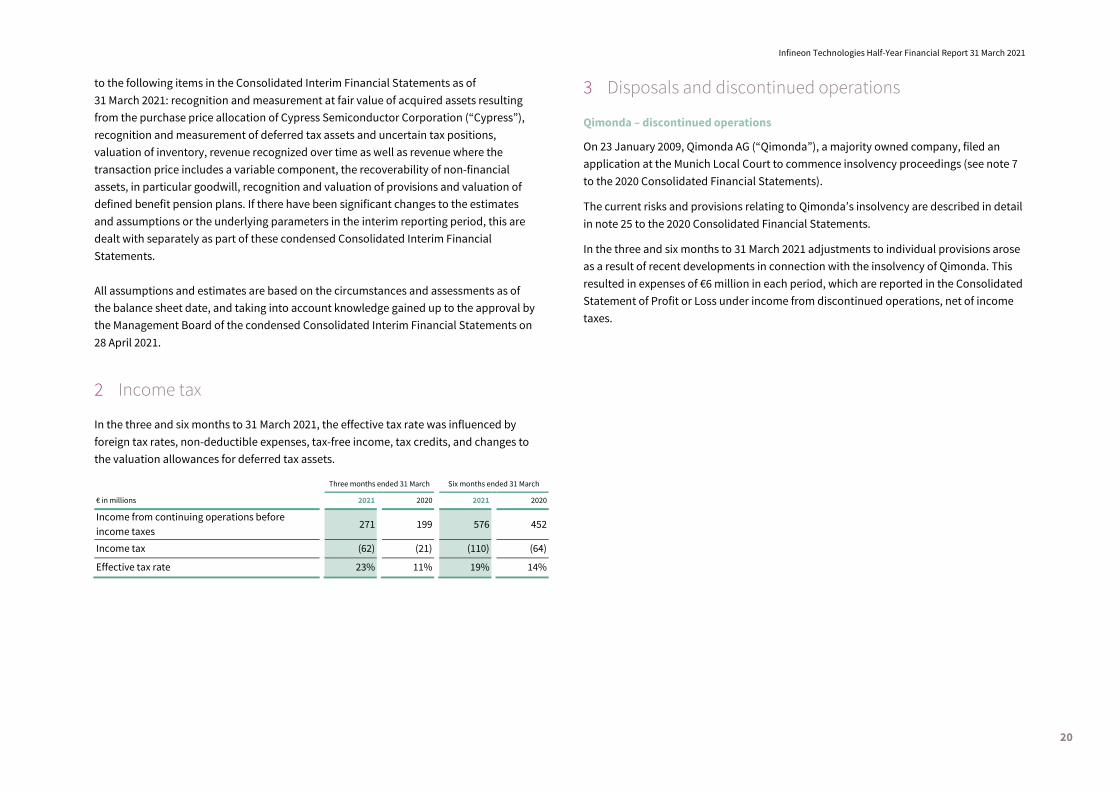
2 Income tax
In the three and six months to 31 March 2021, the effective tax rate was influenced by
foreign tax rates, non-deductible expenses, tax-free income, tax credits, and changes to
the valuation allowances for deferred tax assets.
Three months ended 31 March Six months ended 31 March € in millions 2021 2020 2021 2020 Income from continuing operations before
income taxes 271 199 576 452
Income tax (62) (21) (110) (64)
Effective tax rate 23% 11% 19% 14%
3 Disposals and discontinued operations
Qimonda – discontinued operations
On 23 January 2009, Qimonda AG (“Qimonda”), a majority owned company, filed an
application at the Munich Local Court to commence insolvency proceedings (see note 7
to the 2020 Consolidated Financial Statements).
The current risks and provisions relating to Qimonda’s insolvency are described in detail
in note 25 to the 2020 Consolidated Financial Statements.
In the three and six months to 31 March 2021 adjustments to individual provisions arose
as a result of recent developments in connection with the insolvency of Qimonda. This
resulted in expenses of €6 million in each period, which are reported in the Consolidated
Statement of Profit or Loss under income from discontinued operations, net of income
taxes.
Infineon Technologies Half-Year Financial Report 31 March 2021
21
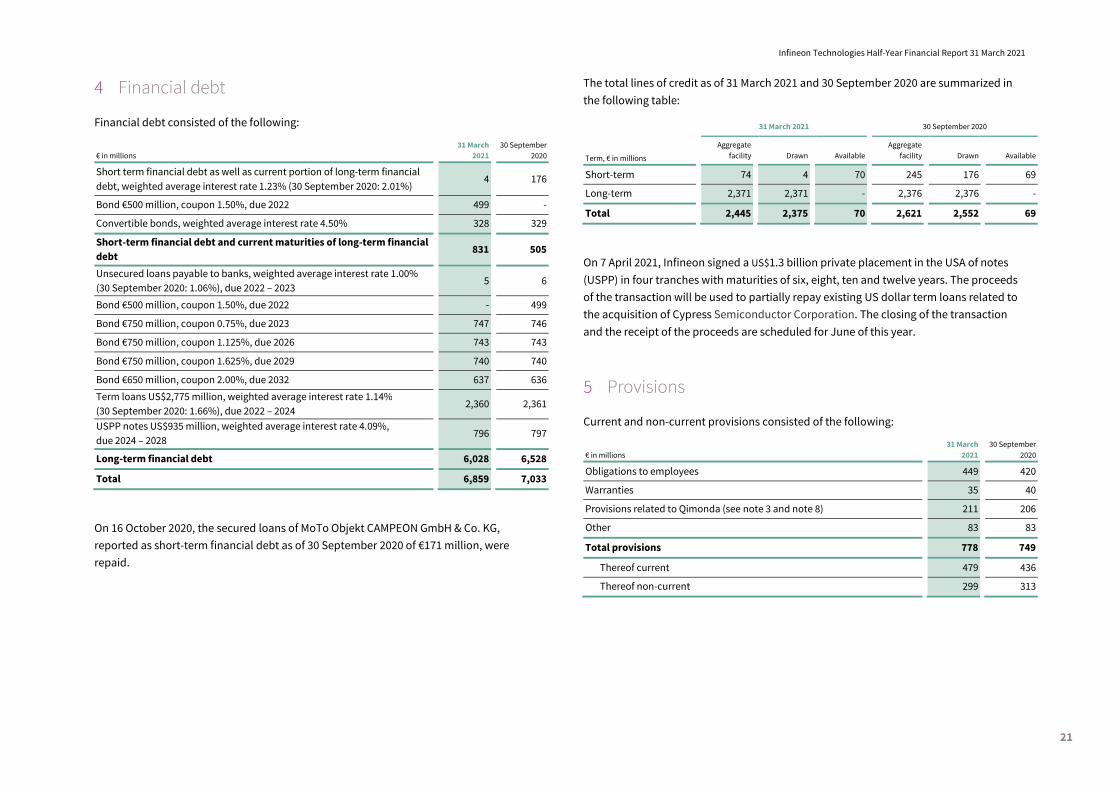
4 Financial debt
Financial debt consisted of the following:
€ in millions 31 March
2021 30 September
2020 Short term financial debt as well as current portion of long-term financial
debt, weighted average interest rate 1.23% (30 September 2020: 2.01%) 4 176
Bond €500 million, coupon 1.50%, due 2022 499 -
Convertible bonds, weighted average interest rate 4.50% 328 329
Short-term financial debt and current maturities of long-term financial
debt 831 505
Unsecured loans payable to banks, weighted average interest rate 1.00%
(30 September 2020: 1.06%), due 2022 – 2023 5 6
Bond €500 million, coupon 1.50%, due 2022 - 499
Bond €750 million, coupon 0.75%, due 2023 747 746
Bond €750 million, coupon 1.125%, due 2026 743 743
Bond €750 million, coupon 1.625%, due 2029 740 740
Bond €650 million, coupon 2.00%, due 2032 637 636 Term loans US$2,775 million, weighted average interest rate 1.14%
(30 September 2020: 1.66%), due 2022 – 2024 2,360 2,361
USPP notes US$935 million, weighted average interest rate 4.09%,
due 2024 – 2028 796 797
Long-term financial debt 6,028 6,528
Total 6,859 7,033
On 16 October 2020, the secured loans of MoTo Objekt CAMPEON GmbH & Co. KG,
reported as short-term financial debt as of 30 September 2020 of €171 million, were
repaid.
The total lines of credit as of 31 March 2021 and 30 September 2020 are summarized in
the following table:
31 March 2021 30 September 2020
Term, € in millions
Aggregate
facility
Drawn
Available Aggregate
facility
Drawn
Available
Short-term 74 4 70 245 176 69
Long-term 2,371 2,371 - 2,376 2,376 -
Total 2,445 2,375 70 2,621 2,552 69
On 7 April 2021, Infineon signed a US$1.3 billion private placement in the USA of notes
(USPP) in four tranches with maturities of six, eight, ten and twelve years. The proceeds
of the transaction will be used to partially repay existing US dollar term loans related to
the acquisition of Cypress Semiconductor Corporation. The closing of the transaction
and the receipt of the proceeds are scheduled for June of this year.
5 Provisions
Current and non-current provisions consisted of the following:
€ in millions 31 March
2021 30 September
2020 Obligations to employees 449 420
Warranties 35 40
Provisions related to Qimonda (see note 3 and note 8) 211 206
Other 83 83
Total provisions 778 749
Thereof current 479 436
Thereof non-current 299 313
Infineon Technologies Half-Year Financial Report 31 March 2021
22
6 Pension plans
Financial market interest rate and credit spread developments in the previous six
months have led to an increase in the discount factor used in the valuation of defined
benefit plans to 1.1 percent as of 31 March 2021 (30 September 2020: 0.9 percent), which
reduces the defined benefit obligation of defined benefit pension plans by €41 million. In
addition, the fair value of domestic plan assets have increased by €36 million. As a result,
pension plan commitments as of 31 March 2021 were adjusted by €71 million (after tax),
which was recorded as an actuarial gain on pension plans and similar commitments in
Other Comprehensive Income.
7 Equity
The ordinary share capital of Infineon Technologies AG amounted to €2,611,842,274 as
of 31 March 2021 (30 September 2020: €2,611,842,274), divided into 1,305,921,137 no par
value registered shares (30 September 2020: 1,305,921,137), each representing €2 of the
Company’s ordinary share capital. As of 31 March 2021, of the above-mentioned total
number of issued shares, the Company held 4,606,673 own shares (30 September 2020:
5,251,391). The change in numbers of own shares is attributable to the transfer of
644,718 own shares to employees and members of the Management Board under the
Performance Share Plan and Restricted Stock Unit Plan (see note 23 to the 2020
Consolidated Financial Statements).
At the Annual General Meeting on 25 February 2021, it was resolved that a dividend of
€0.22 is to be paid for each eligible share out of the distributable profit of Infineon
Technologies AG for the 2020 fiscal year. Taking into account the non-entitlement to a
dividend of own shares, this resulted in a distribution of €286 million. The distribution
for the 2020 fiscal year was paid out of retained earnings.
Infineon Technologies AG issued a perpetual hybrid bond on 1 October 2019 to refinance
the acquisition of Cypress, which is an equity instrument under IAS 32 (see note 21 to the
2020 Consolidated Financial Statements).
For the six months ended 31 March 2021, €20 million was recognized in equity as
compensation to hybrid capital investors. For the purpose of calculating earnings per
share, the net income attributable to the shareholders of Infineon Technologies AG of
€460 million was reduced by the compensation of hybrid capital investors of €16 million
(net of tax) in the six months ended 31 March 2021, to €444 million.
The compensation of the hybrid capital investors is paid annually retrospectively on
1 April of each year, subject to repayment or redemption. On 1 April 2021, €39 million
was paid out.
8 Legal risks
Litigation and government inquiries
Please refer to note 25 to the 2020 Consolidated Financial Statements for a description
of litigation and government inquiries (in particular with respect to “Smart card chips
antitrust litigation” and “Proceedings in relation to Qimonda”), as well as other litigation
and proceedings, and the associated risks.
9 Transactions with related companies and persons
Infineon has transactions in the normal course of business with joint ventures,
associated companies and other related companies (collectively, “related companies”).
Related persons are persons in key management positions, in particular members of the
Management and Supervisory Board and their close relatives (collectively, “related
persons”).
Related companies
Infineon purchases certain raw materials and services from, and sells certain products
and services to related companies. These purchases from and sales to related
companies are generally effected at arm’s length.
Infineon Technologies Half-Year Financial Report 31 March 2021
23
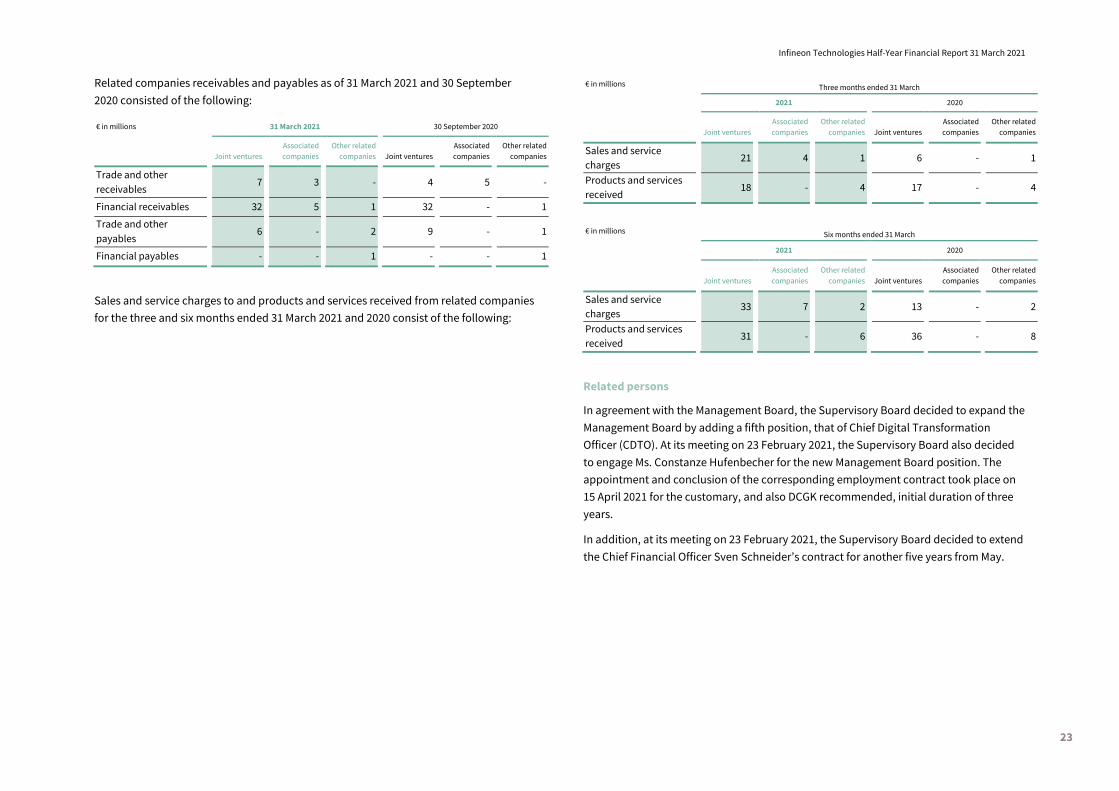
Related companies receivables and payables as of 31 March 2021 and 30 September
2020 consisted of the following:
€ in millions 31 March 2021 30 September 2020
Joint ventures Associated
companies Other related
companies
Joint ventures Associated
companies Other related
companies
Trade and other
receivables 7 3 - 4 5 -
Financial receivables 32 5 1 32 - 1 Trade and other
payables 6 - 2 9 - 1
Financial payables - - 1 - - 1
Sales and service charges to and products and services received from related companies
for the three and six months ended 31 March 2021 and 2020 consist of the following:
€ in millions Three months ended 31 March 2021 2020
Joint ventures Associated
companies Other related
companies
Joint ventures Associated
companies Other related
companies
Sales and service
charges 21 4 1 6 - 1
Products and services
received 18 - 4 17 - 4
€ in millions Six months ended 31 March 2021 2020
Joint ventures Associated
companies Other related
companies
Joint ventures Associated
companies Other related
companies
Sales and service
charges 33 7 2 13 - 2
Products and services
received 31 - 6 36 - 8
Related persons
In agreement with the Management Board, the Supervisory Board decided to expand the
Management Board by adding a fifth position, that of Chief Digital Transformation
Officer (CDTO). At its meeting on 23 February 2021, the Supervisory Board also decided
to engage Ms. Constanze Hufenbecher for the new Management Board position. The
appointment and conclusion of the corresponding employment contract took place on
15 April 2021 for the customary, and also DCGK recommended, initial duration of three
years.
In addition, at its meeting on 23 February 2021, the Supervisory Board decided to extend
the Chief Financial Officer Sven Schneider’s contract for another five years from May.
Infineon Technologies Half-Year Financial Report 31 March 2021
24
The act implementing the Second Shareholders' Rights Directive (ARUG II) came into
force on 1 January 2020. Furthermore, the Government Commission on the German
Corporate Governance Code adopted a new version of the Code (DCGK), which became
effective on 20 March 2020. Both have resulted in new regulatory requirements,
including with respect to Management Board compensation. In this context, the
Supervisory Board decided on a new Management Board compensation system at its
meeting of 20 November 2020. This was approved by the Annual General Meeting on
25 February 2021.
The new remuneration system applies to all Infineon Management Board members who
are appointed to the Management Board after the Supervisory Board’s remuneration
system resolution on 20 November 2020.
For members of the Management Board already in office at this date, the remuneration
system will take effect on 1 October 2021. However, the new regulations relating to the
Long Term Incentive (LTI) and the abolition of the Mid Term Incentive (MTI) will apply for
the allocation of the (virtual) performance shares on 1 April 2021. Existing employment
contracts have been adjusted accordingly.
The Supervisory Board compensation system was also adjusted due to the provisions of
ARUG II. The amendments proposed by the Management Board and the Supervisory
Board were approved by the Annual General Meeting on 25 February 2021. The adjusted
Supervisory Board compensation system will apply from 1 October 2021, effective for
the 2022 fiscal year that begins on that date.
Apart from the above, there were no further transactions between Infineon and related
persons which fall outside of the scope of the existing service or appointment terms in
the three and six months to 31 March 2021.
10 Additional disclosures on financial instruments
The classification of financial instruments in categories according to IFRS 9, the
valuation methods and significant assumptions, are unchanged since 30 September
2020 and are described in detail in note 2 to the 2020 Consolidated Financial
Statements. A detailed overview of Infineon’s financial instruments, financial risk factors
and the management of financial risks is contained in notes 28 and 29 to the 2020
Consolidated Financial Statements.
The coronavirus pandemic and the related measures to contain the virus could continue
to have a direct and indirect effect on Infineon’s financial risks such as foreign exchange
risk, interest rate risk, credit risk as well as liquidity risk and other risks. The course of
the spread of the coronavirus pandemic and the impact on Infineon’s risk position is
continually monitored and is taken into account in the methods, models and processes
used to control financial risks.
In relation to the credit risks associated with financial assets measured at amortized cost
such as bank deposits and trade receivables as well as contract assets, comprehensive
credit checks on business partners, the setting of credit limits and monitoring processes
reflect the current situation. When determining the expected credit losses to be
recognized, Infineon takes into account all relevant information that is on the one hand
currently available without undue cost or time and, on the other hand, appropriate and
robust. These include ratings, credit default swap premiums, the analysis of balance
sheet ratios and customers’ payment behavior, as well as country-specific risks.
Individual allowances are recorded where required based on case-by-case facts or other
risk indicators. Developments in the wake of the coronavirus pandemic are very
dynamic, so it cannot be ruled out that the actual credit losses deviate significantly from
the expected credit losses recognized based on current estimates and assumptions, or
that the affected estimates and assumptions will have to be adjusted in future periods
and this could have a significant impact on Infineon’s expected credit losses. Further
possible longer-term effects on Infineon as a consequence of the spread of the
coronavirus and the associated volatility in the financial markets are currently not
assessable.
With respect to financial instruments measured at fair value through profit and loss,
depending on the further development of the coronavirus pandemic, larger fluctuations
in fair values could arise, which could result in a corresponding volatility within the
Consolidated Statement of Profit or Loss or the Consolidated Statement of Financial
Position.

Infineon Technologies Half-Year Financial Report 31 March 2021
25
Financial instruments measured at fair value are allocated to the following fair value
measurement levels in accordance with IFRS 13. The allocation to the different levels is
based on the market proximity of the valuation parameters used in the determination of
the fair value:
› Level 1: quoted prices (unadjusted) in active markets for identical assets and
liabilities,
› Level 2: valuation parameters whose prices are not those considered in Level 1, but
which can be observed either directly or indirectly for the assets or liabilities
concerned,
› Level 3: valuation parameters for assets and liabilities, which are not based on
observable market data.
The division into levels as of 31 March 2021 and 30 September 2020 was as follows:
Fair value Fair value by category
€ in millions Level 1 Level 2 Level 3
31 March 2021
Current assets:
Cash and cash equivalents 1,520 1,520 - -
Financial investments 810 810 - -
Other current assets 1 - 1 -
Non-current assets:
Other non-current assets 110 90 3 17
Total 2,441 2,420 4 17
Current liabilities:
Short-term financial debt and current portion
of long-term financial debt 141 - 141 -
Other current liabilities 8 - 8 -
Total 149 - 149 -
30 September 2020
Current assets:
Cash and cash equivalents 1,524 1,524 - -
Financial investments 777 777 - -
Other current assets 3 - 3 -
Non-current assets:
Other non-current assets 98 81 - 17
Total 2,402 2,382 3 17
Current liabilities:
Short-term financial debt and current portion
of long-term financial debt 139 - 139 -
Other current liabilities 68 - 68 -
Total 207 - 207 -
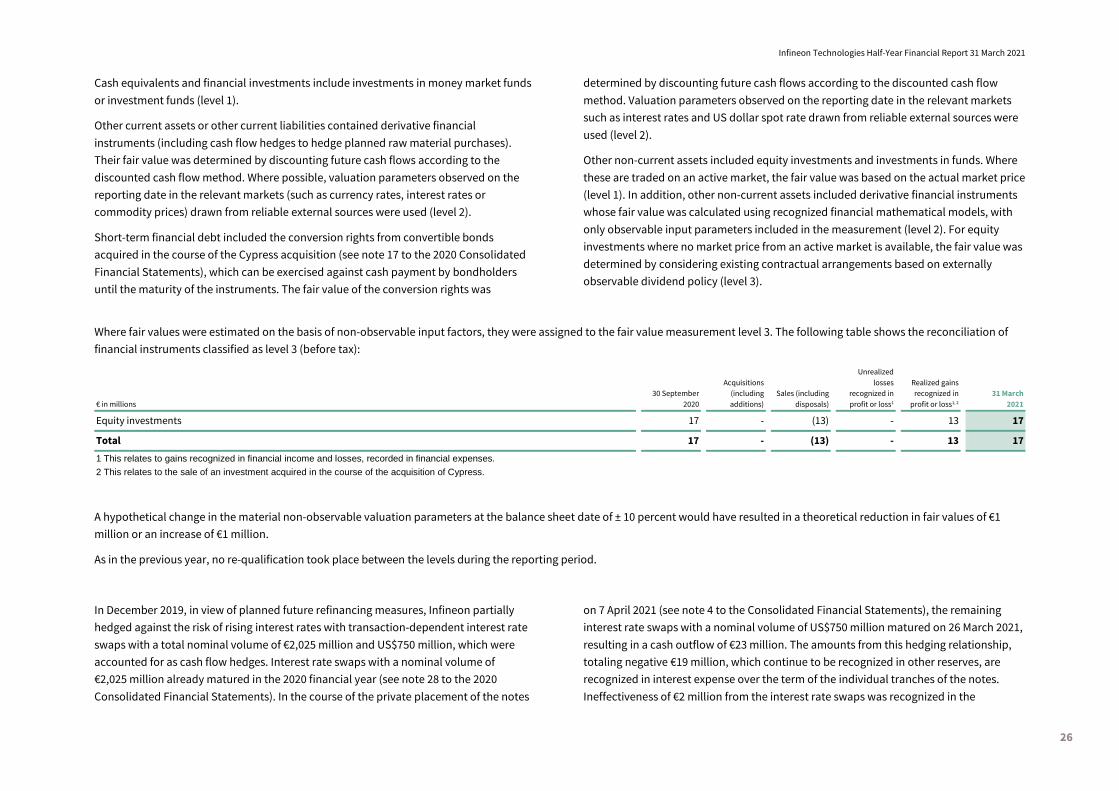
Infineon Technologies Half-Year Financial Report 31 March 2021
26
Cash equivalents and financial investments include investments in money market funds
or investment funds (level 1).
Other current assets or other current liabilities contained derivative financial
instruments (including cash flow hedges to hedge planned raw material purchases).
Their fair value was determined by discounting future cash flows according to the
discounted cash flow method. Where possible, valuation parameters observed on the
reporting date in the relevant markets (such as currency rates, interest rates or
commodity prices) drawn from reliable external sources were used (level 2).
Short-term financial debt included the conversion rights from convertible bonds
acquired in the course of the Cypress acquisition (see note 17 to the 2020 Consolidated
Financial Statements), which can be exercised against cash payment by bondholders
until the maturity of the instruments. The fair value of the conversion rights was
determined by discounting future cash flows according to the discounted cash flow
method. Valuation parameters observed on the reporting date in the relevant markets
such as interest rates and US dollar spot rate drawn from reliable external sources were
used (level 2).
Other non-current assets included equity investments and investments in funds. Where
these are traded on an active market, the fair value was based on the actual market price
(level 1). In addition, other non-current assets included derivative financial instruments
whose fair value was calculated using recognized financial mathematical models, with
only observable input parameters included in the measurement (level 2). For equity
investments where no market price from an active market is available, the fair value was
determined by considering existing contractual arrangements based on externally
observable dividend policy (level 3).
Where fair values were estimated on the basis of non-observable input factors, they were assigned to the fair value measurement level 3. The following table shows the reconciliation of
financial instruments classified as level 3 (before tax):
€ in millions
30 September
2020
Acquisitions
(including
additions)
Sales (including
disposals)
Unrealized
losses
recognized in
profit or loss1
Realized gains
recognized in
profit or loss1, 2
31 March
2021 Equity investments 17 - (13) - 13 17
Total 17 - (13) - 13 17 1 This relates to gains recognized in financial income and losses, recorded in financial expenses. 2 This relates to the sale of an investment acquired in the course of the acquisition of Cypress.
A hypothetical change in the material non-observable valuation parameters at the balance sheet date of ± 10 percent would have resulted in a theoretical reduction in fair values of €1
million or an increase of €1 million.
As in the previous year, no re-qualification took place between the levels during the reporting period.
In December 2019, in view of planned future refinancing measures, Infineon partially
hedged against the risk of rising interest rates with transaction-dependent interest rate
swaps with a total nominal volume of €2,025 million and US$750 million, which were
accounted for as cash flow hedges. Interest rate swaps with a nominal volume of
€2,025 million already matured in the 2020 financial year (see note 28 to the 2020
Consolidated Financial Statements). In the course of the private placement of the notes
on 7 April 2021 (see note 4 to the Consolidated Financial Statements), the remaining
interest rate swaps with a nominal volume of US$750 million matured on 26 March 2021,
resulting in a cash outflow of €23 million. The amounts from this hedging relationship,
totaling negative €19 million, which continue to be recognized in other reserves, are
recognized in interest expense over the term of the individual tranches of the notes.
Ineffectiveness of €2 million from the interest rate swaps was recognized in the
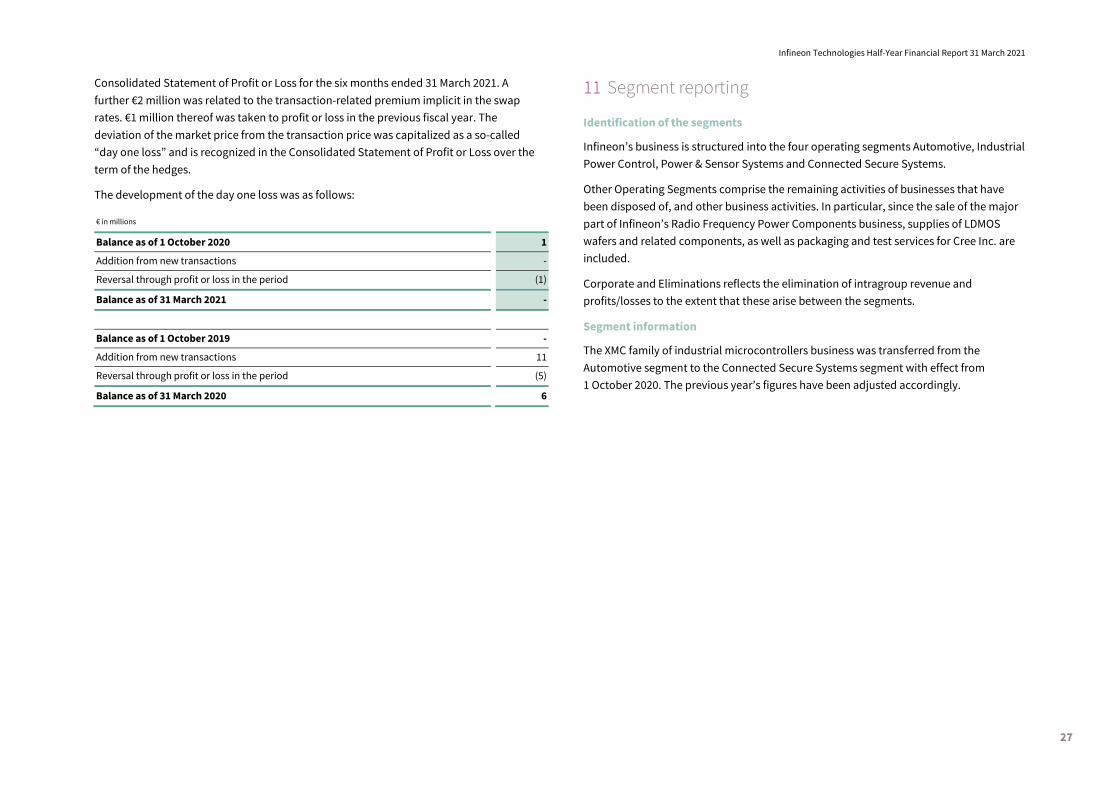
Infineon Technologies Half-Year Financial Report 31 March 2021
27
Consolidated Statement of Profit or Loss for the six months ended 31 March 2021. A
further €2 million was related to the transaction-related premium implicit in the swap
rates. €1 million thereof was taken to profit or loss in the previous fiscal year. The
deviation of the market price from the transaction price was capitalized as a so-called
“day one loss” and is recognized in the Consolidated Statement of Profit or Loss over the
term of the hedges.
The development of the day one loss was as follows:
€ in millions
Balance as of 1 October 2020 1
Addition from new transactions -
Reversal through profit or loss in the period (1)
Balance as of 31 March 2021 -
Balance as of 1 October 2019 -
Addition from new transactions 11
Reversal through profit or loss in the period (5)
Balance as of 31 March 2020 6
11 Segment reporting
Identification of the segments
Infineon’s business is structured into the four operating segments Automotive, Industrial
Power Control, Power & Sensor Systems and Connected Secure Systems.
Other Operating Segments comprise the remaining activities of businesses that have
been disposed of, and other business activities. In particular, since the sale of the major
part of Infineon’s Radio Frequency Power Components business, supplies of LDMOS
wafers and related components, as well as packaging and test services for Cree Inc. are
included.
Corporate and Eliminations reflects the elimination of intragroup revenue and
profits/losses to the extent that these arise between the segments.
Segment information
The XMC family of industrial microcontrollers business was transferred from the
Automotive segment to the Connected Secure Systems segment with effect from
1 October 2020. The previous year’s figures have been adjusted accordingly.
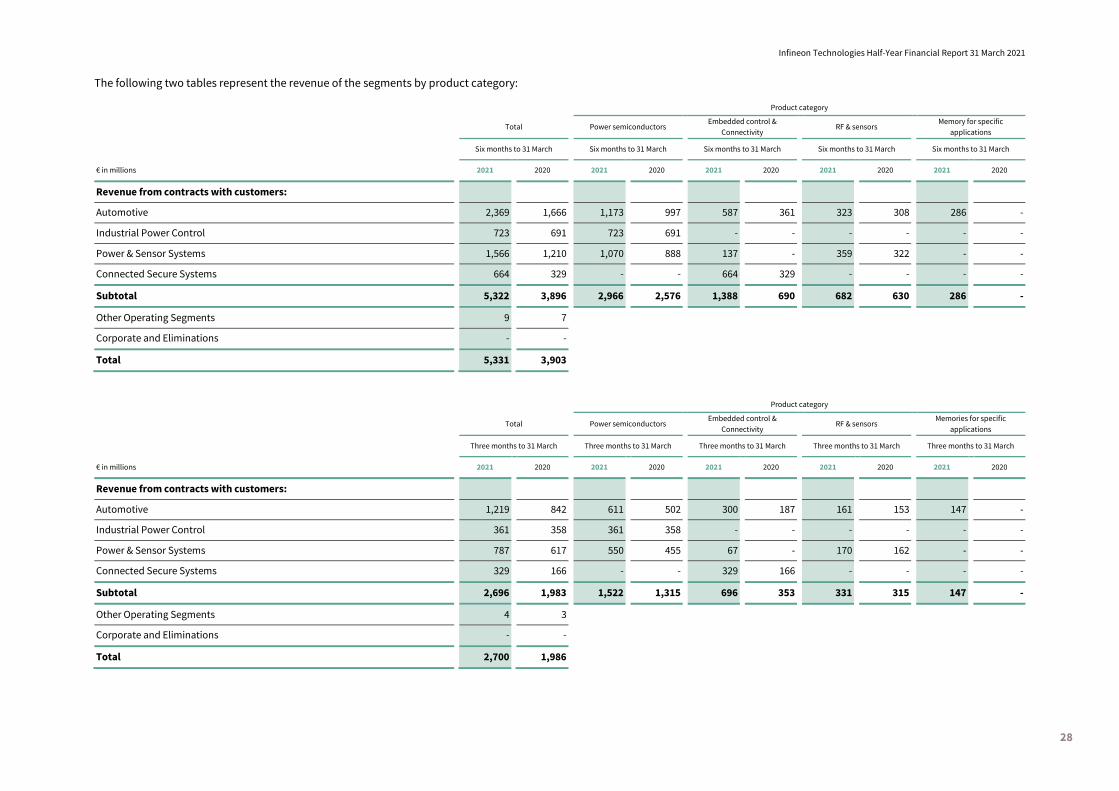
Infineon Technologies Half-Year Financial Report 31 March 2021
28
The following two tables represent the revenue of the segments by product category:
Product category
Total Power semiconductors Embedded control &
Connectivity RF & sensors Memory for specific
applications Six months to 31 March Six months to 31 March Six months to 31 March Six months to 31 March Six months to 31 March
€ in millions 2021 2020 2021 2020 2021 2020 2021 2020 2021 2020
Revenue from contracts with customers:
Automotive 2,369 1,666 1,173 997 587 361 323 308 286 -
Industrial Power Control 723 691 723 691 - - - - - -
Power & Sensor Systems 1,566 1,210 1,070 888 137 - 359 322 - -
Connected Secure Systems 664 329 - - 664 329 - - - -
Subtotal 5,322 3,896 2,966 2,576 1,388 690 682 630 286 -
Other Operating Segments 9 7
Corporate and Eliminations - -
Total 5,331 3,903
Product category
Total Power semiconductors Embedded control &
Connectivity RF & sensors Memories for specific
applications Three months to 31 March Three months to 31 March Three months to 31 March Three months to 31 March Three months to 31 March
€ in millions 2021 2020 2021 2020 2021 2020 2021 2020 2021 2020
Revenue from contracts with customers:
Automotive 1,219 842 611 502 300 187 161 153 147 -
Industrial Power Control 361 358 361 358 - - - - - -
Power & Sensor Systems 787 617 550 455 67 - 170 162 - -
Connected Secure Systems 329 166 - - 329 166 - - - -
Subtotal 2,696 1,983 1,522 1,315 696 353 331 315 147 -
Other Operating Segments 4 3
Corporate and Eliminations - -
Total 2,700 1,986

Infineon Technologies Half-Year Financial Report 31 March 2021
29
€ in millions 31 March 2021 30 September 2020
Inventories:
Automotive 894 975
Industrial Power Control 226 251
Power & Sensor Systems 479 449
Connected Secure Systems 142 190
Other Operating Segments 1 3
Corporate and Eliminations 195 184
Total 1,937 2,052
Three months to 31 March Six months to 31 March € in millions 2021 2020 2021 2020
Segment result:
Automotive 197 49 381 115
Industrial Power Control 59 62 121 124
Power & Sensor Systems 184 138 381 284
Connected Secure Systems 30 25 75 49
Other Operating Segments - - 2 -
Corporate and Eliminations - - - (1)
Total 470 274 960 571
The following table provides the reconciliation of Segment Result to income from
continuing operations before income taxes:
Three months to 31 March Six months to 31 March
€ in millions 2021 2020 2021 2020
Segment result 470 274 960 571
Plus/minus:
Impairments net of reversals
(especially goodwill) - - (8) -
Share-based compensation (3) (3) (6) (6) Acquisition-related
depreciation/amortization and other
expenses (148) (26) (285) (59)
Gains (losses) on sales of businesses,
or interests in subsidiaries, net - - - 1
Other income and expense, net (5) (19) (15) (15)
Operating income 314 226 646 492
Financial income - 5 18 9
Financial expenses (42) (32) (85) (49) Gain from investments accounted for
using the equity method (1) - (3) -
Income from continuing operations
before income taxes 271 199 576 452
Of the €148 million “acquisition-related depreciation/amortization and other expenses”
incurred in the three months ended 31 March 2021, €84 million were attributable to cost
of goods sold, €3 million to research and development expenses, €54 million to selling,
general and administrative expenses and €7 million to other operating income/expense.
Of the €285 million “acquisition-related depreciation/amortization and other expenses”
incurred in the six months ended 31 March 2021, €152 million were attributable to cost
of goods sold, €9 million to research and development expenses, €115 million to selling,
general and administrative expenses and €9 million to other operating income/expense.
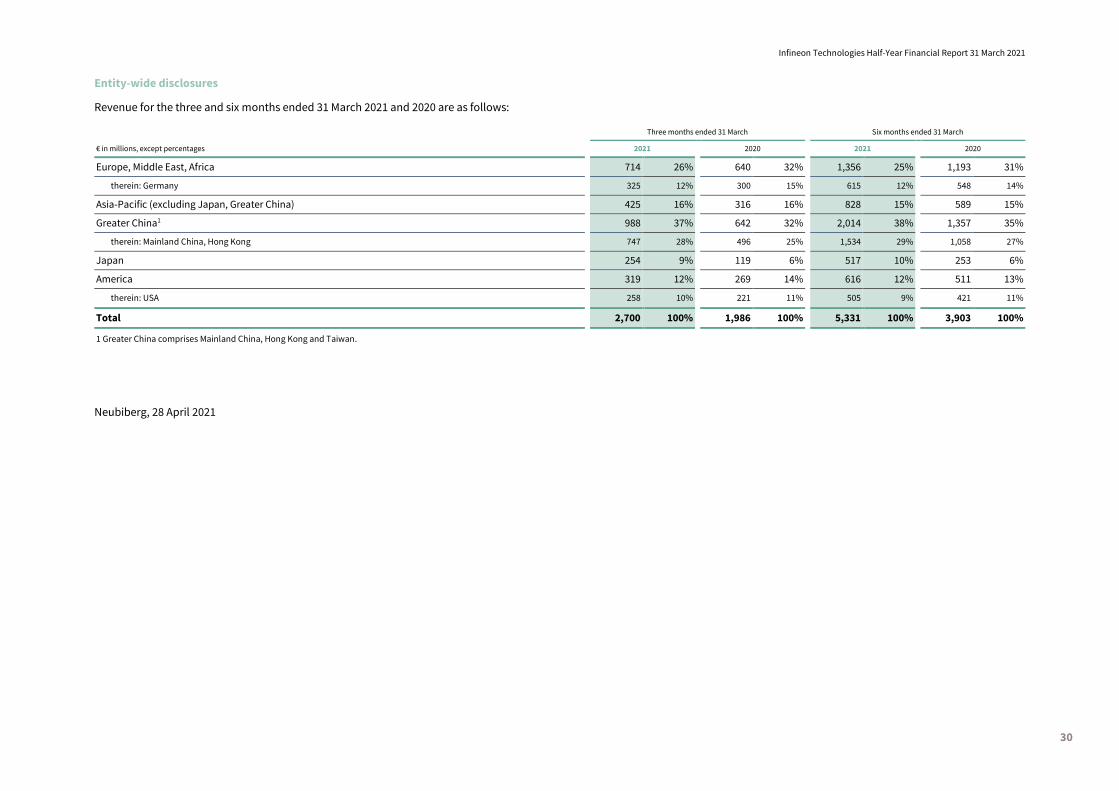
Infineon Technologies Half-Year Financial Report 31 March 2021
30
Entity-wide disclosures
Revenue for the three and six months ended 31 March 2021 and 2020 are as follows:
Three months ended 31 March Six months ended 31 March € in millions, except percentages 2021 2020 2021 2020
Europe, Middle East, Africa 714 26% 640 32% 1,356 25% 1,193 31% therein: Germany 325 12% 300 15% 615 12% 548 14%
Asia-Pacific (excluding Japan, Greater China) 425 16% 316 16% 828 15% 589 15%
Greater China1 988 37% 642 32% 2,014 38% 1,357 35% therein: Mainland China, Hong Kong 747 28% 496 25% 1,534 29% 1,058 27%
Japan 254 9% 119 6% 517 10% 253 6%
America 319 12% 269 14% 616 12% 511 13%
therein: USA 258 10% 221 11% 505 9% 421 11%
Total 2,700 100% 1,986 100% 5,331 100% 3,903 100%
1 Greater China comprises Mainland China, Hong Kong and Taiwan.
Neubiberg, 28 April 2021
Infineon Technologies Half-Year Financial Report 31 March 2021
31
Responsibility Statement by the
Management Board
To the best of our knowledge, and in accordance with the applicable reporting principles
for interim financial reporting, the condensed Consolidated Interim Financial
Statements give a true and fair view of the assets, liabilities, financial position and profit
or loss of the Group, and the Interim Group Management Report includes a fair review of
the development and performance of the business and the position of the Group,
together with a description of the principal opportunities and risks associated with the
expected development of the Group for the remaining months of the fiscal year.
Neubiberg, 3 May 2021
Dr. Reinhard Ploss Dr. Sven Schneider
Dr. Helmut Gassel Jochen Hanebeck Constanze Hufenbecher
Infineon Technologies Half-Year Financial Report 31 March 2021
32
Review Report
To Infineon Technologies AG, Neubiberg
We have reviewed the condensed interim consolidated financial statements of the
Infineon Technologies AG, Neubiberg – comprising statement of profit or loss, statement
of comprehensive income, statement of financial position, statement of cash flow,
statement of changes in equity and selected explanatory notes – together with the
interim group management report of the Infineon Technologies AG, Neubiberg, for the
period from 1 October 2020 to 31 March 2021 that are part of the semiannual financial
report according to § 115 WpHG [“Wertpapierhandelsgesetz“: “German Securities
Trading Act”]. The preparation of the condensed interim consolidated financial
statements in accordance with International Accounting Standard IAS 34 “Interim
Financial Reporting” as adopted by the EU, and of the interim group management report
in accordance with the requirements of the WpHG applicable to interim group
management reports, is the responsibility of the Company’s management. Our
responsibility is to issue a report on the condensed interim consolidated financial
statements and on the interim group management report based on our review.
We performed our review of the condensed interim consolidated financial statements
and the interim group management report in accordance with the German generally
accepted standards for the review of financial statements promulgated by the Institut
der Wirtschaftsprüfer (IDW). Those standards require that we plan and perform the
review so that we can preclude through critical evaluation, with a certain level of
assurance, that the condensed interim consolidated financial statements have not been
prepared, in material respects, in accordance with IAS 34, “Interim Financial Reporting”
as adopted by the EU, and that the interim group management report has not been
prepared, in material respects, in accordance with the requirements of the WpHG
applicable to interim group management reports. A review is limited primarily to
inquiries of company employees and analytical assessments and therefore does not
provide the assurance attainable in a financial statement audit. Since, in accordance
with our engagement, we have not performed a financial statement audit, we cannot
issue an auditor’s report.
Based on our review, no matters have come to our attention that cause us to presume
that the condensed interim consolidated financial statements have not been prepared,
in material respects, in accordance with IAS 34, “Interim Financial Reporting” as adopted
by the EU, or that the interim group management report has not been prepared, in
material respects, in accordance with the requirements of the WpHG applicable to
interim group management reports.
Munich, 3 May 2021
KPMG AG
Wirtschaftsprüfungsgesellschaft
(Original German version signed by:)
Andrejewski Pritzer
Wirtschaftsprüfer Wirtschaftsprüfer

Infineon Technologies Half-Year Financial Report 31 March 2021
33
Supplementary Information
Forward-looking Statements
This Half-Year Financial Report contains forward-looking statements about the business,
financial condition and earnings performance of Infineon.
These statements are based on assumptions and projections resting upon currently
available information and present estimates. They are subject to a multitude of
uncertainties and risks. Actual business development may therefore differ materially
from what has been expected.
Beyond disclosure requirements stipulated by law, Infineon does not undertake any
obligation to update forward-looking statements.
Financial Calendar
Tuesday, 3 August 2021¹
Publication of third quarter 2021 results
Wednesday, 10 November 2021¹
Publication of fourth quarter and fiscal year 2021 results
1 preliminary
Publication date of half-year financial report as of 31 March 2021: 5 May 2021
Contact information
Infineon Technologies AG
Investor Relations
Am Campeon 1-15
85579 Neubiberg near Munich, Germany
Phone: +49 89 234-26655
Fax: +49 89 234-9552987
E-Mail: [email protected]
Visit http://www.infineon.com/investor for an electronic version of this report and other
information.

Published by Infineon Technologies AGAm Campeon 1– 15, 85579 Neubiberg near Munich (Germany)