Embed Size (px)
Citation preview

Lendlease Corporation Limited ABN 32 000 226 228 andLendlease Responsible Entity Limited ABN 72 122 883 185 AFS Licence 308983as responsible entity for Lendlease Trust ABN 39 944 184 773 ARSN 128 052 595
Level 14, Tower Three, International Towers Sydney Telephone +61 2 9236 6111Exchange Place, 300 Barangaroo Avenue Facsimile +61 2 9252 2192Barangaroo NSW 2000 Australia lendlease.com
Lendlease Group 2021 Half Year Financial and Operational MetricsLendlease Group today announced its results for the half year ended 31 December 2020. Attachedis a data file comprising financial and operational metrics covering FY17 – HY21.
An excel file containing the data is available at: www.lendlease.com/investor-centre
The data contained in the excel file is attached to this ASX in PDF format.
ENDS
For further information, please contact:
Investors: Media:Justin McCarthy Stephen EllawayMob: +61 422 800 321 Mob: +61 417 851 287
Authorised for lodgement by the Lendlease Group Disclosure Committee
22 February 2021

Core BusinessFY17 FY18 FY19 FY20 1H21
UnitProfit and Loss Summary - Core Business
Revenue A$m 14,382.6 13,287.9 13,414 10,405 4,376
Segment EBITDADevelopment A$m 552.4 673.2 793 322 244Construction A$m 271.4 295.8 211 101 104Investments1 A$m 433.3 368.9 278 300 121
Total Segment EBITDA1 A$m 1,257.1 1,337.9 1,282 723 469
Group Services A$m (154.4) (140.1) (140) (129) (54)Group Treasury A$m (29.8) (35.4) (25) (29) (10)Operating EBITDA1 A$m 1,072.9 1,162.4 1,117 565 405Depreciation & Amortisation A$m (76.5) (82.1) (94) (160) (75)Operating EBIT1 A$m 996.4 1,080.3 1,023 405 330Net Finance Revenue/(Costs) A$m (97.0) (72.5) (125) (153) (67)Operating PBT1 A$m 899.4 1,007.8 898 252 263Income Tax Benefit/(Expense)1 A$m (234.6) (298.9) (266) (46) (58)External non controlling interests A$m (0.1) (0.8) - - -Operating PAT1 A$m 664.7 708.1 632 206 205
Reconciliation Operating to Statutory Profit after Tax1
Core Operating Profit After Tax A$m 664.7 708.1 632 206 205Add / (less): Investment properties revaluations A$m (5.0) 5.0 25 (19) -Add / (less): Financial assets revaluations A$m 54.0 225.0 100 (10) 5Add / (less): Equity accounted investments revaluations A$m 12.0 22.0 47 (72) (12)Add / (less): Impairment losses relating to intangibles A$m - - - (9) -
Total Non Operating Items (post-tax) A$m 61.0 252.0 172 (110) (7)Non Core Profit after Tax A$m 32.9 (167.3) (337) (406) (2)NPAT attributable to securityholders A$m 758.6 792.8 467 (310) 196
Returns and Key Performance Measures - Core Business1
Number of equivalent full time employees no. 8,801 8,854 8,787 8,398 8,054
(EPS) Core Operating Earnings per stapled security1,2 cents 121.4 111.5 34.2 29.8
(ROE) Core Operating PAT to average securityholders' equity1 % 11.3% 10.1% 3.1% 5.9%
Development ROIC % 13.7% 13.4% 11.6% 4.7% 7.2%Investments ROIC1 % 9.8% 7.6% 5.7% 5.8% 5.3%Construction EBITDA Margin % 2.6% 3.1% 2.2% 1.3% 3.0%
EBITDA Mix by Segment - % Operating EBITDADevelopment1 % 44% 50% 62% 45% 52%Construction1 % 22% 22% 16% 14% 22%Investments1 % 34% 28% 22% 41% 26%
Key Platform Value DriversDevelopment Pipeline A$b 49.3 71.1 76.1 113.0 109.5Construction Backlog A$b 15.7 15.2 15.6 13.9 14.5Funds Under Management A$b 26.1 30.1 35.2 36.0 37.9
Invested Capital by Segment & RegionDevelopment A$b 3.0 4.3 4.8 4.8 5.0Investments A$b 3.3 3.3 3.6 3.7 3.6
Australia A$b 4.7 4.4 3.6 3.4 4.0Asia A$b 0.7 0.9 1.2 1.4 1.3Europe A$b 0.8 1.2 1.7 1.8 2.1Americas A$b 0.5 1.0 1.4 1.5 1.2
Total Invested Capital3 A$b 7.0 7.6 7.8 8.2 8.8
End of sheet

Group SummaryFY17 FY18 FY19 FY20 1H21
UnitReturns and Key Performance Measures - Total Group
NPAT attributable to securityholders A$m 758.6 792.8 467 (310) 196(EPS) Earnings per stapled security on PAT3 cents 130.1 136.1 82.4 (51.4) 28.5Distribution per stapled security cents 66.0 69.0 42.0 33.3 15.0Distribution Payout ratio4 % 51% 50% 51% 50%
Securities on issue m 583 574 564 688 688Weighted average number of securities5 m 583 583 567 603 688Net asset backing per security A$ 10.58 11.17 11.27 10.08 10.14Net tangible asset backing per security A$ 8.15 8.70 8.69 7.96 8.05Security price at period end A$ 16.65 19.81 13.00 12.37 13.10
Number of securityholders no. 58,642 55,648 62,454 66,161 68,673
Effective Tax Rate6 % 24.7% 25.6% 24.7% 20.0%
FX RatesIncome Statement - Period AverageUSD A$/USD 0.76 0.77 0.71 0.67 0.73GBP A$/GBP 0.60 0.57 0.55 0.53 0.55SGD A$/SGD 1.05 1.04 0.97 0.93 0.99
Balance Sheet - Period EndUSD A$/USD 0.77 0.74 0.70 0.69 0.77GBP A$/GBP 0.59 0.56 0.55 0.56 0.56SGD A$/SGD 1.06 1.01 0.95 0.96 1.02
Corporate Strength - Total Group
Total tangible assets A$m 19,439.1 15,542.2 15,721 16,291 15,019Cash A$m 1,249.2 1,177.1 1,290 1,111 899Borrowings A$m 2,152.4 2,358.5 2,715 2,395 2,718
Operating cash flow A$m 146.0 72.8 60 137 (539)Investing cash flow A$m 70.1 221.8 167 (369) (499)Total Operating and Investing cash flow A$m 216.1 294.6 227 (232) (1,038)Financing cash flow A$m 8.5 (397.8) (128) 495 366Total cash flow A$m 224.6 (103.2) 99 263 (672)
Ratio of current assets to current liabilities times 0.6x 1.0x 0.9x 1.1x 0.9xRatio of current assets to current liabilities (excluding resident and accommodation bond liabilities) times 1.0x 1.0x 0.9x 1.1x 0.9xNet debt to total tangible assets, less cash7 % 5.0% 8.2% 9.9% 5.7% 12.9%
Interest cover8 times 10.3x 10.7x 8.8x 2.8x 6.7xAverage cost of debt % 4.9% 4.8% 4.0% 3.4% 3.3%Average debt maturity years 5.1 4.6 4.8 4.2 4.3

Group SummaryFY17 FY18 FY19 FY20 1H21
UnitBalance Sheet - Total Group
Statement of Financial PositionCurrent AssetsCash and cash equivalents A$m 1,249.2 1,177.1 1,290 1,111 899Loans and receivables A$m 2,749.2 2,670.2 2,050 1,667 1,638Inventories A$m 2,152.0 2,369.2 2,238 2,256 2,334Current tax assets A$m - - 11 27 21Other financial assets A$m 33.0 6.7 97 16 22Other assets A$m 77.9 91.0 70 59 144Disposal Group assets held for sale A$m 841 -Total current assets A$m 6,261.3 6,314.2 5,756 5,977 5,058
Non Current AssetsLoans and receivables A$m 507.7 787.8 688 744 966Inventories A$m 2,975.4 3,177.1 3,345 3,113 2,844Equity accounted investments A$m 834.6 2,626.6 3,452 3,671 3,716Investment properties A$m 6,967.4 278.2 501 658 419Other financial assets A$m 1,203.3 1,547.8 1,103 1,076 1,024Deferred tax assets A$m 129.4 120.0 101 141 105Property, plant and equipment A$m 425.8 464.7 548 693 641Intangible assets A$m 1,415.1 1,421.4 1,457 1,457 1,436Defined benefit plan asset A$m 64.3 154.7 140 156 190Other assets A$m 69.9 71.1 87 62 56Total non current assets A$m 14,592.9 10,649.4 11,422 11,771 11,397Total assets A$m 20,854.2 16,963.6 17,178 17,748 16,455
Current LiabilitiesTrade and other payables A$m 5,578.8 5,769.5 5,724 4,496 4,382Resident liabilities A$m 4,573.0 - - - -Provisions A$m 285.6 329.9 332 343 336Current tax liabilities A$m 6.4 10.4 - - -Borrowings and financing arrangements A$m 291.9 474.8 225 134 535Other financial liabilities A$m 22.0 3.4 6 10 11Disposal Group liabilities held for sale A$m 670 -Total current liabilities A$m 10,757.7 6,588.0 6,287 5,653 5,264
Non Current LiabilitiesTrade and other payables A$m 1,772.1 1,530.7 1,401 2,405 1,587Provisions A$m 58.4 67.8 45 62 63Borrowings and financing arrangements A$m 1,860.5 1,883.7 2,490 2,261 2,183Defined benefit plan liability A$m - - - - -Other financial liabilities A$m 0.8 0.7 1 1 6Deferred tax liabilities A$m 238.2 478.5 597 434 376Total non current liabilities A$m 3,930.0 3,961.4 4,534 5,163 4,215Total liabilities A$m 14,687.7 10,549.4 10,821 10,816 9,479Net Assets A$m 6,166.5 6,414.2 6,357 6,932 6,976
EquityIssued capital A$m 1,289.8 1,296.8 1,300 1,889 1,890Treasury securities A$m (24.7) (44.1) (68) (68) (69)Reserves9 A$m (15.5) 61.0 105 65 (65)Retained earnings9 A$m 3,696.8 3,855.1 3,815 3,265 3,452Total equity attributable to members of Lendlease Corporation Limited A$m 4,946.4 5,168.8 5,152 5,151 5,208Total equity attributable to unitholders of Lendlease Trust A$m 1,117.0 1,244.5 1,182 1,756 1,745Total equity attributable to securityholders A$m 6,063.4 6,413.3 6,334 6,907 6,953External non controlling interests A$m 103.1 0.9 23 25 23Total equity A$m 6,166.5 6,414.2 6,357 6,932 6,976
Group SummaryFY17 FY18 FY19 FY20 1H21
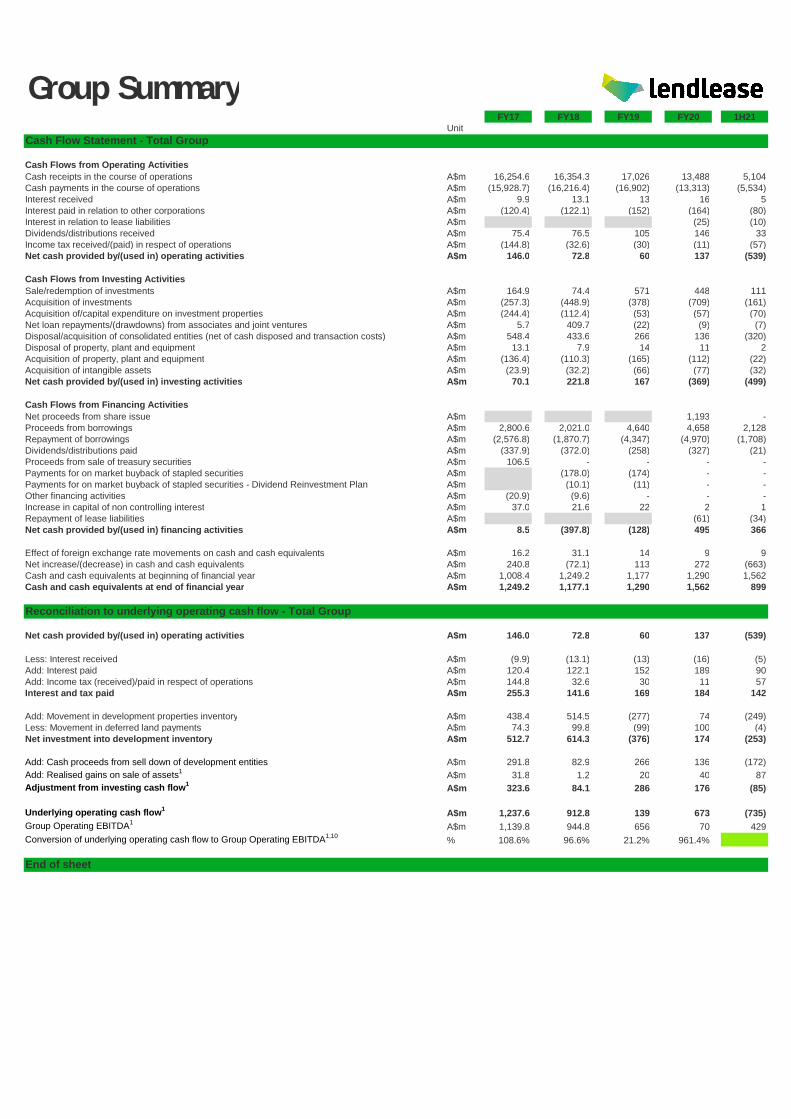
UnitCash Flow Statement - Total Group
Cash Flows from Operating ActivitiesCash receipts in the course of operations A$m 16,254.6 16,354.3 17,026 13,488 5,104Cash payments in the course of operations A$m (15,928.7) (16,216.4) (16,902) (13,313) (5,534)Interest received A$m 9.9 13.1 13 16 5Interest paid in relation to other corporations A$m (120.4) (122.1) (152) (164) (80)Interest in relation to lease liabilities A$m (25) (10)Dividends/distributions received A$m 75.4 76.5 105 146 33Income tax received/(paid) in respect of operations A$m (144.8) (32.6) (30) (11) (57)Net cash provided by/(used in) operating activities A$m 146.0 72.8 60 137 (539)
Cash Flows from Investing ActivitiesSale/redemption of investments A$m 164.9 74.4 571 448 111Acquisition of investments A$m (257.3) (448.9) (378) (709) (161)Acquisition of/capital expenditure on investment properties A$m (244.4) (112.4) (53) (57) (70)Net loan repayments/(drawdowns) from associates and joint ventures A$m 5.7 409.7 (22) (9) (7)Disposal/acquisition of consolidated entities (net of cash disposed and transaction costs) A$m 548.4 433.6 266 136 (320)Disposal of property, plant and equipment A$m 13.1 7.9 14 11 2Acquisition of property, plant and equipment A$m (136.4) (110.3) (165) (112) (22)Acquisition of intangible assets A$m (23.9) (32.2) (66) (77) (32)Net cash provided by/(used in) investing activities A$m 70.1 221.8 167 (369) (499)
Cash Flows from Financing ActivitiesNet proceeds from share issue A$m 1,193 -Proceeds from borrowings A$m 2,800.6 2,021.0 4,640 4,658 2,128Repayment of borrowings A$m (2,576.8) (1,870.7) (4,347) (4,970) (1,708)Dividends/distributions paid A$m (337.9) (372.0) (258) (327) (21)Proceeds from sale of treasury securities A$m 106.5 - - - -Payments for on market buyback of stapled securities A$m (178.0) (174) - -Payments for on market buyback of stapled securities - Dividend Reinvestment Plan A$m (10.1) (11) - -Other financing activities A$m (20.9) (9.6) - - -Increase in capital of non controlling interest A$m 37.0 21.6 22 2 1Repayment of lease liabilities A$m (61) (34)Net cash provided by/(used in) financing activities A$m 8.5 (397.8) (128) 495 366
Effect of foreign exchange rate movements on cash and cash equivalents A$m 16.2 31.1 14 9 9Net increase/(decrease) in cash and cash equivalents A$m 240.8 (72.1) 113 272 (663)Cash and cash equivalents at beginning of financial year A$m 1,008.4 1,249.2 1,177 1,290 1,562Cash and cash equivalents at end of financial year A$m 1,249.2 1,177.1 1,290 1,562 899
Reconciliation to underlying operating cash flow - Total Group
Net cash provided by/(used in) operating activities A$m 146.0 72.8 60 137 (539)
Less: Interest received A$m (9.9) (13.1) (13) (16) (5)Add: Interest paid A$m 120.4 122.1 152 189 90Add: Income tax (received)/paid in respect of operations A$m 144.8 32.6 30 11 57Interest and tax paid A$m 255.3 141.6 169 184 142
Add: Movement in development properties inventory A$m 438.4 514.5 (277) 74 (249)Less: Movement in deferred land payments A$m 74.3 99.8 (99) 100 (4)Net investment into development inventory A$m 512.7 614.3 (376) 174 (253)
Add: Cash proceeds from sell down of development entities A$m 291.8 82.9 266 136 (172)Add: Realised gains on sale of assets1 A$m 31.8 1.2 20 40 87Adjustment from investing cash flow1 A$m 323.6 84.1 286 176 (85)
Underlying operating cash flow1 A$m 1,237.6 912.8 139 673 (735)Group Operating EBITDA1 A$m 1,139.8 944.8 656 70 429Conversion of underlying operating cash flow to Group Operating EBITDA1,10 % 108.6% 96.6% 21.2% 961.4%
End of sheet

Non CoreFY17 FY18 FY19 FY20 1H21
UnitProfit and Loss Summary - Non Core1
Revenue A$m 2,288.4 3,284.2 3,141 2,884 843EBITDA A$m 66.9 (217.6) (461) (495) 24Depreciation & Amortisation A$m (21.7) (24.5) (28) (84) (31)EBIT A$m 45.2 (242.1) (489) (579) (7)Net Finance Revenue/(Costs) A$m 0.4 0.5 - 5 -PBT A$m 45.6 (241.6) (489) (574) (7)Income Tax Benefit/(Expense) A$m (12.7) 74.3 152 168 5PAT A$m 32.9 (167.3) (337) (406) (2)
Returns and Key Performance Measures - Non Core
EBITDA Margin % 2.9% (6.6%) (14.7%) (17.2%) 2.8%
Key Platform Value DriversConstruction Backlog2 A$b 4.9 5.9 5.4 5.1 2.5
Total Segment - Non Core
New Work Secured2
Engineering A$b 1.0 3.5 2.0 1.0Services A$b 1.0 0.8 1.0 1.4 0.8Total A$b 2.0 4.3 3.0 2.4 0.8
Backlog revenue2
Engineering A$b 3.1 4.2 3.8 3.1Services A$b 1.8 1.7 1.6 2.0 2.5Total A$b 4.9 5.9 5.4 5.1 2.5
Book to billTotal ratio 0.9 1.3 1.0 0.8 0.9
Backlog realisation3
Next 12 months % 59% 49% 52% 46% 19%12 - 24 months % 25% 25% 27% 26% 29%Beyond 24 months % 16% 26% 21% 28% 52%
End of sheet

DevelopmentFY17 FY18 FY19 FY20 1H21
UnitProfit and Loss
Development Revenue A$m 3,433.0 3,204.2 3,355 2,344 766Australia A$m 3,142.0 2,855.2 2,712 1,198 390Asia A$m 19.6 67.2 18 13 6Europe A$m 203.6 199.1 544 969 342Americas A$m 67.8 82.7 81 164 28
Development EBITDA A$m 552.4 673.2 793 322 244Australia A$m 497.8 551.3 556 174 173Asia A$m (13.5) 26.7 121 34 (2)Europe A$m 68.3 110.4 37 116 83Americas A$m (0.2) (15.2) 79 (2) (10)
Development PAT A$m 397.8 491.9 554 233 177Australia A$m 348.1 383.6 395 118 121Asia A$m (11.9) 15.2 79 18 (3)Europe A$m 60.2 103.5 27 93 66Americas A$m 1.4 (10.4) 53 4 (7)
Development ROIC % 13.7% 13.4% 11.6% 4.7% 7.2%Development Invested Capital A$b 3.0 4.3 4.8 4.8 5.0Development Pipeline A$b 49.3 71.1 76.1 113.0 109.5Development Production1 A$b 4.6 4.0 5.6 5.0 1.8
Development Pipeline and Production1
Total pipeline by product A$b 49.3 71.1 76.1 113.0 109.5Communities A$b 14.7 15.1 14.7 13.9 13.3Apartments A$b 21.7 31.4Apartments - for sale A$b 26.7 45.2 42.0Apartments - for rent A$b 5.9 23.8 24.3Commercial A$b 12.9 24.5 28.6 29.8 29.9Infrastructure A$b - 0.1 0.2 0.3 0.0
Total pipeline by region A$b 49.3 71.1 76.1 113.0 109.5Australia A$b 30.9 29.7 29.3 28.9 28.4Asia A$b 6.1 6.9 5.0 4.2 4.0Europe A$b 8.0 29.3 34.1 50.1 49.0Americas A$b 4.3 5.2 7.7 29.8 28.1
Work in Progress1 by product A$b 12.3 12.2Communities A$b 0.5 0.4Apartments - for sale A$b 3.9 4.5Apartments - for rent A$b 2.2 2.1Commercial A$b 5.7 5.2
Work in Progress1 by region A$b 12.3 12.2Australia A$b 6.8 5.7Asia A$b 1.7 2.3Europe A$b 1.8 2.2Americas A$b 2.0 2.0
Development Production1 by product A$b 4.6 4.0 5.6 5.0 1.8Communities A$b 0.7 1.0 0.6 0.5 0.3Apartments - for sale A$b 1.7 1.2 1.8 2.3 0.5Apartments - for rent A$b - - 0.3 0.3 0.4Commercial A$b 2.2 1.8 2.9 1.9 0.6
Development Production1 by region A$b 4.6 4.0 5.6 5.0 1.8Australia A$b 4.3 2.6 2.7 1.1 1.3Asia A$b - - 2.1 1.7 -Europe A$b 0.3 1.4 0.5 1.1 0.1Americas A$b - - 0.3 1.1 0.4

DevelopmentFY17 FY18 FY19 FY20 1H21
UnitCommunities2
Presold no. 3,896 3,231 2,276 1,725 1,482Remaining no. 53,219 49,102 47,762 45,647 43,697Total pipeline no. 57,115 52,333 50,038 47,372 45,179
Presold A$b 0.9 0.8 0.6 0.5 0.4Remaining A$b 13.8 14.3 14.1 13.4 12.9Total pipeline A$b 14.7 15.1 14.7 13.9 13.3
UrbanisationApartmentsIn delivery - for sale no. 3,177 3,070 1,881 1,418 2,439In delivery - for rent no. 850 1,513 1,533 1,624 2,502Remaining no. 18,325 25,917 27,314 53,183 51,700Total pipeline no. 22,352 30,500 30,728 56,225 56,641
ApartmentsIn delivery - for sale A$b 3.3 3.2 1.7 2.3 4.5In delivery - for rent A$b 0.5 1.1 1.1 0.9 2.1Remaining A$b 17.9 27.1 29.8 65.8 59.7Total pipeline A$b 21.7 31.4 32.6 69.0 66.3
Apartments Presales A$b 3.9 3.4 1.9 2.4 2.5
CommercialIn delivery sqm '000 537 486 322 376 327Remaining sqm '000 513 1,516 2,099 2,039 2,000Total pipeline sqm '000 1,050 2,002 2,421 2,415 2,327
CommercialIn delivery A$b 6.5 7.2 4.9 4.8 5.2Remaining A$b 6.4 17.3 23.7 25.0 24.7Total pipeline A$b 12.9 24.5 28.6 29.8 29.9
Major Urbanisation Projects3
Projects no. 13 18 20 21 22Gateway cities no. 8 10 10 9 10
Regional Summary
Communities pipeline2 no. 57,115 52,333 50,038 47,372 45,179Australia no. 53,255 49,770 47,700 46,010 43,790Asia no. - 936 878 - -Europe no. - 1 1 1 -Americas no. 3,860 1,626 1,459 1,361 1,389
Communities pipeline2 A$b 14.7 15.1 14.7 13.9 13.3Australia A$b 14.7 14.3 14.1 13.6 13.1Asia A$b 0.4 0.4 - -Europe A$b 0.1 0.1 0.1 0.0Americas A$b 0.3 0.1 0.2 0.2
Apartments pipeline no. 22,352 30,500 30,728 56,225 56,641Australia no. 10,128 9,367 7,985 7,661 7,175Asia no. 2,755 2,755 2,755 3,204 3,204Europe no. 4,527 14,210 15,394 26,958 26,818Americas no. 4,942 4,168 4,594 18,402 19,444
Commercial pipeline sqm '000 1,050 2,002 2,421 2,415 2,327Australia sqm '000 420 395 378 376 326Asia sqm '000 308 278 192 209 209Europe sqm '000 302 1,301 1,799 1,779 1,716Americas sqm '000 20 28 52 51 76
Urbanisation pipeline A$b 34.6 55.9 61.2 98.8 96.2Australia A$b 16.2 15.4 15.2 15.3 15.3Asia A$b 6.1 6.5 4.6 4.2 4.0Europe A$b 8.0 29.2 34.0 50.0 49.0Americas A$b 4.3 4.8 7.4 29.3 27.9

DevelopmentFY17 FY18 FY19 FY20 1H21
UnitResidential for sale Summary
Australian Communities A$m 965.7 857.2 373.0 369.5 203.0Australian Apartments A$m 235.2 48.0 114.1 1,582.7 314.1Asia Apartments A$m 228.0 235.5 71.2 166.5 32.7Europe Communities4 A$m 54.5Europe Apartments A$m 218.2 237.7 121.1 62.5 77.2Americas Communities A$m 5.1 - -Americas Apartments A$m 42.0 127.1 175.3 183.5 47.2Total Sales A$m 1,689.1 1,505.5 859.8 2,364.7 728.7
Australian Communities A$m 716.1 991.4 560.6 525.7 267.3Australian Apartments A$m 1,327.3 911.9 1,574.4 241.0 158.7Asia Apartments5 A$m 608.5 -Europe Communities4 A$m 54.5Europe Apartments A$m 489.3 247.0 282.1 476.9 160.0Americas Communities A$m 5.1 - -Americas Apartments A$m 208.2 168.6 27.3Total Settlements6 A$m 2,532.7 2,150.3 2,630.4 2,020.7 667.8
Australian Communities A$m 947.0 812.8 625.2 469.1 404.8Australian Apartments A$m 2,782.3 1,918.4 458.1 1,794.3 1,948.7Asia Apartments5 A$m 228.0 463.9 570.9 152.3 175.0Europe Apartments A$m 849.9 885.3 731.6 343.1 248.1Americas Apartments A$m 42.0 168.6 150.0 159.4 166.2Total Presales A$m 4,849.2 4,249.0 2,535.8 2,918.2 2,942.8
Australian Communities no. 4,162 3,247 1,422 1,347 800Australian Apartments no. 321 64 155 348 69Asia Apartments no. 210 176 37 242 48Europe Communities4 no. 1Europe Apartments no. 215 377 175 43 57Americas Communities no. 146 - -Americas Apartments no. 40 60 58 100 16Total Sales no. 4,948 3,924 1,993 2,080 991
Australian Communities no. 3,060 3,912 2,377 1,898 1,043Australian Apartments no. 1,807 1,056 1,281 369 225Asia Apartments5 no. 429 -Europe Communities4 no. 1Europe Apartments no. 726 258 296 471 211Americas Communities no. 146 - -Americas Apartments no. 46 97 4Total Settlements6 no. 5,593 5,226 4,146 3,264 1,484
Australian Communities no. 3,896 3,231 2,276 1,725 1,482Australian Apartments no. 2,793 1,801 675 652 495Asia Apartments5 no. 210 386 423 236 284Europe Apartments no. 1,124 1,243 1,013 585 431Americas Apartments no. 40 100 112 114 126Total Presales no. 8,063 6,761 4,499 3,312 2,818
Retirement Development2
Settlements6 A$m 81.3 - - - -Sales A$m 81.3 - - - -Settlements6 no. 176 - - - -Sales no. 176 - - - -Avg price Avg price $'000 462 - - - -

DevelopmentFY17 FY18 FY19 FY20 1H21
UnitResidential for rent Summary
Asia A$b 0.5Europe A$b 0.8 0.8 1.1 1.1Americas A$b 0.5 0.5 0.7 0.6 0.5Projects in delivery7 A$b 0.5 1.3 1.5 1.7 2.1
Asia No. units 878Europe No. units 663 663 904 904Americas No. units 850 850 870 720 720Projects in delivery No. units 850 1,513 1,533 1,624 2,502
Americas A$b 0.3 0.8 -Total Completions7,8 A$b 0.3 0.8 -
Americas no. units 452 870 -Total Completions8 no. units 452 870 -
Commercial Summary
Australia A$b 2.5 3.0 2.4 3.1 3.4Asia A$b 3.8 4.0 2.4 1.5 1.3Europe A$b 0 0.2 0.1 0.2 0.5Projects in delivery7 A$b 6.5 7.2 4.9 4.8 5.2
Australia sqm '000 197 223 145 208 155Asia sqm '000 267 237 151 122 122Europe sqm '000 73 26 26 46 49Projects in delivery sqm '000 537 486 322 376 327
Australia A$b 2.1 0.7 0.9 0.3 0.6Asia A$b 2.1 1.1 -Europe A$b 1.1 - 0.5 -Total Completions A$b 2.1 1.8 3.0 1.9 0.6
Australia sqm '000 109 63 81 11 51Asia sqm '000 83 29 -Europe sqm '000 73 - 26 -Total Completions sqm '000 109 136 164 66 51
End of sheet

ConstructionFY17 FY18 FY19 FY20 1H21
UnitProfit and Loss - Core Business1
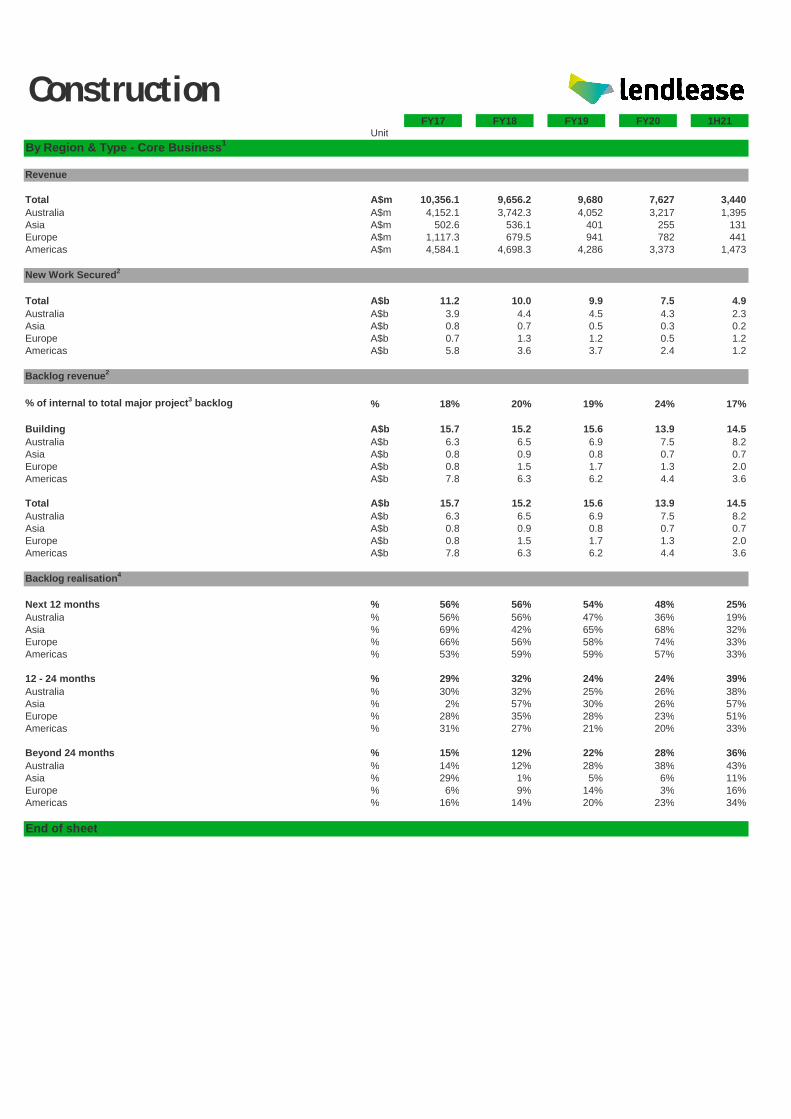
Construction Revenue A$m 10,356.1 9,656.2 9,680 7,627 3,440Australia A$m 4,152.1 3,742.3 4,052 3,217 1,395Asia A$m 502.6 536.1 401 255 131Europe A$m 1,117.3 679.5 941 782 441Americas A$m 4,584.1 4,698.3 4,286 3,373 1,473
Construction EBITDA A$m 271.4 295.8 211 101 104Australia A$m 134.5 194.5 126 97 57Asia A$m (0.2) 15.0 (1) (11) 11Europe A$m 31.7 22.7 40 (9) 15Americas A$m 105.4 63.6 46 24 21
Construction PAT A$m 178.8 189.8 141 42 59Australia A$m 92.0 132.5 84 62 36Asia A$m (2.5) 4.6 (2) (14) 6Europe A$m 23.5 19.7 31 (11) 8Americas A$m 65.8 33.0 28 5 9
Construction EBITDA Margin % 2.6% 3.1% 2.2% 1.3% 3.0%Australia % 3.2% 5.2% 3.1% 3.0% 4.1%Asia % - 2.8% (0.2%) (4.3%) 8.4%Europe % 2.8% 3.3% 4.3% (1.2%) 3.4%Americas % 2.3% 1.4% 1.1% 0.7% 1.4%
Total Segment - Core Business1
RevenueTotal A$m 10,356.1 9,656.2 9,680 7,627 3,440
New Work Secured2
Building A$b 11.2 10.0 9.9 7.5 4.9Total A$b 11.2 10.0 9.9 7.5 4.9
% of internal to total major project3 backlog % 18% 20% 19% 24% 17%
Backlog revenue2
Building A$b 15.7 15.2 15.6 13.9 14.5Total A$b 15.7 15.2 15.6 13.9 14.5
Book to billTotal ratio 1.1 1.0 1.0 1.0 1.4
Backlog realisation4
Next 12 months % 56% 56% 54% 48% 25%12 - 24 months % 29% 32% 24% 24% 39%Beyond 24 months % 15% 12% 22% 28% 36%
Australia - Core Business1
RevenueTotal A$m 4,152.1 3,742.3 4,052 3,217 1,395
New Work Secured2
Building A$b 3.9 4.4 4.5 4.3 2.3Total A$b 3.9 4.4 4.5 4.3 2.3
Backlog revenue2
Building A$b 6.3 6.5 6.9 7.5 8.2Total A$b 6.3 6.5 6.9 7.5 8.2
Book to billTotal ratio 0.9 1.2 1.1 1.3 1.6
Backlog realisation4
Next 12 months % 56% 56% 47% 36% 19%12 - 24 months % 30% 32% 25% 26% 38%Beyond 24 months % 14% 12% 28% 38% 43%

ConstructionFY17 FY18 FY19 FY20 1H21
UnitAsia
RevenueTotal A$m 502.6 536.1 401 255 131
New Work Secured2
Building A$b 0.8 0.7 0.5 0.3 0.2Total A$b 0.8 0.7 0.5 0.3 0.2
Backlog revenue2
Building A$b 0.8 0.9 0.8 0.7 0.7Total A$b 0.8 0.9 0.8 0.7 0.7
Book to billTotal ratio 1.6 1.3 1.2 1.2 1.5
Backlog realisation4
Next 12 months % 69% 42% 65% 68% 32%12 - 24 months % 2% 57% 30% 26% 57%Beyond 24 months % 29% 1% 5% 6% 11%
Europe
RevenueTotal A$m 1,117.3 679.5 941 782 441
New Work Secured2
Building A$b 0.7 1.3 1.2 0.5 1.2Total A$b 0.7 1.3 1.2 0.5 1.2
Backlog revenue2
Building A$b 0.8 1.5 1.7 1.3 2.0Total A$b 0.8 1.5 1.7 1.3 2.0
Book to billTotal ratio 0.6 1.9 1.3 0.6 2.7
Backlog realisation4
Next 12 months % 66% 56% 58% 74% 33%12 - 24 months % 28% 35% 28% 23% 51%Beyond 24 months % 6% 9% 14% 3% 16%
Americas
RevenueTotal A$m 4,584.1 4,698.3 4,286 3,373 1,473
New Work Secured2
Building A$b 5.8 3.6 3.7 2.4 1.2Total A$b 5.8 3.6 3.7 2.4 1.2
Backlog revenue2
Building A$b 7.8 6.3 6.2 4.4 3.6Total A$b 7.8 6.3 6.2 4.4 3.6
Book to billTotal ratio 1.3 0.8 0.9 0.7 0.8
Backlog realisation4
Next 12 months % 53% 59% 59% 57% 33%12 - 24 months % 31% 27% 21% 20% 33%Beyond 24 months % 16% 14% 20% 23% 34%
ConstructionFY17 FY18 FY19 FY20 1H21
UnitBy Region & Type - Core Business1
Revenue
Total A$m 10,356.1 9,656.2 9,680 7,627 3,440Australia A$m 4,152.1 3,742.3 4,052 3,217 1,395Asia A$m 502.6 536.1 401 255 131Europe A$m 1,117.3 679.5 941 782 441Americas A$m 4,584.1 4,698.3 4,286 3,373 1,473
New Work Secured2
Total A$b 11.2 10.0 9.9 7.5 4.9Australia A$b 3.9 4.4 4.5 4.3 2.3Asia A$b 0.8 0.7 0.5 0.3 0.2Europe A$b 0.7 1.3 1.2 0.5 1.2Americas A$b 5.8 3.6 3.7 2.4 1.2
Backlog revenue2
% of internal to total major project3 backlog % 18% 20% 19% 24% 17%
Building A$b 15.7 15.2 15.6 13.9 14.5Australia A$b 6.3 6.5 6.9 7.5 8.2Asia A$b 0.8 0.9 0.8 0.7 0.7Europe A$b 0.8 1.5 1.7 1.3 2.0Americas A$b 7.8 6.3 6.2 4.4 3.6
Total A$b 15.7 15.2 15.6 13.9 14.5Australia A$b 6.3 6.5 6.9 7.5 8.2Asia A$b 0.8 0.9 0.8 0.7 0.7Europe A$b 0.8 1.5 1.7 1.3 2.0Americas A$b 7.8 6.3 6.2 4.4 3.6
Backlog realisation4
Next 12 months % 56% 56% 54% 48% 25%Australia % 56% 56% 47% 36% 19%Asia % 69% 42% 65% 68% 32%Europe % 66% 56% 58% 74% 33%Americas % 53% 59% 59% 57% 33%
12 - 24 months % 29% 32% 24% 24% 39%Australia % 30% 32% 25% 26% 38%Asia % 2% 57% 30% 26% 57%Europe % 28% 35% 28% 23% 51%Americas % 31% 27% 21% 20% 33%
Beyond 24 months % 15% 12% 22% 28% 36%Australia % 14% 12% 28% 38% 43%Asia % 29% 1% 5% 6% 11%Europe % 6% 9% 14% 3% 16%Americas % 16% 14% 20% 23% 34%
End of sheet

InvestmentsFY17 FY18 FY19 FY20 1H21
UnitProfit and Loss
Investments Revenue A$m 566.7 393.6 348 390 151Australia A$m 447.2 274.3 210 172 78Asia A$m 52.0 48.7 63 134 41Europe A$m 7.9 21.6 13 16 6Americas A$m 59.6 49.0 62 68 26
Investments Operating EBITDA1 A$m 433.3 368.9 278 300 121Australia A$m 347.3 297.6 199 130 62Asia A$m 33.1 39.3 28 119 28Europe A$m 10.2 7.4 9 (10) (4)Americas A$m 42.7 24.6 42 61 35
Investments Operating PAT1 A$m 320.4 241.4 196 214 96Australia A$m 253.9 172.0 149 97 44Asia A$m 27.1 30.8 9 96 33Europe A$m 11.7 9.3 10 (9) (3)Americas A$m 27.7 29.3 28 30 22
Investments EBITDA by activityOwnership Earnings1 A$m 317.2 236.0 134 102 50Management Earnings A$m 116.1 133.0 144 198 71
Investments ROIC1 % 9.8% 7.6% 5.7% 5.8% 5.3%Investments Invested Capital A$b 3.3 3.3 3.6 3.7 3.6
Investment segment property valuation movements (pre-tax) A$m 62.0 300.0 211 (147) (11)
Operational Metrics (Investments Segment)
Investments
Total Investments A$m 3,328.6 3,374.8 3,675 3,998 3,670
Investments by RegionAustralia A$m 2,865.6 2,693.3 2,513 2,330 2,316Asia A$m 317.4 367.5 708 914 822Europe A$m - - 40 79 112Americas A$m 145.6 314.0 414 675 420
Investments by SectorResidential A$m 103.1 196.6 252 422 459Office A$m 825.8 1,053.1 946 851 844Retail A$m 518.4 573.1 720 934 889Industrial A$m 71.0 74.6 95 101 103Retirement A$m 1,710.7 1,303.0 1,397 1,353 1,375Other A$m 99.6 174.4 265 337 -
Funds Under Management
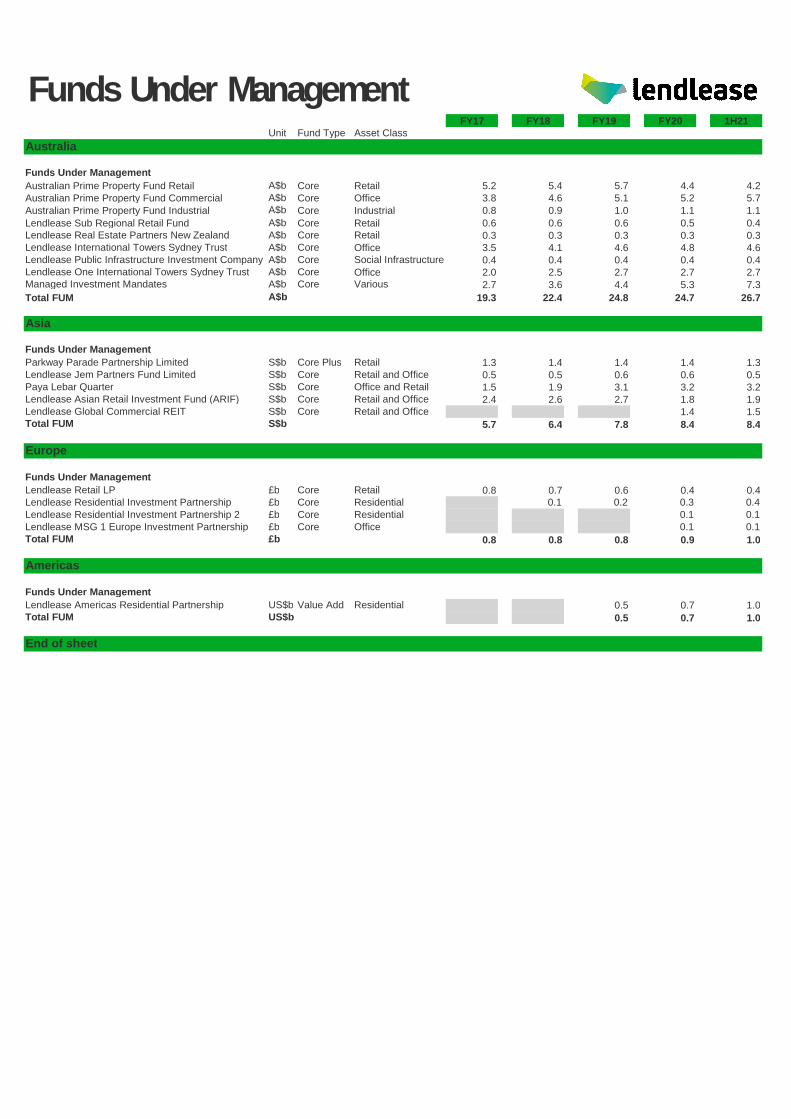
Total A$b 26.1 30.1 35.2 36.0 37.9Australia A$b 19.3 22.4 24.8 24.7 26.7Asia A$b 5.4 6.3 8.2 8.7 8.2Europe A$b 1.4 1.4 1.5 1.6 1.7Americas A$b - - 0.7 1.0 1.3
FUM by SectorTotal A$b 26.1 30.1 35.2 36.0 37.9Retail A$b 13.1 13.8 14.8 13.0 13.2Office A$b 11.6 14.5 17.7 19.3 20.4Industrial A$b 0.8 0.9 1.0 1.1 1.4Residential A$b - - 1.0 1.7 2.0Other A$b 0.6 0.9 0.7 0.8 0.8

InvestmentsFY17 FY18 FY19 FY20 1H21
UnitAssets Under Management
Total A$b 12.2 12.7 28.7 29.3 27.6Australia A$b 7.2 7.3 7.5 6.1 6.5Asia A$b 4.2 4.6 7.2 8.5 8.0Europe A$b 0.8 0.8 0.7 0.5 0.4Americas A$b - - 13.3 14.2 12.7
AUM by SectorTotal A$b 12.2 12.7 28.7 29.3 27.6Residential A$b - - 13.3 14.2 12.7Retail A$b 12.2 12.7 12.7 12.0 12.0Office A$b - - 2.7 3.1 2.9
Commercial2 Assets Under Management
AUM A$b 12.2 12.7 15.4 15.1 14.9Australia A$b 7.2 7.3 7.5 6.1 6.5Asia A$b 4.2 4.6 7.2 8.5 8.0Europe A$b 0.8 0.8 0.7 0.5 0.4Americas A$b - - - - -
GLA under management sqm '000 1,201.5 1,172.0 1,296.2 1,392.3 1,459.3Australia sqm '000 747.3 744.4 785.5 774.7 841.0Asia sqm '000 312.5 285.9 369.0 475.9 476.6Europe sqm '000 141.7 141.7 141.7 141.7 141.7Americas sqm '000 - - - - -
Residential Assets Under Management
AUM A$b 13.3 14.2 12.7Americas A$b 13.3 14.2 12.7
Residential for Rent Units under Management no. 53,105 52,595 52,214 52,525 52,419Americas no. 53,105 52,595 52,214 52,525 52,419Europe no. - - - - -
Retirement3
Total number of villagesAustralia no. 71 71 72 72 75
Total number of unitsAustralia no. 12,626 12,717 12,785 12,858 12,931
Number of resale unitsAustralia no. 939 694 842 874 373
Long term growth rateAustralia % 3.6% 3.5% 3.5% 3.5% 3.5%
Discount rateAustralia % 13.0% 12.3% 12.3% 12.4% 12.4%
PipelineAustralia no. 4,422 3,829 3,077 2,442
PipelineAustralia A$b 1.6 1.8 1.6 1.4
Sales/Settlements4
Australia no. 144 150 104 72
Sales/Settlements4
Australia A$m 72.3 86.0 56.8 48.0
Sales/Settlements4
Australia Avg price $'000 502 573 546 667

InvestmentsFY17 FY18 FY19 FY20 1H21
UnitAustralia
FUM A$b 19.3 22.4 24.8 24.7 26.7
Retail AUMAUM A$b 7.2 7.3 7.5 6.1 6.5GLA under management sqm '000 747.3 744.4 785.5 774.7 841
Asia
FUM A$b 5.4 6.3 8.2 8.7 8.2
Commercial2 AUMNumber of retail centres and office buildings no. 4 4 7 11 11AUM A$b 4.2 4.6 7.2 8.5 8.0GLA under management sqm '000 312.5 285.9 369 475.9 476.6
Europe
FUM A$b 1.4 1.4 1.5 1.6 1.7
Retail AUMNumber of retail centres no. 2 2 2 2 2AUM A$b 0.8 0.8 0.7 0.5 0.4GLA under management sqm '000 141.7 141.7 141.7 141.7 141.7
Americas
FUM A$b 0.7 1.0 1.3
ResidentialAUM A$b 13.3 14.2 12.7
Military Housing Units under management no. 53,105 52,595 52,214 51,789 51,683
Residential for Rent Units under management no. 736 736
Residential for Rent Buildings under management no. 3 3
End of sheet
Funds Under ManagementFY17 FY18 FY19 FY20 1H21
Unit Fund Type Asset ClassAustralia
Funds Under ManagementAustralian Prime Property Fund Retail A$b Core Retail 5.2 5.4 5.7 4.4 4.2Australian Prime Property Fund Commercial A$b Core Office 3.8 4.6 5.1 5.2 5.7Australian Prime Property Fund Industrial A$b Core Industrial 0.8 0.9 1.0 1.1 1.1Lendlease Sub Regional Retail Fund A$b Core Retail 0.6 0.6 0.6 0.5 0.4Lendlease Real Estate Partners New Zealand A$b Core Retail 0.3 0.3 0.3 0.3 0.3Lendlease International Towers Sydney Trust A$b Core Office 3.5 4.1 4.6 4.8 4.6Lendlease Public Infrastructure Investment Company A$b Core Social Infrastructure 0.4 0.4 0.4 0.4 0.4Lendlease One International Towers Sydney Trust A$b Core Office 2.0 2.5 2.7 2.7 2.7Managed Investment Mandates A$b Core Various 2.7 3.6 4.4 5.3 7.3Total FUM A$b 19.3 22.4 24.8 24.7 26.7
Asia
Funds Under ManagementParkway Parade Partnership Limited S$b Core Plus Retail 1.3 1.4 1.4 1.4 1.3Lendlease Jem Partners Fund Limited S$b Core Retail and Office 0.5 0.5 0.6 0.6 0.5Paya Lebar Quarter S$b Core Office and Retail 1.5 1.9 3.1 3.2 3.2Lendlease Asian Retail Investment Fund (ARIF) S$b Core Retail and Office 2.4 2.6 2.7 1.8 1.9Lendlease Global Commercial REIT S$b Core Retail and Office 1.4 1.5Total FUM S$b 5.7 6.4 7.8 8.4 8.4
Europe
Funds Under ManagementLendlease Retail LP £b Core Retail 0.8 0.7 0.6 0.4 0.4Lendlease Residential Investment Partnership £b Core Residential 0.1 0.2 0.3 0.4Lendlease Residential Investment Partnership 2 £b Core Residential 0.1 0.1Lendlease MSG 1 Europe Investment Partnership £b Core Office 0.1 0.1Total FUM £b 0.8 0.8 0.8 0.9 1.0
Americas
Funds Under ManagementLendlease Americas Residential Partnership US$b Value Add Residential 0.5 0.7 1.0Total FUM US$b 0.5 0.7 1.0
End of sheet

LegendGrey highlighted cell Data is not included in this data file because it was not previously disclosed.Green highlighted cell Not applicable.2H numbers included in document Note: All 2H information contained in the document is derived via calculationRounding Note: Numbers disclosed are subject to rounding
Term DefinitionAssets Under Management Total market value of gross assets managed by Lendlease.
Backlog units Backlog includes Group owned, joint venture and managed projects. The actual number of units for anyparticular project can vary as planning approvals are obtained.
Book to Bill Ratio calculated as new work secured over revenue realised.
Commercial backlog (sqm) Represents net developable land in relation to master-planned urban communities and net developable floorspace for other developments. The actual net developable land area and floor space for any particular projectcan vary as planning approvals are obtained.
Construction backlog realisation The proportion of construction backlog revenue which is expected to be earned across future periods.
Construction backlog revenue Current year construction backlog revenue is the total revenue to be earned in future periods.
Core Operating Earnings per security Core Operating Profit after Tax divided by the weighted average number of securities on issue during the period(including treasury securities).
Core Operating Return on equity (ROE) Full year (FY) ROE is calculated using the annual Core Operating Profit after Tax divided by the arithmeticaverage of beginning, half and year end securityholders' equity.Half year (1H) ROE is calculated on an annualised basis using the half year Core Operating Profit after Taxdivided by the arithmetic average of beginning and half year end securityholders' equity.
Development pipeline Total estimated project revenue of all development work secured (representing 100% of project value).
Development Production Project end value on product completed during a financial period (representing 100% of project value).
Development Work in Progress End value of Development Pipeline in delivery as at period end (representing 100% of project value).
Distribution payout ratio Distribution divided by Core Operating Profit after Tax.
Distribution per security For the full year (FY) reflects the amount of interim and final distribution per stapled security from the Company/ Trust.For the half year (1H) reflects the amount of interim distribution per stapled security from the Company / Trust.
Earnings per security Statutory Profit after Tax divided by the weighted average number of securities on issue during the period(including treasury securities).
Effective tax rate Income tax expense as a percentage of statutory profit before tax.
Funds under management (FUM) Total market value of investments across Lendlease managed funds.
Gearing Net debt to total tangible assets, less cash.
GLA under management (sqm) Represents the gross lettable area, with the exception of Asia which represents the net lettable area of thecentres.
Invested capital Represents securityholder equity plus gross debt less cash on balance sheet.
Invested equity Invested equity refers to the contributed equity for each project.
Investments Includes equity invested in Lendlease managed funds and direct investment in property and property relatedassets. Represents the Group’s assessment of market value.

Investments - Management EBITDA Earnings primarily derived from the investment management platform and the management of US MilitaryHousing operations.
Investments - Ownership EBITDA Returns excluding Investments segment revaluations derived from investments, the Group's Retirementinvestment, US Military Housing equity investment and infrastructure investment.
Market capitalisation The number of securities on issue multiplied by the security price at period end.
Net debt Borrowings, including certain other financial liabilities, less cash.
New work secured revenue Estimated revenue to be earned from construction contracts secured during the period. New work is securedand forms part of construction backlog revenue when formal contracts are signed.
Operating EBITDA Operating Earnings before interest, tax, depreciation and amortisation.
Operating Profit after tax (OPAT) Statutory profit adjusted for non operating items. These include non-cash backed property related revaluationmovements of Investment Property, Other Financial Assets and Equity accounted Investments in theInvestments segment, and other non-cash adjustments or non-recurring items such as impairment lossesrelating to Goodwill and other Intangibles.
Presales ($) Total sales value of units that have been sold and not yet settled. Includes units sold but not yet in delivery.Includes 100 per cent of joint venture projects and therefore will not necessarily correlate with the Group’s Profitafter Tax.
Presales (units) Units that have been sold and not yet settled. Includes units sold but not yet in delivery.
Profit after tax (PAT) Profit after Tax attributable to securityholders, determined in accordance with Australian Accounting Standards.
Return on invested capital (ROIC) Full year (FY) ROIC is calculated using the annual Operating Profit after Tax divided by the arithmetic averageof beginning, half and year end invested capital.Half year (1H) ROIC is calculated on an annualised basis using the half year Operating Profit after Tax dividedby the arithmetic average of beginning and half year end invested capital.
Settlements (units) Apartments - units cash settled in the period on completed units in Australia, Europe and Americas, and unitswhich have reached practical completion in Asia.Communities & Retirement - units settled in the period on completed land lots or units.Commercial - buildings that have reached practical completion during the period.
Urbanisation pipeline Estimated end value of all of the Group’s secured development projects (excluding Communities andRetirement projects) as at period end; Includes 100% of joint venture projects and therefore will not necessarilycorrelate with the Group’s Profit after Tax.
Weighted average number of securities The time weighted number of securities outstanding during the period.
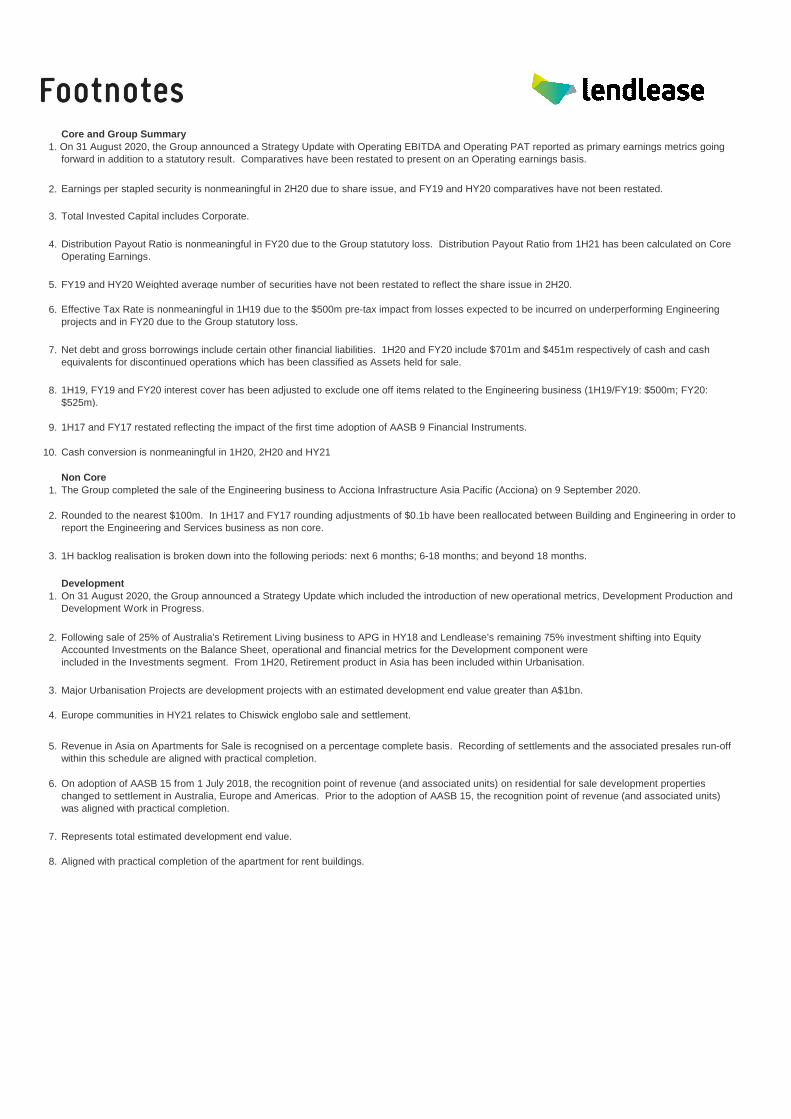
Core and Group Summary1. On 31 August 2020, the Group announced a Strategy Update with Operating EBITDA and Operating PAT reported as primary earnings metrics going
forward in addition to a statutory result. Comparatives have been restated to present on an Operating earnings basis.
2. Earnings per stapled security is nonmeaningful in 2H20 due to share issue, and FY19 and HY20 comparatives have not been restated.
3. Total Invested Capital includes Corporate.
4. Distribution Payout Ratio is nonmeaningful in FY20 due to the Group statutory loss. Distribution Payout Ratio from 1H21 has been calculated on CoreOperating Earnings.
5. FY19 and HY20 Weighted average number of securities have not been restated to reflect the share issue in 2H20.
6. Effective Tax Rate is nonmeaningful in 1H19 due to the $500m pre-tax impact from losses expected to be incurred on underperforming Engineeringprojects and in FY20 due to the Group statutory loss.
7. Net debt and gross borrowings include certain other financial liabilities. 1H20 and FY20 include $701m and $451m respectively of cash and cashequivalents for discontinued operations which has been classified as Assets held for sale.
8. 1H19, FY19 and FY20 interest cover has been adjusted to exclude one off items related to the Engineering business (1H19/FY19: $500m; FY20:$525m).
9. 1H17 and FY17 restated reflecting the impact of the first time adoption of AASB 9 Financial Instruments.
10. Cash conversion is nonmeaningful in 1H20, 2H20 and HY21
Non Core1. The Group completed the sale of the Engineering business to Acciona Infrastructure Asia Pacific (Acciona) on 9 September 2020.
2. Rounded to the nearest $100m. In 1H17 and FY17 rounding adjustments of $0.1b have been reallocated between Building and Engineering in order toreport the Engineering and Services business as non core.
3. 1H backlog realisation is broken down into the following periods: next 6 months; 6-18 months; and beyond 18 months.
Development1. On 31 August 2020, the Group announced a Strategy Update which included the introduction of new operational metrics, Development Production and
Development Work in Progress.
2. Following sale of 25% of Australia's Retirement Living business to APG in HY18 and Lendlease’s remaining 75% investment shifting into EquityAccounted Investments on the Balance Sheet, operational and financial metrics for the Development component wereincluded in the Investments segment. From 1H20, Retirement product in Asia has been included within Urbanisation.
3. Major Urbanisation Projects are development projects with an estimated development end value greater than A$1bn.
4. Europe communities in HY21 relates to Chiswick englobo sale and settlement.
5. Revenue in Asia on Apartments for Sale is recognised on a percentage complete basis. Recording of settlements and the associated presales run-offwithin this schedule are aligned with practical completion.
6. On adoption of AASB 15 from 1 July 2018, the recognition point of revenue (and associated units) on residential for sale development propertieschanged to settlement in Australia, Europe and Americas. Prior to the adoption of AASB 15, the recognition point of revenue (and associated units)was aligned with practical completion.
7. Represents total estimated development end value.
8. Aligned with practical completion of the apartment for rent buildings.

Construction1. From 1H17, comparatives have been restated to exclude the Engineering and Services business following the decision that it is no longer a required
part of the Group's strategy.
2. Rounded to the nearest $100m. In 1H17 and FY17 rounding adjustments of $0.1b have been reallocated between Building and Engineering in order toreport the Engineering and Services business as non core.
3. Includes all Construction projects with backlog greater than $100m.
4. 1H backlog realisation is broken down into the following periods: next 6 months; 6-18 months; and beyond 18 months.
Investments1. On 31 August 2020, the Group annouced a Strategy Update with Operating EBITDA and Operating PAT reported as primary earnings metrics going
forward in addition to a statutory result. Comparatives have been restated to present on an Operating earnings basis.
2. Office product has been included from FY19 onwards.
3. Following sale of 25% of Australia's Retirement Living business to APG in HY18 and Lendlease’s remaining 75% investment shifting into EquityAccounted Investments on the Balance Sheet, operational and financial metrics for the Development component wereincluded in the Investments segment.
4. On adoption of AASB 15 from 1 July 2018, the recognition point of revenue (and associated units) on residential for sale development propertieschanged to settlement in Australia, Europe and Americas. Prior to the adoption of AASB 15, the recognition point of revenue (and associated units)was aligned with practical completion.

Important NoticeThis document has been prepared and is issued by Lendlease Corporation Limited (ACN 000 226 228) (Lendlease) in good faith.Neither Lendlease (including any of its controlled entities), nor Lendlease Trust (together referred to as the Lendlease Group) makesany representation or warranty, express or implied, as to the accuracy, completeness, adequacy or reliability of any statements,estimates, opinions or other information contained in this document (any of which may change without notice). To the maximumextent permitted by law, Lendlease, the Lendlease Group and their respective directors, officers, employees and agents disclaim allliability and responsibility (including without limitation any liability arising from fault or negligence) for any direct or indirect loss ordamage which may be suffered, howsoever arising, through use or reliance on anything contained in or omitted from this document.
This document does not contain any new information but is a compilation of material from Lendlease Group’s results and previouslydisclosed reports and presentations. Review of this material does not replace the need to review the Lendlease Group results andother previously disclosed reports and presentations for context and information included in those documents.
This document has been prepared without regard to the specific investment objectives, financial situation or needs of any recipientof this presentation. Each recipient should consult with, and rely solely upon, their own legal, tax, business and/or financial advisorsin connection with any decision made in relation to the information contained in this presentation.
Lendlease Group’s statutory results are prepared in accordance with International Financial Reporting Standards (IFRS). Thisdocument also includes material that is not included in Lendlease Group’s statutory results and contains non-IFRS measures.Material that is not included in Lendlease Group’s statutory results has not been subject to audit. Lendlease Group’s auditors,KPMG, performed agreed upon procedures to ensure consistency of this document with Lendlease Group’s statutory results, otherpublicly disclosed material and management reports.
This document has been released on the Lendlease website as an excel spreadsheet and the half year data on the ASX platform asa PDF document.