Embed Size (px)
Citation preview
2021 Half Year Results29 July 2021
Dr. Dominik von Achten – Group CEO
Dr. Lorenz Näger – Group CFO
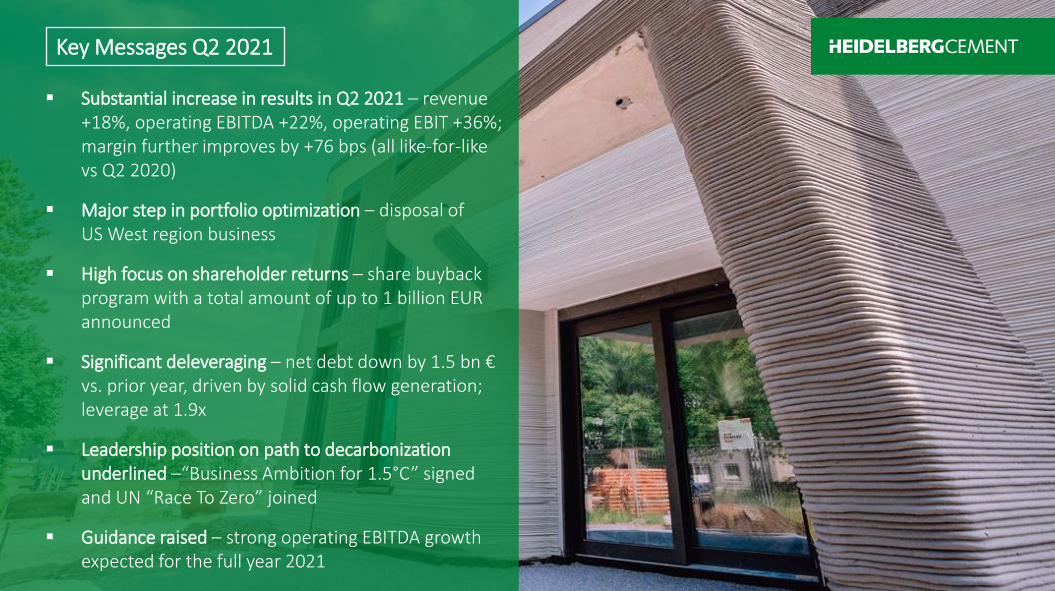
Germany's first 3D-printed house in Beckum. © Detlef Podehl

▪ Substantial increase in results in Q2 2021 – revenue +18%, operating EBITDA +22%, operating EBIT +36%; margin further improves by +76 bps (all like-for-like vs Q2 2020)
▪ Major step in portfolio optimization – disposal of US West region business
▪ High focus on shareholder returns – share buyback program with a total amount of up to 1 billion EUR announced
▪ Significant deleveraging – net debt down by 1.5 bn € vs. prior year, driven by solid cash flow generation; leverage at 1.9x
▪ Leadership position on path to decarbonization underlined –“Business Ambition for 1.5°C” signedand UN “Race To Zero” joined
▪ Guidance raised – strong operating EBITDA growth expected for the full year 2021
Key Messages Q2 2021
2021 Half Year Results | 29 July 20213
Q 2 / H 1 2 0 2 1 R E S U L T S
Substantial increase in results – Continuous improvement in all operational metrics
Revenue (m€) Operating EBITDA (m€) Operating EBITDA Margin Operating EBIT (RCO) (m€)
4,324
8,254
4,980
8,938
Q2 H1
+15%
+8%
2020 2021
Lfl: +18%
Lfl: +11%
998
1,404
1,182
1,720
Q2 H1
+18%
+23%
Lfl: +22%
Lfl: +26%
H1Q2
23.1% 23.7%
17.0%19.2%
+64 bps
+224 bps
Lfl: +36%
Lfl: +57%
651710
862
1,084
Q2 H1
+32%
+53%
Lfl: +76 bps
Lfl: +228 bps
2021 Half Year Results | 29 July 20214
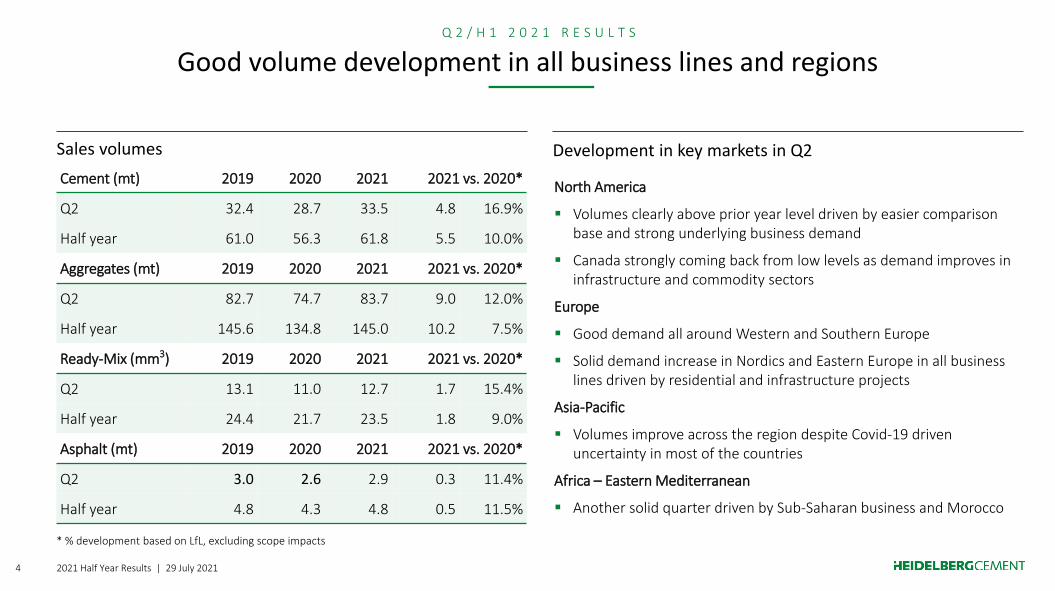
Development in key markets in Q2
Good volume development in all business lines and regions
North America
▪ Volumes clearly above prior year level driven by easier comparison base and strong underlying business demand
▪ Canada strongly coming back from low levels as demand improves in infrastructure and commodity sectors
Europe
▪ Good demand all around Western and Southern Europe
▪ Solid demand increase in Nordics and Eastern Europe in all business lines driven by residential and infrastructure projects
Asia-Pacific
▪ Volumes improve across the region despite Covid-19 driven uncertainty in most of the countries
Africa – Eastern Mediterranean
▪ Another solid quarter driven by Sub-Saharan business and Morocco
Q 2 / H 1 2 0 2 1 R E S U L T S
Cement (mt) 2019 2020 2021 2021 vs. 2020*
Q2 32.4 28.7 33.5 4.8 16.9%
Half year 61.0 56.3 61.8 5.5 10.0%
Aggregates (mt) 2019 2020 2021 2021 vs. 2020*
Q2 82.7 74.7 83.7 9.0 12.0%
Half year 145.6 134.8 145.0 10.2 7.5%
Ready-Mix (mm3) 2019 2020 2021 2021 vs. 2020*
Q2 13.1 11.0 12.7 1.7 15.4%
Half year 24.4 21.7 23.5 1.8 9.0%
Asphalt (mt) 2019 2020 2021 2021 vs. 2020*
Q2 3.0 2.6 2.9 0.3 11.4%
Half year 4.8 4.3 4.8 0.5 11.5%
Sales volumes
* % development based on LfL, excluding scope impacts

2021 Half Year Results | 29 July 20215
Q2 Operating EBITDA Bridge (m€)
Operating EBITDA increases by 22% in Q2 2021
277
1,182
-28
-1
Net volume
998
Q2 2020 EBITDA Currency
1,182
Price over cost Q2 2021 EBITDAQ2 2020 LfL EBITDA
971
Scope
-66
Q2 2021 LfL EBITDA
+21.8%
Q 2 / H 1 2 0 2 1 R E S U L T S

2021 Half Year Results | 29 July 20216
H1 Operating EBITDA Bridge (m€)
Operating EBITDA improves by 360 m€ in H1 2021
340 20
Price over cost
1,404 -41
1,720
H1 2020 EBITDA Currency H1 2020 LfL EBITDA
1,723 -3
H1 2021 LfL EBITDA
H1 2021 EBITDA
1,363
ScopeNet volume
+26.4%
Q 2 / H 1 2 0 2 1 R E S U L T S
2021 Half Year Results | 29 July 20217
Q 2 / H 1 2 0 2 1 R E S U L T S
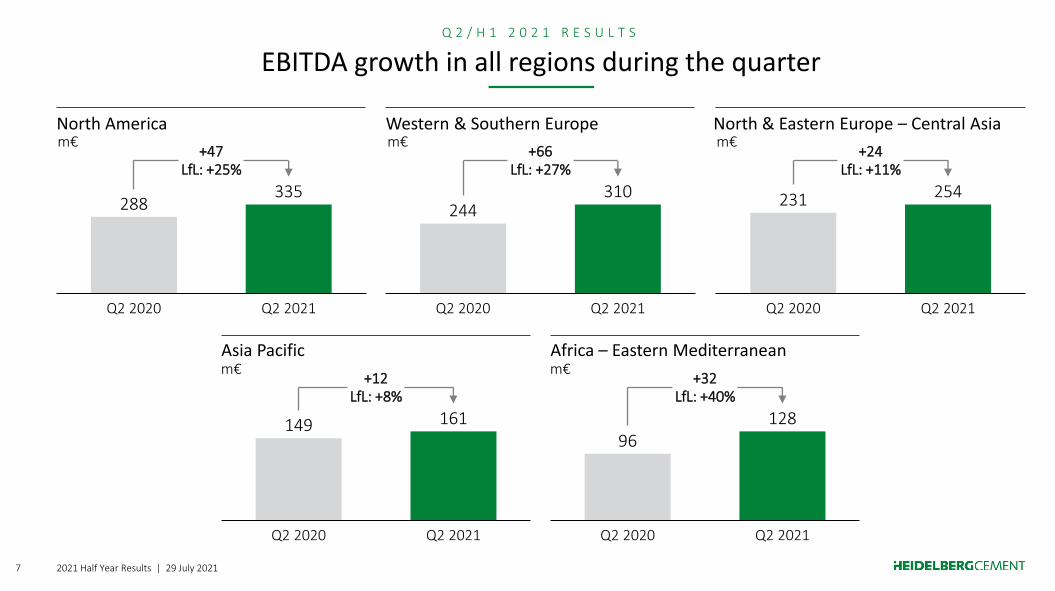
EBITDA growth in all regions during the quarter
North America Western & Southern Europe North & Eastern Europe – Central Asia
Asia Pacific Africa – Eastern Mediterranean
96128
Q2 2020 Q2 2021
+32LfL: +40%
149 161
Q2 2021Q2 2020
+12LfL: +8%
231 254
Q2 2020 Q2 2021
+24LfL: +11%
244310
Q2 2020 Q2 2021
+66LfL: +27%
288335
Q2 2020 Q2 2021
+47LfL: +25%
m€ m€ m€
m€m€
2021 Half Year Results | 29 July 20218
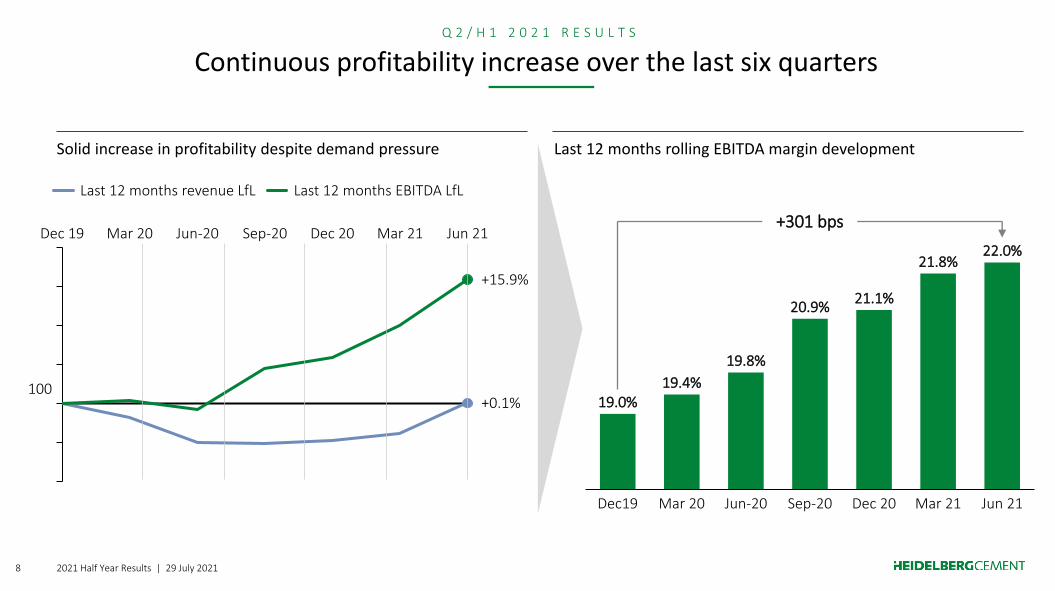
Last 12 months rolling EBITDA margin development
Q 2 / H 1 2 0 2 1 R E S U L T S
Continuous profitability increase over the last six quarters
Solid increase in profitability despite demand pressure
+15.9%
Jun-20Dec 19 Mar 20 Sep-20 Dec 20
+0.1%
Mar 21 Jun 21
Last 12 months revenue LfL Last 12 months EBITDA LfL
100
Dec19 Jun 21Jun-20Mar 20 Sep-20
22.0%
Mar 21Dec 20
19.0%19.4%
19.8%
20.9%21.1%
21.8%
+301 bps
2021 Half Year Results | 29 July 20219
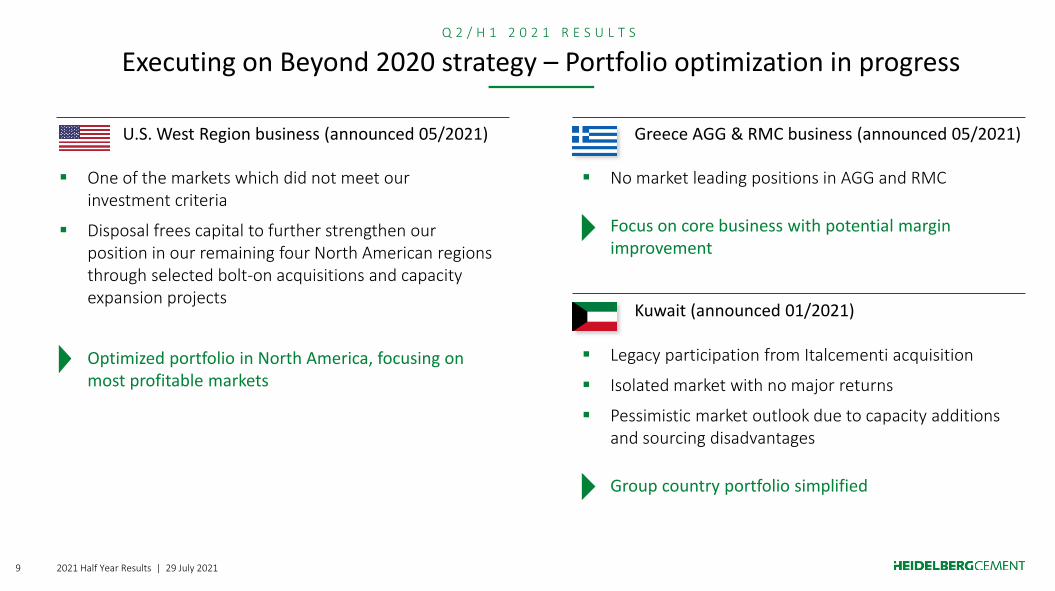
Executing on Beyond 2020 strategy – Portfolio optimization in progressQ 2 / H 1 2 0 2 1 R E S U L T S
U.S. West Region business (announced 05/2021) Greece AGG & RMC business (announced 05/2021)
Kuwait (announced 01/2021)
▪ No market leading positions in AGG and RMC
Focus on core business with potential margin improvement
▪ Legacy participation from Italcementi acquisition
▪ Isolated market with no major returns
▪ Pessimistic market outlook due to capacity additions and sourcing disadvantages
Group country portfolio simplified
▪ One of the markets which did not meet our investment criteria
▪ Disposal frees capital to further strengthen our position in our remaining four North American regions through selected bolt-on acquisitions and capacity expansion projects
Optimized portfolio in North America, focusing on most profitable markets
2021 Half Year Results | 29 July 202110
Q 2 / H 1 2 0 2 1 R E S U L T S
Share buyback program with a total amount of up to 1 billion EUR announced
▪ First share buyback in HeidelbergCement’s history
▪ The company plans to buy back shares of up to 1 billion EUR until
September 2023
▪ First tranche in the amount of €300 to €350 million is scheduled to start in
August 2021 and is to be completed by January 2022 at the latest
▪ Authorization granted by the AGM on 6 May 2021 to buy back up to 10% of
share capital until 5 May 2026
▪ For the time being, the acquired shares will be held as treasury shares
High focus on shareholder returns as outlined in our strategy “Beyond 2020”!
▪ Significant increase in EPS – adjusted for the additional ordinary result, EPS increases by 71% to 3.1€ year-over-year
▪ Strong cash generation – LTM free cash flow at 2.3 bn€, leading to a cash conversion rate of 56%
▪ Solid deleveraging – net debt reduced by 1.5 bn€ year-over-year
▪ Leverage at very comfortable level – year end leverage targeted at the lower end of our guidance 1.5x to 2.0x
Key Financial Messages June 2021
2021 Half Year Results | 29 July 202112
F I N A N C I A L H I G H L I G H T S
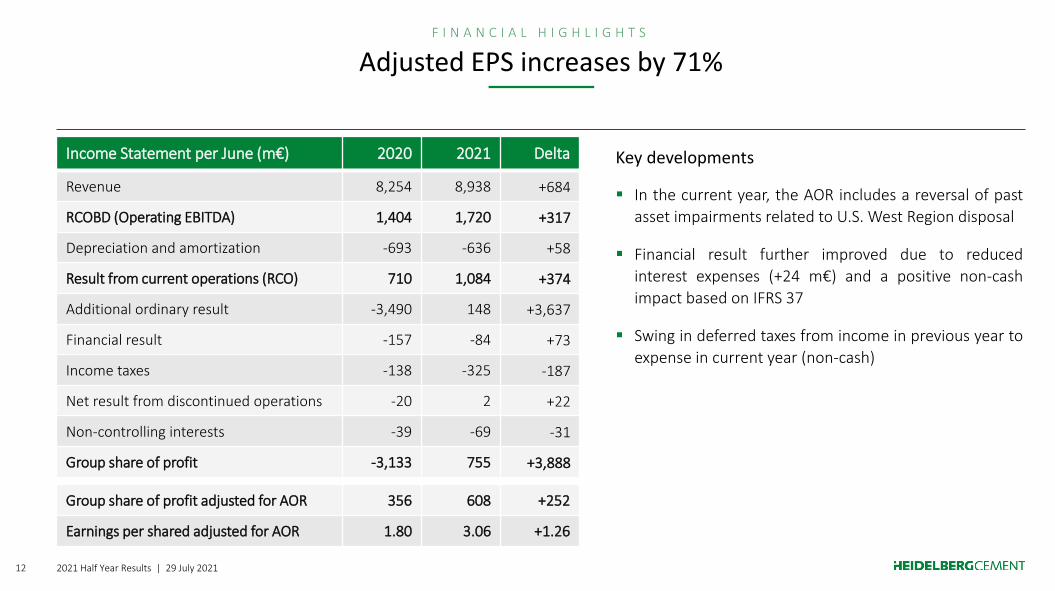
Adjusted EPS increases by 71%
▪ In the current year, the AOR includes a reversal of past
asset impairments related to U.S. West Region disposal
▪ Financial result further improved due to reduced
interest expenses (+24 m€) and a positive non-cash
impact based on IFRS 37
▪ Swing in deferred taxes from income in previous year to
expense in current year (non-cash)
Key developmentsIncome Statement per June (m€) 2020 2021 Delta
Revenue 8,254 8,938 +684
RCOBD (Operating EBITDA) 1,404 1,720 +317
Depreciation and amortization -693 -636 +58
Result from current operations (RCO) 710 1,084 +374
Additional ordinary result -3,490 148 +3,637
Financial result -157 -84 +73
Income taxes -138 -325 -187
Net result from discontinued operations -20 2 +22
Non-controlling interests -39 -69 -31
Group share of profit -3,133 755 +3,888
Group share of profit adjusted for AOR 356 608 +252
Earnings per shared adjusted for AOR 1.80 3.06 +1.26
2021 Half Year Results | 29 July 202113
F I N A N C I A L H I G H L I G H T S
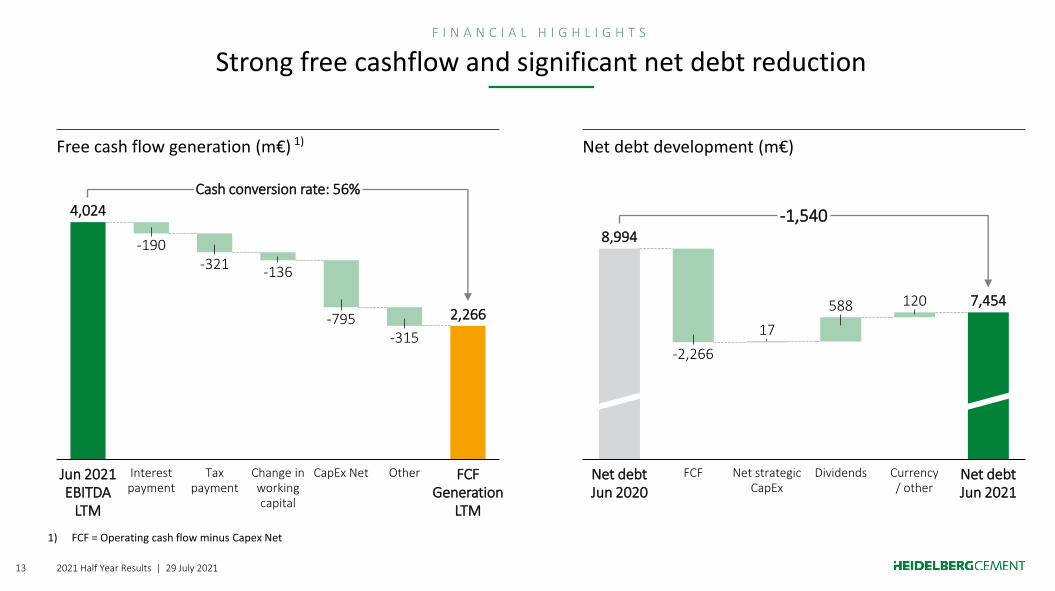
Strong free cashflow and significant net debt reduction
Net debt development (m€)Free cash flow generation (m€) 1)
4,024
2,266
Interest payment
CapEx NetTax payment
-190
Jun 2021 EBITDA
LTM
-321 -136
OtherChange in working capital
-795-315
FCF Generation
LTM
Cash conversion rate: 56%
17
588 120
8,994
Net debt Jun 2021
Net debt Jun 2020
-2,266
Net strategic CapEx
FCF Dividends Currency / other
7,454
-1,540
1) FCF = Operating cash flow minus Capex Net

2021 Half Year Results | 29 July 202114
Already announced cash generation and cash allocation priorities:
F I N A N C I A L H I G H L I G H T S
First half of the year marks major milestones in Beyond 2020 Strategy
DividendDeleveragingOperating Cash Flow
Disposals CapEx Net ExcessCash
Commitment:Progressive
dividend
Commitment:
• Leverage 1.5x to 2.0x
• BBB flat rating
U.S. West Region disposal is announced
with a value of 2.3 b$
Year-end leverage at the lower
end of 1.5x - 2.0x
Share buyback program announced with total amount of up to 1 billion EURFaster than
expected return to
progressive dividend policy
Full year spending
below 1.2 b€
We continuously check for growth
opportunities through bolt-on M&As
Shareholder return
Growth
✓ ✓ ✓ ✓✓

2021 Half Year Results | 29 July 202115
Apr
S U S T A I N A B I L I T Y
Delivering on our ESG agenda – Q2 2021 highlights
May Jun
Publication of our Sustainability Report 2021
AGM resolution to include CO2 target in compensation scheme
Dr. Nicola Kimm to become new Board Member responsible for ESG, Global R&D, and New Technologies
Quarry Life Award –we open our quarries for the unique biodiversity competition
German Innovation Award for 3D printed house
Building the world’s first carbon-neutral cement plant at our Sliteplant in Sweden
Rating upgrades from S&P to BBB with stable outlook and Moody’s to Baa2

2021 Half Year Results | 29 July 202116
S U S T A I N A B I L I T Y
EU program “Fit for 55” – CBAM can improve carbon leakage protection in Europe
We welcome the Commission’s ambition to align the EU rules with the Green Deal
We support a strengthened carbon price in combination with a Carbon Border Adjustment Mechanism (CBAM) in order to support the industrial transformation and much needed breakthrough technologies
We request a seamless transition from free allocation with the objective to avoid carbon leakage
We ask not to exclude any individual sector to allow for the desired effect and keep a level playing field
We expect contributions from all stakeholders including industry, politics, and society to reach the increased ambition
We will analyse the impact of the proposal in more detail and closely monitor and engage in the political
discussions and negotiations over the coming years
2021 Half Year Results | 29 July 202117
S U S T A I N A B I L I T Y
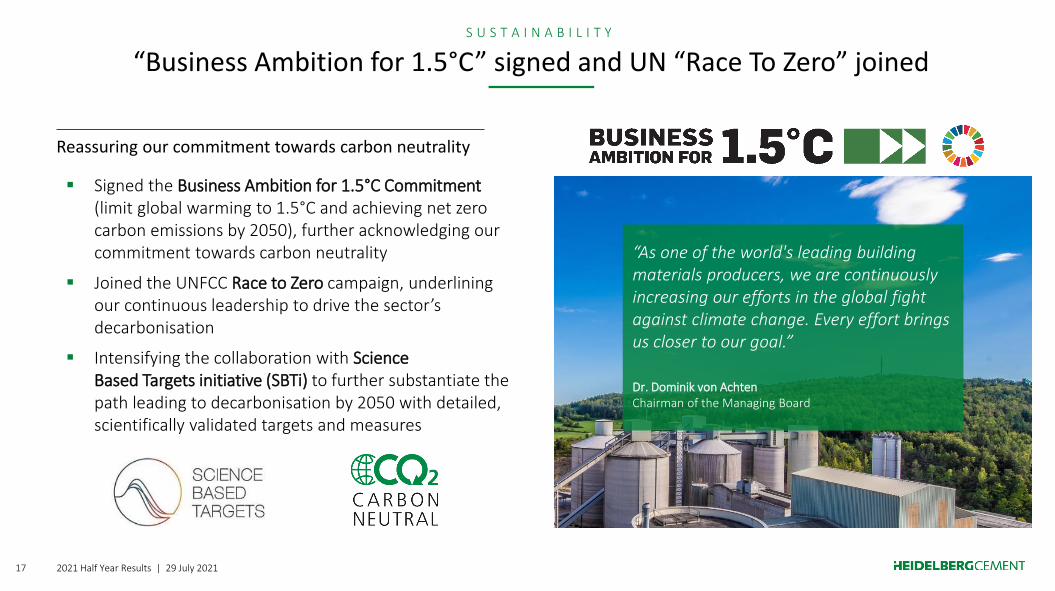
“Business Ambition for 1.5°C” signed and UN “Race To Zero” joined
Reassuring our commitment towards carbon neutrality
“As one of the world's leading building materials producers, we are continuously increasing our efforts in the global fight against climate change. Every effort brings us closer to our goal.”
Dr. Dominik von AchtenChairman of the Managing Board
▪ Signed the Business Ambition for 1.5°C Commitment (limit global warming to 1.5°C and achieving net zero carbon emissions by 2050), further acknowledging our commitment towards carbon neutrality
▪ Joined the UNFCC Race to Zero campaign, underlining our continuous leadership to drive the sector’s decarbonisation
▪ Intensifying the collaboration with Science Based Targets initiative (SBTi) to further substantiate the path leading to decarbonisation by 2050 with detailed, scientifically validated targets and measures

2021 Half Year Results | 29 July 202118
Solid demand growth in all major countries
U.S.
Order backlogs and economic conditions are generally solid in most of the markets. Demand growth expected. Recent leading indicators and large government stimulus provides further potential.
Canada
Positive volume development in key markets with carry-over projects from PY, low interest rates, surge in residential and stimulus funding.
U.K.
Demand growth expected in all business lines, driven mainly by increase in infrastructure activity.
Italy
Solid market driven by both announced infrastructure projects and pick up in residential demand.
Germany
Market demand expected to continue on high levels driven by residential and infrastructure segments.
Poland
Positive demand growth in all business lines driven by good development of the residential and some infrastructure projects.
Australia
Solid demand across the country expected to continue in the second half. Recent Covid-related shutdowns may put pressure in short term.
Indonesia
Underlying market demand continues to be reassuring, but Covid-19 challenges remain for H2.
Egypt
Market stabilization expected with the implementation of government-controlled production quota.
O U T L O O K & K E Y T A K E A W A Y S

2021 Half Year Results | 29 July 202119
Initial guidance Updated guidance
Operational PerformanceSlight increase in LfL operating EBITDA and operating EBIT
Strong increase in LfL operating EBITDA and operating EBIT
CapEx Net * 1.2 billion EUR Below 1.2 billion EUR
ROIC Above 8% Clearly above 8%
Leverage 1.5x to 2.0x At the lower end of “1.5x to 2.0x”
Full year 2021 guidance raised as a result of very good business developmentO U T L O O K & K E Y T A K E A W A Y S
* Tangible fixed assets only, without M&A and growth CapEx
▪ Substantial increase in results in Q2 2021 – revenue +18%, operating EBITDA +22%, operating EBIT +36%; margin further improves by +76 bps (all like-for-like vs Q2 2020)
▪ Major step in portfolio optimization – disposal of US West region business
▪ High focus on shareholder returns – share buyback program with a total amount of up to 1 billion EUR announced
▪ Significant deleveraging – net debt down by 1.5 bn € vs. prior year, driven by solid cash flow generation; leverage at 1.9x
▪ Leadership position on path to decarbonization underlined –“Business Ambition for 1.5°C” signedand UN “Race To Zero” joined
▪ Guidance raised – strong operating EBITDA growth expected for the full year 2021
Key Messages Q2 2021
Appendix
2021 Half Year Results | 29 July 202122
A P P E N D I X
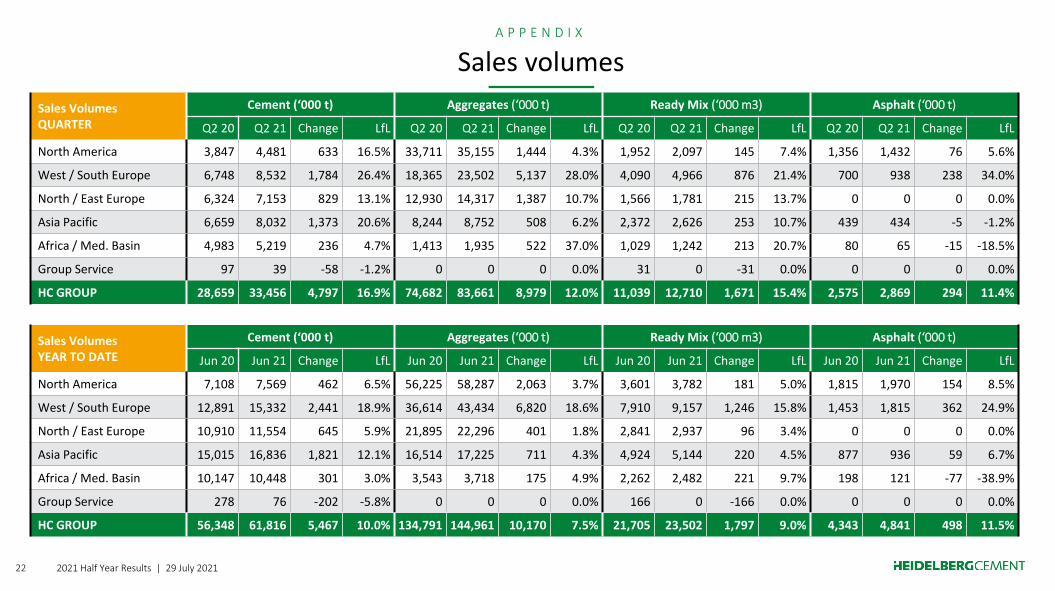
Sales volumes
Sales VolumesQUARTER
Cement (‘000 t) Aggregates (‘000 t) Ready Mix (‘000 m3) Asphalt (‘000 t)
Q2 20 Q2 21 Change LfL Q2 20 Q2 21 Change LfL Q2 20 Q2 21 Change LfL Q2 20 Q2 21 Change LfL
North America 3,847 4,481 633 16.5% 33,711 35,155 1,444 4.3% 1,952 2,097 145 7.4% 1,356 1,432 76 5.6%
West / South Europe 6,748 8,532 1,784 26.4% 18,365 23,502 5,137 28.0% 4,090 4,966 876 21.4% 700 938 238 34.0%
North / East Europe 6,324 7,153 829 13.1% 12,930 14,317 1,387 10.7% 1,566 1,781 215 13.7% 0 0 0 0.0%
Asia Pacific 6,659 8,032 1,373 20.6% 8,244 8,752 508 6.2% 2,372 2,626 253 10.7% 439 434 -5 -1.2%
Africa / Med. Basin 4,983 5,219 236 4.7% 1,413 1,935 522 37.0% 1,029 1,242 213 20.7% 80 65 -15 -18.5%
Group Service 97 39 -58 -1.2% 0 0 0 0.0% 31 0 -31 0.0% 0 0 0 0.0%
HC GROUP 28,659 33,456 4,797 16.9% 74,682 83,661 8,979 12.0% 11,039 12,710 1,671 15.4% 2,575 2,869 294 11.4%
Sales VolumesYEAR TO DATE
Cement (‘000 t) Aggregates (‘000 t) Ready Mix (‘000 m3) Asphalt (‘000 t)
Jun 20 Jun 21 Change LfL Jun 20 Jun 21 Change LfL Jun 20 Jun 21 Change LfL Jun 20 Jun 21 Change LfL
North America 7,108 7,569 462 6.5% 56,225 58,287 2,063 3.7% 3,601 3,782 181 5.0% 1,815 1,970 154 8.5%
West / South Europe 12,891 15,332 2,441 18.9% 36,614 43,434 6,820 18.6% 7,910 9,157 1,246 15.8% 1,453 1,815 362 24.9%
North / East Europe 10,910 11,554 645 5.9% 21,895 22,296 401 1.8% 2,841 2,937 96 3.4% 0 0 0 0.0%
Asia Pacific 15,015 16,836 1,821 12.1% 16,514 17,225 711 4.3% 4,924 5,144 220 4.5% 877 936 59 6.7%
Africa / Med. Basin 10,147 10,448 301 3.0% 3,543 3,718 175 4.9% 2,262 2,482 221 9.7% 198 121 -77 -38.9%
Group Service 278 76 -202 -5.8% 0 0 0 0.0% 166 0 -166 0.0% 0 0 0 0.0%
HC GROUP 56,348 61,816 5,467 10.0% 134,791 144,961 10,170 7.5% 21,705 23,502 1,797 9.0% 4,343 4,841 498 11.5%

2021 Half Year Results | 29 July 202123
A P P E N D I X
Operating result
Operating ResultQUARTER
Revenues (m€) Operating EBITDA (m€) Operating EBIT / RCO (m€) EBITDA Margin
Q2 20 Q2 21 Change LfL Q2 20 Q2 21 Change LfL Q2 20 Q2 21 Change LfL Q2 20 Q2 21 Change LfL
North America 1,216 1,269 4.4% 12.2% 288 335 16.2% 25.2% 191 251 31.6% 42.1% 23.7% 26.4% +268 bps +274 bps
West / South Europe 1,182 1,531 29.5% 29.0% 244 310 27.3% 27.4% 143 214 49.6% 49.7% 20.6% 20.3% -35 bps -26 bps
North / East Europe 765 867 13.4% 12.4% 231 254 10.3% 11.4% 183 207 13.2% 14.7% 30.2% 29.3% -83 bps -25 bps
Asia Pacific 667 754 13.0% 13.5% 149 161 8.4% 8.4% 85 103 21.3% 20.1% 22.3% 21.4% -92 bps -100 bps
Africa / Med. Basin 410 460 12.3% 17.4% 96 128 33.4% 40.0% 69 102 48.5% 57.1% 23.5% 27.9% +442 bps +451 bps
Group Service 201 360 79.2% 81.7% 4 7 74.0% 70.3% 2 7 219.7% 129.3% 2.1% 2.0% -6 bps -13 bps
HC GROUP 4,324 4,980 15.2% 17.9% 998 1,182 18.4% 21.8% 651 862 32.3% 36.0% 23.1% 23.7% +64 bps +76 bps
Operating ResultYEAR TO DATE
Revenues (m€) Operating EBITDA (m€) Operating EBIT / RCO (m€) EBITDA Margin
Jun 20 Jun 21 Change LfL Jun 20 Jun 21 Change LfL Jun 20 Jun 21 Change LfL Jun 20 Jun 21 Change LfL
North America 2,136 2,118 -0.9% 7.0% 340 414 21.9% 31.6% 146 247 69.1% 82.5% 15.9% 19.6% +366 bps +366 bps
West / South Europe 2,287 2,767 21.0% 21.2% 306 431 40.9% 41.5% 103 241 133.2% 133.4% 13.4% 15.6% +221 bps +224 bps
North / East Europe 1,349 1,438 6.6% 6.6% 294 322 9.5% 11.0% 197 228 15.4% 17.0% 21.8% 22.4% +59 bps +89 bps
Asia Pacific 1,403 1,520 8.3% 9.4% 280 319 14.1% 15.4% 150 201 34.3% 35.3% 19.9% 21.0% +107 bps +109 bps
Africa / Med. Basin 853 904 5.9% 11.6% 192 243 26.7% 32.9% 137 191 38.9% 46.3% 22.5% 26.9% +443 bps +432 bps
Group Service 499 623 24.9% 28.7% 10 13 38.4% 49.6% 7 13 75.4% 65.8% 1.9% 2.1% +21 bps +31 bps
HC GROUP 8,254 8,938 8.3% 11.4% 1,404 1,720 22.6% 26.4% 710 1,084 52.7% 57.4% 17.0% 19.2% +224 bps +228 bps
2021 Half Year Results | 29 July 202124
A P P E N D I X
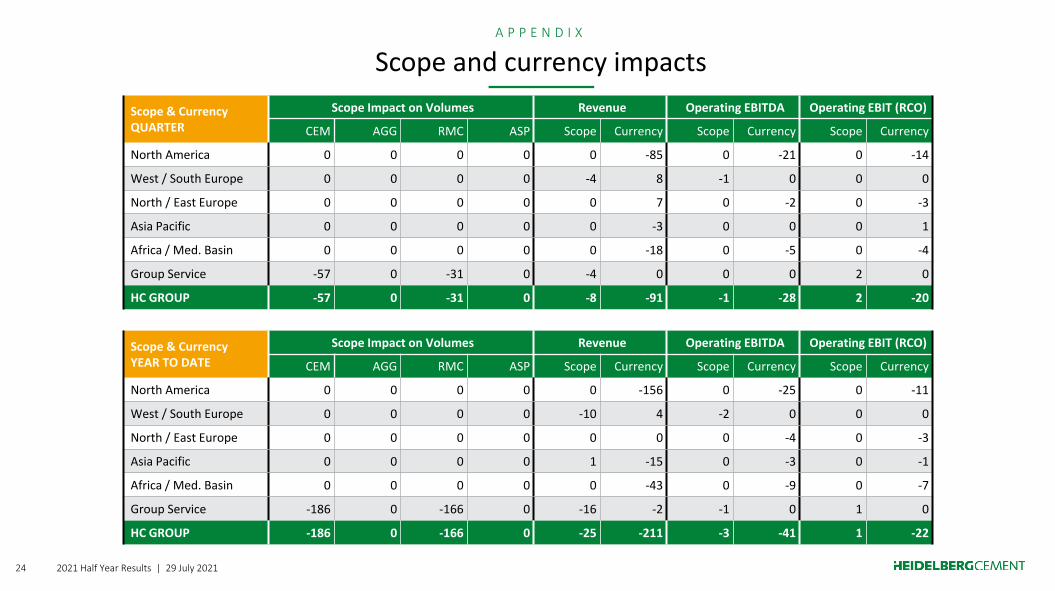
Scope and currency impacts
Scope & CurrencyQUARTER
Scope Impact on Volumes Revenue Operating EBITDA Operating EBIT (RCO)
CEM AGG RMC ASP Scope Currency Scope Currency Scope Currency
North America 0 0 0 0 0 -85 0 -21 0 -14
West / South Europe 0 0 0 0 -4 8 -1 0 0 0
North / East Europe 0 0 0 0 0 7 0 -2 0 -3
Asia Pacific 0 0 0 0 0 -3 0 0 0 1
Africa / Med. Basin 0 0 0 0 0 -18 0 -5 0 -4
Group Service -57 0 -31 0 -4 0 0 0 2 0
HC GROUP -57 0 -31 0 -8 -91 -1 -28 2 -20
Scope & CurrencyYEAR TO DATE
Scope Impact on Volumes Revenue Operating EBITDA Operating EBIT (RCO)
CEM AGG RMC ASP Scope Currency Scope Currency Scope Currency
North America 0 0 0 0 0 -156 0 -25 0 -11
West / South Europe 0 0 0 0 -10 4 -2 0 0 0
North / East Europe 0 0 0 0 0 0 0 -4 0 -3
Asia Pacific 0 0 0 0 1 -15 0 -3 0 -1
Africa / Med. Basin 0 0 0 0 0 -43 0 -9 0 -7
Group Service -186 0 -166 0 -16 -2 -1 0 1 0
HC GROUP -186 0 -166 0 -25 -211 -3 -41 1 -22

2021 Half Year Results | 29 July 202125
F I N A N C I A L C A L E N D A R
Contact information and financial calendar
Date Events
7 September 2021 Exane BNP Paribas ESG Conference
9 September 2021 Davy Building Materials & Industrials Conference
21 September 2021 GS / Berenberg German Corporate Conference
23 September 2021 Metzler Dialogue
29 September 2021 Barclays Construction and Infra Conference
30 September 2021 JP Morgan European All Stars Conference
7 October 2021 Société Générale ESG / SRI Conference
4 November 2021 Q3 2021 Results
9 November 2021 UBS European Virtual Conference
30 November 2021 BofA Materials & Infrastructure Conference
1 December 2021 Goldman Sachs Industrial Conference
2 December 2021 Société Générale Premium Review Conference
Contact Information
Christoph Beumelburg
Director Group Communication & Investor Relations
Phone: +49 (0) 6221 481 13249
Ozan Kacar
Head of Investor Relations
Phone: +49 (0) 6221 481 13925
Katharina Forster
Senior Investor Relations Manager
Phone: +49 (0) 6221 481 41016
Samuel Jacob
Investor Relations Manager
Phone: +49 (0) 6221 481 39670

DisclaimerUnless otherwise indicated, the financial information provided herein has been prepared
under International Financial Reporting Standards (IFRS).
This presentation contains forward-looking statements and information. Forward-looking
statements and information are statements that are not historical facts, related to
future, not past, events. They include statements about our believes and expectations
and the assumptions underlying them. These statements and information are based
on plans, estimates, projections as they are currently available to the management of
HeidelbergCement. Forward-looking statements and information therefore speak only
as of the date they are made, and we undertake no obligation to update publicly any
of them in light of new information or future events.
By their very nature, forward-looking statements and information are subject to certain
risks and uncertainties. A variety of factors, many of which are beyond
HeidelbergCement’s control, could cause actual results to defer materially from those
that may be expressed or implied by such forward-looking statement or information.
For HeidelbergCement particular uncertainties arise, among others, from changes in
general economic and business conditions in Germany, in Europe, in the United States
and elsewhere from which we derive a substantial portion of our revenues and in
which we hold a substantial portion of our assets; the possibility that prices will decline
as result of continued adverse market conditions to a greater extent than currently
anticipated by HeidelbergCement’s management; developments in the financial
markets, including fluctuations in interest and exchange rates, commodity and equity
prices, debt prices (credit spreads) and financial assets generally; continued volatility
and a further deterioration of capital markets; a worsening in the conditions of the
credit business and, in particular, additional uncertainties arising out of the subprime,
financial market and liquidity crises; the outcome of pending investigations and legal
proceedings and actions resulting from the findings of these investigations; as well as
various other factors.
More detailed information about certain of the risk factors affecting
HeidelbergCement is contained throughout this presentation and in
HeidelbergCement’s financial reports, which are available on the HeidelbergCement
website, www.heidelbergcement.com. Should one or more of these risks or
uncertainties materialize, or should underlying assumptions prove incorrect, actual
results may vary materially from those described in the relevant forward-looking
statement or information as expected, anticipated, intended, planned, believed,
sought, estimated or projected.
In addition to figures prepared in accordance with IFRS, HeidelbergCement also
presents alternative performance measures, including, among others Operating
EBITDA, EBITDA margin, Adjusted EPS, free cash flow and net debt. These alternative
performance measures should be considered in addition to, but not as a substitute
for, the information prepared in accordance with IFRS. Alternative performance
measures are not subject to IFRS or any other generally accepted accounting
principles. Other companies may define these terms in different ways.
“Operating EBITDA” definition included in this presentation represents “Result from
current operations before depreciation and amortization (RCOBD)” and “Operating
Income” represents “Result from current operations (RCO)” lines in the annual and
interim reports.