Embed Size (px)
Citation preview
2021 HALF YEARFINANCIAL RESULTS PRESENTATION17 May 2021Incitec Pivot Limited ABN 42 004 080 264ASX Code: IPL OTC: INCZY
Disclaimer
This presentation has been prepared by Incitec Pivot Limited (“IPL”). The information contained in this presentation is for information
purposes only. The information contained in this presentation is not investment or financial product advice and is not intended to be
used as the basis for making an investment decision. This presentation has been prepared without taking into account the investment
objectives, financial situation or particular needs of any particular person.
No representation or warranty, express or implied, is made as to the fairness, accuracy, completeness or correctness of the information, opinions and
conclusions contained in this presentation. To the maximum extent permitted by law, none of IPL, its directors, employees or agents, nor any other
person accepts any liability, including, without limitation, any liability arising out of fault or negligence for any loss arising from the use of the information
contained in this presentation.
In particular, no representation or warranty, express or implied, is given as to the accuracy, completeness or correctness, likelihood of achievement or
reasonableness of any forecasts, prospects or returns (“forward-looking statements”) contained in this presentation nor is any obligation assumed to update
such information. Such forward-looking statements are based on information and assumptions known to date and are by their nature subject
to significant uncertainties and contingencies. Actual results, performance or achievements could be significantly different from those expressed in,
or implied by, this presentation. Forward-looking statements are not guarantees of future performance.
Before making an investment decision, you should consider, with or without the assistance of a financial adviser, whether an investment is appropriate
in light of your particular investment needs, objectives and financial circumstances. Past performance is no guarantee of future performance.
Incitec Pivot Limited ABN 42 004 080 264
2

3
OVERVIEWJeanne JohnsManaging Director & Chief Executive Officer
1
1
0
3
0
1
0
1H18 FY18 1H19 FY19 1H20 FY20 1H21
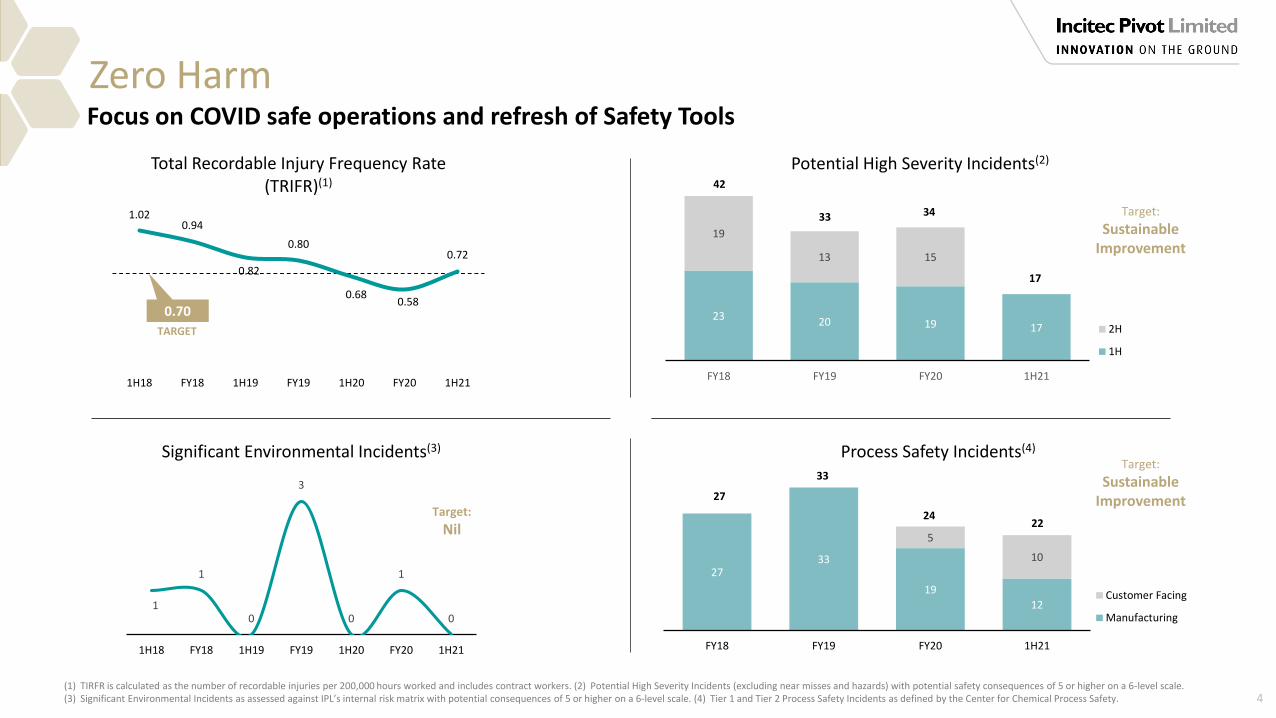
Significant Environmental Incidents(3)
2733
19
12
5
10
FY18 FY19 FY20 1H21
Process Safety Incidents(4)
Customer Facing
Manufacturing
27
33
24
23 20 19 17
19
13 15
FY18 FY19 FY20 1H21
Potential High Severity Incidents(2)
2H
1H
Zero Harm
Target:
Nil
(1) TIRFR is calculated as the number of recordable injuries per 200,000 hours worked and includes contract workers. (2) Potential High Severity Incidents (excluding near misses and hazards) with potential safety consequences of 5 or higher on a 6-level scale. (3) Significant Environmental Incidents as assessed against IPL’s internal risk matrix with potential consequences of 5 or higher on a 6-level scale. (4) Tier 1 and Tier 2 Process Safety Incidents as defined by the Center for Chemical Process Safety.
Focus on COVID safe operations and refresh of Safety Tools
Target:
SustainableImprovement
Target:
SustainableImprovement
0.70
4
42
33 341.020.94
0.82
0.80
0.680.58
0.72
1H18 FY18 1H19 FY19 1H20 FY20 1H21
Total Recordable Injury Frequency Rate (TRIFR)(1)
0.70
TARGET
22
17
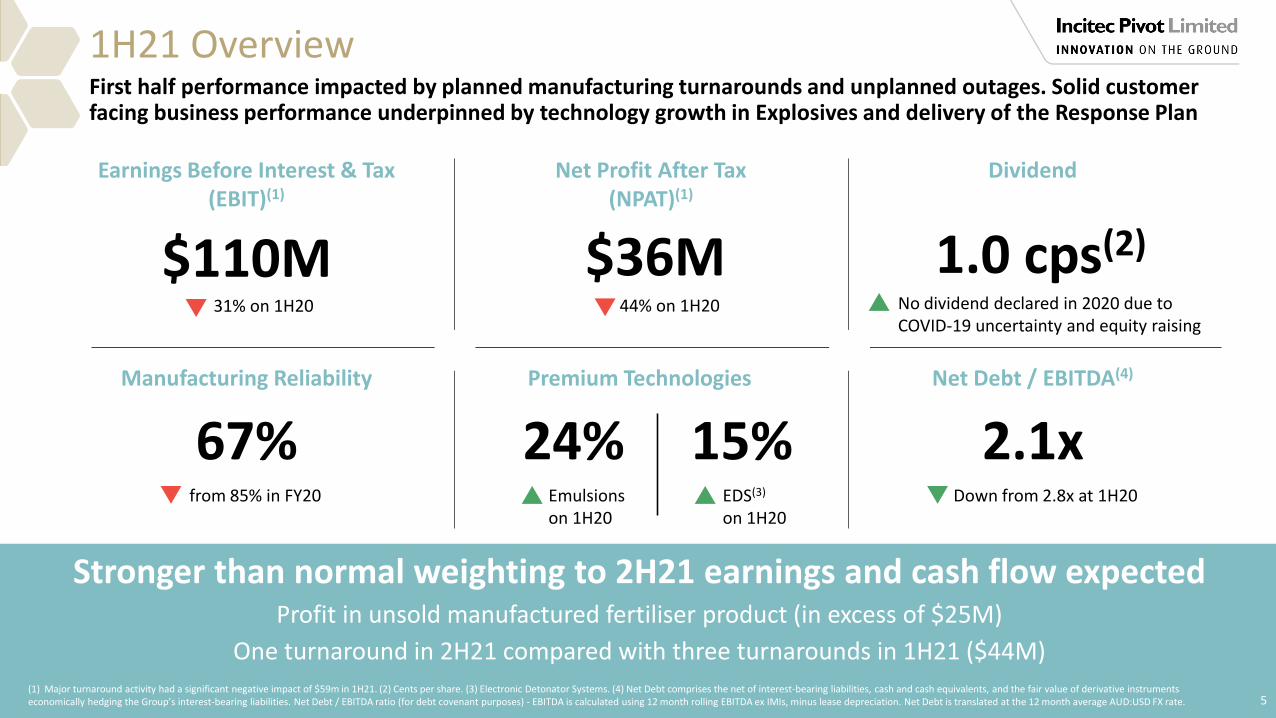
EDS(3)
on 1H20
5
1H21 OverviewFirst half performance impacted by planned manufacturing turnarounds and unplanned outages. Solid customer facing business performance underpinned by technology growth in Explosives and delivery of the Response Plan
Premium Technologies
24% 15%
(1) Major turnaround activity had a significant negative impact of $59m in 1H21. (2) Cents per share. (3) Electronic Detonator Systems. (4) Net Debt comprises the net of interest-bearing liabilities, cash and cash equivalents, and the fair value of derivative instruments economically hedging the Group’s interest-bearing liabilities. Net Debt / EBITDA ratio (for debt covenant purposes) - EBITDA is calculated using 12 month rolling EBITDA ex IMIs, minus lease depreciation. Net Debt is translated at the 12 month average AUD:USD FX rate.
Net Debt / EBITDA(4)
2.1xDown from 2.8x at 1H20
Manufacturing Reliability
67%from 85% in FY20
Net Profit After Tax (NPAT)(1)
$36M
Earnings Before Interest & Tax (EBIT)(1)
$110M31% on 1H20
Emulsions on 1H20
44% on 1H20
Stronger than normal weighting to 2H21 earnings and cash flow expectedProfit in unsold manufactured fertiliser product (in excess of $25M)
One turnaround in 2H21 compared with three turnarounds in 1H21 ($44M)
Dividend
1.0 cps(2)
No dividend declared in 2020 due to COVID-19 uncertainty and equity raising
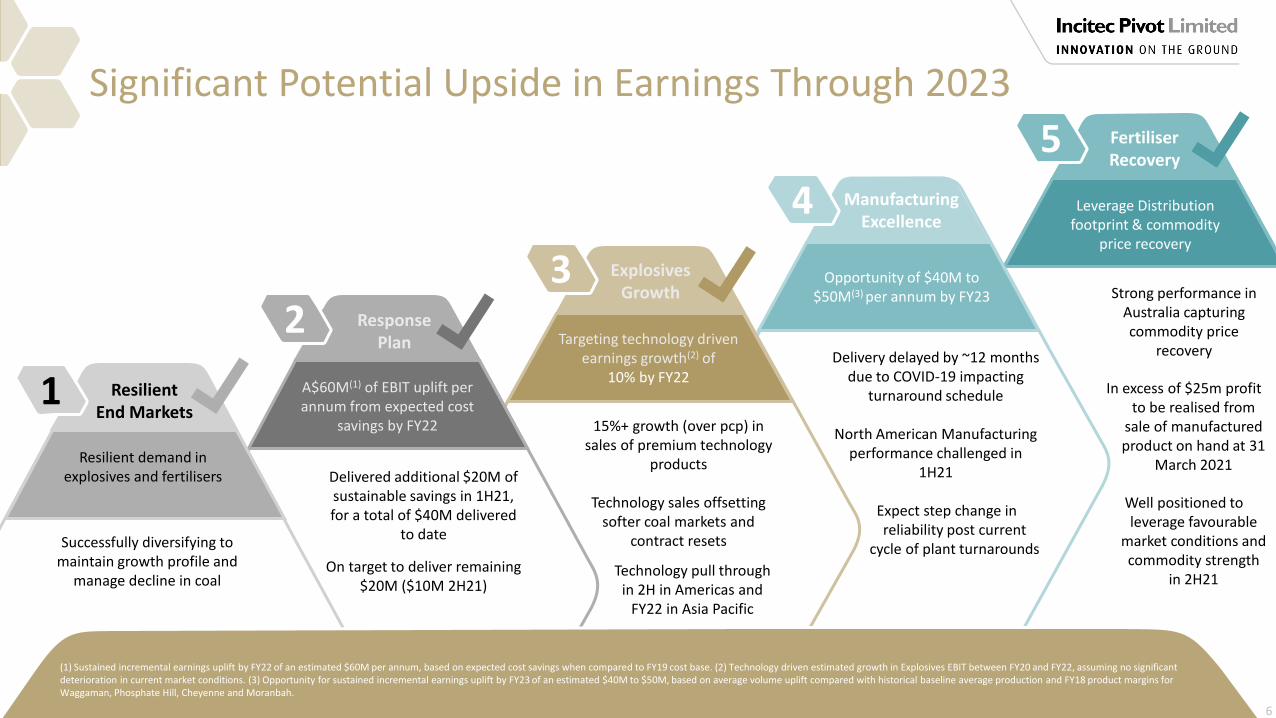
Successfully diversifying to maintain growth profile and
manage decline in coal
Delivered additional $20M of sustainable savings in 1H21, for a total of $40M delivered
to date
On target to deliver remaining $20M ($10M 2H21)
15%+ growth (over pcp) in sales of premium technology
products
Technology sales offsetting softer coal markets and
contract resets
Technology pull through in 2H in Americas and
FY22 in Asia Pacific
1 Resilient End Markets
Response Plan
2
Explosives Growth
3
Manufacturing Excellence
4
Fertiliser Recovery
5
Significant Potential Upside in Earnings Through 2023
Strong performance in Australia capturing commodity price
recovery
In excess of $25m profit to be realised from
sale of manufactured product on hand at 31
March 2021
Well positioned to leverage favourable
market conditions and commodity strength
in 2H21
(1) Sustained incremental earnings uplift by FY22 of an estimated $60M per annum, based on expected cost savings when compared to FY19 cost base. (2) Technology driven estimated growth in Explosives EBIT between FY20 and FY22, assuming no significant deterioration in current market conditions. (3) Opportunity for sustained incremental earnings uplift by FY23 of an estimated $40M to $50M, based on average volume uplift compared with historical baseline average production and FY18 product margins for Waggaman, Phosphate Hill, Cheyenne and Moranbah.
A$60M(1) of EBIT uplift per annum from expected cost
savings by FY22
Resilient demand in explosives and fertilisers
Leverage Distribution footprint & commodity
price recovery
Opportunity of $40M to $50M(3) per annum by FY23
Targeting technology driven earnings growth(2) of
10% by FY22
6
Delivery delayed by ~12 months due to COVID-19 impacting
turnaround schedule
North American Manufacturing performance challenged in
1H21
Expect step change in reliability post current
cycle of plant turnarounds
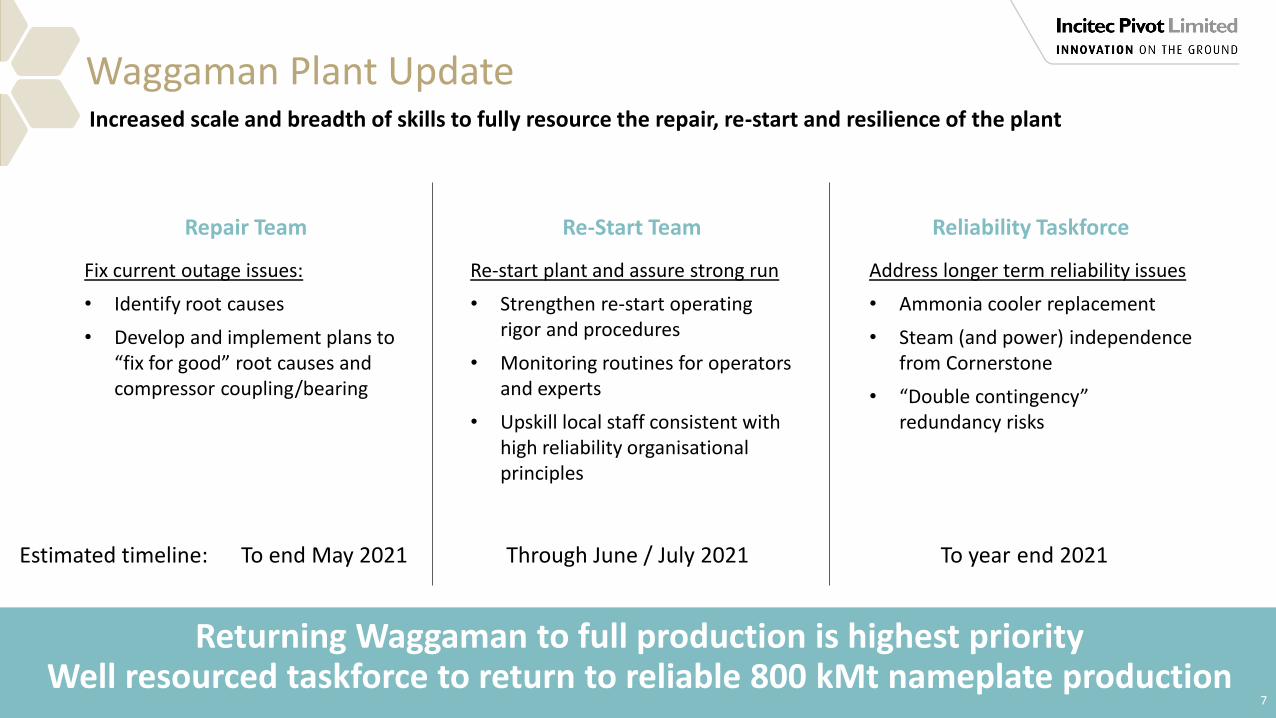
Returning Waggaman to full production is highest priorityWell resourced taskforce to return to reliable 800 kMt nameplate production
7
Waggaman Plant Update
Reliability Taskforce
Address longer term reliability issues
• Ammonia cooler replacement
• Steam (and power) independence from Cornerstone
• “Double contingency” redundancy risks
Repair Team
Fix current outage issues:
• Identify root causes
• Develop and implement plans to “fix for good” root causes and compressor coupling/bearing
Re-Start Team
Re-start plant and assure strong run
• Strengthen re-start operating rigor and procedures
• Monitoring routines for operators and experts
• Upskill local staff consistent with high reliability organisational principles
Increased scale and breadth of skills to fully resource the repair, re-start and resilience of the plant
Estimated timeline: To end May 2021 Through June / July 2021 To year end 2021
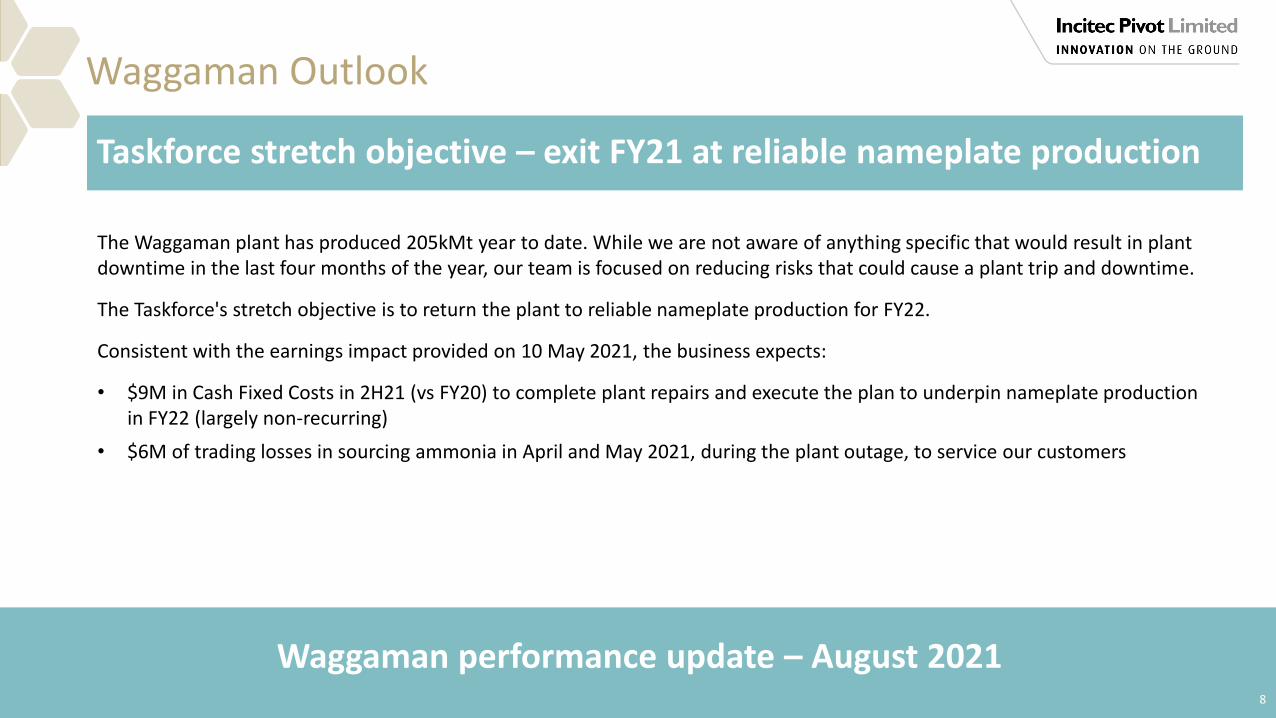
Waggaman performance update – August 20218
Waggaman Outlook
The Waggaman plant has produced 205kMt year to date. While we are not aware of anything specific that would result in plant downtime in the last four months of the year, our team is focused on reducing risks that could cause a plant trip and downtime.
The Taskforce's stretch objective is to return the plant to reliable nameplate production for FY22.
Consistent with the earnings impact provided on 10 May 2021, the business expects:
• $9M in Cash Fixed Costs in 2H21 (vs FY20) to complete plant repairs and execute the plan to underpin nameplate production in FY22 (largely non-recurring)
• $6M of trading losses in sourcing ammonia in April and May 2021, during the plant outage, to service our customers
Taskforce stretch objective – exit FY21 at reliable nameplate production
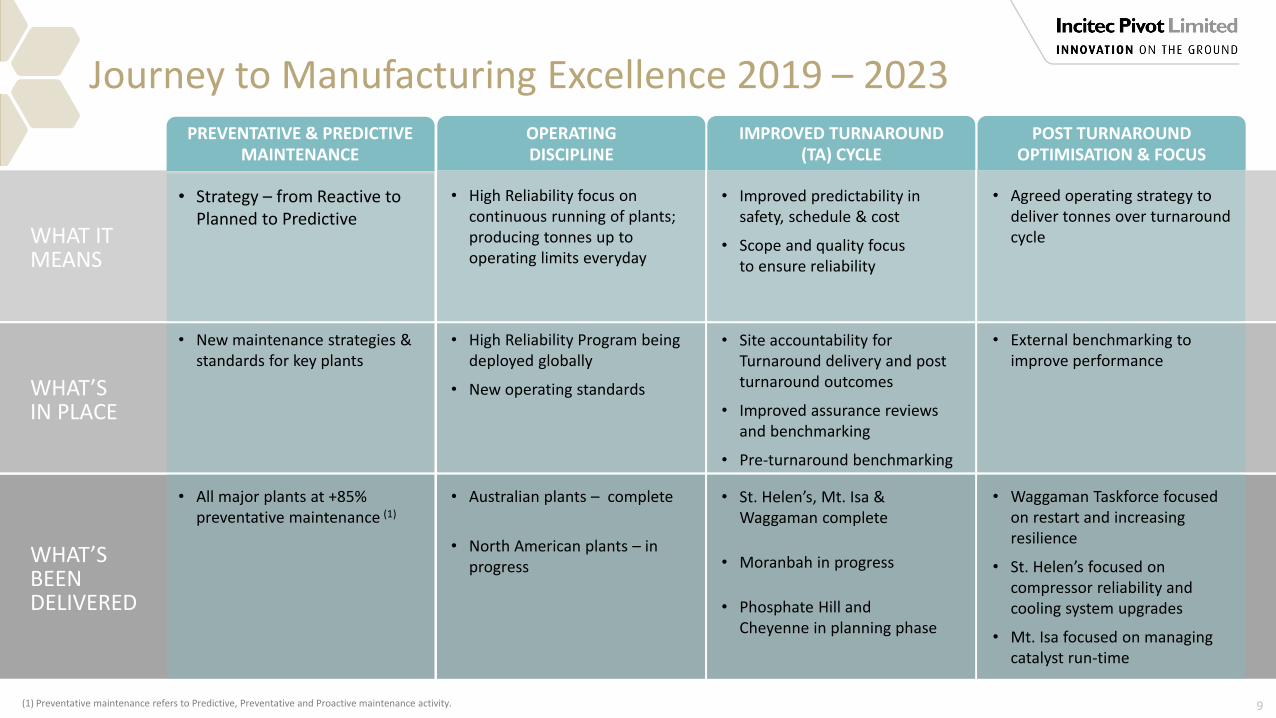
WHAT IT MEANS
WHAT’S IN PLACE
WHAT’S BEENDELIVERED
Journey to Manufacturing Excellence 2019 – 2023
• Strategy – from Reactive to Planned to Predictive
• High Reliability focus on continuous running of plants; producing tonnes up to operating limits everyday
• Improved predictability in safety, schedule & cost
• Scope and quality focus to ensure reliability
• Agreed operating strategy to deliver tonnes over turnaround cycle
OPERATING DISCIPLINE
IMPROVED TURNAROUND (TA) CYCLE
POST TURNAROUND OPTIMISATION & FOCUS
• New maintenance strategies & standards for key plants
• High Reliability Program being deployed globally
• New operating standards
• Site accountability for Turnaround delivery and post turnaround outcomes
• Improved assurance reviews and benchmarking
• Pre-turnaround benchmarking
• External benchmarking to improve performance
• All major plants at +85% preventative maintenance (1)
• Australian plants – complete
• North American plants – in progress
• St. Helen’s, Mt. Isa & Waggaman complete
• Moranbah in progress
• Phosphate Hill and Cheyenne in planning phase
• Waggaman Taskforce focused on restart and increasing resilience
• St. Helen’s focused on compressor reliability and cooling system upgrades
• Mt. Isa focused on managing catalyst run-time
PREVENTATIVE & PREDICTIVE MAINTENANCE
9(1) Preventative maintenance refers to Predictive, Preventative and Proactive maintenance activity.

$40M to $50M Manufacturing Excellence delivery On target to deliver $40M-$50M, date extended to FY23 - turnaround delays due to COVID-19 impacts
Plant Contribution(1) Status Comments
Phosphate Hill $15M - $20M TA 2H22Well progressed on turnaround planning, mini turnarounds every 15 weeks reduce reliance on major turnaround
Waggaman $20M - $25M TA 1H21Focused attention post turnaround optimisation, WALA taskforce in place
Moranbah $5M TA 2H21 Well progressed, on track to hit target post 2H21 turnaround
Cheyenne $0M TA 2H22Managing known reliability issues, expect return to target post turnaround
Total $40M - $50M(2)
TA = Turnaround
10(1) Contribution measured against average 2016 to 2018 (Waggaman 2017 to 2018) performance and FY18 commodity prices. (2) Net of incremental cost of higher depreciation related to increased turnaround scope.

‘Clean’ hydrogen
Carbon capture & use or storage
N2O(1) abatement
Renewable electricity
Alternate feedstocks
11
Long Term Climate Change - Pathway to Net Zero EmissionsAs we work towards a low emissions future
97% from nitrogen manufacturing
38% from natural gas for ammonia feedstock
31% from natural gas for energy
16% from nitric acid N2O(1)
process emissions
8% from Scope 2 electricity(2)
4% from Scope 1 electricity(3) (natural gas)
Materiality & scale
TRL(4) of technologies
Access to critical infrastructure
Government policies (by jurisdiction)
Financing & ‘bankability’
Vendors & technology partners
Feasibility studies
Alignment with long-term asset strategies
Value chain partnerships
Government engagement
(1) Nitrous oxide. (2) Scope 2 greenhouse gas emissions are the emissions released to the atmosphere from the indirect consumption of an energy commodity. (3) Scope 1 greenhouse gas emissions are the emissions released to the atmosphere as a direct result of an activity, or series of activities at a facility level. Scope 1 emissions are sometimes referred to as direct emissions. (4) Technology readiness levels (TRLs) are a method for estimating the maturity of technologies during the acquisition phase of a program. The use of TRLs enables consistent, uniform discussions of technical maturity across different types of technology.
EVALUATEEMISSION SOURCES
The pathway to Net Zero will involve both risks and strategic business opportunities. IPL’s Decarbonisation and Energy Transition Steering Committee will pursue these opportunities.

12
GROUP FINANCIAL RESULTSNick StratfordChief Financial Officer
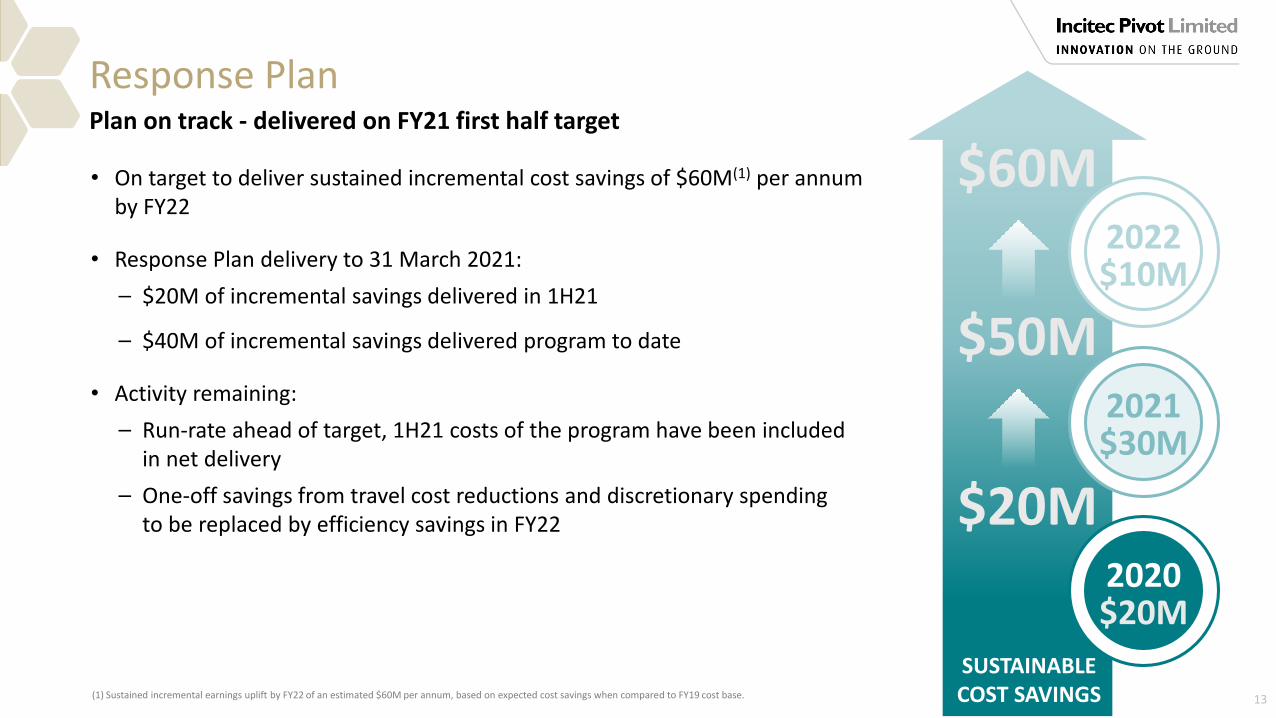
Response Plan
• On target to deliver sustained incremental cost savings of $60M(1) per annum by FY22
• Response Plan delivery to 31 March 2021:
⎯ $20M of incremental savings delivered in 1H21
⎯ $40M of incremental savings delivered program to date
• Activity remaining:
⎯ Run-rate ahead of target, 1H21 costs of the program have been included in net delivery
⎯ One-off savings from travel cost reductions and discretionary spending to be replaced by efficiency savings in FY22
13
Plan on track - delivered on FY21 first half target
(1) Sustained incremental earnings uplift by FY22 of an estimated $60M per annum, based on expected cost savings when compared to FY19 cost base.
2020$20M
2021$30M
2022$10M
$20M
$50M
$60M
SUSTAINABLECOST SAVINGS
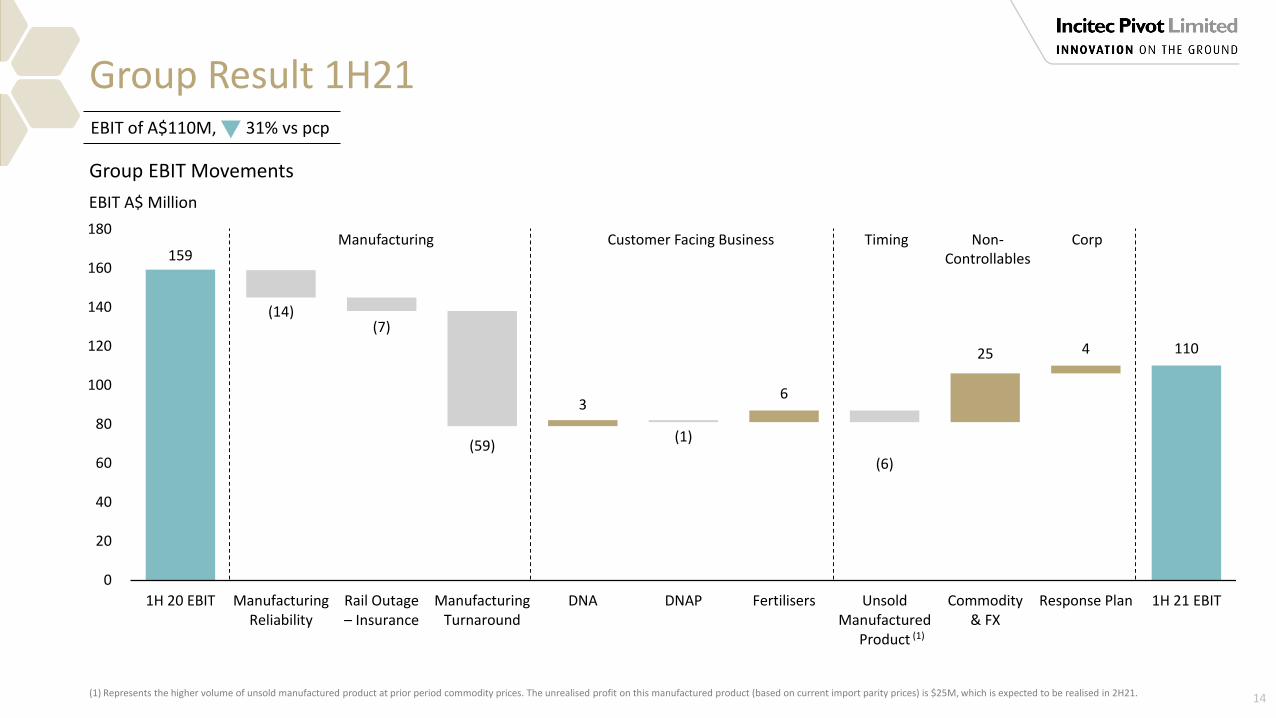
(1) Represents the higher volume of unsold manufactured product at prior period commodity prices. The unrealised profit on this manufactured product (based on current import parity prices) is $25M, which is expected to be realised in 2H21.
Group Result 1H21
14
Group EBIT Movements
EBIT of A$110M, 31% vs pcp
159
110
(14)(7)
(59)(1)
(6)
36
25 4
0
20
40
60
80
100
120
140
160
180
1H 20 EBIT ManufacturingReliability
Rail Outage – Insurance
ManufacturingTurnaround
DNA DNAP Fertilisers UnsoldManufactured
Product
Commodity& FX
Response Plan 1H 21 EBIT
EBIT A$ Million
(1)
Manufacturing Customer Facing Business Timing Non-Controllables
Corp
15
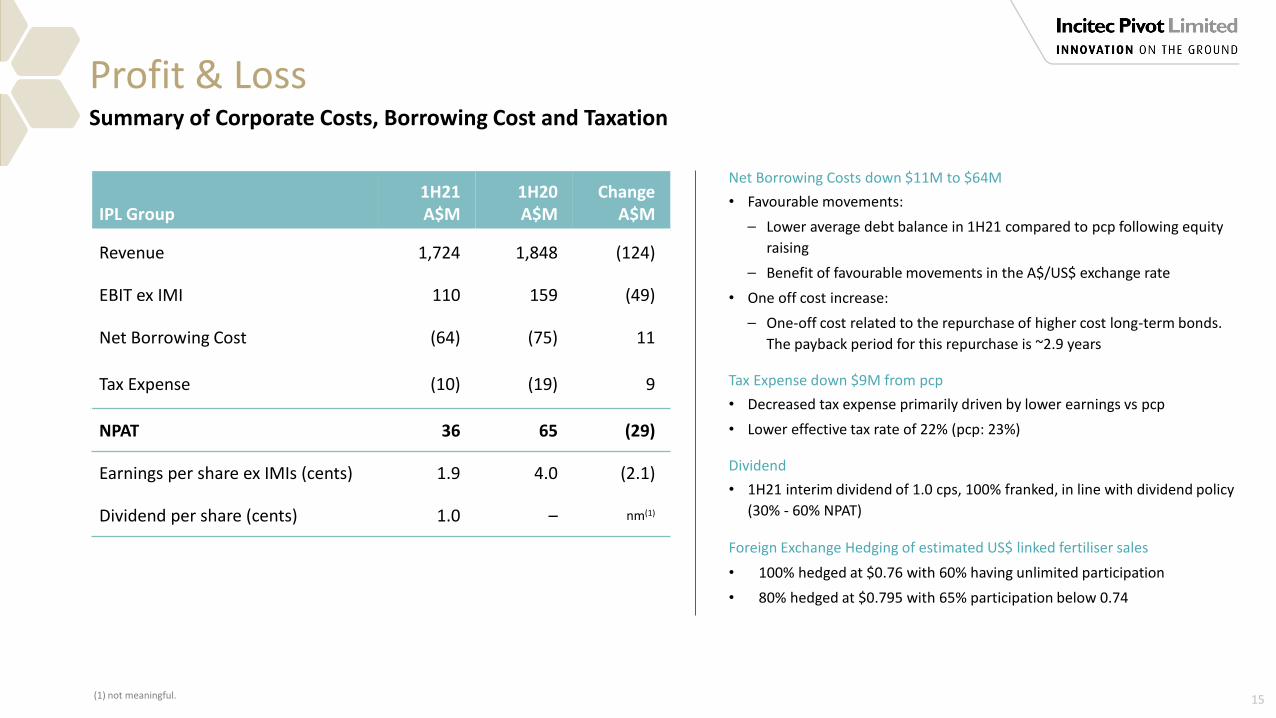
Summary of Corporate Costs, Borrowing Cost and Taxation
IPL Group1H21 A$M
1H20 A$M
ChangeA$M
Revenue 1,724 1,848 (124)
EBIT ex IMI 110 159 (49)
Net Borrowing Cost (64) (75) 11
Tax Expense (10) (19) 9
NPAT 36 65 (29)
Earnings per share ex IMIs (cents) 1.9 4.0 (2.1)
Dividend per share (cents) 1.0 – nm(1)
Profit & Loss
Net Borrowing Costs down $11M to $64M
• Favourable movements:
⎯ Lower average debt balance in 1H21 compared to pcp following equity
raising
⎯ Benefit of favourable movements in the A$/US$ exchange rate
• One off cost increase:
⎯ One-off cost related to the repurchase of higher cost long-term bonds.
The payback period for this repurchase is ~2.9 years
Tax Expense down $9M from pcp
• Decreased tax expense primarily driven by lower earnings vs pcp
• Lower effective tax rate of 22% (pcp: 23%)
Dividend
• 1H21 interim dividend of 1.0 cps, 100% franked, in line with dividend policy
(30% - 60% NPAT)
Foreign Exchange Hedging of estimated US$ linked fertiliser sales
• 100% hedged at $0.76 with 60% having unlimited participation
• 80% hedged at $0.795 with 65% participation below 0.74
(1) not meaningful.

16
Seasonal Trade Working Capital build supports strong 2H21 cash flow
Cash Flows
EBITDA ex IMIs down 15% vs pcp
• Operational cash flows impacted by reduced manufacturing
contributions from planned and unplanned outages
Trade Working Capital (TWC)
• Increase from pcp due to:
⎯ Unusually low movement in 1H20, impacted by high
September 2019 inventory balances
⎯ Reduction in the use of trade working capital financing
facilities
Capital Expenditure
• Sustenance capital spend is above pcp due to turnarounds at
Mt. Isa, St. Helens and Waggaman in the 1H21
Net Other
• Focus on balance sheet simplification and reduction of
derivative cash flows outside of operating result
Dividend Payments
• In light of ongoing uncertainty due to COVID-19 and IPL’s May
2020 equity raising, IPL did not pay a dividend in 1H21
(1) Free Cash Flow is calculated using Operating cash flows after Sustenance capital spend, Lease buy-outs, Growth capital spend, Lease liability payments and Other Investing cash outflows.
1H21 1H20 Change
Cash flow A$M A$M A$M
EBITDA 286 338 (52)
Interest paid (62) (77) 15
Tax paid (15) (12) (3)
Trade Working Capital (323) (178) (145)
Net Other 11 81 (70)
Operating cash flow (103) 152 (255)
Growth capital (17) (35) 18
Sustenance (141) (119) (22)
Net Other (3) (67) 64
Investing cash flow (161) (221) 60
Dividends paid - (31) 31
Translation of net debt (26) (71) 45
Net Other (14) (14) -
Financing Cash Flow (40) (116) 76
Change to Net Debt (304) (185) (119)
Opening balance Net Debt (1,029) (1,691) 662
Closing balance Net Debt (1,333) (1,876) 543
17
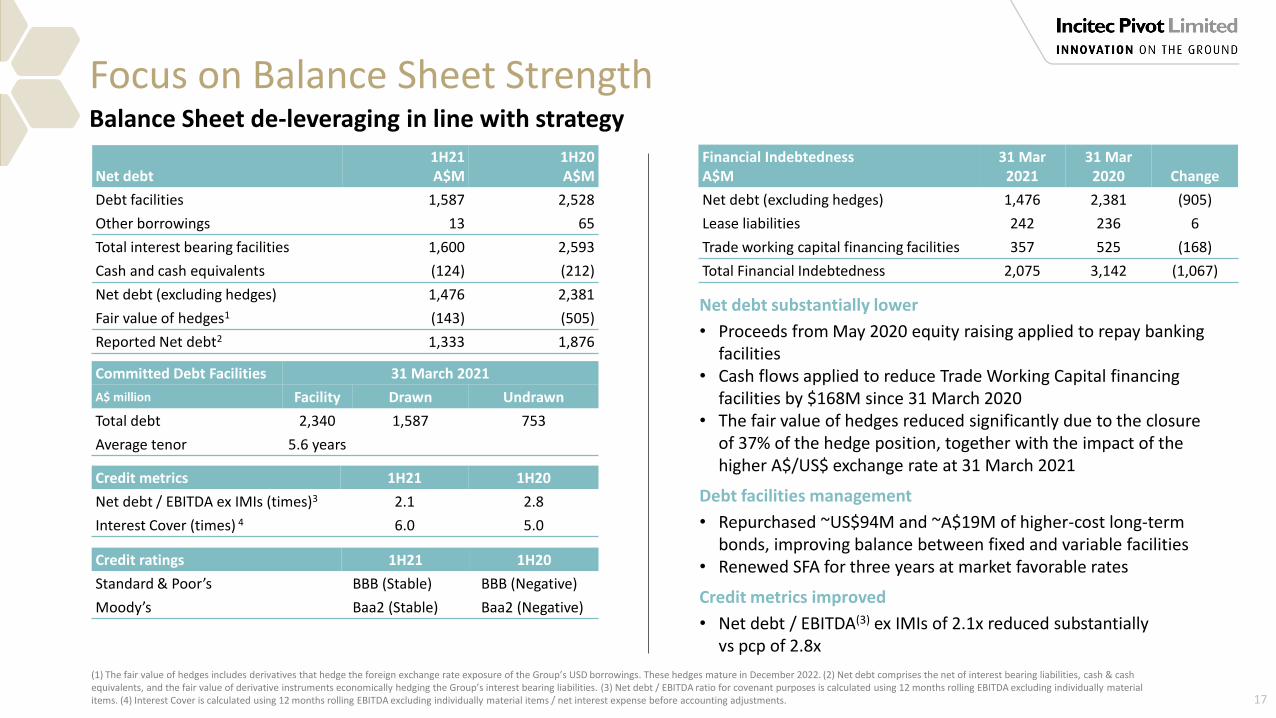
Focus on Balance Sheet StrengthBalance Sheet de-leveraging in line with strategy
(1) The fair value of hedges includes derivatives that hedge the foreign exchange rate exposure of the Group’s USD borrowings. These hedges mature in December 2022. (2) Net debt comprises the net of interest bearing liabilities, cash & cash equivalents, and the fair value of derivative instruments economically hedging the Group’s interest bearing liabilities. (3) Net debt / EBITDA ratio for covenant purposes is calculated using 12 months rolling EBITDA excluding individually material items. (4) Interest Cover is calculated using 12 months rolling EBITDA excluding individually material items / net interest expense before accounting adjustments.
Net debt substantially lower
• Proceeds from May 2020 equity raising applied to repay banking facilities
• Cash flows applied to reduce Trade Working Capital financing facilities by $168M since 31 March 2020
• The fair value of hedges reduced significantly due to the closure of 37% of the hedge position, together with the impact of the higher A$/US$ exchange rate at 31 March 2021
Debt facilities management
• Repurchased ~US$94M and ~A$19M of higher-cost long-term bonds, improving balance between fixed and variable facilities
• Renewed SFA for three years at market favorable rates
Credit metrics improved
• Net debt / EBITDA(3) ex IMIs of 2.1x reduced substantially vs pcp of 2.8x
Net debt1H21A$M
1H20A$M
Debt facilities 1,587 2,528
Other borrowings 13 65
Total interest bearing facilities 1,600 2,593
Cash and cash equivalents (124) (212)
Net debt (excluding hedges) 1,476 2,381
Fair value of hedges1 (143) (505)
Reported Net debt2 1,333 1,876
Committed Debt Facilities 31 March 2021
A$ million Facility Drawn Undrawn
Total debt 2,340 1,587 753
Average tenor 5.6 years
Credit metrics 1H21 1H20
Net debt / EBITDA ex IMIs (times)3 2.1 2.8
Interest Cover (times) 4 6.0 5.0
Credit ratings 1H21 1H20
Standard & Poor’s BBB (Stable) BBB (Negative)
Moody’s Baa2 (Stable) Baa2 (Negative)
Financial IndebtednessA$M
31 Mar 2021
31 Mar 2020 Change
Net debt (excluding hedges) 1,476 2,381 (905)
Lease liabilities 242 236 6
Trade working capital financing facilities 357 525 (168)
Total Financial Indebtedness 2,075 3,142 (1,067)
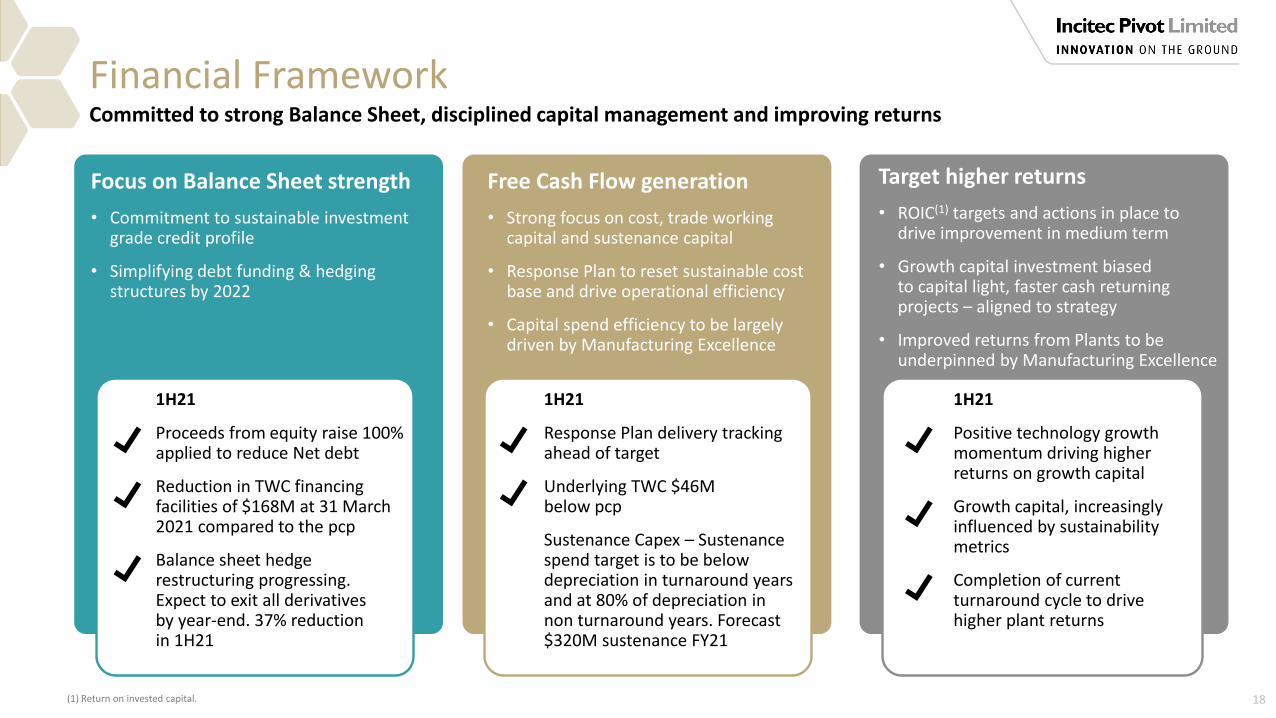
Financial Framework
Focus on Balance Sheet strength
• Commitment to sustainable investment grade credit profile
• Simplifying debt funding & hedging structures by 2022
Free Cash Flow generation
• Strong focus on cost, trade working capital and sustenance capital
• Response Plan to reset sustainable cost base and drive operational efficiency
• Capital spend efficiency to be largely driven by Manufacturing Excellence
Target higher returns
• ROIC(1) targets and actions in place to drive improvement in medium term
• Growth capital investment biased to capital light, faster cash returning projects – aligned to strategy
• Improved returns from Plants to be underpinned by Manufacturing Excellence
Committed to strong Balance Sheet, disciplined capital management and improving returns
1H21
Proceeds from equity raise 100% applied to reduce Net debt
Reduction in TWC financing facilities of $168M at 31 March 2021 compared to the pcp
Balance sheet hedge restructuring progressing. Expect to exit all derivatives by year-end. 37% reduction in 1H21
1H21
Response Plan delivery tracking ahead of target
Underlying TWC $46M below pcp
Sustenance Capex – Sustenance spend target is to be below depreciation in turnaround years and at 80% of depreciation in non turnaround years. Forecast $320M sustenance FY21
1H21
Positive technology growth momentum driving higher returns on growth capital
Growth capital, increasingly influenced by sustainability metrics
Completion of current turnaround cycle to drive higher plant returns
18(1) Return on invested capital.

OPERATING PERFORMANCE
Managing Director & Chief Executive OfficerJeanne Johns
20
Summary of Segment Financial Performance
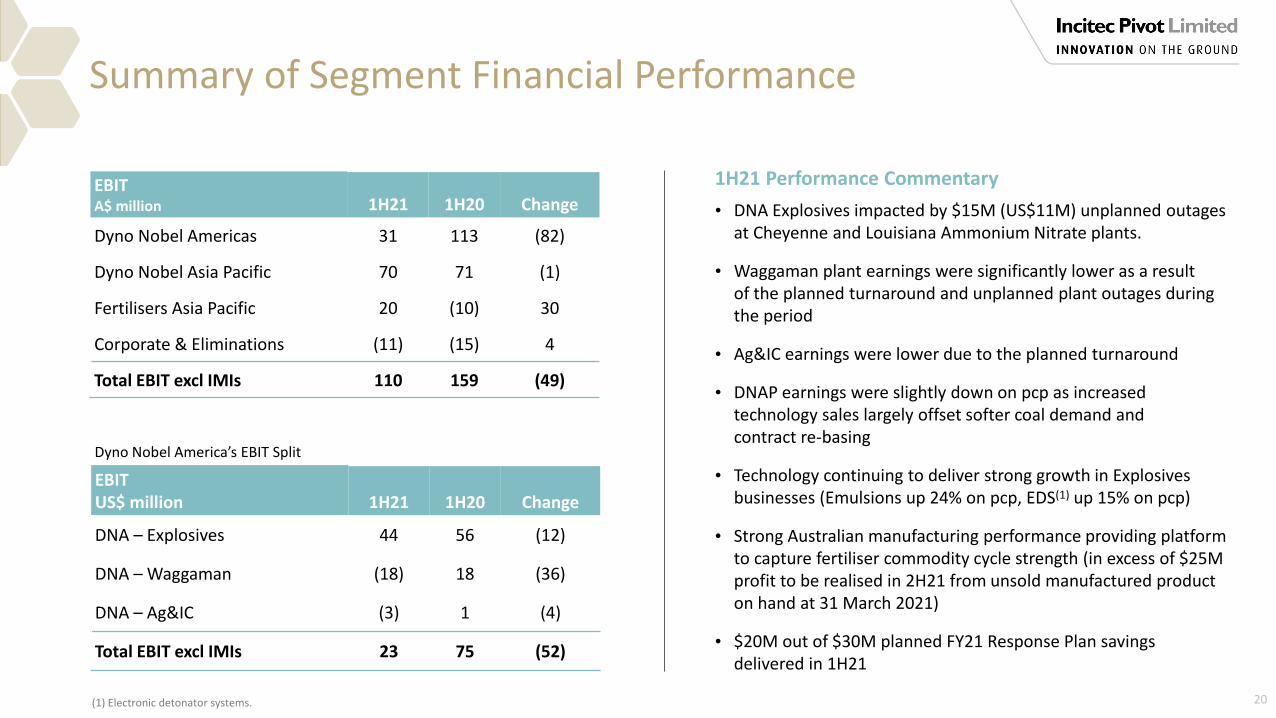
EBITA$ million 1H21 1H20 Change
Dyno Nobel Americas 31 113 (82)
Dyno Nobel Asia Pacific 70 71 (1)
Fertilisers Asia Pacific 20 (10) 30
Corporate & Eliminations (11) (15) 4
Total EBIT excl IMIs 110 159 (49)
1H21 Performance Commentary
• DNA Explosives impacted by $15M (US$11M) unplanned outages at Cheyenne and Louisiana Ammonium Nitrate plants.
• Waggaman plant earnings were significantly lower as a result of the planned turnaround and unplanned plant outages during the period
• Ag&IC earnings were lower due to the planned turnaround
• DNAP earnings were slightly down on pcp as increased technology sales largely offset softer coal demand and contract re-basing
• Technology continuing to deliver strong growth in Explosives businesses (Emulsions up 24% on pcp, EDS(1) up 15% on pcp)
• Strong Australian manufacturing performance providing platform to capture fertiliser commodity cycle strength (in excess of $25M profit to be realised in 2H21 from unsold manufactured product on hand at 31 March 2021)
• $20M out of $30M planned FY21 Response Plan savings delivered in 1H21
EBITUS$ million 1H21 1H20 Change
DNA – Explosives 44 56 (12)
DNA – Waggaman (18) 18 (36)
DNA – Ag&IC (3) 1 (4)
Total EBIT excl IMIs 23 75 (52)
Dyno Nobel America’s EBIT Split
(1) Electronic detonator systems.
Technology led diversification into quality markets offset coal declines
EBIT of A$74M, 12% vs pcp
0%
5%
10%
15%
0
10
20
30
40
50
60
HY20 HY21
Americas Explosives
21
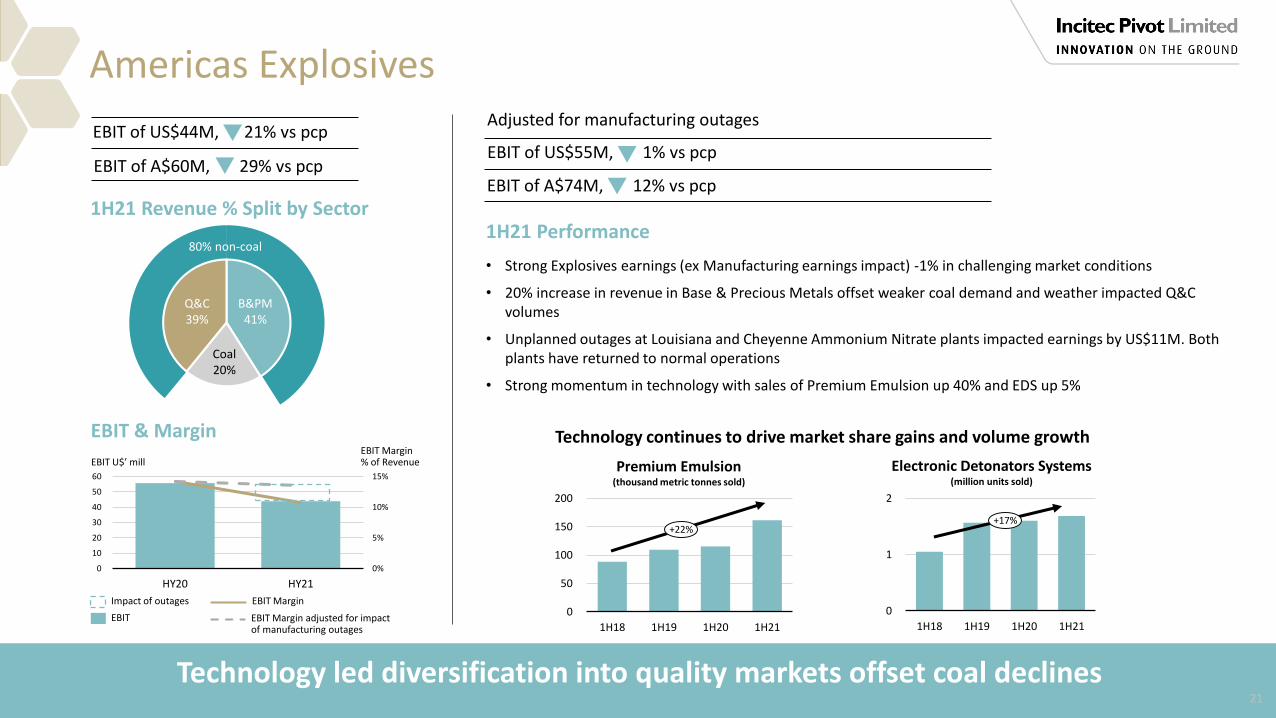
1H21 Performance
• Strong Explosives earnings (ex Manufacturing earnings impact) -1% in challenging market conditions
• 20% increase in revenue in Base & Precious Metals offset weaker coal demand and weather impacted Q&C volumes
• Unplanned outages at Louisiana and Cheyenne Ammonium Nitrate plants impacted earnings by US$11M. Both plants have returned to normal operations
• Strong momentum in technology with sales of Premium Emulsion up 40% and EDS up 5%
EBIT of US$44M, 21% vs pcp
EBIT of A$60M, 29% vs pcp
1H21 Revenue % Split by Sector
EBIT Margin% of RevenueEBIT U$’ mill
Impact of outages
EBIT
EBIT Margin
EBIT Margin adjusted for impact of manufacturing outages
EBIT & Margin
EBIT of US$55M, 1% vs pcp
Adjusted for manufacturing outages
0
50
100
150
200
1H18 1H19 1H20 1H21
Premium Emulsion(thousand metric tonnes sold)
+22%
0
1
2
1H18 1H19 1H20 1H21
+17%
Electronic Detonators Systems(million units sold)
Technology continues to drive market share gains and volume growth
Coal20%
B&PM41%
Q&C39%
80% non-coal

Americas Explosives – MarketsOutlook positive across all sectors
Base & Precious Metals
• Volume growth expected across all sectors with strong Gold and Copper prices supporting mines as they recover from FY20 COVID-19 closures
• DNA volumes are expected to grow in the 2H vs FY20, driven by mine recoveries and technology driven market share gains
Quarry & Construction
• Q&C volumes are expected to grow in the mid single digits 2H v FY20 as the economy continues to open up and recover from COVID-19 slowdown
• DNA volumes are expected to trend in line with or above market growth rates, as technology share gains continue
Coal
• Market forecasts are predicting a recovery in coal demand in 2H21, driven by favourable gas economics and a lower prior year comparative (COVID-19 demand impacted)
• For DNA, coal bankruptcies in the Powder River Basin and Illinois Basin are expected to limit 2H volume growth to low single digits
Positive market outlook with rebound expected in 2H from COVID impact on pcp22
0.0
0.5
1.0
1.5
1H18 1H19 1H20 1H21
0
20
40
60
1H18 1H19 1H20 1H21
Asia Pacific Explosives
23
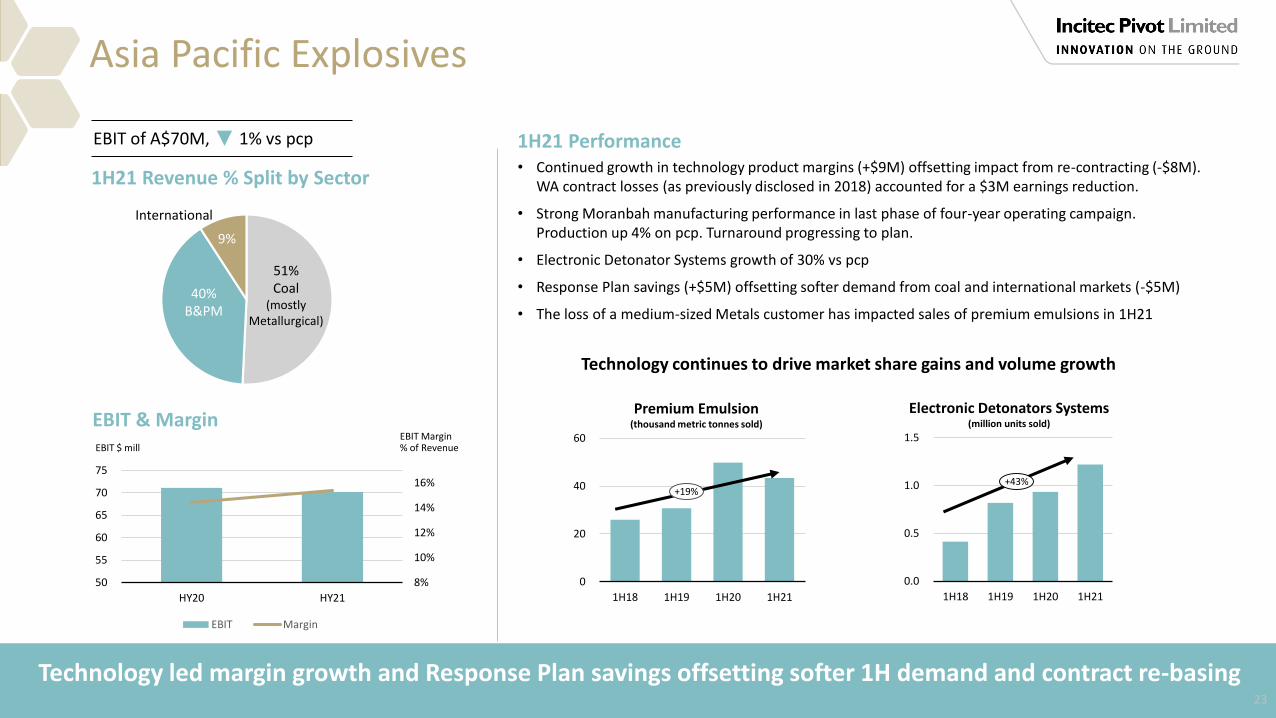
1H21 Performance• Continued growth in technology product margins (+$9M) offsetting impact from re-contracting (-$8M).
WA contract losses (as previously disclosed in 2018) accounted for a $3M earnings reduction.
• Strong Moranbah manufacturing performance in last phase of four-year operating campaign. Production up 4% on pcp. Turnaround progressing to plan.
• Electronic Detonator Systems growth of 30% vs pcp
• Response Plan savings (+$5M) offsetting softer demand from coal and international markets (-$5M)
• The loss of a medium-sized Metals customer has impacted sales of premium emulsions in 1H21
EBIT of A$70M, 1% vs pcp
1H21 Revenue % Split by Sector
51%Coal
(mostly Metallurgical)
40%B&PM
International
Premium Emulsion(thousand metric tonnes sold)
+19%+43%
Electronic Detonators Systems(million units sold)
EBIT Margin% of RevenueEBIT $ mill
EBIT & Margin
8%
10%
12%
14%
16%
50
55
60
65
70
75
HY20 HY21
EBIT Margin
Technology continues to drive market share gains and volume growth
Technology led margin growth and Response Plan savings offsetting softer 1H demand and contract re-basing
9%
24
Asia Pacific Explosives – Markets
(1) Forecast FY21 technology growth (based on contracted & committed business) expected to offset re-contracting impacts.
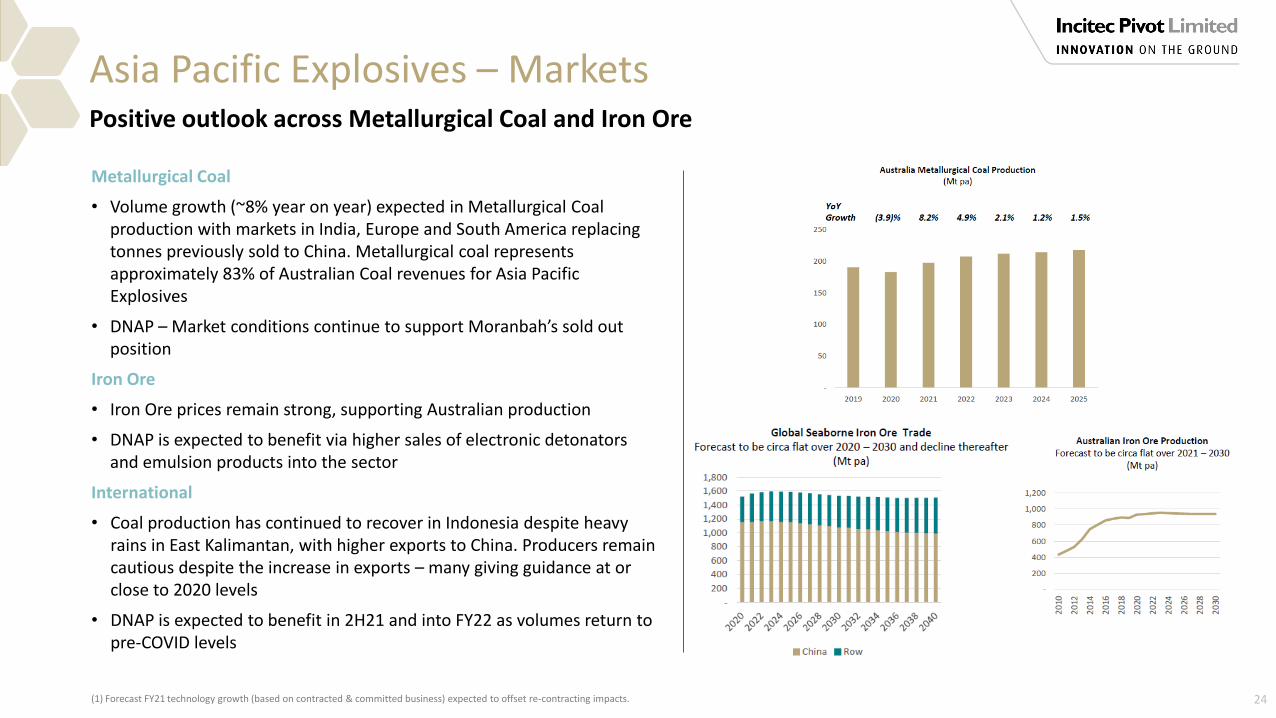
Metallurgical Coal
• Volume growth (~8% year on year) expected in Metallurgical Coal production with markets in India, Europe and South America replacing tonnes previously sold to China. Metallurgical coal represents approximately 83% of Australian Coal revenues for Asia Pacific Explosives
• DNAP – Market conditions continue to support Moranbah’s sold out position
Iron Ore
• Iron Ore prices remain strong, supporting Australian production
• DNAP is expected to benefit via higher sales of electronic detonators and emulsion products into the sector
International
• Coal production has continued to recover in Indonesia despite heavy rains in East Kalimantan, with higher exports to China. Producers remain cautious despite the increase in exports – many giving guidance at or close to 2020 levels
• DNAP is expected to benefit in 2H21 and into FY22 as volumes return to pre-COVID levels
Positive outlook across Metallurgical Coal and Iron Ore
Strong operational performance enabling capture of commodity upswing
0.0
0.5
1.0
1.5
2.0
2.5
3.0
3.5
4.0
4.5
1H19 1H20 1H210
10
20
30
1H18 1H19 1H20 1H21
Distribution
Fertilisers Asia Pacific
25
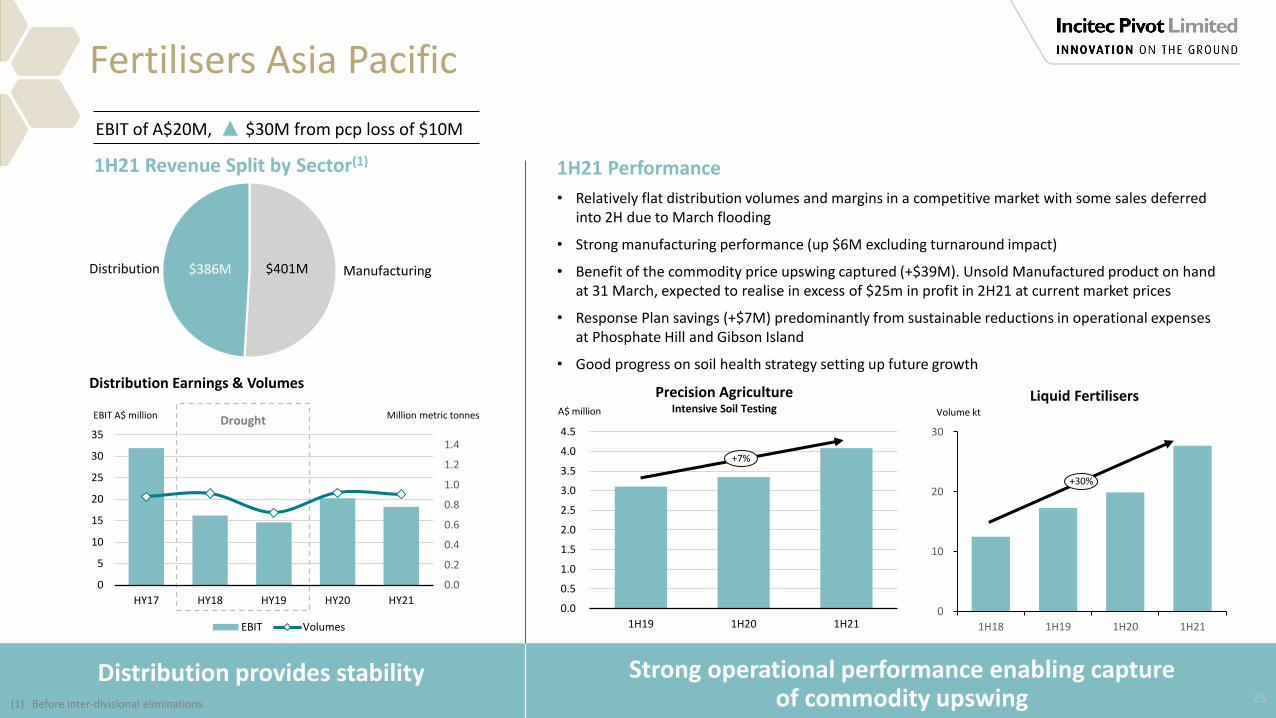
EBIT of A$20M, $30M from pcp loss of $10M
(1) Before inter-divisional eliminations.
1H21 Revenue Split by Sector(1)
Manufacturing$401M$386M
1H21 Performance
• Relatively flat distribution volumes and margins in a competitive market with some sales deferred into 2H due to March flooding
• Strong manufacturing performance (up $6M excluding turnaround impact)
• Benefit of the commodity price upswing captured (+$39M). Unsold Manufactured product on hand at 31 March, expected to realise in excess of $25m in profit in 2H21 at current market prices
• Response Plan savings (+$7M) predominantly from sustainable reductions in operational expenses at Phosphate Hill and Gibson Island
• Good progress on soil health strategy setting up future growthDistribution Earnings & Volumes
EBIT A$ million Million metric tonnesDrought
0.0
0.2
0.4
0.6
0.8
1.0
1.2
1.4
0
5
10
15
20
25
30
35
HY17 HY18 HY19 HY20 HY21
EBIT Volumes
Precision AgricultureIntensive Soil TestingA$ million
+7%
Liquid FertilisersVolume kt
+30%
Distribution provides stability
26
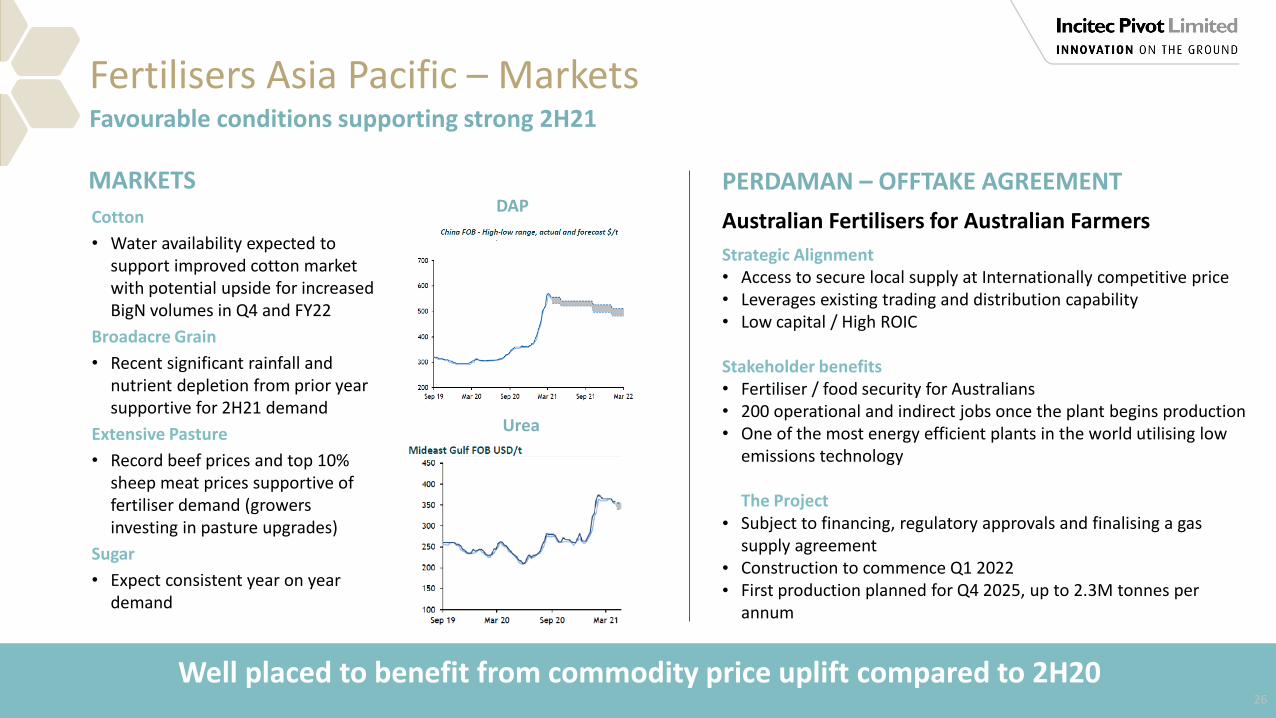
Fertilisers Asia Pacific – Markets Favourable conditions supporting strong 2H21
Cotton
• Water availability expected to support improved cotton market with potential upside for increased BigN volumes in Q4 and FY22
Broadacre Grain
• Recent significant rainfall and nutrient depletion from prior year supportive for 2H21 demand
Extensive Pasture
• Record beef prices and top 10% sheep meat prices supportive of fertiliser demand (growers investing in pasture upgrades)
Sugar
• Expect consistent year on year demand
MARKETSDAP
Urea
PERDAMAN – OFFTAKE AGREEMENT
Strategic Alignment• Access to secure local supply at Internationally competitive price• Leverages existing trading and distribution capability• Low capital / High ROIC
Stakeholder benefits• Fertiliser / food security for Australians• 200 operational and indirect jobs once the plant begins production• One of the most energy efficient plants in the world utilising low
emissions technology
The Project• Subject to financing, regulatory approvals and finalising a gas
supply agreement• Construction to commence Q1 2022• First production planned for Q4 2025, up to 2.3M tonnes per
annum
Australian Fertilisers for Australian Farmers
Well placed to benefit from commodity price uplift compared to 2H20

TECHNOLOGYJeanne JohnsManaging Director & Chief Executive Officer

0
1
2
3
1H18 1H19 1H20 1H21
0
50
100
150
200
250
1H18 1H19 1H20 1H21
Technology Driving Future Growth
28(1) Technology driven estimated growth in Explosives EBIT between FY20 and FY22, assuming no significant deterioration in current market conditions. (2) Detonator market in North America and Australia.
(thousand metric tonnes sold)
(# of trucks)
+21%
(million units sold)
+26%
Targeting technology driven Explosives EBIT growth1 of 10% by FY22
Electronic Detonators Systems represent a small proportion of global detonator sales – significant scope for future growth
Chile customer trials progressing well and delivering superior blasting outcomes
Strong growth in momentum of technology uptake
Premium Emulsion
Delta E Trucks
Electronic Detonator Systems
+186%
+24%
+15%
29
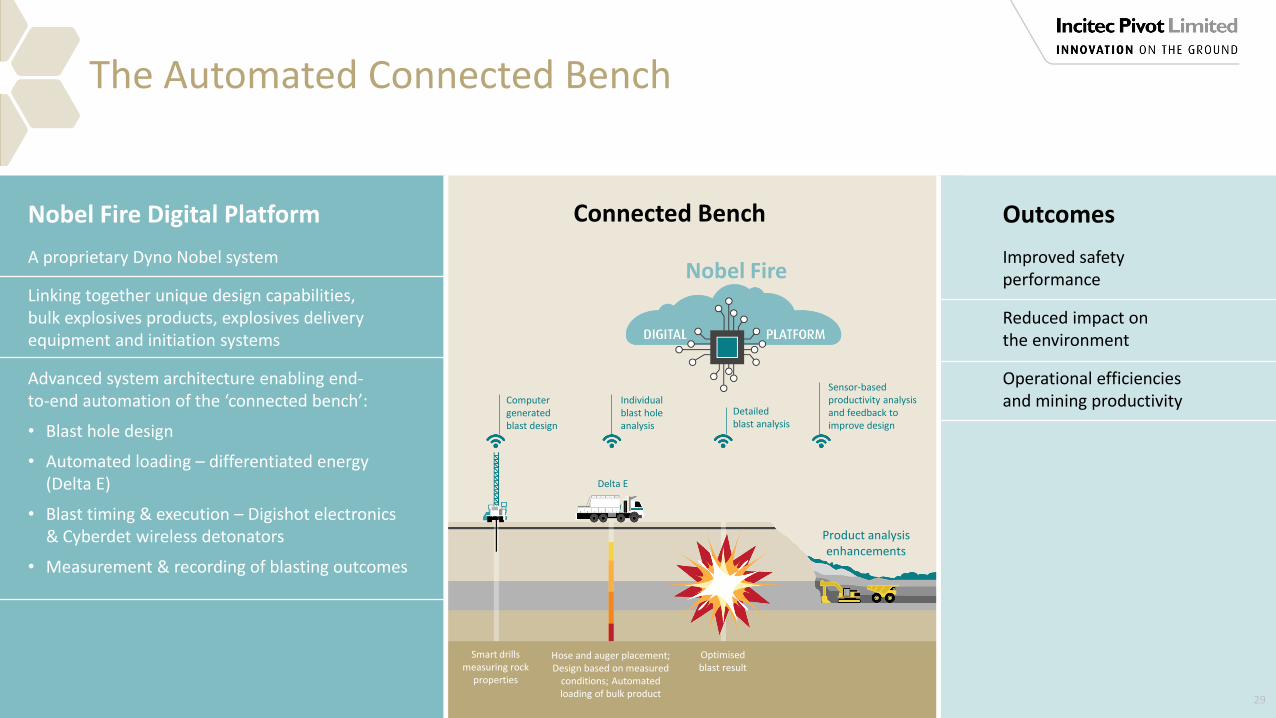
Computer generated blast design
Individual blast hole analysis
Detailed blast analysis
Sensor-based productivity analysis and feedback to improve design
Smart drills measuring rock
properties
Hose and auger placement; Design based on measured
conditions; Automated loading of bulk product
Optimisedblast result
Product analysis enhancements
Connected Bench
Nobel Fire
Delta E
The Automated Connected Bench
Outcomes
Improved safety performance
Reduced impact on the environment
Operational efficiencies and mining productivity
Nobel Fire Digital Platform
A proprietary Dyno Nobel system
Linking together unique design capabilities, bulk explosives products, explosives delivery equipment and initiation systems
Advanced system architecture enabling end-to-end automation of the ‘connected bench’:
• Blast hole design
• Automated loading – differentiated energy (Delta E)
• Blast timing & execution – Digishot electronics & Cyberdet wireless detonators
• Measurement & recording of blasting outcomes

Base raw materials, support and services
Technology Strategy Progress
30
Digital integration, data and a connected bench
Advanced products, systems and services
Conventional products and systems
Our Technology Strategy Our Vision Brought To Life
Automated bulk explosives loading equipment moving to field trials with large east coast coal customer
CyberDet wireless detonator regulatory approvals completed
Next generation Delta E systems released
Universal control system and truck data management released as standard build
New phase stabilised bulk Ammonium Nitrate commercialisation process underway
Nobel Fire digital platform in rapid scale up
Fragmentation density model (FDM) commercialised during the period
Geologic Element Motion (GEM) model development on track

SUSTAINABILITYJeanne JohnsManaging Director & Chief Executive Officer
(1) Global Reporting Initiative. 32
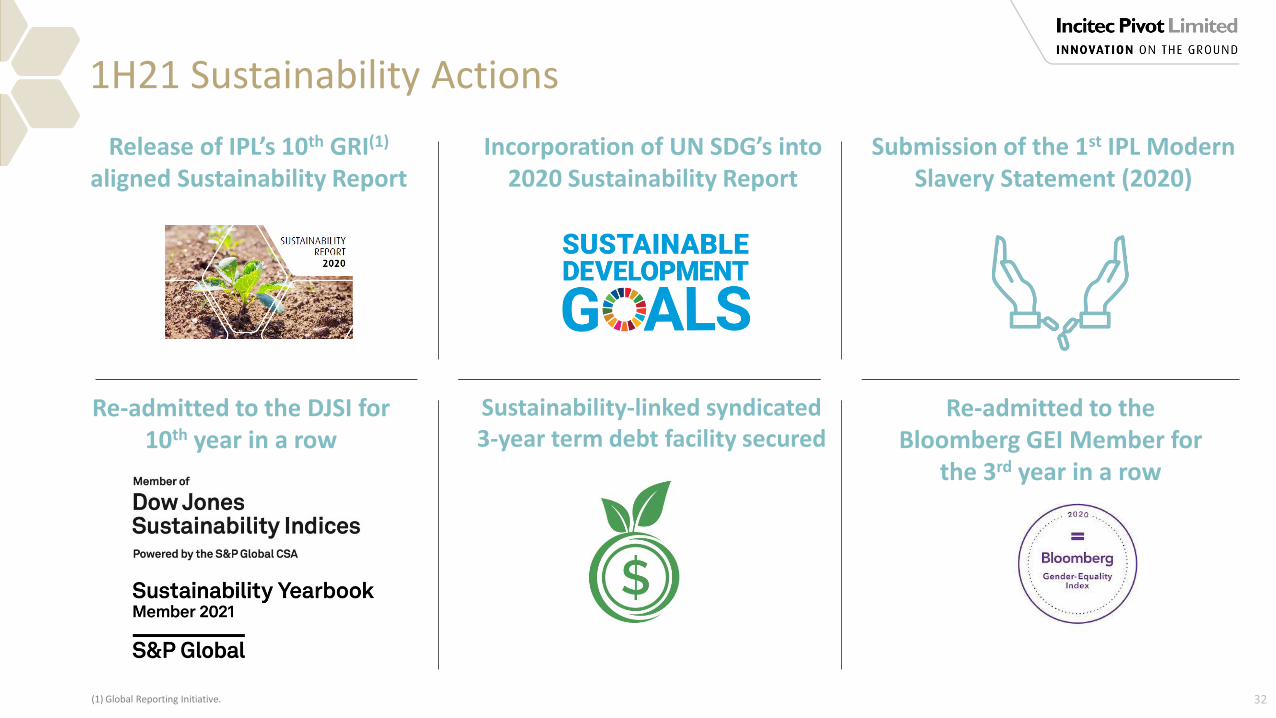
1H21 Sustainability Actions
Submission of the 1st IPL Modern Slavery Statement (2020)
Re-admitted to the Bloomberg GEI Member for
the 3rd year in a row
Re-admitted to the DJSI for 10th year in a row
Release of IPL’s 10th GRI(1)
aligned Sustainability Report
Sustainability-linked syndicated 3-year term debt facility secured
Incorporation of UN SDG’s into 2020 Sustainability Report
33
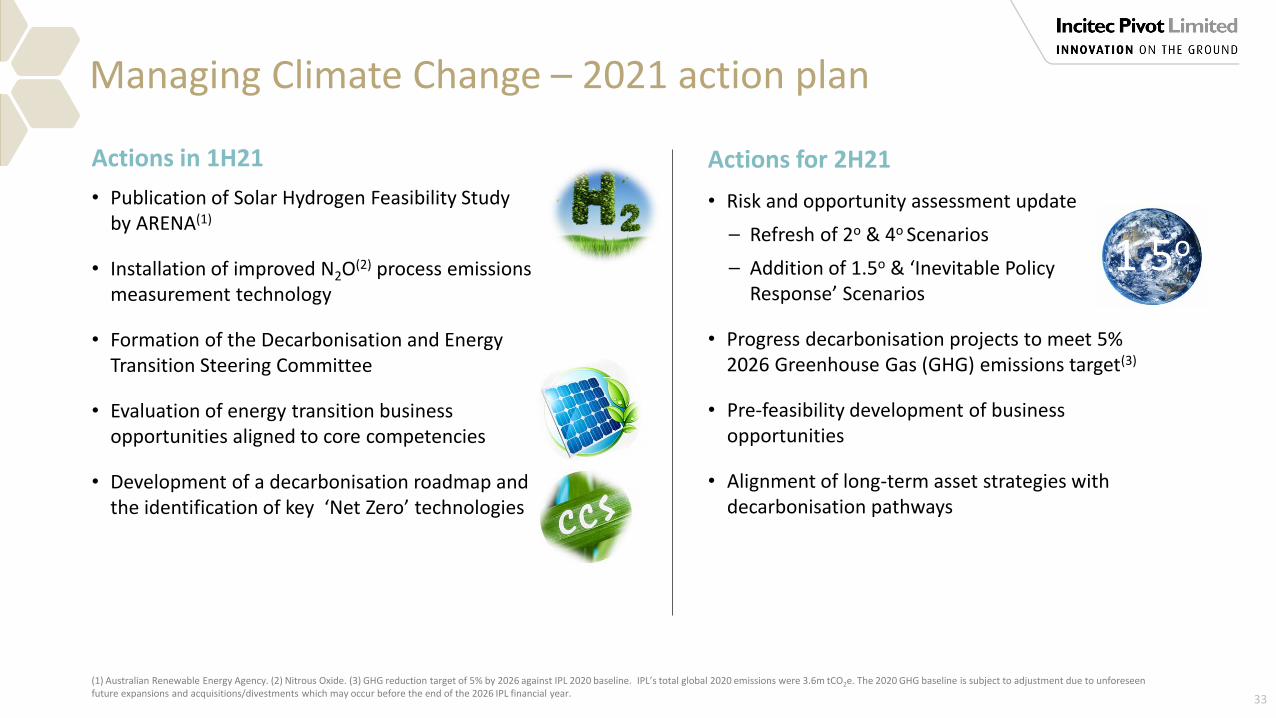
Managing Climate Change – 2021 action plan
Actions for 2H21
5%
• Publication of Solar Hydrogen Feasibility Study by ARENA(1)
• Installation of improved N2O(2) process emissions measurement technology
• Formation of the Decarbonisation and Energy Transition Steering Committee
• Evaluation of energy transition business opportunities aligned to core competencies
• Development of a decarbonisation roadmap and the identification of key ‘Net Zero’ technologies
Actions in 1H21
• Risk and opportunity assessment update
⎯ Refresh of 2o & 4o Scenarios
⎯ Addition of 1.5o & ‘Inevitable Policy Response’ Scenarios
• Progress decarbonisation projects to meet 5% 2026 Greenhouse Gas (GHG) emissions target(3)
• Pre-feasibility development of business opportunities
• Alignment of long-term asset strategies with decarbonisation pathways
1.5o
(1) Australian Renewable Energy Agency. (2) Nitrous Oxide. (3) GHG reduction target of 5% by 2026 against IPL 2020 baseline. IPL’s total global 2020 emissions were 3.6m tCO2e. The 2020 GHG baseline is subject to adjustment due to unforeseen future expansions and acquisitions/divestments which may occur before the end of the 2026 IPL financial year.

OUTLOOK & STRATEGIC PRIORITIESJeanne JohnsManaging Director & Chief Executive Officer

Outlook – 2H21
• Unsold Manufactured Ammonium Phosphate product on hand, to realise in excess of $25M in profit in 2H21 at current market prices
• One planned turnaround in 2H21 compared with three completed in 1H21 (+$44M)
• Plant reliability improvement
• Favourable prevailing fertiliser market conditions relative to pcp
Commodity1H21 Realised Price US$/mt
Spot Price US$/mt
Ammonia 256 545(2)
DAP 426 536(3)
Urea 296 343 - 350(4)
(1) IPL’s average 1H/2H split over the past 4 financial years (2017 to 2020) is 43% / 57%. (2) CFR Tampa as at 11 May 2021. (3) China DAP as at 11 May 2021 (4) FOB Middle East as at 6 May 2021. 35
PlantTA Timing
Duration(Weeks)
2H21 1H22 2H22
Moranbah 7
Phosphate Hill 7
Cheyenne 7
Stronger than normal weighting to 2H earnings and cash flow expected(1)
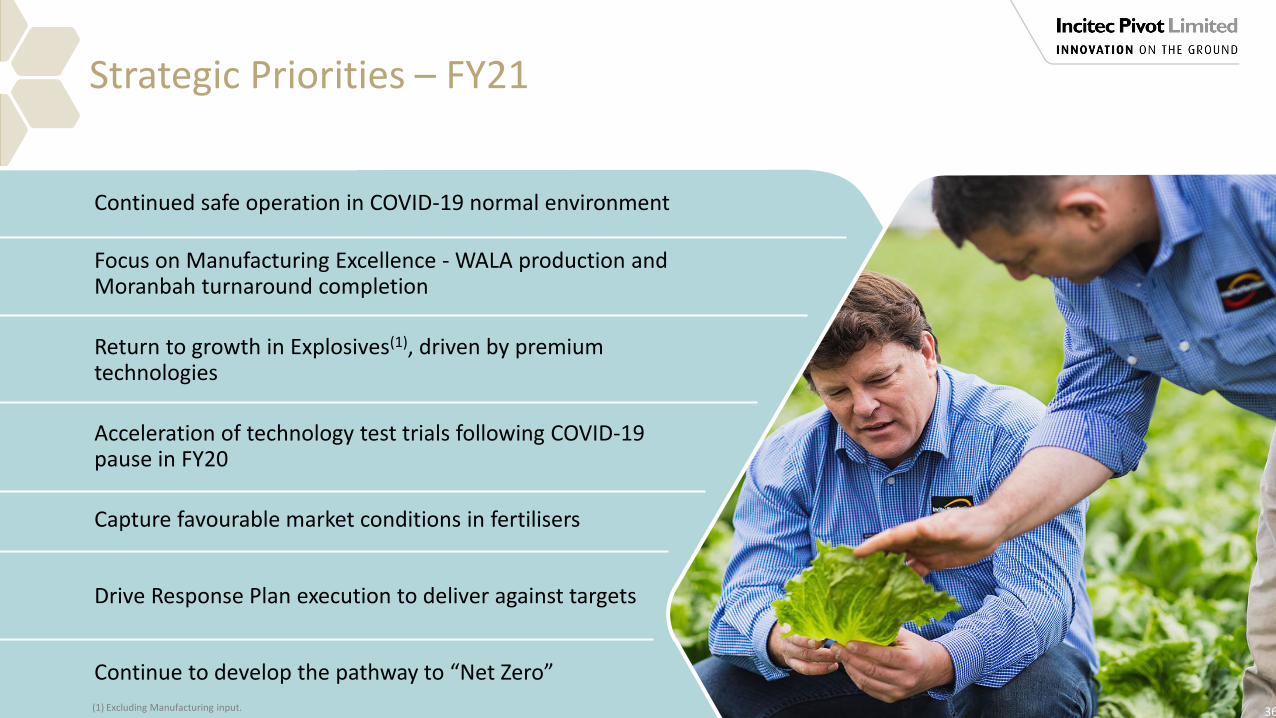
Strategic Priorities – FY21
Continued safe operation in COVID-19 normal environment
Focus on Manufacturing Excellence - WALA production and Moranbah turnaround completion
Return to growth in Explosives(1), driven by premium technologies
Acceleration of technology test trials following COVID-19 pause in FY20
Capture favourable market conditions in fertilisers
Drive Response Plan execution to deliver against targets
Continue to develop the pathway to “Net Zero”
(1) Excluding Manufacturing input. 36

QUESTIONS &ANSWERS
37
APPENDIX

COMPETITIVE ADVANTAGEBest premium technology in the market today, ideally suited for growth markets/sectorsStrategically located assets close to quality customers
STRONG EXPLOSIVES MARGINS~ 13% EBIT margin
2, reflecting value add premium technology and markets
DIVERSIFIED CATEGORY EXPOSURETwo best mining markets in the worldBase & Precious Metals, Quarry & Construction, Coal
QUALITY CUSTOMER BASE
Growth Through Supporting Essential Industries
AUSTRALIA’S LARGEST INTEGRATED SUPPLIER OF FERTILISERS
INNOVATION AND HIGHEST QUALITY EXPOSURE TO EXPLOSIVES
(1) 1H21 IPL Group EBIT split excluding eliminations & corporate costs. (2) 1H21 Explosives EBIT margins.
LEADER IN EAST COAST MARKET Extensive distribution platform with stable distribution volumes
DIVERSIFIED CATEGORY EXPOSUREDairy, Sugar, Cotton, Grains, Horticulture
LEVERAGED TO GROWING GLOBAL PHOSPHATES MARKETS~47% increase in Di-ammonium Phosphates prices and ~20% increase in Urea prices
LARGEST AUSTRALIAN FERTILISERS PRODUCERManufacturing provides security of supply
83%EBIT1
17%EBIT1
39
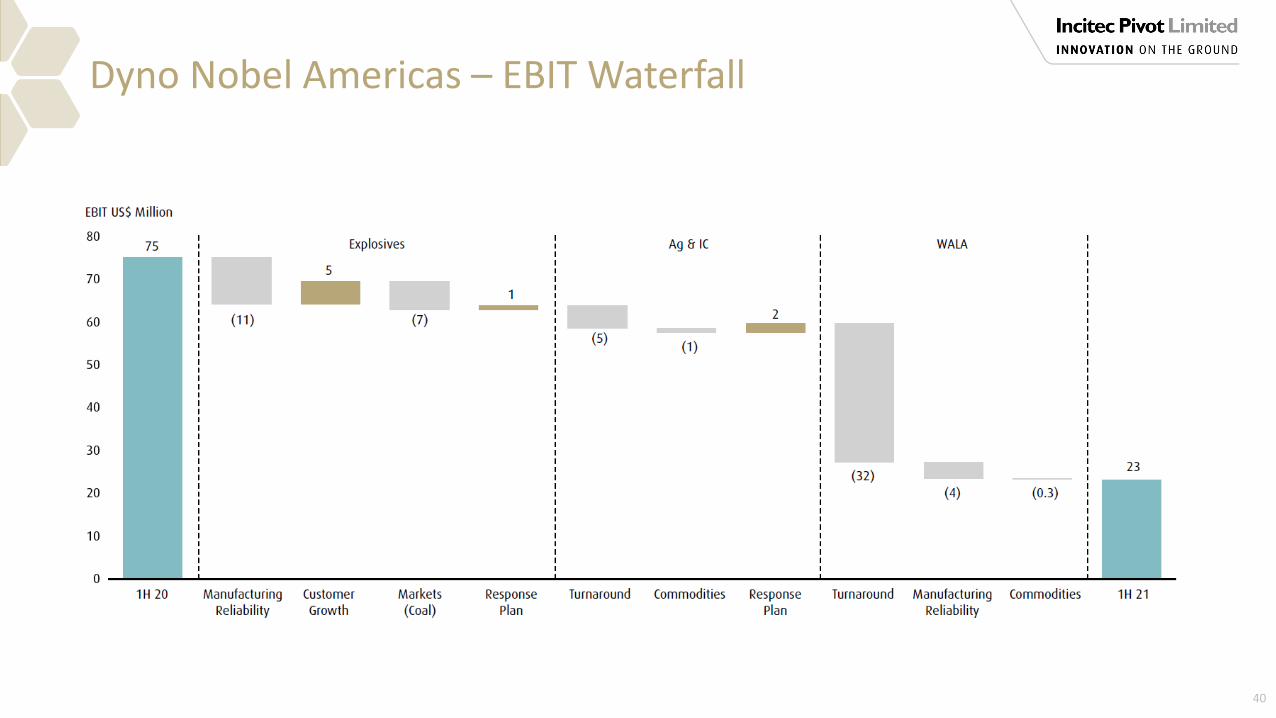
Dyno Nobel Americas – EBIT Waterfall
40
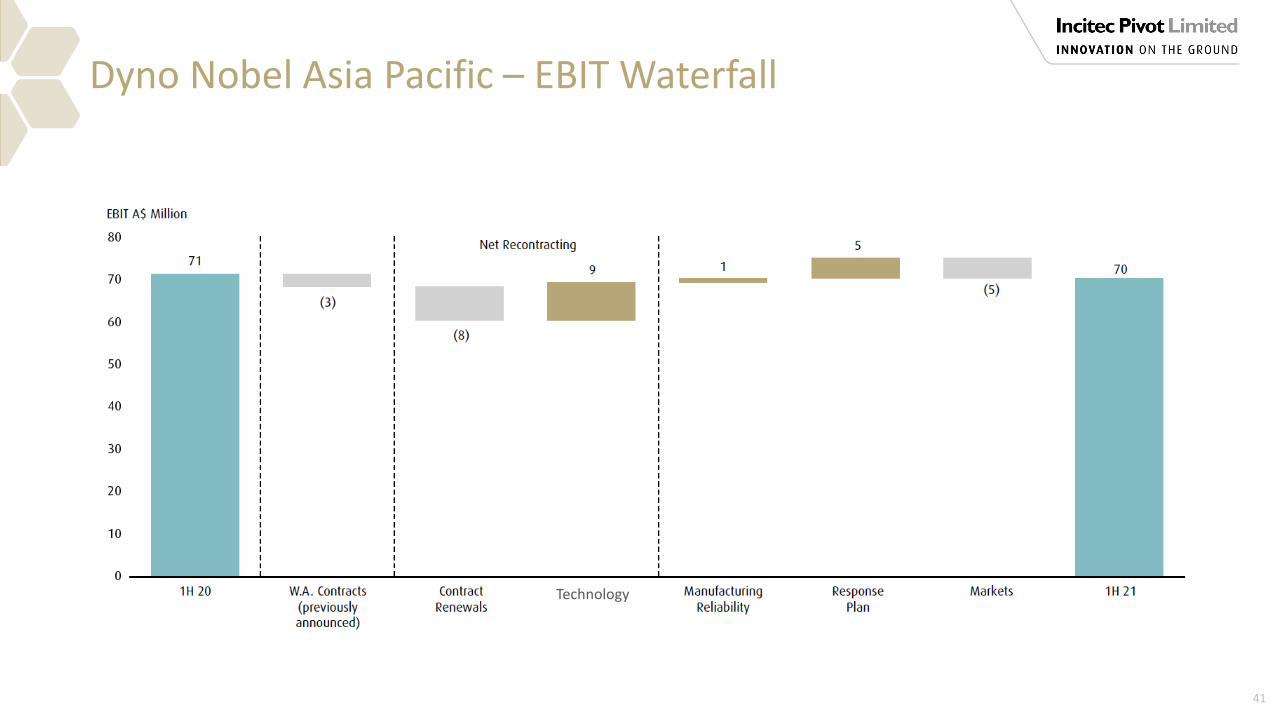
Dyno Nobel Asia Pacific – EBIT Waterfall
41
Technology
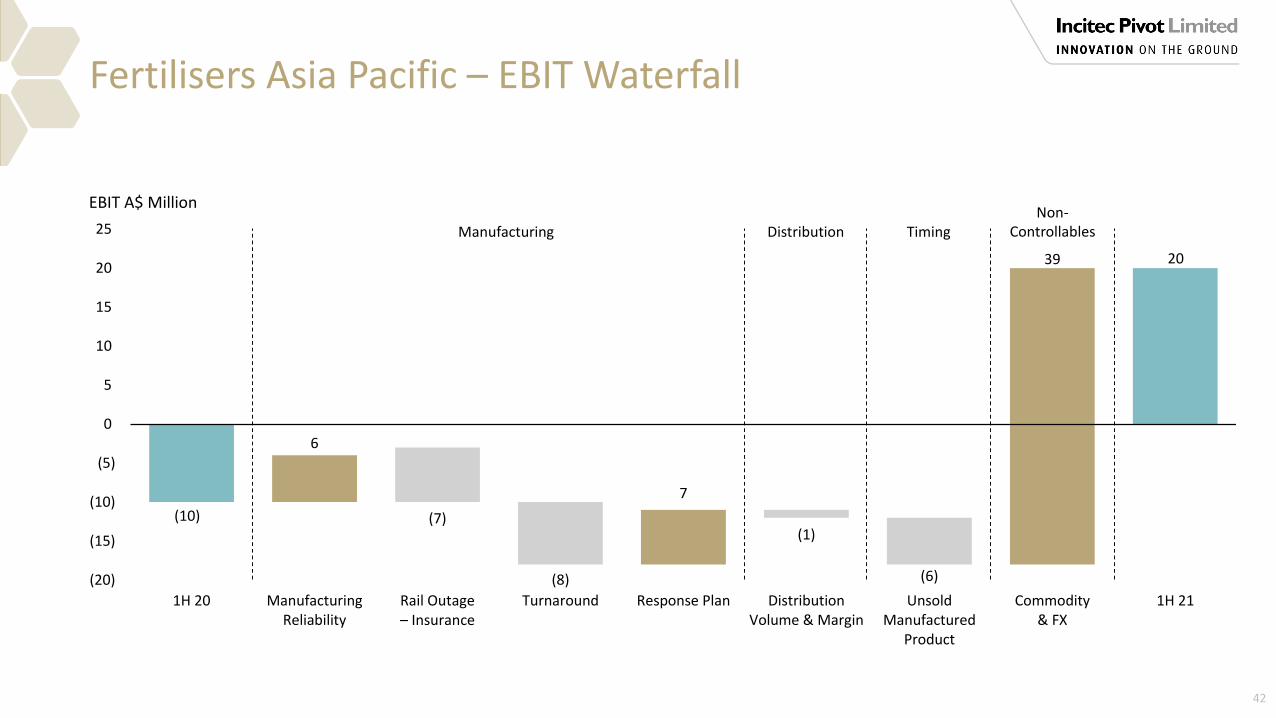
Fertilisers Asia Pacific – EBIT Waterfall
42
(7)
(8)
(1)
(6)
6
7
39
(20)
(15)
(10)
(5)
0
5
10
15
20
25
1H 20 ManufacturingReliability
Rail Outage – Insurance
Turnaround Response Plan DistributionVolume & Margin
UnsoldManufactured
Product
Commodity& FX
1H 21
EBIT A$ Million
Manufacturing Distribution TimingNon-
Controllables
(10)
20
Response Plan
$40M EBIT2
Explosives Growth
10% of EBIT3
Manufacturing Excellence
$40M - $50M4
Fertilisers Recovery5
43
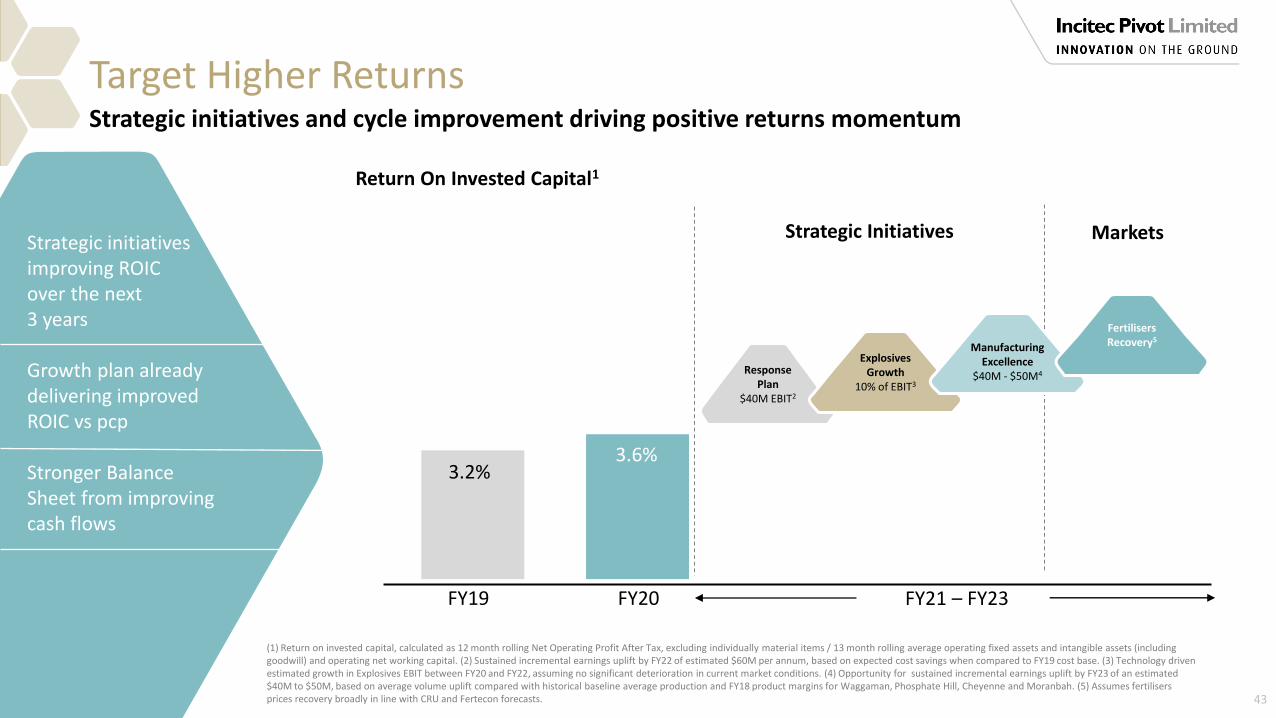
Target Higher Returns Strategic initiatives and cycle improvement driving positive returns momentum
3.2%
FY19 FY20
3.6%
Return On Invested Capital1
Strategic Initiatives Markets
FY21 – FY23
(1) Return on invested capital, calculated as 12 month rolling Net Operating Profit After Tax, excluding individually material items / 13 month rolling average operating fixed assets and intangible assets (including goodwill) and operating net working capital. (2) Sustained incremental earnings uplift by FY22 of estimated $60M per annum, based on expected cost savings when compared to FY19 cost base. (3) Technology driven estimated growth in Explosives EBIT between FY20 and FY22, assuming no significant deterioration in current market conditions. (4) Opportunity for sustained incremental earnings uplift by FY23 of an estimated $40M to $50M, based on average volume uplift compared with historical baseline average production and FY18 product margins for Waggaman, Phosphate Hill, Cheyenne and Moranbah. (5) Assumes fertilisers prices recovery broadly in line with CRU and Fertecon forecasts.
Strategic initiativesimproving ROIC over the next 3 years
Growth plan alreadydelivering improved ROIC vs pcp
Stronger Balance Sheet from improvingcash flows