Embed Size (px)
Citation preview

Prec. Indian Acad. Sci. (Engg. Sci.) Vol. 4, Pt. 3, September 1981, pp. 295-314. ~) Printed in India.
Fluid dynamics of the monsoon
SULOCHANA GADGIL Centre for Theoretical Studies, Indian Institute of Science, Bangalore 560 012
MS received 15 January 1981
Abstract. The monsoonal regions of the world are characterized by a seasonal reversal in the direction of winds associated with the excursion of the equatorial trough (or the ITCZ) in response to the variation in the latitude of maximum insola- tion. This monsoonal circulation is a planetary scale phenomenon. However, the associated precipitation is critically dependent on the organization of the cumulus clouds (typically a few kilometers in horizontal extent) over the scale of synoptic vortices (typically a few hundred kilometers in horizontal extent). Thus modelling of the seasonal transitions and intraseasonal fluctuations requires an understanding of the fluid mechanics of these three scales of organizations and their interactions. The present paper is an attempt to outline the current state of understanding of these phenomena,
Keywords. Monsoon; tropical circulation; intertropical convergence zone; atmos- pheric instabilities.
1. Introduction
Over certain regions of the tropics, the wind blows in opposite directions in summer and winter. For instance, over the Arabian Sea, the wind at low levels blows from the southwest in the summer and from the northeast in the winter. Such a seasonal reversal in the direction of the wind is traditionally known as the monsoon. The Arabs first discovered the monsoon over the Arabian sea. In fact the word monsoon is derived from the Arabic word m a u s a r n for a season. Thus the essence of monsoon is scasonality.
Around the first century B.C. when India moved from pre-history to history, other traders from the Mediterranean world became aware of these winds and used this knowledge in planning their voyages. Ships travelling from Alexandria, which was then the entrepot of the Mediterranean world, would wait for the southwest monsoon to be established and then set sail for the west coast port of Bhartrkachckha (modem Broach). The northeast monsoon of the winter season would take these ships back. At this time Indians were involved in extensive trade with the Golden Isles of Jawa, Sumatra and Bali, which supplied the spices which were then sold to the Romans at enormous profits (Thaper 1966). Thus it is likely that they were also aware of the monsoon over the Bay of Bengal.
The monsoon is by no means restricted to the Indian region and the surrounding oceans. Ramage's (1971) delineation of the monsoonal regions of the world using a criterion based on the seasonality of winds shows the monsoon to be a planetary scale phenomenon (figure 1). As the famous astronomer Edmond Halley observed
295
Proc.--2a

296 Sulochana Gadgil
vr 1~:~0 120 80 N 40
l"ropie ot' \ , r ' ~
0
S 40
z.0 0 40 80 120 160 E '
Cancer "'~.,.~"~*" Equotgr , ~".~.
Tropic of Capricorn'~ ~ , , , / / , ,
Figure I. Monsoonal regions of the world (Ramage 1971)
1966
0 , �9 �9 �9 �9 r i m I i i i i i i I | | ~ g 1'o 1~ ~o i5~o ~ ~o ~5 zo :~s ~1 s ~o 15 :~o 26 3,1 5 ~o ~5 20 as c
i June ' JuLy I August I September I ! !
Figure 2. Average daily rainfall along the west coast of peninsular India (Anantha- krishnan 1956)
in 1686, in the monsoon 'are contained several problems that merit well the consi- deration of the acutest naturalists both by reason of constancy of effect and its vast extent' .
The seasonality of the wind is but one aspect of the variation of the tropical cir- culation. Of far greater concern to the large populations living in the monsoonal regions of the world is the variation of the rainfall associated with the monsoon. The rainfall along the west coast during one summer season is shown in figure 2. Two scales appear prominently in the variation: (i) the synoptic scale of 2-5 days associated with coherent structures of a few hundred kilometers in the horizontal extent, called tropical disturbances, and (ii) the longer period fluctuation (with a time-scale of two weeks or more) between active spells and weak spells, associated with the planetary scale.
The synoptic-scale disturbances organize the cumulus clouds (figure 3, plate 1), which are typically a few kilometers in horizontal extent, over the synoptic scale. This organization for the most i~tense tropical disturbance 1,iz., a typhoon or hurricane is shown in figure 4 (plate 2). These synoptic-scale disturbances are embedded in the plane~ry scale. Interactions between these three scales play a crucial role in the dynamics of the monsoon and its fluctuations. In-this paper, ~n attempt is made to summarize what is known about the fluid mechanics of each of these scales of organization and their interaction,

Fluid dynamics of the monsoon 297
2. Planetary-scale monsoon: the problem
As a first approximation, the general circulation of the atmosphere can be represented as in figure 5 (after Ferrel 1856). The major features of the longitudinally and tempo- rally averaged tropical circulation at the surface of the earth are seen to be:
(i) The trade winds blowing from the subtropical high pressure belts towards the equatorial region in the northeasterly (southeasterly) direction in the northern (south- ern) hemisphere.
(ii) A zone of low pressure in the equatorial region called the equatorial trough or the intertropical convergence zone (ITCZ) in which the trades from the two hemi- spheres converge. Note that although the pressure field is axisymmetric, the trades have a westward component of velocity due to the action of the Coriolis force which is significant for these planetary scales. In fact, above the atmospheric boundary layer, the cross-isobar component becomes insignificant and the geostrophic com- ponent dominates.
The air converging in the ITCZ rises and moves poleward in the upper tropo- sphere. The vertical circulation comprises ascent over the ITCZ and descent every- where else. This meridional cell, called the Hadley cell, is depicted in figure 6.
,
5 . . . . "
Figure 5. The general circulation of the atmosphere according to Ferrel (1856),

298 Sulochana Gadgil
?
F !
s u b t r o p i c a l d i v e r g e n t t r a d e w i n d f l o w ; e q u a t o r i a l h igh I t r o u g h
A B C Figwre 6. Schematic picture of the Hadley circulation (Augstein 1978).
-2000 m
s e a sur face
The updraft in the ITCZ which occurs throughout the troposphere is associated with intense moist convection and hence the ITCZ is seen as a prominent feature of satellite cloud imagery (e.g. figure 7, plate 3). It is seen that the latitudinal extent of this cloud band, which stretches almost continuously around the earth in the tropics, is much smaller than the surrounding cloud-free region over which the air is descending.
The location of the ITCZ varies with the season (figure 8) in association with the variation of the sea-level trough (figure 9). It is seen that the amplitude of the seasonal variation is maximum in the monsoonal regions. The monsoonal change in the wind direction is merely a manifestation of this migration of the equatorial trough. When the trough is located in the northern hemisphere, the southeasterly trades from the southern hemisphere cross over into the northern hemisphere and blow towards this trough in a southwesterly direction. The zonal component changes from easterly to westerly upon crossing the equator because of the change in sign of the local vertical component of the rotation of the earth. Poleward of the trough, the northeasterly trades prevail. Thus a seasonal reversal in the direction of the wind occurs over the
Jun - Aug 1967
Dec 1967 - Feb 1968
2o" . . . . . . . . xt . . . .
/ L , ~"~ " % ( . , ' - "-... - . ' ~ " ' ~ " ~ ' ] L I ' ~ " ~ ~ -....,
,o.F --.. h'--J f 7" L I �9 I I j I~L . 1 ~ J I I % I ~ l, ,
160" 120" ~0" 40" 0" 60" 80' 120' 160"
Figure 8. Seasonal distribution of axes of maximum brightness (cloudiness) from ESSA 3 and 5 digitized pictures over the tropics for March 1967-February 1968 (Hubert et al 1969)

N
20
.~- 0 O
S
Fluid dynamics o f the monsoon
/-,0 80 120 E 160 ~ 160 W 120 80 40 0 i L ~ . , d . . ~ I i I I [ I
~. .~ol.~/~,..--~ ~ , ~ ~ J
299
Figure 9. Mean location of th�9 equatorial trough (Riehl 1954)
40"[~ . j ~ ~ ' H ~ ' ~ ~
30" 90" 150" 1SO" 90" 30" 0 30"
30" 90" 150" 150" 90" 30" O" 30" Figure 10. Idealized surface mean flow for January (top) and August (bottom) (Gray 1968)
region lying between the two latitudes corresponding to the extreme locations of the equatorial trough (figure 10).
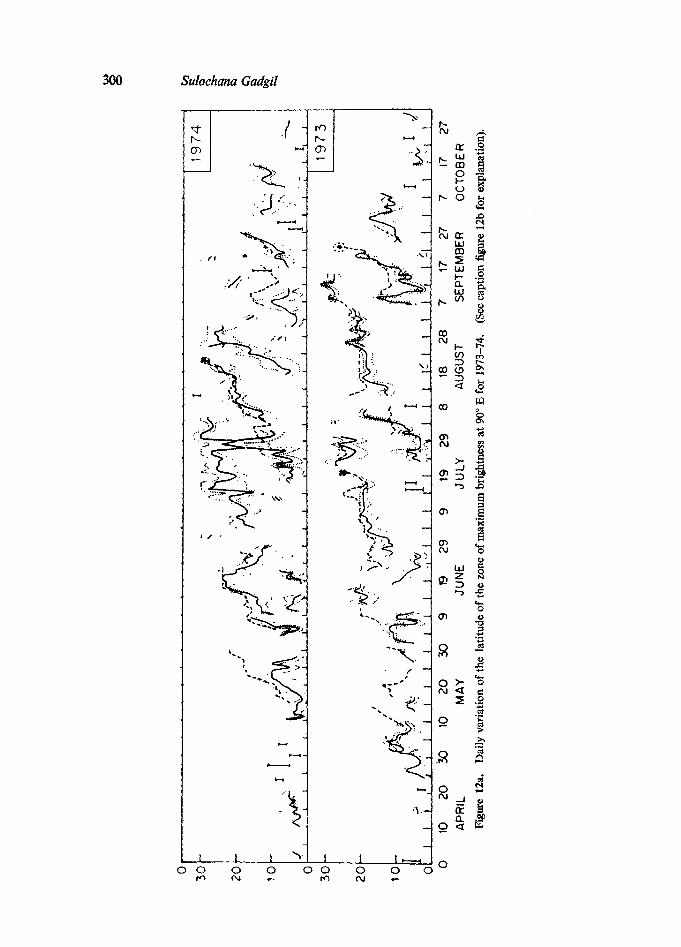
Over the Indian longitudes, the northward shift of the ITCZ occurs during the onset phase of the monsoon in May and June. Towards the beginning of July the ITCZ gets established near the mean summer location of about 20 ~ (figure 11, plate 4). It persists over this region through August, with fluctuations in its location and in the intensity of the associated clouding and rainfall. The ITCZ migrates southwards in October and November during the withdrawal phase of the monsoon. The seasonal migrations and midseason fluctuations of the clouding and rainfall associated with the ITCZ are extremely complex (figure 12), and deciphering the role of the various mechanisms which drive or influence these variations is a rather difficult task. On the planetary scale, the major questions to which we need to address ourselves are the following.
(i) How does the Hadley cell arise ? Why is the vertical circulation asymmetric with a narrow rising limb ?
(ii) What determines the location and intensity of the ITCZ when the external forcing and boundary conditions are steady ?
(iii) How do the ITCZ and the rest of the Hadley cell respond to seasonally vari- able forcing ?
300 Sulochana Gadgil
.F
.? ~..i~ -.
�9 t ~ ~:;, ~ r .
:e . . . , " . ,~.
__1 0 0
rr) --
M
J
t _L__~__L___Z__ 0 0 0 0 0
! , : , . .
I! ;. ~ . ',~
~ . . ; ~ - ~,, �9 ~
~o~
o ~
co
a
. - . o ix} _1
~ o 0 0

Fluid dynamics of the monsoon 301
Z O
0 0
~
"~ ~ -:"
~'" ~'I
t
~ ~ " ~ . ~.; ~.~
~5
0 0
-
~ ' ~ .~.
q ,
I :>
o 0 o
" , . , ~ . ' ~ ~
- :a. ~
~ . o ~
o~ o o o
D r~
!
cn o m =
o~
0 ~.~

302 Sulochana Gadgil
(iv) What are the factors responsible for (a) mid-season fluctuations meh as the long dry spells known as breaks in the monsoon, and (b) inter-annnal variability and climatic change ?
I consider next what is known about each of these aspects on the basis of the existing theoretical and empirical studies.
3. Hadley cell: a simple model
The ultimate source of energy for the atmospheric motions is the radiation from the sun. As a first approximation, the earth's atmosphere may be considered to be trains- parent to the solar radiation and ' black' with respect to the terrestrial radiation. Hence the atmosphere is heated at its bottom boundary, i.e., at the surface of the earth. The heat balance at the surface of the earth determines the nature of the boundary condition. For an ocean-covered earth, the large heat capacity of the ocean implies a prescription of the surface temperature with latitude. On the other hand, since the heat capacity of land is negligible, at its surface the heat flux has to be prescribed, again as a function of latitude. The Hadley cell is then the axisymmetric response of a rotating planetary atmosphere to latitudinally varying heating from below.
This problem of sideways convection has been studied by analytical and numerical models, in the linear as well as nonlinear regime (e.g. Stone 1968; Schneider & Lindzen 1977). These models assume that the vertical transport of heat and momentum by turbulence can be parametrized in terms of eddy-coefflcients, which vary with height in some studies. More complex models also assume a similar parametrization for the horizontal transport of momentum and heat. The important results emerg- ing from these models are: (i) the rising limb of the convective ccU is located at the latitude at which the specified surface temperature or heat flux is maximum. (ii) When the Rayleigh numbers are high, the ascending limb is much narrower than the descend- ing one. (iii) The cell driven by the boundary heating is rather shallow, the circulation being more or less restricted to a depth of about one kilometer from the surface for parameters appropriate to the earth's atmosphere. The circulation extends through- out the troposphere only when a mid-tropospheric heat source representing the latent- heat released by the convective clouds associated with the ITCZ is included in the model. Thus the interaction with the cumulus clouds has to be included even in the simplest model for the ITCZ. This leads us to the question: How do these cumulus clouds arise in the tropical atmospheric and how do they interact with the synoptic and planetary scales 9.
4. Cumulus dynamics: conditional instability of the first kind
In the lower part of the tropical atmosphere, the temperature is observed to decrease with height at a rate of about 5.5~ Since a parcel of air rising adiabatically cools at a rate of 10~ it finds itself colder and denser than its environment and is acted upon by a restoring buoyancy force. If, however, the parcel is saturated, the moisture condenses with a release of the latent heat of condensation and thereby prevents the parcel from cooling as rapidly as a dry one. Thus a

Fluid dynamics of the monsoon 303
saturated parcel of air rising above the level at which condensation takes place cools at a rate of about 4.5~ Such a parcel finds itself warmer than the surrounding air and is accelerated upward by the buoyancy force. The tropical atmosphere is therefore gravitationally stable for unsaturated air and unstable for saturated air. Such an atmosphere is said to be conditionally unstable.
If the moist air near the surface of the earth can be lifted upto the level at which condensation begins to occur (0.5 to 1 kin), conditional instability triggers the forma- tion of cumulus clouds. In the cumulus cloud, the air rises due to the buoyancy forces and the condensed moisture is lost through precipitation. This air descends in the region surrounding the cloud. Since the atmosphere is stable for dry air, work has to be done to transport the air downward against gravity. It can be shown that the ratio of the work done by the buoyancy forces in the upward displacement within the cumulus to that done against gravity in the downward displacement, increases with decreasing horizontal extent of the cloud. In other words, the thinner the cloud, the faster it grows in this simple inviseid model. If friction and entrain- ment of dry air in the cumulus are incktded in the model, the fastest growing scale is no longer zero, but depends on the horizontal mixing. It is known from the theory of Benard covection that these limitations will not be effective till the width appro- aches the depth of'the troposphere. For parameters appropriate for our atmosphere, the favoured scale turns out to be about 5 km which is close to the observed width of a cumulus cloud.
5. Conditional instability of the second kind
In a conditionally unstable atmosphere, a cumulus scale perturbation is favoured over the synoptic scale perturbation, and hence if the two were to compete, the cumulus would surely win. The synoptic-scale disturbances can occur in this situa- tion only because these two scales can cooperate with each other. We have seen that cumulus clouds can form only if the moist air at the surface is lifted upto the level at which condensation begins. The synoptic-scale disturbance triggers the formation of clouds by providing the required updraft. Charney & Eliassen (1964) first suggested the possibility of such a cooperative interaction. In their model the synoptic scale updraft arises due to boundary friction. Qualitatively, the nature of the interaction between the cumulus and synoptic scales they postulated is as follows.
A tropical disturbance is a cyclonic vortex (i.e. with anticlockwise rotation in the northern hemisphere) which is associated with a well-marked low pressure area in the weather maps of the lower troposphere. The air in the frictional boundary layer in a rotating system converges when the vortieity above the boundary layer is cyclonic. This results in an updraft from the surface boundary layer into the interior whose rough/rude is proportional to that of the vortieity above the boundary layer. Thus the frictionally-generated updraft of the tropical disturbance leads to the generation of cumulus clouds throu ghout the disturbance (figure 13).
The air ascending within the cumulus cloud gains heat because the latent heat released exceeds the cooling due to adiabatic expansion. The air descending between the clouds also gains heat due to adiabatic compression. Thus once cumulus clouds are generated, the entire region comprising the clouds and their downdrafts heats up.

304 Sulochana Gadgil
1 1 Figure 13. Schematic represen- tation of interaction between cumulus cells and a synoptic scale cyclonic disturbance (Chamey 1967)
This heating lowers the pressure and intensifies the synoptic scale vortex. This in turn increases the updraft and hence the cloud formation. Thus there is a positive feedback which allows the clouds and the disturbance to cooperate with each other and leads to the intensification of the latter. This instability, which leads to the intensi- fication of tropical disturbances, is caUed conditional instability of the second kind (OSK).
6. Interactions between planetary and synoptic scales
The synoptic-scale disturbances are generated by the instability of the planetary- scale flow. It is l~lieved that tropical disturbances are a manifestation of the bare- tropic instability (shear flow instability) of the planetary-scale circulation.
Over the Indian Ocean, during the summer, most of the cross-equatorial flow occurs in a low-level jet near the east coast of Africa (figure 14). This jet traverses the Arabian sea and the Indian landmass. The nature of the variation of the wind in this jet is rather favourable for the development of barotropic instability. Krishna- murthy et al (1980) have shown that the formation of the onset vortex for the season of 1979 could be attributed to barotropic instability. However, although bare- tropic instability of the planetary scale wind field may be a necessary condition for genesis it is by no means sufficient. On many occasions, the disturbances do not form even when instability criteria are satisfied. We do not as yet have a complete theory which yields all the necessary and sufficient conditions for the formation of the dis- turbances. Once formed, they in~nsify if they can trigger cumulus developments via CISK.
The synoptic-scale vortices seem to play a major role in maintaining the planetary scale. A study of the daily weather charts over the Indian area for two summer seasons showed that on a vast majority of occasions when the ITCZ was active there were one or more synoptic-scale vortices embedded in it. Only on very few occa- sions was convection uniformly organized on the scale of the ITCZ. Sikka (1980) has also shown that the total rainfall in a season is directly related to the number of disturbances generated in the season. In fact even in the mean monthly streamline

Fluid dynamics of the monsoon
4o'E so" so" 70" so"
305
;o'
I0"
40 E 50" 60" 70" 80"
Q
Figure 14.
Axis of maximum flow
SeLected su~bsidiary streamlines
. . . . Isotochs at 5~-kt intervals shading denotes speed >20kt >25kt~ etc
fNor thern equatorial trough (NEI"~ ~ . ~ Zones of minimum wind [.Southern equatoriot trough (SET)
�9 LonO contours at 3000~w and 700Oft
Lond above 10000ft
Mean monthly airflow at I km in July (Findlater 1977).
chart for July at a level just above the boundary layer the synoptic vortices are pro- minent (figure 15). All these observations suggest that the synoptic scale disturb- ances are crucial for the very existence of the ITCZ.
7. Seasonal variation of the ITCZ
Averaged over the globe, the location of the equatorial trough shows a seasonal osoil- lation with a phase lag of about two months (figure 16). It is seen from figure 8 that the amplitude of this seasonal variation is maximum over the Indian longitudes (about 30 ~ latitude), is significant over the eastern parts of Africa and South America and negligible over the eastern and central Pacific and Atlantic Oceans. The phase lag over the continents is about one month whereas that over the oceans is two months. The difference in the amplitude of the response over land and ocean arises mainly because the ocean provides an interactive boundary at which the temperatures

306 Sulochana Gadgil
I
o * / ~ | ,~
�9 " r ~ ~ o -
~ o s s ~ �9 ~ o* �9 �9
�9 i �9 L
} ~ �9 . s ~ #
~
Figure 15. Kinematic analysis of mean resultant wind for July at 900 m. are labelled in knots (Ramage 1971)
/ " , , . " . ~. , , , , ~ _ ~ / I
6o* ~0 ~ eO m tOe. t
Isotachs
are determined not only by the insolation but by other factors such as the wind- driven ocean currents, up-welling etc. Thus the wind regime, consisting of easterlies equatorward of the subtropical highs attd westerlies poleward of them, drives anticyclonic gyres in the oceans with poleward currents near the western boundaries and equatorward currents near the eastern boundaries of the oceans. Such strong equatorward currents occur along the west coasts of Southern Africa and America. They depress the sea-surface temperature of the equatorial region by adveetion of the cold water from the high latitudes. This seems to constrain the oscillation of the ITCZ in these oceanic areas to the northern hemisphere.
The location of the radiative heat source over the continental areas corresponds rather closely to that of the maximum insolation and hence the amplitude of the oscillation over the eastern hemisphere is larger. Further, the Tibetan plateau which extends to half tile troposphere, acts as an elevated heat source so the amplitude is even larger over the Indian longitudes than over other continental areas.
8. Transitions, fluctuations and climatic changes
The seasonal transitions over any given longitudinal belt differ markedly from the mean pizture of figure 16, in being rather abrupt. For example, the northward

Fluid dynamics of the monsoon
" ol- r \
Sept Nov Jan March May JuLy Sept
307
Figure 16. Seasonal variation in the latitude of the equatorial trough and sun averaged over the globe (Riehl 1978).
movement of ITCZ over the Indian longitudes during the onset phase of the monsoon, i.e. in the spring-to-summer transition, occurs in a series of northward surges, each successive surge taking the ITCZ farther northward. These surges arise from the poleward movement of the synoptic-scale vortices generated in the ITCZ (Sikka & Gadgil 1980). Hence the prediction of the transition phase involves the prediction of the generation and movement of the disturbances.
The fluctuations in the precipitation over the time-scale of 2-4 weeks between the active and the weak phases of the ITCZ probably arise from the clouds and the hydrological cycle associated with them. A relatively simple model of the monsoon including important features such as the presence of a continental as well as oceanic areas with the latter being an interactive boundary (Webster et al 1977) brings out clearly the important role played by tl~e clouds (figure 17). Note that with the in- corporation of the clouds, the synoptic-scale fluctuations become more prominent and the larger time-scale fluctuation also appears with a ' break' in the monsoon every four weeks. This suggests that the decrease in the strength of the radiative source brought about by the clouds in the ITCZ may act as a negative feedback and generate intraseasonal fluctuations.
The interannual variability of the ITCZ arises from the interaction between the various components of the tropical atmospheric and oceanic circulation. There is evidence for strong coupling between trade winds and the underlying ocean (Barnett 1977). Reiter (1978 a, b) has shown that there is a positive feedback between the ITCZ, the trades and the sea-surface temperature (SST). Studies of predictabilities of SST (Davies 1976) suggest that the observed variation in SST is largely a result of the atmosphere driving the ocean, although earlier Bjerknes (1966) and Namias (1959) had suggested that the strength of the ITCZ is determined by the SST. Whether the oceanic or the atmospheric conditions play a determining role in the interaction depends upon the time-scale considered. It is likely that the low-frequency variabili- ties in the seasonal thermocline arise from stochastic forcings by short-period atmo- spheric disturbances (Frankignoul & Hasselmann 1977). The oceanic conditions so produced may in turn determine the intensity of the ITCZ in a given season. Such interactions are likely to be important in determining climatic changes occurring over longer time-scales.
A steady decrease in the precipitation leading to climatic change can occur due to a biogeophysical feedback in which precipitation decreases with the introduction of

308 Sulockana Gadgil
Z',.
v

Fluid dynamics o f the monsoon 309
desert-like condit ions (with higher albcdo at the surface) and this decrease o f precipi- tation in tu rn triggers an intensification o f desert condit ions (Chantey et al 1977). Changes i n the evapotranspira t ion rates can also produce similar effects. Whether these or other mechanisms bring about the observed climatic change has to be ascer- tained by fur ther studies.
All in all, it is clear tha t despite the progress in our fmderstanding o f the m o n s o o n since Halley's time, it remains to this day one o f the mos t exciting and challenging problems in fluid dynamics.
References
Ananthakrishnan R 1966 Monsoon rainfall summary, June to September (Poona : India Met. Dept.) Augstein E 1978 in Meteorology over the tropical oceans, Prec. of Conf. (Bracknell, UK: Royal Met.
See.) p. 73 Barnett T P 1977 d. Atmos. Sci. 34 221 Bjerknes J 1966 Tellns 18 820 Charney J G 1967 in Advances in numerical weather prediction (Connecticut: Travellers Res. Centre) Charney J G, Quirk W J, Chow S & Kornfield J 1977 J. Atmos. Sci. 34 1366 Chamey J G & Eliasscn A 1964 J. Atmos. Sci. 21 68 Davis R E 1976 J. Phys. Oceanogr. 3 249 Ferrel W 1856 Nashville J. Med. Surgery 11 287 (Reprinted: 1882 Prof. Pap. Signal Serv. No. 12,
Washington 7-19, 64) Findlater J 1977 Pageoph. 115 1251 Frankignoul C & H_asselmann K 1977 Tellus 29 289 Gray W M 1968 Man. Weather Rev. 96 669 Halley E 1686 Philos. Trans. 26 153 Hubert L F, Krueger A F & Winston J S 1969 d. Atmos. Sci. 26 771 Krishnamurthi T N, Ardanuy P, Ramanathan Y & Pasch R 1980 On the onset-vortex of the summer
monsoon, Rcp. No. 80-3 Dept of Meteorology, Florida State Univ., Tallahassee Namias J 1959 J. Geophys. Res. 64 631 Ramage C S 1971 Monsoon meteorology (Now York: Academic Press) Reiter E R 1978a J. Atmos. ScL 35 349 Reiter E R 1978b Man. Weather Rev. 106 324 Riehl H 1954 Tropicalmeteorology (New York: McGraw Hill) Riehl H 1978 Introduction to the atmosphere (Now York: McGraw Hill) Schneider E K & Lindzen R S 1977 J. Atmos. Sci. 34 263 Sikka D R 1980 Prec. Indian Acad. Sci. (Earth Planet. Sci.) 89 179 Sikka D R & Gadgil S 1980 Man. Weather Rev. (in press) Stone P H 1968 J. Atmos. ScL 25 644 Thaper R 1966 A history oflndia (Harmondsworth, UK: Penguin) Webster P J, Chou L & Lan K M W 1977 Pure AppL Geophys. 115 1463

Fluid dynamics of the monsoon 311
t ~
"0
0
<

312 Sulochana Gadgil
Plate 2
Figure 4. A hurricane on 17 January 1976 from NOAA 4 satellite (Riehl 1978)

Fluid dynamics of the monsoon 313
ee~
o h
e q
Oh
*d
(.q
r
�9
r ~q
tz Q

314 Sulochana Gadgil
t ~
~tj
~rj
oo
0 N