Embed Size (px)
Citation preview
(c) AZOTH Analytics
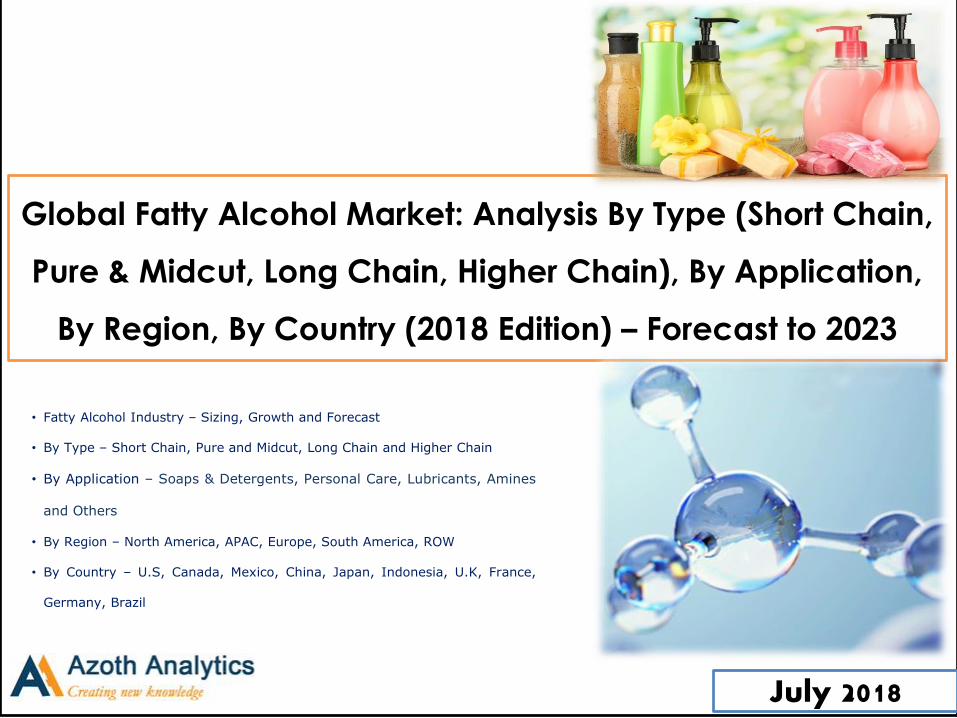
Global Fatty Alcohol Market: Analysis By Type (Short Chain,
Pure & Midcut, Long Chain, Higher Chain), By Application,
By Region, By Country (2018 Edition) – Forecast to 2023
• Fatty Alcohol Industry – Sizing, Growth and Forecast
• By Type – Short Chain, Pure and Midcut, Long Chain and Higher Chain
• By Application – Soaps & Detergents, Personal Care, Lubricants, Amines
and Others
• By Region – North America, APAC, Europe, South America, ROW
• By Country – U.S, Canada, Mexico, China, Japan, Indonesia, U.K, France,
Germany, Brazil
July 2018
(c) AZOTH Analytics
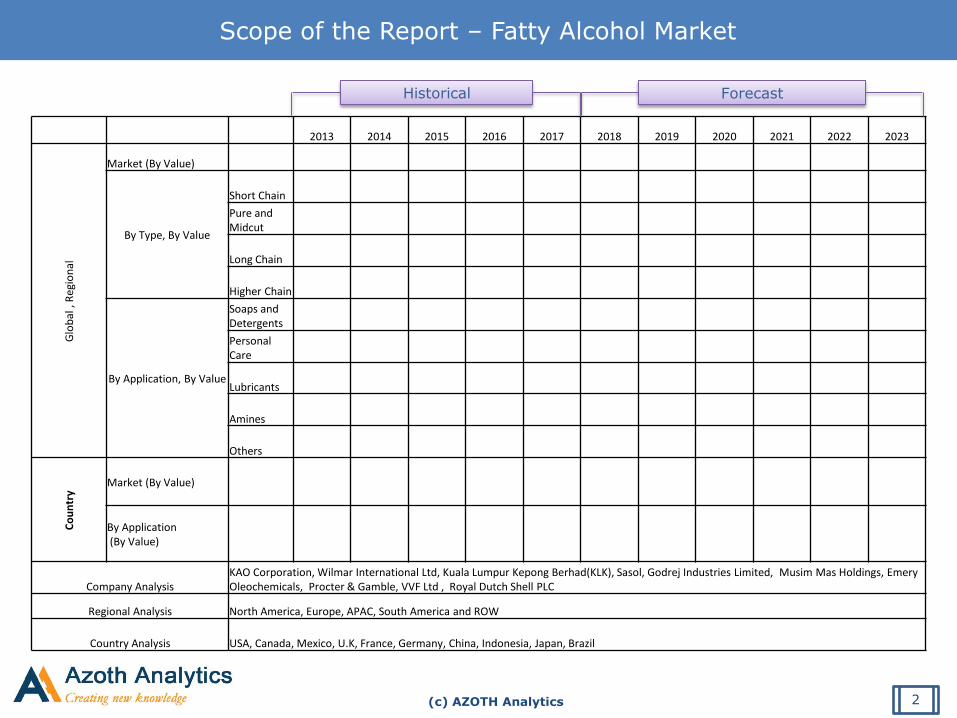
Scope of the Report – Fatty Alcohol Market
2
2013 2014 2015 2016 2017 2018 2019 2020 2021 2022 2023
Glo
bal
, R
egio
nal
Market (By Value)
By Type, By Value
Short Chain
Pure and Midcut
Long Chain
Higher Chain
By Application, By Value
Soaps and Detergents
Personal Care
Lubricants
Amines
Others
Co
un
try
Market (By Value)
By Application (By Value)
Company Analysis KAO Corporation, Wilmar International Ltd, Kuala Lumpur Kepong Berhad(KLK), Sasol, Godrej Industries Limited, Musim Mas Holdings, Emery Oleochemicals, Procter & Gamble, VVF Ltd , Royal Dutch Shell PLC
Regional Analysis North America, Europe, APAC, South America and ROW
Country Analysis USA, Canada, Mexico, U.K, France, Germany, China, Indonesia, Japan, Brazil
Historical Forecast
(c) AZOTH Analytics
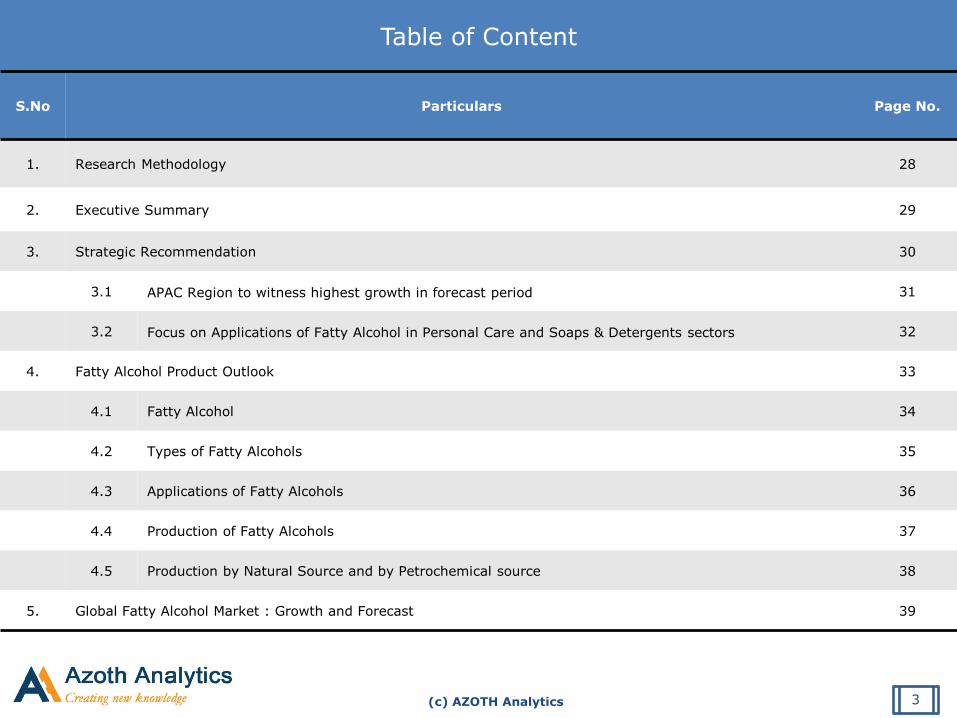
Table of Content
3
S.No Particulars Page No.
1. Research Methodology 28
2. Executive Summary 29
3. Strategic Recommendation 30
3.1 APAC Region to witness highest growth in forecast period 31
3.2 Focus on Applications of Fatty Alcohol in Personal Care and Soaps & Detergents sectors 32
4. Fatty Alcohol Product Outlook 33
4.1 Fatty Alcohol 34
4.2 Types of Fatty Alcohols 35
4.3 Applications of Fatty Alcohols 36
4.4 Production of Fatty Alcohols 37
4.5 Production by Natural Source and by Petrochemical source 38
5. Global Fatty Alcohol Market : Growth and Forecast 39
(c) AZOTH Analytics
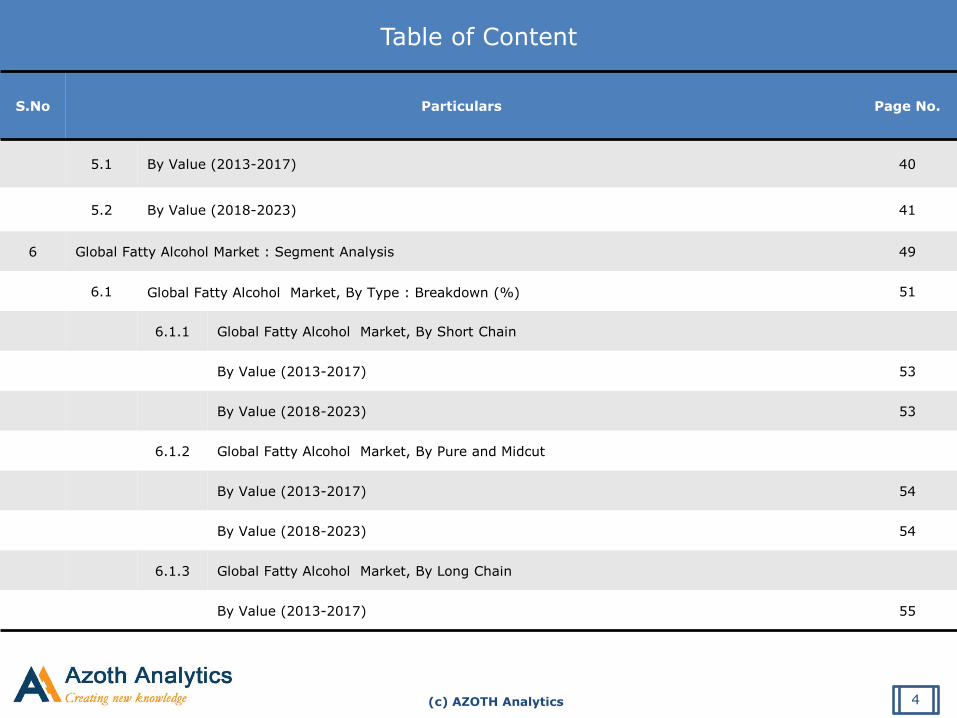
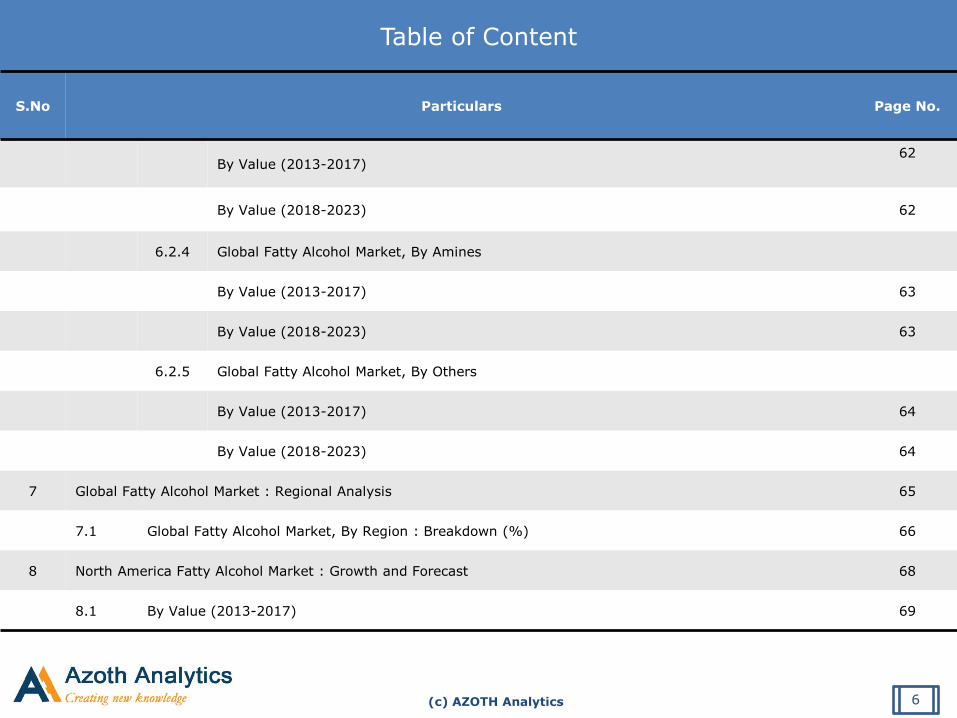
Table of Content
4
S.No Particulars Page No.
5.1 By Value (2013-2017) 40
5.2 By Value (2018-2023) 41
6 Global Fatty Alcohol Market : Segment Analysis 49
6.1 Global Fatty Alcohol Market, By Type : Breakdown (%) 51
6.1.1 Global Fatty Alcohol Market, By Short Chain
By Value (2013-2017) 53
By Value (2018-2023) 53
6.1.2 Global Fatty Alcohol Market, By Pure and Midcut
By Value (2013-2017) 54
By Value (2018-2023) 54
6.1.3 Global Fatty Alcohol Market, By Long Chain
By Value (2013-2017) 55
(c) AZOTH Analytics
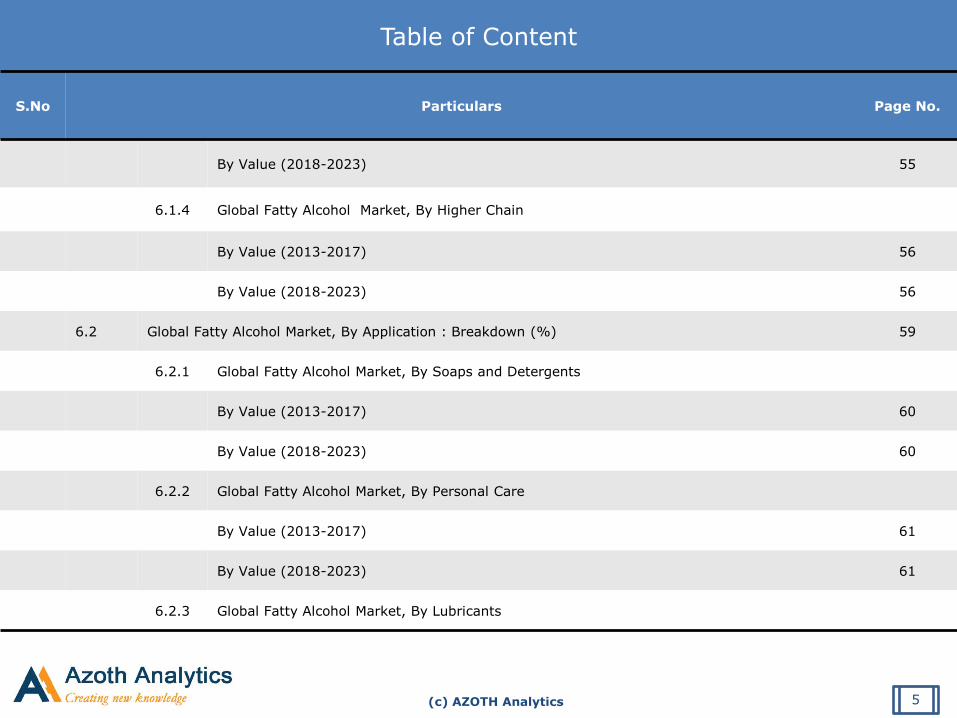
Table of Content
5
S.No Particulars Page No.
By Value (2018-2023) 55
6.1.4 Global Fatty Alcohol Market, By Higher Chain
By Value (2013-2017) 56
By Value (2018-2023) 56
6.2 Global Fatty Alcohol Market, By Application : Breakdown (%) 59
6.2.1 Global Fatty Alcohol Market, By Soaps and Detergents
By Value (2013-2017) 60
By Value (2018-2023) 60
6.2.2 Global Fatty Alcohol Market, By Personal Care
By Value (2013-2017) 61
By Value (2018-2023) 61
6.2.3 Global Fatty Alcohol Market, By Lubricants
(c) AZOTH Analytics
Table of Content
6
S.No Particulars Page No.
By Value (2013-2017) 62
By Value (2018-2023) 62
6.2.4 Global Fatty Alcohol Market, By Amines
By Value (2013-2017) 63
By Value (2018-2023) 63
6.2.5 Global Fatty Alcohol Market, By Others
By Value (2013-2017) 64
By Value (2018-2023) 64
7 Global Fatty Alcohol Market : Regional Analysis 65
7.1 Global Fatty Alcohol Market, By Region : Breakdown (%) 66
8 North America Fatty Alcohol Market : Growth and Forecast 68
8.1 By Value (2013-2017) 69
(c) AZOTH Analytics
Table of Content
7
S.No Particulars Page No.
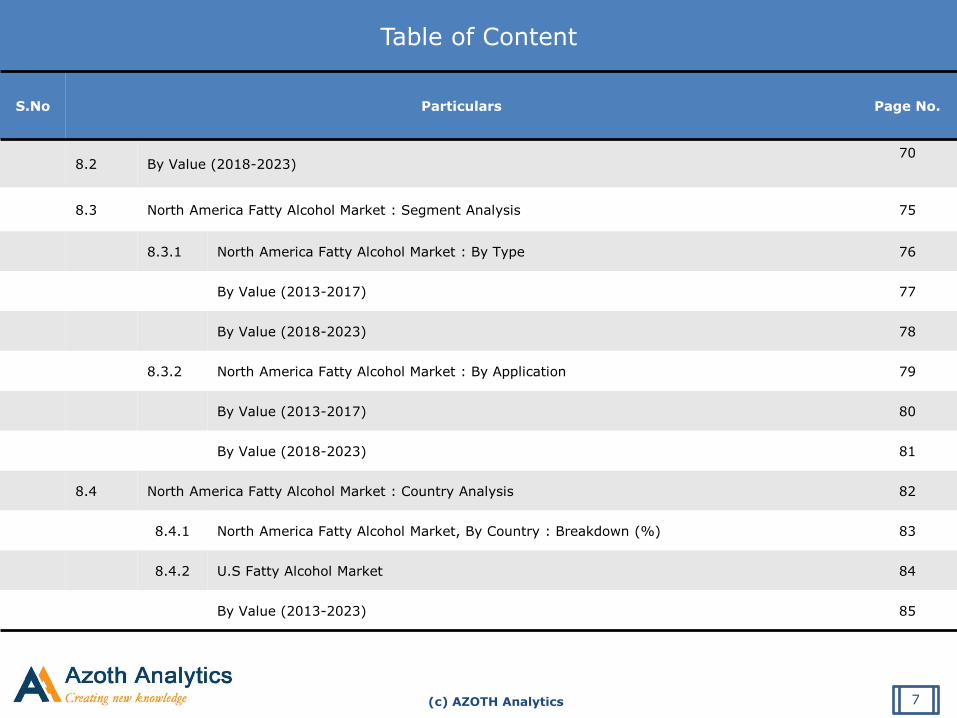
8.2 By Value (2018-2023) 70
8.3 North America Fatty Alcohol Market : Segment Analysis 75
8.3.1 North America Fatty Alcohol Market : By Type 76
By Value (2013-2017) 77
By Value (2018-2023) 78
8.3.2 North America Fatty Alcohol Market : By Application 79
By Value (2013-2017) 80
By Value (2018-2023) 81
8.4 North America Fatty Alcohol Market : Country Analysis 82
8.4.1 North America Fatty Alcohol Market, By Country : Breakdown (%) 83
8.4.2 U.S Fatty Alcohol Market 84
By Value (2013-2023) 85
(c) AZOTH Analytics
Table of Content
8
S.No Particulars Page No.
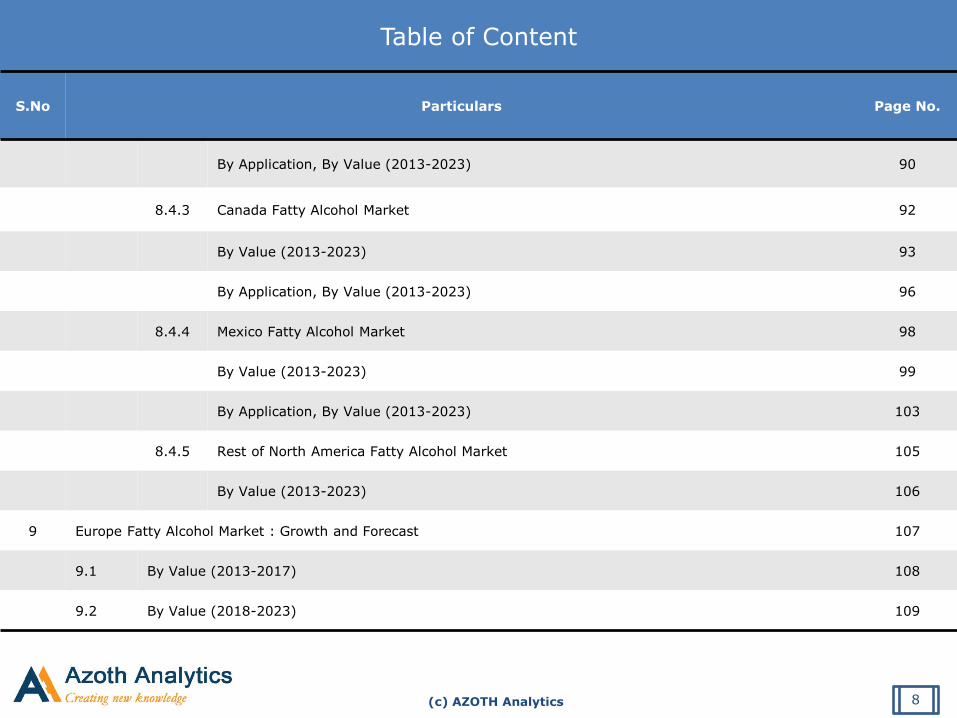
By Application, By Value (2013-2023) 90
8.4.3 Canada Fatty Alcohol Market 92
By Value (2013-2023) 93
By Application, By Value (2013-2023) 96
8.4.4 Mexico Fatty Alcohol Market 98
By Value (2013-2023) 99
By Application, By Value (2013-2023) 103
8.4.5 Rest of North America Fatty Alcohol Market 105
By Value (2013-2023) 106
9 Europe Fatty Alcohol Market : Growth and Forecast 107
9.1 By Value (2013-2017) 108
9.2 By Value (2018-2023) 109
(c) AZOTH Analytics
Table of Content
9
S.No Particulars Page No.
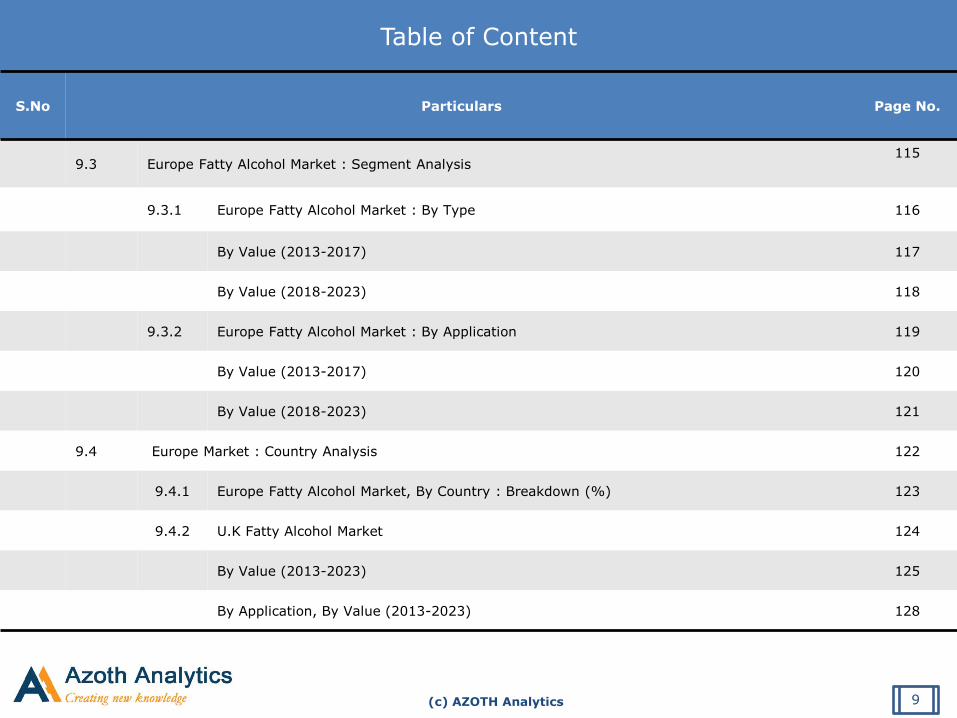
9.3 Europe Fatty Alcohol Market : Segment Analysis 115
9.3.1 Europe Fatty Alcohol Market : By Type 116
By Value (2013-2017) 117
By Value (2018-2023) 118
9.3.2 Europe Fatty Alcohol Market : By Application 119
By Value (2013-2017) 120
By Value (2018-2023) 121
9.4 Europe Market : Country Analysis 122
9.4.1 Europe Fatty Alcohol Market, By Country : Breakdown (%) 123
9.4.2 U.K Fatty Alcohol Market 124
By Value (2013-2023) 125
By Application, By Value (2013-2023) 128
(c) AZOTH Analytics
Table of Content
S.No Particulars Page No.
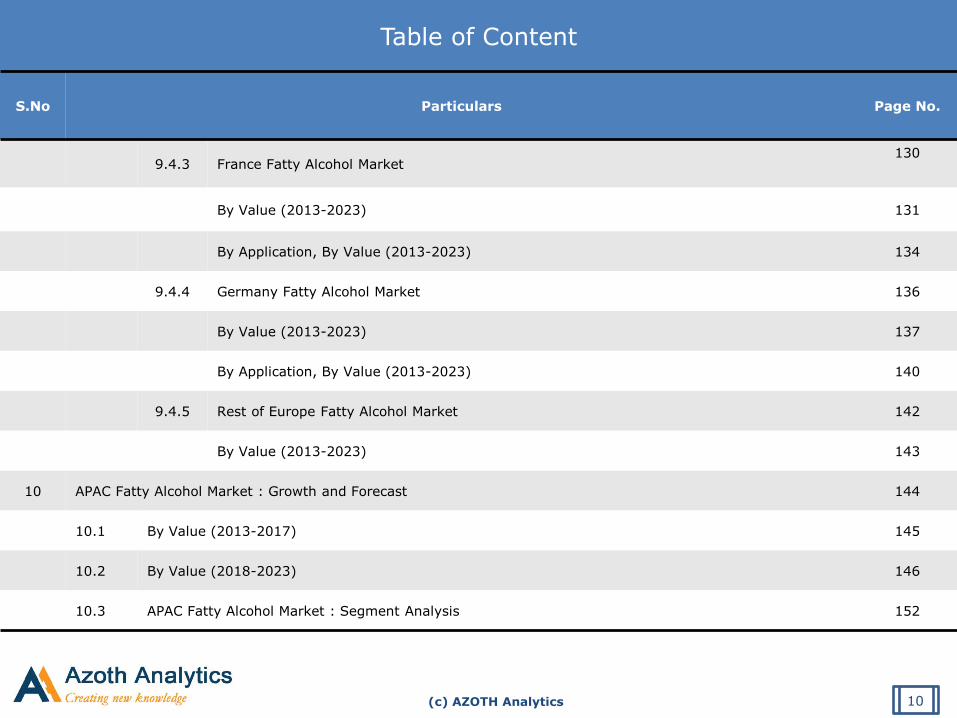
9.4.3 France Fatty Alcohol Market 130
By Value (2013-2023) 131
By Application, By Value (2013-2023) 134
9.4.4 Germany Fatty Alcohol Market 136
By Value (2013-2023) 137
By Application, By Value (2013-2023) 140
9.4.5 Rest of Europe Fatty Alcohol Market 142
By Value (2013-2023) 143
10 APAC Fatty Alcohol Market : Growth and Forecast 144
10.1 By Value (2013-2017) 145
10.2 By Value (2018-2023) 146
10.3 APAC Fatty Alcohol Market : Segment Analysis 152
10
(c) AZOTH Analytics
Table of Content
S.No Particulars Page No.
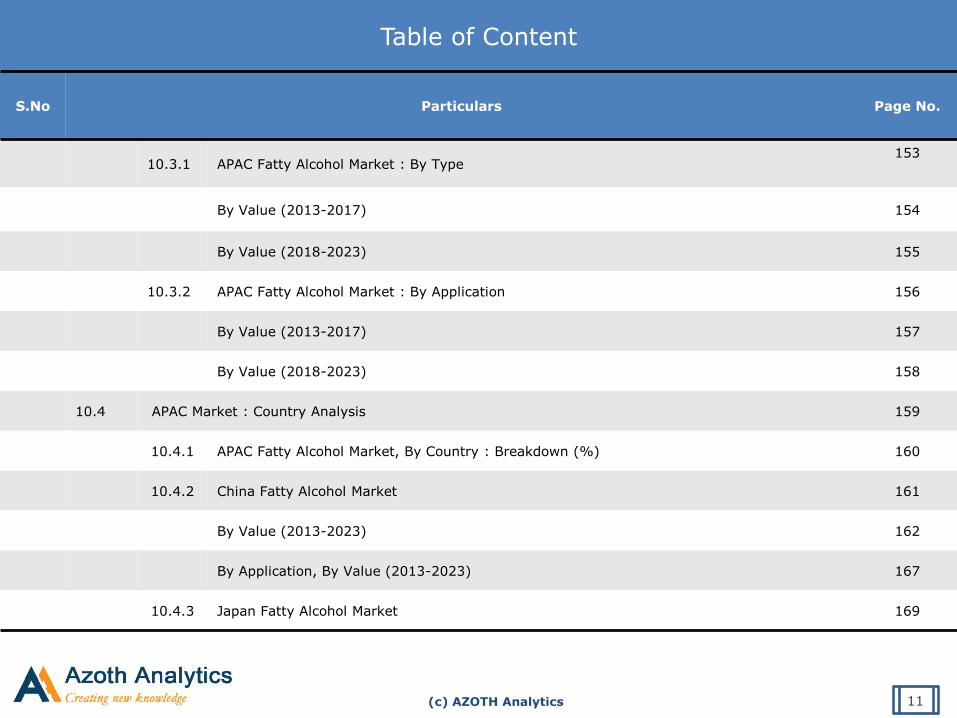
10.3.1 APAC Fatty Alcohol Market : By Type 153
By Value (2013-2017) 154
By Value (2018-2023) 155
10.3.2 APAC Fatty Alcohol Market : By Application 156
By Value (2013-2017) 157
By Value (2018-2023) 158
10.4 APAC Market : Country Analysis 159
10.4.1 APAC Fatty Alcohol Market, By Country : Breakdown (%) 160
10.4.2 China Fatty Alcohol Market 161
By Value (2013-2023) 162
By Application, By Value (2013-2023) 167
10.4.3 Japan Fatty Alcohol Market 169
11

(c) AZOTH Analytics
Table of Content
S.No Particulars Page No.
By Value (2013-2023) 170
By Application, By Value (2013-2023) 173
10.4.4 Indonesia Fatty Alcohol Market 175
By Value (2013-2023) 176
By Application, By Value (2013-2023) 178
10.4.5 Rest of APAC Fatty Alcohol Market 180
By Value (2013-2023) 181
11 South America Fatty Alcohol Market : Growth and Forecast 183
11.1 By Value (2013-2017) 184
11.2 By Value (2018-2023) 185
11.3 South America Fatty Alcohol Market : Segment Analysis 187
11.3.1 South America Fatty Alcohol Market : By Type 188
12
(c) AZOTH Analytics
Table of Content
S.No Particulars Page No.
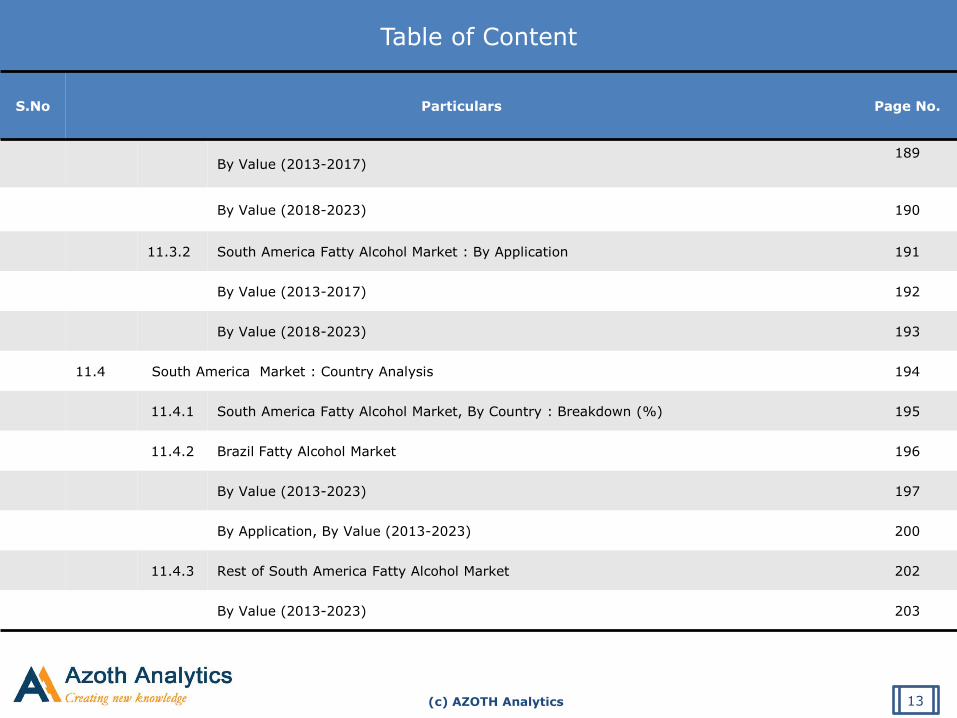
By Value (2013-2017) 189
By Value (2018-2023) 190
11.3.2 South America Fatty Alcohol Market : By Application 191
By Value (2013-2017) 192
By Value (2018-2023) 193
11.4 South America Market : Country Analysis 194
11.4.1 South America Fatty Alcohol Market, By Country : Breakdown (%) 195
11.4.2 Brazil Fatty Alcohol Market 196
By Value (2013-2023) 197
By Application, By Value (2013-2023) 200
11.4.3 Rest of South America Fatty Alcohol Market 202
By Value (2013-2023) 203
13
(c) AZOTH Analytics
Table of Content
S.No Particulars Page No.
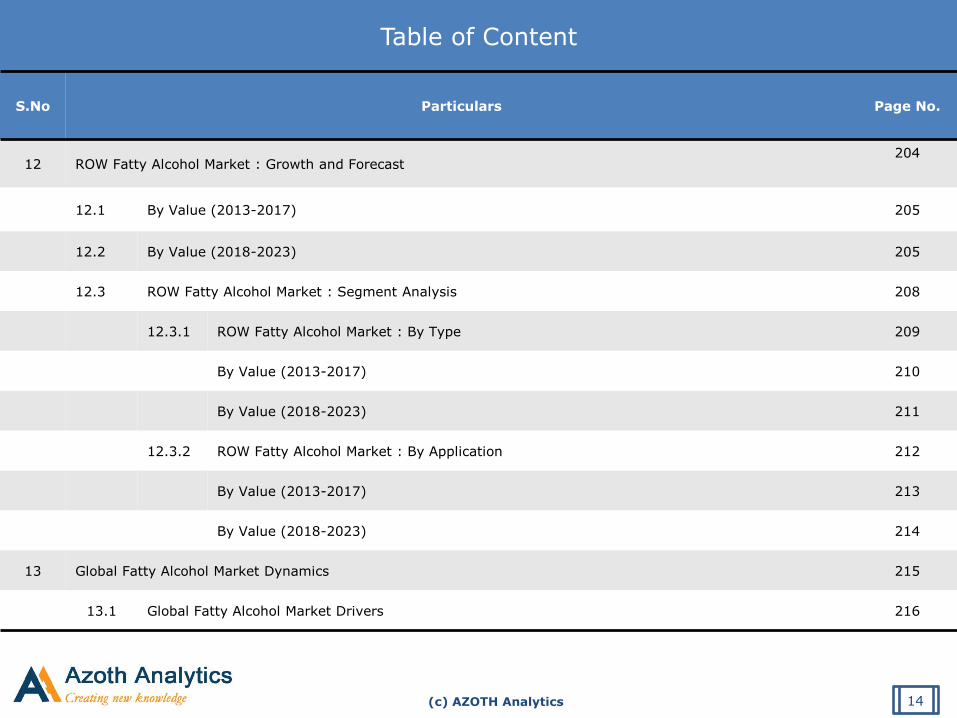
12 ROW Fatty Alcohol Market : Growth and Forecast 204
12.1 By Value (2013-2017) 205
12.2 By Value (2018-2023) 205
12.3 ROW Fatty Alcohol Market : Segment Analysis 208
12.3.1 ROW Fatty Alcohol Market : By Type 209
By Value (2013-2017) 210
By Value (2018-2023) 211
12.3.2 ROW Fatty Alcohol Market : By Application 212
By Value (2013-2017) 213
By Value (2018-2023) 214
13 Global Fatty Alcohol Market Dynamics 215
13.1 Global Fatty Alcohol Market Drivers 216
14
(c) AZOTH Analytics
Table of Content
S.No Particulars Page No.
13.2 Global Fatty Alcohol Market Restraints 220
14 Global Fatty Alcohol Market Trends 222
15 Porter Five Force Analysis 226
16 SWOT Analysis 228
17 Company Profiling 230
17.1 KAO Corporation 231
17.2 Wilmar International Ltd. 232
17.3 Kuala Lumpur Kepong Berhad (KLK) 233
17.4 Sasol 234
17.5 Godrej Industries Limited 235
17.6 Musim Mas Holdings 237
17.7 Emery Oleochemicals 238
15
(c) AZOTH Analytics
Table of Content
S.No Particulars Page No.
17.8 Procter and Gamble (P&G) 239
17.9 VVF Ltd 240
17.10 Royal Dutch Shell PLC 241
18 About Us 242
16
(c) AZOTH Analytics
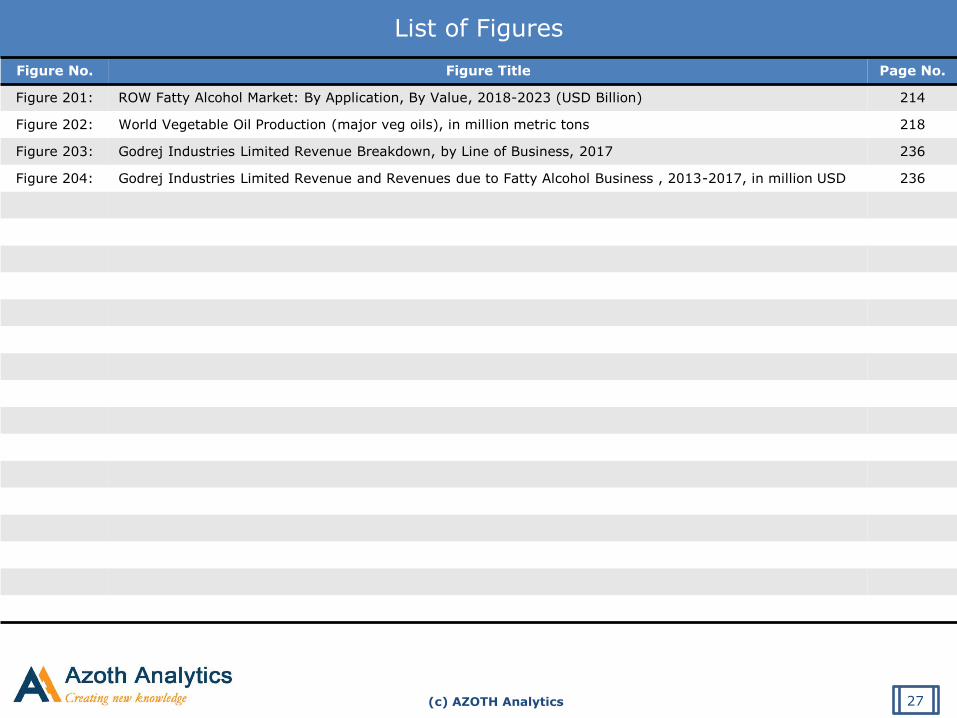
List of Figures
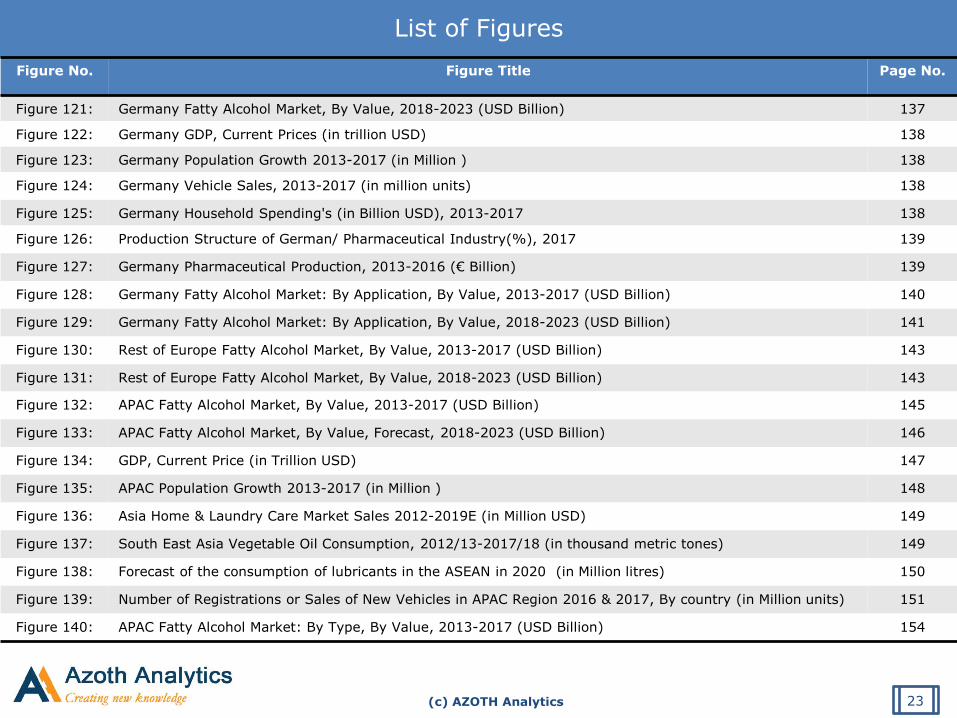
Figure No. Figure Title Page No.
Figure 1: Global Fatty Alcohol Market Size, By value , 2013-2017 (USD Billion) 40
Figure 2: Global Fatty Alcohol Market Size, By value , 2018-2023 (USD Billion) 41
Figure 3: Global Population growth, 2013-2017 (in Billion ) 42
Figure 4: World Real GDP Growth , 2013-2023, in Trillion USD 43
Figure 5: Outlook of Gross Domestic Production ,2018 (%) 44
Figure 6: Trend in Gross Domestic Production ,2018-2020 (%) 44
Figure 7: Global Home & Laundry Care Market Sales 2012-2021E (in Billion USD) 44
Figure 8: Global Vegetable Oil Production, By Type of Oil, 2012-2017 (in million metric tones) 45
Figure 9: Global Vegetable Oil Production, By Type of Oil, 2012-2017 (in million metric tones) 46
Figure 10: Global Lubricants market split by region in 2017 (%) 47
Figure 11: Global Car and Commercial Vehicle Production Statistics (2013-2017), In Million Units 47
Figure 12: Number of Cars sold World wide, 2015-2018 (in millions) 48
Figure 13: Breakdown of the Cosmetic Market Worldwide in 2017, By Geographic Zone 48
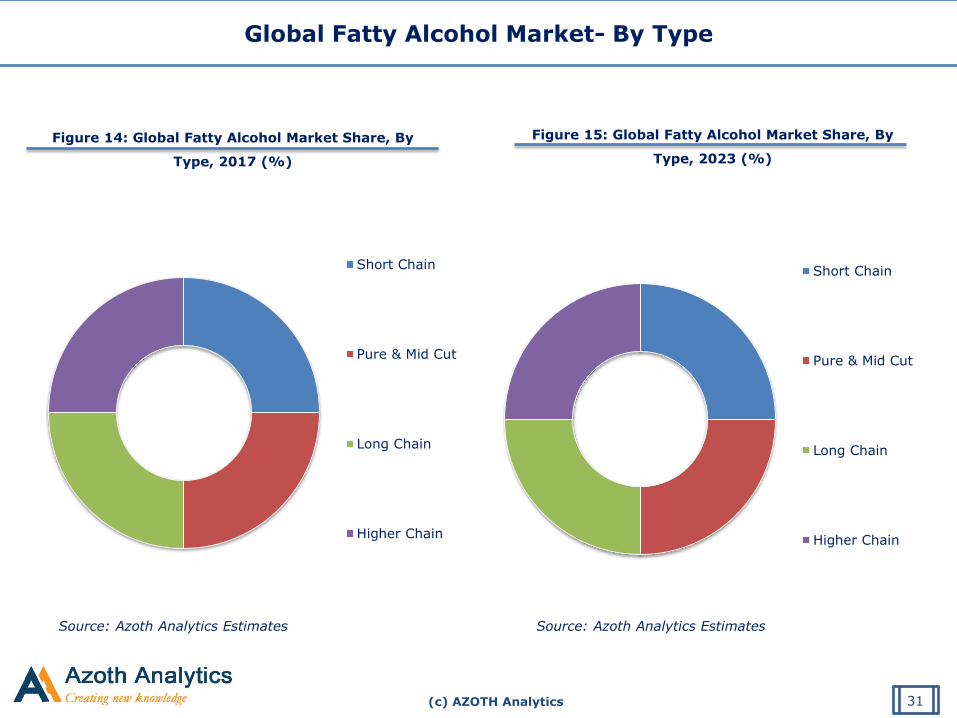
Figure 14: Global Fatty Alcohol Market Share, By Type, 2017 (%) 52
Figure 15: Global Fatty Alcohol Market Share, By Type, 2023 (%) 52
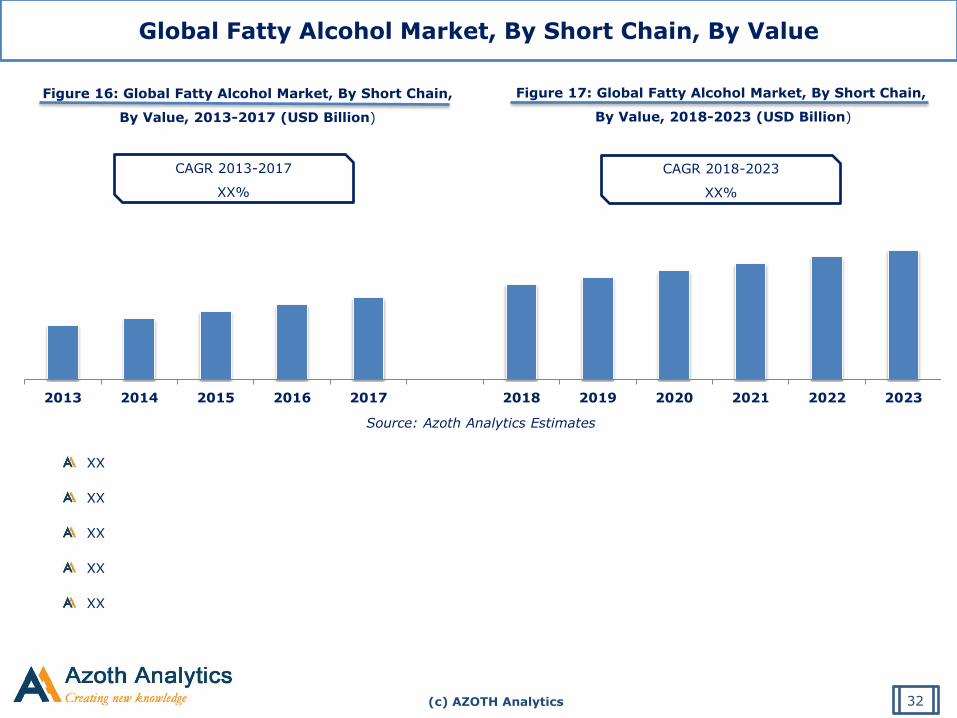
Figure 16: Global Fatty Alcohol Market, By Short Chain, By Value, 2013-2017 (USD Billion) 53
Figure 17: Global Fatty Alcohol Market, By Short Chain, By Value, 2018-2023 (USD Billion) 53
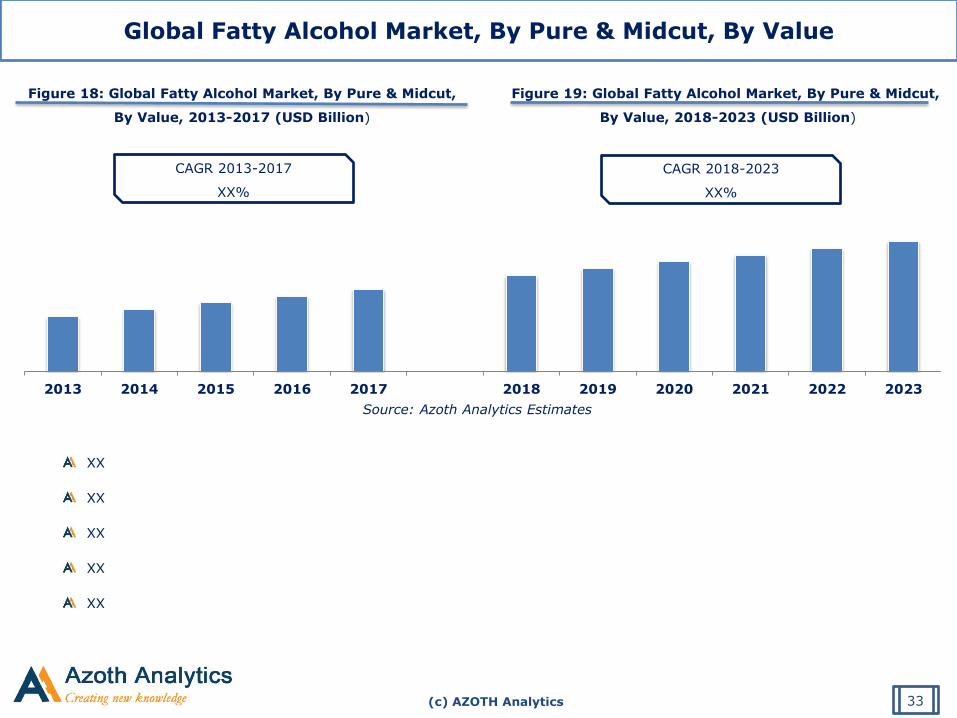
Figure 18: Global Fatty Alcohol Market, By Pure & Midcut, By Value, 2013-2017 (USD Billion) 54
Figure 19: Global Fatty Alcohol Market, By Pure & Midcut, By Value, 2018-2023 (USD Billion) 54
Figure 20: Global Fatty Alcohol Market, By Long Chain, By Value, 2013-2017 (USD Billion) 55
17
(c) AZOTH Analytics
List of Figures Figure No. Figure Title Page No.
Figure 21: Global Fatty Alcohol Market, By Long Chain, By Value, 2018-2023 (USD Billion) 55
Figure 22: Global Fatty Alcohol Market, By Higher Chain, By Value, 2013-2017 (USD Billion) 56
Figure 23: Global Fatty Alcohol Market, By Higher Chain, By Value, 2018-2023 (USD Billion) 56
Figure 24: Global Fatty Alcohol Market Share, By Application, 2017 (%) 59
Figure 25: Global Fatty Alcohol Market Share, By Application, 2023 (%) 59
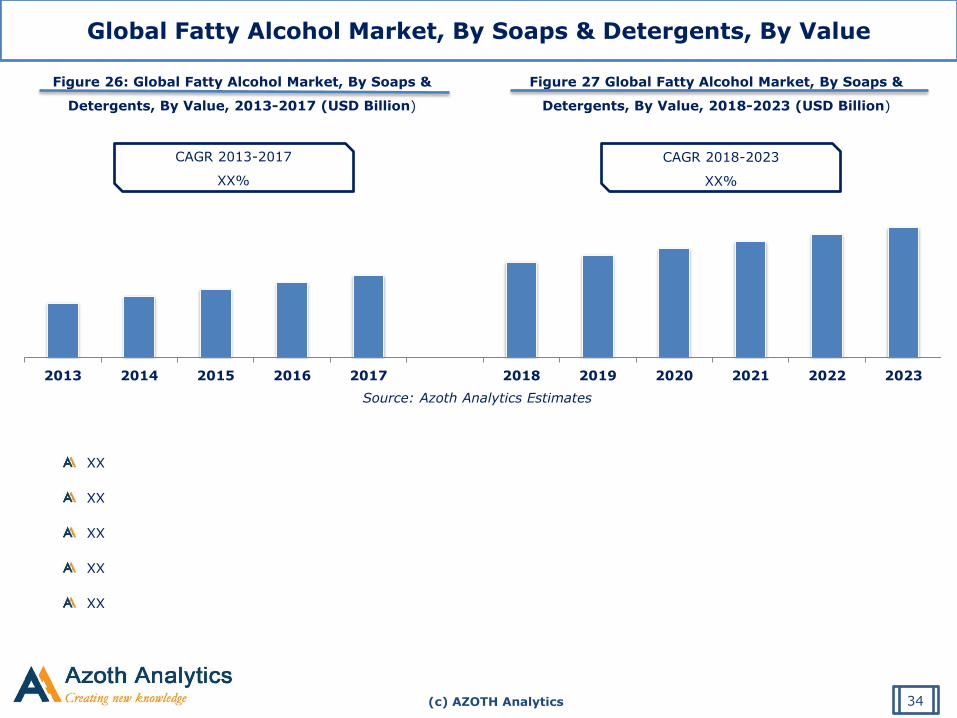
Figure 26: Global Fatty Alcohol Market, By Soaps & Detergents, By Value, 2013-2017 (USD Billion) 60
Figure 27: Global Fatty Alcohol Market, By Soaps & Detergents, By Value, 2018-2023 (USD Billion) 60
Figure 28: Global Fatty Alcohol Market, By Personal Care, By Value, 2013-2017 (USD Billion) 61
Figure 29: Global Fatty Alcohol Market, By Personal Care, By Value, 2018-2023 (USD Billion) 61
Figure 30: Global Fatty Alcohol Market, By Lubricants, By Value, 2013-2017 (USD Billion) 62
Figure 31: Global Fatty Alcohol Market, By Lubricants, By Value, 2018-2023 (USD Billion) 62
Figure 32: Global Fatty Alcohol Market, By Amines, By Value, 2013-2017 (USD Billion) 63
Figure 33: Global Fatty Alcohol Market, By Amines, By Value, 2018-2023 (USD Billion) 63
Figure 34: Global Fatty Alcohol Market, By Others, By Value, 2013-2017 (USD Billion) 64
Figure 35: Global Fatty Alcohol Market, By Others, By Value, 2018-2023 (USD Billion) 64
Figure 36: Global Fatty Alcohol Market Share, By Region, 2017 (%) 66
Figure 37: Global Fatty Alcohol Market Share, By Region, 2023 (%) 67
Figure 38: North America Fatty Alcohol Market, By Value, 2013-2017 (USD Billion) 69
Figure 39: North America Fatty Alcohol Market, By Value, Forecast, 2018-2023 (USD Billion) 70
Figure 40: North America Home & Laundry Care Market Sales 2012-2019E (in Million USD) 71
18
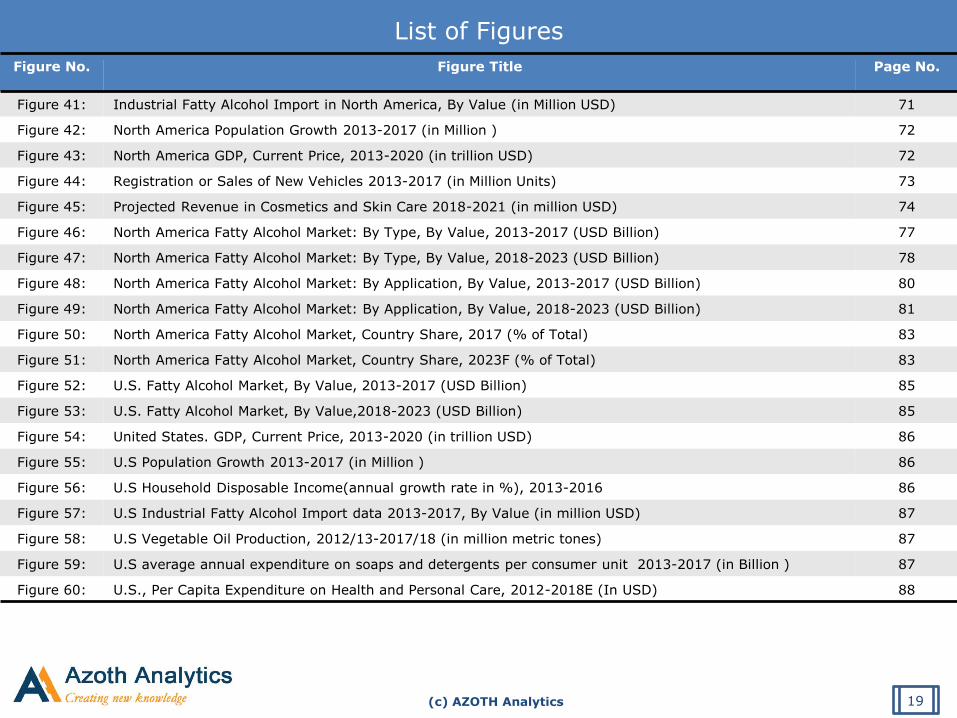
(c) AZOTH Analytics
List of Figures
Figure No. Figure Title Page No.
Figure 41: Industrial Fatty Alcohol Import in North America, By Value (in Million USD) 71
Figure 42: North America Population Growth 2013-2017 (in Million ) 72
Figure 43: North America GDP, Current Price, 2013-2020 (in trillion USD) 72
Figure 44: Registration or Sales of New Vehicles 2013-2017 (in Million Units) 73
Figure 45: Projected Revenue in Cosmetics and Skin Care 2018-2021 (in million USD) 74
Figure 46: North America Fatty Alcohol Market: By Type, By Value, 2013-2017 (USD Billion) 77
Figure 47: North America Fatty Alcohol Market: By Type, By Value, 2018-2023 (USD Billion) 78
Figure 48: North America Fatty Alcohol Market: By Application, By Value, 2013-2017 (USD Billion) 80
Figure 49: North America Fatty Alcohol Market: By Application, By Value, 2018-2023 (USD Billion) 81
Figure 50: North America Fatty Alcohol Market, Country Share, 2017 (% of Total) 83
Figure 51: North America Fatty Alcohol Market, Country Share, 2023F (% of Total) 83
Figure 52: U.S. Fatty Alcohol Market, By Value, 2013-2017 (USD Billion) 85
Figure 53: U.S. Fatty Alcohol Market, By Value,2018-2023 (USD Billion) 85
Figure 54: United States. GDP, Current Price, 2013-2020 (in trillion USD) 86
Figure 55: U.S Population Growth 2013-2017 (in Million ) 86
Figure 56: U.S Household Disposable Income(annual growth rate in %), 2013-2016 86
Figure 57: U.S Industrial Fatty Alcohol Import data 2013-2017, By Value (in million USD) 87
Figure 58: U.S Vegetable Oil Production, 2012/13-2017/18 (in million metric tones) 87
Figure 59: U.S average annual expenditure on soaps and detergents per consumer unit 2013-2017 (in Billion ) 87
Figure 60: U.S., Per Capita Expenditure on Health and Personal Care, 2012-2018E (In USD) 88
19
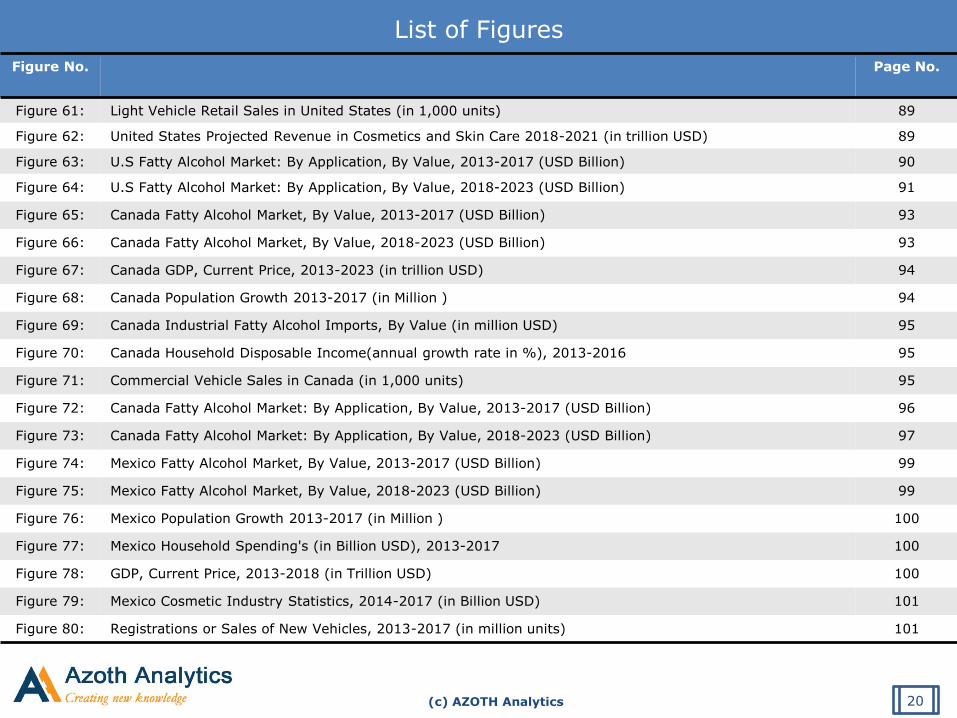
(c) AZOTH Analytics
List of Figures
Figure No. Page No.
Figure 61: Light Vehicle Retail Sales in United States (in 1,000 units) 89
Figure 62: United States Projected Revenue in Cosmetics and Skin Care 2018-2021 (in trillion USD) 89
Figure 63: U.S Fatty Alcohol Market: By Application, By Value, 2013-2017 (USD Billion) 90
Figure 64: U.S Fatty Alcohol Market: By Application, By Value, 2018-2023 (USD Billion) 91
Figure 65: Canada Fatty Alcohol Market, By Value, 2013-2017 (USD Billion) 93
Figure 66: Canada Fatty Alcohol Market, By Value, 2018-2023 (USD Billion) 93
Figure 67: Canada GDP, Current Price, 2013-2023 (in trillion USD) 94
Figure 68: Canada Population Growth 2013-2017 (in Million ) 94
Figure 69: Canada Industrial Fatty Alcohol Imports, By Value (in million USD) 95
Figure 70: Canada Household Disposable Income(annual growth rate in %), 2013-2016 95
Figure 71: Commercial Vehicle Sales in Canada (in 1,000 units) 95
Figure 72: Canada Fatty Alcohol Market: By Application, By Value, 2013-2017 (USD Billion) 96
Figure 73: Canada Fatty Alcohol Market: By Application, By Value, 2018-2023 (USD Billion) 97
Figure 74: Mexico Fatty Alcohol Market, By Value, 2013-2017 (USD Billion) 99
Figure 75: Mexico Fatty Alcohol Market, By Value, 2018-2023 (USD Billion) 99
Figure 76: Mexico Population Growth 2013-2017 (in Million ) 100
Figure 77: Mexico Household Spending's (in Billion USD), 2013-2017 100
Figure 78: GDP, Current Price, 2013-2018 (in Trillion USD) 100
Figure 79: Mexico Cosmetic Industry Statistics, 2014-2017 (in Billion USD) 101
Figure 80: Registrations or Sales of New Vehicles, 2013-2017 (in million units) 101
20
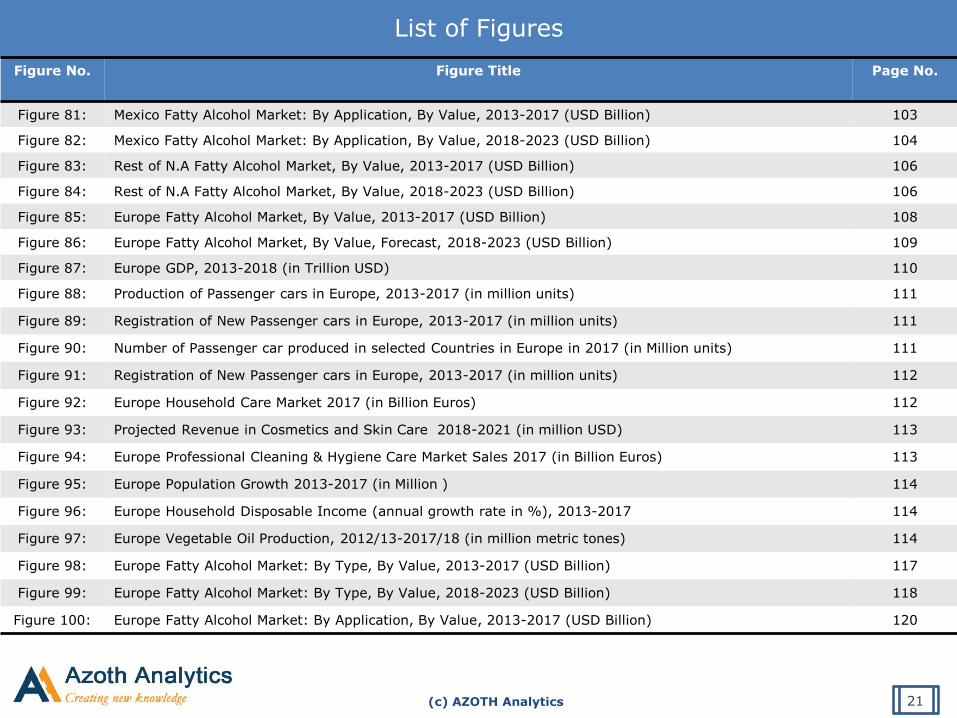
(c) AZOTH Analytics
List of Figures
Figure No. Figure Title Page No.
Figure 81: Mexico Fatty Alcohol Market: By Application, By Value, 2013-2017 (USD Billion) 103
Figure 82: Mexico Fatty Alcohol Market: By Application, By Value, 2018-2023 (USD Billion) 104
Figure 83: Rest of N.A Fatty Alcohol Market, By Value, 2013-2017 (USD Billion) 106
Figure 84: Rest of N.A Fatty Alcohol Market, By Value, 2018-2023 (USD Billion) 106
Figure 85: Europe Fatty Alcohol Market, By Value, 2013-2017 (USD Billion) 108
Figure 86: Europe Fatty Alcohol Market, By Value, Forecast, 2018-2023 (USD Billion) 109
Figure 87: Europe GDP, 2013-2018 (in Trillion USD) 110
Figure 88: Production of Passenger cars in Europe, 2013-2017 (in million units) 111
Figure 89: Registration of New Passenger cars in Europe, 2013-2017 (in million units) 111
Figure 90: Number of Passenger car produced in selected Countries in Europe in 2017 (in Million units) 111
Figure 91: Registration of New Passenger cars in Europe, 2013-2017 (in million units) 112
Figure 92: Europe Household Care Market 2017 (in Billion Euros) 112
Figure 93: Projected Revenue in Cosmetics and Skin Care 2018-2021 (in million USD) 113
Figure 94: Europe Professional Cleaning & Hygiene Care Market Sales 2017 (in Billion Euros) 113
Figure 95: Europe Population Growth 2013-2017 (in Million ) 114
Figure 96: Europe Household Disposable Income (annual growth rate in %), 2013-2017 114
Figure 97: Europe Vegetable Oil Production, 2012/13-2017/18 (in million metric tones) 114
Figure 98: Europe Fatty Alcohol Market: By Type, By Value, 2013-2017 (USD Billion) 117
Figure 99: Europe Fatty Alcohol Market: By Type, By Value, 2018-2023 (USD Billion) 118
Figure 100: Europe Fatty Alcohol Market: By Application, By Value, 2013-2017 (USD Billion) 120
21
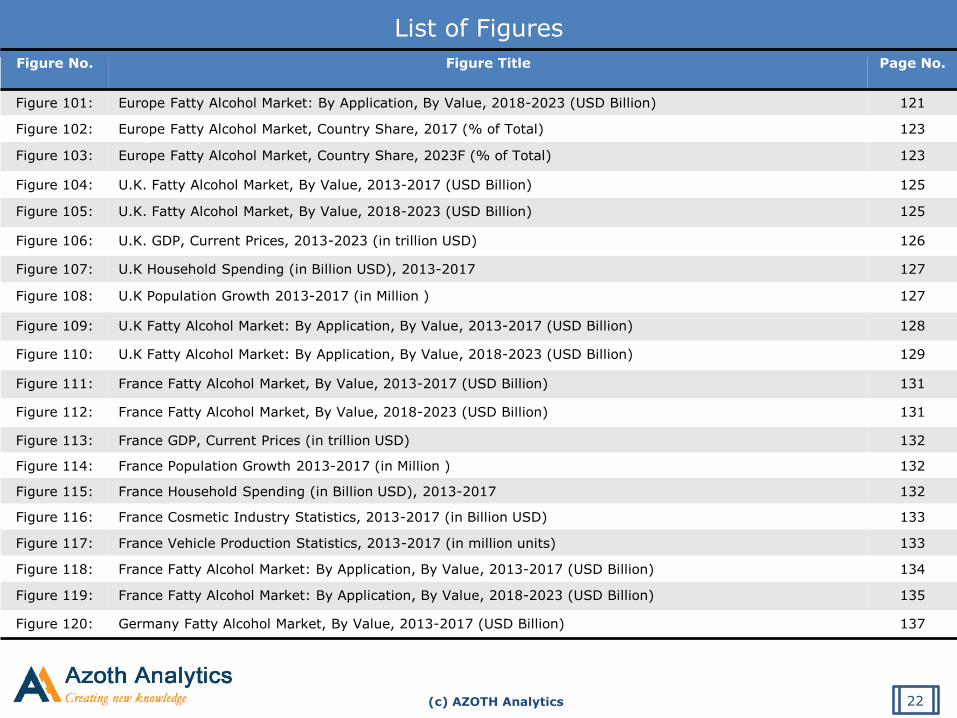
(c) AZOTH Analytics
List of Figures
Figure No. Figure Title Page No.
Figure 101: Europe Fatty Alcohol Market: By Application, By Value, 2018-2023 (USD Billion) 121
Figure 102: Europe Fatty Alcohol Market, Country Share, 2017 (% of Total) 123
Figure 103: Europe Fatty Alcohol Market, Country Share, 2023F (% of Total) 123
Figure 104: U.K. Fatty Alcohol Market, By Value, 2013-2017 (USD Billion) 125
Figure 105: U.K. Fatty Alcohol Market, By Value, 2018-2023 (USD Billion) 125
Figure 106: U.K. GDP, Current Prices, 2013-2023 (in trillion USD) 126
Figure 107: U.K Household Spending (in Billion USD), 2013-2017 127
Figure 108: U.K Population Growth 2013-2017 (in Million ) 127
Figure 109: U.K Fatty Alcohol Market: By Application, By Value, 2013-2017 (USD Billion) 128
Figure 110: U.K Fatty Alcohol Market: By Application, By Value, 2018-2023 (USD Billion) 129
Figure 111: France Fatty Alcohol Market, By Value, 2013-2017 (USD Billion) 131
Figure 112: France Fatty Alcohol Market, By Value, 2018-2023 (USD Billion) 131
Figure 113: France GDP, Current Prices (in trillion USD) 132
Figure 114: France Population Growth 2013-2017 (in Million ) 132
Figure 115: France Household Spending (in Billion USD), 2013-2017 132
Figure 116: France Cosmetic Industry Statistics, 2013-2017 (in Billion USD) 133
Figure 117: France Vehicle Production Statistics, 2013-2017 (in million units) 133
Figure 118: France Fatty Alcohol Market: By Application, By Value, 2013-2017 (USD Billion) 134
Figure 119: France Fatty Alcohol Market: By Application, By Value, 2018-2023 (USD Billion) 135
Figure 120: Germany Fatty Alcohol Market, By Value, 2013-2017 (USD Billion) 137
22
(c) AZOTH Analytics
List of Figures
Figure No. Figure Title Page No.
Figure 121: Germany Fatty Alcohol Market, By Value, 2018-2023 (USD Billion) 137
Figure 122: Germany GDP, Current Prices (in trillion USD) 138
Figure 123: Germany Population Growth 2013-2017 (in Million ) 138
Figure 124: Germany Vehicle Sales, 2013-2017 (in million units) 138
Figure 125: Germany Household Spending's (in Billion USD), 2013-2017 138
Figure 126: Production Structure of German/ Pharmaceutical Industry(%), 2017 139
Figure 127: Germany Pharmaceutical Production, 2013-2016 (€ Billion) 139
Figure 128: Germany Fatty Alcohol Market: By Application, By Value, 2013-2017 (USD Billion) 140
Figure 129: Germany Fatty Alcohol Market: By Application, By Value, 2018-2023 (USD Billion) 141
Figure 130: Rest of Europe Fatty Alcohol Market, By Value, 2013-2017 (USD Billion) 143
Figure 131: Rest of Europe Fatty Alcohol Market, By Value, 2018-2023 (USD Billion) 143
Figure 132: APAC Fatty Alcohol Market, By Value, 2013-2017 (USD Billion) 145
Figure 133: APAC Fatty Alcohol Market, By Value, Forecast, 2018-2023 (USD Billion) 146
Figure 134: GDP, Current Price (in Trillion USD) 147
Figure 135: APAC Population Growth 2013-2017 (in Million ) 148
Figure 136: Asia Home & Laundry Care Market Sales 2012-2019E (in Million USD) 149
Figure 137: South East Asia Vegetable Oil Consumption, 2012/13-2017/18 (in thousand metric tones) 149
Figure 138: Forecast of the consumption of lubricants in the ASEAN in 2020 (in Million litres) 150
Figure 139: Number of Registrations or Sales of New Vehicles in APAC Region 2016 & 2017, By country (in Million units) 151
Figure 140: APAC Fatty Alcohol Market: By Type, By Value, 2013-2017 (USD Billion) 154
23
(c) AZOTH Analytics
List of Figures
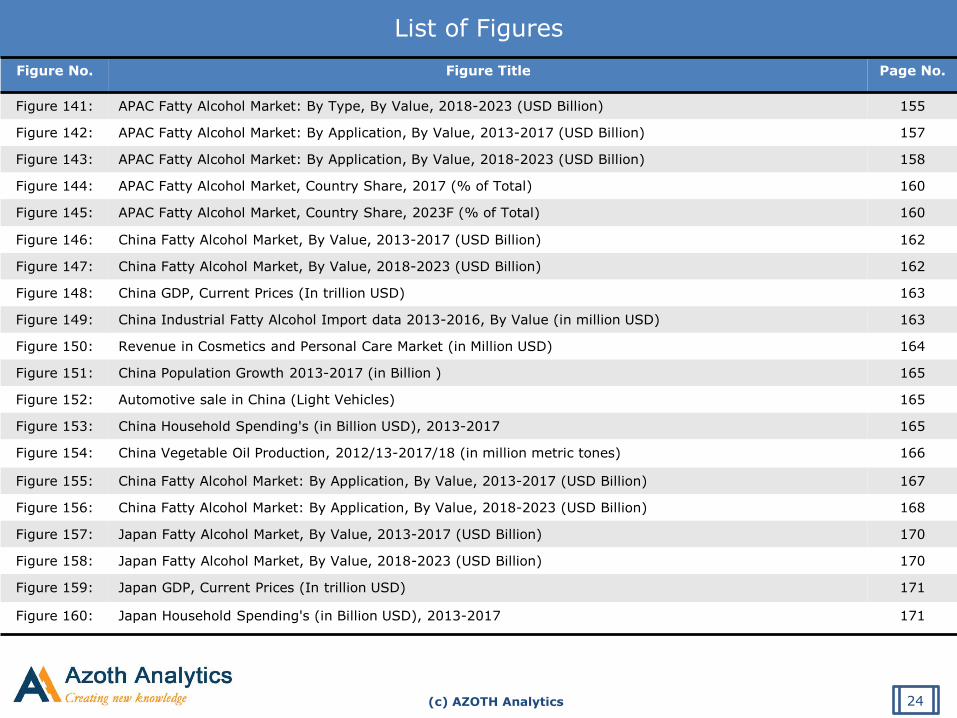
Figure No. Figure Title Page No.
Figure 141: APAC Fatty Alcohol Market: By Type, By Value, 2018-2023 (USD Billion) 155
Figure 142: APAC Fatty Alcohol Market: By Application, By Value, 2013-2017 (USD Billion) 157
Figure 143: APAC Fatty Alcohol Market: By Application, By Value, 2018-2023 (USD Billion) 158
Figure 144: APAC Fatty Alcohol Market, Country Share, 2017 (% of Total) 160
Figure 145: APAC Fatty Alcohol Market, Country Share, 2023F (% of Total) 160
Figure 146: China Fatty Alcohol Market, By Value, 2013-2017 (USD Billion) 162
Figure 147: China Fatty Alcohol Market, By Value, 2018-2023 (USD Billion) 162
Figure 148: China GDP, Current Prices (In trillion USD) 163
Figure 149: China Industrial Fatty Alcohol Import data 2013-2016, By Value (in million USD) 163
Figure 150: Revenue in Cosmetics and Personal Care Market (in Million USD) 164
Figure 151: China Population Growth 2013-2017 (in Billion ) 165
Figure 152: Automotive sale in China (Light Vehicles) 165
Figure 153: China Household Spending's (in Billion USD), 2013-2017 165
Figure 154: China Vegetable Oil Production, 2012/13-2017/18 (in million metric tones) 166
Figure 155: China Fatty Alcohol Market: By Application, By Value, 2013-2017 (USD Billion) 167
Figure 156: China Fatty Alcohol Market: By Application, By Value, 2018-2023 (USD Billion) 168
Figure 157: Japan Fatty Alcohol Market, By Value, 2013-2017 (USD Billion) 170
Figure 158: Japan Fatty Alcohol Market, By Value, 2018-2023 (USD Billion) 170
Figure 159: Japan GDP, Current Prices (In trillion USD) 171
Figure 160: Japan Household Spending's (in Billion USD), 2013-2017 171
24
(c) AZOTH Analytics
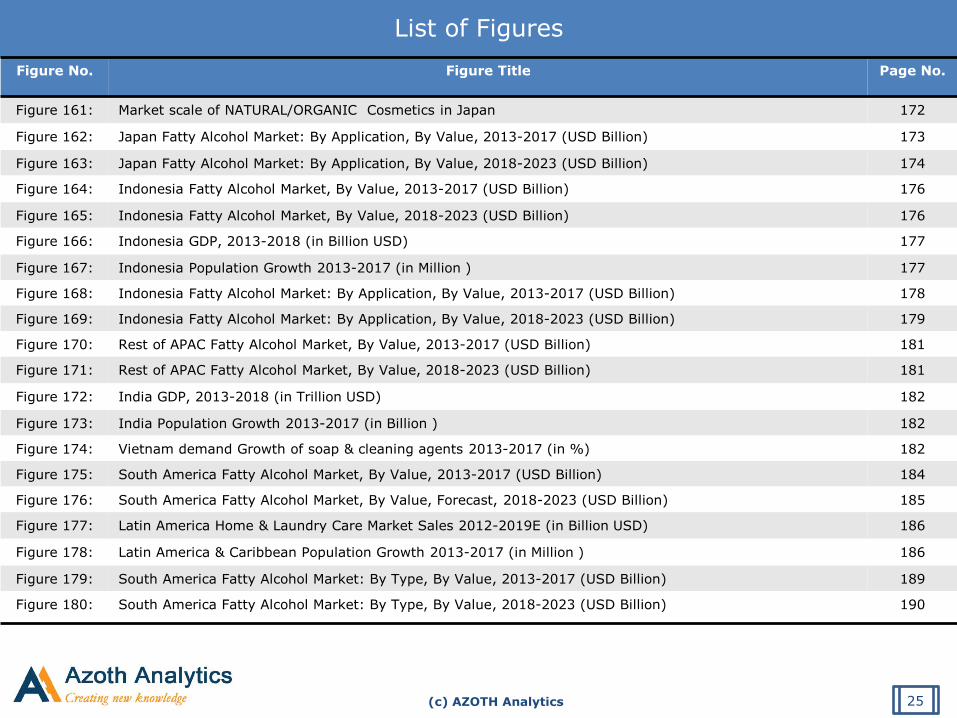
List of Figures
Figure No. Figure Title Page No.
Figure 161: Market scale of NATURAL/ORGANIC Cosmetics in Japan 172
Figure 162: Japan Fatty Alcohol Market: By Application, By Value, 2013-2017 (USD Billion) 173
Figure 163: Japan Fatty Alcohol Market: By Application, By Value, 2018-2023 (USD Billion) 174
Figure 164: Indonesia Fatty Alcohol Market, By Value, 2013-2017 (USD Billion) 176
Figure 165: Indonesia Fatty Alcohol Market, By Value, 2018-2023 (USD Billion) 176
Figure 166: Indonesia GDP, 2013-2018 (in Billion USD) 177
Figure 167: Indonesia Population Growth 2013-2017 (in Million ) 177
Figure 168: Indonesia Fatty Alcohol Market: By Application, By Value, 2013-2017 (USD Billion) 178
Figure 169: Indonesia Fatty Alcohol Market: By Application, By Value, 2018-2023 (USD Billion) 179
Figure 170: Rest of APAC Fatty Alcohol Market, By Value, 2013-2017 (USD Billion) 181
Figure 171: Rest of APAC Fatty Alcohol Market, By Value, 2018-2023 (USD Billion) 181
Figure 172: India GDP, 2013-2018 (in Trillion USD) 182
Figure 173: India Population Growth 2013-2017 (in Billion ) 182
Figure 174: Vietnam demand Growth of soap & cleaning agents 2013-2017 (in %) 182
Figure 175: South America Fatty Alcohol Market, By Value, 2013-2017 (USD Billion) 184
Figure 176: South America Fatty Alcohol Market, By Value, Forecast, 2018-2023 (USD Billion) 185
Figure 177: Latin America Home & Laundry Care Market Sales 2012-2019E (in Billion USD) 186
Figure 178: Latin America & Caribbean Population Growth 2013-2017 (in Million ) 186
Figure 179: South America Fatty Alcohol Market: By Type, By Value, 2013-2017 (USD Billion) 189
Figure 180: South America Fatty Alcohol Market: By Type, By Value, 2018-2023 (USD Billion) 190
25
(c) AZOTH Analytics
List of Figures
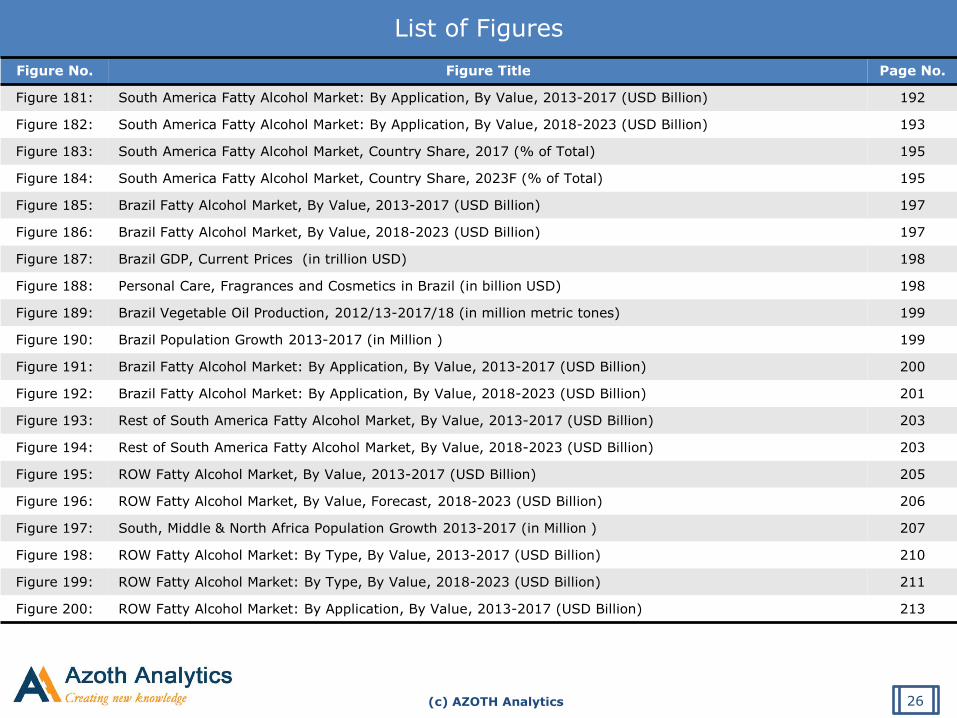
Figure No. Figure Title Page No.
Figure 181: South America Fatty Alcohol Market: By Application, By Value, 2013-2017 (USD Billion) 192
Figure 182: South America Fatty Alcohol Market: By Application, By Value, 2018-2023 (USD Billion) 193
Figure 183: South America Fatty Alcohol Market, Country Share, 2017 (% of Total) 195
Figure 184: South America Fatty Alcohol Market, Country Share, 2023F (% of Total) 195
Figure 185: Brazil Fatty Alcohol Market, By Value, 2013-2017 (USD Billion) 197
Figure 186: Brazil Fatty Alcohol Market, By Value, 2018-2023 (USD Billion) 197
Figure 187: Brazil GDP, Current Prices (in trillion USD) 198
Figure 188: Personal Care, Fragrances and Cosmetics in Brazil (in billion USD) 198
Figure 189: Brazil Vegetable Oil Production, 2012/13-2017/18 (in million metric tones) 199
Figure 190: Brazil Population Growth 2013-2017 (in Million ) 199
Figure 191: Brazil Fatty Alcohol Market: By Application, By Value, 2013-2017 (USD Billion) 200
Figure 192: Brazil Fatty Alcohol Market: By Application, By Value, 2018-2023 (USD Billion) 201
Figure 193: Rest of South America Fatty Alcohol Market, By Value, 2013-2017 (USD Billion) 203
Figure 194: Rest of South America Fatty Alcohol Market, By Value, 2018-2023 (USD Billion) 203
Figure 195: ROW Fatty Alcohol Market, By Value, 2013-2017 (USD Billion) 205
Figure 196: ROW Fatty Alcohol Market, By Value, Forecast, 2018-2023 (USD Billion) 206
Figure 197: South, Middle & North Africa Population Growth 2013-2017 (in Million ) 207
Figure 198: ROW Fatty Alcohol Market: By Type, By Value, 2013-2017 (USD Billion) 210
Figure 199: ROW Fatty Alcohol Market: By Type, By Value, 2018-2023 (USD Billion) 211
Figure 200: ROW Fatty Alcohol Market: By Application, By Value, 2013-2017 (USD Billion) 213
26
(c) AZOTH Analytics
List of Figures
Figure No. Figure Title Page No.
Figure 201: ROW Fatty Alcohol Market: By Application, By Value, 2018-2023 (USD Billion) 214
Figure 202: World Vegetable Oil Production (major veg oils), in million metric tons 218
Figure 203: Godrej Industries Limited Revenue Breakdown, by Line of Business, 2017 236
Figure 204: Godrej Industries Limited Revenue and Revenues due to Fatty Alcohol Business , 2013-2017, in million USD 236
27
(c) AZOTH Analytics
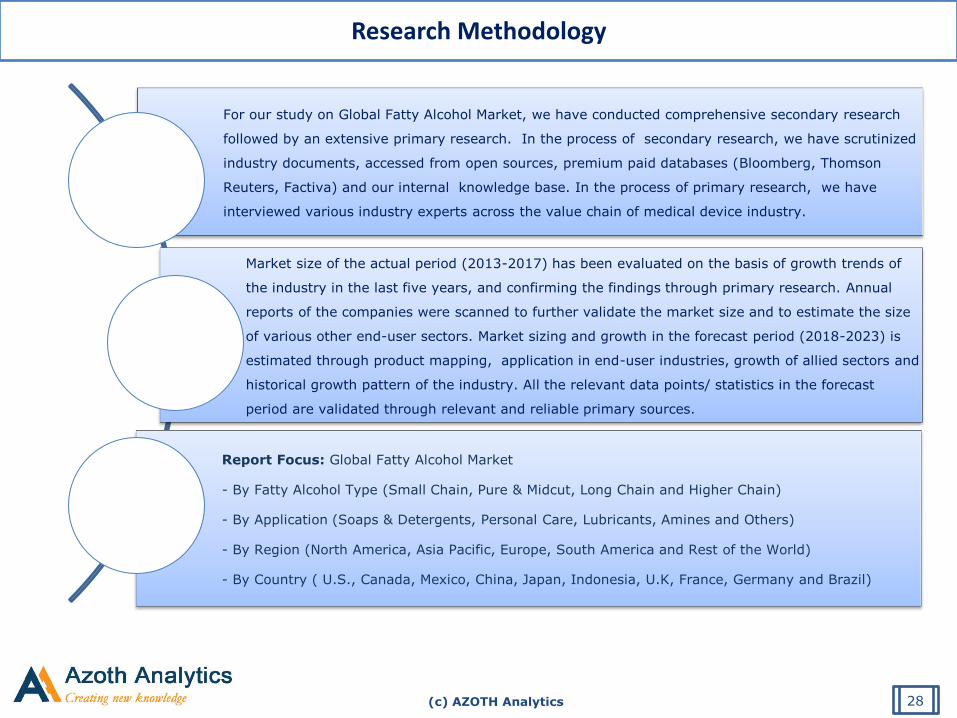
For our study on Global Fatty Alcohol Market, we have conducted comprehensive secondary research
followed by an extensive primary research. In the process of secondary research, we have scrutinized
industry documents, accessed from open sources, premium paid databases (Bloomberg, Thomson
Reuters, Factiva) and our internal knowledge base. In the process of primary research, we have
interviewed various industry experts across the value chain of medical device industry.
Market size of the actual period (2013-2017) has been evaluated on the basis of growth trends of
the industry in the last five years, and confirming the findings through primary research. Annual
reports of the companies were scanned to further validate the market size and to estimate the size
of various other end-user sectors. Market sizing and growth in the forecast period (2018-2023) is
estimated through product mapping, application in end-user industries, growth of allied sectors and
historical growth pattern of the industry. All the relevant data points/ statistics in the forecast
period are validated through relevant and reliable primary sources.
Report Focus: Global Fatty Alcohol Market
- By Fatty Alcohol Type (Small Chain, Pure & Midcut, Long Chain and Higher Chain)
- By Application (Soaps & Detergents, Personal Care, Lubricants, Amines and Others)
- By Region (North America, Asia Pacific, Europe, South America and Rest of the World)
- By Country ( U.S., Canada, Mexico, China, Japan, Indonesia, U.K, France, Germany and Brazil)
Research Methodology
28
(c) AZOTH Analytics
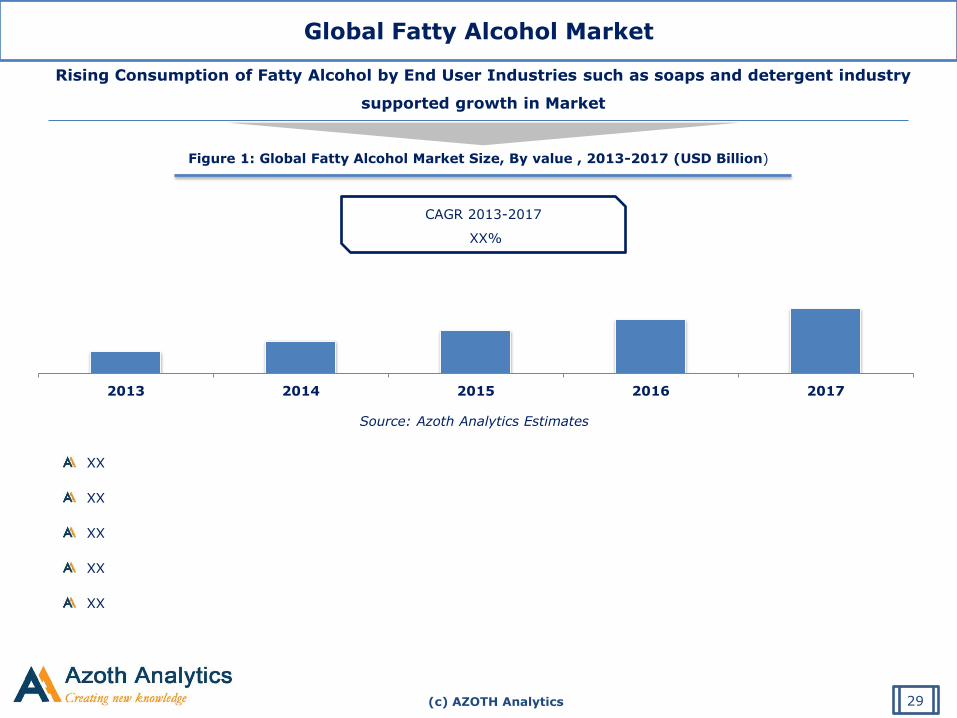
Global Fatty Alcohol Market
Source: Azoth Analytics Estimates
XX
XX
XX
XX
XX
Rising Consumption of Fatty Alcohol by End User Industries such as soaps and detergent industry
supported growth in Market
2013 2014 2015 2016 2017
Figure 1: Global Fatty Alcohol Market Size, By value , 2013-2017 (USD Billion)
CAGR 2013-2017
XX%
29
(c) AZOTH Analytics
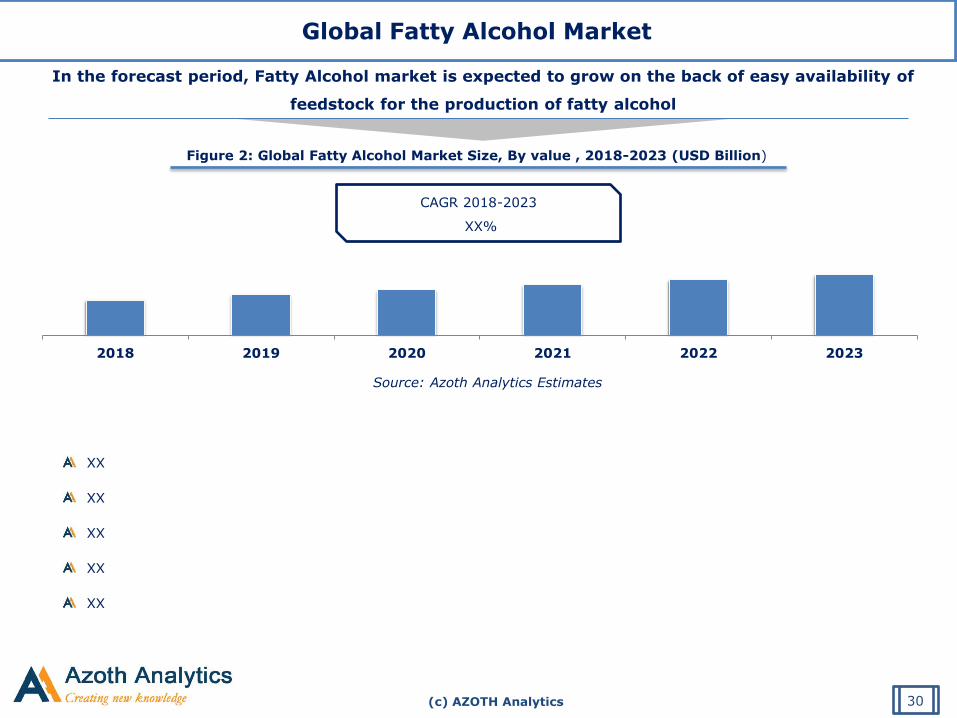
Global Fatty Alcohol Market
Source: Azoth Analytics Estimates
In the forecast period, Fatty Alcohol market is expected to grow on the back of easy availability of
feedstock for the production of fatty alcohol
2018 2019 2020 2021 2022 2023
Figure 2: Global Fatty Alcohol Market Size, By value , 2018-2023 (USD Billion)
CAGR 2018-2023
XX%
Global Fatty Alcohol Market
30
XX
XX
XX
XX
XX
(c) AZOTH Analytics
Global Fatty Alcohol Market- By Type
Figure 14: Global Fatty Alcohol Market Share, By
Type, 2017 (%)
Source: Azoth Analytics Estimates
Short Chain
Pure & Mid Cut
Long Chain
Higher Chain
Figure 15: Global Fatty Alcohol Market Share, By
Type, 2023 (%)
Source: Azoth Analytics Estimates
Short Chain
Pure & Mid Cut
Long Chain
Higher Chain
31
(c) AZOTH Analytics
Figure 16: Global Fatty Alcohol Market, By Short Chain,
By Value, 2013-2017 (USD Billion)
Source: Azoth Analytics Estimates
CAGR 2013-2017
XX%
CAGR 2018-2023
XX%
Figure 17: Global Fatty Alcohol Market, By Short Chain,
By Value, 2018-2023 (USD Billion)
Global Fatty Alcohol Market, By Short Chain, By Value
32
2013 2014 2015 2016 2017 2018 2019 2020 2021 2022 2023
XX
XX
XX
XX
XX
(c) AZOTH Analytics
Figure 18: Global Fatty Alcohol Market, By Pure & Midcut,
By Value, 2013-2017 (USD Billion)
Source: Azoth Analytics Estimates
CAGR 2013-2017
XX%
CAGR 2018-2023
XX%
Figure 19: Global Fatty Alcohol Market, By Pure & Midcut,
By Value, 2018-2023 (USD Billion)
Global Fatty Alcohol Market, By Pure & Midcut, By Value
33
2013 2014 2015 2016 2017 2018 2019 2020 2021 2022 2023
XX
XX
XX
XX
XX
(c) AZOTH Analytics
Figure 26: Global Fatty Alcohol Market, By Soaps &
Detergents, By Value, 2013-2017 (USD Billion)
Source: Azoth Analytics Estimates
CAGR 2013-2017
XX%
CAGR 2018-2023
XX%
Figure 27 Global Fatty Alcohol Market, By Soaps &
Detergents, By Value, 2018-2023 (USD Billion)
Global Fatty Alcohol Market, By Soaps & Detergents, By Value
34
XX
XX
XX
XX
XX
2013 2014 2015 2016 2017 2018 2019 2020 2021 2022 2023
(c) AZOTH Analytics
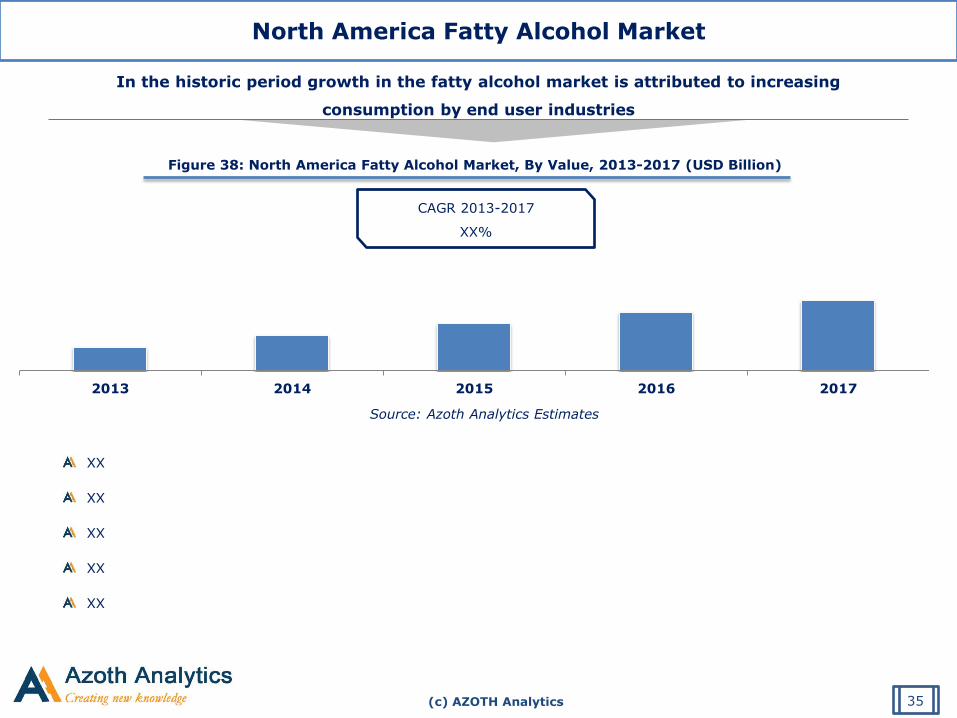
North America Heart Valve Devices Market, By Value
Figure 38: North America Fatty Alcohol Market, By Value, 2013-2017 (USD Billion)
Source: Azoth Analytics Estimates
CAGR 2013-2017
XX%
2013 2014 2015 2016 2017
In the historic period growth in the fatty alcohol market is attributed to increasing
consumption by end user industries
North America Fatty Alcohol Market
35
XX
XX
XX
XX
XX
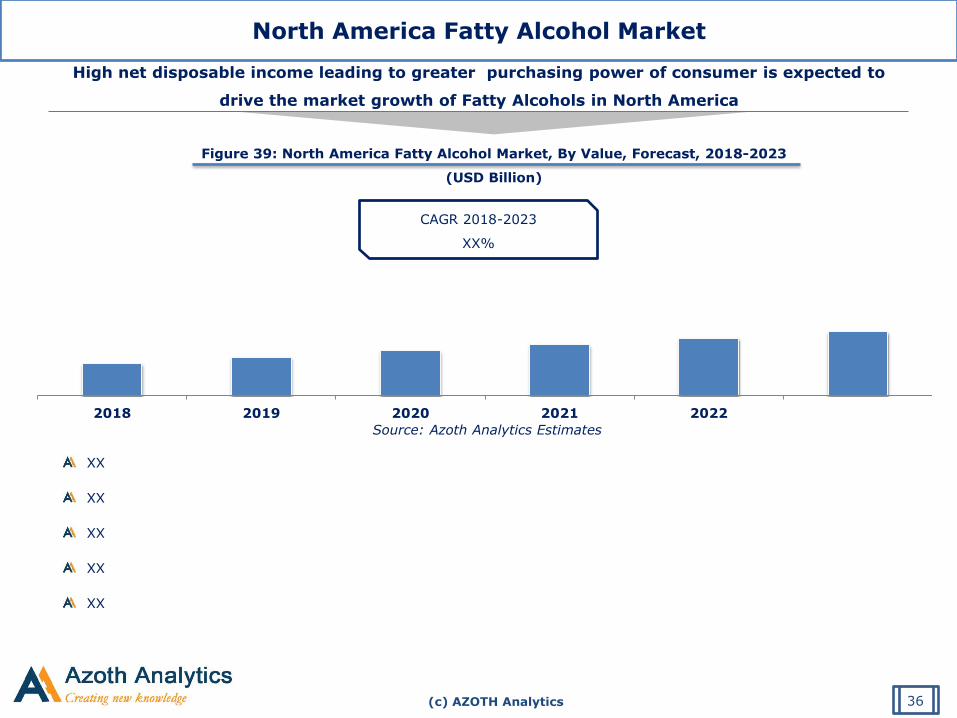
(c) AZOTH Analytics
Figure 39: North America Fatty Alcohol Market, By Value, Forecast, 2018-2023
(USD Billion)
Source: Azoth Analytics Estimates
2018 2019 2020 2021 2022
North America Fatty Alcohol Market
36
CAGR 2018-2023
XX%
High net disposable income leading to greater purchasing power of consumer is expected to
drive the market growth of Fatty Alcohols in North America
XX
XX
XX
XX
XX
(c) AZOTH Analytics
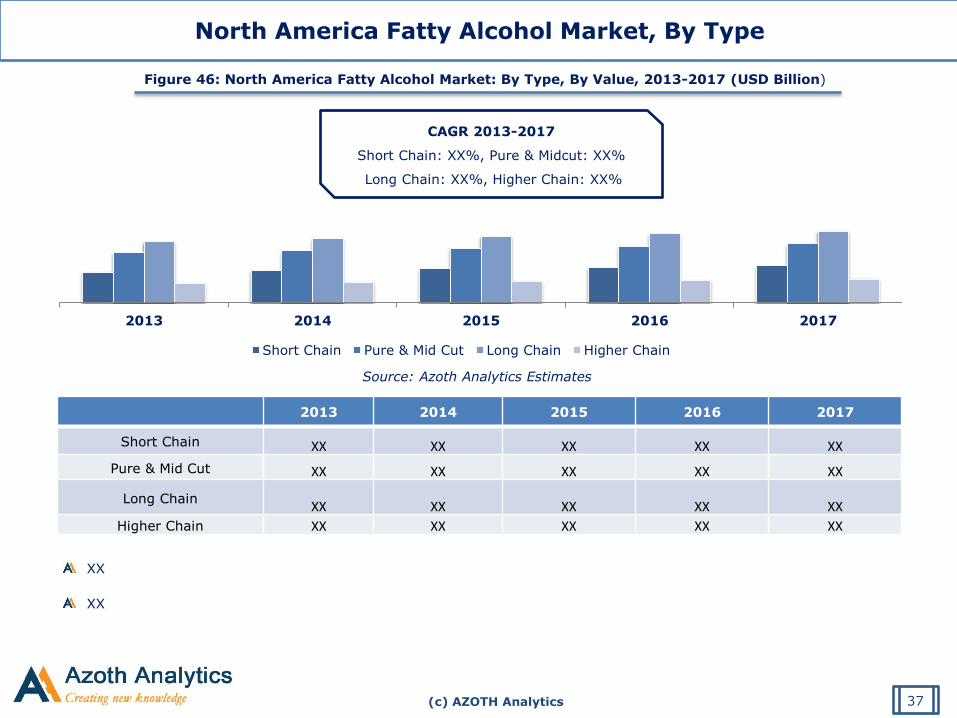
Source: Azoth Analytics Estimates
Figure 46: North America Fatty Alcohol Market: By Type, By Value, 2013-2017 (USD Billion)
North America Fatty Alcohol Market, By Type
2013 2014 2015 2016 2017
Short Chain Pure & Mid Cut Long Chain Higher Chain
37
2013 2014 2015 2016 2017
Short Chain XX XX XX XX XX
Pure & Mid Cut XX XX XX XX XX
Long Chain XX XX XX XX XX
Higher Chain XX XX XX XX XX
CAGR 2013-2017
Short Chain: XX%, Pure & Midcut: XX%
Long Chain: XX%, Higher Chain: XX%
XX
XX
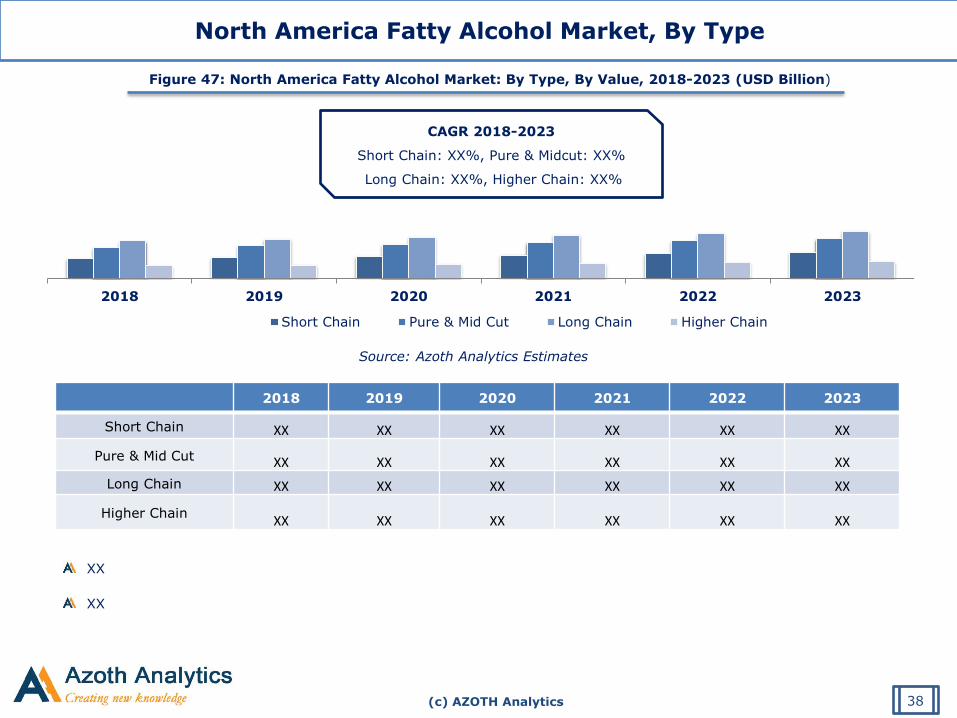
(c) AZOTH Analytics
Source: Azoth Analytics Estimates
Figure 47: North America Fatty Alcohol Market: By Type, By Value, 2018-2023 (USD Billion)
North America Fatty Alcohol Market, By Type
2018 2019 2020 2021 2022 2023
Short Chain Pure & Mid Cut Long Chain Higher Chain
38
2018 2019 2020 2021 2022 2023
Short Chain XX XX XX XX XX XX
Pure & Mid Cut XX XX XX XX XX XX
Long Chain XX XX XX XX XX XX
Higher Chain XX XX XX XX XX XX
CAGR 2018-2023
Short Chain: XX%, Pure & Midcut: XX%
Long Chain: XX%, Higher Chain: XX%
XX
XX
(c) AZOTH Analytics
Source: Azoth Analytics Estimates
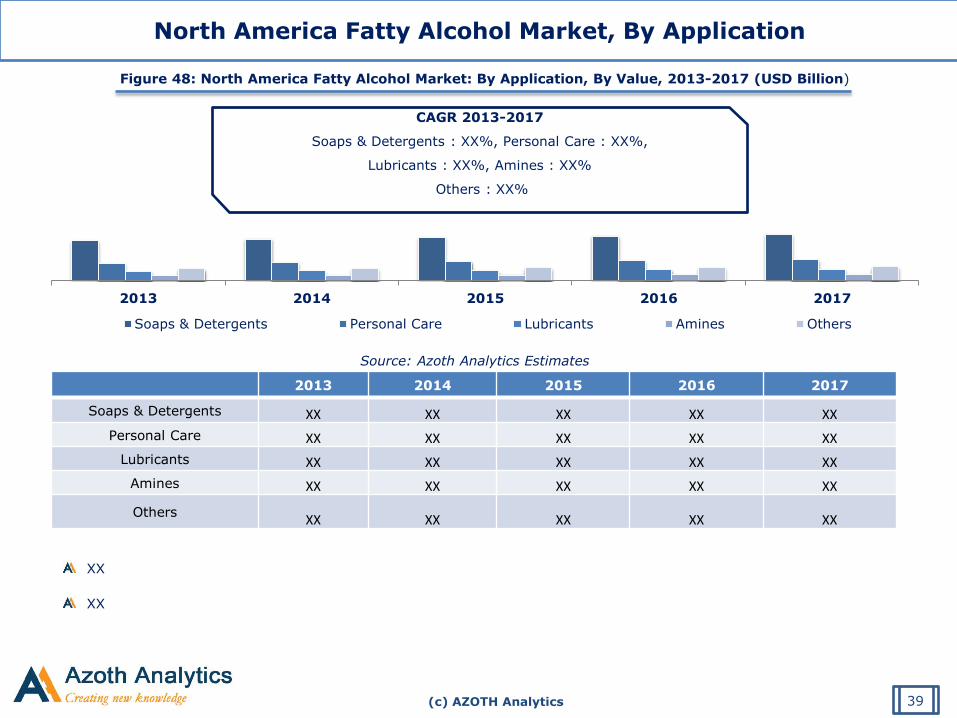
North America Fatty Alcohol Market, By Application
2013 2014 2015 2016 2017
Soaps & Detergents Personal Care Lubricants Amines Others
39
2013 2014 2015 2016 2017
Soaps & Detergents XX XX XX XX XX
Personal Care XX XX XX XX XX
Lubricants XX XX XX XX XX
Amines XX XX XX XX XX
Others XX XX XX XX XX
CAGR 2013-2017
Soaps & Detergents : XX%, Personal Care : XX%,
Lubricants : XX%, Amines : XX%
Others : XX%
Figure 48: North America Fatty Alcohol Market: By Application, By Value, 2013-2017 (USD Billion)
XX
XX
(c) AZOTH Analytics
Source: Azoth Analytics Estimates
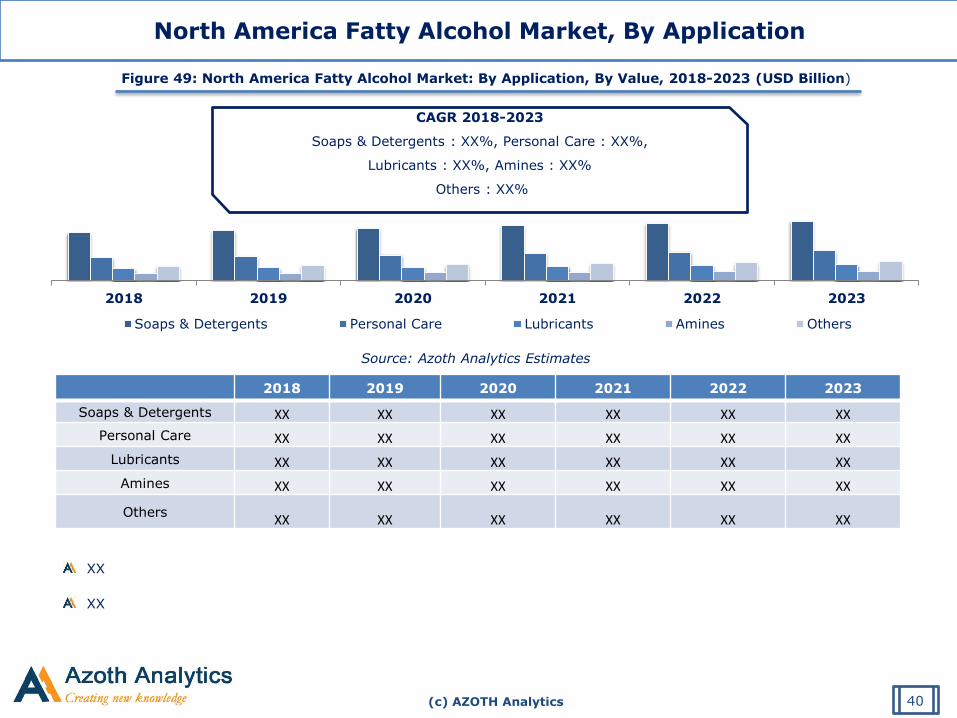
North America Fatty Alcohol Market, By Application
40
2018 2019 2020 2021 2022 2023
Soaps & Detergents XX XX XX XX XX XX
Personal Care XX XX XX XX XX XX
Lubricants XX XX XX XX XX XX
Amines XX XX XX XX XX XX
Others XX XX XX XX XX XX
Figure 49: North America Fatty Alcohol Market: By Application, By Value, 2018-2023 (USD Billion)
CAGR 2018-2023
Soaps & Detergents : XX%, Personal Care : XX%,
Lubricants : XX%, Amines : XX%
Others : XX%
2018 2019 2020 2021 2022 2023
Soaps & Detergents Personal Care Lubricants Amines Others
XX
XX
(c) AZOTH Analytics
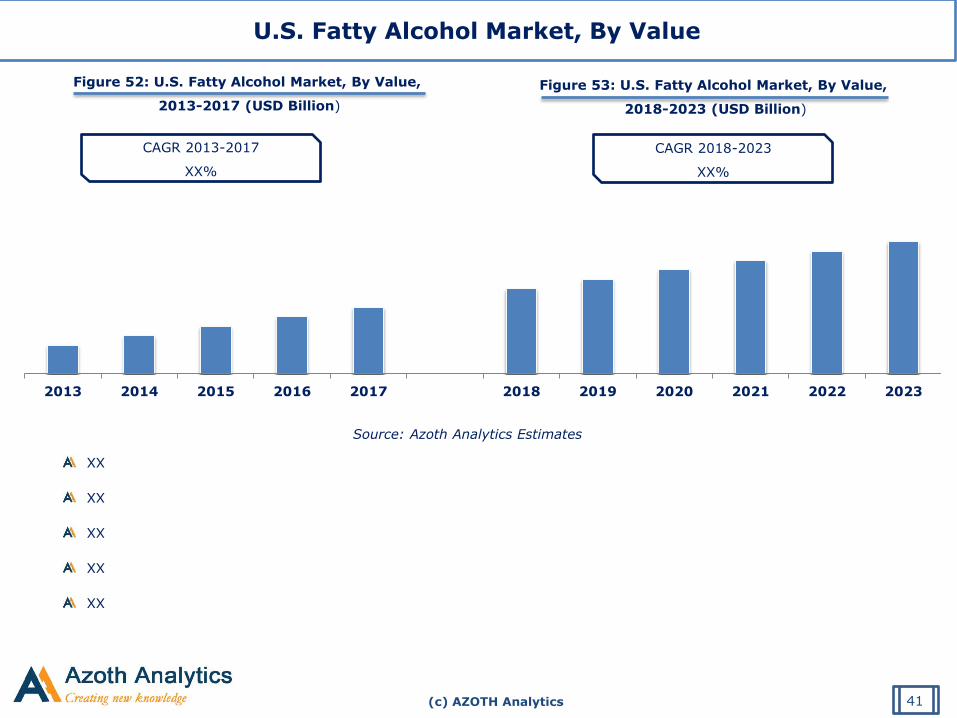
Figure 52: U.S. Fatty Alcohol Market, By Value,
2013-2017 (USD Billion)
Source: Azoth Analytics Estimates
CAGR 2013-2017
XX%
CAGR 2018-2023
XX%
Figure 53: U.S. Fatty Alcohol Market, By Value,
2018-2023 (USD Billion)
U.S. Fatty Alcohol Market, By Value
41
2013 2014 2015 2016 2017 2018 2019 2020 2021 2022 2023
XX
XX
XX
XX
XX
(c) AZOTH Analytics
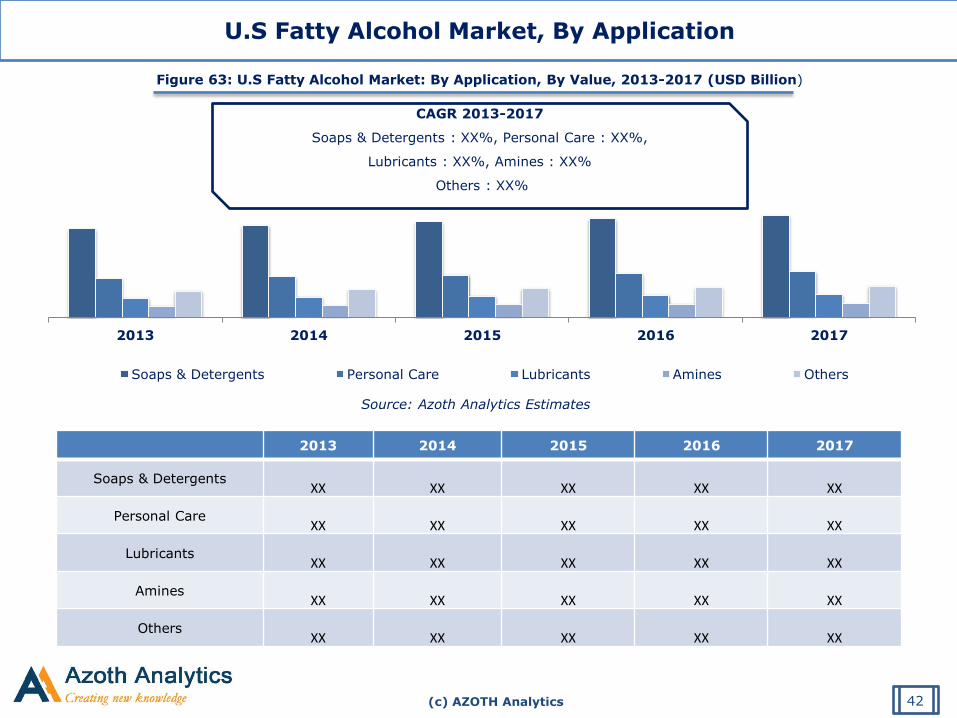
Source: Azoth Analytics Estimates
U.S Fatty Alcohol Market, By Application
2013 2014 2015 2016 2017
Soaps & Detergents Personal Care Lubricants Amines Others
42
2013 2014 2015 2016 2017
Soaps & Detergents XX XX XX XX XX
Personal Care XX XX XX XX XX
Lubricants XX XX XX XX XX
Amines XX XX XX XX XX
Others XX XX XX XX XX
CAGR 2013-2017
Soaps & Detergents : XX%, Personal Care : XX%,
Lubricants : XX%, Amines : XX%
Others : XX%
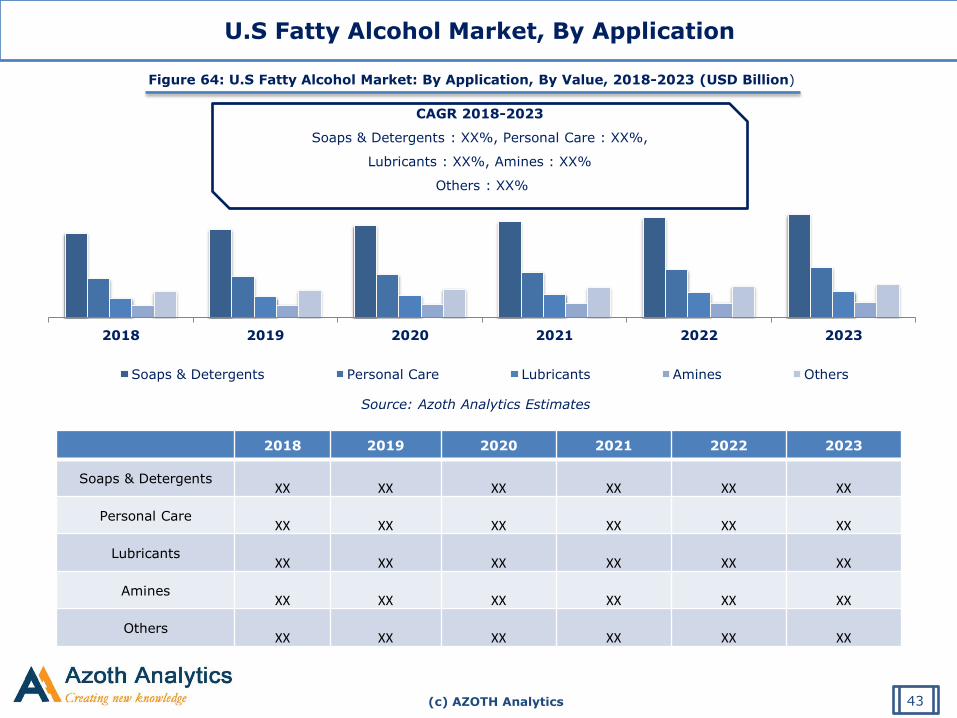
Figure 63: U.S Fatty Alcohol Market: By Application, By Value, 2013-2017 (USD Billion)
(c) AZOTH Analytics
Source: Azoth Analytics Estimates
U.S Fatty Alcohol Market, By Application
2018 2019 2020 2021 2022 2023
Soaps & Detergents Personal Care Lubricants Amines Others
43
2018 2019 2020 2021 2022 2023
Soaps & Detergents XX XX XX XX XX XX
Personal Care XX XX XX XX XX XX
Lubricants XX XX XX XX XX XX
Amines XX XX XX XX XX XX
Others XX XX XX XX XX XX
CAGR 2018-2023
Soaps & Detergents : XX%, Personal Care : XX%,
Lubricants : XX%, Amines : XX%
Others : XX%
Figure 64: U.S Fatty Alcohol Market: By Application, By Value, 2018-2023 (USD Billion)
(c) AZOTH Analytics
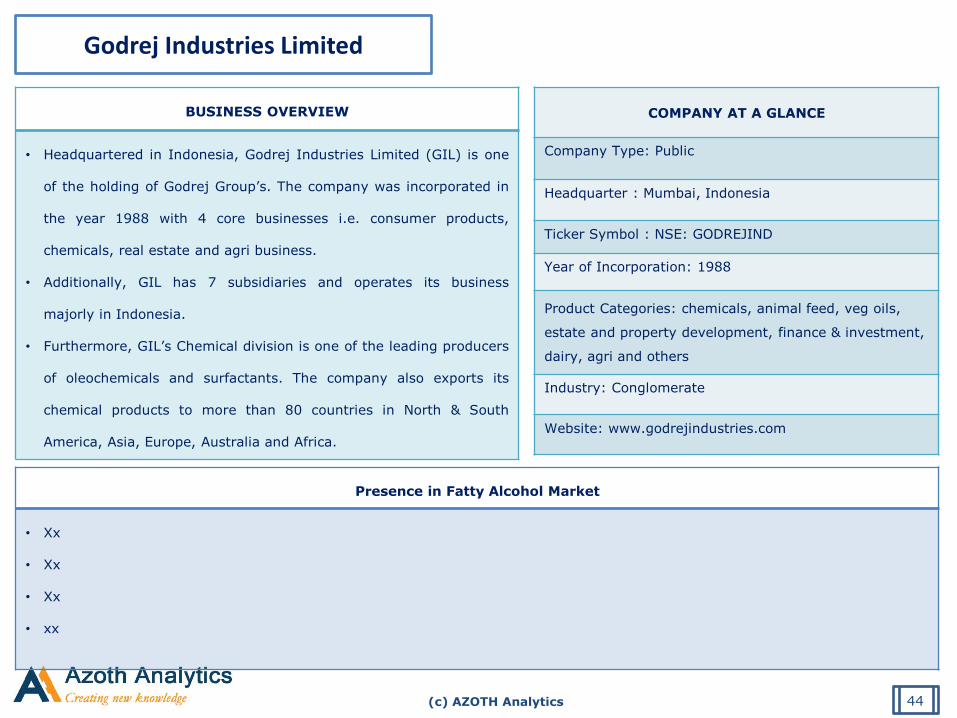
BUSINESS OVERVIEW
• Headquartered in Indonesia, Godrej Industries Limited (GIL) is one
of the holding of Godrej Group’s. The company was incorporated in
the year 1988 with 4 core businesses i.e. consumer products,
chemicals, real estate and agri business.
• Additionally, GIL has 7 subsidiaries and operates its business
majorly in Indonesia.
• Furthermore, GIL’s Chemical division is one of the leading producers
of oleochemicals and surfactants. The company also exports its
chemical products to more than 80 countries in North & South
America, Asia, Europe, Australia and Africa.
COMPANY AT A GLANCE
Company Type: Public
Headquarter : Mumbai, Indonesia
Ticker Symbol : NSE: GODREJIND
Year of Incorporation: 1988
Product Categories: chemicals, animal feed, veg oils,
estate and property development, finance & investment,
dairy, agri and others
Industry: Conglomerate
Website: www.godrejindustries.com
Godrej Industries Limited
Presence in Fatty Alcohol Market
• Xx
• Xx
• Xx
• xx
44
(c) AZOTH Analytics
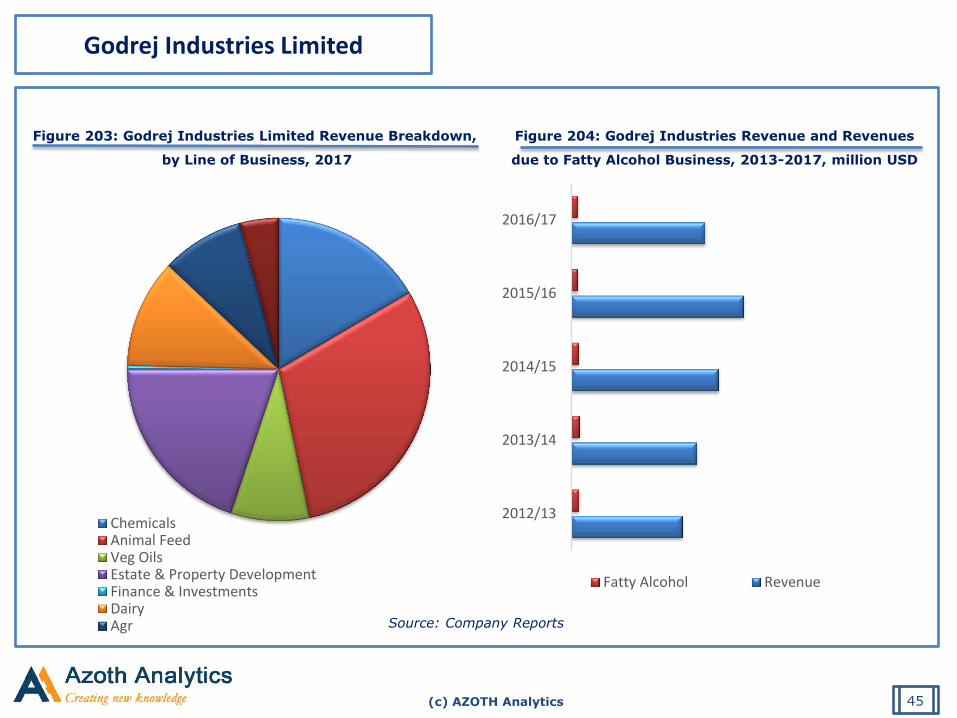
Source: Company Reports
Figure 203: Godrej Industries Limited Revenue Breakdown,
by Line of Business, 2017
Godrej Industries Limited
ChemicalsAnimal FeedVeg OilsEstate & Property DevelopmentFinance & InvestmentsDairyAgr
2012/13
2013/14
2014/15
2015/16
2016/17
Fatty Alcohol Revenue
Figure 204: Godrej Industries Revenue and Revenues
due to Fatty Alcohol Business, 2013-2017, million USD
45
About Azoth Analytics Pvt Ltd.
Azoth Analytics is a business research and analytics firm that creates in-depth research reports and provides customized research solutions and consultancy services. Verticals in which Azoth Analytics specializes include healthcare and pharmaceutical, oil and gas, retail, chemicals, automotive, FMCG, food & beverages and technology. Azoth creates comprehensive and in-depth research reports by recording, interpreting and analyzing information. Strategic market sizing and data dredging techniques include secondary research, and primary research (interviews with management personnel and industry experts).
Related Reports:
Global Water Treatment Chemicals Market: Analysis By Type (Corrosion Inhibitors, Oxidizers & Biocides, Scale Inhibitors, pH Adjusters, Coagulants - Inorganic ,
Organic), End-User (Municipal, Paper & Pulp, Power Generation, Food & Beverages, Refinery), By Region, By Country (2018 Edition): Opportunities and Forecast
(2013-2023)
Global Benzotrifluoride Market (Derivatives and Sub-Derivatives): Analysis By End-User Industry, By Region, By Country (2016-2021)-By
Derivatives and Sub-Derivatives (Amino, Chloro, Bromo, Hydroxy); By End-User Industry (Chemical, Pharmaceutical, Agricultural,
Others); By Region (APAC, North America, Europe and ROW); By Country (China, South Korea, India, Japan, US, Canada, Germany, U.K,
France, Brazil, Saudi Arabia)
Disclaimer: Azoth Analytics report information is based mainly on interviews and therefore, is subject to fluctuation. Azoth Analytics therefore, takes no responsibility for
any incorrect information supplied to us by industry experts, manufacturers or users. Azoth does not warranty the completeness of the information and data. Also, analysis
provided in the report are meant for customers’ internal use only and not for general publication or disclosure to third parties.
46