Embed Size (px)
Citation preview
THE EFFECT OF SHORT-CHAIN FATTY ACIDS ON SOME
HAEMOSTATIC RISK MARKERS IN WESTERNISED BLACK MEN
LEBOGANG FRANCIS MOGONGOA
Thesis submitted in fulfilment of the requirements for the degree
MAGISTER TECHNOLOGIAE:
BIOMEDICAL TECHNOLOGY
in the
School of Health Technology
Faculty of Health and Environmental Sciences
at the
Central University of Technology,
Free State
Supervisor: Prof FJ Veldman (Ph.D)
Co-supervisor: Dr CE Brand (D.Tech.)
BLOEMFONTEIN
June 2007
ii
TABLE OF CONTENTS
LIST Page Number
Thesis contents ii
Declaration of independent work ix
Acknowledgements x
Summary xi
Opsomming xiv
List of Figures xvii
List of Tables xviii
List of Abbreviations xx
List of Appendixes xxii
CHAPTER 1
INTRODUCTION
1.1 BACKGROUND 1
1.2 HYPOTHESIS 4
1.3 OBJECTIVE 5
1.4 DISSERTATION STRUCTURE 5
CHAPTER 2
LITERATURE REVIEW
2.1 INTRODUCTION 6
2.2 DEFINITION OF TERMS 7
iii
2.2.1 Coronary heart disease 7
2.2.2 Stroke 7
2.2.3 Atherosclerosis 8
2.2.4 Dietary fibre 8
2.2.5 Risk factor versus risk marker 9
2.3 EPIDEMIOLOGY 9
2.4 RISK MARKERS FOR ATHEROSCLEROSIS AND THROMBOSIS 10
2.4.1 The haemostatic process 11
2.4.1.1 Vascular endothelium 12
2.4.1.2 Platelets 13
2.4.1.3 Coagulation 13
2.4.1.3.1 Fibrinogen 14
2.4.1.3.2 Fibrin network formation 15
2.4.1.4 Fibrinolysis 17
2.4.2 Haemostatic risk markers and factors 17
2.4.2.1 Fibrinogen as a risk factor for CHD and CVD 18
2.4.2.2 Fibrin network architecture 19
2.4.2.3 Factor VII 21
2.4.2.4 Factor VIII 22
2.4.2.5 Fibrinolytic factors 23
2.4.2.6 Platelets as a risk factor for CHD and CVD 23
2.4.3 Lipid risk markers 24
2.4.3.1 Lipoprotein classes 25
2.4.3.2 Low-density lipoprotein cholesterol (LDL-C) 26
2.4.3.3 High density lipoprotein cholesterol (HDL-C) 26
iv
2.4.3.4 Dietary fat and lipid metabolism 27
2.4.4 Other cardiovascular risk factors 28
2.5 PROPOSED DISEASE MECHANISMS 29
2.5.1 Thrombogenesis 29
2.5.2 Atherogenesis 30
2.6 DIETARY FIBER 32
2.6.1 Short chain fatty acids (SCFAs) 33
2.6.2 Fermentation 33
2.6.3 Absorption 35
2.6.4 Metabolism 36
2.6.5 Biological effects of SCFA 39
2.6.5.1 Butyrate 39
2.6.5.2 Propionate 39
2.6.5.3 Acetate 41
2.7 SUMMARY OF LITERATURE REVIEW 41
CHAPTER 3
MATERIALS AND METHODS
3.1 INTRODUCTION 43
3.1.1 Ethical consideration 43
3.1.2 Study design 44
3.1.3 Work schedule 45
3.2 MATERIALS 46
3.2.1 Study population 46
v
3.2.2 Supplements 47
3.2.3 Specimen collection 48
3.2.4 Apparatus 48
3.2.5 Standards and controls 49
3.2.6 Reagents and consumables 49
3.3 METHODS 50
3.3.1 Specimen preparation 50
3.3.2 Fibrin network architecture variables 50
3.3.2.1 Network fibrin content 50
3.3.2.2 Mass-length ratio from turbidity (µT) 51
3.3.2.3 Compaction of fibrin networks 52
3.3.2.4 Fibrin network lysis rate 53
3.3.3 Coagulation factor determinations 53
3.3.4 Chemical analyses 54
3.3.5 Full blood counts and C–Reactive protein measurements 54
3.4 STATISTICAL ANALYSES 54
CHAPTER 4
RESULTS
4.1 INTRODUCTION 55
4.2 BASELINE RESULTS OF THE ENTIRE STUDY GROUP 56
4.2.1 General health profile of the entire study group for both baseline
visits 56
4.2.2 Haemostatic profile of the entire study group for both baseline
visits 58
vi
4.2.3 Lipid profile of the entire study group for both baseline visits 59
4.3 RESULTS OF THE INTERVENTION STUDY 60
4.3.1 The Placebo Supplement Intervention Study Results 61
4.3.1.1 Mean changes in the general health profile of the placebo supplement
study group 61
4.3.1.2 Mean changes in the haemostatic profile of the placebo supplement
study group 63
4.3.1.3 Mean changes in the lipid profile of the placebo supplement study
group 65
4.3.2 The Acetate-Propionate (50/50) Supplement Intervention Study
Results 67
4.3.2.1 Mean changes in the general health profile of the acetate-propionate
supplement study group 67
4.3.2.2 Mean changes in the haemostatic profile of the acetate-propionate
supplement study group 69
4.3.2.3 Mean changes in the lipid profile of the acetate-propionate supplement
study group 72
4.3.3 The High-Acetate Supplement Intervention Study Results 73
4.3.3.1 Mean changes in the general health profile of the high-acetate
supplement study group 73
4.3.3.2 Mean changes in the haemostatic profile of the high-acetate
supplement study group 75
4.3.3.3 Mean changes in the lipid profile of the high-acetate supplement study
group 78
vii
CHAPTER 5
DISCUSSION
5.1 INTRODUCTION 79
5.2 BASELINE CHARACTERISTICS OF THE ENTIRE STUDY GROUP 80
5.2.1 General health profile of the entire study group at baseline 80
5.2.2 Haemostatic profile of the entire study group at baseline 82
5.2.3 Lipid profile of the entire study group at baseline 85
5.3 INTERVENTION STUDY RESULTS 86
5.3.1 The Placebo Supplement Intervention Study Results 86
5.3.1.1 Changes in the general health profile of the placebo supplement study
group 87
5.3.1.2 Changes in the haemostatic profile of the placebo supplement study
group 87
5.3.1.3 Changes in the lipid profile of the placebo supplement study group 88
5.3.1 The Acetate-Propionate (50/50) Supplement Intervention Study
Results 88
5.3.2.1 Changes in the general health profile of the acetate-propionate (50/50)
supplement study group 89
5.3.2.2 Changes in the haemostatic profile of the acetate-propionate (50/50)
supplement study group 89
5.3.2.3 Changes in the lipid profile of the acetate-propionate (50/50)
supplement study group 90
5.3.2 The High-Acetate Supplement Intervention Study Results 91
5.3.3.1 Changes in the general health profile of the high-acetate supplement
study group 91
viii
5.3.3.2 Changes in the haemostatic profile of the high-acetate supplement
study group 92
5.3.3.3 Changes in the lipid profile of the high-acetate supplement study
group 93
CHAPTER 6
CONCLUSION AND RECOMMENDATIONS
6.1 INTRODUCTION 95
6.2 BASELINE CHARACTERISTICS OF THE ENTIRE STUDY GROUP 96
6.3 INTERVENTION STUDY 97
6.3.1 The Placebo Supplement Intervention Study Results 97
6.3.2 The Acetate-Propionate (50/50) Supplement Intervention Study
Results 98
6.3.3 The High-Acetate Supplement Intervention Study Results 99
6.3.4 The overall general conclusion 99
6.4 RECOMMENDATIONS 100
6.4.1 Future research 100
6.4.2 Dietary recommendations and possible clinical use 100
CHAPTER 7
REFFERENCES 101
Appendix A: Consent form 131
Appendix B: Recruitment questionnaire 135
Appendix C: End of study questionnaire 138
Appendix D: Document for calculation of supplement 142

ix
DECLARATION OF INDEPENDENT WORK
I, LEBOGANG FRANCIS MOGONGOA, hereby declare that this research project
submitted to the Central University of Technology, Free State for the degree MAGISTER
TECHNOLOGIAE: BIOMEDICAL TECHNOLOGY is my own independent work that has
not been submitted before to any institution by me or any other person in fulfilment of the
requirements for the attainment of any qualification.
_______________________ __________________
SIGNATURE OF STUDENT DATE
VERKLARING VAN ONAFHANKLIKE WERK
Ek, LEBOGANG FRANCIS MOGONGOA, verklaar hiermee dat hierdie navorsingsprojek
wat ingehandig word aan die Sentrale Universiteit vir Tegnologie, Vrystaat, vir die graad
MAGISTER TECHNOLOGIAE: BIOMEDIESE TEGNOLOGIE, my eie werk is wat nie deur
myself of enige ander persoon aan enige instansie, vir die verwerwing van enige
kwalifikasie, voorgelê is nie.
_____________________________ __________________
HANDTEKENING VAN STUDENT DATUM

x
ACKNOWLEDGEMENTS
∗ Praise to God the Almighty for affording me this opportunity, for strengthening me,
giving me the courage and ability to complete this thesis
∗ My study leaders for the words of encouragement, their support, assistance, patience
and above all for sacrificing their valuable time
∗ My family, for the words of encouragements when I felt like giving up. My parents for
making me the man I am today. My fiancée for being a part of my life and for
everything she has done for me
∗ NESTEC for funding the project and making me part of this experience. The Medical
Research Council and Cannon Collins Scholarship are acknowledged for the tuition
funding
∗ The School of Health Technology, Central University of Technology, Free State and
Department Haematology and Cell Biology, University of Free State for giving me the
opportunity to complete this project
∗ A special word of thanks to Mr. Henry Gleimius for helping me with the laboratory
analyses and results. Captain Anette van Onselen, Tempe, Bloemfontein, is also
remembered for her assistance and dedication with monitoring the volunteers during
the intervention study, as well as her help with the dietary intake questionnaires.
xi
SUMMARY
Cerebrovascular disease and coronary heart disease (CHD) are of the most important
causes of morbidity and mortality amongst South Africans. The risk factor prevalence for
stroke and CHD becomes altered by changes in lifestyle, including diet. In general it is
suggested that lifestyle management should be the first choice when having to treat
patients with increased cardiovascular risk.
The prudent low-fat, high-fibre diet is regarded as an apparently healthy diet. It is
suspected that this diet is effective for the control of known coronary risk factors as well
as raised clotting factors. Research studies have shown the addition of dietary fibre to
the diet as a promising therapeutic agent for the limited control of known coronary risk
factors. The physiological effects of dietary fibre in humans are significantly influenced by
the degree to which fibre is fermented in the colon. Fermentation results in the production
of short-chain fatty acids (SCFAs); acetate, propionate and butyrate.
The aim of this study was to examine the possible effects of different combinations of
short-chain fatty acids on some metabolic risk markers. In this study a group of
westernised African male volunteers was recruited and randomly assigned to three
groups. Group one received a placebo. Group two received a supplement containing
50% acetate and 50% propionate. Group three received a SCFA supplement in the ratio
of 70% acetate, 15% propionate and 15% butyrate. Supplementation was sustained for a
period of six weeks. Blood samples were drawn during the different visits.
xii
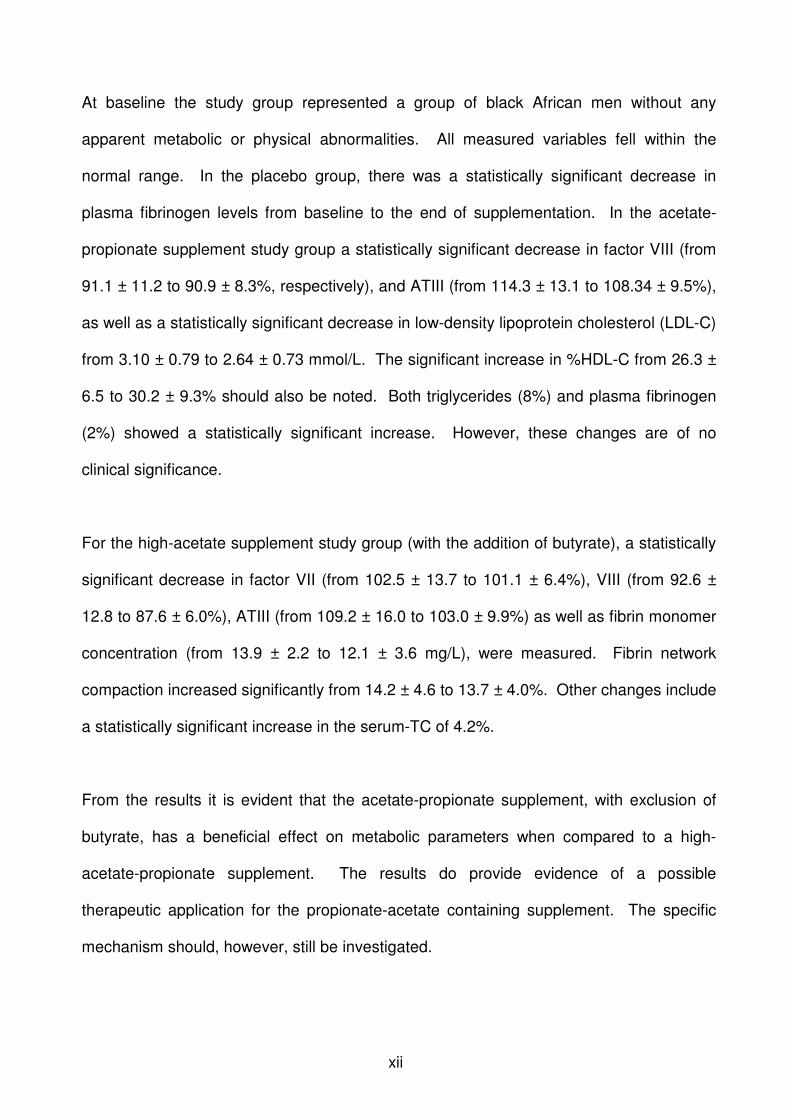
At baseline the study group represented a group of black African men without any
apparent metabolic or physical abnormalities. All measured variables fell within the
normal range. In the placebo group, there was a statistically significant decrease in
plasma fibrinogen levels from baseline to the end of supplementation. In the acetate-
propionate supplement study group a statistically significant decrease in factor VIII (from
91.1 ± 11.2 to 90.9 ± 8.3%, respectively), and ATIII (from 114.3 ± 13.1 to 108.34 ± 9.5%),
as well as a statistically significant decrease in low-density lipoprotein cholesterol (LDL-C)
from 3.10 ± 0.79 to 2.64 ± 0.73 mmol/L. The significant increase in %HDL-C from 26.3 ±
6.5 to 30.2 ± 9.3% should also be noted. Both triglycerides (8%) and plasma fibrinogen
(2%) showed a statistically significant increase. However, these changes are of no
clinical significance.
For the high-acetate supplement study group (with the addition of butyrate), a statistically
significant decrease in factor VII (from 102.5 ± 13.7 to 101.1 ± 6.4%), VIII (from 92.6 ±
12.8 to 87.6 ± 6.0%), ATIII (from 109.2 ± 16.0 to 103.0 ± 9.9%) as well as fibrin monomer
concentration (from 13.9 ± 2.2 to 12.1 ± 3.6 mg/L), were measured. Fibrin network
compaction increased significantly from 14.2 ± 4.6 to 13.7 ± 4.0%. Other changes include
a statistically significant increase in the serum-TC of 4.2%.
From the results it is evident that the acetate-propionate supplement, with exclusion of
butyrate, has a beneficial effect on metabolic parameters when compared to a high-
acetate-propionate supplement. The results do provide evidence of a possible
therapeutic application for the propionate-acetate containing supplement. The specific
mechanism should, however, still be investigated.

xiii
It can be concluded from this study that acetate, propionate and butyrate each have
different effects on human metabolism. It is evident that the use of a mixture of acetate
and propionate may have a beneficial effect on patients at risk of developing CVD.
Further studies that investigate the optimum ratio of these two products may lead to the
development of a naturally derived therapeutic product for the prevention or treatment of
CVD in black African men, as well as the population at large.

xiv
OPSOMMING
Serebrovaskulêre siekte en koronêre hartsiekte is van die belangrikste oorsake van
morbiteit en mortaliteit by Suid-Afrikaners. Die prevalensie van risikofaktore vir beroerte
en koronêre hartsiektes word deur veranderinge in lewensstyl, insluitende dieët bepaal.
Oor die algemeen word dit aanbeveel dat die manipulasie van lewenstyl die eerste keuse
vir behandeling van pasiënte met verhoogde kardiovaskulêre risiko moet wees.
‘n Dieët met lae vet- en hoë veselinhoud word as ‘n gesonde dieët beskou. Daar word
vermoed dat hierdie dieët effektief is vir die kontrolering van bekende koronêre
risikofaktore sowel as verhoogde stollingsfaktore. Navorsingstudies het getoon dat die
byvoeging van dieëtvesel by die dieët ‘n belowende terapeutiese agens is vir die beperkte
kontrolering van bekende koronêre risikofaktore. Die fisiologiese effekte van veselinname
in mense word beïnvloed deur die mate wat vesel in die kolon gefermenteer word.
Fermentasie lei tot die produksie van kortkettingvetsure; asetaat, propionaat en butiraat.
Die doel van die studie was om die moontlike effek van verskillende kombinasies van
kortkettingvetsure op metaboliese risikomerkers te toets. In hierdie studie is ‘n groep
vrywillige verwesterde swart mans gevra om deel te neem en ingedeel in drie groepe
deur randomisering. Groep een het ‘n plasebo ontvang. Groep twee het ‘n aanvulling
ontvang wat 50% asetaat en 50% propionaat bevat. Groep drie het ‘n
kortkettingvetsuuraanvulling ontvang in die verhouding van 70% asetaat, 15% propionaat
en 15% butiraat. Aanvullings is vir ‘n periode van ses weke toegedien. Bloedmonsters is
tydens die verskillende besoeke versamel.
xv
Die studiegroep het aanvanklik uit 'n groep swart mans sonder enige metaboliese of
fisiese abnormaliteite bestaan. Alle gemete veranderlikes het binne die normale waardes
geval. In die plasebogroep was daar ‘n statistiese betekenisvolle verlaging in plasma-
fibrinogeenvlakke vanaf basislyn tot met die einde van die aanvullings. Die asetaat-
propionaataanvullingstudiegroep, het 'n statistiese betekenisvolle verlaging in faktor VIII
(van 91.1 ± 11.2 tot 90.9 ± 8.3%, respektiewelik) en ATIII (van 114.3 ± 13.1 tot 108 ±
9.5%) getoon, sowel as ‘n statistiese betekenisvolle verlaging in LDL-C van 3.10 ± 0.79
tot 2.64 ± 0.73 mmol/L. Die betekenisvolle verhoging van %HDL-C van 26.3 ± 6.5 to 30.2
± 9.3% moet ook in aanmerking geneem word. Beide trigliseriede (8%) en plasma-
fibrinogeen (2%) het ‘n statistiese betekenisvolle verhoging getoon. Hierdie veranderinge
is egter van geen kliniese waarde nie.
Die hoë-asetaatstudiegroep (met die byvoeging van butiraat), het ‘n statistiese
betekenisvolle verlaging in faktor VII (van 102.5 ± 13.7 tot 101.1 ± 6.4%), VIII (van 92.6 ±
12.8 tot 87.6 ± 6.0%), ATIII (van 109.2 ± 16.0 tot 103.0 ± 9%) getoon, sowel as
fibrienmonomeerkonsentrasie (van 13.9 ± 2.2 tot 12.1 ± 3.6mg/L).
Fibriennetwerkkompaksie het betekenisvol verhoog vanaf 14.2 ± 4.6 tot 13.7 ± 4.0%.
Ander veranderinge sluit in ‘n statistiese betekenisvolle verhoging in totale serum-
cholesterol van 4.2%.
Volgens die resultate is dit beduidend dat die asetaat-propionaataanvulling, met uitsluiting
van butiraat, ‘n voordelige effek op metaboliese parameters het wanneer dit vergelyk
word met ‘n hoë-asetaat-propionaataanvulling. Die resultate voorsien bewyse van ‘n
moontlike terapeutiese effek deur die propionaat-asetaat bevattende aanvulling. Die
spesifieke meganisme moet nog ondersoek word.

xvi
Die studie toon dus dat asetaat, propionaat en butiraat elk verskillende effekte op
menslike metabolisme het. Daar is bewys dat die gebruik van ‘n mengsel van asetaat en
propionaat ‘n voordelige effek het op pasiënte met 'n risiko het om serebrovaskulêre
siekte te ontwikkel. Verdere studies wat die optimale verhouding van hierdie twee
produkte ondersoek, kan lei tot die ontwikkeling van ‘n natuurlike terapeutiese produk vir
die behandeling van serebrovaskulêre siekte in swart mans, sowel as die bevolking as
geheel.

xvii
LIST OF FIGURES
2.1 Overview of haemostasis, adapted from Ratnoff & Forbes (1996). 11
2.2 Intergrated in vivo haemostasis 14
2.3 Summary of potential mechanism by which increased plasma fibrinogen may
promote arterial disease and ischaemic events (Lowe, 1993). 19
4.1 A turbidimetric presentation of the mean fibrin network lysis rate of the entire
study group at baseline one and two 59
4.2 A turbidimetric presentation of the mean fibrin network lysis rates of the
placebo group for the entire study period 65
4.3 A turbidimetric presentation of the mean fibrin network lysis rate of the
acetate-propionate group for the entire study period 71
4.4 A turbidimetric presentation of the mean fibrin network lysis rate of the high
acetate group for the entire study period 77
xviii
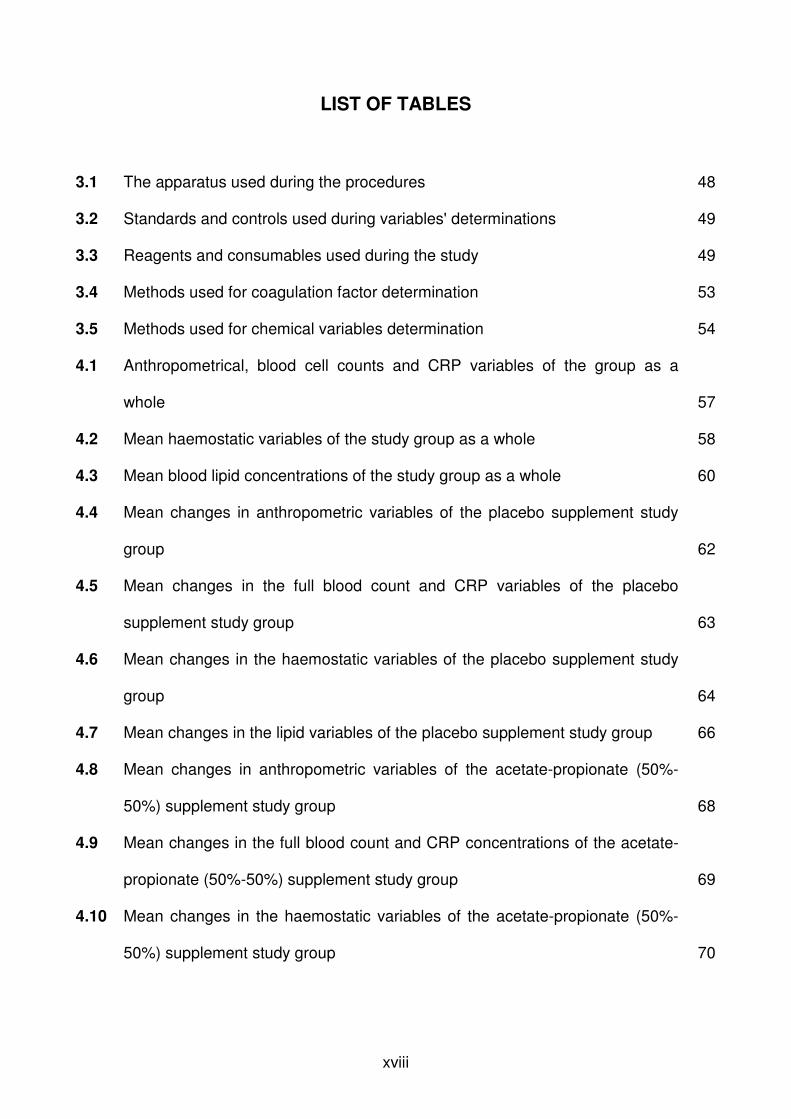
LIST OF TABLES
3.1 The apparatus used during the procedures 48
3.2 Standards and controls used during variables' determinations 49
3.3 Reagents and consumables used during the study 49
3.4 Methods used for coagulation factor determination 53
3.5 Methods used for chemical variables determination 54
4.1 Anthropometrical, blood cell counts and CRP variables of the group as a
whole 57
4.2 Mean haemostatic variables of the study group as a whole 58
4.3 Mean blood lipid concentrations of the study group as a whole 60
4.4 Mean changes in anthropometric variables of the placebo supplement study
group 62
4.5 Mean changes in the full blood count and CRP variables of the placebo
supplement study group 63
4.6 Mean changes in the haemostatic variables of the placebo supplement study
group 64
4.7 Mean changes in the lipid variables of the placebo supplement study group 66
4.8 Mean changes in anthropometric variables of the acetate-propionate (50%-
50%) supplement study group 68
4.9 Mean changes in the full blood count and CRP concentrations of the acetate-
propionate (50%-50%) supplement study group 69
4.10 Mean changes in the haemostatic variables of the acetate-propionate (50%-
50%) supplement study group 70
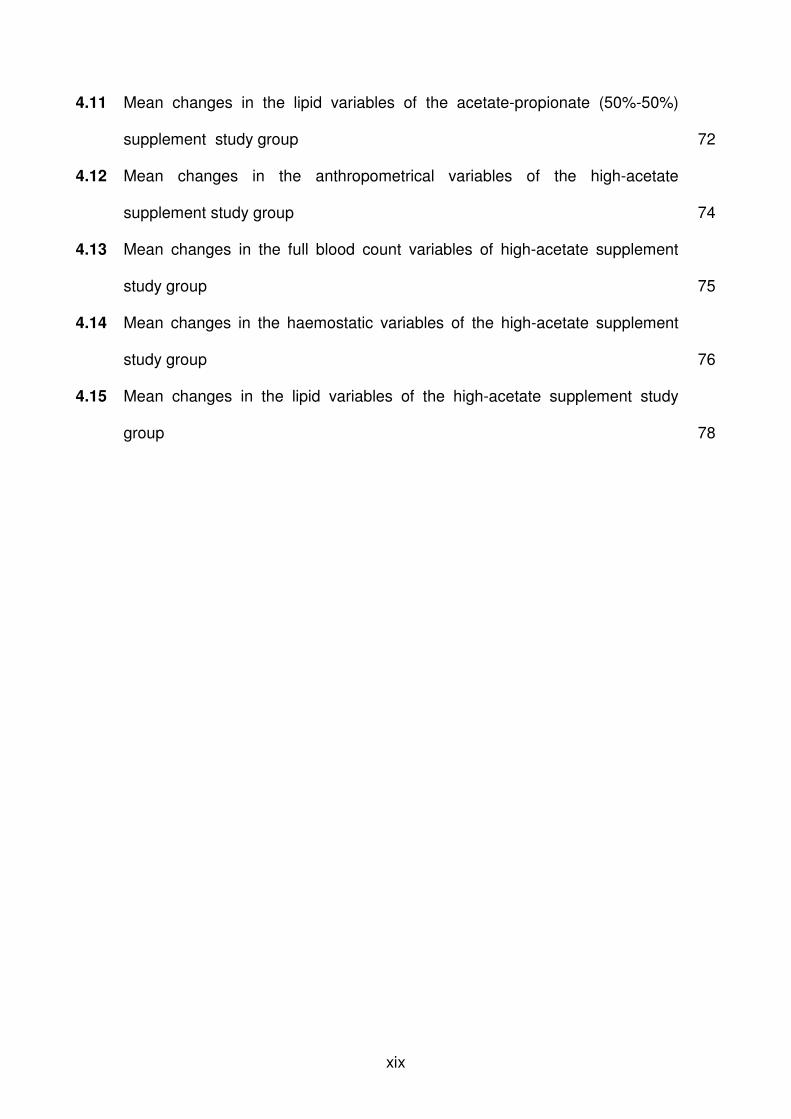
xix
4.11 Mean changes in the lipid variables of the acetate-propionate (50%-50%)
supplement study group 72
4.12 Mean changes in the anthropometrical variables of the high-acetate
supplement study group 74
4.13 Mean changes in the full blood count variables of high-acetate supplement
study group 75
4.14 Mean changes in the haemostatic variables of the high-acetate supplement
study group 76
4.15 Mean changes in the lipid variables of the high-acetate supplement study
group 78
xx
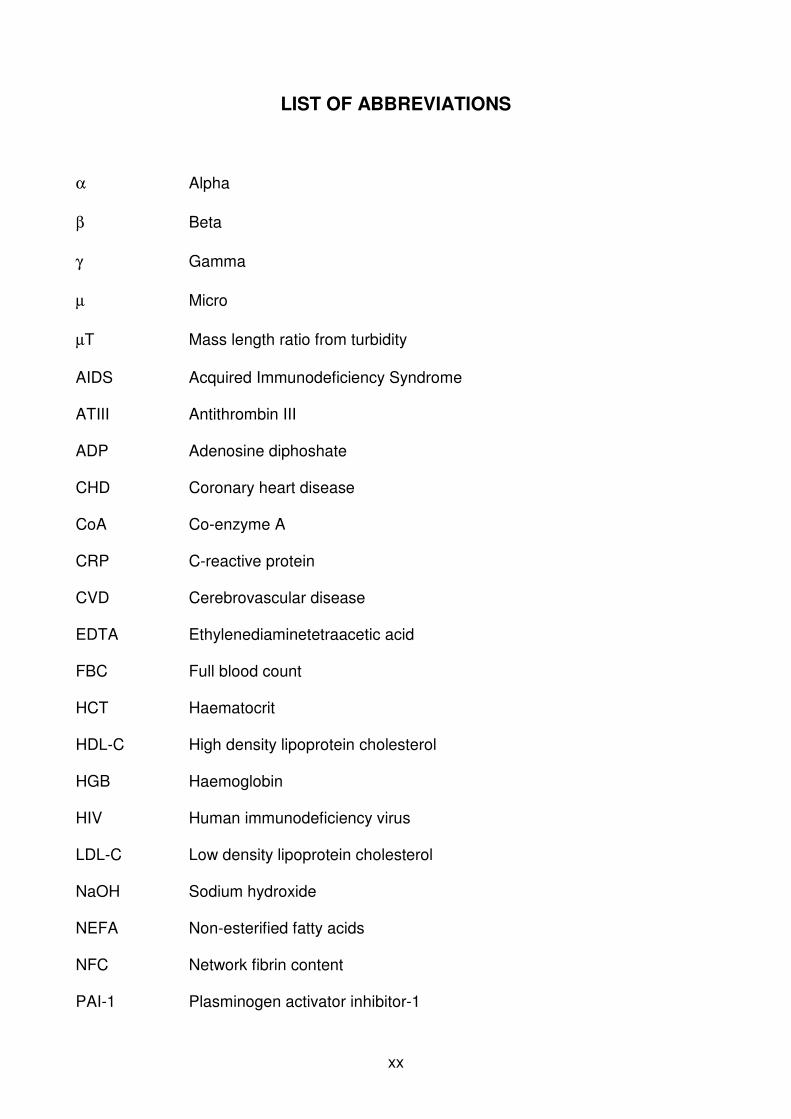
LIST OF ABBREVIATIONS
α Alpha
β Beta
γ Gamma
µ Micro
µT Mass length ratio from turbidity
AIDS Acquired Immunodeficiency Syndrome
ATIII Antithrombin III
ADP Adenosine diphoshate
CHD Coronary heart disease
CoA Co-enzyme A
CRP C-reactive protein
CVD Cerebrovascular disease
EDTA Ethylenediaminetetraacetic acid
FBC Full blood count
HCT Haematocrit
HDL-C High density lipoprotein cholesterol
HGB Haemoglobin
HIV Human immunodeficiency virus
LDL-C Low density lipoprotein cholesterol
NaOH Sodium hydroxide
NEFA Non-esterified fatty acids
NFC Network fibrin content
PAI-1 Plasminogen activator inhibitor-1
xxi
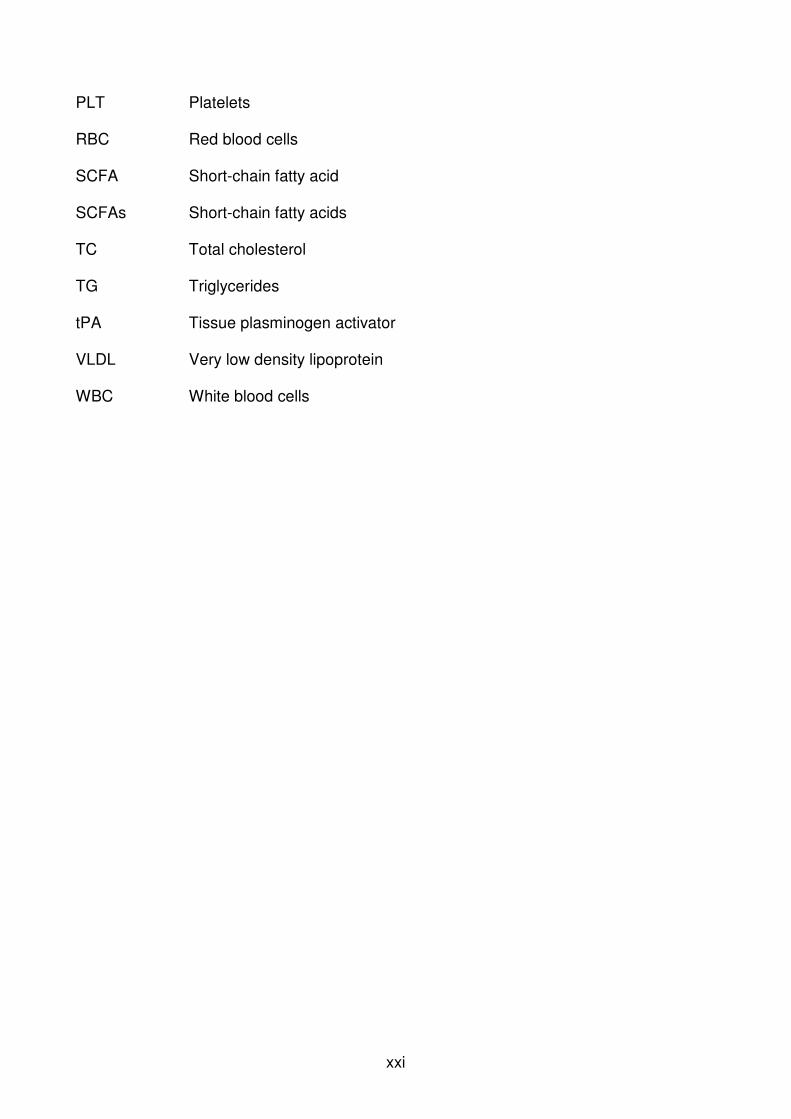
PLT Platelets
RBC Red blood cells
SCFA Short-chain fatty acid
SCFAs Short-chain fatty acids
TC Total cholesterol
TG Triglycerides
tPA Tissue plasminogen activator
VLDL Very low density lipoprotein
WBC White blood cells

xxii
APPENDIXES
A. Consent form 131
B. Recruitment questionnaire 135
C. End of study questionnaire 138
D. Document for calculation of supplement 142

1
CHAPTER 1
INTRODUCTION
1.1 BACKGROUND
Cerebrovascular disease and coronary heart disease (CHD) are of the
most important causes of morbidity and mortality amongst South Africans
and also in the Western world (Bradshaw et al., 1995). Furthermore, the
incidence of the western diseases; atherosclerosis, CHD and
cerebrovascular disease is progressively rising in black populations in
South Africa (Mollentze et al., 1995; Kahn & Tollman, 1999). Stroke is the
most rampant clinical entity of cerebrovascular disease (CVD) (Steyn et
al., 1992) and is an important cause of death in westernised black
populations in South Africa (Joubert, 1991; Qizilbash, 1995; Kahn &
Tollman, 1999) as well as black population in the United States of America
(Iso et al., 1989). The risk factor prevalence for stroke and CHD becomes
altered by changes in lifestyle and diet. Westernisation and migration to
an urban environment causes an even further rise in the risk of stroke and
CHD (Steyn et al., 1991; Seedat et al., 1992; Bourne et al., 1993;
Mollentze et al., 1995; Solomons & Gross, 1995). Mollentze et al. (1995)
indicated that the black population in the Free State is already in advanced
stages of urbanisation and westernisation, while Bourne et al. (1993)
2
found that urbanisation of black populations in the Cape Peninsula
represents a phase towards a progressively atherogenic western diet.
Furthermore, Slabber et al. (1997) also indicated that urban African men in
the Free State show a tendency towards an atherogenic westernised diet,
characterised by low-fibre, high-fat intake.
Westernised African populations tend to have elevated fibrinogen
concentrations (Venter et al., 1992; Slabber et al., 1997). Venter et al.
(1992) also demonstrated that westernisation of Africans tends to raise
fibrinogen concentrations even before an increase in serum lipoproteins is
observed. Raised plasma fibrinogen concentration is accepted as an
independent risk factor for stroke and CHD (Cook & Ubben, 1990; Wolf,
1994). Apart from the known coronary risk factors and raised plasma
fibrinogen levels, other haemostatic risk factors, including modified fibrin
network structures, factor VII, factor VIII and C-reactive protein (CRP), are
also accepted as important for the development of these westernised
diseases (Kannel et al., 1987; Yarnell et al., 1991; Blombäck et al., 1992,
Heinrich et al., 1994, Pan et al., 1997 Mills et al., 2002).
The prudent low-fat, high-fibre diet is regarded as one of the controllable
risk factors in the prevention of degenerative western diseases and is,
therefore also effective for the control of known coronary risk factors
(hyperinsulinaemia, hyperlipidaemia, hypertension, and obesity) as well as
raised clotting factors (Vorster et al., 1988; Hubbard et al., 1994; Vorster et
al., 1997). There is some evidence that fat intake may influence factor VII
3
(Meade et al., 1986), and that fibrinogen levels may be lowered by fish oil
(Oosthuizen et al., 1994), alcohol (Meade & North, 1977) and soluble
dietary fibre (Silvis et al., 1990; Vorster et al., 1997a). Veldman et al.
(1999) also indicated beneficial effects on haemostasis through pectin
supplementation. Furthermore, Venter et al. (1997) stated that a
supplement of soluble fibre might improve not only glucose tolerance and
reduce serum lipid and lipoprotein concentrations, but also reduce
fibrinogen concentrations. The effect of diet on haemostatic risk factor is
however, still controversial and not well established. This underlines the
importance to investigate possible effects of diet in haemostasis.
The physiological effects of dietary fibre in humans are significantly
influenced by the degree to which fibre is fermented in the colon
(Cummings, 1982; Bourquin, et al., 1992). Colonic fibre fermentation
results in the production of short-chain fatty acids (SCFAs) acetate,
propionate and butyrate (Bugaut & Bentejac, 1993; Muir et al., 1995). Total
short-chain fatty acid (SCFA) production from fermentation has been found
to be the greatest for the soluble fibre, oat bran (Bourquin et al., 1992a).
Further effects of SCFAs on lipid metabolism (Topping & Wong, 1994),
haemostasis (Veldman et al., 1999) and Factor VII activity (Marckmann &
Jespersen, 1996) are also evident.
Few results, however, are found, regarding the effect of SCFAs on
haemostatic factors in human subjects. Veldman et al. (1999) indicated
that acetate has a small non-significant decrease on fibrinogen
4
concentration, but found a significant difference in the characteristics of
fibrin networks. The decrease in network fibrin content indicates that less
fibrinogen is converted to fibrin, which is eventually incorporated into the
fibrin networks, which are believed to be less atherogenic (Veldman et al.,
1999). From these limited observation it is evident that there is a possible
association between dietary fibre of SCFAs, fibrin network architecture and
some other haemostatic risk factors. This observation, however, lacks
thorough investigation.
1.2 HYPOTHESIS
Hypothesis I
H0 - The increase in colonic propionate by means of supplementation will
not significantly improve the haemostatic and lipid profiles.
H1 - The increase in the colonic propionate by means of SCFA salt
supplements will improve the haemostatic and lipid profiles.
Hypothesis II
H0 - Doubling SCFA in the large intestine by supplementation of SCFA at
an amount (molar) equivalent to SCFA generated by fermentation of 15
grams mixed fibres (with an increased acetate concentration) will not
significantly improve indicators of the haemostatic and lipid profiles.
5
H1 - SCFA supplements in the large intestine will result in a significant
improvement of haemostatic and lipid profiles; with significantly weaker
and more permeable fibrin networks, coupled with improved lipid profiles.
These metabolic changes would indicate a lower risk for cardiovascular
disease.
1.3 OBJECTIVE
The objective of the study was to test the effects of different short-chain
fatty acids ratio on some haemostatic and lipid risk markers for
cardiovascular disease in westernised black men.
1.4 DISSERTATION STRUCTURE
The first chapter contain the introduction with the aim and motivation for
the study. Chapter two deals with the link between the different variables
examined in this study and contains information needed for the
understanding and interpretation of the study. The materials and methods
used during the study are presented in chapter three, while the findings
are given in chapter four. Chapter five discusses the results, and six
presents the meaning of the findings and recommendations, while seven
contains the references used in this dissertation.
6
CHAPTER 2
LITERATURE REVIEW
2.1 INTRODUCTION
There are two separate but interrelated aspects involved in this study.
These factors include risk markers for coronary heart disease and stroke,
and lifestyle (diet, exercise, stress, etc.). Coronary heart disease and
stroke are considered as degenerative western diseases which in most
cases can be prevented by a change in lifestyle, for example diet, physical
activity and psychological well being. Coronary heart disease and stroke
in turn involves haemostatic and lipid risk markers. Africans have the
lowest incidence of these westernised disorders, in comparison to other
South African population groups. This is thought to be due to the prudent,
low-fat high fiber diet which Africans consume. However with increased
urbanization and adoption of a western, high-fat low-fiber diet, it seems set
that this will cause an increase in the incidence of the westernized
diseases among the African population. The protection seems to center
around the intake of dietary fiber, which is fermented in the large intestine
to short-chain fatty acids. Another factor that seems set to increase the
incidence of CHD and stroke is the lipodystrophy associated with human
immunodeficiency virus (HIV) antiretroviral treatment. This chapter will be
7
used to elaborate the link amongst the production of short-chain fatty acids
and the development of lifestyle associated diseases and lay the
foundation for the understanding of the results and the rest of this
dissertation.
2.2 DEFINITION OF TERMS
2.2.1 Coronary Heart Disease
Coronary heart disease (CHD) is in most instances due to obstruction of
coronary vessels by atherosclerosis or thrombosis, singly or in
combination (Ulbright & Southgate, 1991) that may result in myocardial
infarction, sudden death, and angina pectoris. Atherogenesis and arterial
thrombus are closely linked and each contributes to the other, as indicated
by both autopsy and coronary arteriography studies. There is a dynamic
interaction between spasm, thrombus and atherosclerotic plaque
preceding acute coronary occlusion (Packham & Kinlough-Rathbone,
1994).
2.2.2 Stroke
Stroke refers to the rapidly developing signs of focal and at times global
loss of cerebral function with symptoms lasting more than 24 hours or
leading to death with no apparent cause other than that of vascular origin
(adapted from Hatano, 1976). Atherothromboembolism is by far the most
8
common cause of ischaemic stroke, with haematological disorders,
trauma, and a variety of miscellaneous disorders the cause of the
remainder (Lindley & Warlow, 1994).
2.2.3 Atherosclerosis
Atherogenesis is the formation and development of atherosclerotic lesions
on the surface of arteries; it generally involves a sequence of reactions
that may take several years to become clinically overt (Ross, 1986). It
begins in early life but the complications of coronary heart disease do not
usually occur until middle age (Stehbens, 1990). The term arteriosclerosis
actually encompasses any condition of arterial vessels that results in a
thickening and /or hardening of the walls (Price & Wilson, 2003).
2.2.4 Dietary fibre
Dietary fibre is defined as complex polysaccharide polymers that derive
from plant cell walls which are resistant to the action of our digestive
secretions (Kritchevsky, 1994). Dietary fibre is a generic term covering a
number of substances of unique chemical composition and varying
physiological effects. In the colon, fibre is broken down, by fermentation,
to methane, hydrogen, carbon dioxide, and the respective short-chain fatty
acids (SCFAs), principally acetic, propionic, and butyric acid. SCFAs are
also known as volatile fatty acids. These acids are readily absorbed by
the intestinal mucosa and metabolised by body tissue (Kritchevsky, 1994).
9
2.2.5 Risk factor versus risk marker
Risk factor represents those variables which are considered to contribute
to the chances of developing CHD, for example diet and diabetes mellitus.
While, risk marker represents those variables which are measured in the
patient's blood that are associated with increased risk for developing CHD
and stroke, for example fibrinogen and cholesterol.
2.3 EPIDEMIOLOGY
Cerebrovascular disease and coronary heart disease are important causes
of morbidity and mortality in the western world (Renaud & Lorgeril, 1992)
and amongst South Africans (Bradshaw et al., 1995). Cardiovascular
disease is the prime cause of death among the South African white,
coloured and Indian populations, and the third most common cause of
death among black South Africans aged 15 - 64 years (Bradshaw et al.,
1992). Although blacks still have the lowest cardiovascular disease
mortality rate in South Africa, a survey reveals a deteriorating pattern for
cardiovascular risk (Steyn et al., 1991, Mollentze et al., 1995), because of
exposure to ongoing demographic transition and aggressive marketing of
unhealthy consumer products. Steyn et al. (1992) reported that in 1988
ischaemic heart disease and cerebrovascular disease accounted for 9.6%
and 7.9% respectively of deaths of all South Africans aged 35 - 64 years.
This indicates a loss in the most productive sector of the labour force and
10
clearly constitutes a major cost to the economy. Increasing urbanisation,
the adoption of a westernised lifestyle and concurrent emergence of
associated diseases in black South Africans seem set to further increase
the national cost of cardiovascular disease. The other reason for the
deteriorating pattern of risk is the lipodystrophy associated with HIV
antiretroviral treatment (Law et al., 2003; Miller et al., 2003). The link
between antiretroviral treatment and coronary heart disease is not dealt
with in this dissertation; it is only mentioned to illustrate the future impact.
2.4 RISK MARKERS FOR ATHEROSCLEROSIS AND THROMBOSIS
The aetiology of ischaemic heart disease appears to have two
components: a thrombotic component and a dietary fat/blood lipid
component (Packham & Kinlough-Rathbone, 1994). Any agent that
damages or removes the endothelium can initiate or exacerbate
atherosclerotic lesions, particularly when circulating cholesterol levels are
high. Injurious agents may synergize with each other. Some of the agents
that have been shown to damage the vessel wall also increase the
sensitivity of platelets to aggregating agents, or activate the coagulation
mechanisms, leading to the formation of thrombi. In the absence of an
unequivocal ante mortem diagnosis, factors which have been identified
epidemiologically with the risk of coronary heart attack are examined.
11
Thus the haemostatic process; followed by the haemostatic, lipid and other
risk markers will be discussed in the next section of this chapter.
2.4.1 The haemostatic process
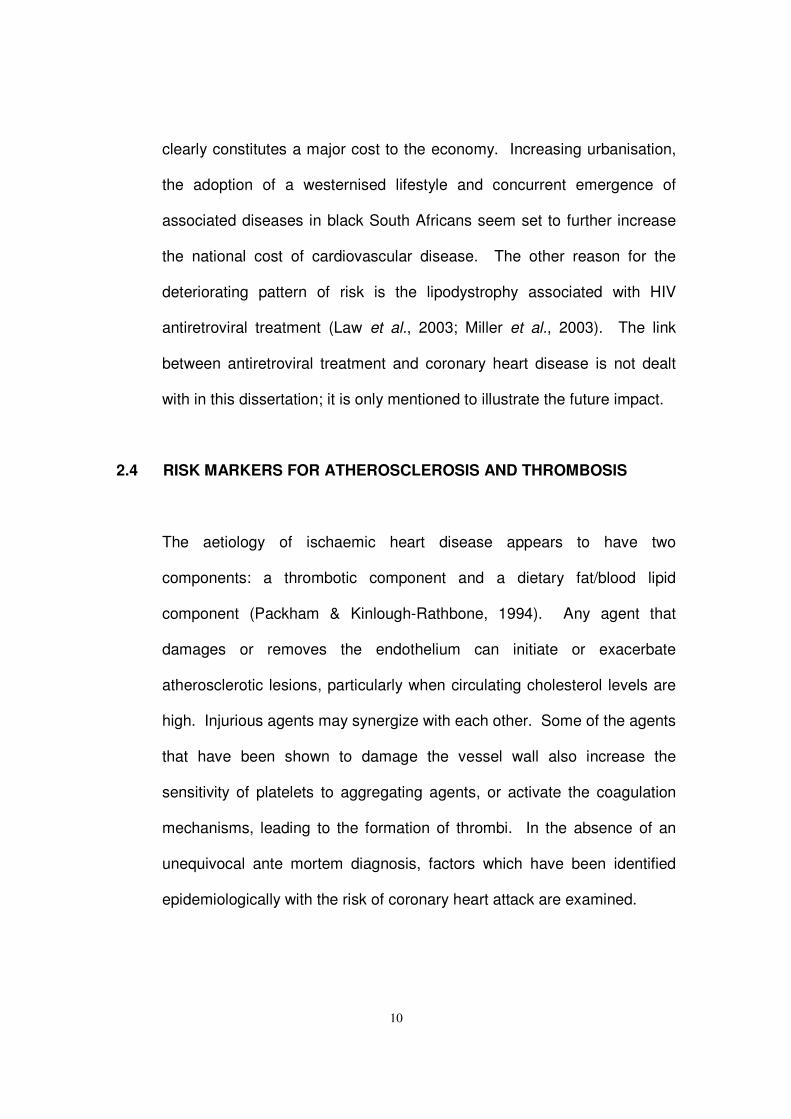
Haemostasis, the spontaneous arrest of blood from ruptured vessels,
involves the interaction of the damaged vessel wall, the blood platelets,
and circulating blood coagulation factors that form a localised stable
mechanical seal that subsequently undergoes slow removal by fibrinolysis
(Ratnoff & Forbes, 1996), as depicted in Figure 2.1.
VASCULAR INJURY
exposed exposed subendothelium tissue factor
Vasoconstriction Platelet aggregation Coagulation
Clot formation
Fibrinolysis
HAEMOSTASIS
Figure 2.1 Overview of haemostasis, adapted from Ratnoff & Forbes
(1996).
12
The haemostatic system is designed to maintain blood in a fluid state
under physiological conditions but primed to react to vascular injury in an
explosive manner to stem blood loss by sealing the defect in the vessel
wall (Ratnoff & Forbes, 1996). Rapid, localised haemostasis is achieved
by complicated systems of activation and inhibition whereby excessive
bleeding and unwanted thrombosis is minimised (Hutton et al., 1999). The
explosive cellular and molecular reaction is modulated by endothelial cell
elaboration of antithrombotic lipids, proteins, inorganic compounds and
several plasma proteases (Kemball-Cook et al., 2004).
2.4.1.1 Vascular endothelium
Normal vascular endothelium maintains blood fluidity by producing
inhibitors of blood coagulation and platelet aggregation, modulating
vascular tone and permeability, and by providing a protective envelope
that separate haemostatic blood components from reactive sub-
endothelial structures (Kemball-Cook et al., 2004). It modulates
fibrinolysis by synthesising and secreting tissue plasminogen activators
and plasminogen activator inhibitors (Ratnoff & Forbes, 1996). Damage
to a blood vessel exposes the elastin and collagen fibres in the
supporting external layers that provide the principle stimulus. Endothelial
disruption activates all four components of the haemostatic apparatus:
rapid vasoconstriction, platelets adherence and aggregation, coagulation
and fibrinolysis (Hutton et al., 1999).
13
2.4.1.2 Platelets
Platelets do not adhere to normal vascular endothelial cells. However,
an area of endothelial disruption provides binding sites for the adhesive
proteins (Watson & Harrison, 2004). Platelets adhere first to the basal
layer of adherent platelets and eventually to one another, forming a mass
of aggregated platelets (Hutton et al., 1999). There is also release of
platelet content that potentiates platelet aggregation. During activation,
platelets expose receptors for specific plasma clotting factors, particularly
activated factor V (Va), which may be either secreted and expressed by
platelets or bound from plasma. This 'acquired' receptor in conjunction
with anionic phospholipids exposed on activated platelets provides an
efficient surface for coagulation (Hutton et al., 1999).
2.4.1.3 Coagulation
The process of coagulation occurs in a series of complex steps, involving
various coagulation enzymes and factors, which terminate in the
formation of the blood clot (Kemball-Cook et al., 2004). Although it has
been traditional to divide the coagulation system into intrinsic and
extrinsic (tissue factor) pathways, such a division does not occur in vivo.
The principal initiating pathway of in vivo blood coagulation is the tissue
factor system, which involves components from both the blood and
14
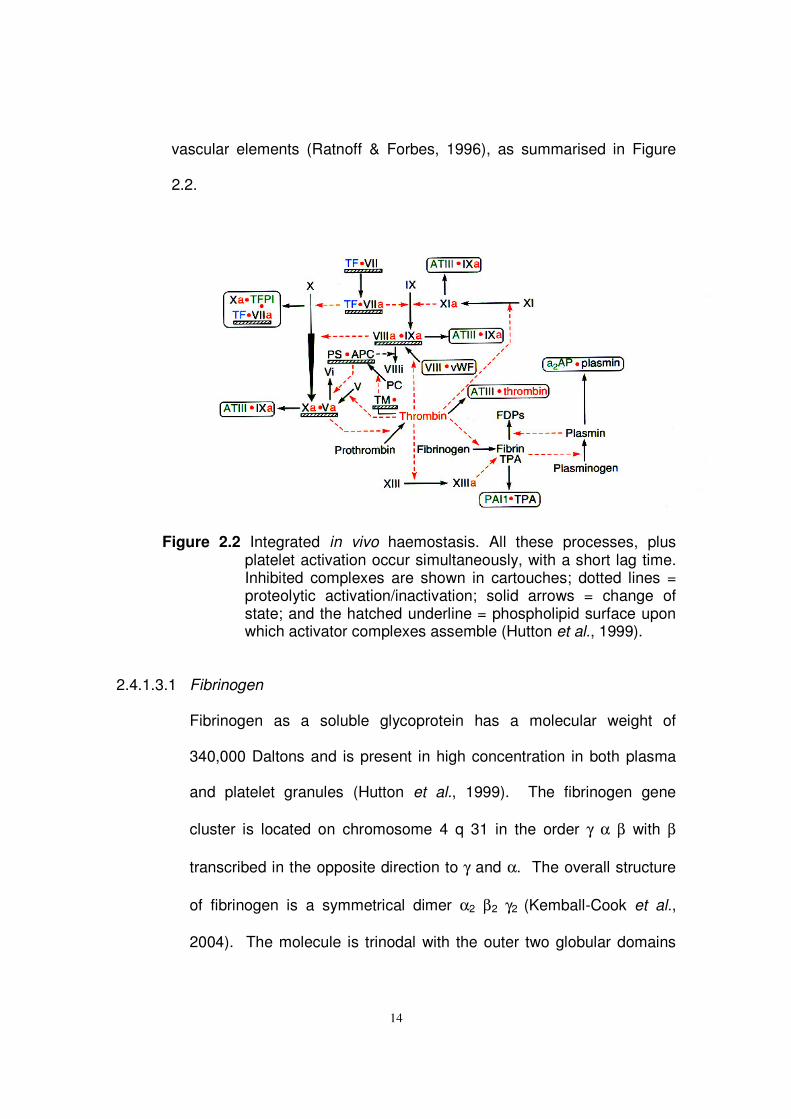
vascular elements (Ratnoff & Forbes, 1996), as summarised in Figure
2.2.
Figure 2.2 Integrated in vivo haemostasis. All these processes, plus platelet activation occur simultaneously, with a short lag time. Inhibited complexes are shown in cartouches; dotted lines = proteolytic activation/inactivation; solid arrows = change of state; and the hatched underline = phospholipid surface upon which activator complexes assemble (Hutton et al., 1999).
2.4.1.3.1 Fibrinogen
Fibrinogen as a soluble glycoprotein has a molecular weight of
340,000 Daltons and is present in high concentration in both plasma
and platelet granules (Hutton et al., 1999). The fibrinogen gene
cluster is located on chromosome 4 q 31 in the order γ α β with β
transcribed in the opposite direction to γ and α. The overall structure
of fibrinogen is a symmetrical dimer α2 β2 γ2 (Kemball-Cook et al.,
2004). The molecule is trinodal with the outer two globular domains
15
(fragment D) containing the carboxytermini of all three chains,
connected to the central globular domain (fragment E), which contains
the N-termini (where fibrinopeptide A and B are found) of all the 6
chains tethered together by disulphide bonds. The lateral and central
globular domains are connected by soiled coil region, forming α-helical
ropes (Hutton et al., 1999).
2.4.1.3.2 Fibrin network formation
The precursor of fibrin is fibrinogen, which interacts with other
proteins, including factor XIII, fibronectin, α2-antiplasmin inhibitor,
plasminogen, and plasminogen activator (Hutton et al., 1999).
Polymerisation of fibrinogen occurs when thrombin, which binds to the
central domain, cleaves two short negatively charged fibrinopeptides A
and B from the N-termini of the α and β chains respectively, resulting
in the formation of a transient intermediate, termed fibrin monomer
(Hutton et al., 1999). Fibrinopeptide A is released more rapidly from
fibrinogen than fibrinopeptide B, but as polymerization to protofibrils
proceeds, the rate of fibrinopeptide B release is increased nearly
sevenfold (Kemball-Cook et al., 2004). This reveals new N terminal
sequences in the fragment E region (called knobs) which fit into holes
in the fragment D regions. Polymerisation then occurs spontaneously
in a half overlap array, which can elongate indefinitely in either
direction (Ratnoff & Forbes, 1996).
16
Release of either set of fibrinopeptides initially leads to a half-
staggered overlap structure. The structure is stabilised by non-
covalent interactions between complementary polymerisation sites
present on the central and outer domains of the fibrin (Kemball-Cook
et al., 2004). Continuing thrombin-catalysed cleavage of the
fibrinopeptides from the central domain of fibrinogen leads to the
formation of two-stranded polymers of fibrin, termed protofibrils, in a
rapid bimolecular polymerisation process. Protofibrils' additional
stability is provided by non-covalent interactions between the distal D
domains of fibrin molecules aligned end-to-end in the same strand of
each protofibril (Ratnoff & Forbes, 1996). Progressive lengthening of
the polymer chain occurs by a half-overlap, side-to-side approximation
of fibrin monomer molecules, and the two-stranded protofibrils interact
laterally to form either long, thin fibrin strands or short, broad sheets of
fibrin. In mature forms the fibrin fibre contains about 100 protofibrils,
with a somewhat random pattern of branching that links the fibres
together (Ratnoff & Forbes, 1996).
It is suspected that the degree of lateral strand association probably
contributes to the tensile strength of the clot. Clot resistance to
plasmin degradation is believed to be influenced mainly by
crosslinking, mediated by Factor XIII (Doolittle, 1994). In the early
stages of the fibrin assembly process, protofibrils are stabilised by the
factor XIIIa-catalysed formation of crosslinks between the γ-chains (D
17
domains) of the assembling fibrin molecules (Doolittle, 1994). After
pairing of virtually all the γ-chains in the fibrin network, a slower
process of multiple crosslink formation between α-chains proceeds.
These interwoven α-chain bonds are probably more critical for clot
lysis resistance than is the limited geometry of the γ-γ crosslink.
Factor XIIIa also covalently crosslinks α2-antiplasmin, the principal
fibrinolytic inhibitor, to α-chains in the clot, thereby increasing
resistance to degradation (Ichinose, 1994).
2.4.1.4 Fibrinolysis
The fibrinolytic system removes unwanted fibrin deposits to re-establish
flow in vessels occluded by a thrombus and to facilitate the healing
process following inflammation and injury (Hutton et al., 1999). Although
only a small proportion of plasma plasminogen is bound to fibrin during
particulate clot formation, this is sufficient to influence subsequent
physiologic breakdown of the clot (Kemball-Cook et al., 2004). The
process is a balanced one, involving plasminogien activator inhibitor-1
and α2 -antiplasmin (Gaffney & Longstaff, 1994).
2.4.2 Haemostatic risk markers and factors
Hypercoagulability can be broadly defined as a risk of thrombosis in
circumstances that would not cause thrombosis in a normal subject
(Schafer, 1994). From a clinical standpoint, patients suspected of having
18
a hypercoagulable state can be divided into two broad categories
(Schafer, 1994). The first category is the primary hypercoagulable state,
with a specific defect in heparin-antithrombin III, protein C-thrombomodulin
and protein S, or plasminogen-plasminogen activator mechanisms
(Walker, 2004). The second category consists of a heterogeneous array
of clinical disorders in which there is an apparent increased risk for
developing thrombotic complications as compared to the general
population, for example, lupus anticoagulant, diabetes mellitus and obesity
(Schafer 1994).
2.4.2.1 Fibrinogen as a risk factor for CHD and CVD
Prospective epidemiological studies have reported strong positive
relationships, between fibrinogen level and the risk of myocardial
infarction and/or stroke (Wilhelmsen et al., 1984, Stone & Thorp, 1985,
Meade et al., 1986, Kannel et al., 1987, Heinrich et al., 1991, Møller &
Kristensen, 1991). The authors concluded that a high fibrinogen level
was an independent risk factor for cardiovascular disease and that
fibrinogen plays an especially important role in the thrombotic process,
thus in the pathogenesis of cardiovascular disease (Figure 2.3). It should
be taken into account that the thrombotic tendency is unlikely to be
accounted for by a single component of the haemostatic cascade, due to
the complex pathophysiology of thrombosis. Many studies have found a
strong positive association between smoking and fibrinogen level, with
19
smokers having the highest fibrinogen levels, moderate levels among ex
smokers and the lowest levels in non-smokers (Kannel, 1997;
Wilhelmsen, 1988; Møller & Kristensen, 1991).
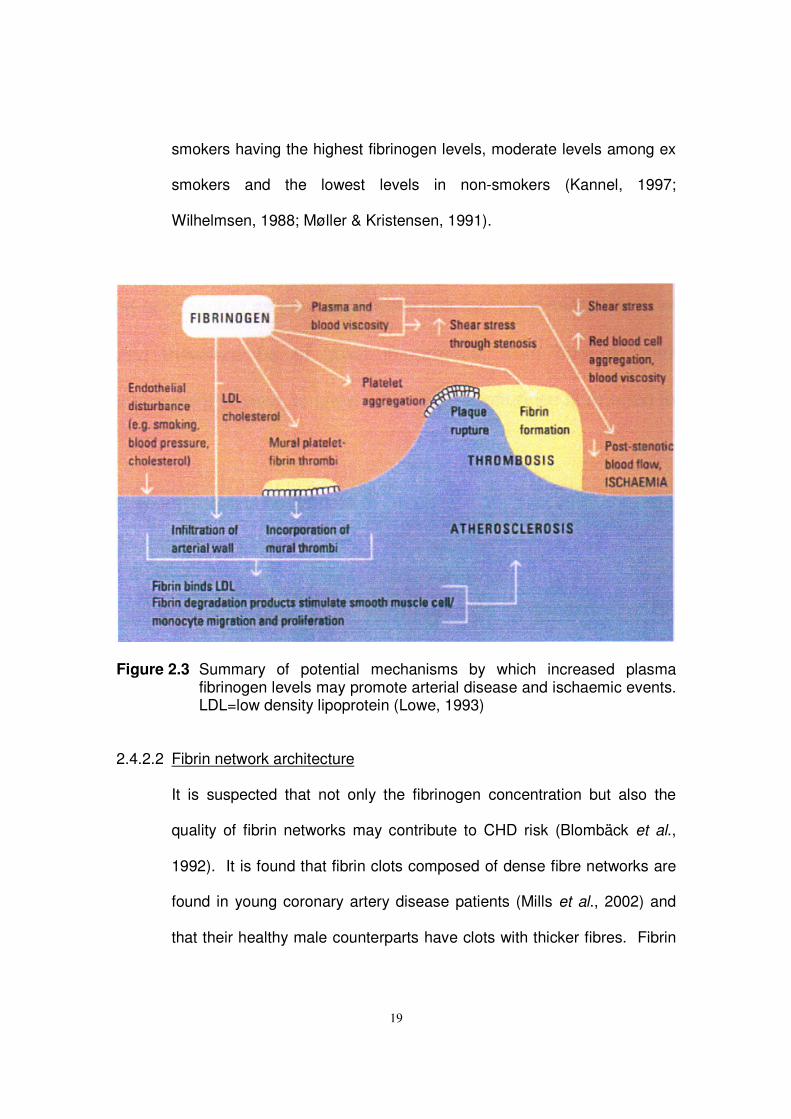
Figure 2.3 Summary of potential mechanisms by which increased plasma fibrinogen levels may promote arterial disease and ischaemic events. LDL=low density lipoprotein (Lowe, 1993)
2.4.2.2 Fibrin network architecture
It is suspected that not only the fibrinogen concentration but also the
quality of fibrin networks may contribute to CHD risk (Blombäck et al.,
1992). It is found that fibrin clots composed of dense fibre networks are
found in young coronary artery disease patients (Mills et al., 2002) and
that their healthy male counterparts have clots with thicker fibres. Fibrin
20
networks formed from plasma of the healthy controls are more
permeable (Mills et al., 2002).
Vascular occlusive disease has a higher incidence in the diabetic patient
compared to the non-diabetic (Ostermann & van de Loo, 1996). Nair et
al. (1991) found that in the diabetic patient the fibre thickness (measured
as the ratio of mass-length of the fibres) and permeability of networks are
reduced. These networks are also more resistant to lysis.
It is known that any given network comprises of a major network of
thicker fibres and a minor network of thinner fibres. The minor network
occupies the interstitial spaces between the major fibres (Nair et al.,
1986). According to Blombäck et al. (1992) kinetic and modulating
factors determine the dimensional gel structures. Kinetic factors include
the thrombin and fibrinogen concentration, while modulating factors
include proteins and ions in close contact with the fibrinogen molecule
(Blombäck et al. 1992).
Three independent methods are used to characterize the fibrin network
architecture. The mass-length ratio serves as a measure of fibrin
thickness (Nair et al., 1991). Permeability serves as a measure of
variability in fibrin fibre thickness and pore size within the network, which
indicates the degree to which fluids can move through the network and
therefore carry enzymes that support the breakdown of the network,
especially of unwanted clots (van Gelder et al., 1995). Compaction
characterises the degree of cross-linking and tensile properties of the
21
fibrin network (Nair & Shats, 1997). Other techniques include the network
lysis rate, which could be used to assess the overall structure of the fibrin
network in terms of lytic rate under controlled conditions. Gabriel et al.,
(1992) have shown that thin fibrin fibres are lysed more slowly when
compared to thick fibrin fibres.
It is suggested that fibrin networks with mostly thin fibres, decreased
permeability and higher tensile strength are more atherogenic in nature
(Blombäck et al., 1992). Fibrin networks with mostly thicker fibres, which
are more permeable and have lower tensile strength, are believed to be
less atherogenic. This is because they are more deformable, allow easy
access of the lytic enzymes and also have greater exposed surface
areas for the fibrinolytic agents (Blombäck et al., 1992).
2.4.2.3 Factor VII
A high blood factor VII activity level has been reported to predispose
patients to the onset of ischaemic heart disease (Meade et al., 1986,
1986a). Surgue et al. (1985) demonstrated that in a series of patients
with heterozygous familial hypercholesterolaemia, the age adjusted
mean plasma fibrinogen level and factor VII activity were significantly
higher in patients with evidence of CHD when compared to patients
without CHD. Serum lipids concentration did not differ significantly
between the two groups. Heinrich et al. (1994) reported that there is a
trend toward higher factor VII activity and occurrence of CHD events.
22
Meade et al. (1986) postulated that dietary fat may be an important
determinant of factor VII activity. Miller et al. (1986) found a positive
correlation between dietary cholesterol intake and factor VII activity.
Factor VII is assumed to be activated via the negative charge of
chylomicrons and VLDL. Accordingly, dietary intake of fats could
influence the risk of ischaemic disease via a long term atherogenic and a
short-term thrombogenic pathway. Since factor VII activation leads to an
increase in thrombin concentration, thereby intensifying platelet activation
and procoagulatory mechanisms, it can be assumed that, conversely,
cholesterol-lowering measures also reduce the thrombotic risk
associated with a high activity of factor VII (Miller et al., 1986).
2.4.2.4 Factor VIII
Since factor VIII and von Willebrand factor are both procoagulants,
favouring clot formation and platelet adhesion, high levels might be
expected to be risk factors for thrombosis and atherosclerosis. Conlan et
al. (1993) showed a strong association of factor VIII with a number of
known cardiovascular disease risk factors. Pan et al. (1997) found a
positive association between factor VIII concentration and carotid
atherosclerosis in the Chinese population. The authors suggest that the
association might not be independent. In the Northwich Park Heart
Study, the individuals in the highest tertile group of factor VIII levels were
associated with a 44% increase in risk for CHD (Meade et al., 1986).
23
Meade et al. (1986a) found that factor VIII was highest in Africans than
Caucasians as observed in other studies (Conlan et al., 1993). It is
suggested that factor VIII levels may be determined predominantly by
genetic (ethnic group and ABO status) rather than environmental
characteristics.
2.4.2.5 Fibrinolytic factors
A variety of fibrinolytic defects have been implicated in the pathogenesis
of thrombosis. These include decreased release of tissue plasminogen
activator (Nilsson et al., 1985) and increased plasminogen activator
inhibitor -1 (PAI-1) concentration (Hamstern et al., 1987). The net effect
of each of these abnormalities is impaired functional plasmin generation
and a blunted fibrinolytic response to fibrin formation (De Pergola &
Pannacciulli, 2002). High PAI-1 levels may be markers that help identify
individuals with an increased risk of recurrent myocardial infarction
(Hamstern et al., 1987).
2.4.2.6 Platelets as a risk factor for CHD and CVD
The development of thrombosis, especially arterial, is greatly influenced
by platelets. This is important where vessel disease, especially
atherosclerosis, is the underlying cause. Platelet hyperaggregability is
associated with increased risk of cardiovascular incidence (Mammen,
1999). This is particularly true for sticky platelet syndrome, where
24
platelets show marked hyperaggregability with ADP and/or epinephrine
(Mammen, 1995; Frenkel & Mammen, 2003). These patients have an
increased risk of developing thrombosis, even while on anticoagulant
therapy or with no evidence of other hyperaggregability conditions.
2.4.3 Lipid risk markers
A total plasma cholesterol level above 5.2 mmol/l is considered to promote
the development of advanced atherosclerotic lesions (Roberts, 1989;
Oliver, 1990). The Lipid Research Clinics Coronary Primary Prevention
Trial (1984 a & b) and Helsinki Heart Study (Frick et al., 1987), clearly
showed that lowering plasma cholesterol levels brings benefit in terms of
reduction of coronary morbidity. High cholesterol levels have also been
reported to result in platelet hypersensitivity to aggregating agents in man
(Bradlow et al., 1982; DiMinno et al., 1986). The question of whether
elevated levels of plasma triglycerides are an independent risk factor for
coronary heart disease is unsettled and controversial (Oliver, 1990; Austin,
1991; Criqui, 1991; Wilson et al., 1991). It is hypothesised that the risk for
coronary artery disease associated with blood cholesterol increases with
rising plasma concentrations of LDL-C. However, it is also believed that
the risk associated with LDL-C is diminished when associated with high
HDL-C concentrations. For this reason, some laboratories calculate the
ratio of LDL-C: HDL-C for estimating the degree of risk; a ratio of less than
25
3:1 is considered desirable (Kaplan et al., 1995). The LDL:HDL ratio is a
strong predictor of cardiac events (Hermansen et al., 2003).
2.4.3.1 Lipoprotein classes
Cholesterol, plasma phospholipids, triglycerides and other hydrophobic
fats, enter and leave plasma bound to specific proteins, forming
lipoproteins (Kaplan et al., 1995). The protein and phospholipids impart
solubility to the otherwise insoluble lipids. Apolipoprotein (apo) are
protein moieties of the lipoprotein. The lipoproteins act as carriers of
triglyceride. Lipoproteins can be classified as chylomicrons, very-low
density lipoprotein (VLDL), intermediate-density lipoprotein (IDL), the
low-density lipoprotein (LDL), or high-density lipoprotein (HDL). Each of
these lipoprotein families contains cholesterol, but in differing
proportions. Chylomicrons, for example, which are more than 95%
triglyceride by weight, carry 1% cholesterol and less than 1% protein.
VLDL, in contrast, contains about 10% protein, 18% cholesterol by
weight, and has fivefold more triglycerides compared to cholesterol. LDL
contains 50% cholesterol by weight; while HDL has 50% protein by
weight and an estimated 23% cholesterol content (Kaplan et al., 1995).
26
2.4.3.2 Low-density lipoprotein cholesterol (LDL-C)
LDL-C binds to specific primary receptors on fibroblasts, which are
responsible for their transport into the cell (Levy, 1981). In humans the
concentrations of LDL-C in the bloodstream totally saturate the primary
LDL-C receptor sites in vivo. Other non-specific receptors become
involved in the clearance of lipoprotein - including receptors on the lining
of the blood vessels themselves, where cholesterol accumulates. It is
postulated that the reason humans are susceptible to atherosclerosis is
because our LDL-C concentrations are higher and above the threshold of
primary clearance (Levy, 1981).
Two main LDL-C phenotypes have been identified, one characterised by
the predominance of large buoyant LDL-C particles and other by an
excess of small, dense LDL-C particles. A pattern consisting of an
increased concentration of small, dense LDL-C particles, an elevation of
triglycerides and a reduction in HDL-C has been shown to increase the
risk of ischaemic cardiac events (Halle et al., 1996).
2.4.3.3 High density lipoprotein cholesterol (HDL-C)
There exists a negative association between HDL-C and the incidence of
ischemic heart disease (Stampfer et al., 1991). A circulating HDL-C
concentration of less than 35 mg/dl (approximately 0.85 mmol/L) is
believed to promote the onset of atherogenesis, while a higher
concentration of the molecule is believed to offer protection against
27
atherosclerosis. HDL-C is not monodisperse, but exists as two main
populations, designated HDL2 and HDL3. Of the two, HDL3 is major and
HDL2 minor in mass terms, but not in clinical significance (Cheung et al.,
1991).
2.4.3.4 Dietary fat and lipid metabolism
The interplay between diet and lipid metabolism has been the topic of
investigation for many decades. Both randomised clinical trials and long-
term epidemiological studies were used to investigate possible
relationships between dietary fat intake and lipid metabolism. Diets rich
in saturated fatty acids of chain length 12 to 16 carbons not only raise
circulating total cholesterol levels (Ulbright & Southgate, 1991), but have
also been shown to be thrombogenic in rats and in man. It is believed
that polyunsaturated fatty acids are antithrombotic in nature (Hornstra,
1980, 1989; NordØy & Goodnight, 1990). It has been pointed out that
the ratio of polyunsaturated to saturated fatty acids (P/S ratio) in the diet
also influences platelet function in man (Renaud, 1990). Renaud (1990)
noted that a dietary P/S ratio of 0.7 is characteristic of the Japanese diet,
a population in whom the clinical complications of atherosclerosis are
reduced. Enrichment of diets with omega-6 polyunsaturated fatty acids
has been shown to depress serum-HDL-C levels, as well as lowering the
LDL-C (Ulbright & Southgate, 1991). Trans-polyunsaturated fatty acids
(produced during the hydrogenation of liquid vegetable oils), in contrast
28
to cis-polyunsaturated fatty acids, have been found to raise LDL-C levels
and lower HDL-C levels in man (Mensink & Katan, 1990), and hence are
considered to be atherogenic. A diet low in saturated and trans-fatty
acids, with adequate amounts of monounsaturated and polyunsaturated
fatty acids, especially long-chain omega-3 fatty acids, would be
recommended to reduce the risk of developing CHD (Lichtenstein, 2003).
2.4.4 Other cardiovascular risk factors
Other risk factors generally associated with increased cardiovascular risk,
include:
• Smoking status (Hennekens et al., 1984; Haapanen et al., 1989;
Homer et al., 1991; Ingall et al., 1991),
• Obesity (Lowe et al., 1988; Lee et al., 1990; Lowe et al., 1992; De
Pergola & Pannacciulli, 2002),
• Diabetes mellitus (Colwell, 1988; Ostermann & van de Loo, 1996),
• Hypertension (Kannel, 1991),
• Stress, or type A personality (Siltanen, 1987; Dimsdale, 1988),
• Adrenaline and noradrenaline (Hourani & Cusack, 1991),
• Hyper-homocysteinaemia (McCully, 1990; Clarke et al., 1991),
• Gender (Beard et al., 1989; Stampfer et al., 1991a),
• Physical inactivity (Powel et al., 1987; Møller & Kristensen, 1991;
Kannel, 1997) and
29
• Age (Bush et al., 1988; Witterman et al., 1989; Barrett-Connor &
Bush, 1991).
2.5 PROPOSED DISEASE MECHANISMS
Stroke and coronary heart disease are multifactor diseases. Their
sequelae encompass genetic factors; physiological factors, such as
metabolism of the arterial wall; humoral factors, including lipids and
lipoproteins and the complex mechanics of blood clotting; stress and
psychological factors; and ecological factors which include diet and
behaviours such as cigarette smoking (Ulbright & Southgate, 1991).
Stroke and CHD commonly involve atherosclerosis and thrombosis thus
the following section will be used to supply a detailed description of
thrombogenesis and atherogenesis.
2.5.1 Thrombogenesis
A thrombus is a deposit formed from blood constituents on the surface of
the heart lining or blood vessels, and can occur anywhere in the circulation
(Summers et al., 2004). In 1856 Virchow proposed that three major
factors determine the site, kind and extent of a thrombus: first is the
mechanical effect in which blood flow is predominant; second is alterations
in the constituents of blood; and thirdly, changes in the vessel wall
30
(Packham & Kinlough-Rathbone 1994). Thrombosis and blockage of
narrowed arteries is a fatal event and the cause of more than 90% of
deaths from CHD (Polk, 1985). Thus, the partially occluded artery is easily
blocked by thrombi formed from aggregated platelets or white blood cells
that rapidly aggregate and clump in response to specific stimuli (Polk,
1985; Ross, 1986; Kinsella et al., 1990).
Vascular damage initiates activation of platelets and the coagulation
cascade that is fundamental to thrombus formation. Aggregation is
induced by thromboxane A2 (Kinsella et al., 1990). Arterial thrombi are
stabilised by the following:
• adhesive blood proteins
• the granules of platelets that have released their granule contents,
• ADP from platelet dense granules or from red blood cells, and
• by fibrin formed under the influence of thrombin.
In addition, clot retraction mediated by platelet actomyosin consolidates a
thrombus and makes it less susceptible to fibrinolysis (Fitzgerald, 1991).
2.5.2 Atherogenesis
Atherosclerotic lesion formation can be induced in two ways: by enriching
the diet with cholesterol (or saturated fats) (Armstrong & Heistad, 1990) or
by repeated injury of the wall of the artery of normocholesterolaemic man
or animals (Tyson et al., 1976; Moore, 1981). The theory of repeated
31
injury is supported by re-occlusion of vessels and accelerated
development of atherosclerotic lesions after procedures such as bypass
surgery, angioplasty and endarterectomy (Summers et al., 2004). Injury-
induced atherosclerosis is exacerbated by lipid-enriched diets (Minick,
1981). Atherosclerosis is a complex process so it is believed that both
theories might play a role simultaneously.
The suggested sequence of events is that monocytes adhere to the
endothelium, migrate into the intima, and become macrophages that take
up lipids. Before uptake, low-density lipoprotein cholesterol (LDL-C) is
oxidised, either in or adjacent to endothelial cells, or when it is bound to
proteoglycans in the intima. Furthermore, it is shown that extensive
oxidation of LDL-C leads to its aggregation (Moar et al., 1997). Both of
these modified forms of LDL-C are present in the atherosclerotic lesion
(Aviram et al., 1995). Following infiltration, macrophages phagocytose the
cholesterol rich LDL-C particles (especially when oxidised or modified),
mediated by scavenger receptors on the macrophage membrane (Aviram
& Fuhrman, 1998). Foam cells are formed. The macrophages secrete
growth factors, thereby stimulating the proliferation and migration of
smooth muscle cells (Steinberg, 1988, 1992; Esterbauer et al., 1992).
Other sources of growth factors include the endothelial cells and the
smooth muscle cells (Ross, 1989; Gordon et al., 1989; Clowes, 1991).
Over time, these lipid-laden cells progressively accumulate and the
adjacent smooth muscle cells proliferate, causing the formation of a raised
32
lesion (Ross, 1986; Steinberg, 1988; Kinsella et al., 1990). Eventually, the
endothelium is disrupted over the foam cells. At this stage platelets
adhere and are induced to secrete growth factors, which further stimulate
the migration and proliferation of smooth muscle cells (Faggiotta & Ross,
1984; Masuda & Ross, 1990). Gradually the lesion develops into a fibrous
plaque. The calcification of advanced lesions may occur. Ultimately,
plaque impedes blood flow. There is growing evidence that oxidation
and/or modification of the lipids contained within LDL-C greatly increase
the capacity of macrophages, endothelial cells, and monocytes to bind and
ingest oxidised LDL via receptors, thus accelerating atherogenesis (Ross,
1986; Steinberg, 1992).
2.6 DIETARY FIBRE
In 1885 Louis Pasteur suggested that the presence of bacteria in the
alimentary tract was essential for the life of rabbits and guinea pigs,
although this suggestion was subsequently disproved by the successful
rearing of germ-free specimens of these animals. Their shortened survival
supported the principle that the intestinal flora is important for normal
nutrition (Wrong, 1995).
Dietary fibres from natural or semi-synthetic sources have gained
increasing attention because of their value as a supplement to the normal
33
western diet, which is poor in bulking substances. Addition of fibre for
treatment of disorders such as atherosclerosis and colon cancer could
hold therapeutic value (Wrong, 1995).
2.6.1 Short chain fatty acids (SCFAs)
Short chain fatty acids are the end product of microbial fermentation within
the digestive tract. Those of interest to us can be described as "saturated
unbranched alkyl monocarboxylic acids of 2 - 4 carbon atoms" (Wrong
1995). SCFAs (acetate, propionate & n-butyrate) and gases (H2, CH4 &
CO2) are the main end products of the anaerobic breakdown of complex
polysaccharides by colonic bacteria (Bourquin et al., 1992a). SCFAs
make up the predominant anions in the large intestine of mammals and
create a slightly acidic pH level (6.0-7.0). SCFAs vary widely in their
relative proportions, depending upon the fibre source in the diet. SCFAs in
human faeces, following consumption of different defined polysaccharides,
have been measured on average, in the molar ratio of acetate: propionate:
butyrate of 53: 27:20 (Brøbech-Mortensen & Clausen, 1996).
2.6.2 Fermentation
"Fermentation" in the human large intestine is used to describe the great
variety of reactions and the overall metabolic process involved in the
anaerobic breakdown and partial mineralization of organic matter,
catalysed by microbial enzymes (Macfarlane & Gibson, 1995). The
34
microbial populations in the large intestine are composed of several
hundred different micro-organism species (prokaryotes and eukaryotes).
In general, most individuals within the same racial and socio-economic
groups harbour similar cell population densities and generic distribution of
bacteria in their colons (Macfarlane & Gibson, 1995).
Substrate for microbial fermentation in the large intestine are
macromolecules that come from endogenous (sloughed epithelial cells,
lysed microbial cells, mucus, and other intestinal excretion) and
exogenous (mostly fibrous components of food) sources, that cannot be
digested by host enzymes (Brøbech-Mortensen & Clausen, 1996). The
major substrates include polysaccharides, non-starch polysaccharides
from plant cell walls, dietary proteins and peptides (Macfarlane & Gibson,
1995). Dietary fibres are complex polysaccharide polymers that derive
from plant cell walls. The structure is made up of water-insoluble cellulose
microfibrils coated with soluble hemicellulose and embedded in a gel of
pectins. Variable amount of starch that escape digestion in the small
intestine (this fraction is called resistant starch) also pass into the colon
and become available as substrate for microbial fermentation, as does
dietary fibres (Brøbech-Mortensen & Clausen, 1996).
The more predominant factors that affect SCFA production from
polysaccharides and protein by bacteria in the large intestine are as
follows:
• chemical composition of the fermentable substrate;
35
• amount of substrate available;
• type of bacteria present in the large gut;
• rate of depolymerization;
• colonic transit time;
• availability of inorganic electron acceptor;
• pH of the gut content, particularly in the proximal colon;
• fermentation strategies of substrate-utilising bacteria;
• substrate specificities and catabolite regulation mechanism of
individual competitive and co-operative particle size;
• solubility and association with indigestable complexes such as
lignins, tannins and silica (Macfarlane & Gibson, 1995).
2.6.3 Absorption
There is ample evidence that SCFAs are rapidly absorbed from the colonic
lumen. Cummings (1981) suggested that, on the basis of a typical western
diet containing 20g fermentable carbohydrate, 200 mmol SCFA are
produced by colonic anaerobic bacteria; 90-97% (180-193 mmol) of SCFA
are absorbed and only 3-10% (7-20 mmol) are excreted in faeces
(Scheppach et al., 1987; Brøbech-Mortensen & Clausen, 1996). Several
models have been proposed to explain SCFA transport (Engelhardt, 1995)
and to account for the large number of observations describing the
dependence of SCFA absorption rates on luminal pH and pCO2 , as well
as on fluxes of water, protons, and inorganic ions (Cl-, HCO3-, Na+ and K+)
36
through the mucosa. SCFAs may also be transported in the ionised form
via an SCFA- HCO3- exchange mechanism.
SCFA absorption in the large intestine involves several processes: non-
ionic diffusion, carrier-mediated mechanisms, diffusion after protonation,
carrier mediated SCFA anion exchange with bicarbonate, and diffusion
coupled with sodium absorption (Scheppach et al., 1987). It is widely
believed that the transmural movement of SCFAs is a concentration-
dependent, passive diffusion process, whereby SCFAs, at least in part, are
transported in the protonated form. Hydrogen ions are needed for SCFA
protonation, because 99% of SCFA (pKa = 4.8) are in the ionised form for
hydration of luminal CO2 to HCO3- and H+. In addition, the mechanism of
uptake into enterocytes is undoubtedly a complex process involving a
number of factors and mechanisms (Engelhardt, 1995). The precise
mechanism for the absorptive process of SCFAs remains undefined, but
all these above outlined factors seem to play a role (Brøbech-Mortensen &
Clausen, 1996).
2.6.4 Metabolism
Butyrate is found in lower proportion in the blood draining the large
intestine when compared to blood draining the lumen (Brøbech-Mortensen
& Clausen, 1996). This reflects the fact that a large part of absorbed
butyrate is metabolised by the mucosa (to carbon dioxide and ketone
bodies). Butyrate is an important fuel for the colonic mucosa whereas
37
acetate and propionate are released into the portal blood. Portal vein
concentrations of butyrate are approximately tenfold higher when
compared to the peripheral vein concentration, while propionate
concentrations are 20 - 40 folds higher and acetate concentrations only
approximately fourfold higher. The major site of SCFA metabolism is the
liver; where butyrate and propionate are almost entirely absorbed.
However, the percentage of acetate uptake is lower (frequently less than
50%). SCFA concentrations in the portal vein are closely dependent on
digestive fermentation (Brøbech-Mortensen & Clausen, 1996).
Hepatic butyrate uptake is practically total under physiological conditions.
Butyrate is exclusively metabolised in mitochondria (carnitine-independent
source of acetyl-CoA) and act as a potentially ketogenic substrate during
the post-absorptive period. In fed subjects, butyrate may represent a
precursor for lipogenesis. High concentrations of butyrate inhibit
propionate utilisation. Because of the provision of acetyl-CoA in
mitochondria, butyrate is an effective activator of gluconeogenis from
lactate, and of ureogenesis; thus butyrate probably thwarts some of the
inhibitory effects of propionate on gluconeogenesis (Rèmésy et al., 1995).
Under healthy conditions, propionate is totally taken up by the
hepatocytes. Propionate may depress the rate of ureogenesis, in contrast
to acetate and butyrate that activate it. Propionate is also a very effective
gluconeogenic substrate in most species. Propionate is probably a
constituent precursor of glycogen synthesis and possibly of lipid synthesis.
38
It acts as an inhibitor of pyruvate oxidation in hepatocytes from fed rats. In
addition, propionate increases the release of lactate in hepatocytes from
fed rats by increasing glycolysis. This effect is counteracted by aleote,
which suggests that propionate inhibits the production of acetyl-CoA and
citrate (Rèmésy et al., 1995).
The metabolic fate of acetate and its role in the liver is connected to the
general orientation of metabolism towards carbohydrate or lipid utilisation.
Acetate stimulates in vitro fatty acid synthesis but inhibits cholesterol-
genesis within isolated rat hepatocytes (Rèmésy et al., 1995).
Furthermore, acetate can stimulate gluconeogenesis from lactate. A
substantial fraction of acetate from digestive fermentation is not taken up
by the liver. Splanchnic balance of acetate is always positive, even during
fasting periods. Most of the extrasplanchnic tissues can metabolise
acetate, for example, adipose tissue, mammary gland (cytosolic), muscle,
kidney, and the heart (mitochondrial). These tissues have acetyl-CoA
synthase. The cytosolic localisation of acetyl-CoA synthase should
channel acetate toward lipogenesis, whereas the mitochondrial localisation
favours its utilisation for energy supply in the Krebs cycle (Rèmésy et al.,
1995).
39
2.6.5 Biological effects of SCFA
Various epidemiological and case control studies have shown that the
intake of dietary fibre has some beneficial effects on the health of human
subjects (Brøbech-Mortensen & Clausen, 1996). Especially the
cholesterol-lowering effects of dietary fibre intake have been the topic of
many studies. The specific mechanism through which dietary fibre
decreases blood cholesterol concentration is unclear. Two possible
hypotheses have been developed: (1) soluble fibres bind bile acids in the
intestine, alter lipid and bile-acid absorption and increase faecal loss of
bile acids; and (2) soluble fibres are fermented in the colon to short-chain
fatty acids, which are absorbed into the portal vein and attenuate hepatic
cholesterol synthesis (Anderson & Siesel, 1990).
2.6.5.1 Butyrate
The effect of butyrate on haemostasis is not known, while the effect on
lipid metabolism has not been extensively studied. In cultured cell lines,
butyrate is a well-recognised antitumor agent, whereas the other SCFAs
are much less active in this respect (Young & Gibson, 1995; Brøbech-
Mortensen & Clausen, 1996).
2.6.5.2 Propionate
Venter et al. (1997) undertook a study where baboons were fed a
western diet with either a 2% propionate or 5% soluble dietary fibre
40
concentrate supplement. Total serum cholesterol values were increased
in the baboons fed an unsupplemented western diet. Soluble fibre
supplementation prevented this increase, while propionate did not.
However, both propionate and fibre intake increased the serum high-
density-lipoprotein cholesterol concentration. Furthermore, the liver
cholesterol concentration was lowered by propionate and fibre
supplementation. Experimental studies in animals indicate that feeding
oat bran has hypocholesterolaemic effects (Brøbech-Mortensen &
Clausen, 1996). Concomitant to this, oat bran significantly increases
portal vein propionate concentration. In comparison, cellulose that does
not lower cholesterol levels does not increase the propionate
concentration. In vitro studies indicate that propionate at physiological
concentrations, significantly decreases hepatic cholesterol synthesis
(Anderson, 1995). Other conflicting results show that propionate
administered rectally, has no effect on either the circulating total
cholesterol or the triglyceride concentration (Wolever et al., 1991). When
administered orally, propionate is reported to have no effect on serum
cholesterol levels, but causes an increase in the triglyceride
concentration (Brøbech-Mortensen & Clausen, 1996). Conflicting results
show that the total serum cholesterol concentration is slightly decreased
and the triglyceride concentration slightly increased (Anderson, 1995).
41
2.6.5.3 Acetate
When acetate is administered through different routes, for example oral,
rectal and intravenous, to healthy human volunteers the following are
found. Decrease in glycerol levels and a significant decrease in serum
concentrations of free fatty acids. Acetate appears to compete with long-
chain fatty acids for oxidation in certain tissues, promote hepatic
cholesterol synthesis and decrease lipolysis (Topping & Pant, 1995).
Veldman et al., (1999) postulated that pectin and acetate effected a
positive change in the fibrin network structure. These changes are partly
accounted for by the direct effect of acetate on fibrin network structure.
2.7 SUMMARY OF LITERATURE REVIEW
Cerebrovascular disease and coronary heart disease (CHD) are of the
most important causes of morbidity and mortality amongst South Africans.
The risk factor prevalence for stroke and CHD becomes altered by
changes in lifestyle, including diet. In general it is suggested that lifestyle
management should be the first choice when having to treat patients with
increased cardiovascular risk.
The prudent low-fat, high-fibre diet is regarded as an apparently healthy
diet. It is suspected that this diet is effective for the control of known
coronary risk factors as well as raised clotting factors. Research studies
have shown the addition of dietary fibre to the diet as a promising
42
therapeutic agent for the limited control of known coronary risk factors.
The physiological effects of dietary fibre in humans are significantly
influenced by the degree to which fibre is fermented in the colon.
Fermentation results in the production of short-chain fatty acids (SCFAs)
acetate, propionate and butyrate.
This chapter has been used to show how CHD and stroke are related to
lifestyle changes especially diet, and the reason why black people were
chosen as the study population. CHD and stroke involves both
haemostasis and lipids. Risk markers from both where discussed, to show
a link between diet and these variables. Finally, the short-chain fatty
acids' link with haemostatic and lipid risk markers was discussed to
explore the possible mechanism by which SCFAs affects the risk markers.
Thus a foundation has been laid for the understanding of this study
43
CHAPTER 3
MATERIALS AND METHODS
3.1 INTRODUCTION
In this study a group of westernised African male volunteers were recruited
and fed two different combinations of short-chain fatty acids, as well as a
placebo supplement, for a period of six weeks. Blood was drawn at
different intervals and analysed to assess changes that were brought
about by the different supplements. The study was explained to all
volunteers, where they signed the Informed Consent Document (appendix
A) and completed the recruitment questionnaire (appendix B). Blood
sampling and medical examinations were performed at the medical
facilities of the Tempe Military Base, Bloemfontein. Laboratory analyses of
samples were performed at the Research Laboratory, School of Health
Technology, Central University of Technology, Free State.
3.1.1 Ethical consideration
This study proposal was submitted to and approved by the Ethics
Committee of the University of the Free State, reference number: ETOVS
227/98. The study was conducted according to International Good Clinical
44
Practice Guidelines and adhered to the contents of the Declaration of
Helsinki.
3.1.2 Study design
Volunteers were recruited from the Military Base at Tempe Defence Force,
Bloemfontein, and randomly assigned to three different supplementation
groups. Group 1 received a placebo filled with non-fermentable cellulose.
Group 2 received a supplement containing 50% acetate and 50%
propionate. Group 3 received a SCFA supplement in the ratio of 70%
acetate, 15% propionate and 15% butyrate. Neither researchers, field-
workers nor the volunteers were aware of which supplement they were
assigned to. The study was therefore double-blind.
A calculation based on the results of previous experiments was only of
partial value for obtaining sample size since effects of propionate
supplementation on outcomes measured in this study were not available.
For power calculations a reference of 15% change in circulating blood
cholesterol was used (Veldman, 2000). It was estimated that a group of
25 individuals per supplement would allow for expected drop-outs without
a significant loss of statistical power.
45
3.1.3 Work schedule
A recruitment day was scheduled during which blood samples were drawn,
dietary intake, social and geographic background questionnaires
completed, as well as anthropometric measurements taken as part of the
selection process. The scientific value of the study and expectations of
the researchers were also explained to the volunteer, in both English and
their preferred mother tongue. Inclusion criteria were strictly adhered to
for selection of participants. A total of 75 subjects were selected after
scrutinisation of the recruitment data. For standardisation purposes
supplementation followed after a run-in phase of one week, during which
all subjects consumed placebo supplements. Subjects were then
randomly assigned to one of three groups. Blood was also drawn on day
8 (end of the run-in phase) which also served as a baseline measurement.
Volunteers then consumed the pellets containing different combinations of
SCFAs or placebo corresponding to their group assignment for a period of
four weeks. A washout period of one week followed. Blood samples were
drawn after two weeks of supplementation on day 22, and again at the end
of the four week period on day 36. Following day 36, all subjects
consumed placebo containing capsules for seven days, after which blood
was drawn to assess the recovery of measured variables after
supplementation. At the end of the study the subjects completed a
questionnaire about their experiences during the study (appendix C).
46
3.2 MATERIALS
3.2.1 Study population
Only seventy-five subjects met the inclusion criteria. The subjects were
permanent African male staff of Tempe Military base, Bloemfontein. The
inclusion criteria were as follows:
• No smokers, alcoholics, and history of cardiovascular incidences
• No usage of chronic medications
• No usage of medication or other supplementation during the study,
without the knowledge of the study leader
• No lifestyle changes during study and at least six months prior to
the study
• Subjects should have been permanent staff for at least one year
prior to the study
• No familial hypercholesterolaemic subjects were used
• Subjects should have a fibrinogen level of higher than 2.5 g/L in
order to recognise significant effects on this variable.
• The background diet should be identical and contain about
15 grams unabsorbed carbohydrates.
47
3.2.2 Supplements
Volunteers obtained SCFA supplements in capsules equivalent to the
fermentation of 15 grams dietary fibre. The capsules were designed in
such a way that their contents were released only in the large intestine;
they were resistant to stomach acid and small intestine enzymes (coated
with a chelac-containing spray). The reason for this was to simulate the
generation of SCFA in the large intestine. The supplements’ content, ratio
and concentration were calculated using the sheet attached in appendix D.
The acetate/propionate ratios were as follows:
Group one: Placebo capsules containing indigestible cellulose.
Group two: Half + half 50% acetate 50% propionate 0% butyrate
Group three: High acetate 70% acetate 15% propionate 15% butyrate
Compliance of supplement consumption was monitored by the dieticians
(Captains M De Wet & A van Onselen – who were involved in the study),
as the entire subject group ate their meals at the Mess-hall of Tempe
Military Base, Bloemfontein.
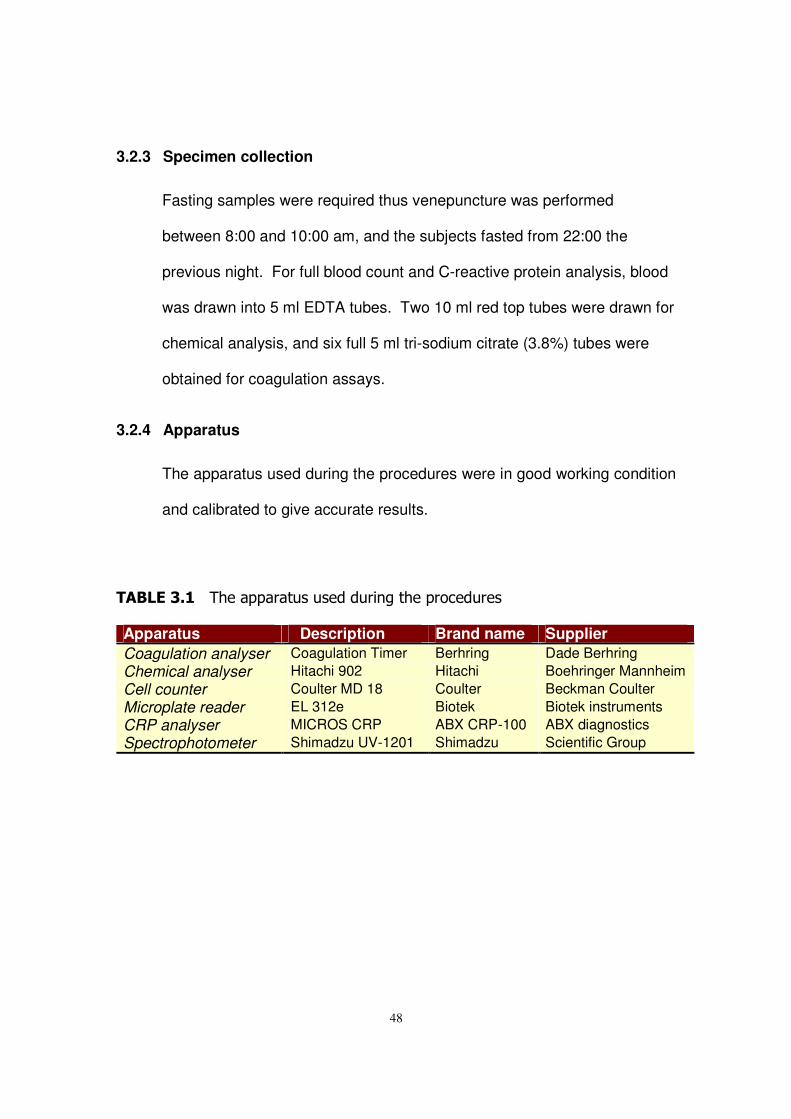
48
3.2.3 Specimen collection
Fasting samples were required thus venepuncture was performed
between 8:00 and 10:00 am, and the subjects fasted from 22:00 the
previous night. For full blood count and C-reactive protein analysis, blood
was drawn into 5 ml EDTA tubes. Two 10 ml red top tubes were drawn for
chemical analysis, and six full 5 ml tri-sodium citrate (3.8%) tubes were
obtained for coagulation assays.
3.2.4 Apparatus
The apparatus used during the procedures were in good working condition
and calibrated to give accurate results.
��������� ������������������ ���������������
Apparatus Description Brand name Supplier Coagulation analyser Coagulation Timer Berhring Dade Berhring Chemical analyser Hitachi 902 Hitachi Boehringer Mannheim Cell counter Coulter MD 18 Coulter Beckman Coulter Microplate reader EL 312e Biotek Biotek instruments CRP analyser MICROS CRP ABX CRP-100 ABX diagnostics Spectrophotometer Shimadzu UV-1201 Shimadzu Scientific Group
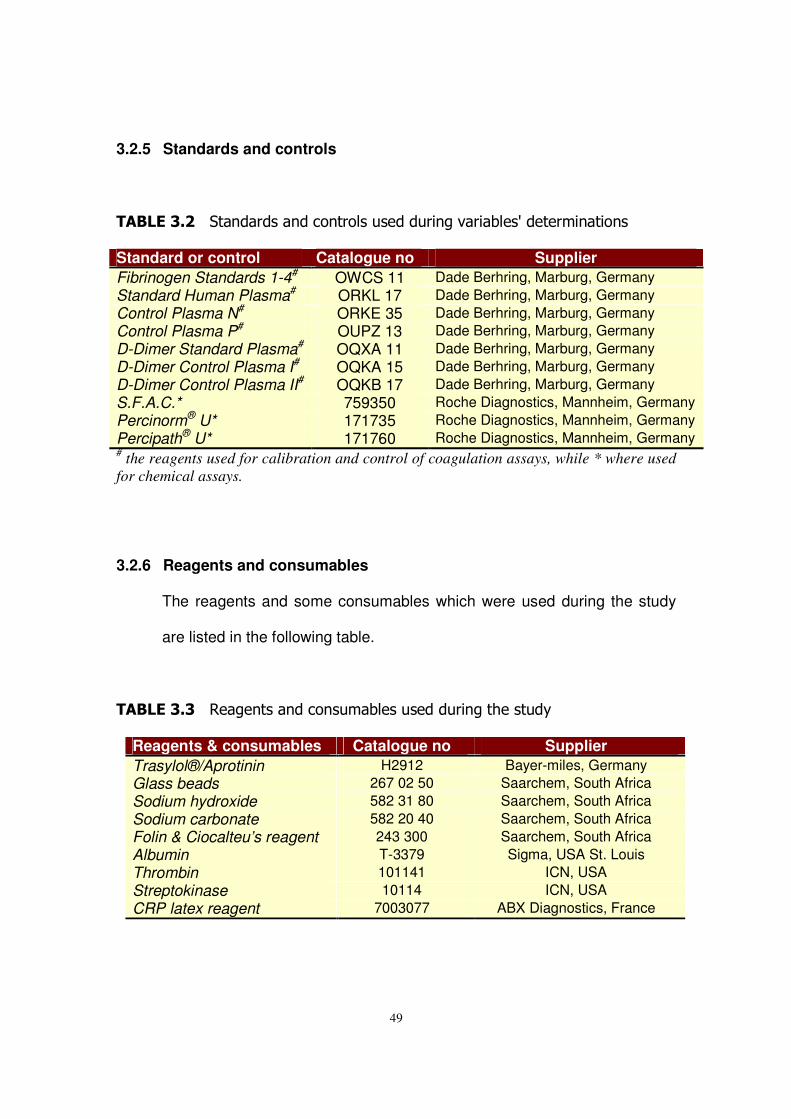
49
3.2.5 Standards and controls
��������� ��� ������ ���� ����������� ������������������� ���� �
Standard or control Catalogue no Supplier Fibrinogen Standards 1-4# OWCS 11 Dade Berhring, Marburg, Germany Standard Human Plasma# ORKL 17 Dade Berhring, Marburg, Germany Control Plasma N# ORKE 35 Dade Berhring, Marburg, Germany Control Plasma P# OUPZ 13 Dade Berhring, Marburg, Germany D-Dimer Standard Plasma# OQXA 11 Dade Berhring, Marburg, Germany D-Dimer Control Plasma I# OQKA 15 Dade Berhring, Marburg, Germany D-Dimer Control Plasma II# OQKB 17 Dade Berhring, Marburg, Germany S.F.A.C.* 759350 Roche Diagnostics, Mannheim, Germany Percinorm® U* 171735 Roche Diagnostics, Mannheim, Germany Percipath® U* 171760 Roche Diagnostics, Mannheim, Germany # the reagents used for calibration and control of coagulation assays, while * where used for chemical assays.
3.2.6 Reagents and consumables
The reagents and some consumables which were used during the study
are listed in the following table.
���������� ����� ��� ���� ������������ ����������
Reagents & consumables Catalogue no Supplier Trasylol®/Aprotinin H2912 Bayer-miles, Germany Glass beads 267 02 50 Saarchem, South Africa Sodium hydroxide 582 31 80 Saarchem, South Africa Sodium carbonate 582 20 40 Saarchem, South Africa Folin & Ciocalteu’s reagent 243 300 Saarchem, South Africa Albumin T-3379 Sigma, USA St. Louis Thrombin 101141 ICN, USA Streptokinase 10114 ICN, USA CRP latex reagent 7003077 ABX Diagnostics, France
50
3.3 METHODS
3.3.1 Specimen preparation
Full blood count analysis was performed within four hours post
venepuncture, after which the specimen was centrifuged, plasma
separated and stored in 1.5 ml Eppendorf vials at –70°C for CRP
analysis. Clotted specimens were centrifuged; serum separated and
stored in 1.5 ml Eppendorf vials at –70°C. Platelet free plasma was
obtained by centrifuging citrated blood twice, which was aliquoted and
stored in 1.5 ml Eppendorf vials at –70°C.
3.3.2 Fibrin network architecture variables
These variables were performed on citrate plasma. Thirty-five micro-litres
of 10.000 KIU/ml Trasylol/aprotinin per nine volumes of citrate plasma
was added, and thus used as an inhibitor of fibrin(ogen) lysis. Plasma with
trasylol was used for analysis of fibrin network content, compaction and
mass-length ratio from turbidity. Permeability was not performed because
of the great degree of variation and the complexity of the method.
Network lysis rate was performed on plasma without Trasylol®.
3.3.2.1 Network fibrin content
The method of Ratnoff & Menzies (1951) was used for duplicate
determination of all network fibrin content. For network fibrin content
51
0.9 ml plasma was pipetted into test tubes containing one gram glass
beads and was clotted by addition of 100 µL Thrombin Reagent (1 IU/ml
Thrombin final concentration, 25 mM Ca++ final concentration). Samples
were left overnight for maximum polymerisation. All samples were
centrifuged at 1300 X g and the supernatants were discarded. The
isolated networks were washed three times with saline solution. One ml
2.5 M NaOH was dispensed into each test tube and the networks were
dissolved by heating the tubes for 15 minutes at 95°C. The samples
were left to cool at room temperature. Seven millilitres water and three
ml 1.9 M sodium carbonate were dispensed into each tube, containing
200 µL of the NaOH-fibrin suspension. The tubes were vortexed and
mixed with one ml Folin-Ciocalteu's phenol reagent. Samples were
incubated at room temperature for 20 minutes and the absorbance
measured at 650 nm. Different concentrations of albumin were dissolved
in 2.5 M NaOH and used to prepare a standard curve. This standard
curve was used to calculate the concentration of fibrin present in
unknown samples.
3.3.2.2 Mass-length ratio from turbidity (µT)
The mass-length ratio from turbidity (µT) was determined in triplicate for
each sample, using the method as described by Nair et al. (1991). Nine
hundred µL of platelet-poor plasma was pipetted into micro-cuvettes of
one centimetre path length. The plasma was mixed and clotted by
52
addition of 100 µL Thrombin Reagent (1 IU/ml Thrombin final
concentration, 25 mM Ca++ final concentration). Samples were left
overnight for maximum polymerisation.
The intercepts, A, in plots of c/T(λ)3 as a function of 1/(λ)2 were used to
calculate µT according to the equation :
µT = [10/1.48xA] x 1012 daltons/cm
with c the network content, T the absorbance × 2.304 and λ the
wavelength. Turbidity (optical density) was measured at a range of
wavelengths between 600 and 800 nm.
3.3.2.3 Compaction of fibrin networks
Compaction was measured in duplicate using the method as described
by Dhall et al. (1976). Nine hundred micro-litre of plasma was pipetted
into 1.5 ml Eppendorf vials, pre-sprayed with lecithin-based aerosol
(Spray-a-Cook) to render the surface non-adhering. The plasma was
clotted by introduction of 100 µL Thrombin Reagent (1 IU/ml Thrombin
final concentration, 25 mM Ca++ final concentration). Samples were left
overnight for maximum polymerisation. After centrifugation at 8000 X g
for 45 seconds the volume of expelled sample from the fibrin networks
was determined using a one ml syringe and expressed as a percentage
of the initial volume.
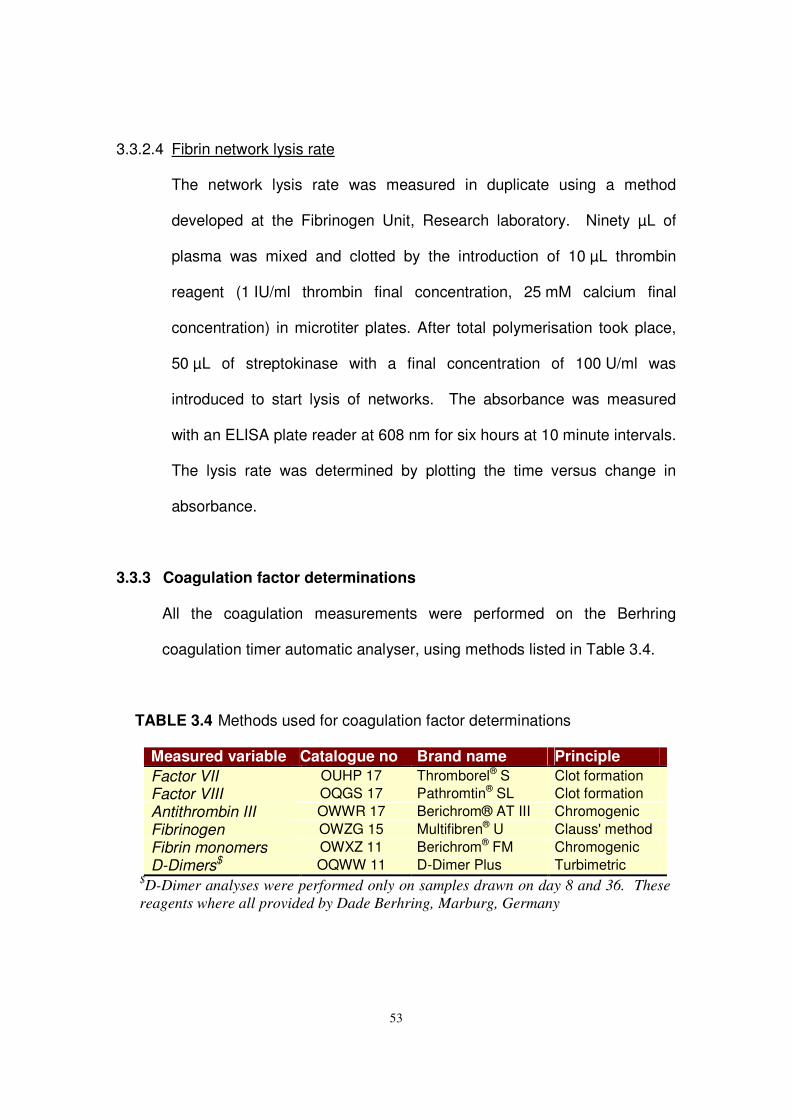
53
3.3.2.4 Fibrin network lysis rate
The network lysis rate was measured in duplicate using a method
developed at the Fibrinogen Unit, Research laboratory. Ninety µL of
plasma was mixed and clotted by the introduction of 10 µL thrombin
reagent (1 IU/ml thrombin final concentration, 25 mM calcium final
concentration) in microtiter plates. After total polymerisation took place,
50 µL of streptokinase with a final concentration of 100 U/ml was
introduced to start lysis of networks. The absorbance was measured
with an ELISA plate reader at 608 nm for six hours at 10 minute intervals.
The lysis rate was determined by plotting the time versus change in
absorbance.
3.3.3 Coagulation factor determinations
All the coagulation measurements were performed on the Berhring
coagulation timer automatic analyser, using methods listed in Table 3.4.
TABLE 3.4 Methods used for coagulation factor determinations
Measured variable Catalogue no Brand name Principle Factor VII OUHP 17 Thromborel® S Clot formation Factor VIII OQGS 17 Pathromtin® SL Clot formation Antithrombin III OWWR 17 Berichrom® AT III Chromogenic Fibrinogen OWZG 15 Multifibren® U Clauss' method Fibrin monomers OWXZ 11 Berichrom® FM Chromogenic D-Dimers$ OQWW 11 D-Dimer Plus Turbimetric
$D-Dimer analyses were performed only on samples drawn on day 8 and 36. These reagents where all provided by Dade Berhring, Marburg, Germany
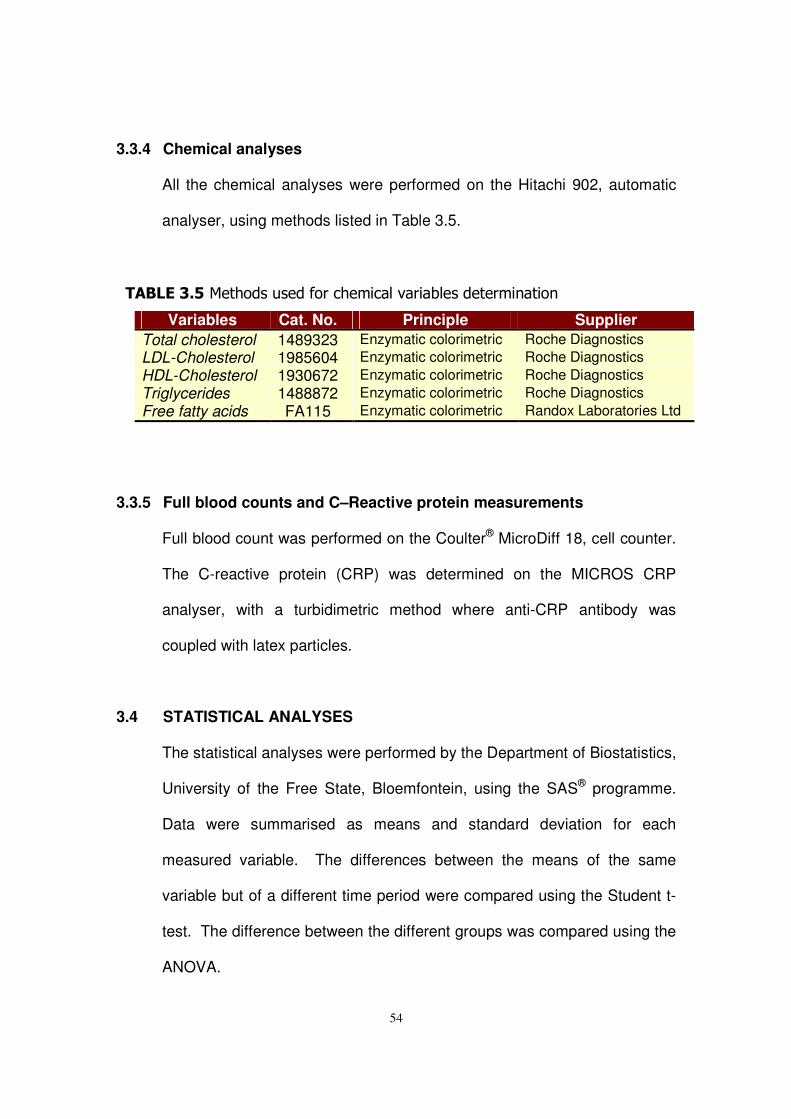
54
3.3.4 Chemical analyses
All the chemical analyses were performed on the Hitachi 902, automatic
analyser, using methods listed in Table 3.5.
������������������������������������������������� ���� �
Variables Cat. No. Principle Supplier Total cholesterol 1489323 Enzymatic colorimetric Roche Diagnostics LDL-Cholesterol 1985604 Enzymatic colorimetric Roche Diagnostics HDL-Cholesterol 1930672 Enzymatic colorimetric Roche Diagnostics Triglycerides 1488872 Enzymatic colorimetric Roche Diagnostics Free fatty acids FA115 Enzymatic colorimetric Randox Laboratories Ltd
3.3.5 Full blood counts and C–Reactive protein measurements
Full blood count was performed on the Coulter® MicroDiff 18, cell counter.
The C-reactive protein (CRP) was determined on the MICROS CRP
analyser, with a turbidimetric method where anti-CRP antibody was
coupled with latex particles.
3.4 STATISTICAL ANALYSES
The statistical analyses were performed by the Department of Biostatistics,
University of the Free State, Bloemfontein, using the SAS® programme.
Data were summarised as means and standard deviation for each
measured variable. The differences between the means of the same
variable but of a different time period were compared using the Student t-
test. The difference between the different groups was compared using the
ANOVA.
55
CHAPTER 4
RESULTS
4.1 INTRODUCTION
Dietary fibre is said to help in the prevention of westernised diseases but
the exact mechanism of action is not known. In chapter two it has been
explained that, dietary fibre is fermented in the large gut to short-chain
fatty acids (acetate, propionate and butyrate). It was also explained that, it
is hypothesised that these SCFAs may, in part, contribute in some way to
the beneficial effects of dietary fibre intake on human metabolism. The
aim of this study was to test the effects of different combinations of short-
chain fatty acids on some metabolic risk markers generally associated with
the development of cardiovascular heart disease in westernised African
men.
A summary of the baseline results for the entire study group will be
presented first, followed by the results of the different supplementation
groups. The results of the different groups were sub-divided into three
categories, namely; (i) general health profile, which includes the
anthropometrical, full blood count and CRP data; (ii) haemostatic profile,
and (iii) lipid profile. However, this study highlights the effects of the given
56
supplements on haemostatic risk factors and only a short description of
the other risk variables will be given.
4.2 BASELINE RESULTS OF THE ENTIRE STUDY GROUP
Two baseline measurements were taken from each volunteer separated
by a time-interval of seven days. All subjects consumed placebo
supplements for standardisation purposes between the two baseline visits.
The results of the two baseline measurements will now be presented in
order to provide information regarding the more general characteristics of
the study population as a whole. The reference ranges of the different
variables are included as an aid to judging the results.
4.2.1 General health profile of the entire study group for both baseline
visits
Anthropometrical measurements, blood cell counts and CRP
concentrations of the two baseline visits for most of the study group were
within the normal reference range, except for a few individual outliers.
However, none of the outliers were clinically abnormal. All subjects were
therefore included in the study group.
The results of baseline one was comparable to those of baseline two, with
no statistically significant differences between the two visits.
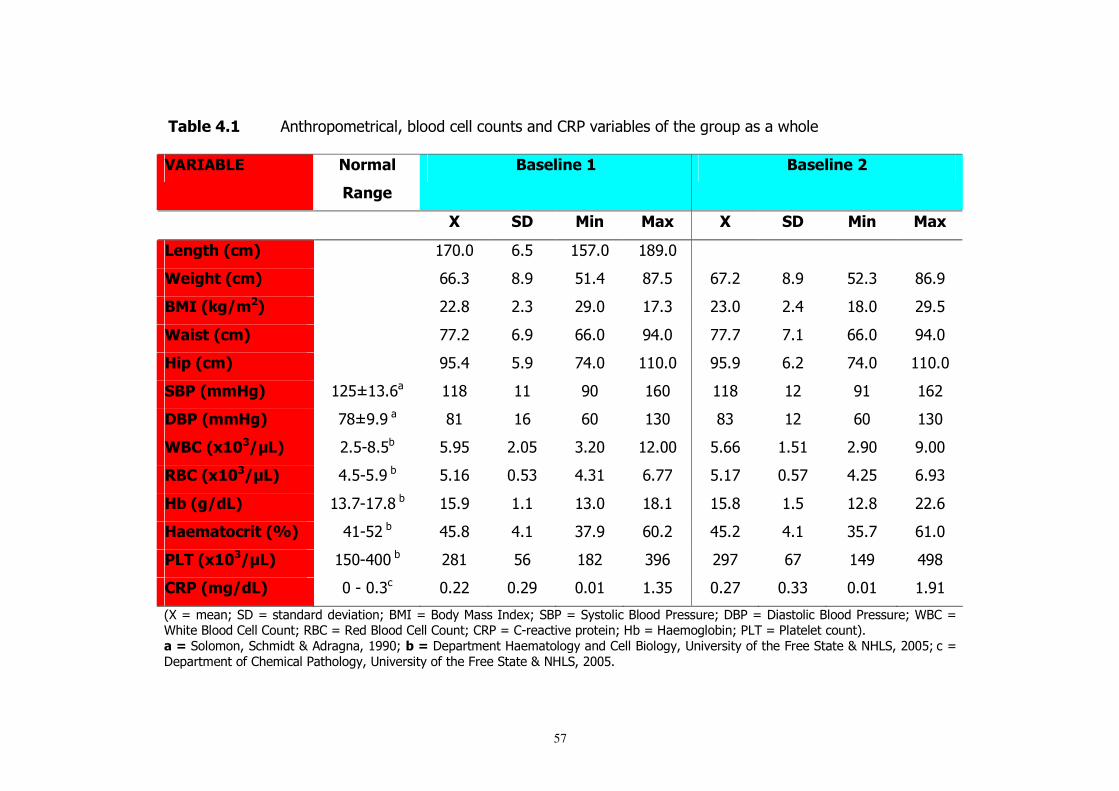
57
�� ������ � ����������������������������� ��� ��������������������������������������
��������� �������
������
���������� ����������
� � �� ��� ���� �� � �� ��� ���� �� �
����!"�#$�%� � !"#"� $#%� %!#"� &'#"� � � � �
&���"!�#$�%� � $$#(� &#'� % #)� &!#%� $!#*� &#'� %*#(� &$#'�
����#'�(�%� � **#&� *#(� *'#"� !#(� *(#"� *#)� &#"� *'#%�
&���!�#$�%� � !!#*� $#'� $$#"� ')#"� !!#!� !# � $$#"� ')#"�
)�*�#$�%� � '%#)� %#'� !)#"� "#"� '%#'� $#*� !)#"� "#"�
��+�#��)�%� *%+ (#$�� &� � '"� $"� &� *� ' � $*�
��+�#��)�%� !&+'#'��� & � $� $"� ("� &(� *� $"� ("�
&�,�# -�(.�%� *#%,&#%�� %#'%� *#"%� (#*"� *#""� %#$$� #% � *#'"� '#""�
��,�# -�(.�%� )#%,%#'��� %# $� "#%(� )#( � $#!!� %# !� "#%!� )#*%� $#'(�
) �#�(/�%� (#!, !#&��� %#'� # � (#"� &# � %#&� #%� *#&� **#$�
)����!�$��!�#0 %� ) ,%*��� )%#&� )# � (!#'� $"#*� )%#*� )# � (%#!� $ #"�
+���# -�(.�%� %",)""��� *& � %$� &*� ('$� *'!� $!� )'� )'&�
,�+�#��(/�%� "�,�"#(�� "#**� "#*'� "#" � #(%� "#*!� "#((� "#" � #' �
-.�/���� 0��1�/��� ������������� 0�2�3�/�2�������3 ��40��2��/���������2����������0�12��/�1��������2����������0�52��/�5�����2������������ �0��2��/�����2������������ �0�����/��,��������������� 0�6��/�6��������� 0��7��/������������ �8#�
��1������� ����������9������ ��� ''"0� �1�1������� ��6������������ �������2��������: ���������������;����������9�<67���*""%0���/�
1������� �������������������������: ���������������;����������9�<67���*""%#�
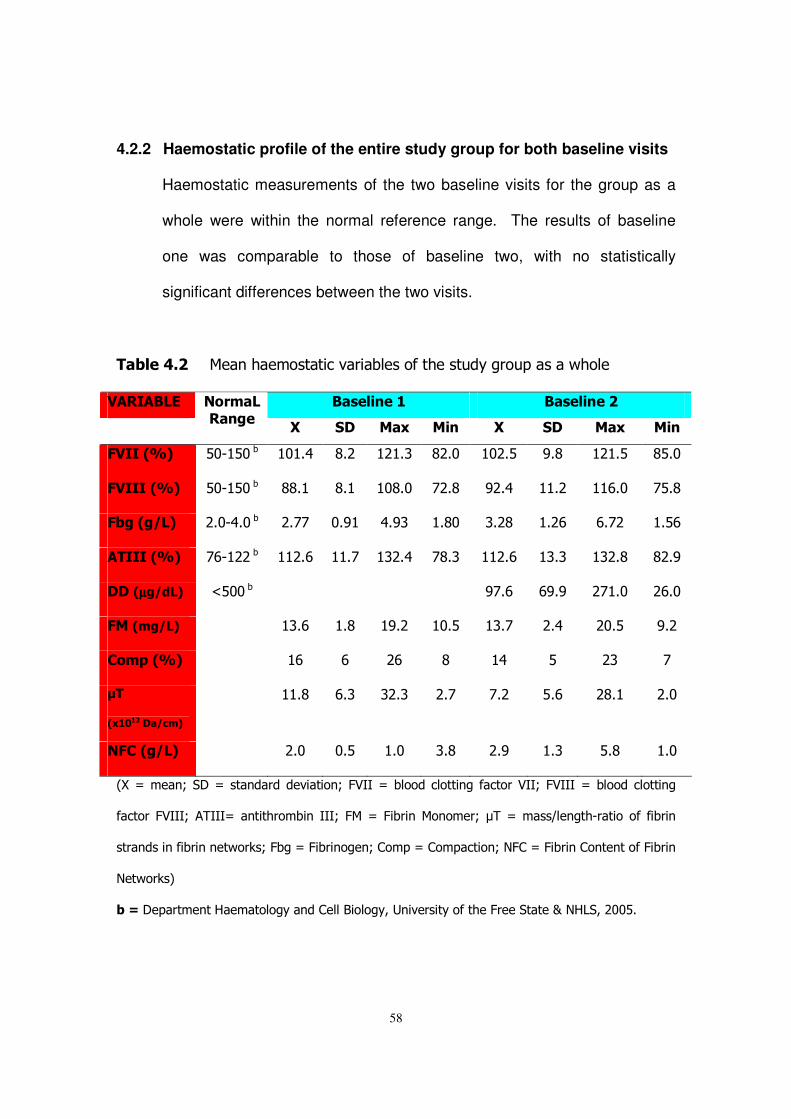
58
4.2.2 Haemostatic profile of the entire study group for both baseline visits
Haemostatic measurements of the two baseline visits for the group as a
whole were within the normal reference range. The results of baseline
one was comparable to those of baseline two, with no statistically
significant differences between the two visits.
�� ������ ��� ��������������������������������������������������������� ���������� ����������
�
������������
�� ��� �� � ���� �� ��� �� � ����
2����#0 %� %", %"��� " #)� &#*� * #(� &*#"� "*#%� '#&� * #%� &%#"�
2�����#0 %� %", %"��� &&# � &# � "&#"� !*#&� '*#)� #*� $#"� !%#&�
2 ��#�(�%� *#",)#"��� *#!!� "#' � )#'(� #&"� (#*&� #*$� $#!*� #%$�
������#0 %� !$, **��� *#$� #!� (*#)� !&#(� *#$� (#(� (*#&� &*#'�
���#µµµµ�(/�%� =%""��� � � � � '!#$� $'#'� *! #"� *$#"�
2��#��(�%� � (#$� #&� '#*� "#%� (#!� *#)� *"#%� '#*�
,��*�#0 %� � $� $� *$� &� )� %� *(� !�
.���
# -���($�%�
� #&� $#(� (*#(� *#!� !#*� %#$� *&# � *#"�
�2,�#�(�%� � *#"� "#%� #"� (#&� *#'� #(� %#&� #"�
-.�/���� 0��1�/��� ������������� 0�;>33�/������������� ���������>330�;>333�/������������� ��
�������;>3330���333/�� ��������� �3330�;��/�;���� ��� ����0�?��/���@�� ���,�������������� �
��� ��� ������ � �����A0�;���/�;���� ��� 0������/���������� 0�<;��/�;���� ��� �� �����;���� �
<�����A8�
�1�1������� ��6������������ �������2��������: ���������������;����������9�<67���*""%#�
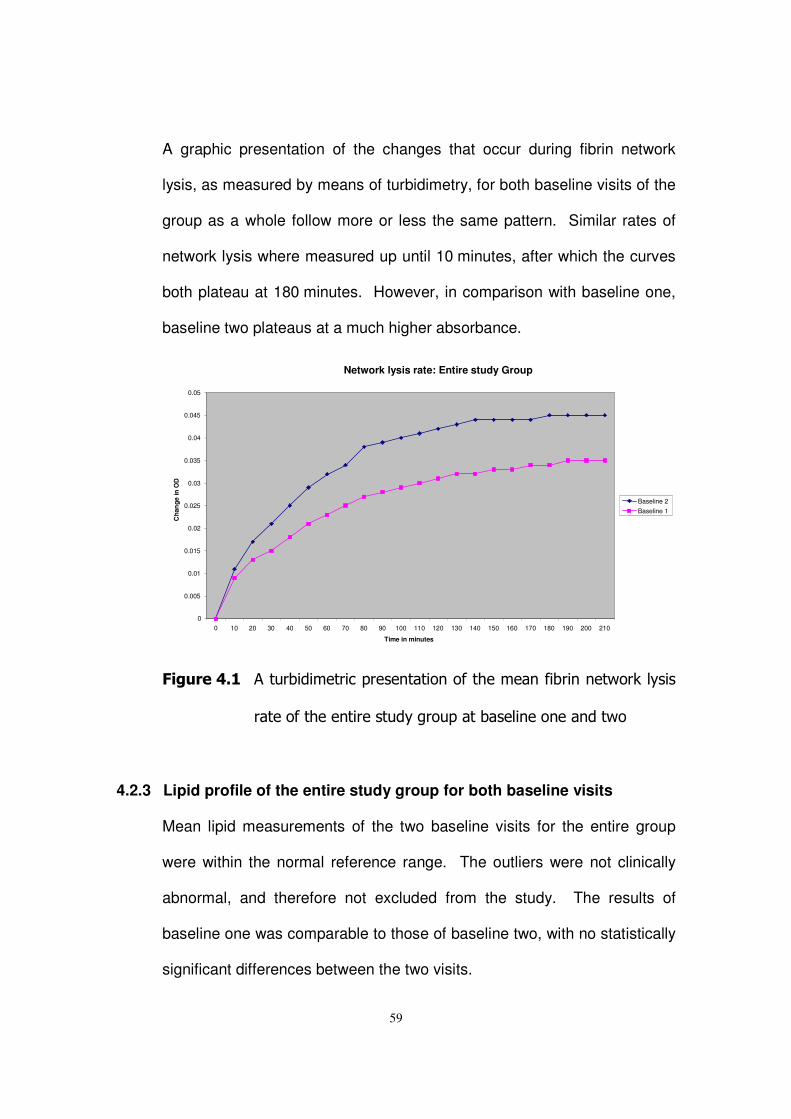
59
A graphic presentation of the changes that occur during fibrin network
lysis, as measured by means of turbidimetry, for both baseline visits of the
group as a whole follow more or less the same pattern. Similar rates of
network lysis where measured up until 10 minutes, after which the curves
both plateau at 180 minutes. However, in comparison with baseline one,
baseline two plateaus at a much higher absorbance.
�
2��3������ ������������������� ����� ����������� ������ � �����A�����
������������� ���������������������� ��� ��� ������
�
4.2.3 Lipid profile of the entire study group for both baseline visits
Mean lipid measurements of the two baseline visits for the entire group
were within the normal reference range. The outliers were not clinically
abnormal, and therefore not excluded from the study. The results of
baseline one was comparable to those of baseline two, with no statistically
significant differences between the two visits.
Network lysis rate: Entire study Group
0
0.005
0.01
0.015
0.02
0.025
0.03
0.035
0.04
0.045
0.05
0 10 20 30 40 50 60 70 80 90 100 110 120 130 140 150 160 170 180 190 200 210 Time in minutes
Cha
nge
in O
D
Baseline 2 Baseline 1
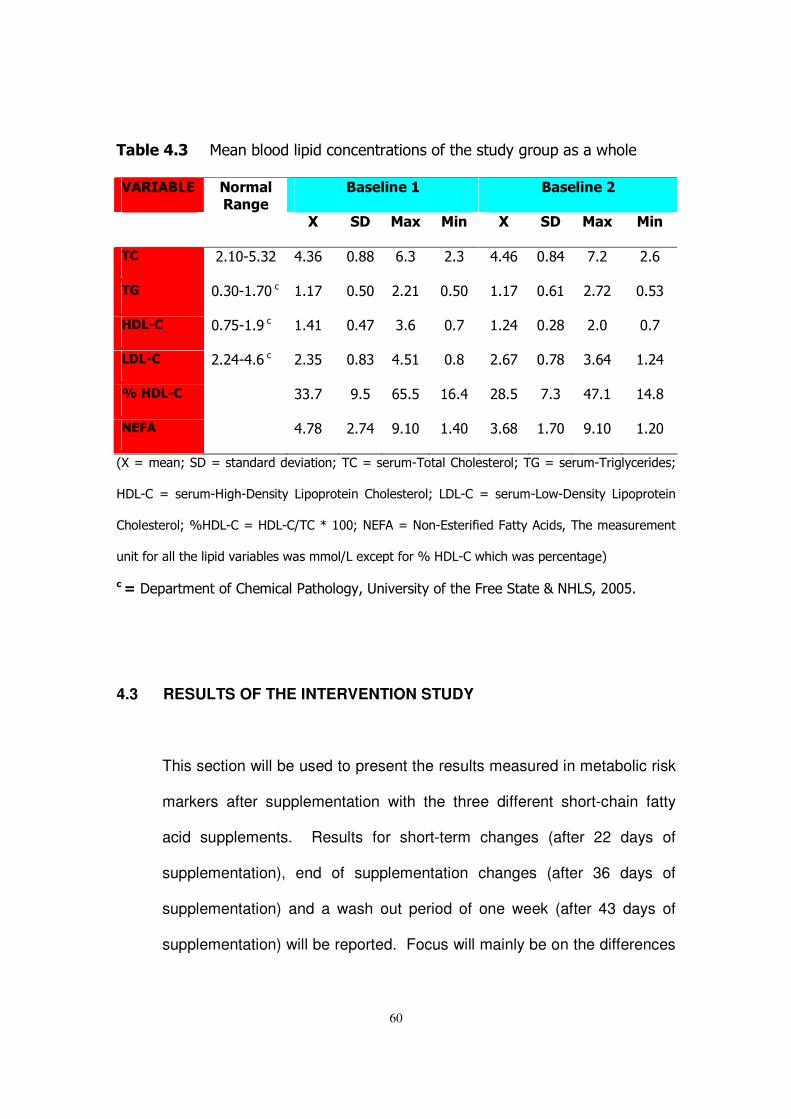
60
�� ������� ��� ��������������� �� ������ ���������������������������
��������� ���������� ����������
�
�������������
�� ��� �� � ���� �� ��� �� � ����
�,�� *# ",%#(*�� )#($� "#&&� $#(� *#(� )#)$� "#&)� !#*� *#$�
�4� "#(", #!"��� # !� "#%"� *#* � "#%"� # !� "#$ � *#!*� "#%(�
)��5,� "#!%, #'��� #) � "#)!� (#$� "#!� #*)� "#*&� *#"� "#!�
���5,�� *#*),)#$��� *#(%� "#&(� )#% � "#&� *#$!� "#!&� (#$)� #*)�
0 �)��5,�� � ((#!� '#%� $%#%� $#)� *&#%� !#(� )!# � )#&�
��2��� � )#!&� *#!)� '# "� #)"� (#$&� #!"� '# "� #*"�
-.�/���� 0��1�/��� ������������� 0����/����,����������������0��B�/����,������������0�
617,��/����,6���,1� ����7��������� �����������0�717,��/����,7��,1� ����7��������� �
����������0�C617,��/�617,�@���D� ""0�<E;��/�<� ,E���������;���������������������� ��
�������������������������������������@7��4���������C�617,���������������� ����8�
$�1�1������� �������������������������: ���������������;����������9�<67���*""%#�
4.3 RESULTS OF THE INTERVENTION STUDY
This section will be used to present the results measured in metabolic risk
markers after supplementation with the three different short-chain fatty
acid supplements. Results for short-term changes (after 22 days of
supplementation), end of supplementation changes (after 36 days of
supplementation) and a wash out period of one week (after 43 days of
supplementation) will be reported. Focus will mainly be on the differences
61
between day 8 (baseline 2; start of supplementation) and day 36 (end of
supplementation).
4.3.1 The Placebo Supplement Intervention Study Results
The group consumed a placebo for the entire study period. This group
was composed of 25 volunteers but only 21 volunteers' results were used.
The other four subjects’ results were excluded because some of the visits’
haemostatic specimens were clotted.
4.3.1.1 Mean changes in the general health profile of the placebo supplement
study group
No significant changes were measured in any of the general health
indicators from day 8 (start of supplementation phase) to day 36 (end of
supplementation phase) within the placebo supplement group.
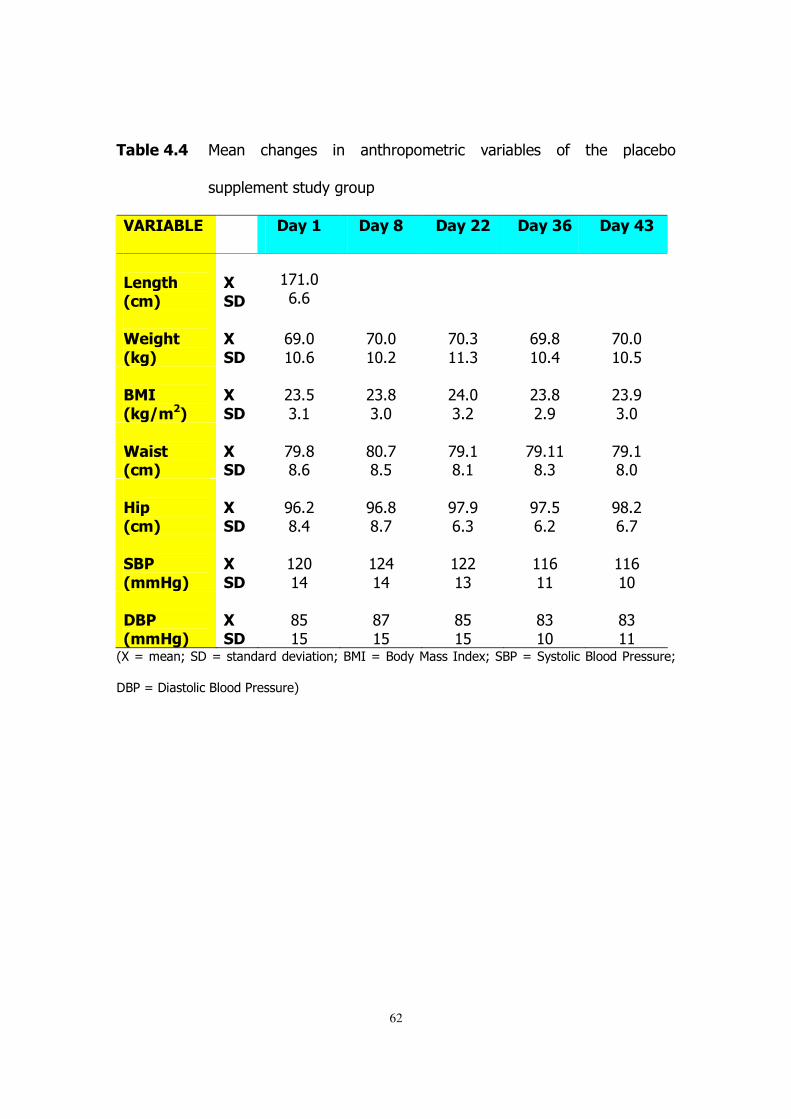
62
�� ������� ��� � ��� ��� � � � ������������� ��������� ��� ���� ��������
������ �����������
��������� � ��6�� ��6�7� ��6�� ��6��8� ��6����
�
����!"�#$�%�
�
�����
�
! #"�$#$�
��
� � �
�&���"!�
#'�%�
���
���
�$'#"� "#$�
�!"#"� "#*�
�!"#(� #(�
�$'#&� "#)�
�!"#"� "#%�
�����
#'�(�%�
���
���
�*(#%�(# �
�*(#&�(#"�
�*)#"�(#*�
�*(#&�*#'�
�*(#'�(#"�
�
&���!�#$�%�
�
�����
�!'#&�&#$�
�&"#!�&#%�
�!'# �&# �
�!'# �&#(�
�!'# �&#"�
�
)�*�#$�%�
�
�����
�'$#*�&#)�
�'$#&�&#!�
�'!#'�$#(�
�'!#%�$#*�
�'&#*�$#!�
���+�
#��)�%�
���
���
� *"� )�
� *)� )�
� **� (�
� $� �
� $� "�
�
��+�#��)�%�
�
�����
�&%� %�
�&!� %�
�&%� %�
�&(� "�
�&(� �
-.�/���� 0��1�/��� ������������� 0�2�3�/�2�������3 ��40��2��/���������2����������0�
12��/�1��������2����������8�
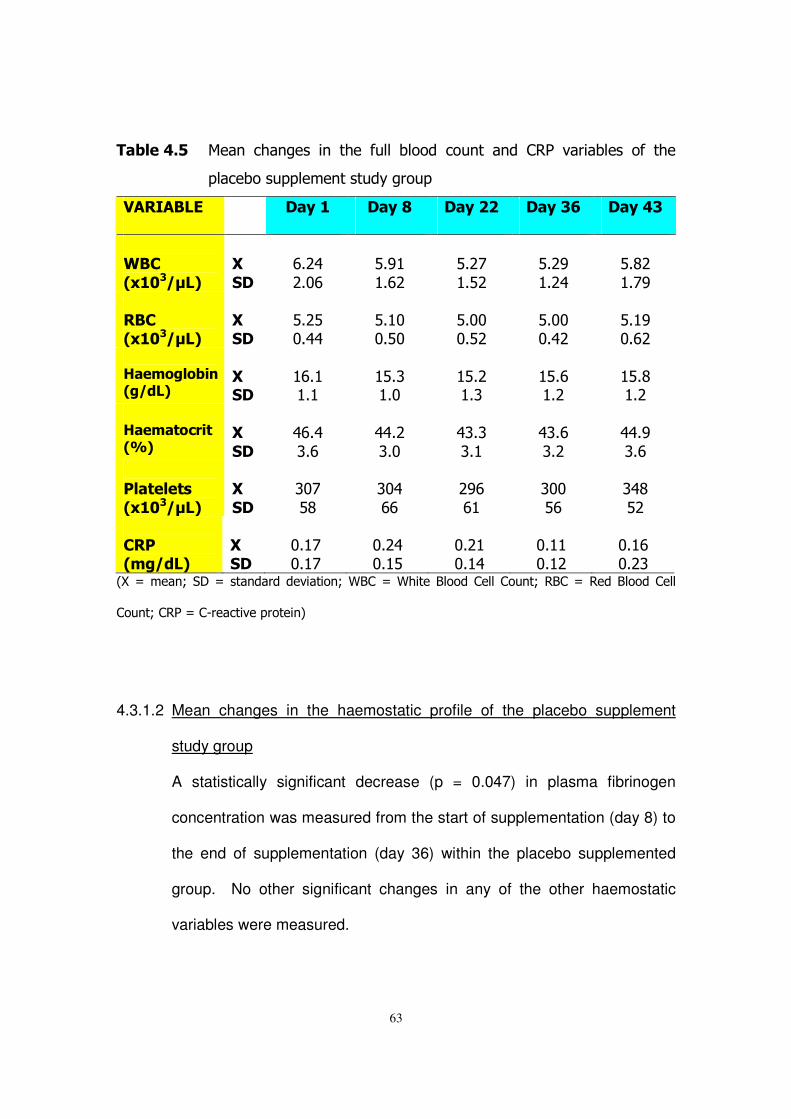
63
�� ������� ��� � ��� ��� � � ���� ���� ������ �� �� � �� ������������� ��� ����
�������������� �����������
��������� � ��6�� ��6�7� ��6�� ��6��8� ��6����
�&�,�
# -�(.�%�
���
���
�$#*)�*#"$�
�%#' � #$*�
�%#*!� #%*�
�%#*'� #*)�
�%#&*� #!'�
�
��,�# -�(.�%�
�
�����
�%#*%�"#))�
�%# "�"#%"�
�%#""�"#%*�
�%#""�"#)*�
�%# '�"#$*�
�)������� ���#�(/�%�
�
�����
� $# � # �
� %#(� #"�
� %#*� #(�
� %#$� #*�
� %#&� #*�
�)����!�$��!�#0 %�
�
��
���
�)$#)�(#$�
�))#*�(#"�
�)(#(�(# �
�)(#$�(#*�
�))#'�(#$�
�
+��!���!��
# -�(.�%�
�
��
���
�("!�%&�
�(")�$$�
�*'$�$ �
�(""�%$�
�()&�%*�
�
,�+�#��(/�%�
�
�����
�"# !�"# !�
�"#*)�"# %�
�"#* �"# )�
�"# �"# *�
�"# $�"#*(�
-.�/���� 0��1�/��� ������������� 0�52��/�5�����2������������ �0��2��/�����2����������
�� �0�����/��,��������������� 8�
�
�
4.3.1.2 Mean changes in the haemostatic profile of the placebo supplement
study group
A statistically significant decrease (p = 0.047) in plasma fibrinogen
concentration was measured from the start of supplementation (day 8) to
the end of supplementation (day 36) within the placebo supplemented
group. No other significant changes in any of the other haemostatic
variables were measured.
�
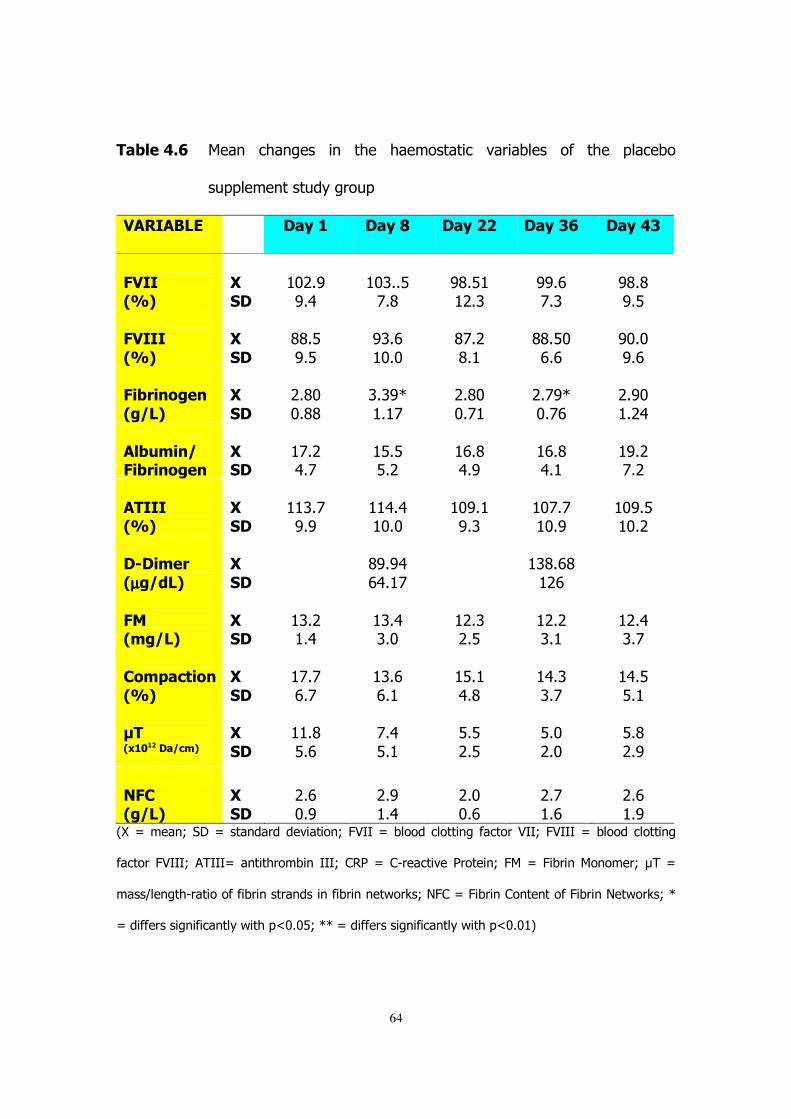
64
�� �����8� ��� � ��� ��� � � ���� ����������� ��������� ��� ���� ��������
������ �����������
��������� � ��6�� ��6�7� ��6�� ��6��8� ��6����
�
2����#0 %�
�
�����
� "*#'�'#)�
� "(##%�!#&�
�'&#% � *#(�
�''#$�!#(�
�'&#&�'#%�
�2�����
#0 %�
���
���
�&&#%�'#%�
�'(#$� "#"�
�&!#*�&# �
�&&#%"�$#$�
�'"#"�'#$�
�2� ��������
#�(�%�
���
���
�*#&"�"#&&�
�(#('D� # !�
�*#&"�"#! �
�*#!'D�"#!$�
�*#'"� #*)�
�
�� 3���(�2� ��������
�
�����
� !#*�)#!�
� %#%�%#*�
� $#&�)#'�
� $#&�)# �
� '#*�!#*�
�
������#0 %�
�
�����
� (#!�'#'�
� )#)� "#"�
� "'# �'#(�
� "!#!� "#'�
� "'#%� "#*�
��5������
#µµµµ�(/�%�
���
���
� �&'#')�$)# !�
� � (&#$&� *$�
�
�
2��#��(�%�
�
�����
� (#*� #)�
� (#)�(#"�
� *#(�*#%�
� *#*�(# �
� *#)�(#!�
�
,��*�$!����
#0 %�
�
��
���
� !#!�$#!�
� (#$�$# �
� %# �)#&�
� )#(�(#!�
� )#%�%# �
�.��# -���($�%��
���
���
� #&�%#$�
�!#)�%# �
�%#%�*#%�
�%#"�*#"�
�%#&�*#'�
��2,�#�(�%�
������
�*#$�"#'�
�*#'� #)�
�*#"�"#$�
�*#!� #$�
�*#$� #'�
-.�/���� 0��1�/��� ������������� 0�;>33�/������������� ���������>330�;>333�/������������� ��
�������;>3330���333/�� ��������� �3330�����/��,��������������� 0�;��/�;���� ��� ����0�?��/�
��@�� ���,�������������� ���� ��� ������ � �����A0�<;��/�;���� ��� �� �����;���� �<�����A0�D�
/���������� ����� ����������="#"%0�DD�/���������� ����� ����������="#" 8�
�
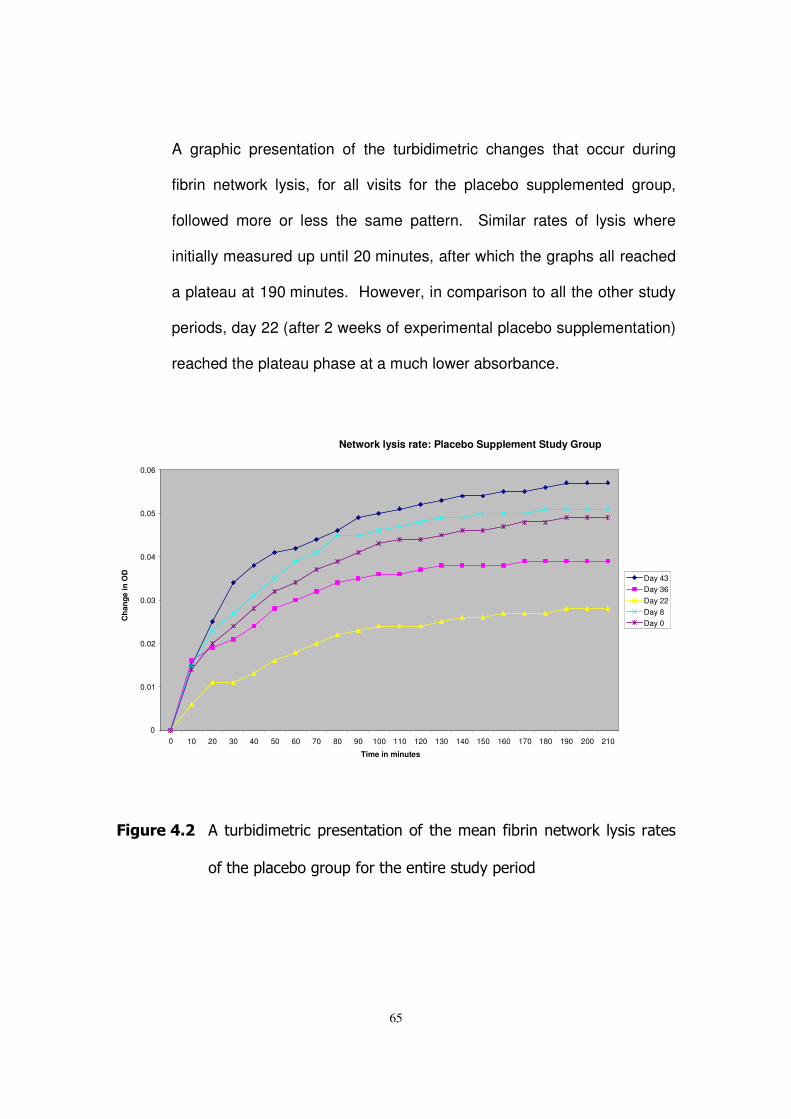
65
A graphic presentation of the turbidimetric changes that occur during
fibrin network lysis, for all visits for the placebo supplemented group,
followed more or less the same pattern. Similar rates of lysis where
initially measured up until 20 minutes, after which the graphs all reached
a plateau at 190 minutes. However, in comparison to all the other study
periods, day 22 (after 2 weeks of experimental placebo supplementation)
reached the plateau phase at a much lower absorbance.
�
�
2��3������ ������������������� ����� ����������� ������ � �����A� ���������
����������������������������� ����������������
Network lysis rate: Placebo Supplement Study Group
0
0.01
0.02
0.03
0.04
0.05
0.06
0 10 20 30 40 50 60 70 80 90 100 110 120 130 140 150 160 170 180 190 200 210 Time in minutes
Cha
nge
in O
D
Day 43 Day 36 Day 22 Day 8 Day 0
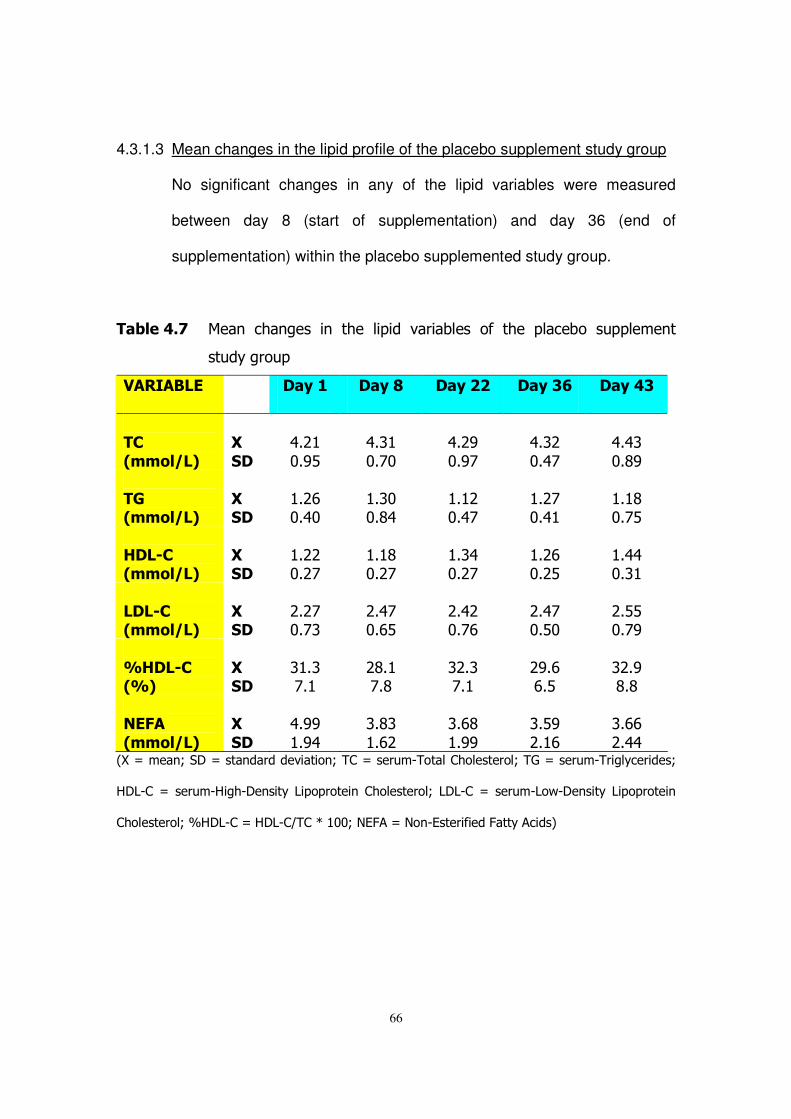
66
4.3.1.3 Mean changes in the lipid profile of the placebo supplement study group
No significant changes in any of the lipid variables were measured
between day 8 (start of supplementation) and day 36 (end of
supplementation) within the placebo supplemented study group.
�� �����9� ��� � ��� ��� � � ���� ������ ��������� ��� ���� �������� ������ ��
���������
��������� � ��6�� ��6�7� ��6�� ��6��8� ��6����
��,�
#����(�%�
���
���
�)#* �"#'%�
�)#( �"#!"�
�)#*'�"#'!�
�)#(*�"#)!�
�)#)(�"#&'�
��4�#����(�%�
������
� #*$�"#)"�
� #("�"#&)�
� # *�"#)!�
� #*!�"#) �
� # &�"#!%�
�
)��5,�#����(�%�
�
�����
� #**�"#*!�
� # &�"#*!�
� #()�"#*!�
� #*$�"#*%�
� #))�"#( �
�
���5,�#����(�%�
�
�����
�*#*!�"#!(�
�*#)!�"#$%�
�*#)*�"#!$�
�*#)!�"#%"�
�*#%%�"#!'�
�
0)��5,�#0 %�
�
�����
�( #(�!# �
�*&# �!#&�
�(*#(�!# �
�*'#$�$#%�
�(*#'�&#&�
�
��2��
#����(�%�
�
��
���
�)#''� #')�
�(#&(� #$*�
�(#$&� #''�
�(#%'�*# $�
�(#$$�*#))�
-.�/���� 0��1�/��� ������������� 0����/����,����������������0��B�/����,������������0�
617,��/����,6���,1� ����7��������� �����������0�717,��/����,7��,1� ����7��������� �
����������0�C617,��/�617,�@���D� ""0�<E;��/�<� ,E���������;���������8�
�
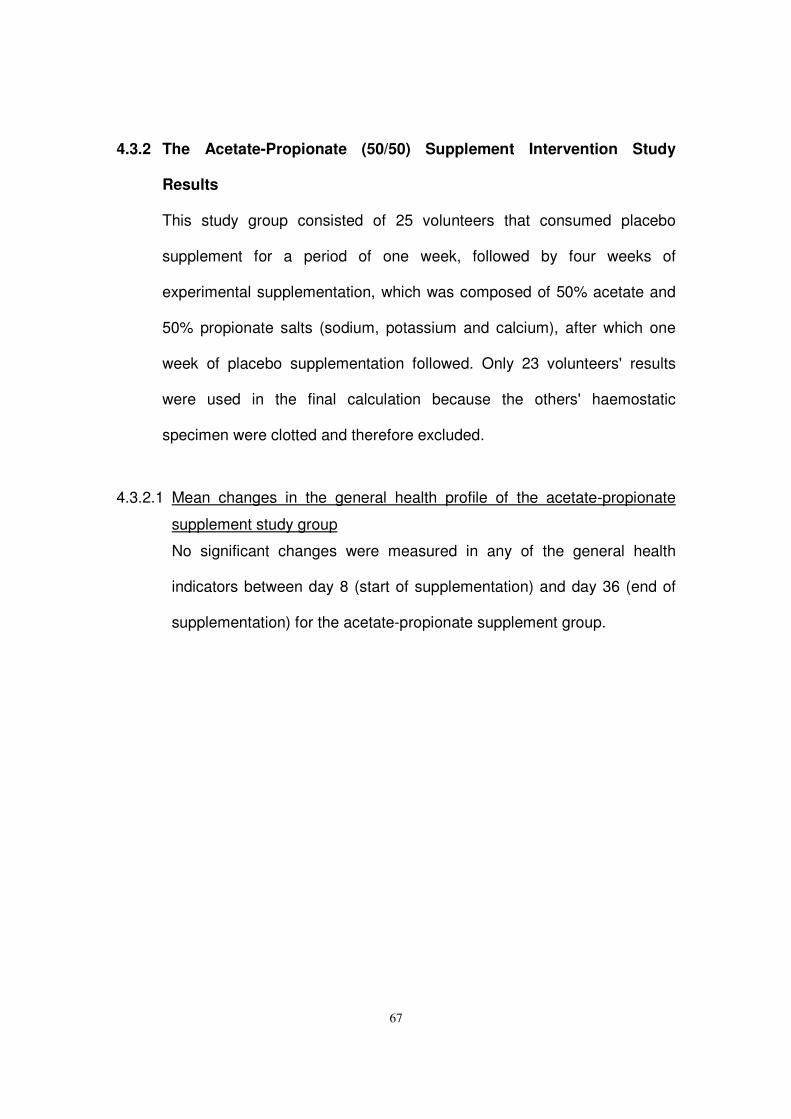
67
4.3.2 The Acetate-Propionate (50/50) Supplement Intervention Study
Results
This study group consisted of 25 volunteers that consumed placebo
supplement for a period of one week, followed by four weeks of
experimental supplementation, which was composed of 50% acetate and
50% propionate salts (sodium, potassium and calcium), after which one
week of placebo supplementation followed. Only 23 volunteers' results
were used in the final calculation because the others' haemostatic
specimen were clotted and therefore excluded.
4.3.2.1 Mean changes in the general health profile of the acetate-propionate
supplement study group
No significant changes were measured in any of the general health
indicators between day 8 (start of supplementation) and day 36 (end of
supplementation) for the acetate-propionate supplement group.
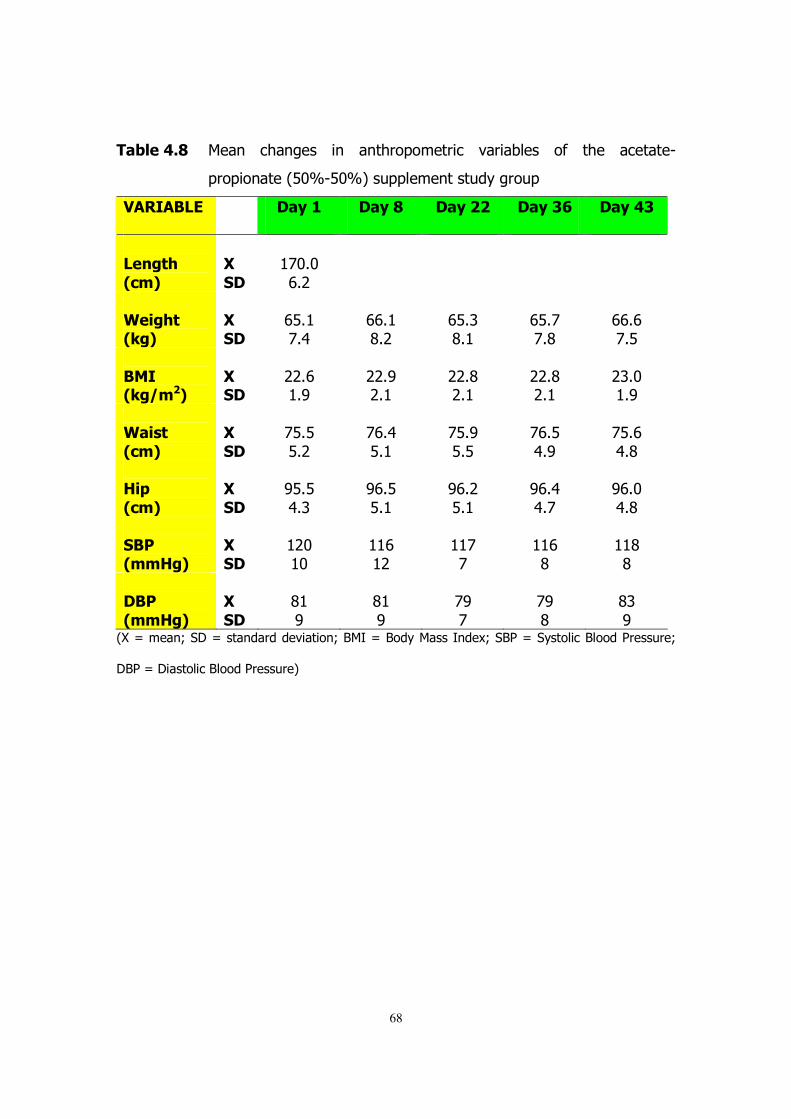
68
�� �����7� ��� � ��� ��� � � � ������������� ��������� ��� ���� �������,
������ ����-%"C,%"C8������� �����������
��������� � ��6�� ��6�7� ��6�� ��6��8� ��6����
�����!"�
#$�%�
���
���
� !"#"�$#*�
� � � �
�
&���"!�#'�%�
�
�����
�$%# �!#)�
�$$# �&#*�
�$%#(�&# �
�$%#!�!#&�
�$$#$�!#%�
�
����#'�(�%�
�
�����
�**#$� #'�
�**#'�*# �
�**#&�*# �
�**#&�*# �
�*(#"� #'�
�
&���!�
#$�%�
�
��
���
�!%#%�%#*�
�!$#)�%# �
�!%#'�%#%�
�!$#%�)#'�
�!%#$�)#&�
�
)�*�
#$�%�
�
��
���
�'%#%�)#(�
�'$#%�%# �
�'$#*�%# �
�'$#)�)#!�
�'$#"�)#&�
�
��+�#��)�%�
�
�����
� *"� "�
� $� *�
� !�!�
� $�&�
� &�&�
���+�
#��)�%�
���
���
�& �'�
�& �'�
�!'�!�
�!'�&�
�&(�'�
-.�/���� 0��1�/��� ������������� 0�2�3�/�2�������3 ��40��2��/���������2����������0�
12��/�1��������2����������8�
69
�� �����:� ��� ���� ���� ����������������� ��� �������� �� ������ ��������
�������,������ ����-%"C,%"C8������� �����������
��������� � ��6�� ��6�7� ��6�� ��6��8� ��6����
�
&�,�# -�(.�%�
�
�����
�%#'$�*#)!�
�%#!&� #)*�
�%#&'� #("�
�%#&&� #$(�
�%#$%� #)(�
���,�
# -�(.�%�
���
���
�%#((�"#$%�
�%#(*�"#$(�
�%# !�"#)'�
�%#((�"#%)�
�%#*(�"#%$�
�)������� ���#�(/�%�
���
���
� $#*� #*�
� $# � #'�
� %#%� #(�
� %#!� #*�
� %#$� #%�
�)����!�$��!�#0 %�
�
�����
�)!#(�%#"�
�)$# �%#)�
�))#)�)#(�
�)%#$�)#)�
�))#&�)#%�
�
+��!���!��# -�(.�%�
�
�����
�*$)�%"�
�(" �!'�
�*&*�&%�
�(( �&(�
�()"�'"�
�,�+�
#��(/�%�
���
���
�"#*(�"#*'�
�"#*%�"#*&�
�"#*&�"#*)�
�"#*!�"#)'�
�"# %�"# &�
-.�/���� 0��1�/��� ������������� 0�52��/�5�����2������������ �0��2��/�����2����������
�� �0�����/��,��������������� 8�
�
�
4.3.2.2 Mean changes in the haemostatic profile of the acetate-propionate
supplement study group
A statistically significant decrease in plasma factor VIII (p=0.016),
antithrombin III (p<0.001), and an increase in plasma fibrinogen
concentration (p=0.048) and the albumin/fibrinogen ratio (p=0.044), was
measured between day 8 and day 36 within the acetate-propionate
supplementation group. No other changes in any of the other
haemostatic variables were significant.
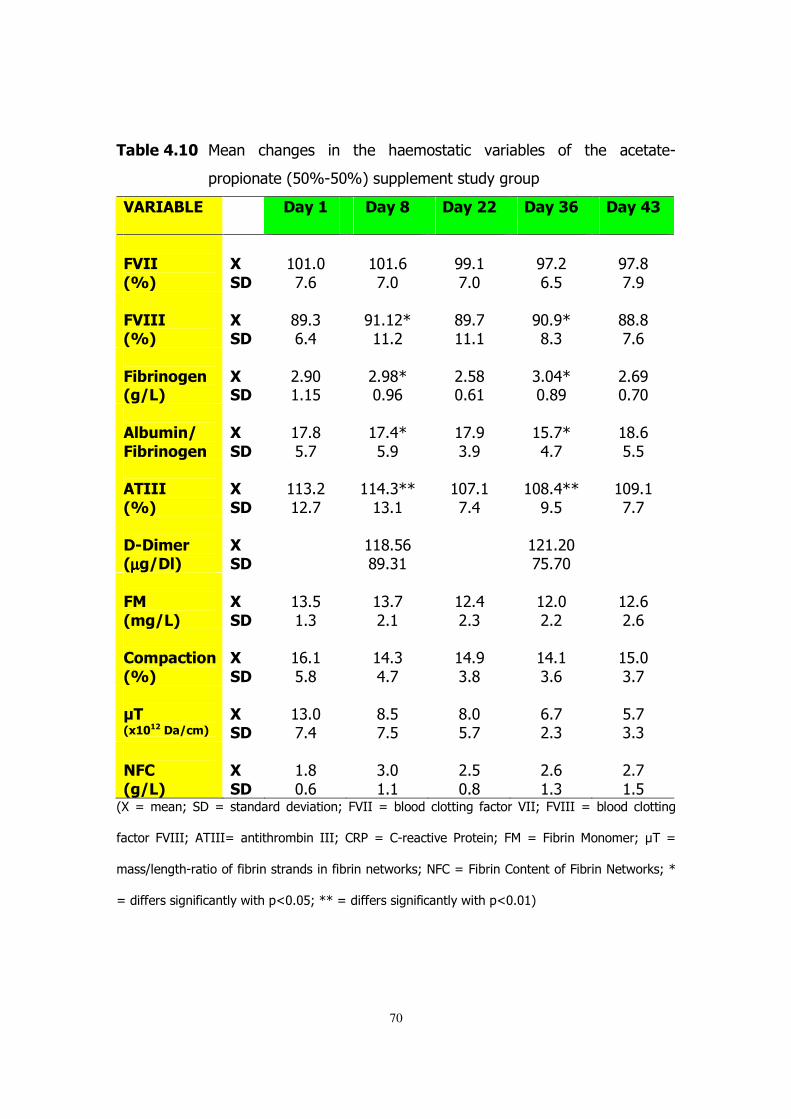
70
�� �����-� ��� � ��� ��� � � ���� ����������� ��������� ��� ���� �������,
������ ����-%"C,%"C8������� �����������
��������� � ��6�� ��6�7� ��6�� ��6��8� ��6����
�2����
#0 %�
���
���
� " #"�!#$�
� " #$�!#"�
�''# �!#"�
�'!#*�$#%�
�'!#&�!#'�
�
2�����#0 %�
�
�����
�&'#(�$#)�
�' # *D� #*�
�&'#!� # �
�'"#'D�&#(�
�&&#&�!#$�
�
2� ��������#�(�%�
�
�����
�*#'"� # %�
�*#'&D�"#'$�
�*#%&�"#$ �
�(#")D�"#&'�
�*#$'�"#!"�
�
�� 3���(�
2� ��������
�
��
���
� !#&�%#!�
� !#)D�%#'�
� !#'�(#'�
� %#!D�)#!�
� &#$�%#%�
�
������
#0 %�
�
��
���
� (#*� *#!�
� )#(DD� (# �
� "!# �!#)�
� "&#)DD�'#%�
� "'# �!#!�
�
�5������#µµµµ�(��%�
�
�����
��
� &#%$�&'#( �
� � * #*"�!%#!"�
�
�
2��
#��(�%�
�
��
���
� (#%� #(�
� (#!�*# �
� *#)�*#(�
� *#"�*#*�
� *#$�*#$�
�
,��*�$!����
#0 %�
�
��
���
� $# �%#&�
� )#(�)#!�
� )#'�(#&�
� )# �(#$�
� %#"�(#!�
�.��# -���($�%�
������
� (#"�!#)�
�&#%�!#%�
�&#"�%#!�
�$#!�*#(�
�%#!�(#(�
��2,�
#�(�%�
���
���
� #&�"#$�
�(#"� # �
�*#%�"#&�
�*#$� #(�
�*#!� #%�
-.�/���� 0��1�/��� ������������� 0�;>33�/������������� ���������>330�;>333�/������������� ��
�������;>3330���333/�� ��������� �3330�����/��,��������������� 0�;��/�;���� ��� ����0�?��/�
��@�� ���,�������������� ���� ��� ������ � �����A0�<;��/�;���� ��� �� �����;���� �<�����A0�D�
/���������� ����� ����������="#"%0�DD�/���������� ����� ����������="#" 8�
�
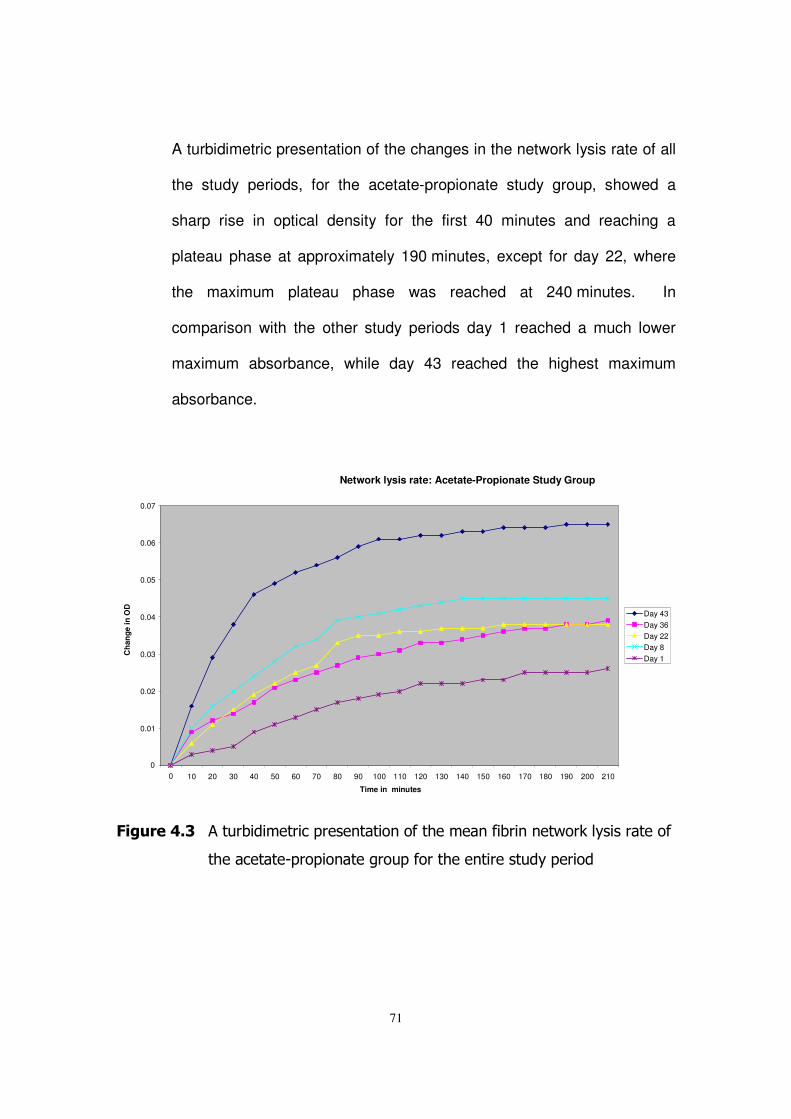
71
A turbidimetric presentation of the changes in the network lysis rate of all
the study periods, for the acetate-propionate study group, showed a
sharp rise in optical density for the first 40 minutes and reaching a
plateau phase at approximately 190 minutes, except for day 22, where
the maximum plateau phase was reached at 240 minutes. In
comparison with the other study periods day 1 reached a much lower
maximum absorbance, while day 43 reached the highest maximum
absorbance.
�
2��3������� ������������������� ����� ����������� ������ � �����A�������������
�����������,������ ������������������ ����������������
�
�
Network lysis rate: Acetate-Propionate Study Group
0
0.01
0.02
0.03
0.04
0.05
0.06
0.07
0 10 20 30 40 50 60 70 80 90 100 110 120 130 140 150 160 170 180 190 200 210 Time in minutes
Cha
nge
in O
D
Day 43 Day 36 Day 22 Day 8 Day 1
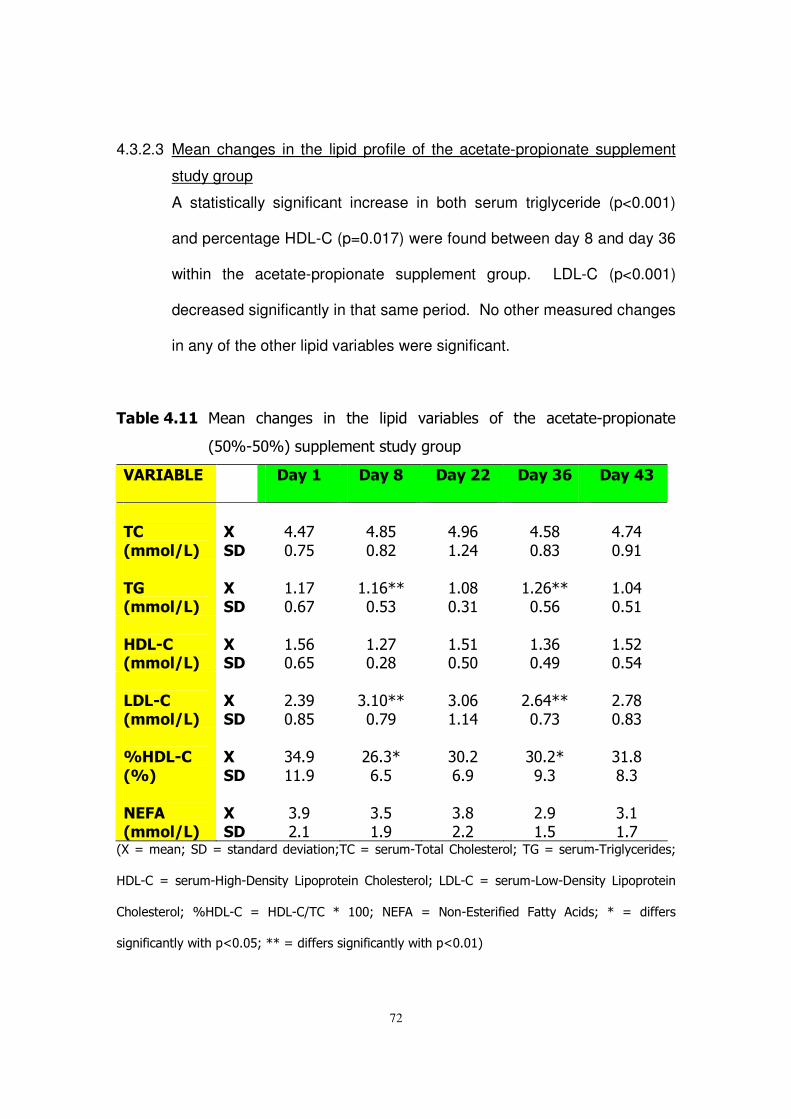
72
4.3.2.3 Mean changes in the lipid profile of the acetate-propionate supplement
study group
A statistically significant increase in both serum triglyceride (p<0.001)
and percentage HDL-C (p=0.017) were found between day 8 and day 36
within the acetate-propionate supplement group. LDL-C (p<0.001)
decreased significantly in that same period. No other measured changes
in any of the other lipid variables were significant.
�� ������ ��� � ��� ��� � � ���� ������ ��������� ��� ���� �������,������ ����
-%"C,%"C8������� �����������
��������� � ��6�� ��6�7� ��6�� ��6��8� ��6����
��,�
#����(�%�
���
���
�)#)!�"#!%�
�)#&%�"#&*�
�)#'$� #*)�
�)#%&�"#&(�
�)#!)�"#' �
�
�4�#����(�%�
�
�����
� # !�"#$!�
� # $DD�"#%(�
� #"&�"#( �
� #*$DD�"#%$�
� #")�"#% �
�
)��5,�#����(�%�
�
�����
� #%$�"#$%�
� #*!�"#*&�
� #% �"#%"�
� #($�"#)'�
� #%*�"#%)�
�
���5,�#����(�%�
�
�����
�*#('�"#&%�
�(# "DD�"#!'�
�(#"$� # )�
�*#$)DD�"#!(�
�*#!&�"#&(�
�
0)��5,�
#0 %�
�
��
���
�()#'� #'�
�*$#(D�$#%�
�("#*�$#'�
�("#*D�'#(�
�( #&�&#(�
�
��2��#����(�%�
�
�����
�(#'�*# �
�(#%� #'�
�(#&�*#*�
�*#'� #%�
�(# � #!�
-.�/���� 0��1�/��� ������������� 0���/����,����������������0��B�/����,������������0�
617,��/����,6���,1� ����7��������� �����������0�717,��/����,7��,1� ����7��������� �
����������0� C617,�� /� 617,�@��� D� ""0� <E;�� /� <� ,E��������� ;����� ����0� D� /� �������
�� ����� ����������="#"%0�DD�/���������� ����� ����������="#" 8�
73
4.3.3 The High-Acetate Supplement Intervention Study Results
The baseline results of this group were comparable to the results of the
other two groups. The results presented are of 22 of the 25 volunteers,
the other three's haemostatic specimen were clotted. The volunteers also
consumed placebo supplements for a period of at least one week,
followed by four weeks of supplementation, which was composed of 70%
acetate, 15% propionate and 15% butyrate, and ending with a week of
placebo.
4.3.3.1 Mean changes in the general health profile of the high-acetate
supplement study group
No significant changes were measured in any of the general health
indicators between day 8 (start of supplementation) and day 36 (end of
supplementation) for the high acetate supplement group.
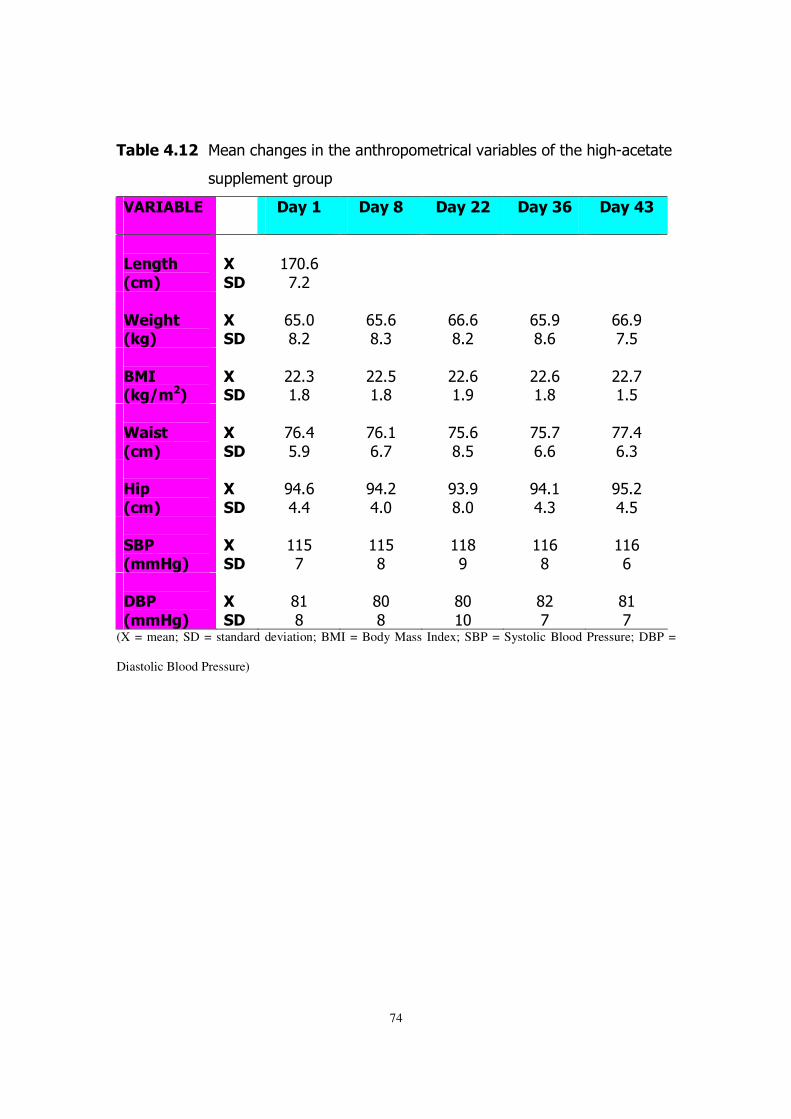
74
�� ������ ��� ���� ���� ������ �����������������������������������,��������
������ �������
��������� � ��6�� ��6�7� ��6�� ��6��8� ��6����
�����!"�
#$�%�
���
���
� !"#$�!#*�
� � � �
�
&���"!�#'�%�
�
�����
�$%#"�&#*�
�$%#$�&#(�
�$$#$�&#*�
�$%#'�&#$�
�$$#'�!#%�
�
����#'�(�%�
�
�����
�**#(� #&�
�**#%� #&�
�**#$� #'�
�**#$� #&�
�**#!� #%�
�
&���!�
#$�%�
�
��
���
�!$#)�%#'�
�!$# �$#!�
�!%#$�&#%�
�!%#!�$#$�
�!!#)�$#(�
�
)�*�
#$�%�
�
��
���
�')#$�)#)�
�')#*�)#"�
�'(#'�&#"�
�')# �)#(�
�'%#*�)#%�
�
��+�#��)�%�
�
�����
� %�!�
� %�&�
� &�'�
� $�&�
� $�$�
���+�
#��)�%�
���
���
�& �&�
�&"�&�
�&"� "�
�&*�!�
�& �!�
(X = mean; SD = standard deviation; BMI = Body Mass Index; SBP = Systolic Blood Pressure; DBP =
Diastolic Blood Pressure)
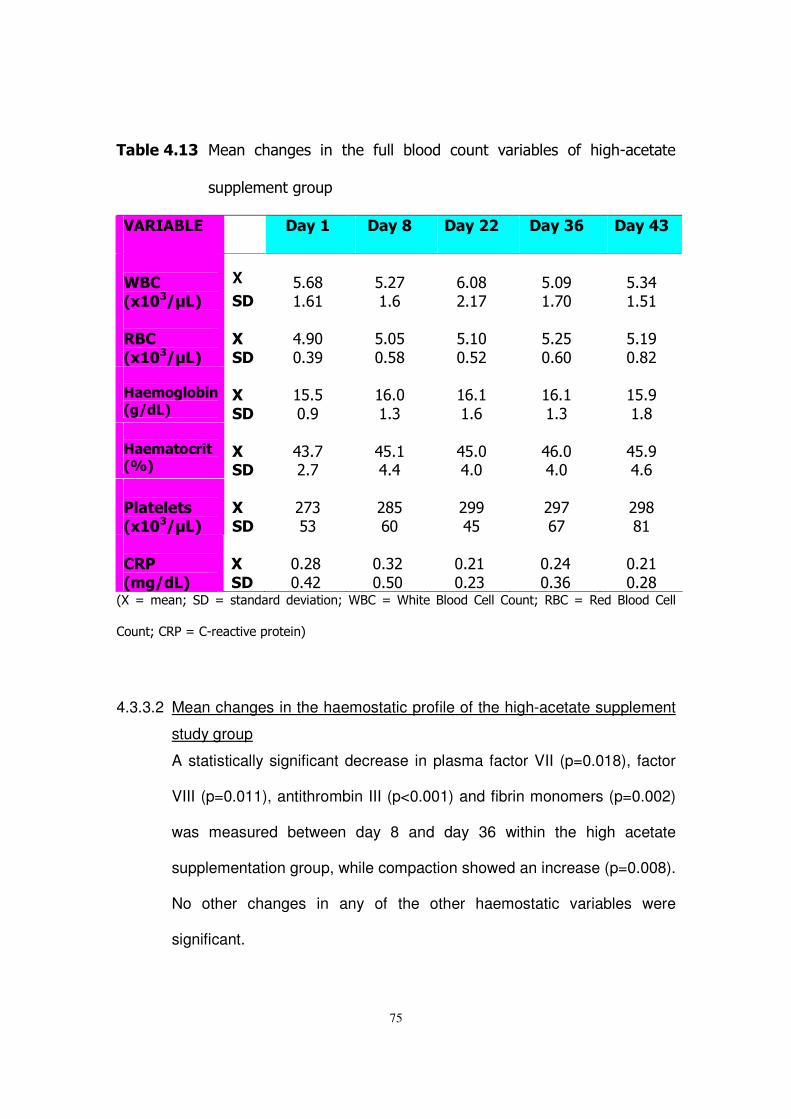
75
�� ������� ��� � ��� ��� � � ���� ���� ������ �� �� ��������� ��� ����,��������
������ �������
��������� � ��6�� ��6�7� ��6�� ��6��8� ��6����
�
&�,�# -�(.�%�
X ���
�%#$&� #$ �
�%#*!� #$�
�$#"&�*# !�
�%#"'� #!"�
�%#()� #% �
���,�
# -�(.�%�
���
���
�)#'"�"#('�
�%#"%�"#%&�
�%# "�"#%*�
�%#*%�"#$"�
�%# '�"#&*�
�)������� ���#�(/�%�
���
���
� %#%�"#'�
� $#"� #(�
� $# � #$�
� $# � #(�
� %#'� #&�
�)����!�$��!�#0 %�
�
�����
�)(#!�*#!�
�)%# �)#)�
�)%#"�)#"�
�)$#"�)#"�
�)%#'�)#$�
�
+��!���!��# -�(.�%�
�
�����
�*!(�%(�
�*&%�$"�
�*''�)%�
�*'!�$!�
�*'&�& �
�,�+�
#��(/�%�
���
���
�"#*&�"#)*�
�"#(*�"#%"�
�"#* �"#*(�
�"#*)�"#($�
�"#* �"#*&�
-.�/���� 0��1�/��� ������������� 0�52��/�5�����2������������ �0��2��/�����2����������
�� �0�����/��,��������������� 8�
4.3.3.2 Mean changes in the haemostatic profile of the high-acetate supplement
study group
A statistically significant decrease in plasma factor VII (p=0.018), factor
VIII (p=0.011), antithrombin III (p<0.001) and fibrin monomers (p=0.002)
was measured between day 8 and day 36 within the high acetate
supplementation group, while compaction showed an increase (p=0.008).
No other changes in any of the other haemostatic variables were
significant.
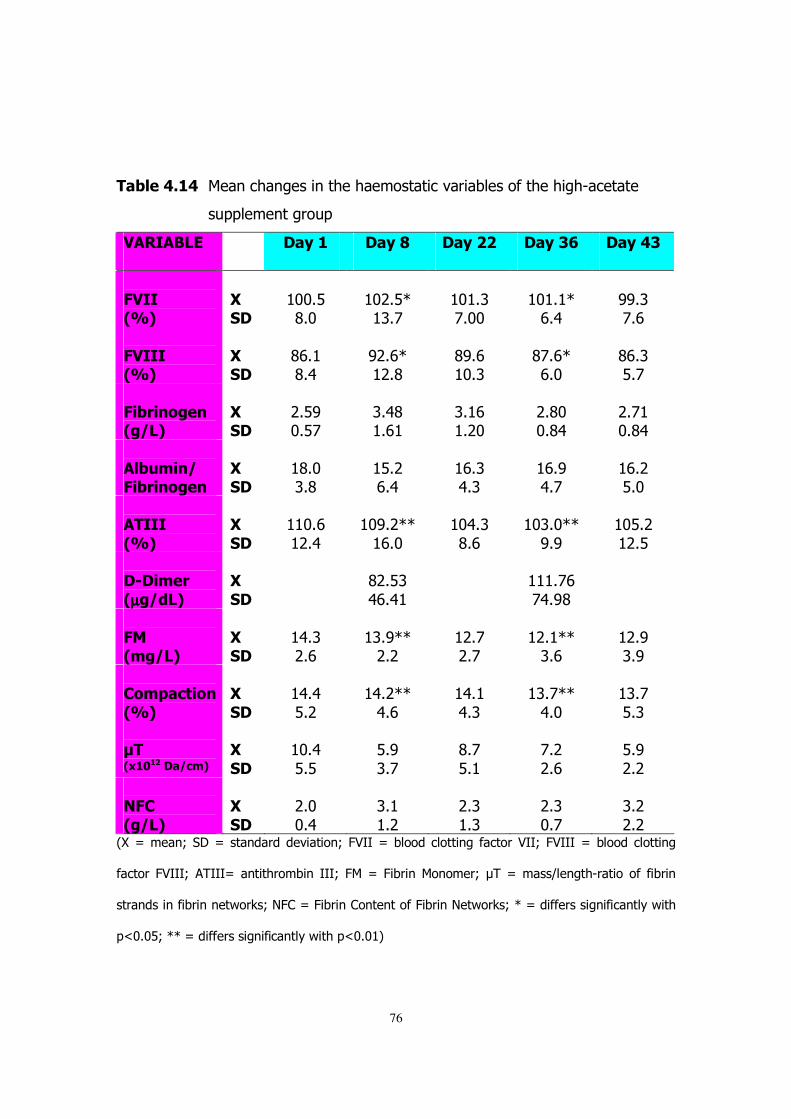
76
�� ������� ��� ���� ���� ������������������������������������,��������
������ �������
��������� � ��6�� ��6�7� ��6�� ��6��8� ��6����
�2����#0 %�
������
� ""#%�&#"�
� "*#%D� (#!�
� " #(�!#""�
� " # D�$#)�
�''#(�!#$�
�
2�����#0 %�
�
�����
�&$# �&#)�
�'*#$D� *#&�
�&'#$� "#(�
�&!#$D�$#"�
�&$#(�%#!�
�2� ��������#�(�%�
������
�*#%'�"#%!�
�(#)&� #$ �
�(# $� #*"�
�*#&"�"#&)�
�*#! �"#&)�
�
�� 3���(�2� ��������
�
�����
� &#"�(#&�
� %#*�$#)�
� $#(�)#(�
� $#'�)#!�
� $#*�%#"�
�
������
#0 %�
�
��
���
� "#$� *#)�
� "'#*DD� $#"�
� ")#(�&#$�
� "(#"DD�'#'�
� "%#*� *#%�
��5������
#µµµµ�(/�%�
���
���
��
�&*#%(�)$#) �
� � #!$�!)#'&�
�
�
2��#��(�%�
�
�����
� )#(�*#$�
� (#'DD�*#*�
� *#!�*#!�
� *# DD�(#$�
� *#'�(#'�
�
,��*�$!����
#0 %�
�
��
���
� )#)�%#*�
� )#*DD�)#$�
� )# �)#(�
� (#!DD�)#"�
� (#!�%#(�
�.��# -���($�%�
���
���
� "#)�%#%�
�%#'�(#!�
�&#!�%# �
�!#*�*#$�
�%#'�*#*�
��2,�
#�(�%�
���
���
�*#"�"#)�
�(# � #*�
�*#(� #(�
�*#(�"#!�
�(#*�*#*�
-.�/���� 0��1�/��� ������������� 0�;>33�/������������� ���������>330�;>333�/������������� ��
�������;>3330���333/�� ��������� �3330�;��/�;���� ��� ����0�?��/���@�� ���,�������������� �
��� ��� ������ � �����A0�<;��/�;���� ��� �� �����;���� �<�����A0�D�/���������� ����� ���������
�="#"%0�DD�/���������� ����� ����������="#" 8�
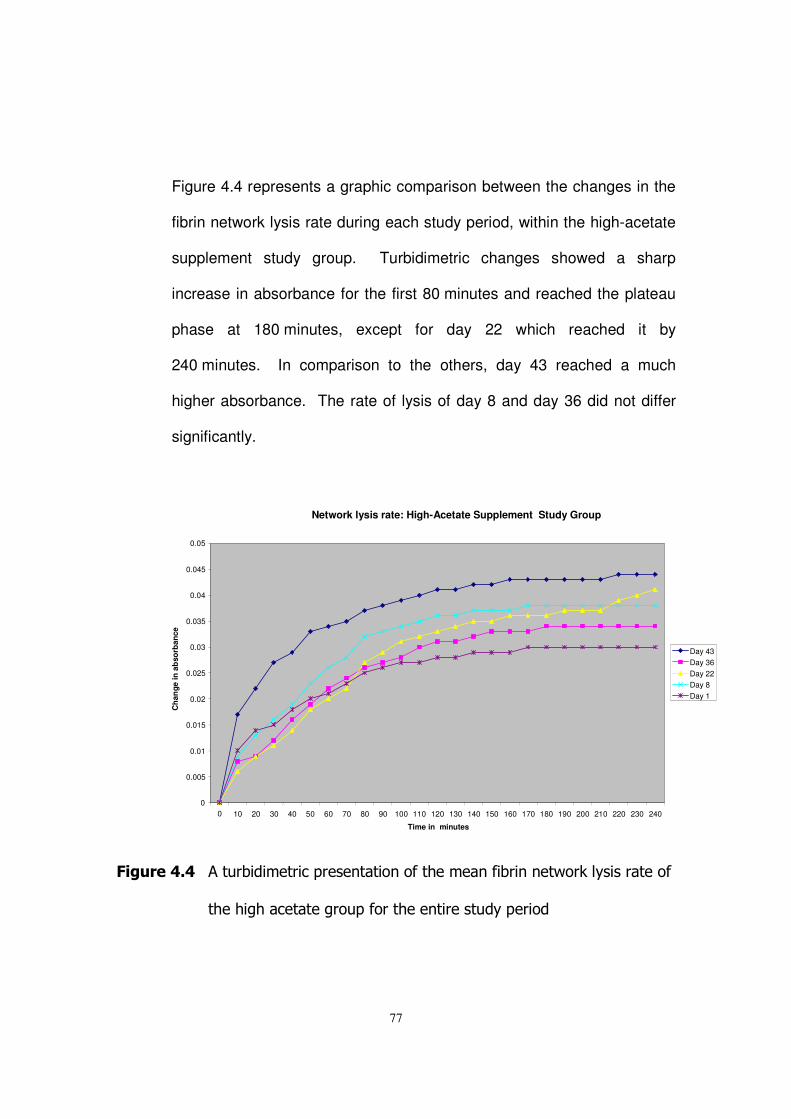
77
�
Figure 4.4 represents a graphic comparison between the changes in the
fibrin network lysis rate during each study period, within the high-acetate
supplement study group. Turbidimetric changes showed a sharp
increase in absorbance for the first 80 minutes and reached the plateau
phase at 180 minutes, except for day 22 which reached it by
240 minutes. In comparison to the others, day 43 reached a much
higher absorbance. The rate of lysis of day 8 and day 36 did not differ
significantly.
�
2��3������� ������������������� ����� ����������� ������ � �����A�������������
������������������������������� ����������������
Network lysis rate: High-Acetate Supplement Study Group
0
0.005
0.01
0.015
0.02
0.025
0.03
0.035
0.04
0.045
0.05
0 10 20 30 40 50 60 70 80 90 100 110 120 130 140 150 160 170 180 190 200 210 220 230 240 Time in minutes
Cha
nge
in a
bso
rban
ce
Day 43 Day 36 Day 22 Day 8 Day 1
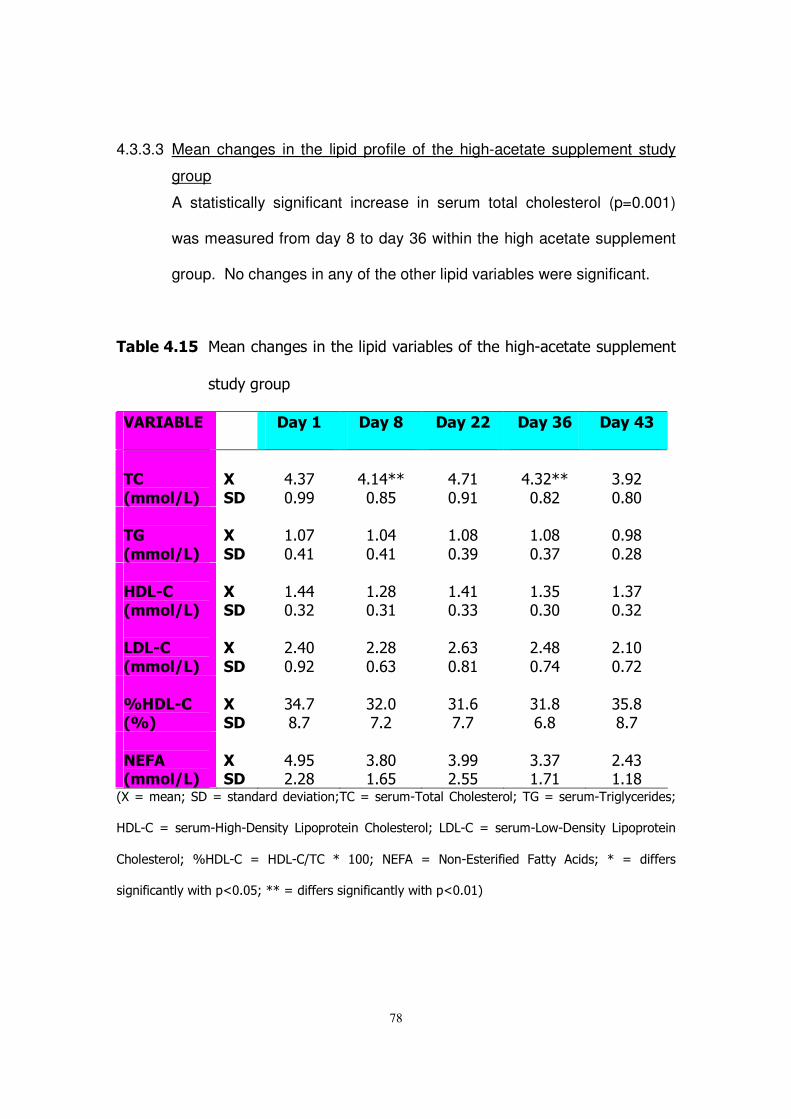
78
4.3.3.3 Mean changes in the lipid profile of the high-acetate supplement study
group
A statistically significant increase in serum total cholesterol (p=0.001)
was measured from day 8 to day 36 within the high acetate supplement
group. No changes in any of the other lipid variables were significant.
�� ������� ��� ���� ���� �������������������������������,�������������� ��
���������
��������� � ��6�� ��6�7� ��6�� ��6��8� ��6����
�
�,�
#����(�%�
�
��
���
�)#(!�"#''�
�)# )DD�"#&%�
�)#! �"#' �
�)#(*DD�"#&*�
�(#'*�"#&"�
��4�
#����(�%�
���
���
� #"!�"#) �
� #")�"#) �
� #"&�"#('�
� #"&�"#(!�
�"#'&�"#*&�
�)��5,�#����(�%�
������
� #))�"#(*�
� #*&�"#( �
� #) �"#((�
� #(%�"#("�
� #(!�"#(*�
����5,�
#����(�%�
���
���
�*#)"�"#'*�
�*#*&�"#$(�
�*#$(�"#& �
�*#)&�"#!)�
�*# "�"#!*�
�
0)��5,�#0 %�
�
�����
�()#!�&#!�
�(*#"�!#*�
�( #$�!#!�
�( #&�$#&�
�(%#&�&#!�
�
��2��#����(�%�
�
�����
�)#'%�*#*&�
�(#&"� #$%�
�(#''�*#%%�
�(#(!� #! �
�*#)(� # &�
-.�/���� 0��1�/��� ������������� 0���/����,����������������0��B�/����,������������0�
617,��/����,6���,1� ����7��������� �����������0�717,��/����,7��,1� ����7��������� �
����������0� C617,�� /� 617,�@��� D� ""0� <E;�� /� <� ,E��������� ;����� ����0� D� /� �������
�� ����� ����������="#"%0�DD�/���������� ����� ����������="#" 8�
79
CHAPTER 5
DISCUSSION
5.1 INTRODUCTION
Coronary heart disease and stroke are considered as degenerative
western diseases which in most cases can be prevented by a change in
lifestyle, for example diet, physical activity and psychological well being.
The link between haemostatic and lipid risk markers for coronary heart
disease and stroke, and lifestyle (diet, exercise, stress, etc.) was
explained in chapter two. In this study a group of westernised African
male volunteers were recruited and fed two different combinations of
short-chain fatty acids, as well as a placebo supplement, for a period of six
weeks. Blood was drawn at different intervals and analysed to assess
changes that were brought about by the different supplements. Focus will
be mainly on the differences between start of supplementation (day 8) and
end of supplementation (day 36). This chapter will be used to discuss the
results which were presented in chapter four, therefore elucidating the
effects that the different supplements had on haemostatic and lipid risk
markers for coronary heart disease. The discussion of the baseline results
of the entire study group will be presented first, followed by the
intervention study.
80
5.2 BASELINE CHARACTERISTICS OF THE ENTIRE STUDY GROUP
Here a discussion of the baseline results is presented, so as to form a
basis for understanding and interpreting the intervention study's results.
The discussion of these baseline results will show if there were any
abnormalities in this group of subjects, and will also evaluate the effect of
placebo consumption for the run-in phase (which lasted a week), in so
doing, its effectiveness in establishing a stable baseline.
5.2.1 General health profile of the entire study group at baseline
All subjects had blood pressures that were within the healthy range of the
population group under investigation. The way in which the blood samples
and other measurements were collected may have contributed to the
‘healthy’ results, mainly due to the fact that the subjects were all calm and
treated with respect. The nursing staff of the Defence Force was
especially caring and friendly. No overweight or obese subjects were
included for the purpose of this study, judging from the body-mass index,
hip and waist measurements. This could be ascribed to the inclusion
criteria, and most importantly, the fact that the subjects were involved with
physical activities most of the day, due to the nature of their occupation.
The BMI and blood pressure measurements were similar to those
obtained by epidemiological studies performed on Africans in South Africa;
in Durban (Seedat, et al., 1992), Cape Peninsula (Oelofse, et al., 1996),
81
Free State (De Wet, 1999) and North West (James et al., 2000). All these
studies were investigating the effects of urbanisation on different risk
factors for CHD and/or stroke.
Blood counts for the purpose of this study were mainly evaluated as
means of ‘marker’ for the general health. It was not expected that the
supplements should have any effect on these variables. However, it was
important to know that anaemic subjects or subjects with low platelets or
white cell counts, which could be indicative of a wide variety of different
disease states, were not included. The blood cell counts reference ranges
used in this study were established for African males in the Free State
region (unpublished data – the experiments were done by the Department
of Haematology and Cell Biology, University of the Free State,
Bloemfontein, 1990), thus they are specific for the studied population.
What can also be observed is that African people tend to have slightly
lower red cell and white blood cell counts than the Caucasian population
(Bain, 1995; Lewis, 2004). C-reactive protein (an acute phase protein)
was measured to ensure that possible changes in other haematological
parameters may not be due to inflammation or any other unknown acute
phase response, and also because it is associated with CHD and CVD.
Luizzo and his colleagues (1994) found elevated plasma CRP
concentration in the majority of patients with unstable angina, myocardial
infarction, and a history of unstable angina. While Ridker et al. (1997)
suggested that the baseline plasma concentration of CRP in apparently
82
healthy men can predict the risk of first myocardial infarction and
ischaemic stroke, independent of other risk factors.
There were no statistically significant changes in any of the general health
indicators for both baseline one (day 1) and baseline two (day 2) of the
entire study group. This indicates that the run-in phase with placebo
managed to establish a stable baseline.
5.2.2 Haemostatic profile of the entire study group at baseline
Coagulation factor determination methods can be divided into two. In the
first group, the factor activity is determined by clot formation time, which is
proportional to the factor activity. The second group measures the factor
directly, especially by immunological methods, usually indicated as factor
concentration, it does not matter whether the factor is functional or not.
The units of measurements in general use are percentage for factor
activity, while for concentration µg/l or mmol/l is used (Hutton et al., 1999).
Thus it is important that when comparisons are made between studies that
this difference is taken into account. In this study, factor activity was used
as the preferred method since it measures only the functional factor.
Elevated FVII (Heinrich et al. 1994), FVIII (Pan et al. 1997) as well as
plasma fibrinogen levels (Møller & Kristensen, 1991) are associated with
increased risk of cardiovascular disease. Cut off values for plasma
fibrinogen for the African population group are a point of argument. The
main reason for this being the different views regarding the strength of
83
plasma fibrinogen as a predictor of stroke, compared to cardiovascular
disease and the prevalence of these two diseases within the different
population groups. The factor VII and VIII percentage activity were similar
to those reported by De wet (1999). The fibrinogen concentration of this
study group was slightly lower than that reported by James et al. (2000).
Antithrombin III (ATIII) is considered a natural anticoagulant; its deficiency
is associated with thrombosis (Walker, 2004). This might indicate that a
higher than normal level will be to the advantage of the individual, but this
needs thorough investigation and its association with coronary risk factor
needs to be determined. Both fibrin monomer and d-dimer levels are
considered as potential risk markers for development of cardiovascular
events. The thrombin-catalysed released of the fibrinopeptides from
fibrinogen results in the formation of a transient intermediate, termed fibrin
monomer. Increased fibrin monomers levels are found in patients with
hypercoagulable disease state, especially after a cardiovascular event.
The fibrin monomer results reported in this study where higher than those
reported by De Wet (1999). D-Dimer is a product of clotted fibrin
breakdown, and is usually found in increased levels in patients with
hypercoagulable disease states occurring before and after cardiovascular
events. It also indicates that fibrinolysis has occurred, thus it is increased
in disseminated intravascular coagulation (Laffan & Manning, 2001).
Fibrin network structure studies were performed because it is thought that
the network structure contributes to the risk of developing coronary heart
84
disease (Mills et al., 2002). The variables are mass-length ratio from
turbidity (which measures fibre thickness), compaction (which measures
the degree of cross-linking), and network lysis rate. The fibrin network
content reported in this study was similar to those reported by Pieters et
al. (2002) and Veldman et al. (1999), while the mass-length ratio was
lower and the compaction higher in this study report. This discrepancy
might be due to the different population groups that were used in these
studies. Indicating that Africans might have these lower mass-length ratio
and higher compaction, but this needs population studies to evaluate this
supposition. Gabriel et al. (1992) has suggested that fibrin structure
contributes to the regulation of the fibrinolytic rate; this is one of the
reasons why fibrin network lysis rate studies were performed. The fibrin
network lysis rates of the two baseline visits were similar, while the end-
point absorbance of baseline one was lower. The reason for this
observation was that baseline two’s (day 8) plasma fibrinogen
concentration and the network fibrin content was higher than that of
baseline one (day 1). The fibrin network content is a measure of the
amount of fibrin that is incorporated into the network structure, and it being
high indicated that there was more fibrinogen was incorporated into the
network structure. Therefore, more fibrinogen was available and indeed
was incorporated into the network structure, thus resulting in a higher end
point absorbance.
85
There were no statistically significant changes in any of the haemostatic
variables for both baseline one (day 1) and baseline two (day 8) of the
entire study group. This indicates that the run-in phase with placebo
managed to establish a stable baseline.
5.2.3 Lipid profile of the entire study group at baseline
The lipid profile of this group of subjects is very interesting. The total
cholesterol (TC) level of this group falls within the moderate risk category
(4.10 – 5.50 mmol / L). The fasting TG levels fall below the high risk cut-
off level of 2 mmol /L (Wilson et al., 1991). The HDL-C levels are
relatively high when compared to the total cholesterol levels. However, in
comparison with the HDL-C, concomitant high LDL-C levels (up to 54% of
the TC) were measured. In general, this is very common within this
population group. Consequently, at first glance, the lipid profiles seem
healthy. However, the LDL-C levels (taking into consideration that it is
lifestyle associated, as well as the group of the volunteers) place the
subjects at risk of future cardiovascular events. The TC, TG, %HDL-C,
HDL-C & LDL-C are comparable to those found by James, et al. (2000),
Oelofse, et al. (1996) and Seedat, et al. (1992). The fasting Non-Esterified
Fatty Acid level of this group falls within the accepted normal range.
Normal daily values can fluctuate to as much as 10 mmol / L, depending
on the fat content of the diet of an individual.
86
There were no statistically significant changes in any of the lipid variables
for both baseline one (day 1) and baseline two (day 8) of the entire study
group. This indicates that the run-in phase with placebo managed to
establish a stable baseline.
5.3 INTERVENTION STUDY RESULTS
Here a discussion of results of different study groups is presented. Focus
was on the results of day 8 (start of supplementation) and day 36 (end of
supplementation). The baseline measurements of the different groups
were comparable with no statistically significant differences thus any
changes which were observed in any of the groups cannot be said that
they were caused by different baseline results. From this observation it
can be assumed that the changes were brought about by the different
supplements.
5.3.1 The Placebo Supplement Intervention Study group
This study group consumed placebo supplements for the entire study
period.
87
5.3.1.1 Changes in the general health profile of the placebo supplement study
group
No statistically significant changes in any of the general health indicators
within the placebo group were measured during the study, more
importantly between day 8 (start of supplementation) and day 36 (end of
supplementation). This can be seen as a positive result since the group
consumed placebo and no significant changes were expected. It is
interesting to note that the plasma CRP concentration of day 8 was
higher than any of the other visits, though it was not statistically
significant. This could be due to an unknown inflammatory response or
infection.
5.3.1.2 Changes in the haemostatic profile of the placebo supplement study
group
A statistically significant change was observed in the plasma fibrinogen
concentration, which showed a decrease for the period from day 8 to day
36, and no statistically significant change was measured in any of the
other haemostatic variables. When looking at all the visits it can be
noticed that the fibrinogen concentration of day 8 was the highest for all
of the visits, and this was also the case with factor VIII concentration
though the change was not statistically significant. Since factor VIII, CRP
and fibrinogen concentration are all acute phase proteins, it follows logic
88
that the statistically significant change in fibrinogen might not have been
brought about by the supplements, but an inflammatory response.
Fibrin network lysis rate of day 1, 8, 36 and 43 showed the same pattern
and similar lysis rates, while day 22 reached a lower end-point
absorbance, which cannot be explained by the fibrinogen concentration.
It can be noticed that the network fibrin content of day 22 was lower than
that of all the other visits, and this could explain why day 22 end-point
absorbance was lower than that of the other visits. Most importantly,
there was no significant change from day 8 and day 36.
5.3.1.3 Changes in the lipid profile of the placebo supplement study group
No statistically significant changes were measured within the lipid
variables of the placebo group, because this study group consumed
placebo which was not supposed to affect the lipid variables.
5.3.2 The Acetate-Propionate (50/50) Supplement Intervention Study
Results
This group consumed placebo from day 1 to day 8, followed by the
acetate-propionate supplements until day 36, and then consumed placebo
for the last week.
89
5.3.2.1 Changes in the general heath profile of the acetate-propionate (50/50)
supplement study group
No significant changes were observed in any of the general health
indicators of the acetate/propionate (half-half) supplemented group over
the duration of the study. This can be viewed as positive because no
changes were expected in these variables since these variables were
only used to assess general health status of the volunteers.
5.3.2.2 Changes in the haemostatic profile of the acetate-propionate (50/50)
supplement study group
A statistically significant decrease in factor VIII activity, antithrombin III
and an increase in fibrinogen concentration were measured within this
group from baseline to end of supplementation (day 8 and day 36). No
statistically significant changes in any of the haemostatic variables were
measured. The change in factor VIII could be viewed as positive
because some studies have suggested that an increase in factor VIII is
associated with increased risk of coronary heart disease development.
The changes in ATIII and fibrinogen could render the blood more
coagulable and the individual at higher risk of development of
cardiovascular complications. This is only supported if the assumption
that a decreased ATIII makes the blood more coagulable. An increase in
fibrinogen was not accompanied by the high CRP and factor VIII, as was
the case with the placebo group, thus indicating that the change is not an
90
acute phase response. There were no statistically significant changes in
the fibrin network architecture, as was seen with Veldman et al. (1999)
but the discrepancy is caused by the amount of acetate fed and the fact
that in this study propionate was also included in the supplements.
These changes are not clinically significant.
Network lysis rate of day 8, 22, and 36 showed similar rate of lysis, while
day 43 reached the highest end-point absorbance, contrary to day 1
which reached the lowest. The network fibrin content of day 1 was the
lowest of all the visits, while day 43 had a couple of samples with high
network fibrin content, this is reflected by the high standard deviation. In
contrast to day 8's fibrin network content that had a low standard
deviation, indicating that the range for this visit was small. Most
importantly day 8 and day 36 showed no significant change.
5.3.2.3 Changes in the lipids profile of the acetate-propionate (50/50)
supplement study group
Triglyceride levels showed a statistically significant increase from start to
the end of supplementation. An increase in TG could be viewed as
making the individual susceptible to cardiovascular events, but in this
case the increase is still well below the high risk cut-off level of 2 mmol/L.
Also, a significant decrease in LDL-C was measured from baseline two
(day 8) to the end of the supplementation phase (day 36). In comparison
with TC levels (LDL-C/TC X 100), the LDL-C fraction dropped from 64%
91
(day 8) to 57% (day 36). This in itself may have some clinical
significance. The rise in HDL-C was small and statistically non-
significant, but with the decrease in LDL-C caused the %HDL-C to rise
from 26% to 30%. The statistically significant decrease in LDL-C and a
concomitant rise in %HDL-C (HDL-C/TC X 100) can be considered as
positive changes, thus reducing the risk of cardiovascular events. These
changes can be related to those found by Veldman et al. (1999) where
acetate and pectin were given as supplements, and Venter et al. (1997)
where feeding a western diet together with 2% propionate showed an
increase in HDL-C.
5.3.3 The High-Acetate Supplement Intervention Study Results
This group consumed placebo from day 1 to day 8, followed by high-
acetate supplements till day 36, and then consumed placebo for the last
week.
5.3.3.1 Changes in the general health profile of the high-acetate supplement
study group
No significant differences in any of the general health indicators of the
high acetate supplemented study group were measured, from the start to
the end of supplementation, as indicated no changes were expected.
92
5.3.3.2 Changes in the haemostatic profile of the high-acetate supplement study
group
The changes that affect the cardiovascular disease risk profile positively
are, a decrease in factor VII, factor VIII, and fibrin monomers, while a
decrease in AT III is unknown, compaction’s increase affects the risk
profile negatively. The more compact network would have a high degree
of cross-linking, thus will not allow easy access for fibrinolytic enzymes
(Nair & Shats, 1997; Blombäck et al., 1992). The significant results
within haemostatic variables of this subject group are difficult to interpret,
mainly due to the fact that some changes could be considered as
beneficial (the decrease in FM levels), and the others as less beneficial
(an increase in compaction). It will be necessary to weigh these changes
against each other, without speculating too much. Though changes were
not found in the fibrin network structure as in Veldman et al. (1999), but
this group showed more changes in the haemostatic variables than the
acetate-propionate supplement group. It must be remembered that the
supplement of this study does not produce the same SCFAs ratio as
pectin. No other significant changes were measured within this subject
group.
Network lysis rate of all the visits showed a similar rate of lysis with no
statistically significant changes amongst them. Day 43 showed a high
end-point absorbance because it had the highest fibrin network content
and had a few samples with high fibrin network content values as
93
reflected by the standard deviation and raw data. Day 22's lysis rate
seemed to increase periodically and it reached plateau after all the other
visits and it had the second highest end-point absorbance which makes
sense because this visit had the second highest fibrinogen concentration.
The change in compaction was small and therefore was not reflected in
the network lysis rate.
5.3.3.3 Changes in the lipids profile of the high-acetate supplement study group
Total cholesterol within this supplemented group showed a statistically
significant increase of approximately 4.2%, compared to no difference
within the placebo group. This increase was caused by a small statistical
non-significant increase in LDL-C (8%) and HDL-C (5.2%), while the
%HDL-C remained constant. At first glance the change looks negative
but when examined closer the change is not so cut and dry. These
results are a bit tricky to evaluate since a positive and a negative change
has taken place. When looking at the %HDL-C and %LDL-C (both
relative to TC) there is not much change in these variables. A decrease
of approximately 4.2% should have a clinical impact, especially if other
variables followed this route. The difference, however, is very small
when compared to clinical significance. It is interesting to note the
statistical non-significant decrease in NEFA levels (of 25%). This change
is expected and ascribed to increase short-chain fatty acid circulation. It
is this decrease in the NEFA concentration that was believed to lower

94
circulation plasma fibrinogen concentrations (Veldman et al., 1999).
However, this hypothesis could never be proven. No other significant
changes of interest in any of the lipid variables within this group were
observed.
95
CHAPTER 6
CONCLUSION AND RECOMENDATIONS
6.1 INTRODUCTION
Coronary heart disease and stroke are considered as degenerative
western diseases which in most cases can be prevented by a change in
lifestyle, for example diet, physical activity and psychological well being.
Africans have the lowest incidence of these westernized disorders, in
comparison to other South African population groups. This is thought to
be due to the prudent, low-fat high fibre diet which Africans consume. The
protection seems to centre on and around the intake of dietary fibre, but
the exact mechanism of action is not known. Dietary fibre is fermented in
the large gut to short-chain fatty acids (acetate, propionate and butyrate).
It is hypothesized that these SCFAs may, in part, contribute in some way
to the beneficial effects of dietary fibre intake on human metabolism.
The aim of this study was to test the effects of different combinations of
short-chain fatty acids on some metabolic risk markers generally
associated with the development of cardiovascular heart disease in
westernised African men. In this study a group of westernised African
male volunteers were recruited and fed two different combinations of
short-chain fatty acids, as well as a placebo supplement, for a period of six

96
weeks. Blood was drawn at different intervals and analysed to assess
changes that were brought about by the different supplements. Focus
was mainly on the differences between start of supplementation (day 8)
and end of supplementation (day 36).
The conclusion of the baseline characteristics of the entire study group will
be presented first, followed by the intervention study, where the conclusion
of the different study groups will be presented, ending with the
recommendations.
6.2 BASELINE CHARACTERISTICS OF THE ENTIRE STUDY GROUP
The characteristics of this group of subjects reflect a group of people
without current metabolic abnormalities, as reflected by the baseline
results and discussions. This could be ascribed to the strict inclusion
criteria adhered to during the recruitment phase. The anthropometrical
measurements reflect that this group of subjects were not clinically obese,
while the blood pressure and blood counts were also within range for this
population.
The haemostatic measurements were within the reference ranges for this
subject group. The lipid profile of this group reflected a normolipidaemic
group with a slight change to the westernised lipid profile though not
pronounced.
97
There was no significant changes, statistical or clinical, observed between
the two baselines. This indicated the placebo supplement was successful
in establishing a stable base line.
6.3 INTERVENTION STUDY
The baseline results of the three study groups were not statistically and
clinically different, indicating that any other significant changes cannot be
attributed to bias, because of a different baseline.
6.3.1 The Placebo Supplement Intervention Study Results
The supplements did not affect the anthropometrical measurements, blood
pressure, blood cell counts and CRP as none of them showed a
statistically and clinically significant change from the beginning of the
intervention period to the end of the study.
The placebo supplement did not affect the haemostatic variables including
fibrin network architecture variables. The statistically significant increase in
fibrinogen might have been brought about by an inflammatory reaction
because CRP and factor VIII were also high for that period, though not
statistically significant. The CRP and Factor VIII changes were also not
clinically significant.
98
The lipid variables of the placebo group were not affected by these
supplements. This is viewed as being positive since no significant changes
were expected in any of the measured variables of this group of subjects.
6.3.2 The Acetate-Propionate (50/50) Supplement Intervention Study
Results
The general health indicators were not affected by the supplements; this
was expected since these were only used as a measure of general health.
A statistically significant decrease in factor VIII can be viewed as a positive
change, while an increase in fibrinogen is viewed as negative changes.
Though statistically significant these two variables are not clinically
significant. The decrease in ATIII has to be evaluated further, so as to
determine if a decrease or an increase can be associated with increased
risk of CHD.
A statistically significant decrease in LDL-C from 64% to 57%, combined
with a statistically non-significant increase in HDL-C from 26% to 30% can
be considered positive effects. While a decrease in triglycerides is
negative, but it was well below the cut-off point
This supplement tended to have affected more lipid variables than the high
acetate group. The acetate–propionate supplement did not have an effect
on the fibrin network structure variables, but had an effect on other
haemostatic variables together with lipid variables.
99
6.3.3 The High-Acetate Supplement Intervention Study Results
The general health indicators were not affected by the supplements; this
was expected since these were only used as a measure of general health.
A statistically significant decrease in factor VII, VIII and fibrin monomers
are considered to lower the risk of cardiovascular events. While a increase
in compaction tend to increase the risk of cardiovascular events. The
contribution of ATIII to CHD risk has still to be determined.
There was a statistically significant increase in total cholesterol of 4.2%,
this was caused by an increase in LDL-C and HDL-C of 8% and 5.6%
respectively.
This study group showed more changes in the haemostatic variables than
the acetate-propionate supplemented group. The high acetate
supplements showed only one significant change in the fibrin network
structure studies (which was negative), but had an effect on other
haemostatic variables and only a single change in lipid variables.
6.3.4 The overall general conclusion
The placebo supplement did not affect the haemostatic variables including
fibrin network architecture variables. The acetate-propionate (50/50)
supplement affected more lipid variables than the high acetate group.
While the high acetate study group showed more changes in the
haemostatic variables than the acetate-propionate supplemented group.
100
6.4 RECOMMENDATIONS
6.4.1 Future research
Is it not time to look closer at fibrin network structure studies for answers
for hypercoagulation patients, where a cause for the increased risk for
thrombosis is not determined by the tests that are currently done? The
researcher suggests a multi-centre study to investigate the effect of fibrin
network structure on the risk for hypercoagulation, thus determining if
fibrin network structure studies are an independent risk marker or not. This
study will also help to determine the cut-off point for risk and on the other
assist with the standardisation of the different methods used for fibrin
network structure studies.
Another study would be to determine the effect of SCFA and fibre on
people who are at risk and even have had an event so as to assess the
effect under these “abnormal” conditions.
6.4.2 Dietary recommendations and possible clinical use
On the basis of the results obtained and results from other similar studies
it has become very important to make the general public aware of the
importance of fibre in the diet, notwithstanding the importance of a
balanced diet. For those individuals who may have allergies or are
intolerant to certain types of fibre may look towards SCFA supplements as
a substitute, though it does not give all the benefits of fibre.
101
CHAPTER 7
REFERENCES
Anderson, J.W. & Siesel, B., 1990. Hypocholesterolaemic effects of oat products.
In: New developments in dietary fiber, physiological, physiochemical, and
analytical aspects. Eds: Furda, I. & Brine, C.J. New York: Plenum Press, 17-36.
Anderson, J.W., 1995. Short-chain fatty acids and lipid metabolism: human
studies. In: Physiological and clinical aspects of short-chain fatty acids,
Cummings J.H., Rombeau J.L. & Sakata T. (eds), University Press,
Cambridge, 509-524.
Armstrong, M.C. & Heistad, D.D., 1990. Animal model of atherosclerosis.
Atherosclerosis, 85: 15-23.
Austin, M.A., 1991. Plasma triglycerides and coronary heart disease.
Arterosclerosis and Thrombosis, 11: 2-14.
Aviram, M., Maor, I., Keidar, S., Hayek, T., Oiknine, J., Bar-EI, Y., Alder, Z.,
Kertzman, V. & Milo, S., 1995. Lesioned low density lipoprotein in athersclerotic
apolipoprotein E-deficient transgenic mice and in humans is oxidized and
agggregated. Bioche Biophys Res Commu, 216: 501-513.
102
Aviram, M. & Fuhrman, B., 1998. Polyphenolic flavonoids inhibit macrophage-
mediated oxidation of LDL and attenuate atherogenesis. Atherosclerosis, 137:
Supplement S45-S50.
Bain, B.J., 1995. Normal ranges. In: Blood cells, a practical guide, 2nd edition,
Oxford, Blackwell, 147-150.
Barrett-Connor, E. & Bush, T.L., 1991. Estrogen and coronary heart disease in
women. Journal of American Medical Association, 265: 1861-1867
Beard, C.M., Kottke, T.E., Annegers, J.F. & Ballard, D.J., 1989. The Rochester
Coronary Health Disease Project: effects of cigarette smoking, hypertension,
diabetes, and steroidal estrogen use on coronary heart disease among 40-to 59-
year old women, 1960 through 1982. Mayo Clinic Proceedings, 64: 1471-1480
Blombäck, B., Blombäck, M., Carlsson, K., Fatah, K., Hamsten, A. & Hessel, B.,
1992. Fibrin gel structure in health and disease. In: Fibrinogen: a new
cardiovascular risk factor. Ernest, E., Koenig, W., Lowe, G.D.O. & Meade, T.W.
(eds). Weden: Blackwell-MZW, 11-18.
103
Bourne, L.T., Langenhoven, M.L., Steyn, K., Laubsher, J.A. & van der Vyver, E.,
1993. Nutrient intake in the urban African population of the Cape Peninsula,
South Africa. The BRISK study. Central African Journal of Medicine, 33: 238-247.
Bourquin, L.D., Titgemeyer, E.C. & Fahey, G.C., 1992. Vegetable fibre
fermentation by human faecal bacteria: cell wall polysaccharide disappearance
and short-chain fatty acid production during in vitro fermentation and water-
holding capacity of unfermented residue. Journal of Nutrition, 23: 860-869.
Bourquin, L.D., Titgemeyer, E.C., Garleb, K.A. & Fahey, G.C., 1992a. Short-
chain fatty acid production and fiber degradation by human colonic bacteria:
Effects of substrate and cell wall fraction procedures. Journal of Nutrition, 122:
1508-1520.
Bradlow, B.A., Chetty, N., Birnbaum, M., Baker, S.G. & Seftel, H.C., 1982.
Platelets function in familial hypercholesterolemia in South Africa and the effect
of probucol. Thrombosis Research, 26: 91-99
Bradshaw, D., Dorrington, R.E. & Sitas, F., 1992. The level of mortality in South
Africa 1985 – what does it tell us about health? South African Medical Journal,
82: 237-240.
104
Bradshaw, D., Bourne, D., Schneider, M. & Sayed, R., 1995. Mortality patterns of
chronic disease in South Africa. In Chronic disease of lifestyle in South Africa.
MRC Technical Report. J. Fourie, J. & Steyn, K. (eds), 5-36.
Brøbech Mortensen, P. & Clausen, M.R., 1996. Short-chain fatty acids in the
human colon: relation to gastrointerstinal health and disease. Scand J
Gastroenterol, 31: suppl 216: 132-48.
Bugaut, M. & Bentéjac, M., 1993. Biological effects of short-chain fatty acids in
nonruminant mammals. Annual Reviews of Nutrition, 13: 217-214.
Bush, T.L., Fried, L.P. & Barrett-Connor, E., 1988. Cholesterol, lipoproteins, and
coronary heart disease in women. Clinical Chemistry, 34: B60-B70.
Cheung, M.C., Brown, B.G., Wolf, A.C. & Albers, J.J., 1991. Altered particle size
distribution of apolipoprotein A-I-containing lipoprotein in subjects with coronary
artery disease. Journal of Lipid Research, 32: 383-394
Clarke, R., Daly, L., Robinson, et al., 1991 Hyperhomocysteinemia an
independent risk factor for vascular disease. New England Journal of Medicine,
324: 1147-1155
105
Clowes, A.W., 1991. Prevention and management of recurrent disease after
arterial reconstruction: New prospects for pharmacological control. Thrombosis
and Haemostasis 66: 62-66.
Colwell, J.A., 1988. Platelets, endothelium and diabetic vascular disease.
Diabete & Metabolisme (Paris), 14: 512-518
Cook, N.S. & Ubben, D., 1990. Fibrinogen as a major risk factor of
cardiovascular disease. Trends Pharmacological Science, 11: 444-451.
Conlan, M.G., Folsam, A.R., Finch, A., Davis, C.E., Sorlie, P., Marcucci, G. &
Wu, K.K., 1993. Association of factor VIII and von Willebrand factor with age,
race, sex and risk factors for atherosclerosis: The Atherosclerosis Risk in
Communities (ARIC) study. Thrombosis and Haemostasis, 70 (3): 380-385.
Criqui, M.H., 1991. Triglycerides and coronary heart disease. In: Atherosclerosis
reviews, Gotto, A.M. Jr, & Paoletti, R. (eds), 22: 75-79
Cummings, J.H., 1981. Short-chain fatty acids in the human colon. Gut; 22: 763-
79.
106
Cummings, J.H., 1982. Polysaccharide fermentation in the human colon. In:
Colon and Nutrition (Falk Symposium 32). Eds: Kasper, H. & Goebell, H. MTP
Lancaster, UK: Press, 91-103.
De Pergola, G. & Pannacciulli, N., 2002. Coagulation and fibrinolysis
abnormalities in obesity. Journal of Endocrinological Investigation, 25 (10): 899-
904.
De Wet, M., 1999. The effect of short-chain fatty acids on plasma fibrinogen
concentration in westernised black men. Magister Scientiae: Dietetics
(dissertation), University of the Free State, 105 – 130.
Dhall, T.Z., Bryce, W.A.J. & Dhall, D.P. 1976. Effects of dextran on the molecular
structure and tensile behaviour of human fibrinogen. Thrombosis and
Haemostasis, 35, 737-745.
DiMinno, G., Silver, M.J., Cerbone, A.M., Rainone, A., Postglione, A. & Manchini,
M., 1986. Increased Fibrinogen binding to platelets form patients with familial
hypercholesterolemia. Arteriosclerosis, 6: 203-211.
Dimsdale, J.E., 1988. A perspective on type A behaviour and coronary disease.
New England Journal of Medicine, 318: 110-112.
107
Doolittle, R.F., 1994. Fibrinogen and fibrin. In: Haemostasis and thrombosis.
Bloom, A.L., Forbes, C.D., Thomas, D.P. & Tuddenham, E.G.D. (eds), third
edition, Vol 1, 491-514, Churchill Livingstone – Edinburgh.
Engelhardt, v.W., 1995. Absorption of short-chain fatty acids from the large
interstine. In: Physiological and clinical aspects of short-chain fatty acids,
Cummings, J.H., Rombeau, J.L. & Sakata, T. (eds), University Press,
Cambridge, 149-170.
Esterbauer, H., Gebicki, J., Puhl, H. & Jurgens, G., 1992. The role of lipid
peroxidation and antioxidants in oxidative modification of LDL. Free Radical
Biological Medicine, 13: 341-390.
Faggiota, A. & Ross, R., 1984. Studies of hypercholesterolemia in the non-
human primate. II. Fatty streak conversion to fibrous plaque. Arteriosclerosis, 4:
341-356.
Fitzgerald, D.J., 1991. Platelet activation in the pathogenesis of unstable angina:
importance in determining the response to plasminogen activators. American
Journal of Cardiology, 68: 51B-57B.
Frenkel, E.P. & Mammen, E.F., 2003. Sticky platelet syndrome and
thrombocythemia. Haematology / Oncology Clinics of North America, 17: 63-83.
108
Frick, M.H., Elo, O., Haapa, K., et al., 1987. Helsinki Heart Study: primary
prevention trial with gemfibrozil in middle-aged men with dyslipademia. Safety of
treatment, changes in risk factors, and incidence of coronary heart disease. New
England Journal of Medicine, 317: 1237-1245.
Gabriel, D.A., Muga, K. & Boothroyd, E.M., 1992. The effect of fibrin structure on
fibrinolysis. The Journal of Biological Chemistry, 267 (34): 24259 - 24263.
Gaffney, P.J. & Longstaff, C., 1994 An overview of haemostasis, In: Haemostasis
and thrombosis. Bloom, A.L., Forbes, C.D., Thomas, D.P. & Tuddenham, E.G.D.,
third edition, Vol 1, 549-574. Churchill Livingstone - Edinburgh.
Gordon, D., Schwartz, S.M., Benditt, E.P. & Wilcox, J.N., 1989. Growth factors
and cell proliferation in human atherosclerosis. Transplantation Proceedings, 21:
3692-3694.
Haapanen, A., Koskenvuo, M., Kaprio, J., Kesäniemi, Y.A. & Heikkilä, K., 1989.
Carotid arteriosclerosis in identical twins discordant for cigarette smoking.
Circulation, 80: 10-16
109
Halle, M., Berg, A., Keul, J. & Baumstark M.W., 1996. Association Between
Serum Fibrinogen Concentrations and HDL and LDL Subfraction Phenotypes in
Healthy Men. Arteriosclerosis, Thrombosis, and Vascular Biology, 16 (1).
Hamstern, A., Wiman, B., de Faiere, U. & Blombäck, B., 1987. Increased plasma
levels of rapid inhibitor of tissue plasminogen activator in young survivors of
myocardial infarction. New England Journal of Medicine, 313: 1557-63.
Hatano, S., 1976. Experience from a multi-centre stroke register: a preliminary
report. Bulletin of the World Health Organization, 54: 541-553.
Heinrich, J., Schulte, H., Balleisen, L., Assmann, G. & van de Loo, J., 1991.
Predictive value of haemostatic variables in the PROCAM-study. Thrombosis
Haemostasis, 65: 815.
Heinrich, J., Balleisen, L., Schulte, H., Assmann, G. & van de Loo, J., 1994.
Fibrinogen and factor VII in the prediction of coronary risk: Results from the
PROCAM Study in healthy men. Atherosclerosis and Thrombosis, 14: 54-59.
Hennekens, C.H., Buring, J.E. & Maerent, S.L., 1984. Smoking and aging in
coronary heart disease. IN: Smoking and aging, Bossé, R. & Rose, C.L. (eds).
Lexington Books, Lexington MA, 95-115.
110
Hermansen, K., Dinesen, B., Hoie, L.H., Morgenstern, E. & Grunewald, J., 2003.
Effects of soy and other natural products on LDL:HDL ratio and other
parameters: a literature review. Advances in Therapy, 20 (1): 50-78.
Homer, D., Ingall, T.J., Baker, H.L. Jr, O’Fallon, W.M., Kottke, B.A. & Whisnat,
J.P., 1991. Serum lipids and lipoprotein are less powerful predictors of
extracranial carotid artery atherosclerosis than are cigarette smoking and
hypertension. Mayo Clinic Proceedings, 66: 259-267.
Hornsta, G., 1980. Dietary fats and arterial thrombosis. PHD thesis, University
of Maastricht, Netherlands.
Hornsta, G., 1989. Effects of dietary lipids on platelet function and thrombosis.
Annuals of Medicine, 21: 53-57.
Hourani, S.M.O. & Cusack, N.J., 1991. Pharmacological receptors on blood
platelets. Pharmacological Reviews, 43: 243-298.
Hutton, R.A., Laffan, M.A. & Tuddenham, E.G.D., 1999. In: Postgraduate
Haematology, forth edition. Hoffbrand, V.A., Lewis, S.M. & Tuddenham, E.G.D.
(eds), p550-580. Butterworth-Heinemann.
111
Hubbard, R.W., Mejia, A. & Horning, M., 1994. The potential of diet to alter
disease process. Nutrition Research, 14:12, 1853-1895.
Ichinose, A., 1994. The physiology and biochemistry of factor XIII In Haemostasis
and Thrombosis. Bloom, A.L., Forbes, C.D., Thomas, D.P. & Tuddenham, E.G.D.
(eds), third edition, vol 1, 531-546. Churchill Livingstone - Edinburgh.
Ingall, T.J., Homer, D., Baker, H.L. Jr, Kottke, B.A., O’Fallon, W.M. & Whisnat,
J.P., 1991. Predictors of intracranial carotid artery atherosclerosis. Duration of
smoking and hypertension are more powerful than serum lipid levels. Archives of
Neurology, 48: 687-691.
Iso, H., Jacobs, D.R., Wentworth, D., Newton, J.D. & Cohen, J.D., 1989. Serum
cholesterol levels and six-year mortality from stroke 350 997 men screened for
the Multiple Risk Factor Intervention Trial. New England Journal of Medicine,
320: 904-910.
James, S., Vorster, H.H., Venter, C.S., Kruger, H.S., Nell, T.A., Veldman, F.J. &
Ubbink, J.B., 2000. Nutritional status influences plasma fibrinogen concentration:
Evidence from the THUSA survey. Thrombosis Research, 98; 383 - 394.
Joubert, J., 1991. The MEDUNSA Stroke Data Bank. An analysis of 304 patients
seen between 1986 and 1987. South Africa Medical Journal, 80: 567-569.
112
Kahn, K. & Tollman, S.M., 1999. Stroke in rural South Africa - Contributing to the
little known about a big problem. South African Medical Journal, 89: 63-65.
Kannel, W.B., Wolf, P.A., Castelli, W.P. & D’Agostino, R.B., 1987. Fibrinogen and
risk of cardiovascular disease. The Farmingham study. Journal of the American
Medical Association, 258: 1183-1186.
Kannel, W.B., 1991. Hypertension, hypertrophy, and the occurrence of
cardiovascular disease. American Journal of the Medical Sciences, 302: 199-
204.
Kannel, W.B., 1997. Influence of fibrinogen on cardiovascular disease. Drugs, 54
(3): 32-40.
Kaplan, A., Jack, R., Opheim, K.E., Toivola, B. & Lyon, A.W., 1995. In: Clinical
Chemistry: interpretation and techniques. Fourth edition, 220-248, Williams &
Wilkins, Baltimore.
Kemball-Cook, G., Tuddenham, E.G.D. & McVey, J.H., 2004. Normal
haemostasis. In: Postgraduate Haematology. Hoffbrand, V.A., Catovsky, D. &
Tuddenham, E.G.D. (eds), Fifth edition, 783-807, Blackwell publishing,
Massachusetts.
113
Kinsella, J., Lokesh, B. & Stone, R., 1990. Dietary n-3 polyunsaturated fatty acids
and amelioration of cardiovascular disease: Possible mechanism. American
Journal of Clinical Nutrition, 52: 1-28.
Kritchevsky, D., 1994. Diet and heart disease. Supplement to SAMJ, 26 - 29.
Laffan, M.A. & Manning R.A., 2001. Investigation of haemostasis. In: Dacie and
Lewis Practical Haematology, ninth edition, eds: Lewis, S.M., Bain, B.J. & Bates
I. Churchill Livingstone, London, 386 – 388.
Law, M., Friis-MØller, N., Weber, R., Reiss, P., Theibaut, R., Kirk, O.R., d'Arminio
Monforte, A., Pradier, C., Morfeldt, L., Calvo, G., El-Sadr, W., De Wit, S., Sabin,
C.A. & Lundgren, J.D., 2003. Modelling the 3-year risk of myocardial infarction
among participants in the Data Collection on Adverse Events of Anti-HIV Drugs
(DAD) study. British HIV Association HIV Medicine, 4, 1-10.
Lee, A.J., Smith, W.C.S., Lowe, G.D.O. & Tunstall-Pedoe, H.D., 1990. Plasma
fibrinogen and coronary risk factors: the Scottish Heart Health Study. Journal of
Clinical Epidemiology, 43: 913-919.
Levy, R.I., 1981. Cholesterol, Lipoproteins, Apoproteins, and Heart Disease:
Present Status and Future Prospects. Clinical Chemistry, 27 (5): 653-662.
114
Lewis, M.S., 2004. Laboratory practice; Appendix 1: Normal values. In:
Postgraduate Haematology. Hoffbrand, V.A., Catovsky, D. & Tuddenham,
E.G.D. (eds), Fifth edition, 1007-1022, Blackwell publishing, Massachusetts.
Lichtenstein, A.H., 2003. Dietary fat and cardiovascular disease risk: quantity or
quality? Journal of Women’s Health (Larchmt), 12 (2): 109-114.
Lindley, R.I. & Warlow, C.P., 1994. Acute ischaemic stroke and transient
ischaemic attacks. In: Haemostasis and Thrombosis, Bloom, A.L., Forbes, C.D.,
Thomas, D.P. & Tuddenham, E.D.G. (eds), third editon, Churchill Livingstone,
London, vol 2: 1255-1274.
Lipid Research Clinic Program, 1984a. The Lipid Research Clinic Coronary
Primary Prevention Trial results. II. Reduction in incidence of coronary heart
disease. Journal of the American Medical Association, 251: 351-364
Lipid Research Clinic Program, 1984b. The Lipid Research Clinic Coronary
Primary Prevention Trial results. II. The relationship of reduction in incidence of
coronary heart disease to cholesterol lowering. Journal of the American Medical
Association, 251: 365-374.
115
Lowe, G.D.O., Smith, W.C.S., Tunstall-Pedoe, H., Lee, A.J. & Rumley, A., 1988.
Cardiovascular risk and haemorheology: results from the Scottish Heart Health
Study and the MONICA-Project, Glasgow. Clinical Hemorheology, 8: 518-524.
Lowe, G.D.O., Lee, A.J., Rumley, A., Smith, W.C.S. & Tunstall-Pedoe, H., 1992.
Epidemiology of Haematocrit, white cell count, red cell aggregation and
fibrinogen: the Glasgow MONICA study. Clinical Hemorheology, 12: 535-544.
Lowe, G.D.O., 1993. The impact of fibrinogen on arterial disease. In: Topics in
preventive cardiology, Excerpta Medica, Netherlands, 21-25.
Luizzo, G., Biasucci, L.M., Gallimore, R., Grillo, R.L., Rebuzzi, A.G., Pepys, M.B.
& Maseri, A. 1994. New England Journal of Medicine, 331: 417-424.
McCully, K.S., 1990. Atherosclerosis, serum cholesterol and the homocysteine
theory: a study of 194 consecutive autopsies. American Journal of the Medical
Sciences, 299: 217-221.
Macfarlane, G.T. & Gibson, G.R., 1995. Microbiological aspects of the production
of short-chain fatty acids in the large bowel. In: Physiological and clinical aspects
of short-chain fatty acids, Cummings, J.H., Rombeau, J.L. & Sakata, T. (eds),
University Press, Cambridge, 87-106.
116
Mammen, E.F., 1995. Ten years' experience with the "Sticky Platelet Syndrome".
Clinical Application of Thrombosis / Haemostasis, 1 (1): 66-72.
Mammen, E.F., 1999. Sticky platelets syndrome. Seminars in Thrombosis and
Haemostasis, 25: 361-364.
Marckmann, P. & Jespersen, J., 1996. Low-fat / high-fiber diets and coagulation /
fibrinolysis. In: Nutrition, genetics and Heart disease. Bray, G.A. & Ray, D.H.
(eds), Baton Rouge, USA: Louisiana State University Press, 50-61.
Masuda, J. & Ross, R., 1990. Atherogenesis during low level
hypercholesterolemia in the non-human primate. I. Fatty streaks formation.
Arteriosclerosis, 10: 164-177.
Meade, T.W. & North, W.R.S., 1977. Population-based distributions of
haemostatic variables. British Medical Bulletin, 33: 283-288.
Meade, T.W., Brosovic, M., Chakrabati, R.R., Haines, A.P., Imeson, J.D.
Mellows, S., Miller, G.J., North, W.R.S., Strirling, Y. & Thompson, S.G., 1986.
Haemostatic and ischaemic heart disease: Principal results of the Northwick Park
Heart Study. The Lancet, 2: 533-537.
117
Meade, T.W., Stirling, Y., Thompson, S.G., Vickers, M.V., Woolf, L.,, Ajdukiewicz,
A.B., Steward, G., Davidson, J.F., Walker, I.D., Doughlas, A.S., Richardson, I.M.,
Weir, R.D., Aromaa, A., Impivaara, O., Maatela, J. & Hladovec, J., 1986a. An
international and interregional comparison of haemostatic variables in the study
of ischaemic heart disease: Report of the working group. International Journal of
Epidemiology, 15 (3): 331-336.
Mensink, R.P. & Katan, M.B., 1990. Effect of dietary trans-fatty acids on high-
density and low-density lipoprotein cholesterol levels in healthy subjects. New
England Journal of Medicine, 323: 439-445.
Miller, G.J., Martin, J.C., Webster, J., Miller, N.E., Wilkinson, W.H. & Meade,
T.W., 1986. Association between dietary fat and plasma factor VII coagulant
activity - A predictor of cardiovascular mortality. Atherosclerosis, 60: 269.
Miller, J., Carr, A., Emery, S., Law, M., Mallal, S., Baker, D., Smith, D., Kaldor, J.
& Cooper, D.A., 2003. HIV lipodystrophy: prevalence, severity and correlates of
risk in Australia. British HIV Association HIV Medicine, 4, 293-301.
Mills, J.D., Ariëns, R.A., Mansfield, M.W. & Grant, P.J., 2002. Altered fibrin clot
structure in the healthy relatives of patients with premature coronary artery
disease. Circulation, 106 (15): 1938-42.
118
Minick, C.R., 1981. Synergy of arterial injury and hypercholesterolemia in
atherogenesis. In: Vascular injury and atherosclerosis, Moore S (ed). Marcel
Dekker, New York, 149-173.
Moar, I., Hayek, T., Coleman, R. & Aviram, M., 1997. LDL oxidation leads to its
aggregation in the atherosclerotic apoprotein E-deficient mice. Arteriosclerosis,
Thrombosis and Vascular disease, 17: 2995-3005.
Mollentze, W.F., Moore, A.J., Steyn, A.F., Joubert, G., Steyn, K., Oosthuizen,
G.M. & Weich, D.J.V., 1995. Coronary heart disease risk factors in a rural and
urban Orange Free State black population. South African Medical Journal, 85
(2): 90-96.
Møller, L. & Kristensen, T.S., 1991. Plasma fibrinogen and ischaemic heart
disease risk factors. Atherosclerosis and Thrombosis, 11: 344.
Moore, S., 1981. Injury mechanisms in artherosclerosis. In: Vascular injury and
atherosclerosis, Moore S (ed). Marcel Dekker, New York, 149-173.
Muir, J.G., Lu, Z.X., Young, G.P., Cameron-Smith, D., Collier, G.R. & O’Dea, K.
1995. Resistant starch in the diet increase breath hydrogen and serum acetate in
human subjects. American Journal of Clinical Nutrition, 61, 792-799.
119
Nair, C.H., Shats, E.A. & Dhall, D.P., 1986. Effects of temperature, pH and ionic
strength and composition of fibrin network structure and its development.
Thrombosis Research, 42 (6): 809-816.
Nair, C.H., Azhar, A. & Dhall, D.P., 1991. Studies on fibrin network structure in
human plasma. Part one: Methods for clinical application. Thrombosis
Research, 64: 455-476.
Nair C.H. & Shats E.A., 1997. Compaction as a method to characterise fibrin
network structure: kinetic studies and relationship to crosslinking. Thrombosis
Research, 88: 381-387.
Nilsson, L.M., Ljungner, H. & Tengborn, L., 1985. Two different mechanisms in
patients with venous thrombosis and defective fibrinolysis: low concentration of
plasminogen activator or increased concentration of plasminogen activator
inhibitor. British Medical Journal, 290: 1453-56.
Nordøy, A. & Goodnight, S.H., 1990. Dietary lipids and thrombosis: relationship
to atherosclerosis. Arteriosclerosis, 10: 149-163.
Oelofse, A., Jooste, P.L., Steyn, K., Badenhorst, C.J., Lombard, C., Bourne, L. &
Fourie, J., 1996. The lipid and lipoprotein profile of the urban black South African
120
population of the Cape Peninsula - the BRISK study. South African Medical
Journal, 86 (2): 162 - 166.
Oliver, M.F., 1990. Lipids and coronary disease – resolved and unresolved
problems. British Medical Bulletin, 46: 865-872.
Oosthuizen, W., Voster, H.H., Jerlin, J.C., Barnard, H.C., Smuths, C.M., Silvis,
N., Kruger, A. & Venter, C.S., 1994. Both fish oil and olive oil lowered plasma
fibrinogen in women high baseline fibrinogen levels. Thrombosis and
Haemostasis, 72 (4): 557-562.
Ostermann, H. & van de Loo, J., 1996. Factors of the haemostatic system in
diabetic patients. Haemostasis, 16: 386.
Pan, W.H., Bai, C.H., Chen, J.R. & Chiu, H.C., 1997. Association between
carotid atherosclerosis and high factor VIII activity, dyslipidemia, and
hypertension. Stroke, 28: 88-94.
Packham, M.A. & Kinlough-Rathbone, R.L., 1994. Mechanism of atherogenesis
and thrombosis. In: Haemostasis and Thrombosis. Bloom, A.L., Forbes, C.D.,
Thomas, D.P. & Tuddenham, E.D.G. (eds), third edition, Churchill Livingstone,
London, vol 2: 1107-1138.
121
Pieters, M., Jerling, J.C. & Weisel, J.W., 2002. Effect of freeze-drying and frozen
storage of blood plasma on fibrin network characteristics. Thrombosis Research,
107: 263-269.
Polk, E., 1985. Unstable angina with fatal outcome, dynamic coronary
thrombosis, infarction and sudden death. Circulation, 71: 699-707.
Powell, K.E., Thompson, P.D. & Casperson, C.J., 1987. Physical activity and the
incidence of coronary heart disease. Annual Review of Public Health, 8: 253-
287.
Price, S.A. & Wilson, L.M., 2003. In: Pathophysiology Clinical concepts of
disease processes, sixth edition, Mosby, St. Louis, 103-107.
Qizilbash, N., 1995. Fibrinogen and cerebrovascular disease. European Heart
Journal, 16: 42-46.
Ratnoff, O.D. and Menzies, C., 1951. A new method for the determination of
fibrinogen in small samples of plasma. Journal of Laboratory and Clinical
Medicine, 37: 316-320.
Ratnoff, O.D. & Forbes, C.D., 1996. Disorders of Haemostasis, third edition. W.
B. Saunders Company.
122
Rémésy, C., Demigné, C. & Morand, C., 1995. Metabolism of short chain fatty
acids in the liver. In: Physiological and clinical aspects of short-chain fatty acids,
Cummings, J.H., Rombeau, J.L. & Sakata, T. (eds), University Press,
Cambridge, 171-190.
Renaud, S., 1990. Linoleic acid, platelet aggregation and myocardial infarction.
Atherosclerosis, 80: 255-256.
Renaud, S. & Lorgeril, M., 1992. Wine, alcohol, platelets and the French paradox
for coronary heart disease. The Lancet, 339: 1523-1526.
Ridker, P.M., Cushman, M., Stampfer, M.J., Tracy, R.P. & Hennekens, C.H.
1997. Inflammation, asprin, and the risk of cardiovascular disease in apparently
healthy men. New England Journal of Medicine, 336 (14): 973-979.
Roberts, W.C., 1989. Atherosclerosis risk factors – there are ten is there only
one? American Journal of Cardiology, 64: 552-554.
Ross, R., 1986. The pathogenesis of atherosclerosis – an update. New England
Journal of Medicine, 314: 488-500.
Ross, R., 1989. Platelet-derived growth factor. Lancet, i: 1179-1182.
123
Schafer, A.I., 1994. Hypercoagulable states: molecular genetics to clinical
practice. Lancet, 344: 1739-1742.
Scheppach, W.M., Fabian, C.E. & Kasper, H.W., 1987. Fecal short-chain fatty
acid (SCFA) analysis by capillary gas-liquid chromatography. American Journal
of Clinical Nutrition, 46: 641-646.
Seedat, Y.K., Mayet, F.G.H., Latiff, G.H. & Joubert, G., 1992. Risk factors and
coronary heart disease in Durban blacks - the missing link. South African
Medical Journal, 82: 251-256.
Siltanen, P., 1987. Stress, coronary disease, and coronary death. Annuals of
Clinical Research, 19: 96-103.
Silvis, N., Voster, H.H., De Jager, J., Huisman, H.W. & Mollentze, W.F., 1990.
Metabolic and haemostatic consequences of dietary fibre and n-3 fatty acids in
black type 2 (NIDDM) diabetic subjects: a placebo controlled study. International
Clinical Nutrition Review, 10 (3): 362-380.
Slabber, M., Kuyl, J.M., Badenhorst, A.M., Dannhauser, A., du Toit, E., Nel, M. &
Janse van Rensburg, E., 1997. Cardiovascular risk factors and dietary intake of
124
urban African men in South Africa. 4th International symposium on: Multiple risk
factors in cardiovascular disease, cardiac failure, and stroke.
Solomon, E.P., Schmidt, R.R. & Adragna, P.J., 1990. In: Human anatomy and
physiology, 2nd edition, Saunders College Publishing, Orlando, Florida, USA..
Solomons, N.W. & Gross, K., 1995. Urban nutrition in developing countries.
Nutrition Reviews, 5: 90-95.
Stampfer, M.J., Sacks, F.M., Salvini, S., Willett, W.C. & Hennekens, C.H., 1991.
A prospective study of cholesterol, apoproteins, and the risk of myocardial
infarction. New England Journal of Medicine, 325: 373-381.
Stampfer, M.J., Colditz, G.A., Wilett ,W.C., et al., 1991a. Postmenopausal
estrogen therapy and cardiovascular disease. Ten-years follow-up form the
Nurses’ Health Study. New England Journal of Medicine, 325: 756-762.
Stehbens, W.E., 1990. The epidemiological relationship of hypercholesterolemia,
hypertension, diabetes mellitus and obesity to coronary heart disease and
atherogenesis. Journal of Clinical Epidemiology, 43:733-741.
Steinberg, D., 1988. Antioxidants in the prevention of human atherosclerosis.
Circulation, 85: 2338-2344.
125
Steinberg, D., 1992. Metabolism of lipoprotein and their role in pathogenesis of
atherosclerosis. Atherosclerosis Reviews, 18: 1-6
Steyn, K., Jooste, P.L., Bourne, L., Fourie, J., Badenhorst, C.J., Bourne, D.E.,
Langenhoven, M.L., Lombard, C.J., Truter, H., Katzenellenbogen, J., Marais, M.
& Oelofse, A., 1991. Risk factors for coronary heart disease in the black
population of the Cape Peninsula. The BRISK study. South African Medical
Journal, 79: 480-485.
Steyn, K., Fourie, J. & Bradshaw, D., 1992. The impact of chronic disease of
lifestyle and their major risk factors on mortality in South Africa. South African
Medical Journal, 82: 227-231.
Stone, M.C. & Thorp, J.M., 1985. Plasma fibrinogen - a major coronary risk
factor. Journal of the Royal College of General Practitioners, 35: 565-569.
Summers, L.K.M., Marso, S.P. & Grant, P.J., 2004 Atherothrombosis,
thrombolysis and anti-platelets. In: Postgraduate Haematology. Hoffbrand, V.A.,
Catovsky, D. & Tuddenham, E.G.D. (eds), Fifth edition, 945-964, Blackwell
publishing, Massachusetts.
126
Surgue, D.D., Trayner, I., Thompson, G.R., Vere, V.J., Demison, J., Stirling, Y. &
Meade, T.W., 1985. Coronary artery disease and haemostatic variables in
heterozygous familial hypercholesterolaemia. British Heart Journal, 53: 265-268.
Topping, D.L. & Wong, S.H., 1994. Preventive and therapeutic aspects of dietary
fibre. In: Medical Practice of Preventive Nutrition. Wahiqvist, M.L., & Vobecky,
J.S., 179-198, London: Smith-Gordon & Co Ltd.
Topping, D.L. & Pant, I., 1995. Short-chain fatty acids and hepatic lipid
metabolism: experimental studies. In: Physiological and clinical aspects of short-
chain fatty acids, Cummings, J.H., Rombeau, J.L., & Sakata, T. (eds), University
press, Cambridge, 495-508.
Tyson, J.E., de Sa D.J. & Moore, S., 1976. Thromboatheromatous complication
of umbilical arterial catheterization in the newborn period. Archives of Disease in
Childhood, 51: 744-756.
Ulbright, T.L.V. & Southgate, D.A.T., 1991. Coronary heart disease: Seven
dietary factors. Lancet, 338: 985-992.
Van Gelder, J.M., Nair C.H. & Dhall, D.P., 1995. The permeability of fibrin
network developed in human plasma. Blood Coagulation Fibrinolysis, 6 (4): 293-
301.
127
Veldman, F.J., Nair, C.H., Voster, H.H., Vermaak, W.J.H., Jerling, J.C.,
Oosthuizen, W. & Venter, C.S., 1999. Possible mechanism through which dietary
pectin influences fibrin network architecture in hypercholesterolaemic subjects.
Thrombosis Research, 93: 253-264.
Veldman, F.J., 2000. Personal communication, in room 218, Dirk Coetzee
building, Central University of Technology, Free State, Bloemfontein. 25
October: 11h30.
Venter, C.S., Vorster, H.H., Silvis, N., Kruger, A., Mia, F. & Seftel, H.C., 1992.
Determinants of plasma fibrinogen levels in South African communities. In:
Fibrinogen: A new cardiovascular risk factor. Ernst, E., (ed), Vienna: Blackwell,
166-171.
Venter, C.S., Nel, C.J., Vorster, H.H., Jerling, J.C., Oosthuizen, W., Veldman,
F.J., Kellerman, J.A., Smuts, C.M., Vermaak, W.J.H., van der Nest, D.G. & De
Ridder J.H. 1997. Soluble-fibre concentrate lower plasminogen activator inhibitor-
1 in baboons (Papio ursinus). British Journal of Nutrition, 78: 625-637.
Virchow, R., 1856. Phlogose und Thrombose im Gefassystem. Gesämmelte
Abhandlugen zur Wissenchaftlichen Medicin. Staatsdruckerei, Frankfurt.
128
Vorster, H.H., Venter, C.S., Silvis, N., van Eden, T.S., Huisman, H.W. & Walker,
A.R.P., 1988. Dietary influences on haemostasis may be affected risk for
coronary heart disease. Suid-Afrikaanse Tydskrif vir Wetenskap, 84: 289-293.
Vorster, H.H., Cummings, J.H. & Jerling, J.C., 1997. Diet and haemostatic
processes. Nutrition Research Reviews, 10: 115-135.
Vorster, H.H., Cummings, J.H. & Veldman, F.J., 1997a. Diet and haemostasis:
time for nutrition science to get more involved. British Journal of Nutrition, 77:
671-678.
Walker, I.D., 2004. Inherited thrombophilia. In: Postgraduate Haematology.
Hoffbrand, V.A., Catovsky, D. & Tuddenham, E.G.D. (eds), Fifth edition, 885-899,
Blackwell publishing, Massachusetts.
Watson, S.P. & Harrison, P., 2004. The vascular function of platelets. In:
Postgraduate Haematology. Hoffbrand, V.A., Catovsky, D. & Tuddenham,
E.G.D. (eds), Fifth edition, 808-824, Blackwell publishing, Massachusetts.
Wilhelmsen, L., Svärdsudd, K., Korsan-Bengtsen, K., Larson, B., Welin, L. &
Tubblin, G., 1984. Fibrinogen as a risk factor for stroke and myocardial infarction.
The New England Journal of Medicine, 311, 501-505.
129
Wilhelmsen, L., 1988. Coronary heart disease: Epidemiology of smoking and
intervention studies in smoking. American Heart Journal, 115: 242.
Wilson, P.W.F., Aderson, K.M. & Castelli, W.P., 1991. The impact of triglycerides
on coronary heart disease. The Framingham study. Gotto A.M. Jr & Paoletti R.
(eds). Atherosclerosis Reviews, 22: 59-63.
Witterman, J.C.M., Grobbee, D.E., Kok, F.J., Hofman, A. & Valkenburg H.A.,
1989. Increased risk of atherosclerosis in women after the menopause. British
Medical Journal, 298: 642-644.
Wolever, T.M.S., Spadafora, P. & Eshuis, H., 1991. Interaction between colonic
acetate and propionate in humans. American Journal of Clinical Nutrition; 53:
681-687.
Wolf, P.A., 1994. Epidemiology of stroke. American Heart Association, Dallas:
Texas. Primer in Preventative Cardiology, 68-69.
Wrong, O.M., 1995. Definitions and history. In: Physiological and clinical aspects
of short-chain fatty acids, Cummings, J.H., Rombeau, J.L. & Sakata, T. (eds),
University Press, Cambridge, 1-14.
130
Yarnell, J.W.G., Baker, I.A., Sweetnam, P.M., Bainton, D., O’Brein, J.R.,
Whitehead, P.J. & Elwood, P.C., 1991. Fibrinogen, viscosity, and white blood cell
are major risk factors for ischemic heart disease. The Caerphilly and
Collaborative Heart Disease Studies. Circulation, 83: 836-844.
Young, G.P. & Gibson, P.R., 1995. Butyrate and human cancer cell. In:
Physiological and clinical aspects of short-chain fatty acids, Cummings, J.H.,
Rombeau, J.L. & Sakata, T. (eds), University Press, Cambridge, 319-336.

131
APPENDIX: A
CONSENT FORM
THE EFFECTS OF SHORT-CHAIN FATTY ACIDS ON HAEMOSTATIC RISK FACTORS FOR CARDIOVASCULAR HEART DISEASES IN WESTERNISED BLACK MEN
DECLARATION BY OR ON BEHALF OF THE PARTICIPANT I, undersigned, ……………………………………………………………………………………………………………... of …………………………………………………………………………………………………………………………….. …………………………………………………………………………………………………………………… (Address) Identity number: …………………………………………… A I confirm that: 1. I have been asked to participate in the above-mentioned research project, carried out by the
Fibrinogen Unit, Technikon Free State and University of the Orange Free State. 2. The information including the purpose of the study, advantages and disadvantages have been
completely explained to me. 3. I give my permission for the use of the results obtained in this research project for publication
purpose, thus making other scientists aware of the findings as long as my anonymity is protected at all times. The information obtained will be confidential.
4. It was clearly explained to me that I can refuse to participate in this study or I can withdraw my
permission to participate at any time. If I refuse or withdraw, I will not be disadvantaged in any way and it will not be held against me.
5. The information was explained to me by
…………………………………………………………….. (name of interviewer) in …………………... (language) and I confirm that I have good command of this language and understood the explanations. I was also given the opportunity to ask questions on things I did not understand, and I can also ask further questions at any time during the project.
6. No pressure was applied on me to take part in this research project. B I hereby agree voluntarily to take part in this research project. Signed/confirmed at ………………………………………….... on ………………………...2000 …………………………………….. (signature) ………………………………………
Participant Witness

132
DECLARATION BY OR ON BEHALF OF RESEARCHER I, ………………………………………………………………………………………..…………., declare that: 1. I have explained the information in this document and about the project to
…………………………….. ……………………………..……….. (name of participant).
2 I asked the participant to ask any questions if something was not clear. 3 That the interview was conducted in English, Afrikaans, or ………………….. (language) OR that
the interview was conducted in ……………………. (language) with the help of a translator, …………………………………………(name of translator).
Signed/confirmed at ………………………………………….... on ………………………...2000 …………………………………….. (signature) ……………………………………… Researcher or his representative Witness
DECLARATION BY TRANSLATOR I, ………………………………………………………………………………………..…………., declare that: 1 I have translated the content of this document from English/Afrikaans into …………………..
(language) to …………………………………………..…. (name of participant) and that I have translated the participant’s questions to the researcher or his/her representative as well as the answers of the latter to the participant.
2 That the information that I have so translated was a correct interpretation of what I was asked to
translate Signed/confirmed at ………………………………………….... on ………………………...2000 …………………………………….. (signature) ………………………………………
Translator Witness

133
FOROMO YA TUMELLO
FATTY ACIDS TSA KETANE TSE KHOTSWANE DI TSHWENYA JWANG MATSHWAO A LEFU LA PELO MO BANNENG BA BATHO BANTSHO
BOIKANO KA, KAPA MO SEBAKENG SA MO NKA KAROLO Nna, …………………………………………………………………………………………………… mo nka karolo, wa …………………………………………………………………………………………………………………………… ……………………………………………………………………………………………………………………. (aterese) Nomoro ya boitsibiso: …………………………………… A Ke dumela hore: 1. Ke kopilwe hore ke nke karolo resetjheng eo ho buiwang ka yona hodimo, e etswa ke Fibrinogen
Unit, Technikon ya Foreisetata le University ya Foreisetata. 2. Ke hlaloseditswe maikemisetso, melemo le dikotsi tsa resetjhe ena ka botlalo. 3. Ke fana ka tumello ya ka hore diphetho tsa resetjhe ena di sebedisetswe ho ngola atikele etla
tsibisa bo rra saense ba bang ka diphitlhelelo tsena, empa dipheto di tla ba sephiri, feela di tla sebediswa fa lebitso la ka le sa hlahe ka nako tsohle.
4. Ke hlaloseditswe hore nka hanna ho nka karolo, kapa nka hula tumello ya ka ya ho nka karolo ka
nako e ngwee le e ngwee, mme sena ha se na ho sebediswa kgahlano le nna. 5. Ke hlaloseditswe ka resetjhe ke
…………………………………………………………………………….. (lebitso la mohlalosi) ka ………………………(puo) ke a dumella hore puo ena ke a e utlwisisa le hona ho e tseba. Ke fuwe sebaka sa ho botsa dipotso ka dintho tseo ke neng ke sa di utlwisise, ke utlwisisa hore nka botsa ka nnako e ngwee le e ngwee ha resetjhe e tsweletse.
6. Ha ke a bewa ka tlasa khatelelo hore ke nke karolo mo resetjheng ena. B. Ke dumella ka ho rata ha ka ho nka karolo mo resetjheng ena. E saennwe ……………………………………………. . (sebaka), ka la …………………………….. 2000 …………………………………………. ………………………………………….
Mo nka karolo Paki

134
BOIKANO KA KAPA MO SEBAKENG SA MORESETJHI Nna, ……………………………………………………………………………………………, ke ikana hore: 1. Ke hlaloseditse ……………………………………………………………………… (lebitso la mo
nka karolo) ka resetjhe le foromo ena. 2. Ke bolleletse mo nka karolo ho botsa dipotso ha e ba a sa utlwisise 3. Dipotso le thlahiso lesedi di ne di nne di le ka English, Afrikaans, kapa
………………………(puo); kapa dipotso di ne di botswa ka ……………………..(puo) ka thuso ya mofetoledi, ……………………… ……………………….(lebitso la mofetoledi).
E saennwe ……………………………………………. . (sebaka), ka la …………………………….. 2000 …………………………………………. ………………………………………….
Moresetjhi Paki
BOIKANO KA MOFETOLEDI
Nna, ……………………………………………………………………………………………, ke ikana hore: 1. Ke fetoletse ntshetso lesedi le dipotso ho tswa ho English/Afrikaans ho ya ho
…………………………... (puo) ho ………………………………………………………..(lebitso la mo nka karolo), le dikarabo ho tswa ho moresetjhi ho ya ho mo nka karolo.
2. Ke fetoletse di ntho tseo ho neng ho thwe ke di fetolele hantlhe E saennwe ……………………………………………. . (sebaka), ka la …………………………….. 2000 …………………………………………. ………………………………………….
Mofetoledi Paki

135
APPENDIX: B
TECHNIKON FREE STATE FIBRINOGEN UNIT
SCFA PROJECT: RECRUITMENT QUESTIONNAIRE
DATE: ______/__________/_________ INTERVIEWER: ___________________ SURNAME AND INITIALS: __________________________________________________ HOUSE DOCTOR: _________________________________________________________ PATIENT: NAME:_________________________________________ ADDRESS:______________________________________ ______________________________________ ______________________________________ SECTION/DEPARTMENT:____________________ TEL: ____________________________ AGE: ______years______months SMOKING HABITS: YES NO BODY MASS: ____________cm
136
LENGTH: ____________kg BLOOD PRESSURE: _____/_____ ACTIVITY LEVEL: INACTIVE MEDIUM ACTIVE ACTIVE FAMILY HISTORY: CORONARY HEART DISEASE _____ DIABETES MELLITUS _____ HYPERCHOLESTEROLAEMIA _____ OTHER (specify): _____________________________________ MEDICAL HISTORY:
ANGINA/CORONARY HEART DIASEASE _____ MYOCARDIAL INFARCTION _____ STROKE _____ BYPASS _____ BLOOD CLOTS _____ HIGH BLOOD PRESSURE _____ DIABETES TYPE I/II _____ FAMILIAL CHOLESTEROL _____ ANY CHRONIC DISEASES MEDICATION: YES NO SPECIFY:_______________________________________
137
HOW OFTEN DO YOU USE ALCOHOL:
DAILY WEEKLY MONTHLY OTHER: __________________________
BLOOD TESTS BLOOD CHOLESTEROL: _________ FASTING GLUCOSE: _________ PLASMA FIBRINOGEN: _________ FOR OFFICE USE ONLY: SUBJECT: APPROVED REJECTED ASSIGNED SUBJECT NO:

138
APPENDIX:C
QUESTIONNAIRE FOR SUBJECTS WHO COMPLETED THE STUDY
Please answer the following questions regarding your participation in the research study: Respondent number: _______________________ Employee Number: _______________________ 1. Did you experience any vomiting during the study? 1. Yes 2. No If yes, how many times? 1. After each meal 2. Once a day 3. Once a week 4. Other 2. Did you experience any flatulence during the study? 1. Yes 2. No If yes, how many times? 1. After each meal 2. Once a day 3. Once a week 4. Other 3. Did you experience any stomach cramps during the study? 1. Yes 2. No If yes, how many times? 1. After each meal 2. Once a day 3. Once a week 4. Other

139
4. Did you experience any changes in your lifestyle during the study? 1. Yes 2. No If yes, describe the changes:
5. Did you experience any constipation during the study? 1. Yes 2. No If yes, how frequent? 1. After each meal 2. Once a day 3. Once a week 4. Other 6. Did you experience an increased appetite during the study? 1. Yes 2. No If yes, explain:
7. Did you experience any changes in your alcohol consumption during the study? 1. Yes 2. No If yes, to what extent?

140
8. Did you use any medication/supplements during the study? 1. Yes 2. No If yes, what is the name of the medication/supplement you used?
If yes, how many times did you use this medication/supplement? 1. After each meal 2. Once a day 3. Once a week 4. Other and for how long (days)? 9. Did you consume all of the experimental capsules every day? 1. Yes 2. No 10. Was the amount of capsules consumed acceptable? 1. Yes 2. No 11. Would you be willing to consume these capsules daily if they are considered as healthy? 1. Yes 2. No 12. Did you experience any other side-effects of the supplement during the study? 1. Yes 2. No If yes, please specify?
If yes, how frequent? 1. After each meal 2. Once a day 3. Once a week 4. Other

141
13. Did you experience any positive effects on your health during the study? 1. Yes 2. No If yes, explain.
14. Do you have any other comments you would like to make regarding the study?
The research team would like to thank you for your co-operation during the study. The project is very important for gaining new scientific knowledge.

142
APPENDIX D