Embed Size (px)
Citation preview
Eastern Michigan University Eastern Michigan University
DigitalCommons@EMU DigitalCommons@EMU
Senior Honors Theses & Projects Honors College
2013
Short chain fatty acid production by probiotic organisms in the Short chain fatty acid production by probiotic organisms in the
gastrointestinal tract gastrointestinal tract
Elyssa Rautiola Eastern Michigan University, [email protected]
Follow this and additional works at: https://commons.emich.edu/honors
Part of the Chemistry Commons
Recommended Citation Recommended Citation Rautiola, Elyssa, "Short chain fatty acid production by probiotic organisms in the gastrointestinal tract" (2013). Senior Honors Theses & Projects. 328. https://commons.emich.edu/honors/328
This Open Access Senior Honors Thesis is brought to you for free and open access by the Honors College at DigitalCommons@EMU. It has been accepted for inclusion in Senior Honors Theses & Projects by an authorized administrator of DigitalCommons@EMU. For more information, please contact [email protected].
Short chain fatty acid production by probiotic organisms in the gastrointestinal Short chain fatty acid production by probiotic organisms in the gastrointestinal tract tract
Abstract Abstract Interest in determining the mechanism by which pro biotic bacteria in the gastrointestinal tract produce short chain fatty acids (SCFA) has increased over the past few years. This study uses gas chromatography and mass spectrometry to characterize lactate production in aerobic test tube cultures, aerobic bioreactor cultures, and anaerobic bioreactor cultures. To collect anaerobic bioreactor samples, a novel in vitro anaerobic model was developed. The pH and colony forming units of each bacterial sample was also measured in order to understand the correlation between lactate production and bacterial growth. The purpose of this study was to analyze production of SCFA in co-cultures and to develop an anaerobic model to analyze SCFA production by anaerobic bacteria. 4
Degree Type Degree Type Open Access Senior Honors Thesis
Department Department Chemistry
First Advisor First Advisor Steven Pernecky, PhD
Second Advisor Second Advisor Lynne Shetron-Rama, PhD
Keywords Keywords anaerobic, biofilm, lactate
Subject Categories Subject Categories Chemistry
This open access senior honors thesis is available at DigitalCommons@EMU: https://commons.emich.edu/honors/328
SHORT CHAIN FATTY ACID PRODUCTION BY PROBIOTIC ORGANISMS IN
THE GASTROINTESTINAL TRACT
By
Elyssa Rautiola
A Senior Thesis Submitted to the
Eastern Michigan University
Honors College
in Partial Fulfillment ofthe Requirements for Graduation
with Honors in Chemistry
Approved at Ypsilanti, Michigan, on this date (),._' :\ \ S 1 LD\2:)
1
TABLE OF CONTENTS
ABSTRACT .................................................................................................. .4
INTRODUCTION .................................................................................... 5
The Gastrointestinal Tract ........................................................................... 5
Short Chain Fatty Acids .............................................................................. 6
Biofilms ................................................................................................ 7
Research Objective .......................................................................................... &
MATERIAL AND METHODS ..................................................................... 9
Preparation of standards and biological samples ................................................. 9
Extraction of SCFA from biological samples ..................................................... 9
Gas Chromatography Mass Spectrometry ....................................................... 10
Anaerobic environment ............................................................................. 11
Bacterial growth ..................................................................................... 12
Bacterial strains ...................................................................................... 13
Quantitation of bacterial strains .................................................................. .13
Collection of the supernatant and pellet .......................................................... 14
RESULTS ............................................................................................ l5
Production oflactate as a function of bacterial growth ...................................... 16
2
Comparison of SCFA production between microbial strains ................................. 17
Effects of co-culturing on lactate levels .......................................................... 18
Aerobic enviromnent ............................................................................... 19
Anaerobic enviromnent.. ........................................................................... 22
DISCUSSION ....................................................................................... 26
Production oflactate at various points of growth .............................................. .26
Lactate levels in co-cultures ........................................................................ 26
Aerobic conditions .................................................................................. 27
Development of the anaerobic enviromnent .............................. , ...................... 27
Anaerobic growth conditions ..................................................................... 28
CONCLUSION .................................................................................... .30
ACKNOWLEDGMENTS ........................................................................ .32
REFERENCES ...................................................................................... 33
3
ABSTRACT
Interest in determining the mechanism by which pro biotic bacteria in the
gastrointestinal tract produce short chain fatty acids (SCFA) has increased over the past
few years. This study uses gas chromatography and mass spectrometry to characterize
lactate production in aerobic test tube cultures, aerobic bioreactor cultures, and anaerobic
bioreactor cultures. To collect anaerobic bioreactor samples, a novel in vitro anaerobic
model was developed. The pH and colony forming units of each bacterial sample was
also measured in order to understand the correlation between lactate production and
bacterial growth. The purpose of this study was to analyze production of SCFA in co
cultures and to develop an anaerobic model to analyze SCFA production by anaerobic
bacteria.
4
INTRODUCTION
The Gastrointestinal Tract
The human gastrointestinal (GI) tract is populated by an array of microbial
communities. These communities function together with the host in a mutualistic fashion
to support host metabolism and various other processes including development of the
immune system, energy production, and vulnerability to disease (1 ). The bacteria are
present in concentrations of up to 101!-1012 cells/g which equates to up to 100 trillion
bacteria overall (2). The bacteria not only vary greatly in number, but also in the type of
species. The most common types include Bacteriodetes, Bifidobacterium, Eubacterium,
Fusobacterium, Clostridium, Lactobacillus, and Enterococcus (8).
Microbes that have a positive influence on microbe-microbe and host-microbe
interactions are considered probiotics. These microbes are non-pathogenic and have
beneficial effects on host health (3). A study investigating the effects of Lactobacillus
rhamnosus on micro biota composition demonstrated that daily consumption of probiotics
can improve health and decrease allergic disorders (8). Of particular interest is the effect
of probiotics in the GI tract as they have a positive influence on the production of SCFA
(3).
There are both aerobic and anaerobic bacteria present in the GI tract. Those
bacteria that can only grow in the presence of oxygen are considered obligate aerobes.
The oxygen is necessary for them to undergo aerobic respiration to produce A TP.
Bacteria that can undergo either aerobic respiration or fermentation are facultative
anaerobes while those that grow only in the absence of oxygen are considered obligate
anaerobes and undergo fermentation, producing SCF As (11 ).
5
Short Chain Fatty Acids
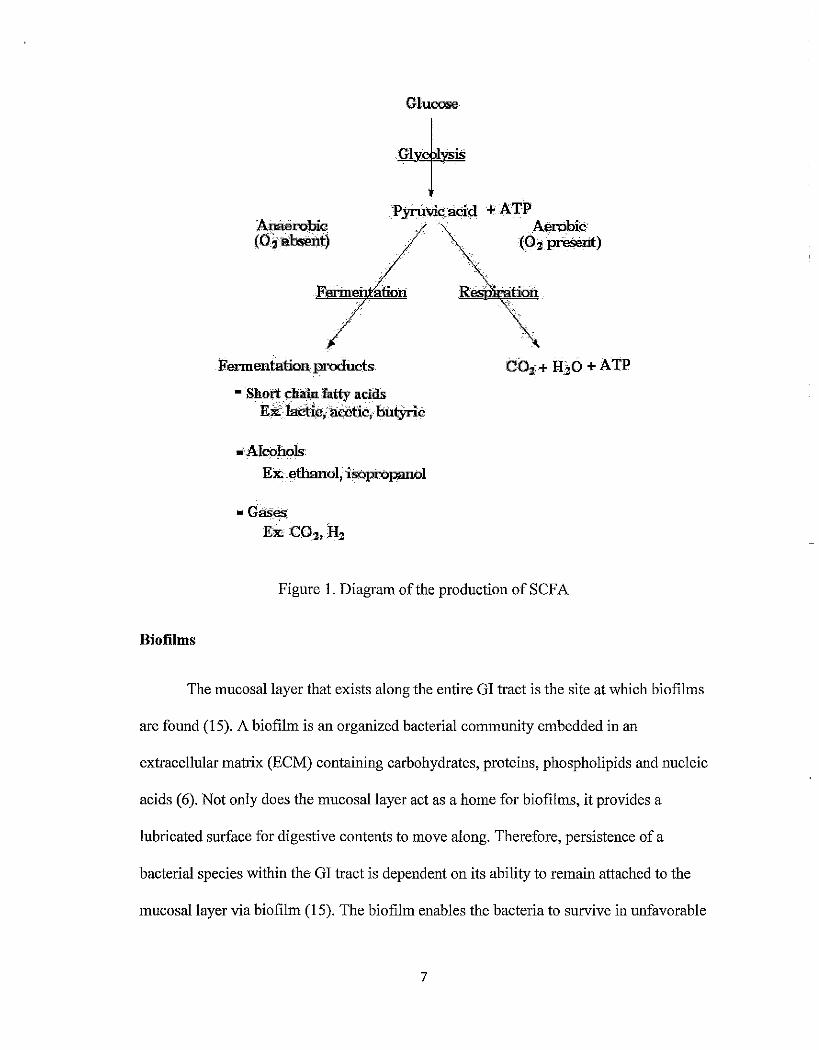
Short chain fatty acids are fermentation products from the bacteria residing in the
GI tract (see Figure 1 ). These bacteria use carbohydrates as their primary source of
energy. SCFA are carboxylic acids that have other functional groups attached to their
carbon atoms. The amount of SCF As produced depends on different factors such as site
of fermentation, diet, time spent in the GI tract, and the composition of the bacteria
present (7). Although most of the SCFAs are absorbed in the colon, 10 to 20% are
excreted in the feces ( 4 ). There are several types of SCF As produced as a result of
metabolic activity, including acetic, propionic, butyric, and lactic acids. Ofthese SCFAs,
butyrate and lactate are of particular interest. Butyrate has been shown to have anti
inflammatory properties along with inhibiting growth and inducing apoptosis of human
colonic carcinoma cells (5). It is also the preferred source of energy for host cells in the
GI tract and is involved in many cellular processes such as repair of the gut mucosal
lining, stimulation of the autonomic nervous system and production of hormones
associated with the GI tract (12).
Lactic acid is another short chain fatty acid that is important to monitor. Bacteria
in the GI tract that produce lactate include lactobacilli, bifidobacteria, enterococci,
streptococci and Eubacterium (9). Although lactate is an important SCF A, it does not
appear to be a major fermentation product as lactate is also used by other bacteria in the
environment, especially the butyrate producing bacteria. This being the case, by putting
both lactate-producing and butyrate-producing bacteria together, a significant amount of
lactate will be converted to butyrate, maximizing the amount of butyrate produced (9).
6
Biofilms
Glucose
+ Pyrit\iic_aci~ + ATP
Fermentation products
• Short chliin fatty acids · EX: lactic, adetic, butyric
•Alc!Jhols
E_X. .l:ltllimol, isopropanol
• Gases. E:rc CO:z,H2
A<!l"Phic (Oi present)
- .. 001 + HlO + Al'P
Figure I. Diagram of the production of SCFA
The mucosal layer that exists along the entire GI tract is the site at which biofilms
are found (15). A biofilm is an organized bacterial community embedded in an
extracellular matrix (ECM) containing carbohydrates, proteins, phospholipids and nucleic
acids ( 6). Not only does the mucosal layer act as a home for biofilms, it provides a
lubricated surface for digestive contents to move along. Therefore, persistence of a
bacterial species within the GI tract is dependent on its ability to remain attached to the
mucosal layer via biofilm (15). The biofilm enables the bacteria to survive in unfavorable
7
conditions via expression of bacterial phenotypes not normally expressed in planktonic
cells (10). Living in close quarters to one another, bacteria have the benefit of using one
another's metabolic products. This is especially the case with the butyrate producers using
the fermentation product oflactate producers to fuel their own metabolic reactions.
Research Objective
There are two main objectives of this study; the first objective is to analyze SCFA
levels in bacterial samples to determine when bacteria produce the most SCF A and to
determine how lactate levels differ in co-cultures of bacteria versus monocultures. The
second objective is to develop a novel in vitro anaerobic model to closely mimic the
conditions and characteristics ofbiofilms in the gut to study SCFA production by
anaerobic bacteria.
8
MATERIALS AND METHODS
Part 1: Characterization of short chain fatty acids in test tube cultures
Preparation of standards and biological samples
The lactate standard was prepared in acetonitrile to a fmal concentration of 200
mg/L. The internal standard used was 1 ,3-propanediol which was also prepared in
acetonitrile to a final concentration of 200 mg/L.
Biological samples (see Table 1) were prepared as test tube cultures. These
cultures were inoculated in single test tubes with 10 mL of pre-reduced reinforced
clostridial media (RCM) and grown overnight. Then, 100 IlL of each overnight was put
into tubes with 10 mL RCM for growth in an anaerobic jar at 37-39·c. These tubes were
left to grow for either 24, 48, or 72 hours. The bacterial samples were then analyzed via
Gas Chromatography/ Mass Spectrometry (GC-MS) to determine the amount ofSCFA
present.
Extraction of SCFA from biological samples
Extraction of the SCFA from the biological sample was necessary for analysis by
GC-MS. In this process, the SCFA are removed from the media and isolated to be easily
quantified. To do -this, the sample was acidified with 0.6 M HCl and vortexed for one
minute. Ether was then added and the solution was centrifuged for 5 minutes at 2000 g.
The resulting top layer containing the ether and SCF A was extracted off and saved. This
process was repeated for a total of five times to ensure all the SCF A were collected. The
ether was left to evaporate, leaving only the SCFA behind. Once all the ether was gone,
the internal standard (1,3-propanediol) and catalyst (anhydrous pyridine) were added. The
9
resulting solution was vortexed and the derivitizing agent (MTBSTFA in TBDMCS) was
added. The samples were then covered and placed in a heating block at 70°C for 4 hours.
Once removed, ethyl acetate was added, the samples were vortexed and then analyzed via
GC-MS.
Gas Chromatography Mass Spectrometry
Measurement of the amount of short chain fatty acid produced by a bacterial
strain was achieved using GC-MS. The injector type used was a standard split injector
with an injector temperature of270 °C. Helium was chosen as the carrier gas and had a
flow rate of0.6 mL/min. The column temperature was 70 °C for the first minute, and
then increased at the rate of20 °C per minute to 160 °C where it was held for 3.5 min.
The temperature was then raised to 280 °C at a rate of 3 5 °C per minute. The total run
time of a sample wa~ 12.43 minutes.
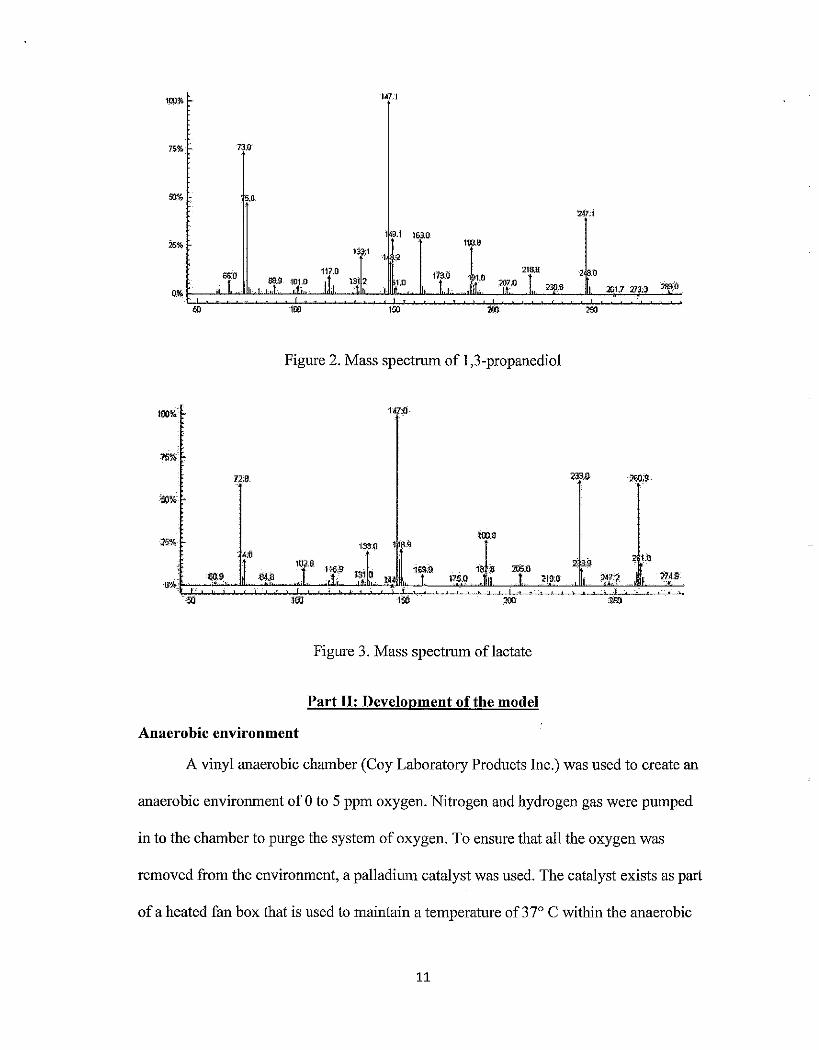
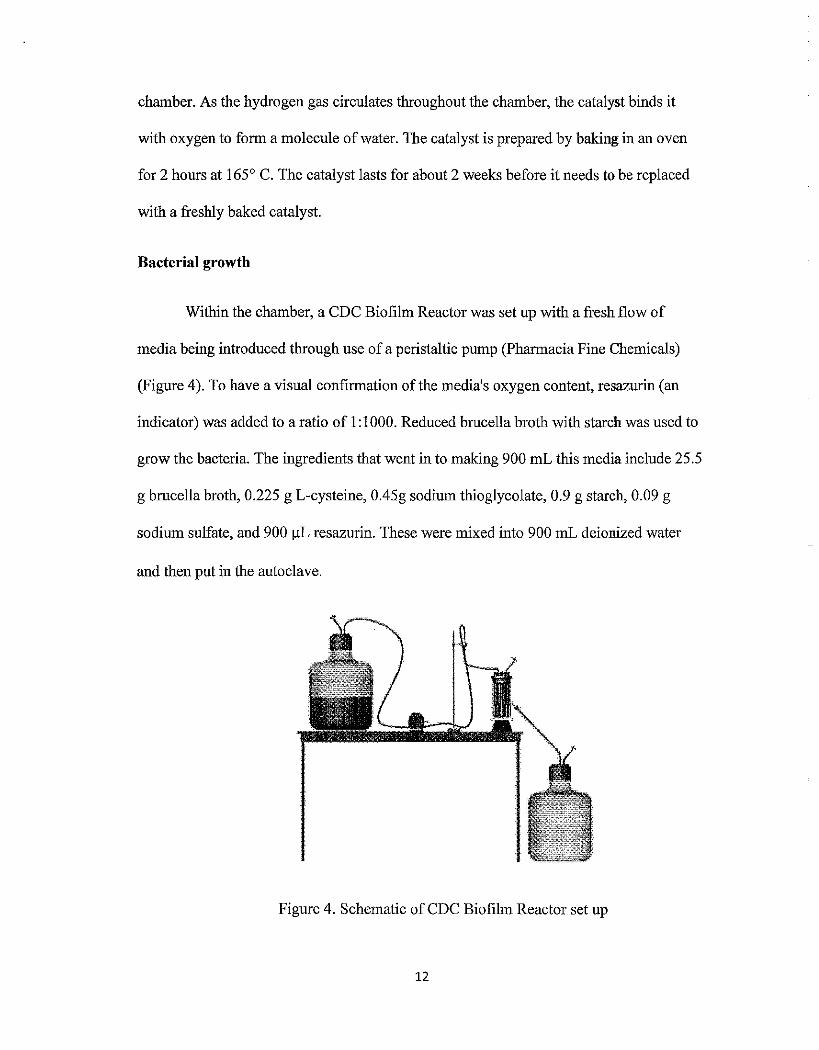
There were 4 peaks of interest when analyzing the mass spectrum. The internal
standard produces ions that have a mass to charge ratio of219 and 247 and lactate
produces ions that have a mass to charge ratio of233 and 261. When examining mass
spectrum from these molecules, there should be peaks at those specified values. The mass
spectrum for the lactate and the internal standard are shown respectively in Figures 2 and
3.
10
100% 147,1
""
5.0
241':1
1 .i 163.0
""' 100.a 133:i
·1 '2
1;[;0 'Y" 2i~ 2 .0
''1:' 1~J_:O l3i2 1~ 1 tO wn 230,8 261.7 273;3 "289))
100 '"' :100 200
Figure 2. Mass spectrum of 1 ,3-propanediol
1001<
71:9
Figure 3. Mass spectrum oflactate
Part II: Development ofthe model
Anaerobic environment
A vinyl anaerobic chamber (Coy Laboratory Products Inc.) was used to create an
anaerobic environment of 0 to 5 ppm oxygen. Nitrogen and hydrogen gas were pumped
in to the chamber to purge the system of oxygen. To ensure that all the oxygen was
removed from the environment, a palladimn catalyst was used. The catalyst exists as part
of a heated fan box that is used to maintain a temperature of 37° C within the anaerobic
11
chamber. As the hydrogen gas circulates throughout the chamber, the catalyst binds it
with oxygen to form a molecule of water. The catalyst is prepared by baking in an oven
for 2 hours at 165° C. The catalyst lasts for about 2 weeks before it needs to be replaced
with a freshly baked catalyst.
Bacterial growth
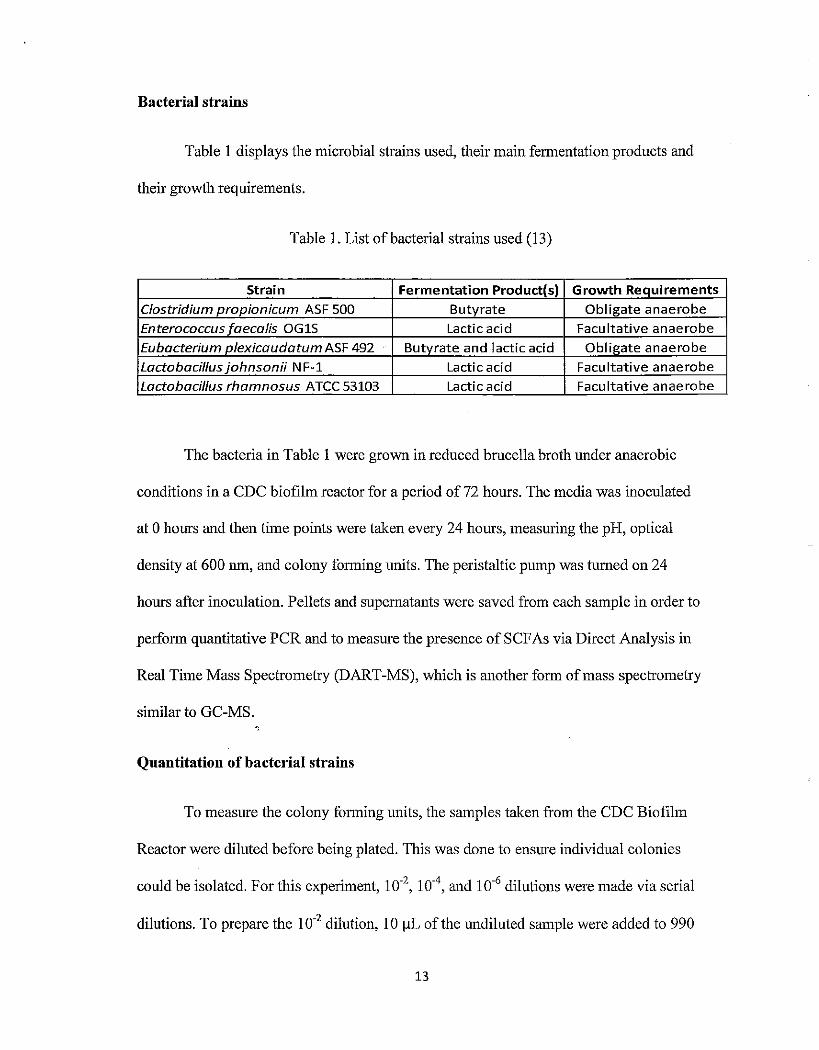
Within the chamber, a CDC Biofilm Reactor was set up with a fresh flow of
media being introduced through use of a peristaltic pump (Pharmacia Fine Chemicals)
(Figure 4). To have a visual confirmation of the media's oxygen content, resazurin (an
indicator) was added to a ratio of I: 1000. Reduced brucella broth with starch was used to
grow the bacteria. The ingredients that went in to making 900 mL this media include 25.5
g brucella broth, 0.225 g L-cysteine, 0.45g sodium thioglycolate, 0.9 g starch, 0.09 g
sodium sulfate, and 900 IlL resazurin. These were mixed into 900 mL deionized water
and then put in the autoclave.
Figure 4. Schematic of CDC Biofilm Reactor set up
12
Bacterial strains
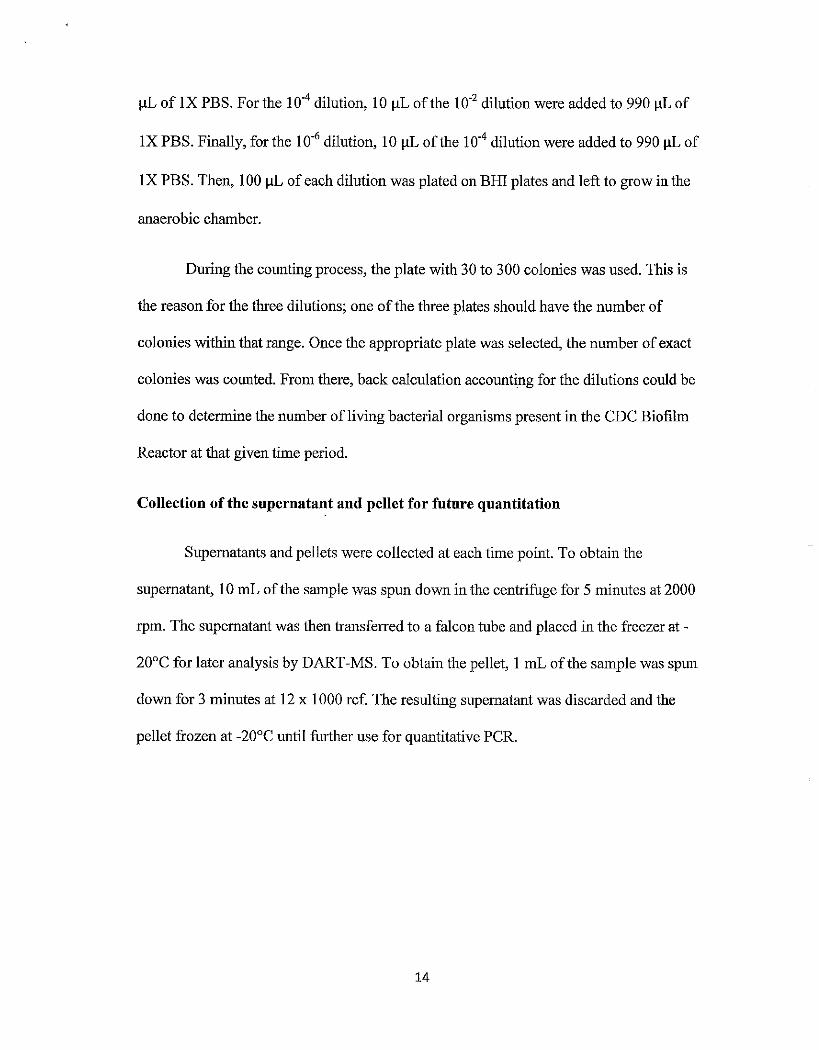
Table 1 displays the microbial strains used, their main fermentation products and
their growth requirements.
Table 1. List of bacterial strains used (13)
Strain Fermentation Product(s) Growth Requirements
Clostridium propionicum ASF 500 Butyrate Obligate anaerobe
Enterococcus faecalis OG1S Lactic acid Facultative anaerobe
Eubacterium plexicaudatum ASF 492 ·· Butyrate and lactic acid Obligate anaerobe
Lactobacillus johnsonii N F-1 Lactic acid Facultative anaerobe
Lactobacillus rhamnosus ATCC 53103 Lactic acid Facultative anaerobe
The bacteria in Table 1 were grown in reduced brucella broth under anaerobic
conditions in a CDC biofilm reactor for a period of 72 hours. The media was inoculated
at 0 hours and then time points were taken every 24 hours, measuring the pH, optical
density at 600 nm, and colony forming units. The peristaltic pump was turned on 24
hours after inoculation. Pellets and supernatants were saved from each sample in order to
perform quantitative PCR and to measure the presence of SCFAs via Direct Analysis in
Real Time Mass Spectrometry (DART-MS), which is another form of mass spectrometry
similar to GC-MS. ·.
Quantitation of bacterial strains
To measure the colony forming units, the samples taken from the CDC Biofilm
Reactor were diluted before being plated. This was done to ensure individual colonies
could be isolated. For this experiment, 10-2, 10-4
, and 10'6 dilutions were made via serial
dilutions. To prepare the 1 o-2 dilution, 10 11L ofthe undiluted sample were added to 990
13
IlL of 1 X PBS. For the 104 dilution, 10 IlL of the 10·2 dilution were added to 990 IlL of
IX PBS. Finally, for the 10·6 dilution, 10 IlL of the 10·4 dilution were added to 990 IlL of
IX PBS. Then, 100 IlL of each dilution was plated on BHI plates and left to grow in the
anaerobic chamber.
During the counting process, the plate with 30 to 300 colonies was used. This is
the reason for the three dilutions; one of the three plates should have the number of
colonies within that range. Once the appropriate plate was selected, the number of exact
colonies was counted. From there, back calculation accounting for the dilutions could be
done to determine the number ofliving bacterial organisms present in the CDC Biofilm
Reactor at that given time period.
Collection ofthe supernatant and pellet for future quantitation
Supernatants and pellets were collected at each time point. To obtain the
supernatant, 10 mL of the sample was spun down in the centrifuge for 5 minutes at 2000
rpm. The supernatant was then transferred to a falcon tube and placed in the freezer at -
20°C for later analysis by DART-MS. To obtain the pellet, 1 mL of the sample was spun
down for 3 minutes at 12 x 1000 ref. The resulting supernatant was discarded and the
pellet frozen at -20°C until further use for quantitative PCR.
14
RESULTS
Part 1: Characterization of short chain fatty acids in test tube cultures
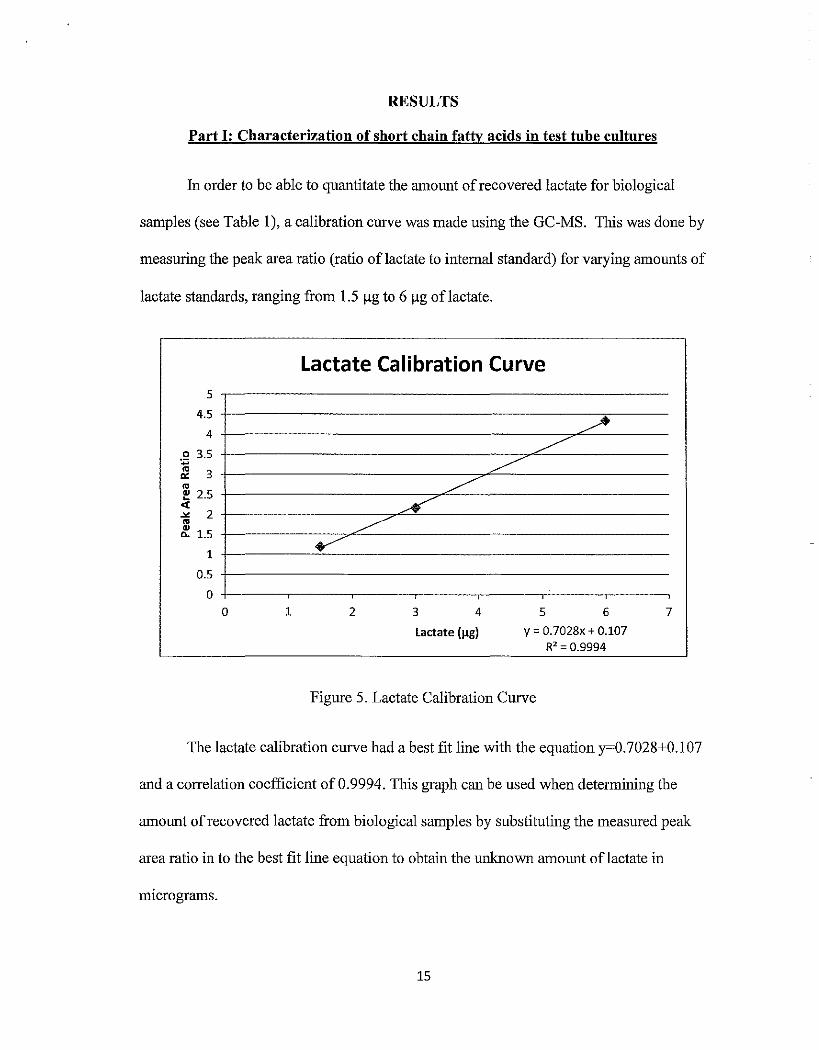
lu order to be able to quantitate tbe amount of recovered lactate for biological
samples (see Table 1 ), a calibration curve was made using tbe GC-MS. This was done by
measuring tbe peak area ratio (ratio oflactate to internal standard) for varying amounts of
lactate standards, ranging from 1.5 llg to 6 !lg of lactate.
5
4.5
4
.Q 3.5 -::. 3
"' ~ 2.5 <(
""' 2 "' ~ 1.5
1
0.5
0
0 1
Lactate Calibration Curve
__.../ /
__.../
~
' 2 3 4
Lactate (J.lg)
__.../
_____.
__.../
5 6
y = 0.7028x + 0.107 R' = 0.9994
Figure 5. Lactate Calibration Curve
7
The lactate calibration curve had a best fit line witb tbe equation y=0.7028+0.107
and a correlation coefficient of 0.9994. This graph can be used when determining the
amount of recovered lactate from biological samples by substituting tbe measured peak
area ratio in to the best fit line equation to obtain tbe unknown amount oflactate in
miCrograms.
15
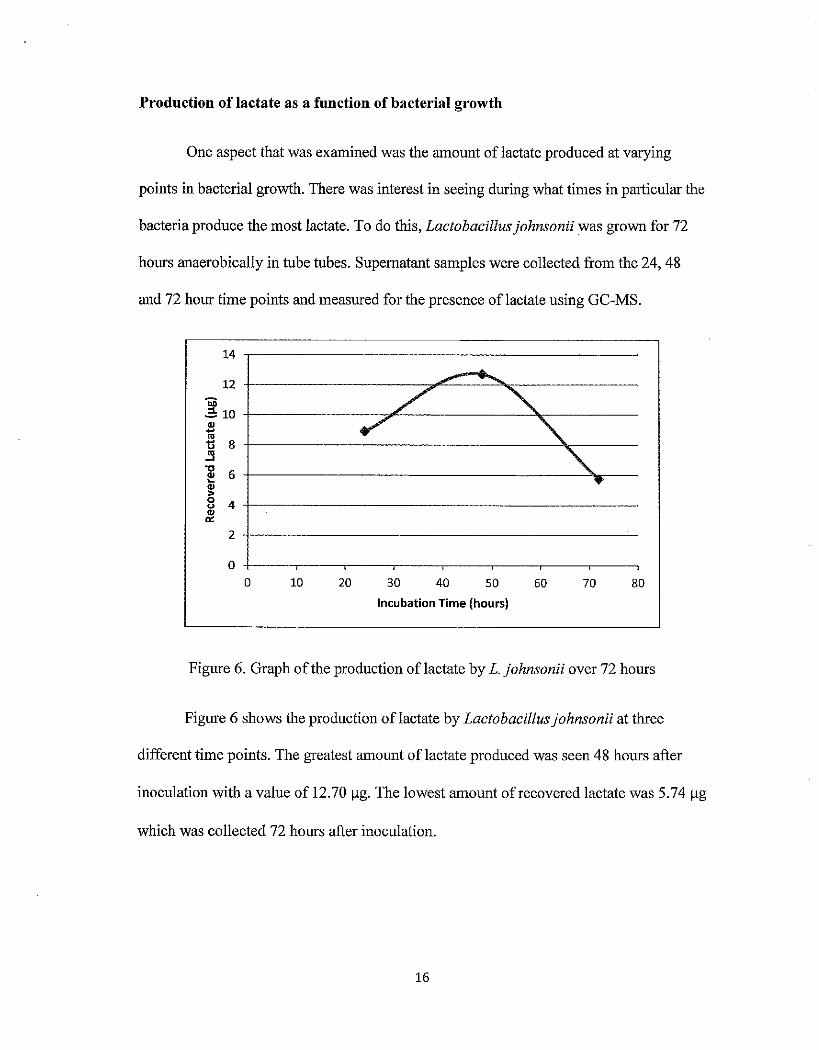
Production of lactate as a function of bacterial growth
One aspect that was examined was the amount of lactate produced at varying
points in bacterial growth. There was interest in seeing during what times in particular the
bacteria produce the most lactate. To do this, Lactobacillus johnsonii was grown for 72
hours anaerobically in tube tubes. Supernatant samples were collected from the 24, 48
and 72 hour time points and measured for the presence oflactate using GC-MS.
14
12
~ 10 QJ ~
"' t> 8 .!3 ~ 6 ~ 8 4 ~
2
0
0 10 20
.A
/ " ~ ' ' • 30 40 so 60 70 80
Incubation Time (hours)
Figure 6. Graph of the production oflactate by L. johnsonii over 72 hours
Figure 6 shows the production oflactate by Lactobacillus johnsonii at three
different time points. The greatest amount oflactate produced was seen 48 hours after
inoculation with a value of 12.70 ~g. The lowest amount of recovered lactate was 5. 74 ~g
which was collected 72 hours after inoculation.
16
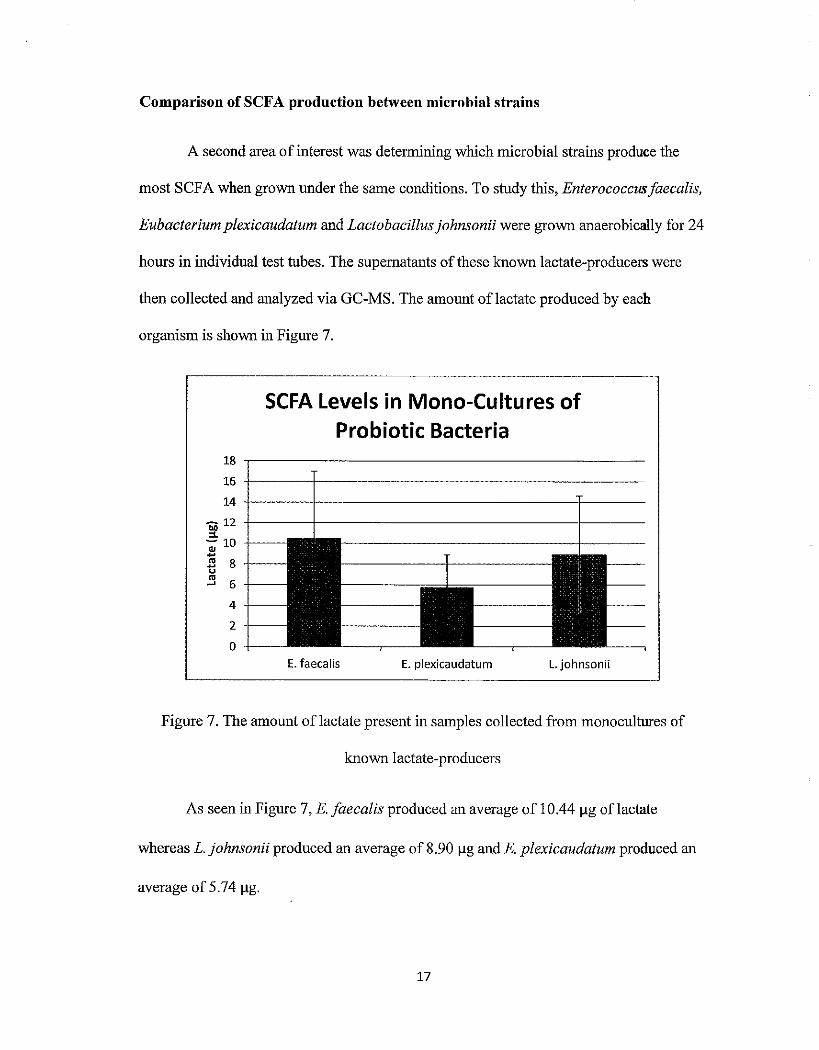
Comparison of SCFA production between microbial strains
A second area of interest was determining which microbial strains produce the
most SCFA when grown under the same conditions. To study this, Enterococcusfaecalis,
Eubacterium plexicaudatum and Lactobacillus johnsonii were grown anaerobically for 24
hours in individual test tubes. The supernatants of these known lactate-producers were
then collected and analyzed via GC-MS. The amount oflactate produced by each
organism is shown in Figure 7.
---·---------· ----------- ----------------·-·-·------~
SCFA Levels in Mono-Cultures of Probiotic Bacteria
18 ,-----------------------
16 +----+------------------------M +------+----------------------~----
- 12 +----+---------------+--~
-.; 10 +--~
2 8 +---u
~ 6 +---
E. faecalis E. plexicaudatum L. johnsonii
Figure 7. The amount of lactate present in samples collected from monocultures of
known lactate-producers
As seen in Figure 7, E. faecalis produced an average of 10.44 1-1g of lactate
whereas L. johnsonii produced an average of 8.90 llg and E. plexicaudatum produced an
average of 5.741-!g.
17
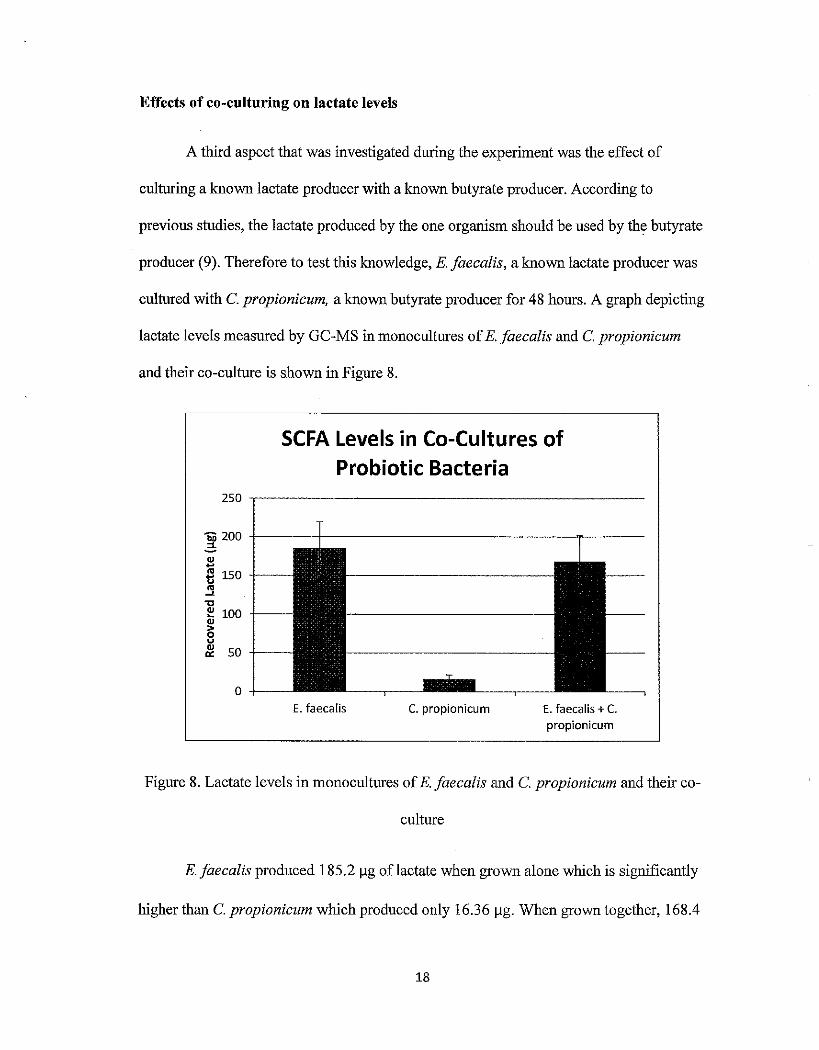
Effects of co-culturing on lactate levels
A third aspect that was investigated during the experiment was the effect of
culturing a known lactate producer with a known butyrate producer. According to
previous studies, the lactate produced by the one organism should be used by the butyrate
producer (9). Therefore to test this knowledge, E. faecalis, a known lactate producer was
cultured with C. propionicum, a known butyrate producer for 48 hours. A graph depicting
lactate levels measured by GC-MS in monocultures of E. faecalis and C. propionicum
and their co-culture is shown in Figure 8.
SCFA Levels in Co-Cultures of Probiotic Bacteria
~ 200
Ql
~ 150 -1---5 "0
~ 100 +--QI
i; u
/'J. 50+--
E. faecalis C. propionicum E. faecalis + C. propionicum
Figure 8. Lactate levels in monocultures of E. faecalis and C. propionicum and their co-
culture
E. faecalis produced 185.2 Jlg oflactate when grown alone which is significantly
higher than C. propionicum which produced only 16.36 Jlg. When grown together, 168.4
18
1-1g of lactate were recovered. The error bars represent the mean ± the standard deviation
of triplicates. The co-culture of these bacteria did in fact have less recovered lactate than
the amonnt oflactate recovered from the monoculture of E. faecalis. This suggests that C.
propionicum used some of the lactate to produce butyrate. However, the difference
between the lactate levels of the co-culture and the E. faecalis monoculture is not great
enough to confirm the suggested mechanism that butyrate-producers use lactate.
Part II: Development of the model
Aerobic environment
For this section of the experiment, the CDC BiofJlm Reactor was nnder aerobic
conditions with fresh media flow. Enterococcus faecalis and Lactobacillus rhamnosus
were grown together for a period of78 hours. Time points were taken where the pH and
colony for:rlling nnits ( cfu) were measured. The number of colony forming units allows
for proper characterization of the role of each organism in the production of SCF A. The
supernatants from the 24, 48 and 72 hour samples were saved and SCF A levels were
measured using direct analysis in real-time mass spectrometry (DART-MS).
The pH was measured at each time point because previous research has shown
that lowering the pH of the environment can trigger different protein expression in
Lactobacillus reuteri (14). By monitoring the pH of different bacterial strains, it can be
determined if this trend is common among all microbes.
19
8
7
6
5
3
2
1
0
1\ _....
0 10
E. faecalis + L. rhamnosus
~
20 30 40 50 60 70 80
Time {hours)
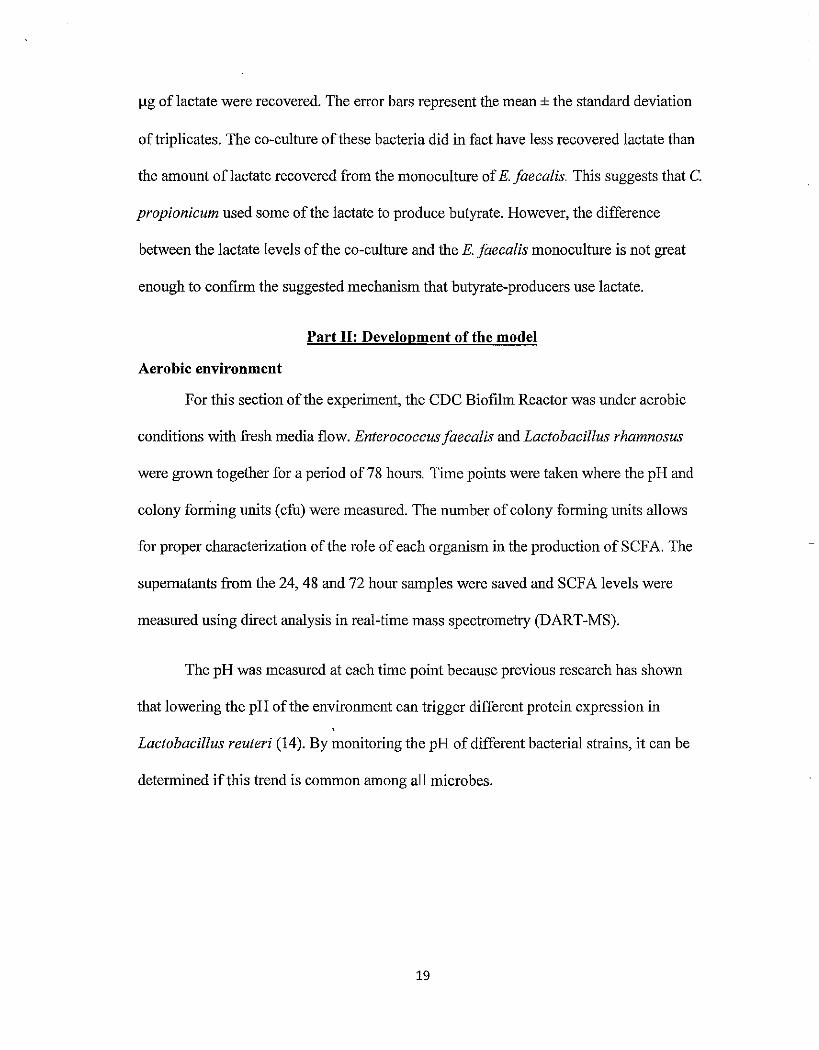
Figure 9. Graph of Time vs. pH of a co-culture sample of E. faecal is andL. rhamnosus.
As shown in Figure 9, the highest pH was seen at inoculation with a pH of 7.13.
As the bacteria were left to grow, the pH dropped and then remained within a range of
5.6 to 6.2. After 72 hours, the media had a pH of5.98.
E. faecalis + L. rhamnosus
1.00E+12 ~-----------,= 1.00E+ll +-------------#'--
1.00E+06 +-----,----....,-----.,.----, 0 20 40
Time {hours)
60 80
-+-L. rhamnosus
.,...E. faecalis
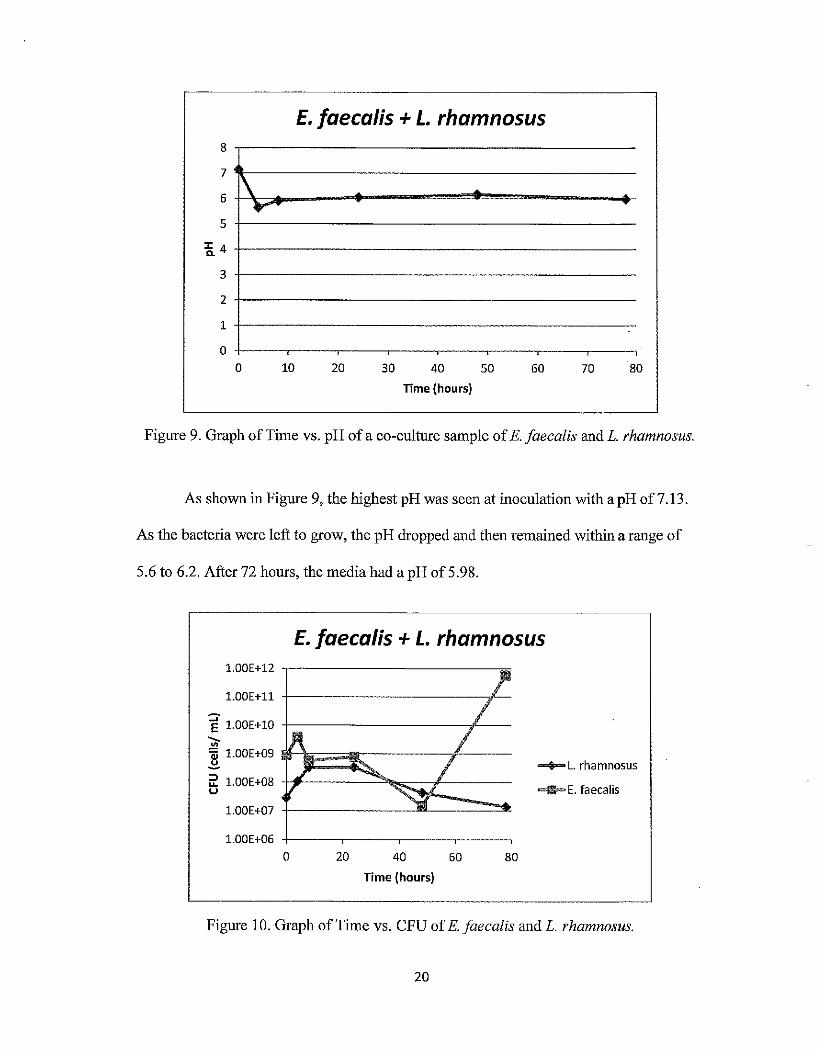
Figure 10. Graph of Time vs. CFU of E.faecalis and L. rhamnosus.
20
With the exception of the 48 hour reading, E. faecalis had the highest number of
colony forming units when compared to L. rhamnosus (Figure 1 0). E. faecalis had the
greatest growth between the 48 and 78 hour time points, with a final cfu count of
5. 70xl 011. L. rhamnosus had the greatest number of cfu after 24 hours with a value of
7.8lxl08• L. rhamonosus appears to have a steadier growth curve, while E. faecalis
appears more sporadic.
6 ., ~
" -g 5
" ;::; "jij4
" ~ .. ~
.5 3 0 ~
:1: 2 u "' -0 1 0
"' " 0:: 0
24
E. faecalis + L. rhamnosus
48 72 Media Control
Time {hours)
"Lactate
111 Butyrate
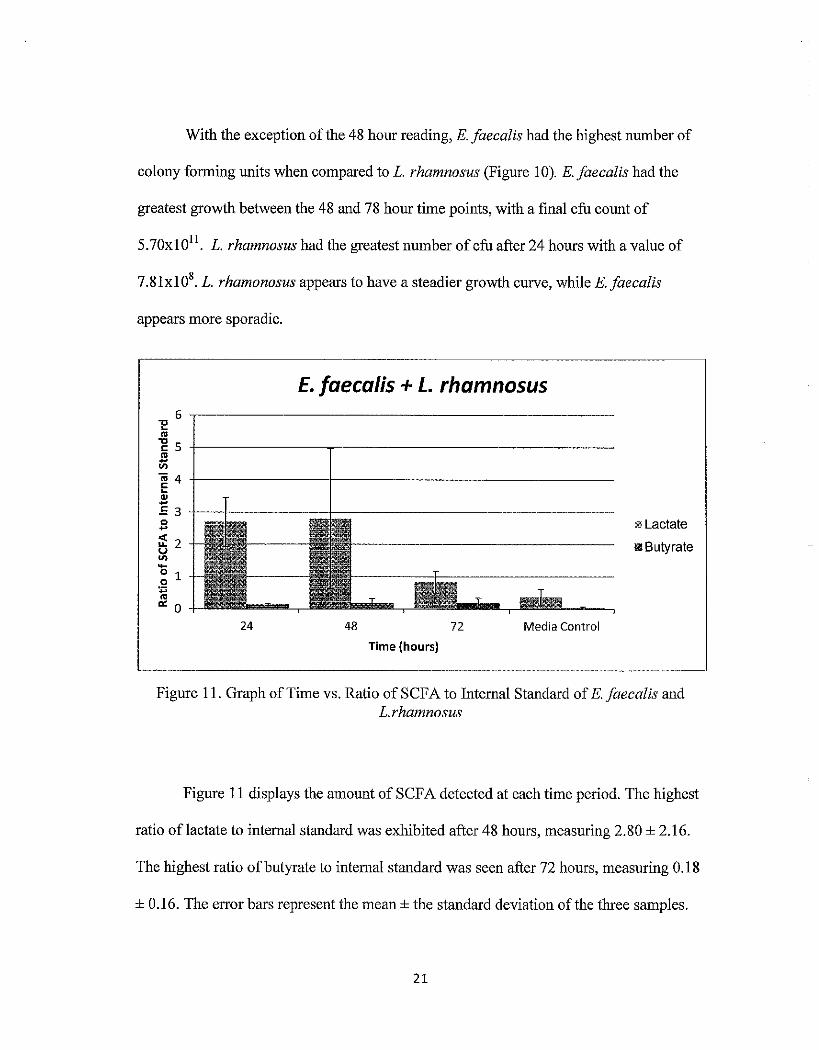
Figure 11. Graph of Time vs. Ratio of SCFA to Internal Standard of E. faecalis and L.rhamnosus
Figure 11 displays the amount of SCF A detected at each time period. The highest
ratio oflactate to internal standard was exhibited after 48 hours, measuring 2.80 ± 2.16.
The highest ratio of butyrate to internal standard was seen after 72 hours, measuring 0.18
± 0.16. The error bars represent the mean± the standard deviation of the three samples.
21
The values were corrected for the blank which represents the level oflactate or butyrate
in the media without the bacteria.
Anaerobic environment
For the anaerobic portion ofthe experiment, the CDC Biofilm Reactor was under
anaerobic conditions with fresh media flow after 24 hours of bacterial growth. The two
strains used were Clostridium propionicum and Eubacterium plexicaudatum. These two
strains were grown for 72 hours. Every 24 hours, a sample was taken where the pH and
colony forming units were measured. The supernatant was saved for analysis of SCF A
production by DART-MS, and the pellet was saved for quantitative PCR. Quantitative
PCR will be used to identifY the bacterial strain and number of bacterial genomes within
the sample.
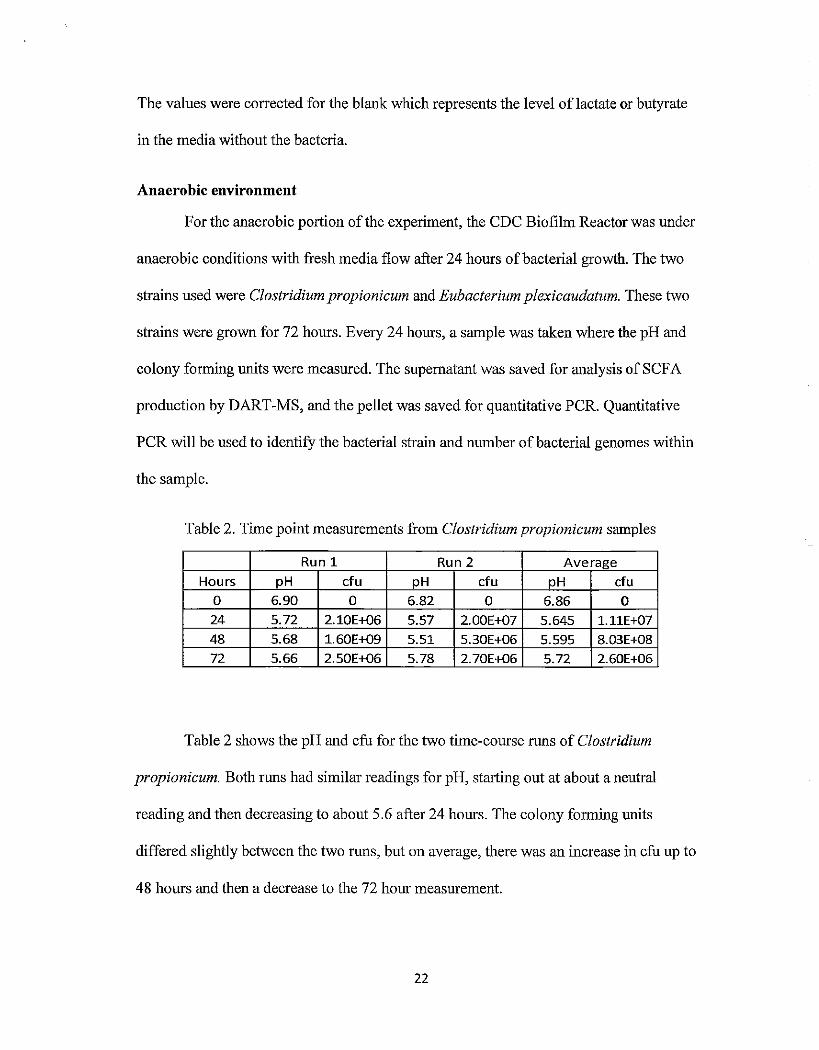
Table 2. Time point measurements from Clostridium propionicum samples
Run 1 Run 2 Average
Hours pH cfu pH cfu pH cfu
0 6.90 0 6.82 0 6.86 0
24 5.72 2.10E+06 5.57 2.00E+07 5.645 1.11E+07
48 5.68 1.60E+09 5.51 5.30E+06 5.595 8.03E+08
72 5.66 2.50E+06 5.78 2.70E+06 5.72 2.60E+06
Table 2 shows the pH and cfu for the two time-course runs of Clostridium
propionicum. Both runs had similar readings for pH, starting out at about a neutral
reading and then decreasing to about 5.6 after 24 hours. The colony forming units
differed slightly between the two runs, but on average, there was an increase in cfu up to
48 hours and then a decrease to the 72 hour measurement.
22
Clostridium propionicum 8 ~------------------------------------------
:~~~~::;:= 5 +-------------------------------------------
~4 +----------------------------------------------3 t---------------------------------------------------------2 t---------------------------------------------------------1 t---------------------------------------------------------0 +-----.------~----r------.-----.------.----,-----,
0 10 20 30 40
Time (hours)
50 60 70 80
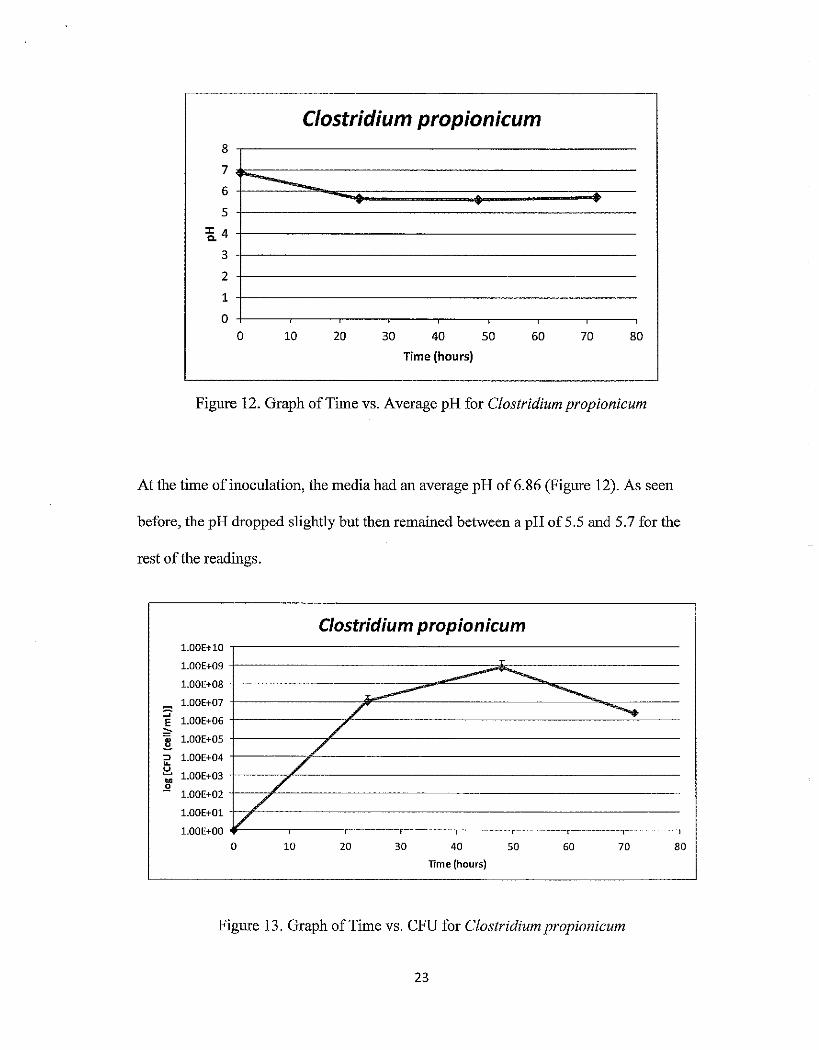
Figure 12. Graph of Time vs. Average pH for Clostridium propionicum
At the time of inoculation, the media had an average pH of 6.86 (Figure 12). As seen
before, the pH dropped slightly but then remained between a pii of 5.5 and 5. 7 for the
rest of the readings.
l.OOE+lO
1.00E+09
1.00E+08
1.00E+07 :::;-E l.OOE+06 ,. o; l.OOE+OS ~ :::> ~
1.00E+04 ~ l.OOE+03 " .2
1.00E+02
l.OOE+Ol
1.00E+OO
/ v 0
Clostridium propionicum
L__... /
/ /
/ /
10 20 30
--
40
Time (hours)
.........
50
--.... ..........
60 70
Figure 13. Graph of Time vs. CFU for Clostridium propionicum
23
80
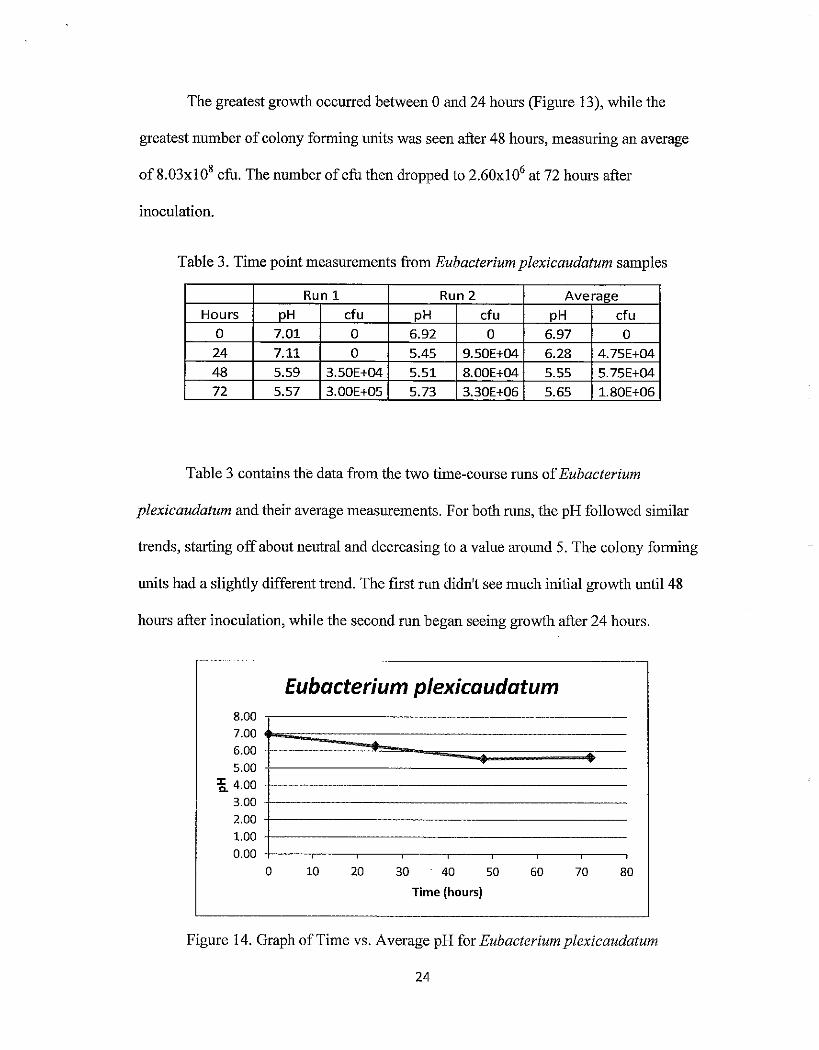
The greatest growth occurred between 0 and 24 hours (Figure 13), while the
greatest number of colony forming units was seen after 48 hours, measuring an average
of 8.03xl 08 cfu. The number of cfu then dropped to 2.60xl 06 at 72 hours after
inoculation.
Table 3. Time point measurements from Eubacterium plexicaudatum samples
Run 1 Run 2 Average
Hours pH cfu pH cfu pH cfu 0 7.01 0 6.92 0 6.97 0
24 7.11 0 5.45 9.50E+04 6.28 4.75E+04
48 5.59 3.50E+04 5.51 8.00E+04 5.55 5.75E+04
72 5.57 3.00E+05 5.73 3.30E+06 5.65 1.80E+06
Table 3 contains the data from the two time-course runs of Eubacterium
plexicaudatum and their average measurements. For both runs, the pH followed similar
trends, starting off about neutral and decreasing to a value around 5. The colony forming
units had a slightly different trend. The first run didn't see much initial growth until48
hours after inoculation, while the second run began seeing growth after 24 hours.
Eubacterium plexicaudatum 8.00 7.00
6.00
5.00
~ 4.00 3.00
2.00
1.00
0.00
0 10 20 30 40 50 60 70 80
Time (hours)
Figure 14. Graph of Time vs. Average pH for Eubacterium plexicaudatum
24
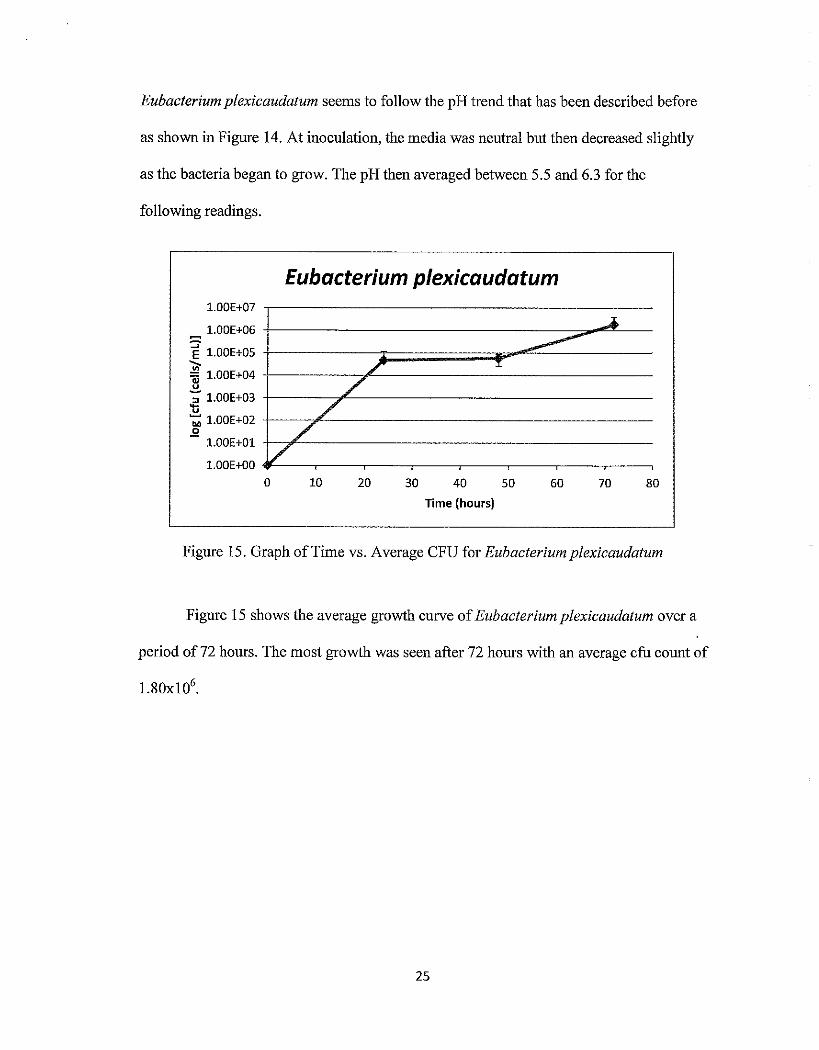
Eubacterium plexicaudatum seems to follow the pH trend that has been described before
as shown in Figure 14. At inoculation, the media was neutral but then decreased slightly
as the bacteria began to grow. The pH then averaged between 5.5 and 6.3 for the
following readings.
~
::;-
1.00E+07
1.00E+06
E l.OOE+OS "";;-~ l.OOE+04 u
";" 1.00E+03 't; '; l.OOE+02 0
- l.OOE+Ol
l.OOE+OO
Eubacterium plexicaudatum
.... ---/ I
/ /
/ v 0 10 20 30 40 50 60 70
Time (hours)
80
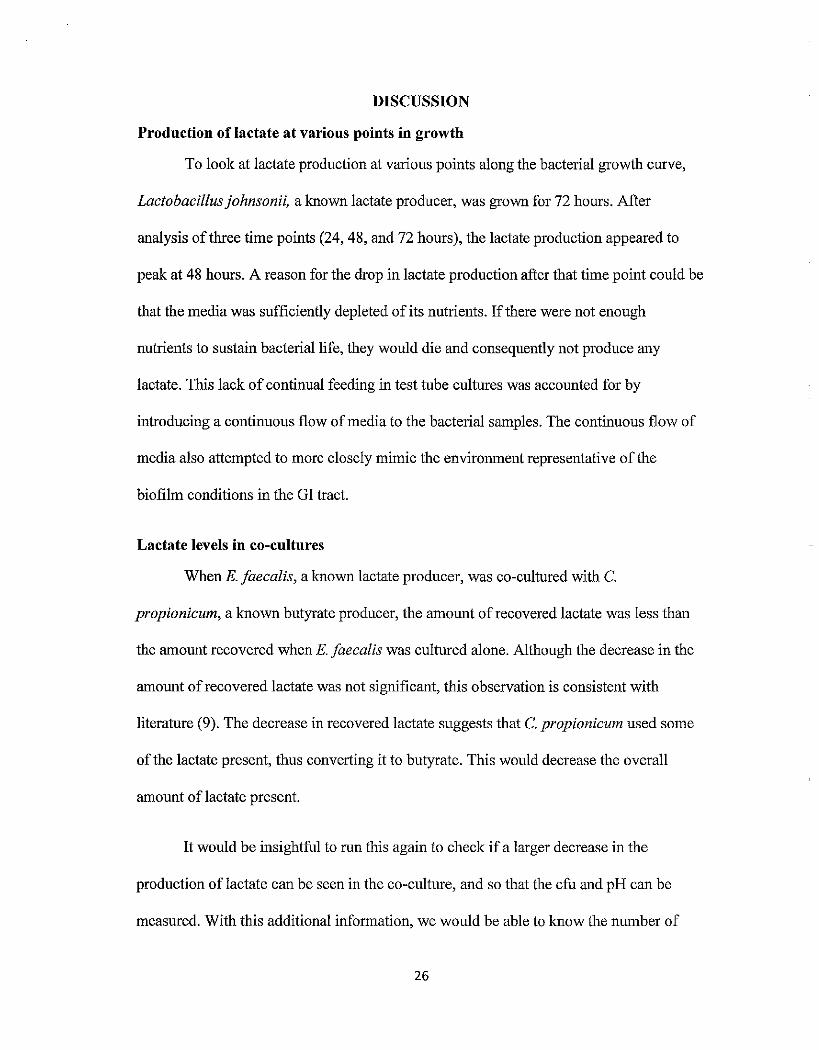
Figure 15. Graph ofTime vs. Average CFU for Eubacteriumplexicaudatum
Figure 15 shows the average growth curve of Eubacterium plexicaudatum over a
period of72 hours. The most growth was seen after 72 hours with an average cfu count of
25
DISCUSSION
Production oflactate at various points in growth
To look at lactate production at various points along the bacterial growth curve,
Lactobacillus johnsonii, a known lactate producer, was grown for 72 hours. After
analysis of three time points (24, 48, and 72 hours), the lactate production appeared to
peak at 48 hours. A reason for the drop in lactate production after that time point could be
that the media was sufficiently depleted of its nutrients. If there were not enough
nutrients to sustain bacterial life, they would die and consequently not produce any
lactate. This lack of continual feeding in test tube cultures was accounted for by
introducing a continuous flow of media to the bacterial samples. The continuous flow of
media also attempted to more closely mimic the environment representative of the
biofilm conditions in the GI tract.
Lactate levels in co-cultures
When E. faecalis, a known lactate producer, was co-cultured with C.
propionicum, a known butyrate producer, the amount of recovered lactate was less than
the amount recovered when E. faecal is was cultured alone. Although the decrease in the
amount of recovered lactate was not significant, this observation is consistent with
literature (9). The decrease in recovered lactate suggests that C. propionicum used some
of the lactate present, thus converting it to butyrate. This would decrease the overall
amount oflactate present.
It would be insightful to run this again to check if a larger decrease in the
production of lactate can be seen in the co-culture, and so that the cfu and pH can be
measured. With this additional information, we would be able to know the number of
26
each organism present which can help determine which microbe is primarily responsible
for the conditions observed.
Aerobic conditions
By measnring the colony forming units and lactate levels from a co-culture of two
lactate producers, E. faecalis and L. rhamnosus, the relationship between the two
measurements could be established. Interestingly, the 24 hour sample had few colony
forming units, but had high levels of lactate present. Opposite to this was the 72 hour
sample which had the most colony forming units, but had the lowest levels oflactate of
each organism. This inverse relationship between the two measurements seems contrary
to common sense--one woUld think that the more bacteria there are, the more SCF A
should be produced. An explanation for what was observed could be the result of
competition among the bacteria. The sample with the highest number of cfu woUld
experience a greater level of competition for nutrients than the sample with the fewest
cfu. This competition for nutrients could result in decreased metabolic activity among the
bacteria, leading to lower levels of lactate being produced. The opposite would be true as
well; if competition is low between bacteria, their metabolic processes will greatly
increase leading to the high production levels of lactate.
Development of the anaerobic environment
In order to truly visualize how bacteria function in the GI tract, an anaerobic
model needed to be developed. This type of model had never been produced by this
group before, so its development started at ground zero. Once the basic concept of the
model was developed, construction took place and several difficulties arose that we had
to smooth out. The first main issue was that the system didn't want to remain anaerobic.
27
The protocol given to us from the manufacturer to fill the anaerobic vinyl chamber with
hydrogen and nitrogen gases was apparently incorrect, causing a seal to leak. This leak
caused the hydrogen and nitrogen gases to escape the chamber and allowed oxygen to
enter. Once the seal was located and patched, a new protocol was developed to obtain the
correct amount of hydrogen and nitrogen gases for our chamber.
A second issue was with creating reducing conditions within the media. When the
media was first pulled out of the autoclave, the resazurin (indicator of oxygen in the
media) indicated the media was anaerobic. However, by the time we got the media to the
anaerobic chamber, the media turned aerobic. Resazurin turns the media pink in the
presence of oxygen or it turns the media a yellow-orange in the absence of oxygen,
allowing visual confirmation ofthe media's oxygen content. The media was then left in
the chamber with the intention to have it become anaerobic but after a couple of days, it
remained aerobic. To combat this issue, reducing agents such as L-cysteine, sodium
thioglycolate and sodium sulfate were added. These agents can be oxidized, thus
removing the free oxygen from the media so that it remained anaerobic at all times.
A third issue that we had to overcome was contamination. The nature of the
anaerobic vinyl chamber makes the workspace difficult to clean. On top of that, to obtain
a sample from the CDC Biofilm Reactor, we have to open the closed and sterile system to
collect the culture. Normally when one has to open a closed and sterile system, a flame is
used to create an air bubble free of bacteria. Since we are working in a hood with
hydrogen and nitrogen gases, we are unable to use a flame. Therefore, our main defense
against contamination was the use of sterile technique.
28
Anaerobic growth conditions
With the successful completion of an anaerobic model, monocultures of anaerobic
bacteria were grown to visualize growth patterns under these conditions. Eubacterium
plexicaudatum and Clostridium propionicum were the two strains chosen to analyze
because they are both obligate anaerobes. When the pH was measured, a common trend
was seen where the pH at inoculation was about neutral but then dropped slightly as the
bacteria began to grow. A reason for this could be that as the bacteria began to grow, they
started introducing short chain fatty acids to the media which would result in a lower pH.
The pH would lower because acids have a low pH so if you were to add acids to a non
buffered solution, the pH would drop. There is interest in looking at the correlation
between colony forming units and pH change for this reason. There is also interest in
looking at pH because of previous literature suggesting that changes in pH lead to
changes of transcription (14). When C. propionicum had the highest number of cfu, the
pH was the lowest. E. plexicaudatum saw a similar trend; when the number of cfu was
the highest, the pH was second lowest. This suggests that under anaerobic conditions,
when there is the most bacterial growth, SCF A production is at its maximum which
would account for the lowest pH measurements.
29
CONCLUSION
Analysis by GC-MS allowed for reproducible results for lactate in test tube
cultures. Although detection of lactate in monocultures and co-cultures was pretty good,
there were some inconstancies between trials. This lack of precision makes it difficult to
draw strong conclusions about the different levels oflactate measured in monocultures
versus co-cultures. In these experiments, only lactate was measured. Other SCFA should
be measured to have a more complete picture of SCF A metabolism in bacteria. Butyrate
in particular will be important to quantitate as it is the preferred energy source for human
cells in the GI tract.
The current in vitro anaerobic model that was developed to better resemble the
conditions within the GI tract is rather effective. By successfully creating an anaerobic
system, we have been able to grow facultative and obligate anaerobes in a biofilm reactor
which better recreates the environment of the GI tract compared to test tube cultures. The
constant flow of media through the bioreactor acts to represent the flow of food and
nutrients through the GI tract. Implementation ofthe coupons within the bioreactor will
allow for true biofilm growth. Collecting samples of the biofilm will allow for analysis
and better characterization of the production ofSCFA in the GI tract.
Growth between the aerobic and anaerobic biofilm reactor models was similar.
With regard to pH, there was a highly reproducible trend seen with all microbial
samples-the pH was about neutral at inoculation and then decreased to a pH between 5
and 6 once bacterial growth commenced. The number of colony forming units did
however differ slightly between the two models. E. faecal is and L. rhamnosus measured
30
high values for cfu in the aerobic model while C. propionicum and E. plexicaudatum
measured moderate values for cfu in the anaerobic model. The difference in growth may
be a result of the different models, but it is very likely that the small difference is a result
of differences in standard microbial growth, meaning certain bacteria simply don't
produce as many cfu as others. It will be very interesting to see ifthere is any difference
in lactate production between the two models once analysis on the DART-MS is
completed.
31

ACKNOWLEDGEMENTS
I would like to thank Dr. Pernecky, my research advisor, for all his support and
guidance during my research experience. Being new to research, I had a lot to learn and
Dr. Pernecky was extraordinarily helpful, explaining difficult processes in a way that
made sense to me. Throughout my time working in the lab, he remained an essential and
insightful source that motivated me to learn more.
I would like to thank Dr. Shetron-Rama, my other research advisor, for her
involvement and encouragement regarding my research. She allowed me to join her side
of the project to gain additional experience in a different field of study when I needed an
alternative direction to continue my research. I particularly appreciate the effort she spent
working with me, ensuring I understood the purpose of each new technique I learned.
I would like to thank the Honors College for awarding me the Undergraduate
Fellowship which helped fund my research. Through this opportunity I have learned and
experienced things that I never would have been able to in a classroom setting.
32
REFERENCES
1. Steams, J.C.; Lynch, M.D.J.; Senadheera, D.B.; Tenenbaum, H. C.; Goldberg,
M.B.; Cvitkovitch, D.G.; Croitoru, K.; Moreno-Hagelsieb, G.; Neufeld, J.D.
Bacterial biogeography of the human digestive tract. Sci Rep. 2011, I, 170.
2. Chow, J.; Lee, S.M.; Shen, Y.; Khosravi, A.; Mazmanian, S.K. Host-Bacterial
Symbiosis in Health and Disease. Adv Immunol. 2010, 107: 243-274.
3. Rehman, A.; Heinsen, F.; Koenen, M.E.; Venema, K.; Knecht, H.; Hellmig, S.;
Schreiber, S.; Ott, S.J. Effects ofprobiotics and antibiotics on the intestinal
homeostasis in a computer controlled model of the large intestine. BMC
Microbial. 2012, 12:47.
4. Huda-Faujan, N.; Abdulami, A.S.; Fatimah, A.B.; Muhammad Anas, 0.;
Shuhaimi, M.; Yazid, A.M.; Loong, Y.Y. The impact of the level of the intestinal
short chain fatty acids in inflammatory bowel disease patients versus healthy
subjects. Open Biochem J. 2012, 4: 53-8.
5. VanZanten, G.C.; Knudsen, A.; R6yti6, H.; Forssten, S.; Lawther, M.; Blennow,
A.; Lahtinen, S.J.; Jakobsen, M.; Svensson, B.; Jespersen, L. The effect of
selected synbiotics on microbial composition and short chain fatty acid production
in a model system of the human colon. PLoS One. 2012, 7(10).
6. Dongari-Bagtzoglou, A. Pathogenesis of mucosal biofilm infections: challenges
and progress. Expert Rev Anti Infect Ther. 2008, 6(2): 201-208.
7. Kannampalli, P.; Shaker, R.; Sengupta, J. N.; Colonic butyrate- algesic or
analgesic? Neurogastroenterol Motil. 2011, 23(11): 975-979.
33
8. Noverr, M. C.; Huffuagle, G. B. Does the microbiota regulate immune responses
outside the gut? Tends in Microbiology. 2004, 12 (12): 562-568.
9. Duncan, S. H.; Louis, P .; Flint, H. J. Lactate-Utilizing Bacteria, Isolated from
Human Feces, That Produce Butyrate as a Major Fermentation Product. Appl
EnvironMicrobiol. 2004, 70(10): 5810-5817.
10. Boles, B. R.; Singh, P. K. Endogenous oxidative stress produces diversity and
adaptability in biofilm communities. Proc Nat! A cad Sci US A. 2008, 1 05(34):
12503-12508.
11. http://www.biology-online.org/dictionary. (Access date: March 1, 2013)
12. Noverr, M.C.; Huffuagle G.B. Rationale of Candida albicans morphogenesis by
fatty acid metabolites. Infection and immunity. 2004,72,6206-6210.
13. Illendula, S. Short-chain Fatty Acid Production by Microbial Organisms in Model
Systems Assessed by GCMS. M.S. Thesis, Eastern Michigan University, MI,
April, 2013.
14. Lee!, K.; Lee, H.; Pi, K.; Choi, Y. The effect oflow pH on protein expression by
the probiotic bacterium Lactobacillus reuteri. Proteomics. 2008, 8, 1624-1630.
15. Probert, H. M.; Gibson, G. R. Bacterial Biofilms in the Human Gastrointestinal
Tract. Curr. Issues Intest. Microbial. 2002. 3: 23-27.
34