Embed Size (px)
Citation preview
http://pib.sagepub.com/Manufacture
Engineers, Part B: Journal of Engineering Proceedings of the Institution of Mechanical
http://pib.sagepub.com/content/227/1/132The online version of this article can be found at:
DOI: 10.1177/0954405412462806
originally published online 20 November 2012 2013 227: 132Proceedings of the Institution of Mechanical Engineers, Part B: Journal of Engineering Manufacture
Srinivasan Balaji and Manas M Mahapatrawelds for aerospace application
Experimental study and modeling of friction stir welding process to produce optimized AA2219 butt
Published by:
http://www.sagepublications.com
On behalf of:
Institution of Mechanical Engineers
can be found at:ManufactureProceedings of the Institution of Mechanical Engineers, Part B: Journal of EngineeringAdditional services and information for
http://pib.sagepub.com/cgi/alertsEmail Alerts:
http://pib.sagepub.com/subscriptionsSubscriptions:
http://www.sagepub.com/journalsReprints.navReprints:
http://www.sagepub.com/journalsPermissions.navPermissions:
http://pib.sagepub.com/content/227/1/132.refs.htmlCitations:
What is This?
- Nov 20, 2012OnlineFirst Version of Record
- Jan 17, 2013Version of Record >>
at UNIV OF CALIFORNIA SANTA CRUZ on November 5, 2014pib.sagepub.comDownloaded from at UNIV OF CALIFORNIA SANTA CRUZ on November 5, 2014pib.sagepub.comDownloaded from
Original Article
Proc IMechE Part B:J Engineering Manufacture227(1) 132–143� IMechE 2012Reprints and permissions:sagepub.co.uk/journalsPermissions.navDOI: 10.1177/0954405412462806pib.sagepub.com
Experimental study and modeling offriction stir welding process to produceoptimized AA2219 butt welds foraerospace application
Srinivasan Balaji and Manas M Mahapatra
AbstractThis article describes the effect of friction stir welding parameters on the mechanical properties and overall macrostruc-ture features of AA2219-T87 welds. The aim is to develop a suitable combination of process parameters for producingsound friction stir welding joints of AA2219 for aerospace applications such as fabrication of space launch vehicle’s pro-pellant tank. Design of experiments approach was used to determine the influential control factors for the optimizationof friction stir welding responses. The observed responses, such as the ultimate tensile strength and percentage of elon-gation of welds, were compared with the specified requirements for the said application. Weld cross-sectional area andthe grain size in various zones of the weld were also recorded. A full-factorial experimental design was conducted toobtain the weld responses. Analysis of variance, interaction effects and desirability function–based techniques were usedto determine the significant welding parameters and to set the optimal level for each control factor. Regression equa-tions were developed to predict output characteristics of welds. The experimental and the predicted values were in agood agreement. Response surface modeling was carried out to identify the combination of process parameters to opti-mize the responses. The modeling methodology adopted and the optimization technique used in the present investiga-tion are observed to be adequate for producing sound AA2219-T87 welds to meet the specification requirements of theintended aerospace application.
KeywordsFriction stir welding, analysis of variance, response surface modeling, AA2219-T87
Date received: 6 March 2012; accepted: 7 September 2012
Introduction
Friction stir welding (FSW) is a solid-state joining tech-nique1,2 and was patented by The Welding Institute(TWI). It is a solid-state, autogenous joining processinvolving a nonconsumable rotating tool with ashoulder and protruding pin probe.3 The rotating pinprobe of FSW tool is used as a stirrer for the jointmaterial. Low distortion, high quality, low residualstress, fewer weld defects and low production cost arethe major advantages of this welding method. AA2219alloy is one of the widely used materials for the con-struction of liquid propellant tanks for space launchvehicles. It has a unique combination of properties suchas good weldability, high strength-to-weight ratio andsuperior cryogenic properties.4 Although in terms ofweldability AA2219 material has got an edge over the6000 and 7000 series aluminum alloys, it suffers frompoor as-welded joint strength. The joint strength of
AA2219 fusion weld is only about 40% of its basematerial strength in the T87 condition.5 This isobserved in both autogenous welds and those weldedwith matching AA2319 filler wire, which containsslightly higher contents of Ti and Zr.6 The loss ofstrength is due to the melting and quick resolidifica-tion, which renders all the strengthening precipitates todissolve, and the weld material is as good as the castmaterial with solute segregation and columnar grains.The propellant tanks that are intended to be welded by
Mechanical and Industrial Engineering Department, Indian Institute of
Technology Roorkee, Roorkee, Uttarakhand, India
Corresponding author:
MM Mahapatra, Mechanical and Industrial Engineering Department, Indian
Institute of Technology Roorkee, Roorkee, Uttarakhand 247 667, India.
Email: [email protected]; [email protected]
at UNIV OF CALIFORNIA SANTA CRUZ on November 5, 2014pib.sagepub.comDownloaded from

FSW process and the welding equipment used for thesame are shown in Figure 1.
The material flow behavior in FSW is influenced bythe FSW tool profiles, tool dimensions and processparameters.7,8 The present study involves the optimiza-tion of process parameters for FSW of AA2219 T-87square-butt welds for aerospace application (satellitelaunch vehicles) using a statistical modeling approachsuch as response surface regression analysis. Such tech-niques are able to quantify the effect of individual para-meters on the weld joints.9,10 An investigation on theinfluence of FSW process parameters on the mechani-cal properties of AA2198 T-3 welds was conducted byBitondo et al.11 A statistical analysis to study the effectof FSW process parameters such as spindle rotationalspeed, traverse speed and stirrer geometry on mechani-cal properties of AA1050/AA5083 joints was conductedby Sarsılmaz et al.12 Lockwood et al.13 examined theglobal and local mechanical responses of the frictionstir welded AA2024 joints using experimental andnumerical approaches. A study on the various modelingtechniques that can be applied to FSW and other weld-ing processes was reported by Benyounis et al.14
Lakshminarayanan and Balasubramanian15 optimizedthe FSW parameters of RDE-40 aluminum alloy usingthe Taguchi technique. In this study, the Taguchiapproach was applied to determine the most influentialfactors that yielded better tensile strength of friction stirwelded RDE-40 aluminum alloy joints. The resultsindicated that rotational speed, welding speed and axialforce are the significant parameters in deciding the ten-sile strength of the welded joint.15 Blignault et al. opti-mized the procedures for FSW of 5083-H321 aluminumalloy by selecting appropriate weld process parametersand tool modifications. This study demonstrated theuse of ‘‘Force Footprint’’ diagram in providing a gra-phical user interface for process optimization of FSW.The model developed in this study allows the weld ten-sile strength to be predicted for all combinations of toolgeometry and process parameters.16 Rajakumar et al.17
optimized FSW process to attain maximum tensilestrength of AA7075-T6 aluminum alloy by using thecentral composite face-centered (CCF) design of experi-ment (DOE). In their study, an attempt was made to
establish an empirical relationship between the FSWprocess parameters, tool dimension, hardness and thetensile strength of the joint. Statistical tools such asDOE, analysis of variance (ANOVA) and regressionanalysis were used to develop the relationships.17
From the literature review, the suitability of DOEand statistical techniques for modeling and optimizingthe FSW process is well noted. However, most of theliteratures are related to laboratory test results of FSW,and very rarely a work related to real industrial appli-cation of FSW is observed. Moreover, works related tomodeling and optimization of FSW process for theproduction of sound AA2219 T-87 welded joints arerarely found in the literature. There is, therefore, a needto experimentally study and optimize the FSW ofAA2219 material in T-87 condition. The present inves-tigation is a step in this regard to experimentally modeland optimize FSW process in an industrial environ-ment for producing sound AA2219 joints for aerospaceapplication. Full-factorial DOEs were conducted toascertain all possible combinations of the control fac-tors. Multiresponse optimization of the responses wasconducted based on full-factorial DOEs by emphasiz-ing about the repeatability of the results in the indus-trial environment.
Experimental details
The material under investigation is a 7.0-mm-thickrolled sheet of AA2219 in T-87 temper condition (solu-tionized, cold-worked and artificially aged). This mate-rial has generated great interest in the aerospaceindustry because of its weldability and strength. Thisalloy is characterized by the presence of copper as themain alloying element. Chemical composition obtainedfrom a chemical analysis tester and the measuredmechanical properties of the alloy in the T-87 tempercondition are shown in Tables 1 and 2, respectively.
A special commercial friction stir welder for weldingof aerospace component was used for the experi-ments.18 Rolled plates of 7-mm-thick AA2219 in T-87temper condition were machined to the required size,that is, 155mm 3 880mm, on a conventional millingmachine. Two plates of the above-mentioned size were
Figure 1. (a) FSW machine and (b) space launch vehicle propellant tank made of AA2219 alloy.
Balaji and Mahapatra 133
at UNIV OF CALIFORNIA SANTA CRUZ on November 5, 2014pib.sagepub.comDownloaded from
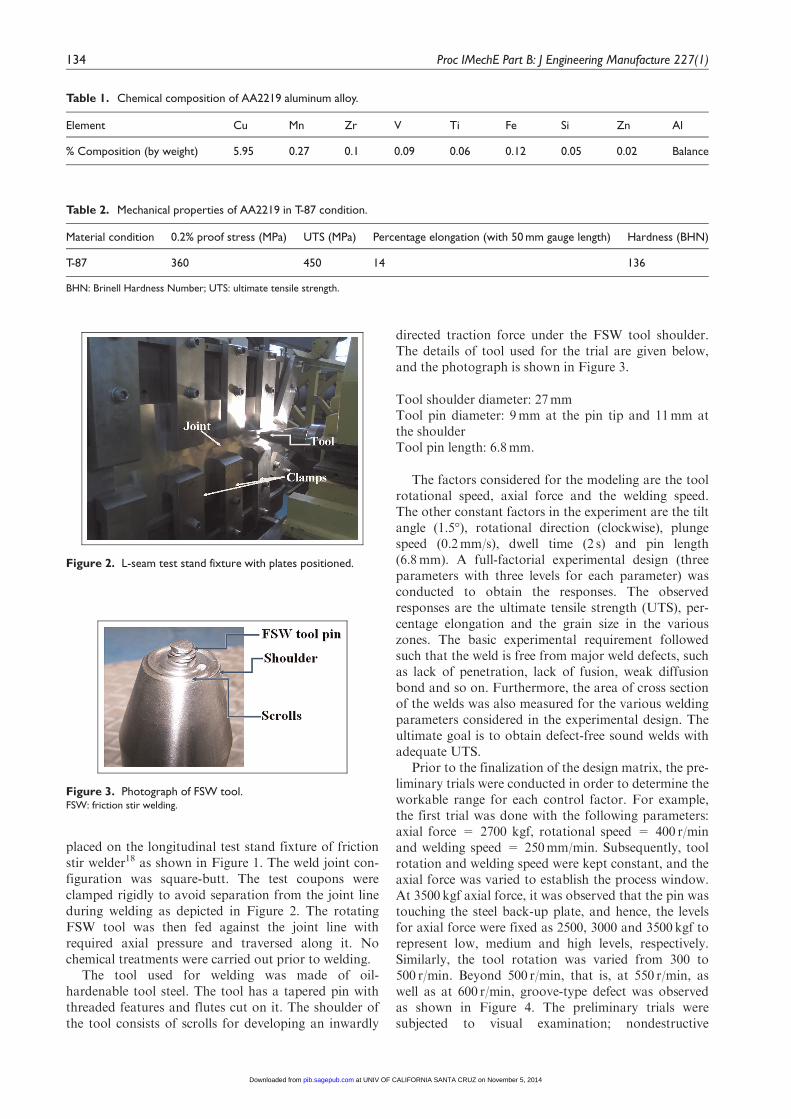
placed on the longitudinal test stand fixture of frictionstir welder18 as shown in Figure 1. The weld joint con-figuration was square-butt. The test coupons wereclamped rigidly to avoid separation from the joint lineduring welding as depicted in Figure 2. The rotatingFSW tool was then fed against the joint line withrequired axial pressure and traversed along it. Nochemical treatments were carried out prior to welding.
The tool used for welding was made of oil-hardenable tool steel. The tool has a tapered pin withthreaded features and flutes cut on it. The shoulder ofthe tool consists of scrolls for developing an inwardly
directed traction force under the FSW tool shoulder.The details of tool used for the trial are given below,and the photograph is shown in Figure 3.
Tool shoulder diameter: 27mmTool pin diameter: 9mm at the pin tip and 11mm atthe shoulderTool pin length: 6.8mm.
The factors considered for the modeling are the toolrotational speed, axial force and the welding speed.The other constant factors in the experiment are the tiltangle (1.5�), rotational direction (clockwise), plungespeed (0.2mm/s), dwell time (2 s) and pin length(6.8mm). A full-factorial experimental design (threeparameters with three levels for each parameter) wasconducted to obtain the responses. The observedresponses are the ultimate tensile strength (UTS), per-centage elongation and the grain size in the variouszones. The basic experimental requirement followedsuch that the weld is free from major weld defects, suchas lack of penetration, lack of fusion, weak diffusionbond and so on. Furthermore, the area of cross sectionof the welds was also measured for the various weldingparameters considered in the experimental design. Theultimate goal is to obtain defect-free sound welds withadequate UTS.
Prior to the finalization of the design matrix, the pre-liminary trials were conducted in order to determine theworkable range for each control factor. For example,the first trial was done with the following parameters:axial force = 2700 kgf, rotational speed = 400 r/minand welding speed = 250mm/min. Subsequently, toolrotation and welding speed were kept constant, and theaxial force was varied to establish the process window.At 3500 kgf axial force, it was observed that the pin wastouching the steel back-up plate, and hence, the levelsfor axial force were fixed as 2500, 3000 and 3500 kgf torepresent low, medium and high levels, respectively.Similarly, the tool rotation was varied from 300 to500 r/min. Beyond 500 r/min, that is, at 550 r/min, aswell as at 600 r/min, groove-type defect was observedas shown in Figure 4. The preliminary trials weresubjected to visual examination; nondestructive
Figure 2. L-seam test stand fixture with plates positioned.
Figure 3. Photograph of FSW tool.FSW: friction stir welding.
Table 2. Mechanical properties of AA2219 in T-87 condition.
Material condition 0.2% proof stress (MPa) UTS (MPa) Percentage elongation (with 50 mm gauge length) Hardness (BHN)
T-87 360 450 14 136
BHN: Brinell Hardness Number; UTS: ultimate tensile strength.
Table 1. Chemical composition of AA2219 aluminum alloy.
Element Cu Mn Zr V Ti Fe Si Zn Al
% Composition (by weight) 5.95 0.27 0.1 0.09 0.06 0.12 0.05 0.02 Balance
134 Proc IMechE Part B: J Engineering Manufacture 227(1)
at UNIV OF CALIFORNIA SANTA CRUZ on November 5, 2014pib.sagepub.comDownloaded from

examination, such as dye-penetrant inspection andradiography; destructive tests, such as tensile tests; bendtests and micro-/macroexaminations in order to
determine the soundness of the weld. The tensile testswere conducted on a universal testing machine modelMTS810 by MTS. The experimental design matrix forfull-factorial experimental design was finalized basedon the trial runs, as presented in Table 3.
The 27 experiments with different welding para-meters (Table 3) were subjected to nondestructiveexamination and destructive testing to determine thequality of the weld. The response measurementsincluded the UTS, percentage elongation and cross-sectional area of the weld. The requirements of UTSand the percentage elongation for this specific aero-space application are 300MPa and 5% elongation inthe as-welded condition. The results obtained for eachof the experiment are tabulated and presented in Table4. The tensile tests were conducted on a computerizeduniversal testing machine. The broken tensile test sam-ples are shown in Figure 5. It can be observed fromTable 4 that the area of cross section of the weld has adirect relationship with the tensile strength of the weld.
Metallographic and macrostructurestudies
Macro- and microstructural analyses have been carriedout using an optical microscope by Nikon. The weldspecimens for metallographic examination are sectionedto required sizes from the joint comprising the friction
Table 4. Experimental results.
No. Welding speed(S) (mm/min)
Axial force(F) (kgf)
Tool rotation(N) (r/min)
UTS(MPa)
Percentageelongation
Cross-sectional areaof weld (mm2)
Remarks
1 300 3500 300 317.3 7.1 100.8 Defect free2 250 2500 500 323.5 8.2 102.4 Defect free3 300 3000 500 344.6 9.1 112.0 Defect free4 250 3000 500 307.4 8.4 100.6 Defect free5 250 3500 400 325.0 8.0 106.0 Defect free6 300 3000 400 340.0 9.1 110.0 Defect free7 250 3000 400 333.3 8.2 108.0 Defect free8 300 2500 500 346.0 8.6 111.0 Defect free9 200 3500 300 331.0 8.7 106.0 Defect free10 200 3000 400 307.7 7.4 100.4 Defect free11 200 3000 300 295.6 5.6 96.8 Defect free12 300 3500 500 325.3 8.7 103.2 Defect free13 250 3500 500 326.1 8.0 103.7 Defect free14 200 3500 500 325.0 7.1 104.0 Defect free15 250 3000 300 317.0 8.0 102.5 Defect free16 300 2500 400 340.4 8.5 111.6 Defect free17 300 3500 400 322.7 8.0 101.4 Defect free18 200 2500 500 260.0 5.1 92.7 Defect free19 200 3000 500 331.0 8.4 105.6 Defect free20 200 2500 300 166.0 2.5 81 Tunnel defect21 250 2500 300 182.5 2.4 91.2 Tunnel defect22 300 2500 300 214.4 2.3 85 Tunnel defect23 250 3500 300 310.6 9.6 99.0 Defect free24 300 3000 300 292.0 4.9 96.1 Defect free25 250 2500 400 288.0 7.4 92.7 Defect free26 200 2500 400 264.0 5.8 92.6 Defect free27 200 3500 400 325.3 9.1 104.4 Defect free
UTS: ultimate tensile strength.
Figure 4. Groove defects observed at rotational speed of600 r/min.
Table 3. Design matrix of process parameters.
Levels Weld speed(S) (mm/min)
Axial force(F) (kgf)
Rotational speed(N) (r/min)
1 (low) 200 2500 3002 (medium) 250 3000 4003 (high) 300 3500 500
Balaji and Mahapatra 135
at UNIV OF CALIFORNIA SANTA CRUZ on November 5, 2014pib.sagepub.comDownloaded from

stir processing zone (FSPZ), thermomechanicallyaffected zone (TMAZ), heat affected zone (HAZ) andthe base metal regions. The specimens were etched withKeller’s reagent to reveal the micro- and macrostruc-tures. It can be seen from Figure 6 that the weld crosssection is almost symmetrical. Photomicrographs of stirzone, weld–TMAZ interface, HAZ and parent metal atdifferent magnification are presented in Figure 7.
The metallographic sections (Figure 7(a)) show aclassic weld nugget region and the stirring marks, com-monly denoted as ‘‘onion rings,’’ which are typicallyfound in this region of the weld. The grains in this zoneare of fine equiaxed type. The grain size in the stir zoneis of the order of ASTM No 9, whereas that in the HAZis of the order of ASTM No 5-6. The TMAZ of the fric-tion stir weld had elongated grain structure due to severemechanical working in that zone. The grain size in theparent metal is of the order of ASTM No 6-7.
Some macrostructure observations of AA2219-T-87welds (Table 4) are presented in detail in Table 5, indi-cating the type of weld cross section, macrodefects andweld strengths. It is observed from Table 5 that withlower axial force of 2500 kgf and with weld speed of200–250mm/min with tool rotational speed of300 r/min, tunnel defects were observed. The tunneldefects were not observed for higher rotational speed
of the tools. This finding is critical in setting the para-meters for FSW of AA2219-T87 alloy to avoid the welddefects.
Surface response modeling andoptimization
The aim of this study is to find out the welding para-meter combinations that influence responses such asthe UTS and percentage elongation. This was accom-plished by means of ANOVA. Regression analysis wasused to establish the correlation between the factorsand responses. The appropriate degree of regressionequation is found out, which can be considered as auseful assessment of the predictive equation. Finally,the optimal levels of the control factors (welding para-meters) were obtained.
Effect of the factors on the UTS and percentageelongation
Figure 8(a) and (b) depicts the plots of the main effectsfor the UTS and percentage elongation of the welds.Based on these plots, the effect of each factor on thedesired response can be assessed. From Figure 8(a), it
Figure 6. Photograph of FSPZ captured using stereo binocular microscope (33).TMAZ: thermomechanically affected zone; HAZ: heat affected zone.
Figure 5. Some broken tensile test samples.
136 Proc IMechE Part B: J Engineering Manufacture 227(1)
at UNIV OF CALIFORNIA SANTA CRUZ on November 5, 2014pib.sagepub.comDownloaded from

Table 5. Some macrostructure observations of AA2219-T87 welds (Table 4).
Sample no. Process parameters Mechanicalproperties
Macrograph of FSWjoint cross section
Observations
3 Weld speed: 300 mm/min;axial force: 3000 kgf andtool rotation: 500 r/min
UTS: 344.6 MPa;percentageelongation: 9.1
Defect-free cross section isobserved. The joint had goodmechanical strength.
6 Welding speed: 300 mm/min; axial force: 3000 kgfand tool rotation:400 r/min
UTS: 340.0 MPa;percentageelongation: 9.1
Defect-free cross section isobserved. The joint had goodmechanical strength.
8 Welding speed: 300 mm/min; axial force: 2500 kgfand tool rotation:500 r/min
UTS: 346.0 MPa;percentageelongation: 8.6
Defect-free cross section. Thejoint had good mechanicalstrength.
16 Welding speed: 300 mm/min; axial force: 2500 kgfand tool rotation:400 r/min
UTS: 340.4 MPa;percentageelongation: 8.5
Defect-free cross section. Thejoint had good mechanicalstrength.
20 Welding speed: 200 mm/min; axial force: 2500 kgfand tool rotation:300 r/min
UTS: 166.0 MPa;percentageelongation: 2.5
Tunnel defect is observed thatruns through the length of theweld and is attributed toinsufficient axial force. Thedefect is located on theadvancing side.
21 Welding speed: 250 mm/min; axial force: 2500 kgfand tool rotation:300 r/min
UTS: 182.5 MPa;percentageelongation: 2.4
Tunnel defect is observed. Thedefect is located on theadvancing side. The failure of thejoint initiated from the defect.
UTS: ultimate tensile strength; FSW: friction stir welding .
Figure 7. Photomicrographs of (a) nugget/stir zone (1503), (b) Weld-TMAZ interface (1003), (c) HAZ (2003) and (d) parentmetal (2003).
Balaji and Mahapatra 137
at UNIV OF CALIFORNIA SANTA CRUZ on November 5, 2014pib.sagepub.comDownloaded from

can be clearly seen that the axial force (F) and toolrotational speed (N) have relatively significant effect onthe UTS of the welds than the welding speed (V). TheUTS of the welds increases steeply with the increase inthe axial force and tool rotational speed up to a certainvalue beyond which the increase is more gradual. Thisis due to the fact that an optimum value of both axialforce and tool rotation is needed to produce a goodweld consolidation between the plates. The heat inputand temperature distribution during the FSW are dueto the frictional heat generation between the rotatingtool shoulder and surface of the plate to be welded andthe viscous heat that is generated due to the stirringaction of the tool probe. Hence, the heat generationduring FSW depends on the coefficient of friction andshear deformation of the joint material. The heat trans-fer phenomenon in FSW was explained by means of arotating plug model by Raghulapadu et al.19 In therotating plug model, a shear surface around the FSWtool similar to that of the shear plane in the metal cut-ting operation is described. This shear surface aroundthe FSW tool is represented with a sharp boundarybetween the recrystallized and the merely distortedareas. In other words, the shear surface around theFSW tool represents velocity discontinuity with a verynarrow zone of high shear strain rate separating themetal rotating with the pin from the metal remaining inthe weldment. The shear surface moves with the FSWtool. As the tool traverses and meets new metal, thenew metal rotates with the tool and gets depositedbehind the tool.19 Apart from the properties of tooland plate material, the axial force influences the coeffi-cient of friction. Thus, the axial force plays a significant
role in the FSW process. On the other hand, there is agradual increase in the UTS with the increase in thewelding speed. A high welding speed means that thetool pin stirs the joint for a lesser time and hence at alower temperature at the joint. This lower temperatureand plastic deformation had led to the increase in UTS.From Figure 8(b), it can be seen that the percentageelongation increases with the increase in the axial force(F), where as the percentage elongation of the weldsincreases with the increase in tool rotational speed, thewelds speed up to an optimum value. Also, from thisplot, it can be observed that the tool rotational speedhas a greater effect on percentage elongation than onthe welding speed and the axial force.
Figure 9(a) and (b) depicts the interaction effects ofthe input process parameters on the UTS and percent-age elongation. From Figure 9(a), it can be inferredthat at lower values of weld speed, the axial force hasmore pronounced effect on the UTS, whereas at highervalues of design range, that is, toward 300mm/min,tool rotational speed has a pronounced effect on UTS.Also at lower values of axial force, the tool rotationalspeed has a pronounced influence on UTS and viceversa. Thus, from the interaction plots, it can beinferred that the tool rotational speed and axial forcehave greater effect on UTS. A similar effect can beinferred from Figure 9(b).
Regression analysis
Regression analysis is performed to find out the rela-tionship between the welding parameters and responsessuch as the UTS and percentage elongation. The R2
Figure 8. Main effects plot data means for (a) UTS and (b) percentage elongation.UTS: ultimate tensile strength.
138 Proc IMechE Part B: J Engineering Manufacture 227(1)
at UNIV OF CALIFORNIA SANTA CRUZ on November 5, 2014pib.sagepub.comDownloaded from

values indicate that the predictors explain 89% and83.5% of the variance in the UTS and percentage elon-gation, respectively. Table 6 shows the ANOVA20 datausing the fitted model with linear, square and interac-tion terms and coefficient of factors and factor effectsin regression model for UTS and percentageelongation.
Least square method is used in the regression analy-sis to find the coefficients of the equation. Thus, theregression equation for UTS (MPa) using data inuncoded units, which satisfies all the 27 experimentalcases, is given by
UTS= � 2355:03+1:829073 (Welding Speed)
+1:072303 (Axial Force)+3:39114
3 (Tool Rotational Speed)+4:8673E10�4
3 (WeldingSpeed2)� 9:8727E10�5(Axial Force2)
� 2:094E10�3 3 (Tool Rotational Speed2)
� 705593E10�4
3 (WeldingSpeed3Axial Force)+1:1147E10�3
3 (WeldingSpeed3Tool Rotational Speed)
� 5:82E10�4
3 (Axial Force3ToolRotational Speed)
ð1Þ
Similarly, the regression equation for percentageelongation of the welds using data in uncoded units isgiven by
Percentage Elongation= �100:354+0:139078
3 Welding Speedð Þ+0:0366317
3 (ToolRotational Speed)+0:148603
3 (ToolRotational speed)� 0:00023111
3 (Welding Speed2)� 2:878E10�6
3 (Welding Speed3Axial Force)+0:0001368
3 (Welding Speed3ToolRotational Speed)
� 2:712E10�5 3 (Axial Force
3ToolRotational Speed) ð2Þ
Validation of the regression model
In order to establish the adequacy of the mathematicalmodel, some test cases of welding parameters wereselected at random other than the values at the levels 1,2 and 3 as indicated in Tables 3 and 4. The actual val-ues of the responses obtained from the test case experi-ments and that predicted by the regression model areshown in Table 7. Table 7 indicates the predicted weld-ing parameter performance compared with the actual
Figure 9. Interaction plot data means for (a) ultimate tensile strength and (b) percentage elongation.
Balaji and Mahapatra 139
at UNIV OF CALIFORNIA SANTA CRUZ on November 5, 2014pib.sagepub.comDownloaded from

welding performance, and a reasonable agreement wasobtained. It is observed that in case of UTS, the varia-tion between the predicted and the actual values iswithin610%, whereas in case of percentage elonga-tion, it is within620%. The above mathematical mod-els for UTS and percentage elongation are of greatimportance in the proper selection of welding para-meters for butt welding of AA2219 aluminum alloy.
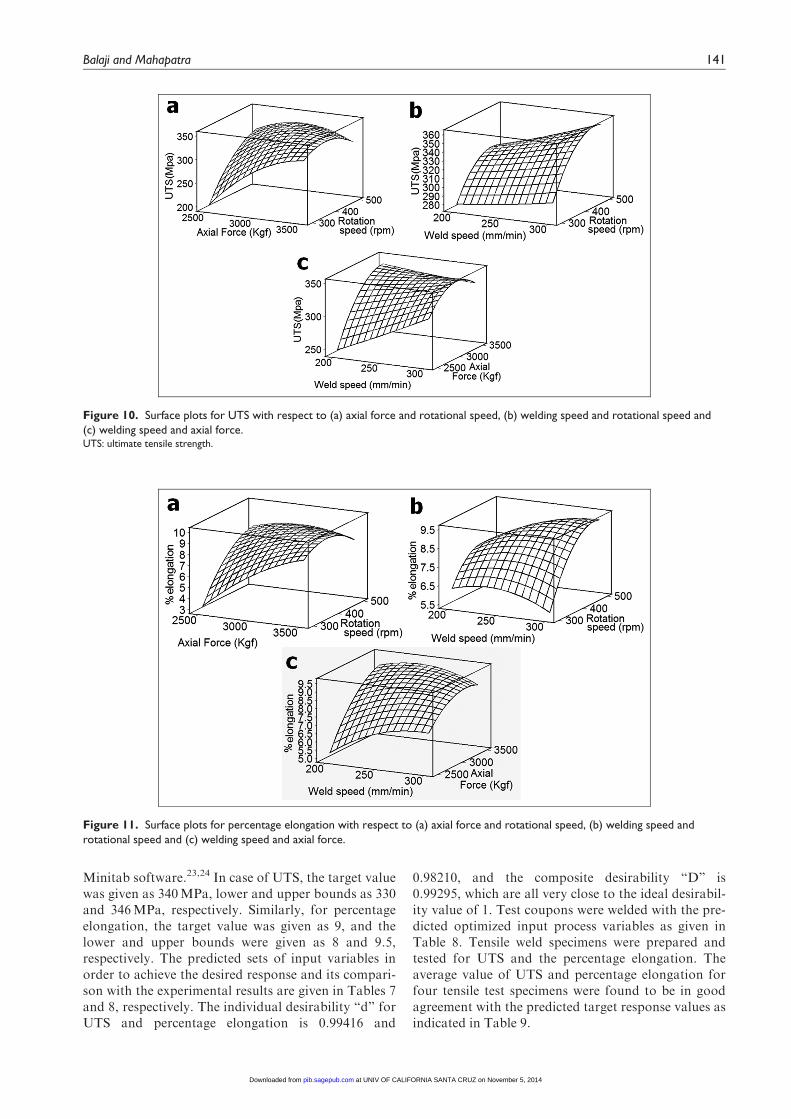
Figures 10 and 11 indicate the three-dimensionalresponse surface plots developed by taking two processparameters in the x- and the y-axes and response in thez-axis. In Figure 10, the response is the UTS, and inFigure 11, it is percentage elongation. The responsesurface plots clearly reveal an optimum response point.Response surface methodology is used to find the opti-mal set of process parameters that produce minimumor maximum value of a response. The convex nature ofthe surface clearly reveals that an optimum combina-tion of process parameters exists for the UTS and per-centage elongation.
Multiresponse optimization of FSW weldcharacteristics
The FSW joint output characteristics such as UTS andpercentage elongation are interdependent, and a
multiresponse optimization technique is consideredappropriate for optimizing the input process para-meters. For multiresponse optimization problems, thedesirability function–based optimization techniqueshave been advocated.21–24 In the present investigation,using the multiresponse optimization technique, theindividual desirability value of FSW joint characteris-tics such as UTS and percentage elongation was utilizedto compute the optimal desirability function. The opti-mal desirability function represented the optimal FSWjoint characteristics.21–24 The desirability functionwas maximized to obtain the optimum FSW controlfactors (input parameters). For the present investiga-tion, the FSW joints were considered of better qualitywith better UTS and percentage elongation. In thisinvestigation, ‘‘higher is better’’ criteria was used tooptimize the FSW joints’ UTS and percentage elonga-tion. To accomplish the optimization, the targetresponses such as UTS and percentage elongationwere set with an optimal desirability function havingvalue close to 1.24 The response surface regressionequations were then utilized for predicting the optimalFSW input process parameter (control factors) basedon the optimal desirability function. In the presentstudy, UTS and percentage elongation are jointlyoptimized using the response optimizer option of
Table 6. ANOVA and estimated regression coefficient for responses20.
Source DF Sequential SS Adj SS Adj MS F P
ANOVA for UTS (response surface regression: R2 = 89.3%; R2 (adj) = 83.6%)Regression 9 51377.3 51377.3 5708.6 15.76 \ 0.001Linear 3 30243.8 30243.8 10081.3 27.83 \ 0.001Square 3 6295.3 6295.3 2098.4 5.79 0.006Interaction 3 14838.2 14838.2 4946.1 13.65 \ 0.001Residual error 17 6159.2 6159.2 362.3Total 26 57536.4
ANOVA for percentage elongation (R2 = 87.5%; R2 (adj) = 81%)Regression 9 100.951 100.951 11.2168 13.26 \ 0.001Linear 3 56.368 24.671 8.2236 9.72 0.001Square 3 12.717 12.717 4.2391 5.01 0.011Interaction 3 31.865 31.865 10.6218 12.55 \ 0.001Residual error 17 14.384 14.384 0.8461Total 26 115.335
UTS: ultimate tensile strength; DF: degrees of freedom, SS: sum of squares: MS: mean square; Adj: adjusted; ANOVA: analysis of variance.
Table 7. Comparison of regression model results with experimental ones for test cases.
Sl. No V (mm/min) F (kgf) N (r/min) PredictedUTS (MPa)
ExperimentalUTS (MPa)
% Error Predictedpercentageelongation
Experimentalpercentageelongation
% Error
1 280 3050 420 346.2 323 7.1826 9.0 7.6 18.4212 245 2975 390 326.1 321 1.5887 8.5 7.8 8.97433 235 2950 370 314.4 317.5 — 8.0 7.6 5.26324 260 3025 410 338.1 323 4.6749 9.0 7.8 15.3855 310 3100 410 352.2 325 8.3692 8.6 7.2 19.4446 300 3075 430 353.5 322.5 9.6124 9.0 7.6 18.421
UTS: ultimate tensile strength.
140 Proc IMechE Part B: J Engineering Manufacture 227(1)
at UNIV OF CALIFORNIA SANTA CRUZ on November 5, 2014pib.sagepub.comDownloaded from
Minitab software.23,24 In case of UTS, the target valuewas given as 340MPa, lower and upper bounds as 330and 346MPa, respectively. Similarly, for percentageelongation, the target value was given as 9, and thelower and upper bounds were given as 8 and 9.5,respectively. The predicted sets of input variables inorder to achieve the desired response and its compari-son with the experimental results are given in Tables 7and 8, respectively. The individual desirability ‘‘d’’ forUTS and percentage elongation is 0.99416 and
0.98210, and the composite desirability ‘‘D’’ is0.99295, which are all very close to the ideal desirabil-ity value of 1. Test coupons were welded with the pre-dicted optimized input process variables as given inTable 8. Tensile weld specimens were prepared andtested for UTS and the percentage elongation. Theaverage value of UTS and percentage elongation forfour tensile test specimens were found to be in goodagreement with the predicted target response values asindicated in Table 9.
Figure 11. Surface plots for percentage elongation with respect to (a) axial force and rotational speed, (b) welding speed androtational speed and (c) welding speed and axial force.
Figure 10. Surface plots for UTS with respect to (a) axial force and rotational speed, (b) welding speed and rotational speed and(c) welding speed and axial force.UTS: ultimate tensile strength.
Balaji and Mahapatra 141
at UNIV OF CALIFORNIA SANTA CRUZ on November 5, 2014pib.sagepub.comDownloaded from

Conclusion
In this article, an experimental investigation was per-formed to study the UTS and percentage elongation offriction stir welded AA2219 aluminum alloy welds.Mathematical models were also developed to predictthe UTS and percentage elongation of the welds. Therelative effects of each factor and the combination offactors on responses were also investigated. The weld-ing parameters were optimized by using the multire-sponse desirability function–based optimizationtechnique. The optimized input variables that yieldedthe target values of responses were found to be withwelding speed of 256.4mm/min, axial force of3020.4 kgf and rotational speed of 492.9 r/min. Themain conclusions are summarized as follows:
1. The UTS and percentage elongation increases withthe increase in axial force applied by the FSW toolon the joint. The UTS also increases with theincrease in weld speed and tool rotational speed.The percentage elongation increases with theincrease in weld speed and tool rotational speed upto an optimum value beyond which there is adecrease in the percentage elongation.
2. According to ANOVA results, axial force wasfound to be the most influencing factor on UTSand percentage elongation, followed by tool rota-tional speed and then the weld speed.
3. The results of the regression analysis and responsesurface analysis indicated the suitability of the datafor predicting the output responses for the testcases.
4. The data were further used for optimization ofresponses, and the target-optimized responses werecompared with the experimental data. There was agood agreement between the two.
5. The results of the modeling and optimization tech-niques applied in the present investigation indicatetheir suitability for modeling of FSW of AA2219-T87 aluminum alloy plates of 7mm thickness.
Funding
This research received no specific grant from any fundingagency in the public, commercial or not-for-profit sectors.
Acknowledgement
The present work is dedicated to Late Shri AjaiAgarwal (Faculty, MIED, IIT Roorkee), who was alsoone of the supervisors of this work. Furthermore, theauthors would also like to extend their gratitude toHindustan Aeronautics Limited, Bangalore, India, forextending the FSW facility at their PSLV welding shopfor conducting the experimental works. The authorsgratefully acknowledge Indian Space ResearchOrganization (ISRO) for providing the necessary mate-rial for the experimental work. The authors would alsolike to thank Shri T. Mohapatra, General Manager,HAL (Aircraft Division), Bangalore; Shri Ravishankar,General Manager, LPSC-HAL Work Centre (LHWC);and Shri P. Srinivasa Rao, Scientist (ISRO) for theirtimely help and support.
References
1. Thomas WM, Nicholas ED, Needham JC, et al. Friction
stir butt welding. International patent application No:
PCT/GB2/02203. GB Patent application No.9125978.8,
1991.
2. Dawes CJ and Thomas WM. Friction stir process welds
in aluminium alloys. Weld J 1996; 75(3): 41–45.3. Flores OV, Kennedy C, Murr LE, et al. Micro structural
issues in a friction stir welded aluminium alloy. Scripta
Mater 1998; 38(5): 703–708.4. Huang C and Kou S. Effect of post weld heat treatment
on mechanical and metallurgical properties of heat trea-
table aluminium alloys. Weld J 2000; 79(5): 113s–120s.5. Rao K, Reddy GM, Rao S, et al. Reasons for superior
mechanical and corrosion properties of 2219 aluminium
alloy electron beam welds. Mater Charact 2005; 55(4–5):
345–354.
6. Elangovan K, Balasubramanian V and Babu S. Develop-
ing an empirical relationship to predict tensile strength of
Table 8. Target output and predicted optimized input variables.
Target outputs Predicted input variables
UTS (MPa) Percentage elongation Weld speed (mm/min) Axial force (kgf) Rotational speed (r/min)
340 9 256.3925 3020.4297 492.9221
UTS: ultimate tensile strength.
Table 9. Comparison of predicted optimized output and the experimental output.
UTS (MPa) Percentage elongation
Target Achieved % Error Target Achieved % Error
340 335 1.4925 9.0 8.6 4.6512
UTS: ultimate tensile strength.
142 Proc IMechE Part B: J Engineering Manufacture 227(1)
at UNIV OF CALIFORNIA SANTA CRUZ on November 5, 2014pib.sagepub.comDownloaded from

friction stir welded AA2219 aluminium alloy. J Mater
Eng Perform 2008; 17(6): 820s–830.7. Liu HJ, Fuji H, Maeda M, et al. Mechanical properties
of friction stir welded joint of 1050-H24 aluminium alloy.Sci Technol Weld Joi 2003; 8(6): 450–454.
8. Lee WB, Yeon YM and Jung SB. Mechanical propertiesrelated to micro-structural variations of 6061Al alloyjoints by friction stir welding. Mater Trans 2004; 45(5):1700–1705.
9. Box GEP, Hunter WH and Hunter JS. Statistics for
experiments. 1st ed. New York: John Wiley Publications,1978.
10. Montgomery DC. Design and analysis of experiments. 4thed. New York: John Wiley & Sons, Inc., 2006.
11. Bitondo C, Prisco U, Squillace A, et al. Friction stir weld-ing of AA2198-T3 butt joints for aeronautical applica-tions. Int J Mater Form 2010; 3(suppl. 1): 1079–1082.
12. Sarsılmaz F and Caydasx U. Statistical analysis onmechanical properties of friction stir welded AA1050/AA5083 couples. Int J Adv Manuf Tech. DOI: 10.1007/s00170-008-1716-x.
13. Lockwood WD, Tomaz B and Reynolds AP. Mechanicalresponse of friction stir welded AA2024: experiment andmodeling. Mater Sci Eng A: Struct 2002; 323: 348–353.
14. Benyounis KY and Olabi AG. Optimization of differentwelding processes using statistical and numericalapproaches—a reference guide. Adv Eng Softw 2008;39(6): 483–496.
15. Lakshminarayanan AK and Balasubramanian V. Processparameters optimization for friction stir welding of RDE-40 aluminium alloy using Taguchi technique. T Nonferr
Metal Soc 2008; 18: 548–554.16. Blignault C, Hattingh DG and James MN. Optimizing
friction stir welding via statistical design of tool geometry
and process parameters. J Mater Eng Perform 2012;21(6): 1059–9495.
17. Rajakumar S, Muralidharan C and Balasubramanian V.Optimization of the friction stir welding process and toolparameters to attain a maximum tensile strength ofAA7075-T6 aluminium alloy. Proc IMechE, Part B: J
Engineering Manufacture 2010; 224: 1175–1191.18. ESAB friction stir welder reference manual (vol. 2: compo-
nents and vol. 3: welding and milling sequences). ESAB,Sweden, 2010.
19. Raghulapadu JK, Peddieson J, Buchanan GR, et al. Arotating plug model of friction stir welding heat transfer.Heat Transfer Eng 2008; 29(3): 321–327.
20. Minitab Inc. User manual of MINITAB statistical soft-
ware (Release 13.31). State College, PA: Minitab Inc.,2000.
21. Asiabanpour B, Palmer K and Khoshnevis B. An experi-
mental study of surface quality and dimensional accuracyfor selective inhibition of sintering. Rapid Prototyping J
2004; 10: 181–192.22. Palanikumar K, Muthukrishnan N and Hariprasad KS.
Surface roughness parameters optimization in machiningA356/SiC/20p metal matrix composites by PCD toolusing response surface methodology and desirability func-tion.Mach Sci Technol 2008; 12: 529–545.
23. Latha B, Senthilkumar VS and Palanikumar K. Modelingand optimization of process parameters for de-laminationin drilling glass fiber reinforced plastic (GFRP) compo-sites.Mach Sci Technol 2011; 15: 172–191.
24. Boriwal L, Mahapatramm and Biswas P. Modellingand optimizing the effects of process parameters ongalvanized steel sheet resistance spot welds. Proc
IMechE, Part B: J Engineering Manufacture. DOI:10.1177/0954405411428988.
Balaji and Mahapatra 143
at UNIV OF CALIFORNIA SANTA CRUZ on November 5, 2014pib.sagepub.comDownloaded from