Embed Size (px)
Citation preview
1
Defect tolerance of friction stir welds in DH36 steel
Ryan J. Stevenson
Athanasios I. Toumpis
Alexander M. Galloway
Department of Mechanical & Aerospace Engineering, University of Strathclyde, Glasgow,
United Kingdom
ABSTRACT Friction stir welding of steel is in the early stages of development. The aim to commercialise
this process creates a trade-off between welding time, cost and quality of the joint produced.
Therefore, it becomes critical to analyse the lower quality bound of steel friction stir welds in
conventional square edge butt welding configuration. Work has been undertaken to evaluate
the microstructure and fatigue performance of 6 mm thick DH36 steel plates friction stir welded
with sub-optimal process conditions, resulting in the development of embedded and surface
breaking flaws. The defective weldments were characterised to understand the nature of the
flaws and a programme of mechanical testing was undertaken (including fatigue assessment)
to determine the relationship between the flaw geometry, location and weld quality. A number
of characteristic flaws were identified and seen to interact with the samples’ fatigue fracture
mechanisms. Samples with wormholes at the weld root produced the lowest fatigue
performance. Fracture from incomplete fusion paths at the retreating side of the welds’ top
surface was seen to correspond to the highest recorded fatigue lives. The work provides an
insight into the complex nature of characteristic flaws in steel friction stir welds and their
interaction with fatigue behaviour.
Keywords: Friction stir welding; Flaws; Fatigue; Sub-optimal welding conditions; Low alloy
steel
Corresponding author: Email: [email protected]
Tel: +44 (0) 141 574 5075
2
1.0 Introduction
Friction stir welding (FSW) has been successfully applied to the joining of aluminium alloys [1].
Research into steel FSW is ongoing but the process is still in the early stages of development
[2]. Steel FSW holds a number of potential advantages in comparison to other joining
processes. Some of these advantages are reduced weld distortion, reduction of welding
consumables and the production of high integrity welds [3]. When commercialised, steel FSW
will offer benefits to a number of industries [4]. To be practicable for use in industry the process
must produce welds of comparable quality to that of conventional fusion welding. This has
already been shown to be achievable [5].
From a cost perspective, steel FSW must also be competitive to other types of welding. A major
obstacle to economical steel FSW is the current cost and lifespan of FSW tools [4]. Another
cost factor is the achievable welding speeds. High welding speeds create desirable economics
for industrial users of steel FSW in that welding times are reduced. Traverse welding speeds of
up to 500 mm/min have been achieved [4]. FSW tool rotational and traverse speeds
correspond to the heat input, cooling rate and ultimate quality of the weld produced. Optimal
welding parameters for competitive steel FSW do not necessarily correspond to optimal
parameters for weld quality [4]. Thus, a trade-off between FSW cost and weld quality is created
and suggests that the lower bound of FSW quality is worth considering.
Threadgill [6] described the terminology related to FSW including characteristic flaws. It was
stated that a FSW flaw does not necessarily constitute a welding defect as a friction stir weld
containing flaws may still meet the relevant performance criteria. FSW flaws can generally be
grouped into two categories; surface breaking and non-surface breaking (embedded) flaws.
Both types can be sub-divided into volumetric and non-volumetric flaws [7]. Most FSW flaws
are a consequence of poor process parameters. The mixing of surface oxides into the
weldment and traces of the joint line of the welded materials have also been described to cause
surface breaking flaws [7]. Lenard and Lockyer [8] stated that if friction stir welds are produced
outside of a defined process parameter envelope (specific to a material), then defects will
occur. A number of characteristic flaws of aluminium FSW were defined which include, voids,
joint line remnants and root flaws.
There has been little work pertaining to flaws present in steel FSW. Toumpis et al. [9]
established a FSW parameter envelope for DH36 steel. A flaw present in a number of the
DH36 friction stir welded samples was also discussed and likened to the material being forged
rather than thermo-mechanically stirred. The repeating pattern of the flaw was related to the
features of the FSW tool and it was proposed that the flaw was a consequence of insufficient
heat input. Han et al. [10] reported the presence of a flaw, located at the weld root, in 18Cr-2Mo
ferritic stainless steel samples manufactured with a tool rotational speed of 200 rpm and
traverse speed of 130 mm/min. The flaw was seen to increase in size when the welding speed
was increased to 160 mm/min. Tingey et al. [11] studied the effects of tool deviation on the
properties of friction stir welded DH36 steel and indicated that the process is tolerant to minor
tool deviation from the weld centreline. With substantial tool deviation, it was found that the
developed root flaw became the dominant fracture initiation site.
The presence of a ‘swirl zone’ in the thermo-mechanically affected zone (TMAZ) of steel FSW
has been noted [12]. This zone is located at the advancing side of the friction stir weld and
coincides with the point at which the material flow caused by the FSW tool pin meets the

3
material flow caused by the tool shoulder. The two flows create a ‘vortex’ which produces a
‘swirl’ pattern. Reynolds et al. [13] investigated FSW of DH36 steel and describe this pattern to
be made up of untempered martensite and a mixture of martensite and granular bainite. The
formation of this zone in the weld microstructure did not compromise the weld quality, but
Reynolds et al. [13] also pointed out that this region often corresponds to a volumetric flaw in
aluminium FSW.
An investigation into the thermo-mechanical deformation behaviour of DH36 steel was
undertaken in a separate study [14]. Hot axisymmetric compression testing was performed and
demonstrated that the flow stress of DH36 steel is significantly affected by varying temperature
and rate of deformation. Flow stress was shown to increase with decreasing temperature and
increasing strain rate. This suggests that FSW at high welding speeds, causing high strain
rates and low thermal input, would reduce the material flow, decrease material mixing within the
TMAZ and increase the likelihood of welding flaws. Research into laser preheating of steel prior
to FSW has indicated an increase in feasible welding speeds with positive microstructural
results [15]. Preheating, which can also be accomplished by induction heating [16], has been
proposed as one way of overcoming poor weld quality caused by low heat input.
Barnes et al. [17] studied the residual stresses in friction stir welded RQT-701 steel. The welds
exhibited compressive residual stresses in the transverse direction and tensile residual
stresses, of above the yield stress of the parent material, in the longitudinal direction. The
maximum residual stresses were found in the parent material directly adjacent to the heat
affected zone (HAZ). Tensile residual stresses, of magnitude similar to that of parent material
yield strength, have been reported in the longitudinal weld direction in HSLA-65 steel [18] and
304L stainless steel [19]. Misalignments, undercuts and tensile residual stresses have been
shown to decrease fatigue life of fusion welded butt joints [20].
Much of the early work relating to steel FSW focused on the feasibility of the process and the
achievable welding speeds [3,13,21]. ‘Overmatching’ of the weld in comparison to the parent
material is generally reported, with fracture in the parent material during tensile testing being
the norm. Very few studies consider the fatigue life of steel FSW. McPherson et al. [5]
compared the fatigue life of DH36 steel when joined by submerged arc welding (SAW) and
FSW. Fatigue tests were carried out at stress ranges of 95% and 80% and found FSW to
exhibit superior performance.
There are a number of classification society guidelines which relate to the operational lifespan
of welded components. The International Institute of Welding (IIW) [22] defines ‘standards’ to
which welded structural details should adhere. These recommendations, which are
summarised by Hobbacher [23], can be used to assist in the design and analysis of weld details
that may experience fatigue due to cyclic loading. British Standard 7910 [24] describes a
number of quality categories to which flaws in metallic structures can be assigned. These
quality categories are related to expected fatigue lives of components and thus complement the
IIW recommendations.
The current study focuses on the fatigue behaviour of friction stir welded DH36 steel containing
surface breaking and embedded flaws, and advances the state of the art by reporting on the
lowest acceptable quality of steel FSW under static and cyclic loading conditions. A number of
welds produced under sub-optimal welding conditions were examined to assess the effect that
4
FSW flaws have on fatigue performance and thus investigate the acceptability of flaws in
friction stir welded DH36 steel.
2.0 Experimental procedures
2.1 Material and welding
Three, 2000 mm long, friction stir welds were manufactured from 6 mm DH36 steel plate. The
chemical composition of the steel, as supplied by the manufacturer, is detailed in table 1.
Table 1 - Chemical composition of DH36 steel
Element C Si Mn P S Al Nb N
wt% 0.11 0.37 1.48 0.014 0.004 0.02 0.02 0.002
The friction stir welds were produced using a PowerStir FSW machine, operated in positional
control, and pcBN tools as referenced in previous work by the authors [9]. These tools were
specifically selected to generate sub-optimal conditions, as they were at the end of their
nominal service life, thus producing defective welds. The parameters used in the production of
the welds are shown in table 2. Welds were labelled W1, W2 and W3. Each of the three welded
plates was confirmed to include welding flaws by means of X-ray imaging. Although welds W2
and W3 were produced using the same welding parameters, poor tool positioning allowed a
weld root flaw to develop in W2 which was not present in W3. These three welds collectively
generated a comprehensive spread of weld flaws for an in-depth analysis to be performed.
Table 2 - Welding parameters
Weld Tool rotational speed (rpm) Traverse speed (mm/min)
W1 500 300
W2 300 250
W3 300 250
2.2 Testing Protocol
Fatigue and tensile samples were sectioned from the welded plates by means of a water-jet
cutter. The high tolerances provided by this method enabled a metallographic sample to be
sectioned from the weld material at either side of each fatigue sample. This provided two
metallographic samples per fatigue sample which were put to use in identifying weld
microstructure and flaws.
Fatigue sample dimensions were selected with reference to ISO standards [25]. Twenty four
samples were sectioned in the transverse direction and cyclically loaded in the same
orientation. In addition, three longitudinal samples were sectioned from each plate. During
testing, these samples were loaded along the length of the weld. A sample labelling system
was developed to include the weld number then the sample reference number, i.e. the third
sample sectioned from weld W1 was labelled W1-3.
5
2.3 Microstructural evaluation
Metallographic samples were sectioned from the weld material at each side of the fatigue
samples as described in section 2.2. Samples were mounted in Polyfast Phenolic hot mounting
resin or Struers Epofix epoxy resin and then ground and polished using a semi-automatic
Struers Rotopol-21 grinding machine. After a final polish using 0.05 μm colloidal silica
suspension, the samples were etched with a 2% Nital solution to reveal the material
microstructure. The microstructure was examined by optical microscopy using an Olympus GX
51 Inverted Metallurgical microscope. Macro and microscopic examination of the
metallographic samples allowed characterisation of the flaws present in the welds. The two
metallographic samples per fatigue sample allowed the flaws contained within each fatigue
sample to be defined to a high degree of accuracy.
2.4 Tensile testing
Tensile testing was undertaken to evaluate the yield stress of the welds examined during this
investigation. The tests were performed in accordance with ISO standards [25] using an Instron
8802 250 kN servo-hydraulic uniaxial testing machine. All tensile samples fractured in the
parent material, exhibiting an average yield stress of 387 MPa. Such overmatching has been
described in numerous studies [3,13,21].
2.5 Fatigue testing
The fatigue testing programme was carried out in accordance with British Standards [26]; the
samples were produced to the geometries suggested in relevant ISO standards [25]. Before
testing, the edges of fatigue samples were polished to achieve a surface finish of 0.2 μm Ra
which was confirmed using a Mitutoyo Surftest SV-2000 surface roughness tester.
Two stress ranges, 80% and 90% of yield stress, were used for fatigue tests with an R ratio of
0.1. This corresponds to nominal applied stress ranges of 279 MPa and 313 MPa respectively.
These high stress ranges were selected as previous work had suggested that lower stress
ranges could correspond to very high cycles to fracture during testing [5]. Fatigue tests were
carried out at a frequency of 10 Hz using the same Instron 8802 testing machine as for the
tensile tests.
2.6 Fracture surface analysis
Post-test fracture surfaces were examined with the aid of macro photography. Scanning
electron microscopy (SEM) was carried out using a Tungsten Filament scanning electron
microscope which allowed higher magnification of significant features contained within the
fracture surfaces. SEM was also used in establishing the fracture initiation site. A number of
fracture surfaces were sectioned, mounted and etched (as in section 2.3) to reveal the fracture
path through the weld microstructure. Examination of the fracture surfaces and comparison to
metallographic samples allowed an assessment of the influence of weld flaws on fatigue life.
2.7 Residual stress measurements
Residual stress measurements were taken by means of the hole drilling method with strain
results recorded at increments of 0.1 mm to a total hole depth of 1 mm. Measurements were

6
recorded at the weld centre and at positions of 12 mm and 24 mm from each side of the weld
centre. These positions were chosen to allow residual stress measurements in the bulk of the
TMAZ, at the boundary of the HAZ and the TMAZ, and in the parent material respectively. Hole
drilling was performed at the top surface of the weld.
Figure 1 depicts the residual stresses in the centre of weld W2 and is indicative of the residual
stress results produced during this work. Within the weld material, longitudinal residual stresses
were tensile in nature with magnitudes between 300 MPa and 500 MPa, which is similar to or in
excess of the parent material yield stress. Transverse residual stresses were found to be small
and compressive with magnitudes of less than 100 MPa. Residual stresses in the parent
material were found to act in the same manner to that of the weldment but were of lower
magnitude. The results display an interesting trend in that longitudinal residual stresses are
significant and act in tension while transverse residual stresses are slightly compressive. This
trend is similar to the results described by Barnes et al. [17] and is expected to have a
significantly detrimental impact on the fatigue life of longitudinally tested samples. These
stresses may also serve to improve the lifespan of samples tested in the transverse direction.
3.0 Results and discussion
3.1 Transverse fatigue tests
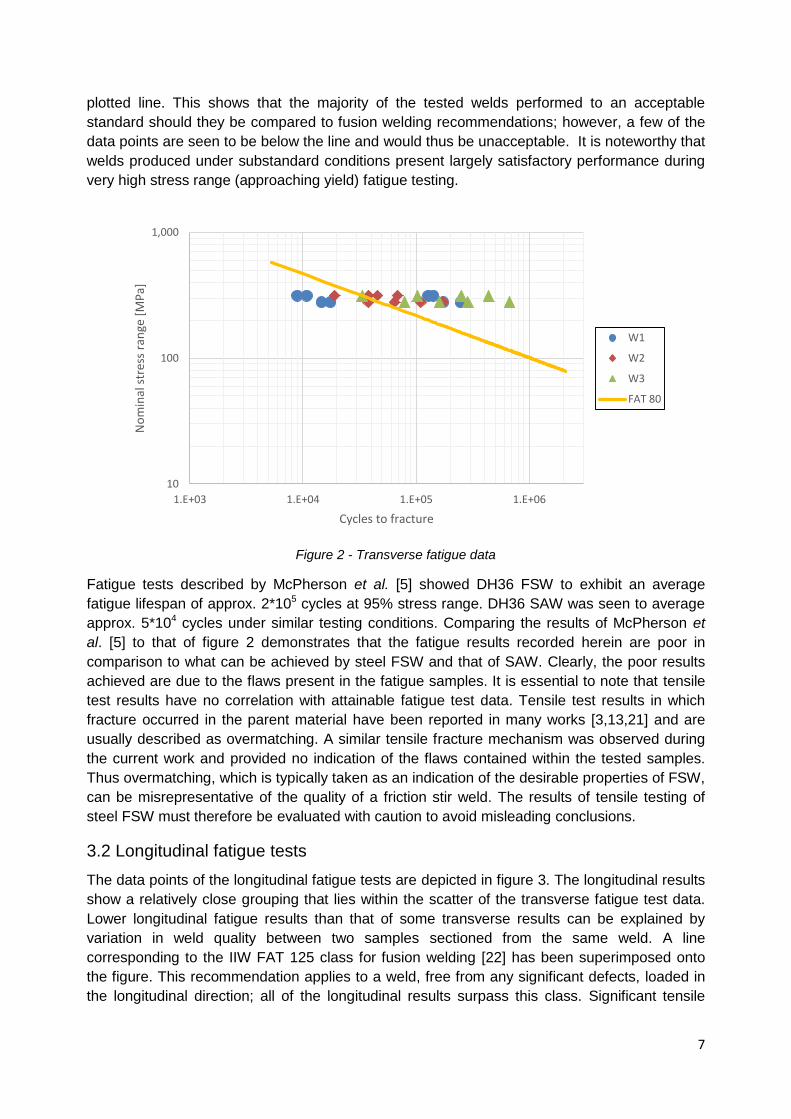
Figure 2 depicts the fatigue life of the transverse fatigue samples. In general, the results are
quite scattered with weld W1 exhibiting the lowest results and weld W3 the highest. Although
the fatigue data from the individual welds overlap, it is likely that the weld quality varies
between the three welds and that this has an effect on the fatigue life of the tested samples. A
line that corresponds to the IIW FAT 80 weld detail class [22] has been plotted on the graph as
this recommendation relates to fusion butt welds produced with the use of a temporary backing
plate. The FAT 80 class demonstrates how a conventional fusion butt weld in transverse cyclic
loading is expected to perform during its life in service. Any weld that adheres to the IIW FAT
80 class is expected to exhibit an operational life that would correspond to a point above the
-150
-100
-50
0
50
100
150
200
250
300
350
0.00 0.10 0.20 0.30 0.40 0.50 0.60
Res
idu
al s
tres
s [M
Pa]
Non-dimensional hole depth [h/2r]
Transversestress
Longitudinalstress
Figure 1 - Residual stresses in weld W2 (centre of weld)
7
plotted line. This shows that the majority of the tested welds performed to an acceptable
standard should they be compared to fusion welding recommendations; however, a few of the
data points are seen to be below the line and would thus be unacceptable. It is noteworthy that
welds produced under substandard conditions present largely satisfactory performance during
very high stress range (approaching yield) fatigue testing.
Figure 2 - Transverse fatigue data
Fatigue tests described by McPherson et al. [5] showed DH36 FSW to exhibit an average
fatigue lifespan of approx. 2*105 cycles at 95% stress range. DH36 SAW was seen to average
approx. 5*104 cycles under similar testing conditions. Comparing the results of McPherson et
al. [5] to that of figure 2 demonstrates that the fatigue results recorded herein are poor in
comparison to what can be achieved by steel FSW and that of SAW. Clearly, the poor results
achieved are due to the flaws present in the fatigue samples. It is essential to note that tensile
test results have no correlation with attainable fatigue test data. Tensile test results in which
fracture occurred in the parent material have been reported in many works [3,13,21] and are
usually described as overmatching. A similar tensile fracture mechanism was observed during
the current work and provided no indication of the flaws contained within the tested samples.
Thus overmatching, which is typically taken as an indication of the desirable properties of FSW,
can be misrepresentative of the quality of a friction stir weld. The results of tensile testing of
steel FSW must therefore be evaluated with caution to avoid misleading conclusions.
3.2 Longitudinal fatigue tests
The data points of the longitudinal fatigue tests are depicted in figure 3. The longitudinal results
show a relatively close grouping that lies within the scatter of the transverse fatigue test data.
Lower longitudinal fatigue results than that of some transverse results can be explained by
variation in weld quality between two samples sectioned from the same weld. A line
corresponding to the IIW FAT 125 class for fusion welding [22] has been superimposed onto
the figure. This recommendation applies to a weld, free from any significant defects, loaded in
the longitudinal direction; all of the longitudinal results surpass this class. Significant tensile
10
100
1,000
1.E+03 1.E+04 1.E+05 1.E+06
No
min
al s
tres
s ra
nge
[M
Pa]
Cycles to fracture
W1
W2
W3
FAT 80

8
residual stresses in the longitudinal direction have reduced sample fatigue life. Tensile residual
stresses of a similar magnitude to that of parent material yield stress have been described to
reduce fatigue life by up to a factor of ten in comparison to stress relieved joints [20]. This
suggests that stress relieving could improve longitudinal fatigue test results. This however may
not be beneficial to the weld as a whole, as the compressive residual stresses in the transverse
direction, which are likely to improve transverse fatigue life, would also be negated.
Figure 3 - Longitudinal fatigue data
3.3 Observed flaws
The following convention has been adopted for use throughout the work:
The advancing side of the weld is displayed at the left hand side of all macroscopic and
microscopic images. The retreating side of the weld is thus at the right hand side of
such images.
Microscopic images are shown adjacent to macroscopic images to denote position.
Both faces of sample fracture surfaces are depicted in a single image. The samples are
arranged so that the weld root of each side of the fracture surface meets in the middle
of the image.
A number of imperfections were observed through microscopic examination of metallographic
samples. Throughout this study, large imperfections in the welds will be referred to as flaws.
This is due to the argument, as discussed by Threadgill [6], that flaws present in friction stir
welds cannot necessarily be termed as defects as such welds may be perfectly useful for some
applications. Each of the three welds examined in this study (W1, W2 and W3) exhibited
different groups of flaws and the observed flaws varied between samples sectioned from
different positions on each weld. Five distinct flaw types were identified and are detailed in
figure 4.
10
100
1,000
1.E+05 1.E+06
No
min
al s
tres
s ra
nge
[M
Pa]
Cycles to fracture
W1
W2
W3
FAT 125

9
Figure 4 - Observed flaws
Flaws present on the weld top surface have been labelled ‘incomplete fusion paths’. These
flaws can take the form of surface breaking cracks or ‘laps’ as illustrated in Figure 5a. No
preparation of the edges of the steel plates was performed prior to welding to more closely
represent expected industrial conditions. This resulted in other incomplete fusion paths,
consisting of surface impurities in the top of the weldment, as shown in Figure 5b. Both types of
flaws increase the weld’s susceptibility to crack propagation.
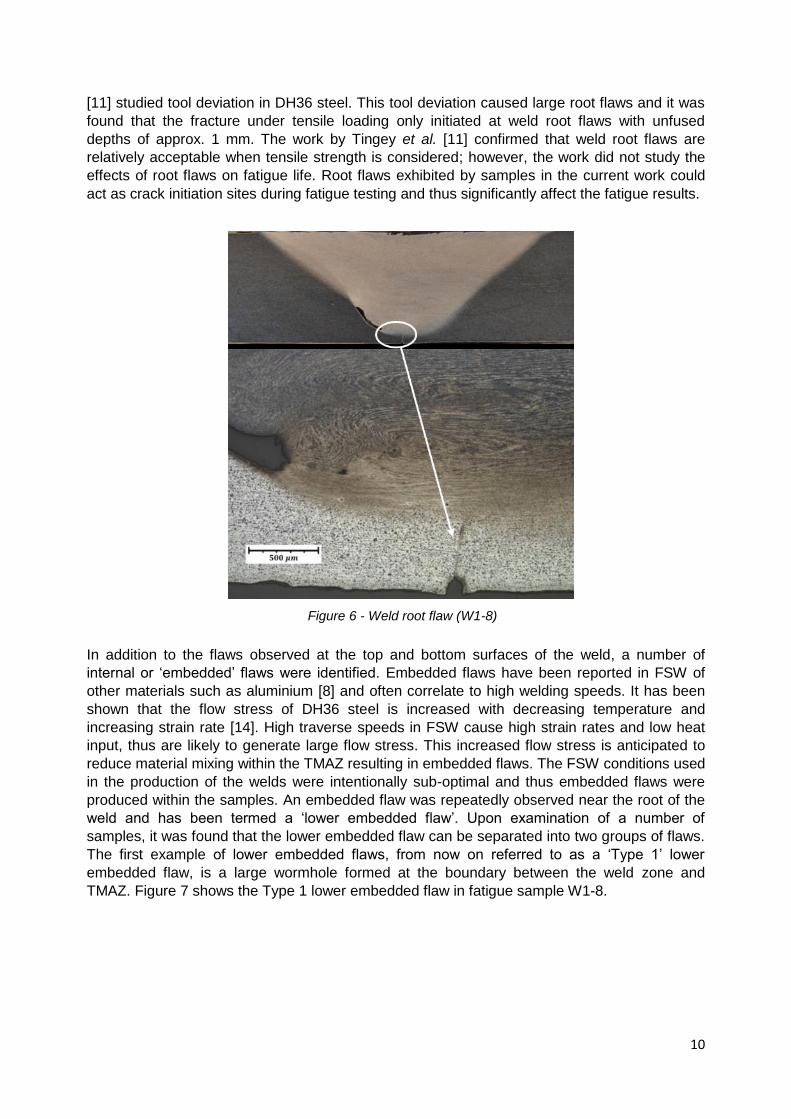
Weld root flaws were observed at the bottom surface of a number of the fatigue samples. Such
flaws were seen to extend up to a depth of 600 μm and are effectively illustrated by figure 6
which displays the weld root flaw present in fatigue sample W1-8. Weld root flaws are caused
by insufficient FSW tool plunge depth or tool deviation from the weld centreline. Tingey et al.
(a) (b)
Figure 5 - Incomplete fusion paths in weld W3-11: (a) at the advancing side of the weldment; (b) towards the middle of the weldment
10
[11] studied tool deviation in DH36 steel. This tool deviation caused large root flaws and it was
found that the fracture under tensile loading only initiated at weld root flaws with unfused
depths of approx. 1 mm. The work by Tingey et al. [11] confirmed that weld root flaws are
relatively acceptable when tensile strength is considered; however, the work did not study the
effects of root flaws on fatigue life. Root flaws exhibited by samples in the current work could
act as crack initiation sites during fatigue testing and thus significantly affect the fatigue results.
In addition to the flaws observed at the top and bottom surfaces of the weld, a number of
internal or ‘embedded’ flaws were identified. Embedded flaws have been reported in FSW of
other materials such as aluminium [8] and often correlate to high welding speeds. It has been
shown that the flow stress of DH36 steel is increased with decreasing temperature and
increasing strain rate [14]. High traverse speeds in FSW cause high strain rates and low heat
input, thus are likely to generate large flow stress. This increased flow stress is anticipated to
reduce material mixing within the TMAZ resulting in embedded flaws. The FSW conditions used
in the production of the welds were intentionally sub-optimal and thus embedded flaws were
produced within the samples. An embedded flaw was repeatedly observed near the root of the
weld and has been termed a ‘lower embedded flaw’. Upon examination of a number of
samples, it was found that the lower embedded flaw can be separated into two groups of flaws.
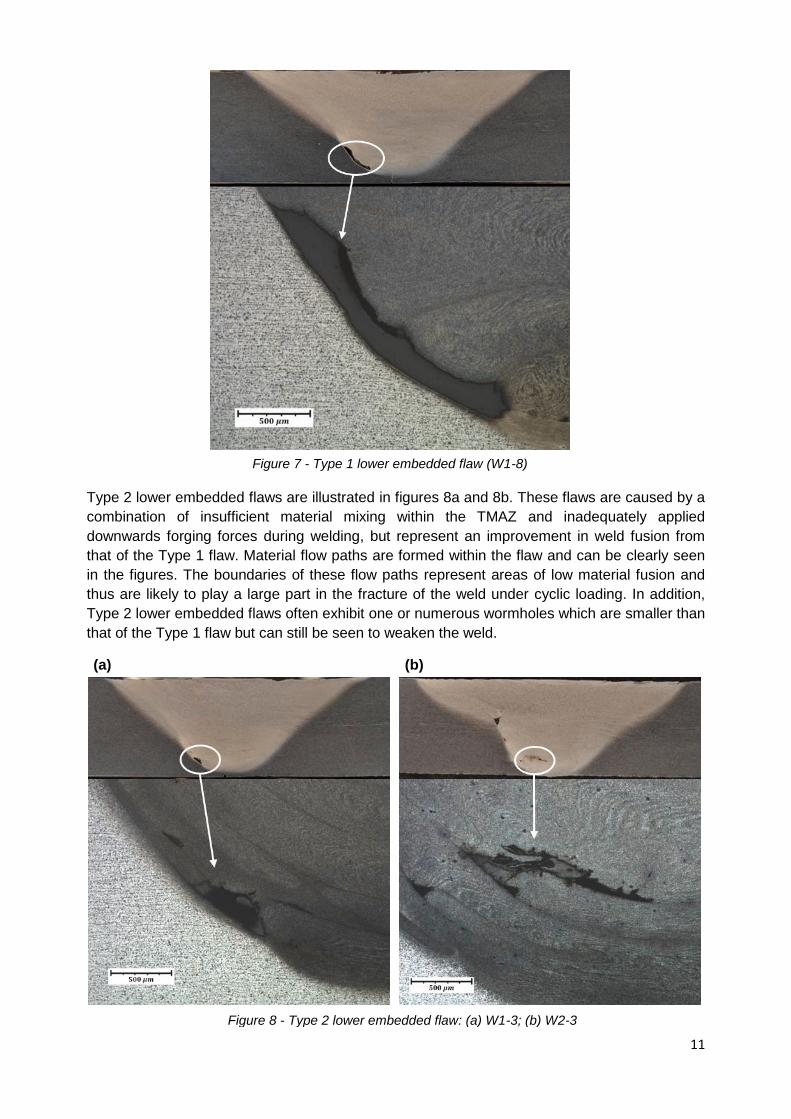
The first example of lower embedded flaws, from now on referred to as a ‘Type 1’ lower
embedded flaw, is a large wormhole formed at the boundary between the weld zone and
TMAZ. Figure 7 shows the Type 1 lower embedded flaw in fatigue sample W1-8.
Figure 6 - Weld root flaw (W1-8)
11
Type 2 lower embedded flaws are illustrated in figures 8a and 8b. These flaws are caused by a
combination of insufficient material mixing within the TMAZ and inadequately applied
downwards forging forces during welding, but represent an improvement in weld fusion from
that of the Type 1 flaw. Material flow paths are formed within the flaw and can be clearly seen
in the figures. The boundaries of these flow paths represent areas of low material fusion and
thus are likely to play a large part in the fracture of the weld under cyclic loading. In addition,
Type 2 lower embedded flaws often exhibit one or numerous wormholes which are smaller than
that of the Type 1 flaw but can still be seen to weaken the weld.
Figure 8 - Type 2 lower embedded flaw: (a) W1-3; (b) W2-3
(a) (b)
Figure 7 - Type 1 lower embedded flaw (W1-8)

12
Another type of embedded flaw was observed in the mid-thickness of the advancing side of
many samples. These wormholes have been termed ‘upper embedded flaws’. The upper
embedded flaws correspond to the position of the ‘swirl zone’ reported in other publications
[12,13] and examination of the material microstructure does show a vortex-like pattern. This
pattern is caused by the interaction of material flow driven by the FSW tool pin and material
flow driven by the tool shoulder. During welding, this interaction creates shearing forces which
are associated with the development of weld imperfections [5]. Upper embedded flaws
examined during this study often exhibited a triangular like shape at the boundary of the TMAZ
(all microstructural images represent a 2D section of each flaw). Fatigue sample W2-3
exhibited this type of flaw which is depicted in figure 9a.
In many cases where an upper embedded flaw was observed, a number of smaller flaws were
also observed on the TMAZ/HAZ boundary directly below it. An example of this is detailed in
figure 9b. These flaws have been termed ‘connectivity’ because they are thought to provide a
weakened path to connect the upper and lower embedded flaws. It should be noted that all
flaws are 3-dimensional and connectivity flaws may actually be linked to other embedded flaws
on a plane not shown in the metallographic samples. Many of the embedded flaws exhibit
sharp corners that are likely to act as stress raisers. This gives rise to the possibility of crack
initiation at the embedded flaws and propagation outwards towards the top and bottom
surfaces of the welds.
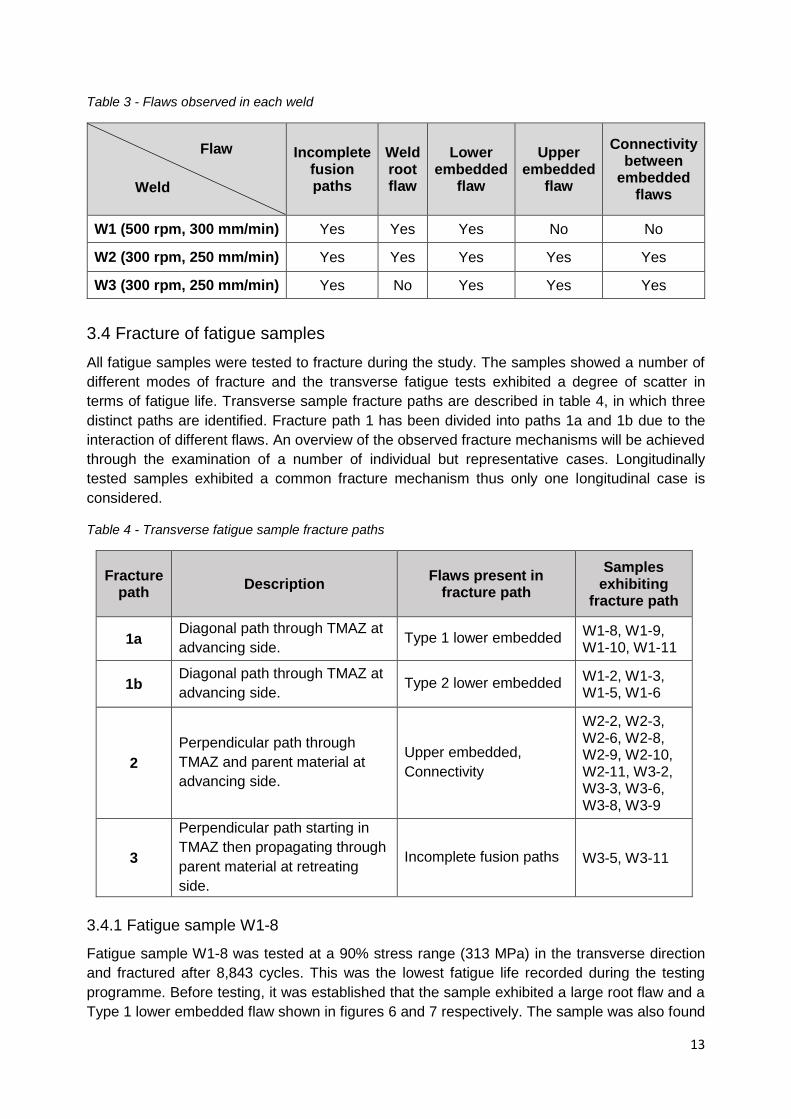
Table 3 summarises the flaws that were observed in each of the three welds investigated. All
flaws were observed to vary in shape and size along the length of each weld. Welds W2 and
W3 were manufactured under the same conditions and display the same flaws with the
exception of the weld root flaw. This is due to poor FSW tool positioning during the production
of weld W2, resulting in a flaw at the weld root. Table 3 demonstrates that differing welding
conditions can create different flaws in the weldment.
Figure 9 - W2-3: (a) upper embedded flaw; (b) connectivity flaw
(a) (b)
13
Table 3 - Flaws observed in each weld
Flaw
Weld
Incomplete fusion paths
Weld root flaw
Lower embedded
flaw
Upper embedded
flaw
Connectivity between
embedded flaws
W1 (500 rpm, 300 mm/min) Yes Yes Yes No No
W2 (300 rpm, 250 mm/min) Yes Yes Yes Yes Yes
W3 (300 rpm, 250 mm/min) Yes No Yes Yes Yes
3.4 Fracture of fatigue samples
All fatigue samples were tested to fracture during the study. The samples showed a number of
different modes of fracture and the transverse fatigue tests exhibited a degree of scatter in
terms of fatigue life. Transverse sample fracture paths are described in table 4, in which three
distinct paths are identified. Fracture path 1 has been divided into paths 1a and 1b due to the
interaction of different flaws. An overview of the observed fracture mechanisms will be achieved
through the examination of a number of individual but representative cases. Longitudinally
tested samples exhibited a common fracture mechanism thus only one longitudinal case is
considered.
Table 4 - Transverse fatigue sample fracture paths
Fracture path
Description Flaws present in
fracture path
Samples exhibiting
fracture path
1a Diagonal path through TMAZ at
advancing side. Type 1 lower embedded
W1-8, W1-9, W1-10, W1-11
1b Diagonal path through TMAZ at
advancing side. Type 2 lower embedded
W1-2, W1-3, W1-5, W1-6
2
Perpendicular path through
TMAZ and parent material at
advancing side.
Upper embedded,
Connectivity
W2-2, W2-3, W2-6, W2-8, W2-9, W2-10, W2-11, W3-2, W3-3, W3-6, W3-8, W3-9
3
Perpendicular path starting in
TMAZ then propagating through
parent material at retreating
side.
Incomplete fusion paths W3-5, W3-11
3.4.1 Fatigue sample W1-8
Fatigue sample W1-8 was tested at a 90% stress range (313 MPa) in the transverse direction
and fractured after 8,843 cycles. This was the lowest fatigue life recorded during the testing
programme. Before testing, it was established that the sample exhibited a large root flaw and a
Type 1 lower embedded flaw shown in figures 6 and 7 respectively. The sample was also found
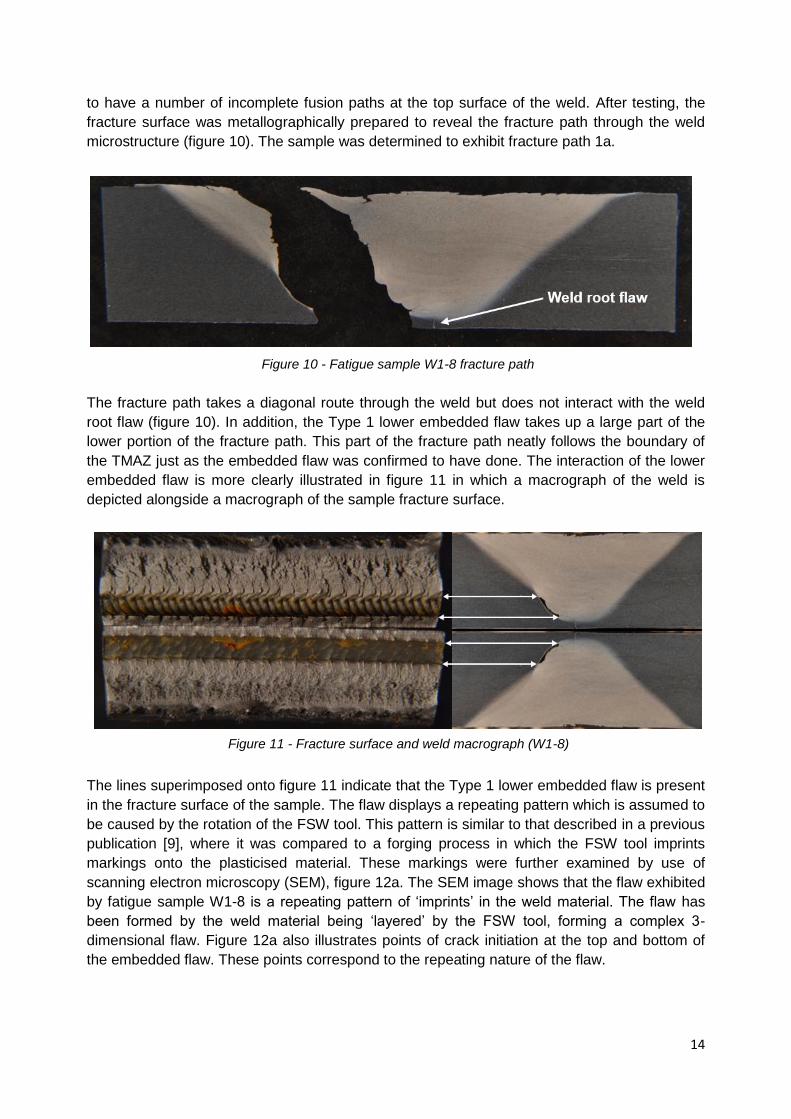
14
to have a number of incomplete fusion paths at the top surface of the weld. After testing, the
fracture surface was metallographically prepared to reveal the fracture path through the weld
microstructure (figure 10). The sample was determined to exhibit fracture path 1a.
The fracture path takes a diagonal route through the weld but does not interact with the weld
root flaw (figure 10). In addition, the Type 1 lower embedded flaw takes up a large part of the
lower portion of the fracture path. This part of the fracture path neatly follows the boundary of
the TMAZ just as the embedded flaw was confirmed to have done. The interaction of the lower
embedded flaw is more clearly illustrated in figure 11 in which a macrograph of the weld is
depicted alongside a macrograph of the sample fracture surface.
The lines superimposed onto figure 11 indicate that the Type 1 lower embedded flaw is present
in the fracture surface of the sample. The flaw displays a repeating pattern which is assumed to
be caused by the rotation of the FSW tool. This pattern is similar to that described in a previous
publication [9], where it was compared to a forging process in which the FSW tool imprints
markings onto the plasticised material. These markings were further examined by use of
scanning electron microscopy (SEM), figure 12a. The SEM image shows that the flaw exhibited
by fatigue sample W1-8 is a repeating pattern of ‘imprints’ in the weld material. The flaw has
been formed by the weld material being ‘layered’ by the FSW tool, forming a complex 3-
dimensional flaw. Figure 12a also illustrates points of crack initiation at the top and bottom of
the embedded flaw. These points correspond to the repeating nature of the flaw.
Weld root
flaw
Figure 10 - Fatigue sample W1-8 fracture path
Figure 11 - Fracture surface and weld macrograph (W1-8)
15
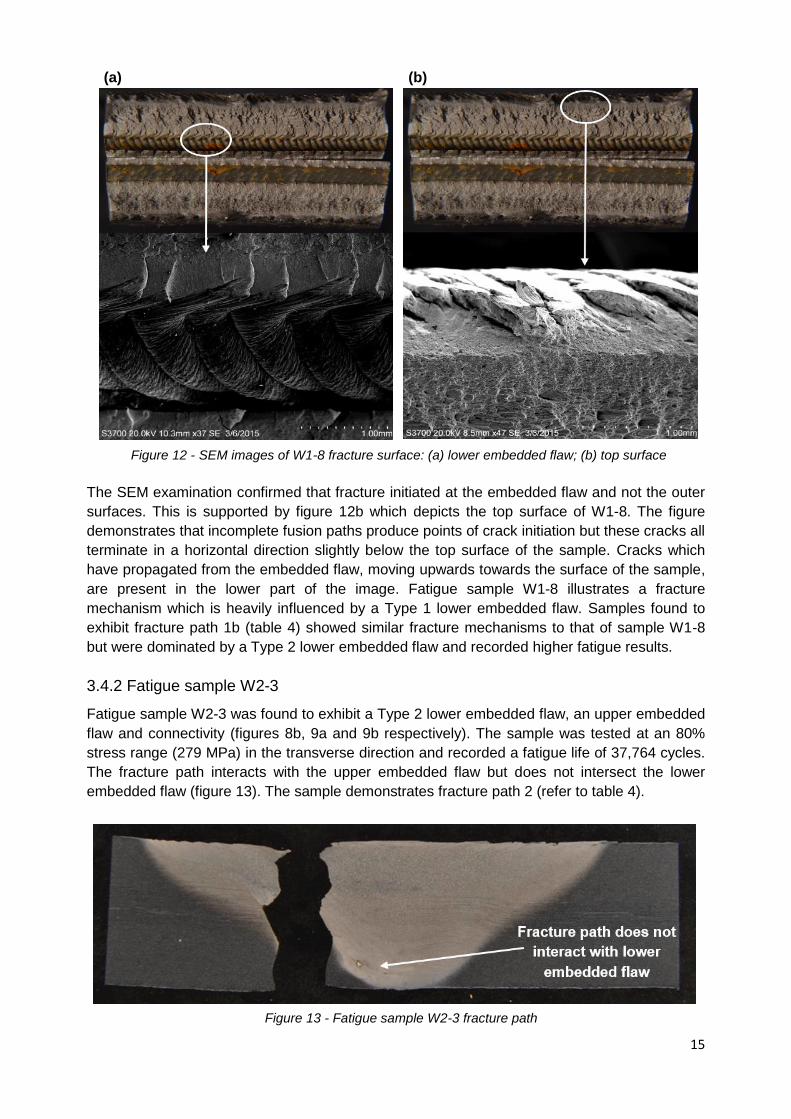
The SEM examination confirmed that fracture initiated at the embedded flaw and not the outer
surfaces. This is supported by figure 12b which depicts the top surface of W1-8. The figure
demonstrates that incomplete fusion paths produce points of crack initiation but these cracks all
terminate in a horizontal direction slightly below the top surface of the sample. Cracks which
have propagated from the embedded flaw, moving upwards towards the surface of the sample,
are present in the lower part of the image. Fatigue sample W1-8 illustrates a fracture
mechanism which is heavily influenced by a Type 1 lower embedded flaw. Samples found to
exhibit fracture path 1b (table 4) showed similar fracture mechanisms to that of sample W1-8
but were dominated by a Type 2 lower embedded flaw and recorded higher fatigue results.
3.4.2 Fatigue sample W2-3
Fatigue sample W2-3 was found to exhibit a Type 2 lower embedded flaw, an upper embedded
flaw and connectivity (figures 8b, 9a and 9b respectively). The sample was tested at an 80%
stress range (279 MPa) in the transverse direction and recorded a fatigue life of 37,764 cycles.
The fracture path interacts with the upper embedded flaw but does not intersect the lower
embedded flaw (figure 13). The sample demonstrates fracture path 2 (refer to table 4).
Figure 12 - SEM images of W1-8 fracture surface: (a) lower embedded flaw; (b) top surface
(a) (b)
Figure 13 - Fatigue sample W2-3 fracture path
16
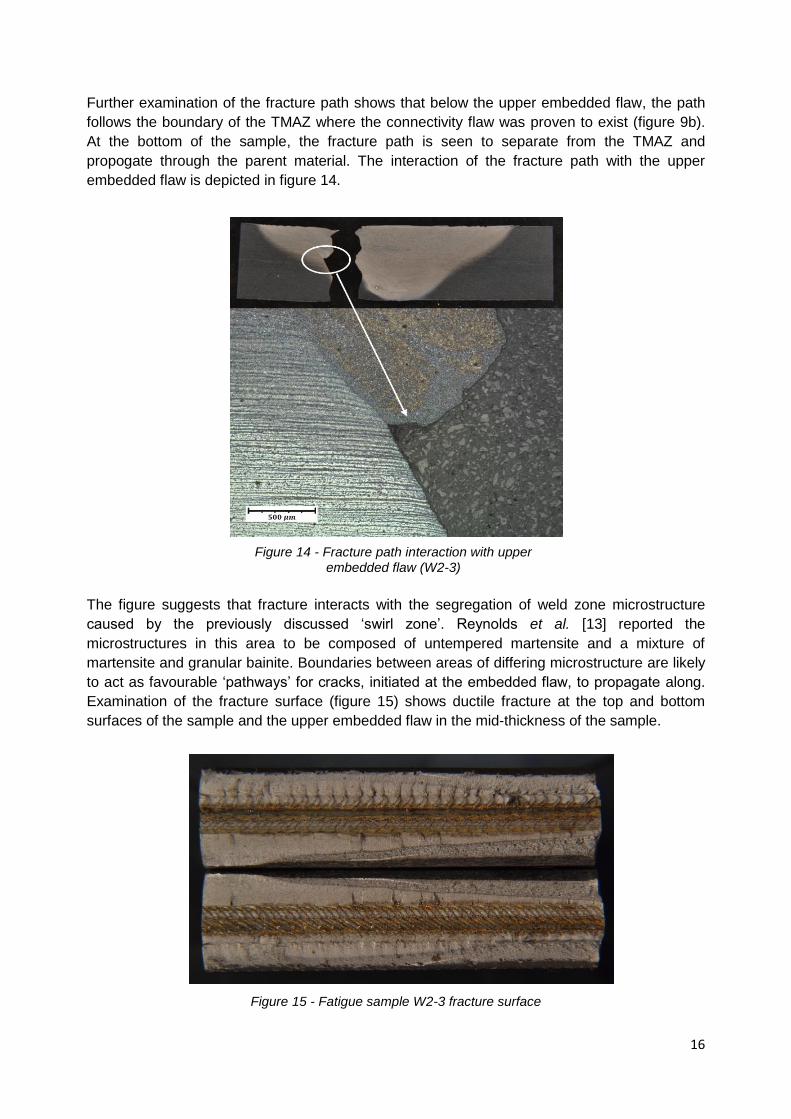
Further examination of the fracture path shows that below the upper embedded flaw, the path
follows the boundary of the TMAZ where the connectivity flaw was proven to exist (figure 9b).
At the bottom of the sample, the fracture path is seen to separate from the TMAZ and
propogate through the parent material. The interaction of the fracture path with the upper
embedded flaw is depicted in figure 14.
The figure suggests that fracture interacts with the segregation of weld zone microstructure
caused by the previously discussed ‘swirl zone’. Reynolds et al. [13] reported the
microstructures in this area to be composed of untempered martensite and a mixture of
martensite and granular bainite. Boundaries between areas of differing microstructure are likely
to act as favourable ‘pathways’ for cracks, initiated at the embedded flaw, to propagate along.
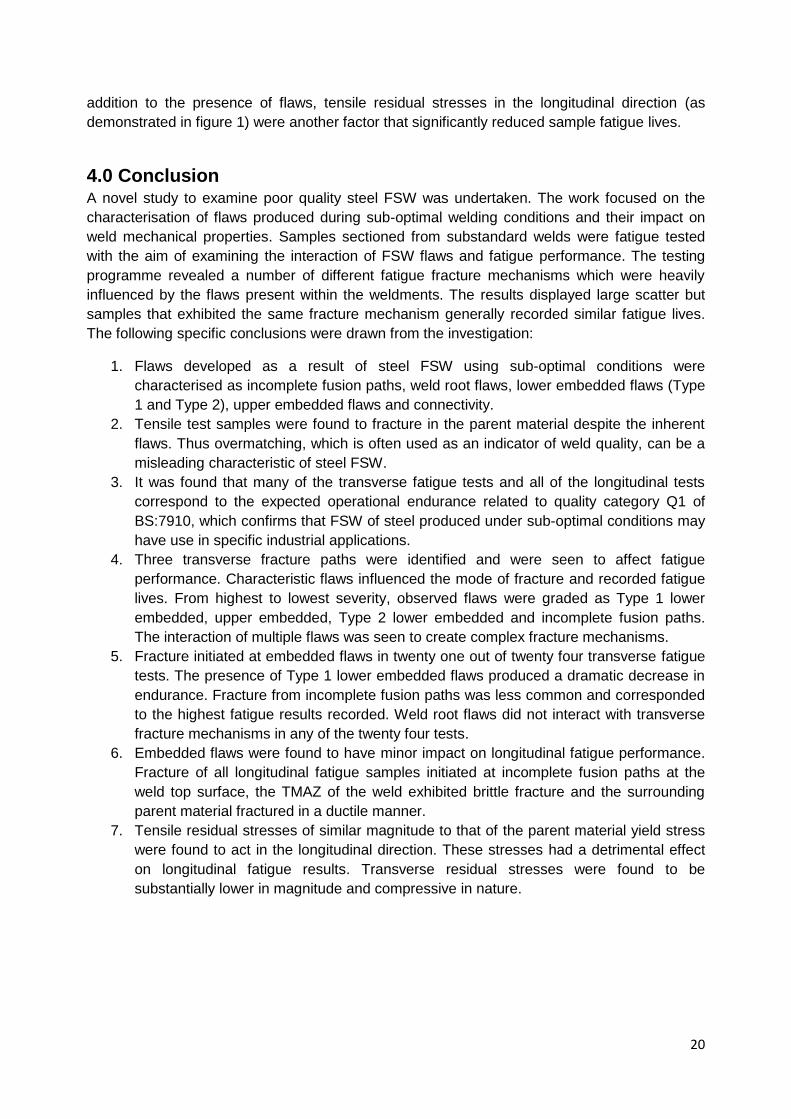
Examination of the fracture surface (figure 15) shows ductile fracture at the top and bottom
surfaces of the sample and the upper embedded flaw in the mid-thickness of the sample.
Figure 15 - Fatigue sample W2-3 fracture surface
Figure 14 - Fracture path interaction with upper embedded flaw (W2-3)

17
3.4.3 Fatigue sample W2-12
Sample W2-12 was found to exhibit incomplete fusion paths, an upper embedded flaw,
connectivity, a Type 2 lower embedded flaw and a weld root flaw. Like all longitudinal fatigue
samples, it was tested at a stress range of 90% (313 MPa). The sample survived 257,049
fatigue cycles before fracture and thus is in the ‘mid-range’ of the longitudinal fatigue lives.
Figure 16 - Fatigue sample W2-12 (longitudinal) top surface
Post-fracture examination of this fatigue sample’s top surface (figure 16) illustrates that fracture
follows the surface markings produced by the FSW tool shoulder. Furthermore, the parent
material at each side of the friction stir weld plastically deforms during testing. This is also
displayed in the fracture surface (figure 17).
Figure 17 - Fatigue sample W2-12: (a) fracture surface (longitudinal); (b) macrograph
(a)
(b)

18
Figure 17 shows the fracture surface of fatigue sample W2-12 and includes a macrograph of
the weld microstructure. Fracture of the longitudinal sample is closely related to the shape of
the friction stir weld. The TMAZ of the weld exhibits brittle fracture while the surrounding parent
material fractured in a ductile manner. Comparison between the fracture surface and
macrograph shows that the embedded flaws also appear in the former. SEM analysis was used
to confirm that fracture initiated at the top surface, which is supported by the large cracks in
figure 17. Thus incomplete fusion paths, at the weld top surface, were the most significant flaws
in terms of longitudinal fatigue.
3.5 Assessment of weld quality
To allow an assessment of weld quality, the fatigue results were analysed in comparison to
British Standard 7910 [24]. This standard defines a number of ‘quality categories’ for flaws
found in welded and un-welded metallic components. The expected operational endurance of
each quality category was calculated for the two stress ranges examined in this study. A fatigue
sample was assigned to a specific quality category when found to exceed its expected
endurance. This method allowed a quality assessment of the friction stir welds studied during
this work.
3.5.1 Transverse Samples
Table 5 - BS:7910 quality categories and corresponding transverse fatigue results
BS
:791
0
qu
ality
cate
go
ry
Minimum endurance
for quality category
(cycles to fracture) Fatigue sample
reference
number
Dominant flaw(s)
Fra
ctu
re p
ath
(s)
90% stress range
(313 MPa)
80% stress range
(279 MPa)
Q1 49,474 69,989
W1-2, W1-3,
W1-5, W1-6,
W2-8, W2-9,
W2-11, W3-2,
W3-3, W3-5,
W3-6, W3-9,
W3-11
Upper embedded,
Type 2 lower embedded,
Incomplete fusion paths
1b, 2, 3
Q2 33,851 47,887 W2-2, W2-6,
W2-10 Upper embedded 2
Q3 20,603 29,147 W2-3, W3-8 Upper embedded 2
Q4 14,029 19,846 - - -
Q5 8,137 11,511 W1-8, W1-9,
W1-10, W1-11 Type 1 lower embedded 1a

19
Table 5 depicts the quality categories 1 to 5 for BS:7910 and the expected fatigue performance
of a metallic structure in each quality category at 80% and 90% stress ranges. The table details
the transverse fatigue samples that fall into each category. Flaws that dominate sample fracture
mechanisms in each category are also listed along with the corresponding fracture paths. The
majority of the samples fall into quality category Q1 (the best quality category) however, these
samples display large scatter in terms of fatigue lives.
To assess the quality of the welds discussed in the previous sections, it is worth examining the
fatigue samples in each quality category. The most obvious result is that category Q5 consists
of consecutive samples sectioned from weld W1 which were found to have similar flaws. Each
of these samples was found to contain a large Type 1 lower embedded flaw (refer to figure 7)
and exhibited fracture path 1a after testing. It is clear that these large Type 1 lower embedded
flaws produced the lowest fatigue results during the study and would most likely be considered
unacceptable for use in any industrial setting. Four samples exhibited fracture path 1b, in which
a Type 2 lower embedded flaw (see figures 8a and 8b) was the dominant flaw. These samples
all conformed to quality category Q1. This suggests that a Type 2 lower embedded flaw is
much less critical to operational lifespan than that of a Type 1 flaw.
Fracture path 3, which initiated at incomplete fusion paths at the retreating side of the top
surface and propagated through the parent material, was exhibited by samples W3-11 and W3-
5. These samples recorded the highest number of cycles to fracture in the 80% and 90% stress
ranges respectively. The high fatigue lives recorded in the samples that fractured via mode 3
suggest that large internal flaws are far more detrimental to a friction stir weld than that of
incomplete fusion paths. Fracture path 2 was exhibited by samples in quality categories 1, 2
and 3. This mode of fracture was dominated by the upper embedded flaw (see figure 9a) and
was the most common mechanism of fracture. It should be noted that connectivity flaws also
contributed to this mode of fracture and thus increase the severity of an upper embedded flaw.
A number of the samples exhibiting this mechanism of fracture also contained Type 2 lower
embedded flaws that did not interact with the fracture path.
In general, the fracture mechanisms can be ranked as 3, 1b, 2, 1a from highest to lowest
fatigue life. As each mode of fracture was dominated by different characteristic flaws, fatigue
life is dependent on the type of flaws present in a sample. Observed flaws can be graded as
Type 1 lower embedded, upper embedded, Type 2 lower embedded and incomplete fusion
paths from highest to lowest severity. The interaction of multiple flaws create complex
mechanisms of fracture; this is effectively demonstrated by the Type 2 lower embedded flaw
which is present in many samples but only occasionally interacts with the recorded fracture
path.
3.5.2 Longitudinal Samples
As the longitudinal fatigue tests recorded cycles to fracture ranging from 190,199 to 466,493, all
samples are classed in the Q1 quality category. All of the longitudinal samples also surpassed
the IIW FAT 125 guideline (figure 3). Longitudinal samples exhibited a fracture mechanism
which initiated at the top surface of the weld, the TMAZ fractured in a brittle manner and the
parent material plastically deformed resulting in ductile fracture. The incomplete fusion paths at
the top surface of the weld were the most significant flaws in terms of longitudinal fatigue.
These flaws were found in all samples and correspondingly, the longitudinal fatigue testing
programme produced less scattered results than that of the transverse testing programme. In
20
addition to the presence of flaws, tensile residual stresses in the longitudinal direction (as
demonstrated in figure 1) were another factor that significantly reduced sample fatigue lives.
4.0 Conclusion A novel study to examine poor quality steel FSW was undertaken. The work focused on the
characterisation of flaws produced during sub-optimal welding conditions and their impact on
weld mechanical properties. Samples sectioned from substandard welds were fatigue tested
with the aim of examining the interaction of FSW flaws and fatigue performance. The testing
programme revealed a number of different fatigue fracture mechanisms which were heavily
influenced by the flaws present within the weldments. The results displayed large scatter but
samples that exhibited the same fracture mechanism generally recorded similar fatigue lives.
The following specific conclusions were drawn from the investigation:
1. Flaws developed as a result of steel FSW using sub-optimal conditions were
characterised as incomplete fusion paths, weld root flaws, lower embedded flaws (Type
1 and Type 2), upper embedded flaws and connectivity.
2. Tensile test samples were found to fracture in the parent material despite the inherent
flaws. Thus overmatching, which is often used as an indicator of weld quality, can be a
misleading characteristic of steel FSW.
3. It was found that many of the transverse fatigue tests and all of the longitudinal tests
correspond to the expected operational endurance related to quality category Q1 of
BS:7910, which confirms that FSW of steel produced under sub-optimal conditions may
have use in specific industrial applications.
4. Three transverse fracture paths were identified and were seen to affect fatigue
performance. Characteristic flaws influenced the mode of fracture and recorded fatigue
lives. From highest to lowest severity, observed flaws were graded as Type 1 lower
embedded, upper embedded, Type 2 lower embedded and incomplete fusion paths.
The interaction of multiple flaws was seen to create complex fracture mechanisms.
5. Fracture initiated at embedded flaws in twenty one out of twenty four transverse fatigue
tests. The presence of Type 1 lower embedded flaws produced a dramatic decrease in
endurance. Fracture from incomplete fusion paths was less common and corresponded
to the highest fatigue results recorded. Weld root flaws did not interact with transverse
fracture mechanisms in any of the twenty four tests.
6. Embedded flaws were found to have minor impact on longitudinal fatigue performance.
Fracture of all longitudinal fatigue samples initiated at incomplete fusion paths at the
weld top surface, the TMAZ of the weld exhibited brittle fracture and the surrounding
parent material fractured in a ductile manner.
7. Tensile residual stresses of similar magnitude to that of the parent material yield stress
were found to act in the longitudinal direction. These stresses had a detrimental effect
on longitudinal fatigue results. Transverse residual stresses were found to be
substantially lower in magnitude and compressive in nature.

21
Acknowledgements The authors gratefully acknowledge the financial support of the European Union which has
funded this work as part of the Collaborative Research Project HILDA (High Integrity Low
Distortion Assembly) through the Seventh Framework Programme (SPC2-GA-2012-314534-
HILDA).
References
[1] Threadgill PL, Leonard AJ, Shercliff HR, Withers PJ. Friction stir welding of aluminium alloys. Int Mater Rev 2009;54:49–93.
[2] Nandan R, DebRoy T, Bhadeshia HKDH. Recent advances in friction-stir welding - Process, weldment structure and properties. Prog Mater Sci 2008;53:980–1023.
[3] Thomas WM, Threadgill PL, Nicholas ED. Feasibility of friction stir welding steel. Sci Technol Weld Join 1999;4:365–72.
[4] Toumpis A, Galloway A, Cater S, Molter L. A techno-economic evaluation of friction stir welding of DH36 steel. 10th Int Frict Stir Weld Symp, Beijing, China: 2014.
[5] McPherson N, Galloway A, Cater S, Hambling S. Friction stir welding of thin DH36 steel plate. Sci Technol Weld Join 2013;18:441–50.
[6] Threadgill PL. Terminology in friction stir welding. Sci Technol Weld Join 2007;12:357–60.
[7] Gibson BT, Lammlein DH, Prater TJ, Longhurst WR, Cox CD, Ballun MC, et al. Friction stir welding: Process, automation, and control. J Manuf Process 2014;16:56–73.
[8] Leonard AJ, Lockyer SA. Flaws in Friction Stir Welds. 4th Int Symp Frict Stir Weld, Park City, UT: 2003.
[9] Toumpis A, Galloway A, Cater S, McPherson N. Development of a process envelope for friction stir welding of DH36 steel - A step change. Mater Des 2014;62:64–75.
[10] Han J, Li H, Zhu Z, Barbaro F, Jiang L, Xu H, et al. Microstructure and mechanical properties of friction stir welded 18Cr – 2Mo ferritic stainless steel thick plate. Mater Des 2014;63:238–46.
[11] Tingey C, Galloway A, Toumpis A, Cater S. Effect of tool centreline deviation on the mechanical properties of friction stir welded DH36 steel. Mater Des 2015;65:896–906.
[12] Lakshminarayanan A, Balasubramanian V, Salahuddin M. Microstructure, Tensile and Impact Toughness Properties of Friction Stir Welded Mild Steel. J Iron Steel Res Int 2010;17:68–74.
[13] Reynolds AP, Tang W, Posada M, Deloach J. Friction stir welding of DH36 steel. Sci Technol Weld Join 2003;8:455–60.
[14] Toumpis AI, Galloway AM, Arbaoui L, Poletz N. Thermomechanical deformation behaviour of DH36 steel during friction stir welding by experimental validation and modelling. Sci Technol Weld Join 2014;19:653–63.
22
[15] Sun YF, Konishi Y, Kamai M, Fujii H. Microstructure and mechanical properties of S45C steel prepared by laser-assisted friction stir welding. Mater Des 2013;47:842–9.
[16] Sun YF, Shen JM, Morisada Y, Fujii H. Spot friction stir welding of low carbon steel plates preheated by high frequency induction. Mater Des 2014;54:450–7.
[17] Barnes SJ, Steuwer A, Mahawish S, Johnson R, Withers PJ. Residual strains and microstructure development in single and sequential double sided friction stir welds in RQT-701 steel. Mater Sci Eng A 2008;492:35–44.
[18] Steuwer A, Barnes SJ, Altenkirch J, Johnson R, Withers PJ. Friction Stir Welding of HSLA-65 Steel: Part II. The Influence of Weld Speed and Tool Material on the Residual Stress Distribution and Tool Wear. Metall Mater Trans A 2012;43:2356–65.
[19] Reynolds A, Tang W, Gnaupel-Herold T, Prask H. Structure, properties, and residual stress of 304L stainless steel friction stir welds. Scr Mater 2003;48:1289–94.
[20] Nguyen NT, Wahab MA. The effect of undercut and residual stresses on fatigue behaviour of misaligned butt joints. Eng Fract Mech 1996;55:453–69.
[21] Lienert T, Tang W, Hogeboom J, Kvidahl L. Friction stir welding of DH-36 steel. 4th Int Symp Frict Stir Weld, Park City, UT: 2003.
[22] Hobbacher A, editor. Recommendations for Fatigue Design of Welded Joints and Components. International Institute of Welding; 2008.
[23] Hobbacher A. The new IIW recommendations for fatigue assessment of welded joints and components - A comprehensive code recently updated. Int J Fatigue 2009;31:50–8.
[24] British Standards Institution. Guide to methods for assessing the acceptability of flaws in metallic structures. BS 7910. London: 2013.
[25] British Standards Institution. Metallic Materials - Tensile Testing - Part 1: Method of test at ambient temperature. BS EN ISO 6892-1. London: 2009.
[26] British Standards Institution. Metallic materials – Constant amplitude strain controlled axial fatigue – Method of test. BS 7270. London: 2006.


![Friction Stir Welding of Shipbuilding Steel with Primer · McPerson et al. [8] compared fatigue behaviour of submerged arc and friction stir weld in DH36 concluding on am improved](https://img.pdfslide.us/doc/110x75/5eb597e5216c0a5a983bbe28/friction-stir-welding-of-shipbuilding-steel-with-mcperson-et-al-8-compared-fatigue.jpg)


![Non-destructive Evaluation of Friction Stir Welded Joints ... · strength of the FSW joint for AC4C Al alloy and Steel dissimilar friction stir lap joints [7]. Aluminum alloy welds](https://img.pdfslide.us/doc/110x75/5e5c511832f9297d8a597cf4/non-destructive-evaluation-of-friction-stir-welded-joints-strength-of-the-fsw.jpg)