Embed Size (px)
Citation preview
Optimisation of the Corrosion Resistance of Pipe Butt Welds in Super Duplex Stainless Steels (SDSS) Paper 7805
G. Byrne, Z. Schulz (both Rolled Alloys), G. Warburton (NeoNickel), R. Francis (RF Materials)
ABSTRACT
Corrosion testing to ASTM G48 Method A, along with charpy impact testing and metallographic examination is used as a method of detection of sigma phase in mill products and fabrications alike. Because of the need to meet G48 Method A ferric chloride corrosion test requirements for SDSS joints in many fabrication specifications and the difficulty fabricators have experienced in meeting these requirements, butt welds in thin walled super duplex stainless steel pipe work systems in seawater and fire water service have been described as “the most challenging joint facing the oil and gas fabrication industry”. This paper describes and discusses the reasons behind this statement and the fabricator experience in developing WPS/PQR’s to pass G48 Method A requirements using conventional techniques and methods. The paper considers what is and is not achievable for ferric chloride testing of welds under these circumstances and compares this with the results of potentiostatic electrochemical CPT tests in simulated chlorinated seawater. Results are presented showing the effect of different shielding and backing gas welding combinations on performance of welds in ferric chloride solution and electrochemical CPT testing. This data also covers the sensitivity of corrosion resistance to variations in weld heat input and inter-pass temperature within and beyond practical ranges. These results are correlated with the changes in weld metal microstructure. The paper identifies the welding parameters required to significantly enhance and consistently maintain the corrosion resistance of welds in both ferric chloride solution and in the electrochemical CPT test.
INTRODUCTION
Leonard et al1 have published data detailing the corrosion resistance of super duplex and super austenitic stainless steel welded joints in the "as - welded" condition in ferric chloride solution and a number of oil and gas, refinery and chemical process industry environments. Their data shows excellent results for UNS S32760, UNS S32750 and UNS S31254 in the process environments over a range of welding conditions. However, in ferric chloride solution (Figure 1) the UNS S31254 joints consistently gave higher critical pitting temperatures than both super duplex alloys. The UNS S31254 joints were welded using an over matching 16% molybdenum welding consumable, whereas the super duplex stainless steels were welded using consumables over matching in nickel to attain the phase balance requirements needed in the weld deposit. Work published by Sintef2 has shown that crevice corrosion resistance of the parent material limits the super austenitic stainless steels range of application. Whereas Rolled Alloys3 has shown that it is the pitting corrosion resistance of welded joints that limits the super duplex stainless steel range of application. Essentially the crevice corrosion resistance of the super austenitic parent steel is the same as the pitting resistance of the super duplex welds. The challenge for super duplex alloys therefore is find a method of increasing the critical pitting temperature of welded joints from 40°C to 50°C to gain parity with super austenitic joints welded with nickel alloy consumables. However, fabricators have been asked to meet ferric chloride test requirements since the onset of the commercial use of duplex and super duplex grades; this has not been without difficulty. Attempts to minimize heat tint by the use of strong argon purging of the pipes has been found to cause nitrogen loss by diffusion from the root run into the backing gas. This lowers the PREN of the root and so the corrosion resistance of the joint, causing root run pitting and failure in the G48 test3,4,5. Similarly, secondary austenite formed during multi pass welding has also been blamed for failure to meet ferric chloride test requirements6. This has been attributed in the past to the lean chemistry of secondary austenite7. In this case poor inter-pass temperature control is believed to promote secondary austenite formation. More recently the relationship between secondary austenite and nitride formation in welds has been better defined and nitrides have been identified as the cause of loss of corrosion resistance of joints8,9. Apart from metallurgical condition of the welds sample preparation and allowing time for samples to air passivate before testing have been problematical in testing of this type10. The qualification of small diameter, thin walled pipe joints has been the most troublesome as heat flow in these joints is 2D and heat transfer from the joint is slow. This increases the tendency for the joint to form sigma phase which is so detrimental to corrosion resistance and toughness. In such cases sigma can form in both the weld metal and a short distance away from the fusion line, in the low temperature HAZ of the parent material. However, the corrosion test requirement reinforces the importance of heat input; inter-pass temperature, welding sequence and welding technique control in weld procedure and welder qualification and in production. Fabricators subsequently tend to be more attentive and focused on these matters than had previously been the
case, had they not struggled with the qualification process. Even so, over the years we have seen specified test temperatures fall from 40° C to 35°C for super duplex grades, the use of argon/nitrogen shielding gas mixes to alloy the deposit through the torch so as to minimize root run nitrogen loss by diffusion to the backing gas and increase PREN of the deposit, acid pickling of welded samples before corrosion testing, thus passivating the sample to some extent and in the case of 22% Cr duplex grades the omission of the corrosion test requirement from the fabrication specification altogether. This paper details the results of corrosion tests on pipe butt welds made in 2" NB sch 40s ZERON® 100 super duplex stainless steel pipes using a manual GTAW process with a range of shielding and backing gas combinations. The benefits of using argon +2.5% nitrogen as a shielding gas have been reported previously4,5 but in practice some inconsistency is experienced. Equally, the benefits of using formier gas (cracked ammonia) as a backing gas in welding have also been reported11. However, there is some concern about the potential for hydrogen embrittlement and cracking when using this gas for welding duplex and super duplex stainless steels. There appears to be no previous work that considers the use of these two gasses in tandem. This work details the effect of using gases in tandem; it details how sensitive corrosion resistance is to variation in heat input and inter-pass temperature within and out with industrially applied ranges and how this affects performance. The paper quantifies the beneficial effect on corrosion resistance as a consequence of the influence of these gases on the chemistry and resultant microstructure of the welds.
EXPERIMENTAL Materials and Welding Circumferential welds were produced in ZERON100 (UNS S32760) 2”NB sch 40s pipe using 2.4 mm diameter ZERON 100X (ER 2594) grade GTAW consumables by manual welding. The oxygen content in the backing gas prior to the start of welding was between 0.02 and 0.03%.
The welding gas combinations used were as follows:
Shielding gas Backing gas Argon Argon Argon + 2.5% N2 Argon Argon Formier gas (90%N2/10%H2) Argon + 2.5% N2 Formier gas (90%N2/10%H2) The welding parameters are summarised in Table 1. The following sets of welds were produced a) Using the best practice for ZERON10010,12 (i.e. typical heat input (<1KJ/mm), low inter-pass
temperature (<100°C), a small amount of oxygen in the backing gas, use of the “cold pass” technique, quadrant type “balanced” welding and minimal weaving commensurate only with adequate side wall fusion). Welded in the 5G/PF, Fixed-Horizontal position in 4 quadrants.
b) Using a high heat input for this size of pipe butt (approx. 1.5kJ/mm), Welded in the 5G/PF Fixed- Horizontal position in 4 quadrants.
c) As above with a very high heat input (approximately 2 kJ/mm). it should be noted that such levels of heat input would be considered inappropriately high for this size of joint.
d) To assess the effect of inter-pass temperature, welds were made with a heat input of about 1 kJ/mm, using argon/argon and argon+2.5%N2/formier gas combinations with very high inter-pass temperatures in the range 200 to 250°C and 250 to 300°C. In this case welds were made in the 5G/PF position in two segments with 200 to 250 °C inter-pass temperature and in the 1G/ PC position via a single pipe rotation for the higher inter-pass temperature welds. This was to suit the welded as segmented runs at this inter-pass temperature were very uncomfortable to execute. Again these levels of inter-pass temperature would generally be considered excessive by welding engineers.
e) To assess any effect of increases in the hydrogen content of the weld deposits on toughness of the weld metal, due to the use of formier gas, two joints were made in 6” NB schedule 80S pipe at 1kJ/mm heat input, one with argon/argon shielding/backing combination and the other with argon+2.5%N2 shielding gas and formier backing gas combinations. These were used to make Charpy impact test samples to measure toughness of the weld metal.
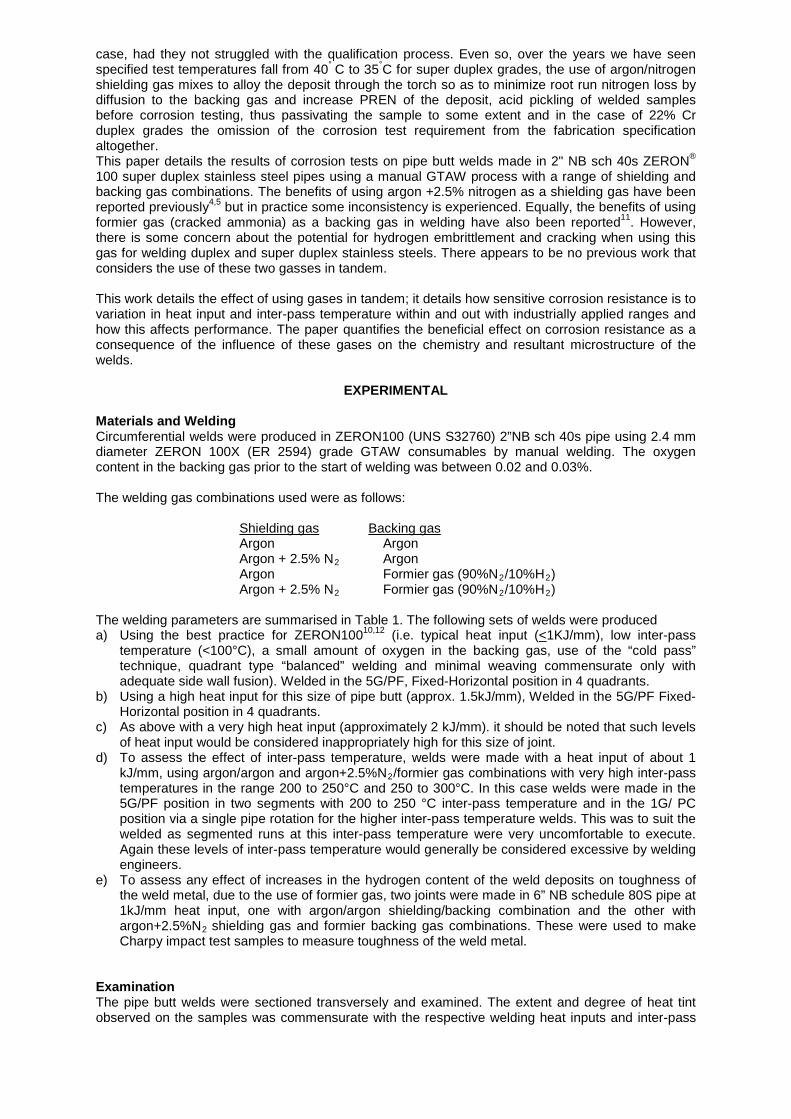
Examination The pipe butt welds were sectioned transversely and examined. The extent and degree of heat tint observed on the samples was commensurate with the respective welding heat inputs and inter-pass
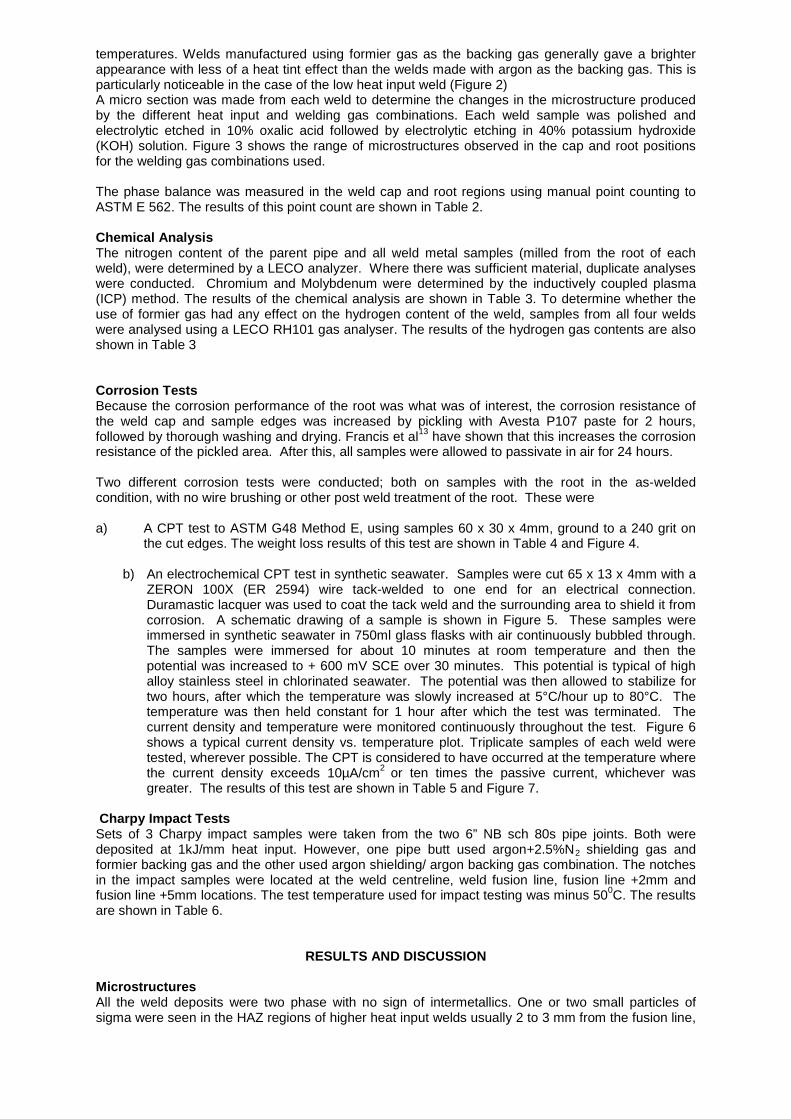
temperatures. Welds manufactured using formier gas as the backing gas generally gave a brighter appearance with less of a heat tint effect than the welds made with argon as the backing gas. This is particularly noticeable in the case of the low heat input weld (Figure 2) A micro section was made from each weld to determine the changes in the microstructure produced by the different heat input and welding gas combinations. Each weld sample was polished and electrolytic etched in 10% oxalic acid followed by electrolytic etching in 40% potassium hydroxide (KOH) solution. Figure 3 shows the range of microstructures observed in the cap and root positions for the welding gas combinations used. The phase balance was measured in the weld cap and root regions using manual point counting to ASTM E 562. The results of this point count are shown in Table 2. Chemical Analysis The nitrogen content of the parent pipe and all weld metal samples (milled from the root of each weld), were determined by a LECO analyzer. Where there was sufficient material, duplicate analyses were conducted. Chromium and Molybdenum were determined by the inductively coupled plasma (ICP) method. The results of the chemical analysis are shown in Table 3. To determine whether the use of formier gas had any effect on the hydrogen content of the weld, samples from all four welds were analysed using a LECO RH101 gas analyser. The results of the hydrogen gas contents are also shown in Table 3 Corrosion Tests Because the corrosion performance of the root was what was of interest, the corrosion resistance of the weld cap and sample edges was increased by pickling with Avesta P107 paste for 2 hours, followed by thorough washing and drying. Francis et al13 have shown that this increases the corrosion resistance of the pickled area. After this, all samples were allowed to passivate in air for 24 hours. Two different corrosion tests were conducted; both on samples with the root in the as-welded condition, with no wire brushing or other post weld treatment of the root. These were a) A CPT test to ASTM G48 Method E, using samples 60 x 30 x 4mm, ground to a 240 grit on
the cut edges. The weight loss results of this test are shown in Table 4 and Figure 4.
b) An electrochemical CPT test in synthetic seawater. Samples were cut 65 x 13 x 4mm with a ZERON 100X (ER 2594) wire tack-welded to one end for an electrical connection. Duramastic lacquer was used to coat the tack weld and the surrounding area to shield it from corrosion. A schematic drawing of a sample is shown in Figure 5. These samples were immersed in synthetic seawater in 750ml glass flasks with air continuously bubbled through. The samples were immersed for about 10 minutes at room temperature and then the potential was increased to + 600 mV SCE over 30 minutes. This potential is typical of high alloy stainless steel in chlorinated seawater. The potential was then allowed to stabilize for two hours, after which the temperature was slowly increased at 5°C/hour up to 80°C. The temperature was then held constant for 1 hour after which the test was terminated. The current density and temperature were monitored continuously throughout the test. Figure 6 shows a typical current density vs. temperature plot. Triplicate samples of each weld were tested, wherever possible. The CPT is considered to have occurred at the temperature where the current density exceeds 10µA/cm2 or ten times the passive current, whichever was greater. The results of this test are shown in Table 5 and Figure 7.
Charpy Impact Tests Sets of 3 Charpy impact samples were taken from the two 6” NB sch 80s pipe joints. Both were deposited at 1kJ/mm heat input. However, one pipe butt used argon+2.5%N2 shielding gas and formier backing gas and the other used argon shielding/ argon backing gas combination. The notches in the impact samples were located at the weld centreline, weld fusion line, fusion line +2mm and fusion line +5mm locations. The test temperature used for impact testing was minus 500C. The results are shown in Table 6.
RESULTS AND DISCUSSION Microstructures All the weld deposits were two phase with no sign of intermetallics. One or two small particles of sigma were seen in the HAZ regions of higher heat input welds usually 2 to 3 mm from the fusion line,
but nowhere in any significant quantities. There were some differences in the appearance of the weld roots and caps and between welds made with different gas combinations as shown in Figure 3. Welds that used pure argon in the shielding and backing gas showed a weld cap with a high (75%) ferrite content (Figure 3a and Table 2) with the corresponding root (Figure 3b) containing 45.4%. A lower ferrite content due to the reheating effect of multiple passes generating reformed austenite. This is typical for duplex stainless steel welds made in this way. When argon+2.5% nitrogen shielding/argon backing gases were used, the ferrite content of the cap fell to 51.8% and there was an austenitic layer on the surface of the cap (Figure 3c). This is shown in more detail in Figure 8. This occurred because nitrogen is a strong austenite former. Table 3 shows the increasing nitrogen content of the deposits made with 2.5% nitrogen additions to the shielding gas (from 0.196% to 0.223%) and with formier backing gas (0.258%). However, the root run ferrite content of the argon+2.5% nitrogen shielding/argon backing gas deposit remained unchanged at 45.4%. With the Ar/formier, shielding/backing gas combination the ferrite content of the cap and root both increased to 64.3% and 51.4% respectively. The nitrogen contents measured were almost the same (as that of the consumable 0.23% compared with 0.233% and 0.258% respectively). It appears that the use of Ar +2.5% N2 shielding gas and formier backing gas in isolation does not significantly affect the phase balance of the root run as measurements are within the +/-5% error range. With nitrogen in both the shielding and backing gases the ferrite content of the root and cap were 39.9 and 36.7% respectively, much lower than in the other cases (Figure 3c and d and Table 2). Again this is because of this strong austenitising tendency of nitrogen (measured at 0.295% in this case) and the tendency to precipitate reformed austenite in the deposits during multi pass welding. The roots for both welds made with pure argon backing gas showed a phase balance typical for ZERON 100 (UNS S32760) welds (Table 2), as did the weld made with the argon/formier, shielding/ backing gas combination. However, the weld made with argon + 2.5% nitrogen shielding gas and formier backing gas had a much more austenitic structure, with a thin layer of austenite on the surface of the weld roots (Figure 3d). Table 3 shows that this weld had the highest nitrogen content of all the deposits (0.295%). The austenite contents of the bulk microstructures observed follow the nitrogen contents of the deposits (Tables 2 and 3). The austenitic “skins” observed on the weld caps and roots indicate that the nitrogen accumulates and concentrates in these locations. From a multi pass welding point of view, the concern with increasing the austenite levels of weld deposits is that this makes the ferrite that remains more concentrated in chromium and molybdenum and hence more prone to sigma formation For the welds made with higher heat inputs the appearance of the microstructures were similar to the
low heat input joints. There was again some sigma particles observed at higher magnifications but these were isolated and discrete. The welds also contained rather more reformed austenite than the lower heat input welds. The presence of reformed austenite was very noticeable in the high inter-pass temperature joints.
Corrosion Tests
a) Weight loss and CPT measurements in ferric chloride tests
The weight loss results of the ASTM G48 Method E tests in ferric chloride are shown in Table 4. All of the attack was on the root except for the Ar/formier weld that pitted in the cap. The weight loss varied somewhat when attack occurred. The results in Table 4 show that there was a 5°C increase in the CPT in ferric chloride solution with both argon +2.5% nitrogen shielding gas/ argon backing gas and argon shielding/ formier backing gas compared to the argon/argon deposit (ie. from 35°C to 40°C). Both these welds gave a CPT of 40°C in ferric chloride. This would be expected in view of the close PREN (%Cr + 3.3(%Mo) + 16%N2) measurements of 41.1 and 41.2 for these deposits. There was a further increase in CPT to 50°C, when argon +2.5% nitrogen shielding/ formier backing gas was used, again corresponding to an increase nitrogen content and hence PREN of the deposit. The CPT of 35°C for the weld with pure argon on both sides meets current test acceptance levels. This sample has weld metal nitrogen content of 0.196%, when at least 0.2% would be expected. This is probably related to the quantity of nitrogen lost from the root during welding4,5,10. Losses of as much as 20% have been reported12. In this case the nitrogen content of the weld wire was 0.23%, so some nitrogen loss through diffusion to the shielding gas has occurred. However, the enhancement in CPT in ferric chloride solution from 35°C to 50°C by use of gas mixes is very encouraging. The increase in CPT follows the increase in nitrogen content and PREN of the weld deposits as shown in Table 3. The results in Table 4 and Figure 4 show CPT for argon/argon welds that are in agreement with previous work 4,13.
b) CPT measurements in simulated seawater polarised to +600mV SCE The electrochemical corrosion test in seawater appears to be more sensitive than the ASTM G48 Method E test. There appears to be better differentiation between the welds and from sample to sample from the same weld (Figure 7). Using argon +2.5% nitrogen shielding gas with argon backing gas combination gave some overall improvements in the CPT compared to the argon/argon welds (Table 5), increasing the mean CPT of 49.3°C to 63.9°C. But the scatter of results increases from a max/min of 47.8°C to 52°C (a 4.2°C range) to 50.3°C to 75.9°C (a 25.6°C range). So, the results overlap somewhat, there is no differential at the lower range of test results between the two cases. This is consistent with fabricator experience as they can some times find no benefit from using argon + nitrogen shielding gas mixes14. In contrast, the results with argon shielding and formier backing gas showed a consistent improvement in mean CPT of at least 13°C with only a 1.8°C spread in the results. The CPT in ferric chloride did not differentiate between the argon +2% nitrogen shielding gas / argon backing gas and argon shielding/ formier backing gas combinations, but the weight loss measurements did. Form the weight loss results you could conclude that the argon +2.5% nitrogen shielding gas/ argon backing gas welds performed better than the argon/ formier deposits in view of the lower weight loss results (71mg vs 249 mg at 45°C, Table 4), but as the argon /formier deposit pitted first in the cap comparisons are not particularly valid. As per the G48 tests, the CPT results from the electrochemical test ranks these two welds with similar mean CPT’s of 63.9°C and 66.3°C. However the argon/formier deposit showed a 15°C higher minimum CPT than the argon, 2.5% nitrogen/argon deposit. This is an interesting result as Table 3 shows only a 0.1% difference in PREN and a 0.025% difference in nitrogen content. This result may be associated with the active nature of the formier backing gas during welding as hydrogen in the formier gas reacts with any oxide formed during welding to form H2O, leaving the root runs shiny. The root runs of these welds show less heat tint compared to the welds with pure argon backing gas and this effect may be being measured in the discerning electrochemical test where chromium rich heat tint scale may act as a fine crevice former, covering chromium denuded areas of the weld root and playing a part in the initiation of corrosion and the scatter in measured CPT. In contrast, in the aggressive ferric chloride test the heat tint scale and denuded metal would just pickle off in the test. With nitrogen in both the shielding and backing gas, there was again a variation in the CPT’s measured with the mean CPT increasing to 73.8°C and a spread in results of 16.1°C (from a minimum of 66.7°C to a maximum of 82.8°C). The CPT’s measured showed an increase of between 18.9°C and 30.8°C compared to the argon/argon deposit results. The highest scatter in results is always found when using argon +2.5% nitrogen shielding gas. Why the use of argon +2.5% nitrogen shielding gas should produce such variability is not known, but Gunn14 reported the same effect in his review of duplex stainless steels. The present data show that argon +2.5% nitrogen shielding gas / formier backing gas combination gives the most consistent increases in corrosion resistance when tested in both ferric chloride and electrochemical test solutions. The increase in nitrogen content of the weld root clearly increased the PREN and corrosion resistance. Figures 9 and 10 show the relationships between the CPT and the PREN and the root nitrogen content. Both show a step relationship with corrosion resistance that is commonly reported15. The hydrogen in the formier backing gas appears inhibit the weld root run region from forming an oxide film during welding. This may make diffusion of nitrogen from the backing gas into the molten weld metal easier during welding. The nitrogen analysis of the deposits (Table 3) show that welding with argon +2.5% nitrogen shielding gas/argon backing gas increases the nitrogen content of the weld by 18.8% compared to the argon/argon weld. The use of argon / formier gas increases the nitrogen content of the weld by 31% and the use of argon +2.5%N2 / formier gas increases the nitrogen content of the root by 50%. Figure 11 shows the results of ferric chloride tests on the welds made with a range of heat inputs. Welds produced using argon/argon shielding gas/backing gas combination showed little change in CPT with increasing heat input. This is rather unexpected for this pipe size and heat input range. The CPT’s would be expected to fall with higher heat inputs. The results obtained by the The Welding Institute from Figure 1 are also superimposed on Figure 11 and show good agreement with our own Ar/Ar results. However, TWI was using 10mm plates to weld in their research. These would have provided a larger heat sink effect than the 2” NB sch 40s pipe butt joints and be less susceptible to heat input changes in this range. The argon+2.5% N2 / formier gas weld corrosion resistance were seen to fall with increasing heat input, but the CPT’s were always higher than the argon/argon welds.
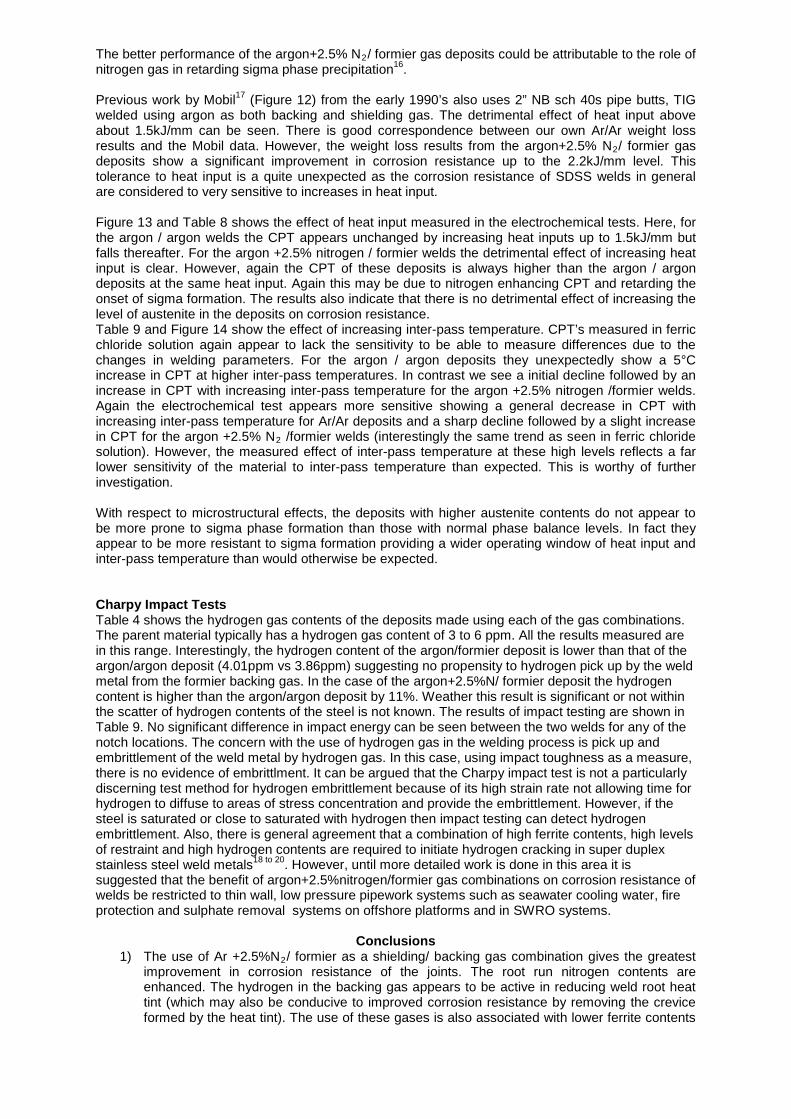
The better performance of the argon+2.5% N2/ formier gas deposits could be attributable to the role of nitrogen gas in retarding sigma phase precipitation16. Previous work by Mobil17 (Figure 12) from the early 1990’s also uses 2” NB sch 40s pipe butts, TIG welded using argon as both backing and shielding gas. The detrimental effect of heat input above about 1.5kJ/mm can be seen. There is good correspondence between our own Ar/Ar weight loss results and the Mobil data. However, the weight loss results from the argon+2.5% N2/ formier gas deposits show a significant improvement in corrosion resistance up to the 2.2kJ/mm level. This tolerance to heat input is a quite unexpected as the corrosion resistance of SDSS welds in general are considered to very sensitive to increases in heat input. Figure 13 and Table 8 shows the effect of heat input measured in the electrochemical tests. Here, for the argon / argon welds the CPT appears unchanged by increasing heat inputs up to 1.5kJ/mm but falls thereafter. For the argon +2.5% nitrogen / formier welds the detrimental effect of increasing heat input is clear. However, again the CPT of these deposits is always higher than the argon / argon deposits at the same heat input. Again this may be due to nitrogen enhancing CPT and retarding the onset of sigma formation. The results also indicate that there is no detrimental effect of increasing the level of austenite in the deposits on corrosion resistance. Table 9 and Figure 14 show the effect of increasing inter-pass temperature. CPT’s measured in ferric chloride solution again appear to lack the sensitivity to be able to measure differences due to the changes in welding parameters. For the argon / argon deposits they unexpectedly show a 5°C increase in CPT at higher inter-pass temperatures. In contrast we see a initial decline followed by an increase in CPT with increasing inter-pass temperature for the argon +2.5% nitrogen /formier welds. Again the electrochemical test appears more sensitive showing a general decrease in CPT with increasing inter-pass temperature for Ar/Ar deposits and a sharp decline followed by a slight increase in CPT for the argon +2.5% N2 /formier welds (interestingly the same trend as seen in ferric chloride solution). However, the measured effect of inter-pass temperature at these high levels reflects a far lower sensitivity of the material to inter-pass temperature than expected. This is worthy of further investigation. With respect to microstructural effects, the deposits with higher austenite contents do not appear to be more prone to sigma phase formation than those with normal phase balance levels. In fact they appear to be more resistant to sigma formation providing a wider operating window of heat input and inter-pass temperature than would otherwise be expected. Charpy Impact Tests Table 4 shows the hydrogen gas contents of the deposits made using each of the gas combinations. The parent material typically has a hydrogen gas content of 3 to 6 ppm. All the results measured are in this range. Interestingly, the hydrogen content of the argon/formier deposit is lower than that of the argon/argon deposit (4.01ppm vs 3.86ppm) suggesting no propensity to hydrogen pick up by the weld metal from the formier backing gas. In the case of the argon+2.5%N/ formier deposit the hydrogen content is higher than the argon/argon deposit by 11%. Weather this result is significant or not within the scatter of hydrogen contents of the steel is not known. The results of impact testing are shown in Table 9. No significant difference in impact energy can be seen between the two welds for any of the notch locations. The concern with the use of hydrogen gas in the welding process is pick up and embrittlement of the weld metal by hydrogen gas. In this case, using impact toughness as a measure, there is no evidence of embrittlment. It can be argued that the Charpy impact test is not a particularly discerning test method for hydrogen embrittlement because of its high strain rate not allowing time for hydrogen to diffuse to areas of stress concentration and provide the embrittlement. However, if the steel is saturated or close to saturated with hydrogen then impact testing can detect hydrogen embrittlement. Also, there is general agreement that a combination of high ferrite contents, high levels of restraint and high hydrogen contents are required to initiate hydrogen cracking in super duplex stainless steel weld metals18 to 20. However, until more detailed work is done in this area it is suggested that the benefit of argon+2.5%nitrogen/formier gas combinations on corrosion resistance of welds be restricted to thin wall, low pressure pipework systems such as seawater cooling water, fire protection and sulphate removal systems on offshore platforms and in SWRO systems.
Conclusions 1) The use of Ar +2.5%N2/ formier as a shielding/ backing gas combination gives the greatest
improvement in corrosion resistance of the joints. The root run nitrogen contents are enhanced. The hydrogen in the backing gas appears to be active in reducing weld root heat tint (which may also be conducive to improved corrosion resistance by removing the crevice formed by the heat tint). The use of these gases is also associated with lower ferrite contents
and the formation of skins of austenite on the surface of the cap and root of the welds. These factors may partly or collectively be responsible for the improved resistance to corrosion.
2) The use of both Ar +2.5%N2 as a shielding gas with Ar as a backing gas and Ar as a shielding gas with formier as a backing gas both give a general improvement in corrosion resistance of welds compared to Ar/Ar deposits. However, the scatter in CPT measured electrochemically when using Ar +2.5%N2 shielding gas was high by comparison to the straight argon shielding gas deposits and unlike the Ar/formier deposits, at the lower bound gave no improvement.
3) The use of an Ar +2.5%N2/ formier gas as a shielding/ backing gas combination appears to make the weld less sensitive to adverse effects of higher heat input and inter-pass temperatures than had previously been understood to be the case.
4) Weld heat inputs up to 2 kJ/mm had no effect on the CPT in ferric chloride solution for the Ar/Ar deposits. In electrochemical testing the measured CPT of these welds fell only at the highest heat input level,
5) For Ar +2.5%N2/ formier gas deposits the CPT in ferric chloride dropped significantly as heat input was increased from 0.93 to 1.41kJ/mm and then stayed stable at higher heat inputs. Electrochemical measurements showed a gradual fall in CPT with increasing heat input. However, the CPT of the Ar +2.5% N2/ formier gas deposits was always higher than the Ar/Ar deposits in both test environments.
6) There is no difference in the charpy impact toughness test results between the Ar/Ar deposits and the Ar +2.5%N2/ formier gas deposits.
7) The use of Ar +2.5%N2/ formier gas does not appear to constrict the welding parameter window available to the welding engineer; in fact the tolerance of corrosion resistance to adverse process changes appears to be enhanced. However, the biggest gains in corrosion resistance appear to be achieved when the optimum levels of heat input and inter-pass temperature are employed.
8) Electrochemical corrosion tests appear to be more sensitive to changes in welding parameters than ferric chloride testing.
References
1) A. J. Leonard, P. Woollin, and D. C. Buxton, Stainless Steel World Conference, Holland 2001, KCI, page 375.
2) Rogne T. and Drugli J.M. Proc. Conf. “Engineering Solutions to Industrial Corrosion Problems” Sanderfjord, Norway, 7-9th June 1993
3) Francis R. and Warburton G. Proc Conf Eurocorr 2007, Friedberg, Germany, Sept 2007. 4) G. Warburton, T. Healiss and C. Mockler, Duplex Stainless Steel ’97,
Maastricht, Holland, Oct 1997. KCI, page 525. 5) Bradshaw R. and Cottis RA. Proc Conf Duplex Stainless Steels ’94, Paper 31,Glasgow, Nov
1994. 6) Lundquvist B. Norberg P. and Olsson K. Proc. Conf. Duplex Stainless Steels ’86. Paper 10
p16 to 29, The Hague, Netherlands 26th to 28th October, 1986. 7) Farger SA. Proc. Conf. Duplex Stainless Steels 91,p 403 to 411, Beaune, France, October
28th to 30th, 1991. 8) Ramirez AJ. Brandi SD. and Lippold JC. Science and Technology of Welding and Joining,
2004, Vol 9, No.4. p301 to 303. 9) Ramirez AJ. Lippold JC and Brandi SD. Metallurgical and Materials Transactions A, Vol. 34A.
August 2003, p1575 to 1597. 10) Rolled Alloys Welding Guidelines for ZERON 100. Bulletin No. 105. 2009. 11) Messer B. Oprea V and Wright A. Stainless Steel World, December 2007, p 53 to 63. 12) Mee, van der V, Neessen F. and Chaadha V. Proc. Conf. Duplex Stainless Steels, Paper
II.C.1 p619 to 632, Beaune, France. 13- 15th October 2010. 13) R. Francis, G. Warburton. Proc. Conf. NACE 2000 Paper 630, Orlando, Florida, USA, 26th to
31st March, 2000. 14) Gunn RN. “Duplex Stainless Steels, Microstructure, Properties and Applications” Woodhead
Publishing 1997 15) Chance J, Coop W, Gradwell KJ and Roscoe CV. Proc. Conf. Duplex Stainless Steels ‘82
Paper 8201- 019, p371 to 398. St. Lewis, USA, October 25th to 28th 1982. 16) Hertzman S. and Charles J. Proc. Conf. Duplex Stainless Steels, Paper II.1 p355 to 368,
Beaune, France. 13- 15th October 2010.
17) Amon C. Private Communication. Mobil Beryl Deluge Replacement Project, “ Practical Considerations on the Effects of Varying Weld Parameters on Corrosion Properties of ZERON 100 Pipe Systems” Nov. 1988.
18) Mee, van der V. Meelker H. and Nassau van L. Proc. 4th international Conf. Duplex Stainless Steels, Glasgow, Scotland 1994, Paper 119.
19) Fekken U. Nassau van L, and Vewey M. Proc. Conf. Duplex Stainless Steels ’86 The Hauge , 1986, Paper 26, p 268 -279
20) Hoffmeister H. Volben L. and Grong O. Proc. 4th International Conf. Duplex Stainless Steels, Glasgow, Scotland 1994, Paper 54
21) Fang P.J, Kirkwood D. Power LJ. and Baxter CF. Proc. 4th International Conf. Duplex Stainless Steels, Glasgow, Scotland 1994, Paper 51
Acknowledgements The authors would like to thank the owners and directors of Rolled Alloys and NeoNickel for funding this work and for their permission to publish. We would also like to thank Metrode Products Ltd. for making the welds and Mr Peter Geoff for his valuable assistance
Tables
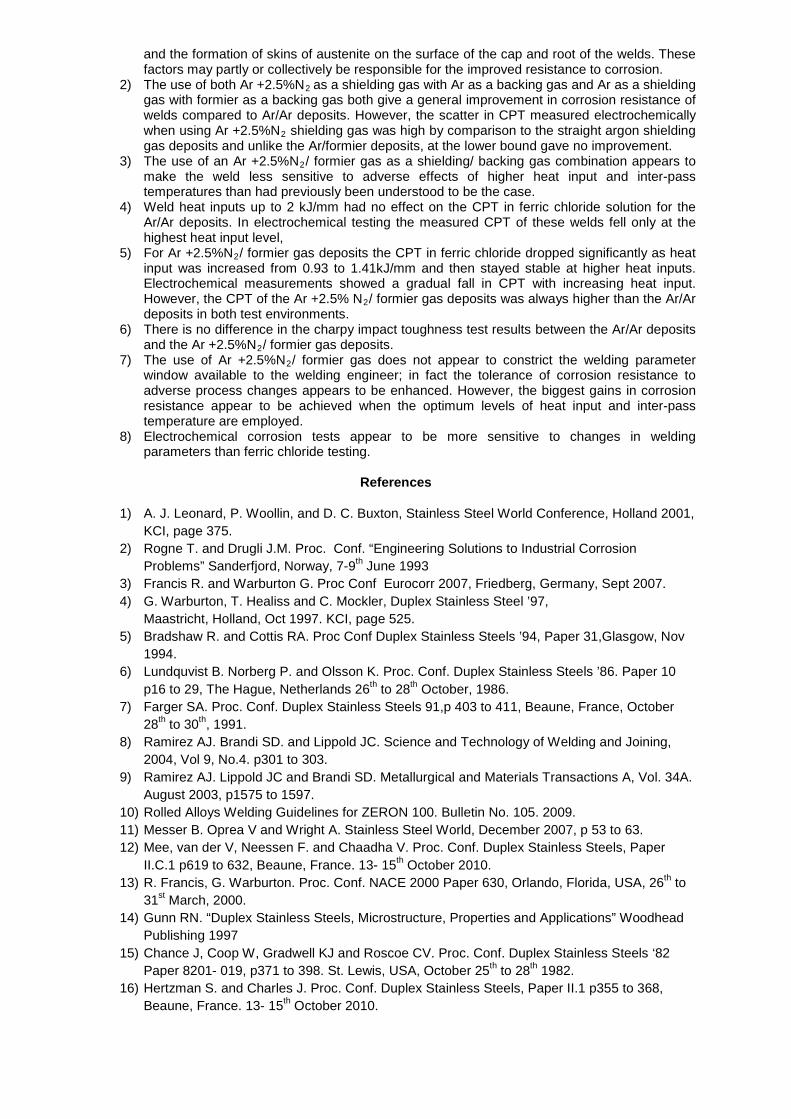
TABLE 1: Summary of welding parameters for 2” schedule 40S pipe butts welded with various shielding and backing gases
Table 2: Phase Balance Measurements
Shielding/ Backing Gas Combination
Ferritte (%)
cap root Ar/Ar 75.5 45.4 Ar+2.5% N/Ar 51.8 45.4 Ar/ formier 64.3 51.4 Ar+2.5% N/formier 39.9 36.7
Weld No Zeron 100X Wire % Gas Shield Purge IPT ; 0C Z100X-T5/- Batch No Torch Purge %O2 R & CP Root root average Cold Pass1. Welded using Standard controlled welding procedure, & via 4 segment weld runs
1 WO23495 0.23 Argon Argon 0.02 24 - 75 0.79 / 1.08 0.93 0.50 / 0.622 .. .. Argon + 2.5%N2 Argon .. 30 - 72 0.84 / 0.88 0.86 0.58 / 0.653 .. .. Argon Formier .. 25 - 75 0.90 / 1.23 1.06 0.60 / 0.834 .. .. Argon + 2.5%N2 Formier .. 27 - 73 0.76 / 1.07 0.91 0.53 / 0.83
2. Welded using HIGH and VERY HIGH root pass heat input conditions, & via 4 segment weld runs5 WO23945 0.23 Argon Argon 0.02 19 - 70 1.17 / 1.66 1.41 0.78 / 0.966 .. .. Argon Argon .. 19 - 70 1.75 / 2.48 2.11 0.76 / 1.137 .. .. Argon + 2.5%N2 Formier 0.03 19 - 62 1.62 / 2.08 1.85 0.85 / 1.008 .. .. Argon + 2.5%N2 Formier .. 19 - 62 2.14 / 2.18 2.16 0.76 / 0.91
3. Welded under VERY HIGH "Weld Zone Background" temperature conditions - Welds 9 & 10 : 5G / PF position ; welded via 2 segment weld runs
9 WO21220 0.23 Argon Argon 0.02 20 - 350 0.91 / 0.95 0.93 0.51 / 0.5110 .. .. Argon + 2.5%N2 Formier .. 20 - 350 0.96 / 1.01 0.98 0.50 / 0.54
- Welds 11 & 12 : 1G / PC position ; welded via a single pipe rotation11 .. .. Argon Argon .. 20 - 420 0.55 0.55 0.4312 .. .. Argon + 2.5%N2 Formier .. 20 - 420 0.79 0.79 0.41
Zeron 100 Pipe Butt Welds ; 2" Sch 40S (3.91mm) ; Manual GTAW ; 5G / PF Fixed-Horizontal
Heat Input : kJ/mm
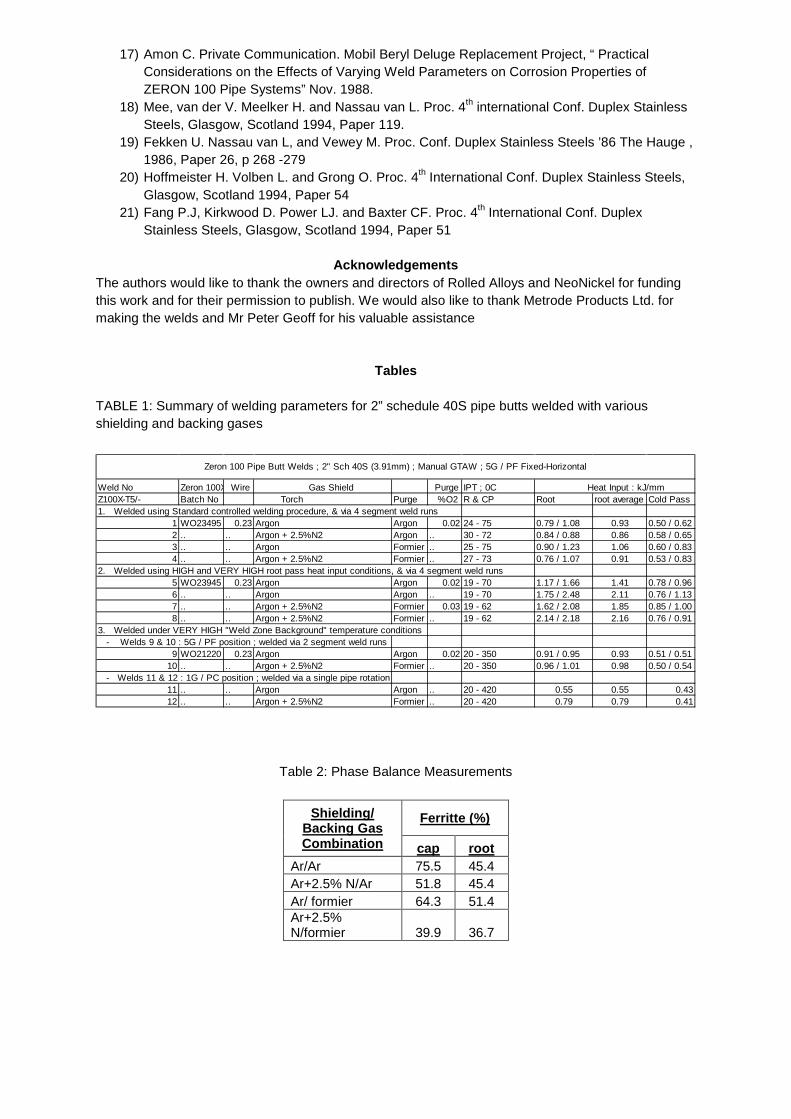
TABLE 3: Composition of parent pipe and weld metal root
Shielding/ Backing Gas Combination
Composition
Cr (%) Ni (%) Mo (%) N (%) H (ppm) PREN Pipe 25.5 6.99 3.62 0.257 41.6 ZERON 100 X consumable 0.230 0.85 Ar/Ar 24.9 8.38 3.63 0.196 4.01 40 Ar+2.5% N/Ar 25.4 8.16 3.67 0.233 3.25 41.1 Ar/ formier 25.1 8.58 3.64 0.258 3.86 41.2 Ar+2.5% N/formier 25.6 8.34 3.71 0.295 4.44 42.6
PREN = %Cr +3.3(%Mo) +16(%N2)
Table 4: The results of ASTM G48 Method E tests in ferric chloride
Weight loss measurements in ferric chloride (mg) shield/backing gas Ar/Ar Ar+2.5% N/Ar Ar/ formier Ar+2.5% N/formier
Test Temp (°C)/ heat input 0.93 kJ/mm 0.86 kJ/mm 1.06 kJ/mm 0.91 kJ/mm 30 3 2 1 0 35 5 - - - 40 8.82* 3 0 0 45 - 71 294 - 50 - 384 334* 0 55 - - - 374
CPT 35 40 40 50
Table 5: CPT results for the welds in seawater at +600mV SCE
shield/backing gas Heat Input CPT @+600mV SCE, (°C)
Difference
(kJ/mm) min mean max ∆, (°C) Ar/Ar 0.93 47.8 49.3 52 4.2
Ar +2.5%N/Ar 0.86 50.3 63.9 75.9 25.6 Ar/formier 1.06 65.3 66.3 67.1 1.8
Ar +2.5%N/ formier 0.91 66.7 73.8 82.8 16.1
Table 6 Charpy impact test results
Shielding/Backing Gases Position Impact Energy (J) @ minus 50C
min mean max
Ar/Ar
weld Centre line 192 202 215 fusion line 114 119 124 fusion line +2mm 89 102 124 fusion line +5mm 89 99 110
Ar+2.5N/formier
weld Centre line 191 197 206 fusion line 99 112 133 fusion line +2mm 96 100 104 fusion line +5mm 110 113 116
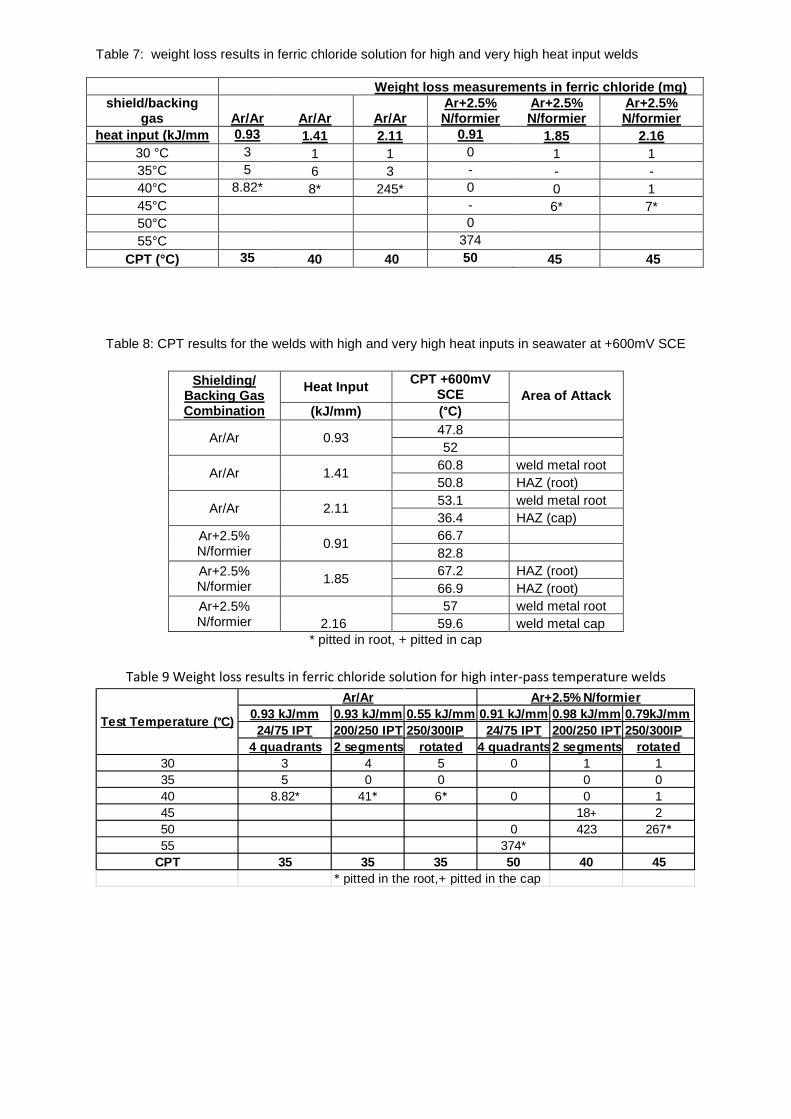
Table 7: weight loss results in ferric chloride solution for high and very high heat input welds
Weight loss measurements in ferric chloride (mg) shield/backing
gas
Ar/Ar Ar/Ar Ar/Ar Ar+2.5% N/formier
Ar+2.5% N/formier
Ar+2.5% N/formier
heat input (kJ/mm 0.93 1.41 2.11 0.91 1.85 2.16 30 °C 3 1 1 0 1 1 35°C 5 6 3 - - - 40°C 8.82* 8* 245* 0 0 1 45°C - 6* 7* 50°C 0 55°C 374
CPT (°C) 35 40 40 50 45 45
Table 8: CPT results for the welds with high and very high heat inputs in seawater at +600mV SCE
Shielding/ Backing Gas Combination
Heat Input CPT +600mV SCE Area of Attack
(kJ/mm) (°C)
Ar/Ar 0.93 47.8 52
Ar/Ar 1.41 60.8 weld metal root 50.8 HAZ (root)
Ar/Ar 2.11 53.1 weld metal root 36.4 HAZ (cap)
Ar+2.5% N/formier 0.91 66.7
82.8 Ar+2.5% N/formier 1.85 67.2 HAZ (root)
66.9 HAZ (root) Ar+2.5% N/formier 2.16
57 weld metal root 59.6 weld metal cap
* pitted in root, + pitted in cap
Table 9 Weight loss results in ferric chloride solution for high inter-pass temperature welds
0.93 kJ/mm 0.93 kJ/mm 0.55 kJ/mm 0.91 kJ/mm 0.98 kJ/mm 0.79kJ/mm24/75 IPT 200/250 IPT 250/300IP 24/75 IPT 200/250 IPT 250/300IP
4 quadrants 2 segments rotated 4 quadrants2 segments rotated30 3 4 5 0 1 135 5 0 0 0 040 8.82* 41* 6* 0 0 145 18+ 250 0 423 267*55 374*
CPT 35 35 35 50 40 45* pitted in the root,+ pitted in the cap
Ar/Ar Ar+2.5% N/formier
Test Temperature (°C)
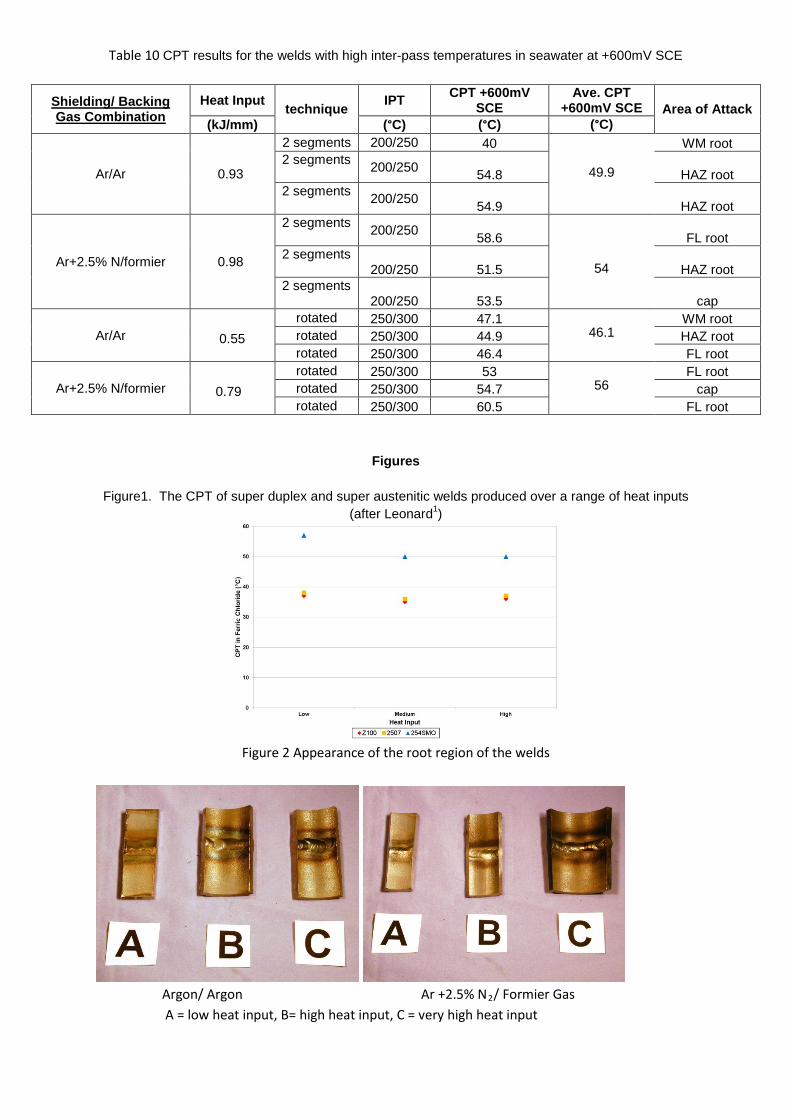
Table 10 CPT results for the welds with high inter-pass temperatures in seawater at +600mV SCE
Shielding/ Backing Gas Combination
Heat Input technique IPT CPT +600mV SCE
Ave. CPT +600mV SCE Area of Attack
(kJ/mm) (°C) (°C) (°C)
Ar/Ar
0.93
2 segments 200/250 40
49.9
WM root 2 segments 200/250 54.8 HAZ root 2 segments 200/250 54.9 HAZ root
Ar+2.5% N/formier
0.98
2 segments 200/250 58.6
54
FL root 2 segments
200/250 51.5 HAZ root 2 segments
200/250 53.5 cap
Ar/Ar 0.55
rotated 250/300 47.1 46.1
WM root rotated 250/300 44.9 HAZ root rotated 250/300 46.4 FL root
Ar+2.5% N/formier 0.79
rotated 250/300 53 56
FL root rotated 250/300 54.7 cap rotated 250/300 60.5 FL root
Figures Figure1. The CPT of super duplex and super austenitic welds produced over a range of heat inputs
(after Leonard1)
Figure 2 Appearance of the root region of the welds
Argon/ Argon Ar +2.5% N2/ Formier Gas A = low heat input, B= high heat input, C = very high heat input
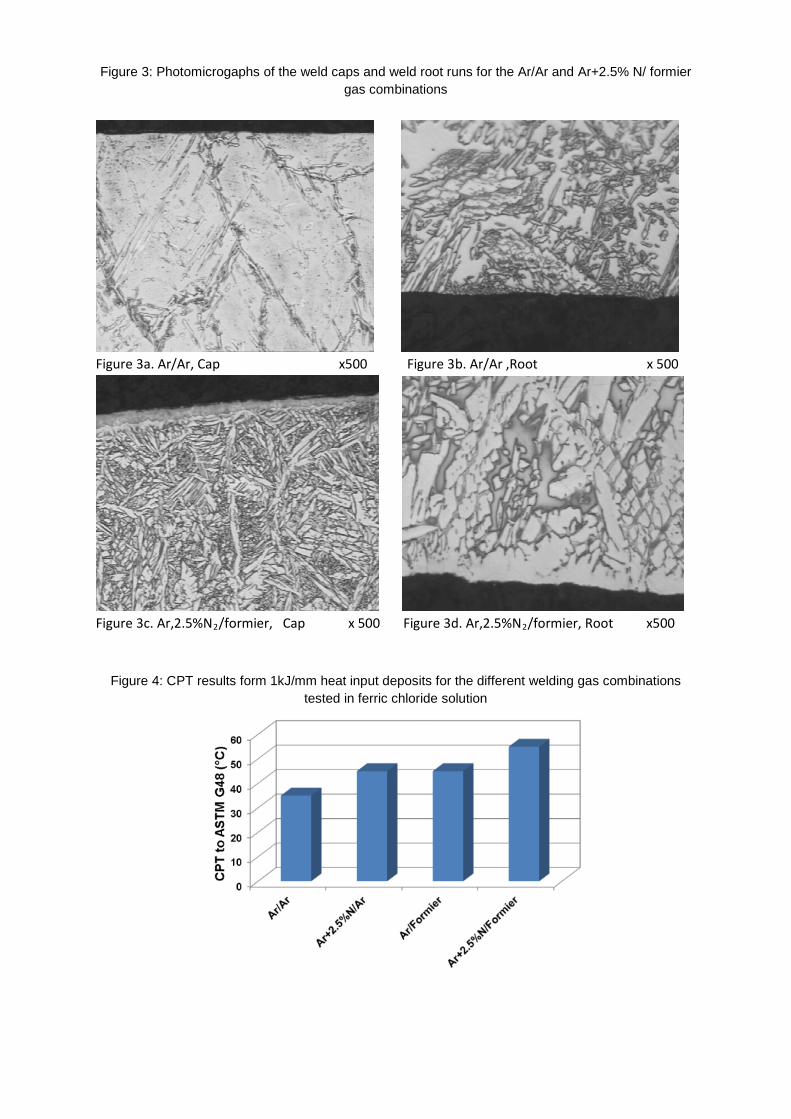
Figure 3: Photomicrogaphs of the weld caps and weld root runs for the Ar/Ar and Ar+2.5% N/ formier
gas combinations
Figure 3a. Ar/Ar, Cap x500 Figure 3b. Ar/Ar ,Root x 500
Figure 3c. Ar,2.5%N2/formier, Cap x 500 Figure 3d. Ar,2.5%N2/formier, Root x500
Figure 4: CPT results form 1kJ/mm heat input deposits for the different welding gas combinations tested in ferric chloride solution
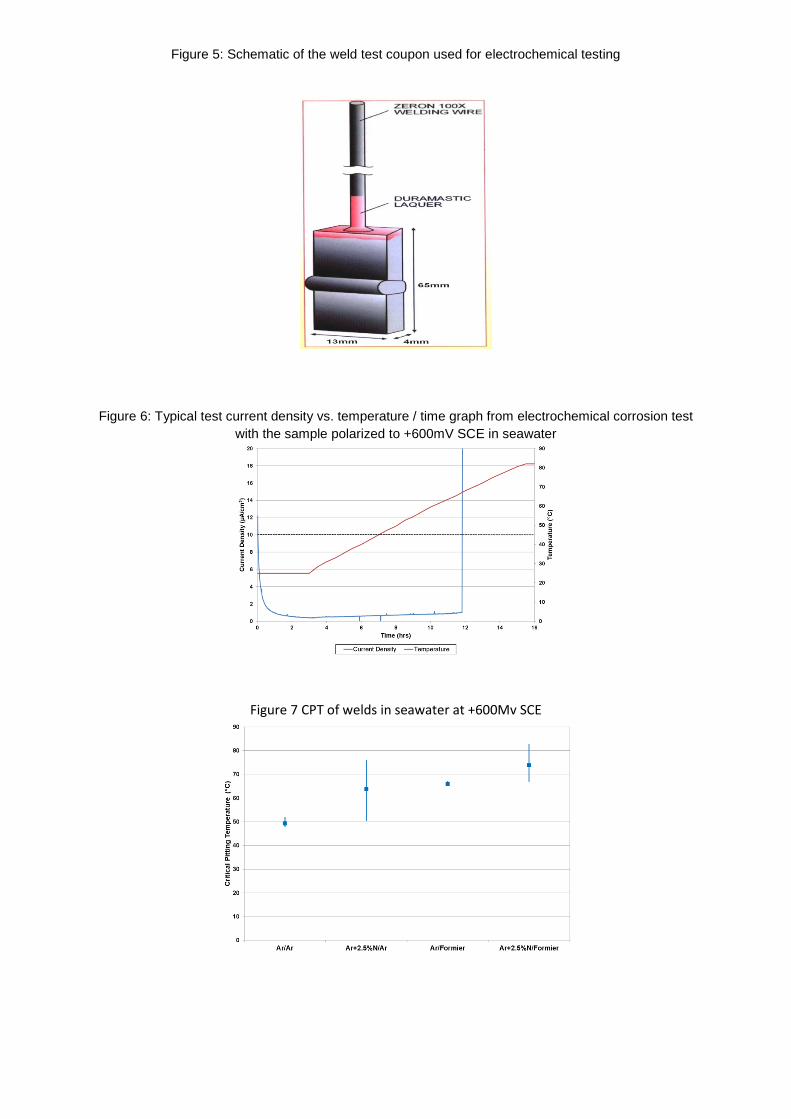
Figure 5: Schematic of the weld test coupon used for electrochemical testing
Figure 6: Typical test current density vs. temperature / time graph from electrochemical corrosion test with the sample polarized to +600mV SCE in seawater
Figure 7 CPT of welds in seawater at +600Mv SCE
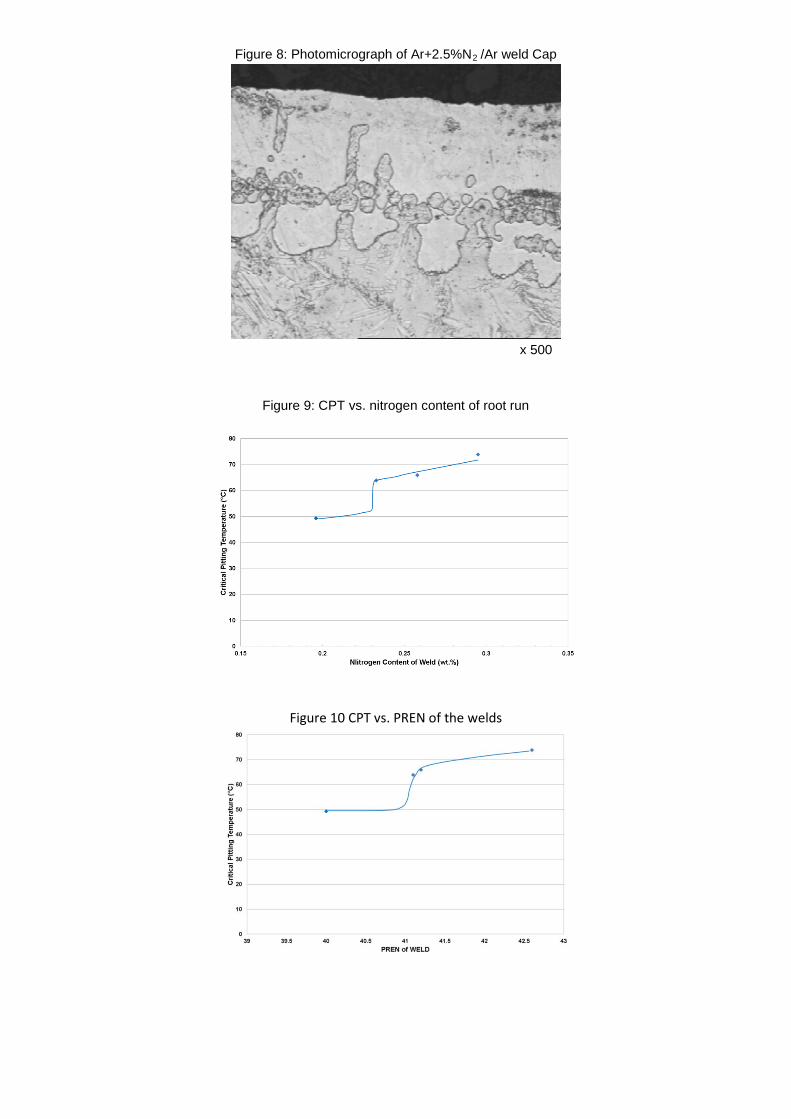
Figure 8: Photomicrograph of Ar+2.5%N2 /Ar weld Cap
x 500
Figure 9: CPT vs. nitrogen content of root run
Figure 10 CPT vs. PREN of the welds
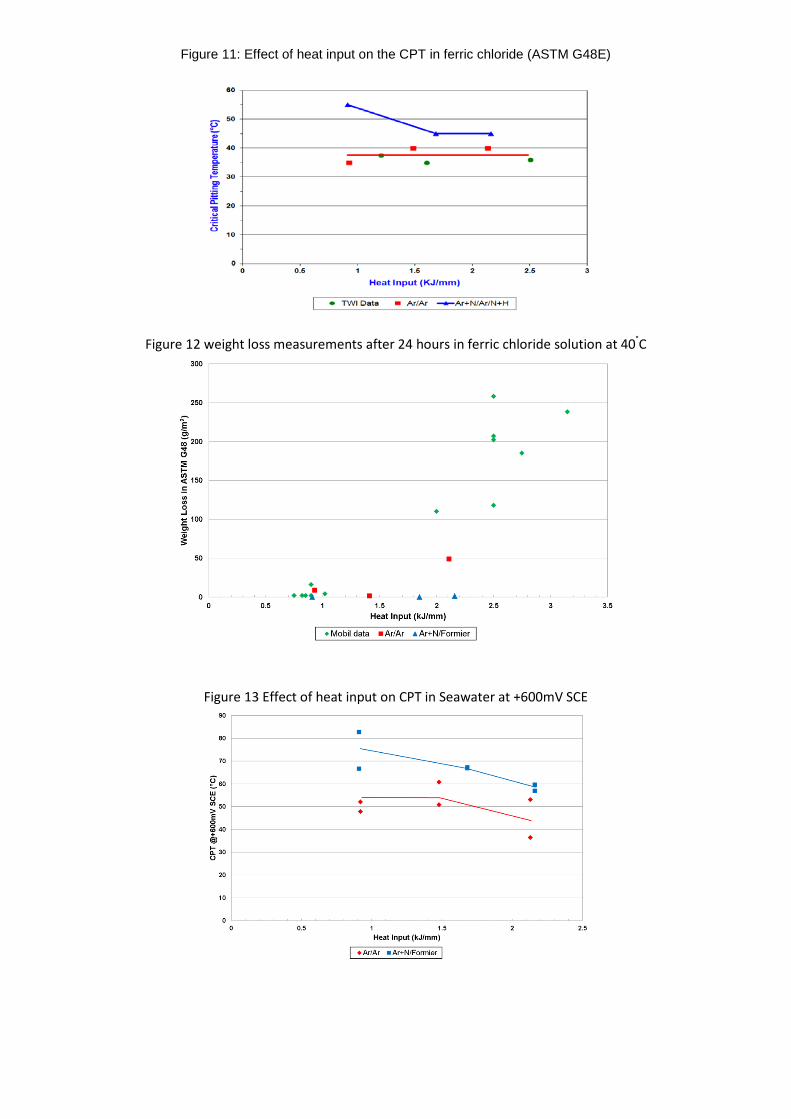
Figure 11: Effect of heat input on the CPT in ferric chloride (ASTM G48E)
Figure 12 weight loss measurements after 24 hours in ferric chloride solution at 40°C
Figure 13 Effect of heat input on CPT in Seawater at +600mV SCE
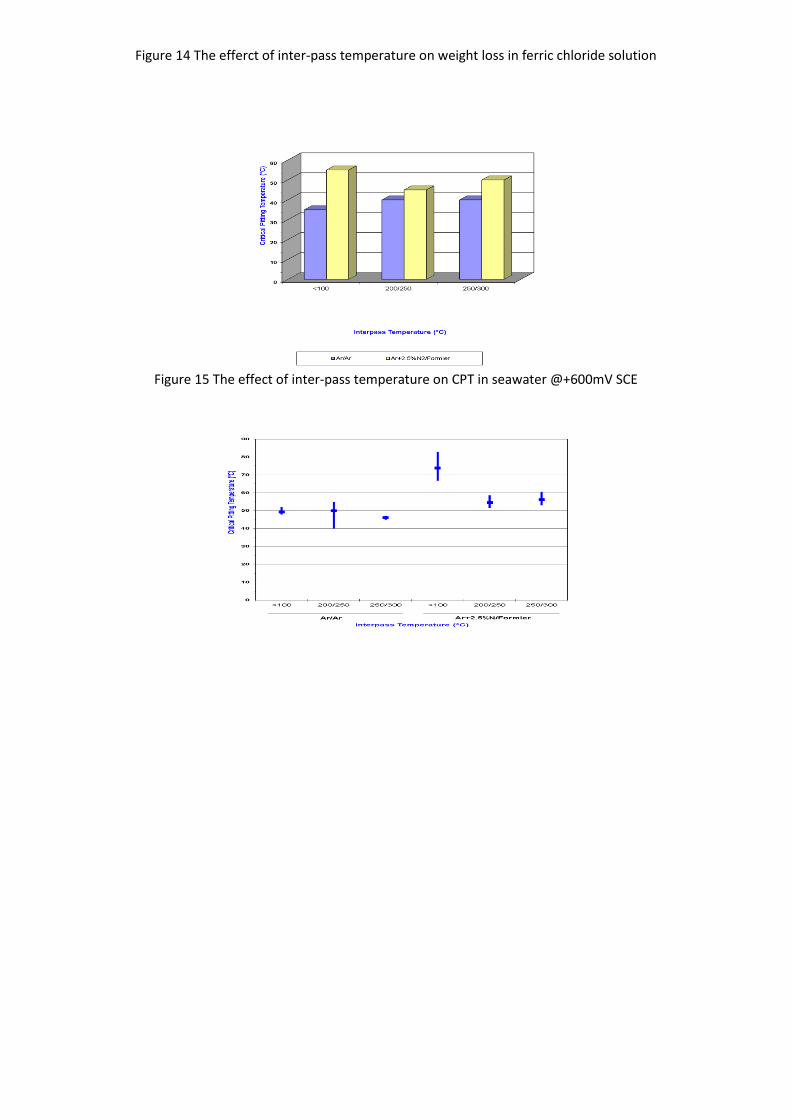
Figure 14 The efferct of inter-pass temperature on weight loss in ferric chloride solution
Figure 15 The effect of inter-pass temperature on CPT in seawater @+600mV SCE


![One platform Multiple options...GOST Butt weld DIN Butt weld ANSI Butt weld Socket weld Female 1 pipe thread F-con. ) butt weld GOST Butt weld [mm] [in.] D A SOC FTP F G D A SOC FTP](https://img.pdfslide.us/doc/110x75/5fe23d7adfe1ef18be65fa23/one-platform-multiple-options-gost-butt-weld-din-butt-weld-ansi-butt-weld-socket.jpg)