Embed Size (px)
Citation preview
The VAS Voluntary Sector Survey 2015
A report on the results for Voluntary Action Swindon
by Phil Back Associates Ltd
December 2015
1 | P a g e
Executive Summary
1. This report sets out the results of a survey of the voluntary and community sector, initiated by VAS, in October - November 2015. A total of 127 valid responses were received from people answering on behalf of 104 different organisations, three quarters of which are independent local groups. Half are groups supporting vulnerable people or families, and a quarter are sports groups; groups from across the whole range of voluntary activity are present in the response.
2. Half of those who responded are committee members; a third are paid staff, and just over a quarter are volunteers. This differs substantially from the more complex surveys issued in 2013 and 2014, when half of those responding were paid staff and only a third were committee members. It seems likely that the simplified questionnaire used this time has been successful in enabling voluntary response as well as professional, although this inevitably affects comparability between the two surveys.
3. Five out of six groups use regular committed volunteers, and half use casual volunteers. Over half of all groups use voluntary labour only and have no paid staff at all. Two out of five groups have full-time paid staff, and a third have part-time paid staff; a quarter of groups have both types of paid staff.
4. Groups vary widely in size, but about half have between six and twenty regular volunteers, and a quarter have this number of casual volunteers. Relatively few organisations employ lone paid staff. Staff and volunteer numbers are relatively static; where change is taking place, increase is more likely than decrease in both paid staff and volunteer numbers.
5. Over half of groups receive grant funding from external bodies, and half rely on donations from the public; two in five are supported by a lottery or charitable trust grant. Contractual funding reaches one in five groups in the survey. Three fifths of groups report stable funding compared to 2014; those reporting change are more likely to show an increase in funding than a reduction, other than among groups working with contract funding
6. Two in five groups have had to take action to make ends meet this year, but a majority have not. The most common approaches to this challenge are to change the way services are delivered, to cut costs, and to increase charges; reductions in service level, or staff numbers, are relatively rare.
7. Numbers of beneficiaries of voluntary and community activity range widely. One in seven groups work with small numbers of people, but about half of all groups have more than 200 beneficiaries, and one in six claims over 2,000 beneficiaries each. Three quarters of groups report increased numbers benefitting from their work compared to 2014, while just 4% are experiencing shrinkage in numbers.
2 | P a g e

8. By far the most common method of acquiring new beneficiaries is through word of mouth, though referrals from community leaders and open days are also significant contributors to recruitment. Word of mouth is also the over-riding way of recruiting new volunteers, but the Volunteer Centre also plays an important part, and open days are also effective. Use of the internet generally, and of social media in particular, is very limited.
9. Groups are much more familiar with VAS than with either Healthwatch or One Swindon. Awareness of One Swindon is low, and more than half of groups have no familiarity with this body. Seven out of ten groups work alongside the Borough Council in some respect, but confidence in the Council as a partner is low. The much lower numbers who work with the Police, in contrast, find them an effective partner.
10. Organisations continue to believe they are highly valued by those they work with, but are more cautious about evaluating their leadership and direction. There is only limited confidence that their organisation has the resources to survive the current voluntary sector climate, and many respondents feel their organisation is less capable than it used to be at managing change.
11. Groups are active in promoting their work, and use a range of methods to get their message across. Between 40 and 50% have contacted a local MP, met with officers, or spoken to a Councillor, but only a third have spoken at a public sector meeting. Participation in protest or demonstration is extremely limited.
12. Groups see their main development needs as help with securing funding, and help in recruiting and retaining volunteers. Issues that several groups are struggling with include recruiting leaders, recruitment of new volunteers, and engaging the wider public in their work. This, together with other findings of the survey, suggests that development areas could usefully include funding applications, volunteer recruitment and retention, management of change, and the use of social media and web-based technology to communicate with an audience.
3 | P a g e
1 Introduction
A survey of the voluntary sector in Swindon has been undertaken in each of the last three years. The 2013 survey, managed by the Swindon Community Infrastructure Partnership received 137 responses and was written up and presented as an analytical report. A further survey, of a similar length to its predecessor, was run in 2014 and attracted just 76 responses; the results of this have been made available in summary form, and some of the analysis we have undertaken for 2015 was not carried out last year.
Voluntary Action Swindon decided to repeat the survey in 2015, and this report analyses the results of the new survey. Where there is comparability with 2013 or 2014, the report also takes the opportunity to explore how the 2015 result compares with its predecessors. However, we need to point out that the 2014 survey attracted a significantly lower response, and has not been analysed in the same depth as the present survey, or that conducted in 2013.
Following advice from ourselves, the decision was taken to shorten and simplify the 2015 questionnaire. It was hoped this would address feedback from the earlier surveys over both length and complexity, especially as regards financial questions which some respondents felt lay outside their expertise. The survey was placed on a secure online website and VAS contacted its mailing list to invite participation; a paper version of the questionnaire was also available for those who preferred this method of completion. A copy of the questionnaire used in the survey is attached as an appendix to this report.
The online survey was launched in mid-October 2015, and a total of 127 valid responses were received by the closing date in mid-November. This is a similar, albeit slightly smaller, level of response to that achieved in 2013, but almost doubles the response achieved in 2014. Although a paper questionnaire was made available, no respondent chose this method of response.
Not everyone answered every question, but in each case the total response for a question is shown in the data table. In some tables, responses exceed 100%; this happened where individuals were allowed to choose more than one of the answers on offer in the question.
Guarantees of confidentiality have been given to respondents, so this report is careful to ensure that no individual can be identified through their response.
4 | P a g e
2 Respondents
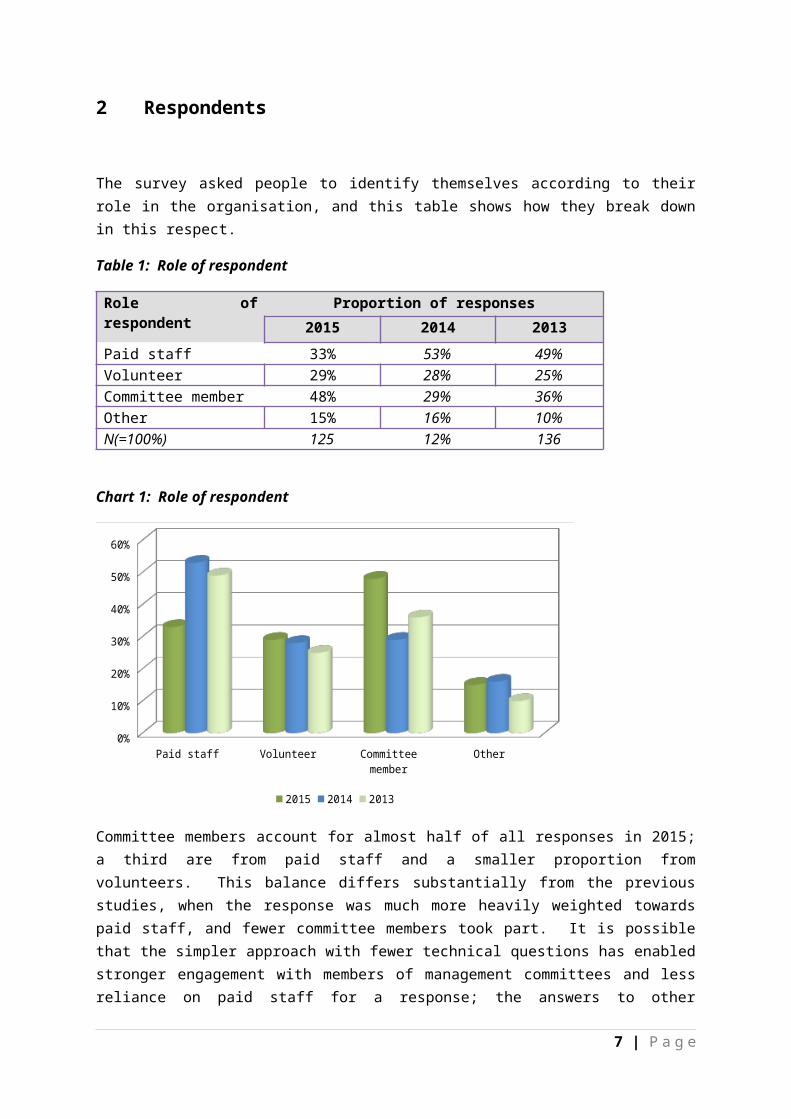
The survey asked people to identify themselves according to their role in the organisation, and this table shows how they break down in this respect.
Table 1: Role of respondent
Role of respondent Proportion of responses2015 2014 2013
Paid staff 33% 53% 49%Volunteer 29% 28% 25%Committee member 48% 29% 36%Other 15% 16% 10%N(=100%) 125 12% 136
Chart 1: Role of respondent
Paid staff Volunteer Committee member Other0%
10%
20%
30%
40%
50%
60%
2015 2014 2013
Committee members account for almost half of all responses in 2015; a third are from paid staff and a smaller proportion from volunteers. This balance differs substantially from the previous studies, when the response was much more heavily weighted towards paid staff, and fewer committee members took part. It is possible that the simpler approach with fewer technical questions has enabled stronger engagement with members of management committees and less reliance on paid staff for a response; the answers to other questions later in the survey also suggest a different response base this time round, rather than a radical change in perspective from the sector as a whole.
Some respondents ticked the 'other' category and they include a small number of members of the public, as well as some professionals in non-voluntary roles such as statutory providers.
5 | P a g e

Respondents were able to choose more than one role, and the table indicates that many did so. Several paid staff also work as volunteers (not necessarily with the same organisation) and no doubt several people are volunteers with more than one organisation. Six of those in the 'other' category are also committee members or volunteers with local organisations.
A total of 104 organisations are represented in the survey. Some of these have more than one respondent (none has more than three, however) and some respondents claim to be answering for two or three different organisations. A full list of the organisations represented in the survey is provided as an appendix to the report.
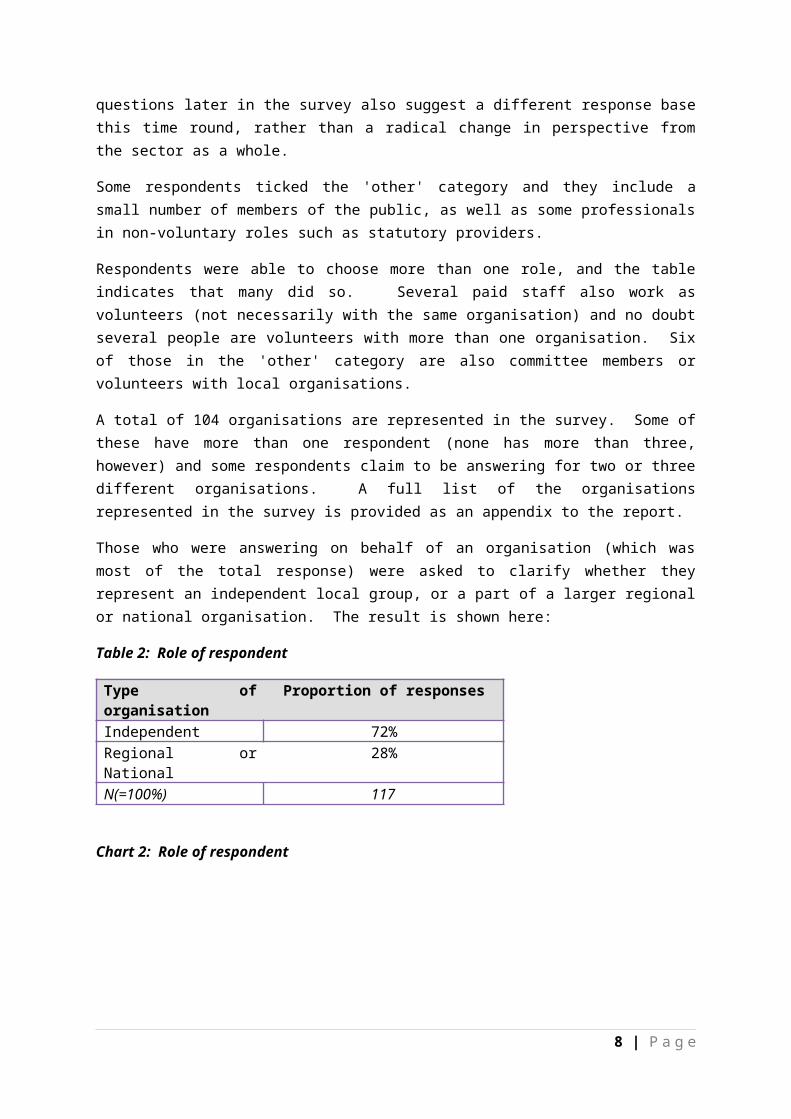
Those who were answering on behalf of an organisation (which was most of the total response) were asked to clarify whether they represent an independent local group, or a part of a larger regional or national organisation. The result is shown here:
Table 2: Role of respondent
Type of organisation Proportion of responses
Independent 72%Regional or National 28%N(=100%) 117
Chart 2: Role of respondent
Independent
Regional or National
Almost three quarters of respondents representing organisations are answering on behalf of an independent local group or organisation, with a quarter speaking as local representative of a larger regional or national body. Some of these will be autonomous branches of national bodies; others will operate under a less devolved structure with more direct management from the centre.
6 | P a g e
3 The organisation and its resources
The survey asked respondents to categorise the main focus of their organisation, and this table shows how the responses to the survey are classified.
Table 3: Organisational focus
Focus Proportion of
responsesSupport for vulnerable people or families 47%Educating and informing 42%Sports facilities and opportunities 24%Speaking out on behalf of particular interests or groups 22%Community Centres/village halls 13%Arts and cultural facilities and opportunities 9%Protecting and conserving the natural environment 9%Heritage and history 9%Promoting or supporting faith or religion 6%Emergency help or relief 6%Justice and human rights 6%Fundraising for people elsewhere 5%Animal welfare 1%Other 16%N(=100%) 112
Chart 3: Organisational focus
Vulnerable
Education
Sports
Speaking o
ut
Comm buildings
Cultural
Environmen
t
Heritag
efait
h
Emerg
ency
Justice
Fundrai
sing
Animals
Other 0%
5%
10%
15%
20%
25%
30%
35%
40%
45%
50%
7 | P a g e
The largest classification is support for vulnerable people and families; almost half of all those responding to the survey see this as a main focus of their organisation. Alongside this, many voluntary groups - over two in five - see education and information as an important dimension of their work, and even for those who do not have educational remits as such, the role of providing information to service users and to a wider public is significant. In fact, most groups who educate and inform do so alongside another purpose; the implication is that the voluntary sector finds it important not only to support people and causes, but also to spread information and understanding among a wider audience.
About a quarter of respondents represent a sports club, demonstrating the significance of volunteering to the provision of both facilities and opportunities in sport; a similar proportion have a role in representing the views of particular interests, including perhaps those who have no other voice that can be heard.
The remainder of the table illustrates the diversity of the sector, with groups working on community buildings, arts, human rights, religion and emergency relief, as well as heritage and animal welfare. The numbers also show a considerable overlap between purposes; for example, all those groups focussing on history and heritage also identify other purposes, usually in relation to educating and informing. Sports bodies are less likely to have other purposes, but some do; in contrast to 2013, two bodies see their role as embracing both sport and the arts.
The 'other' category is frequently used to elaborate on a category already chosen, such as by describing the beneficiaries in more detail, but also records groups working on additional issues including housing, healthcare, community development, counselling and therapeutic work, and the advancement of volunteering.
The results of this question are not strictly comparable to the earlier surveys, when a much longer list of categories and beneficiaries was used, but it is clear that the response this time round is more diverse than before, with greater representation of sport, the arts and heritage, and a reduced participation by environmental and community development groups.
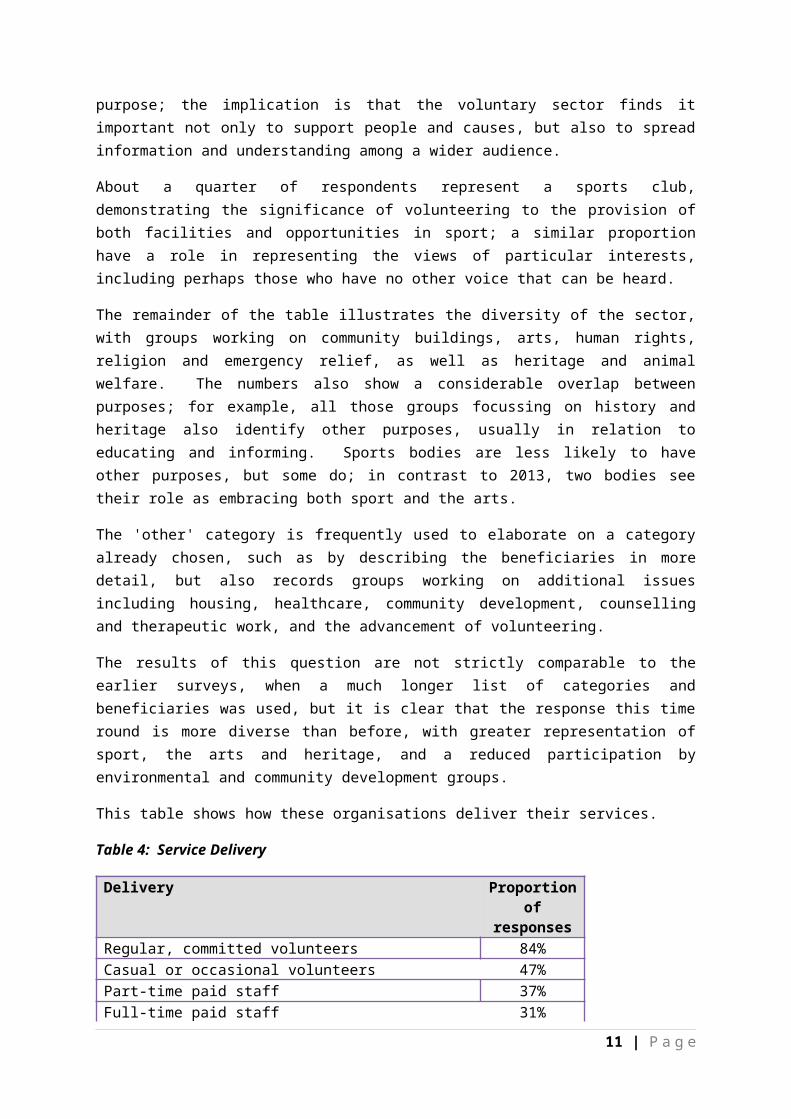
This table shows how these organisations deliver their services.
Table 4: Service Delivery
Delivery Proportion of
responsesRegular, committed volunteers 84%Casual or occasional volunteers 47%Part-time paid staff 37%Full-time paid staff 31%Others 14%Don't know 2%N(=100%) 113
8 | P a g e
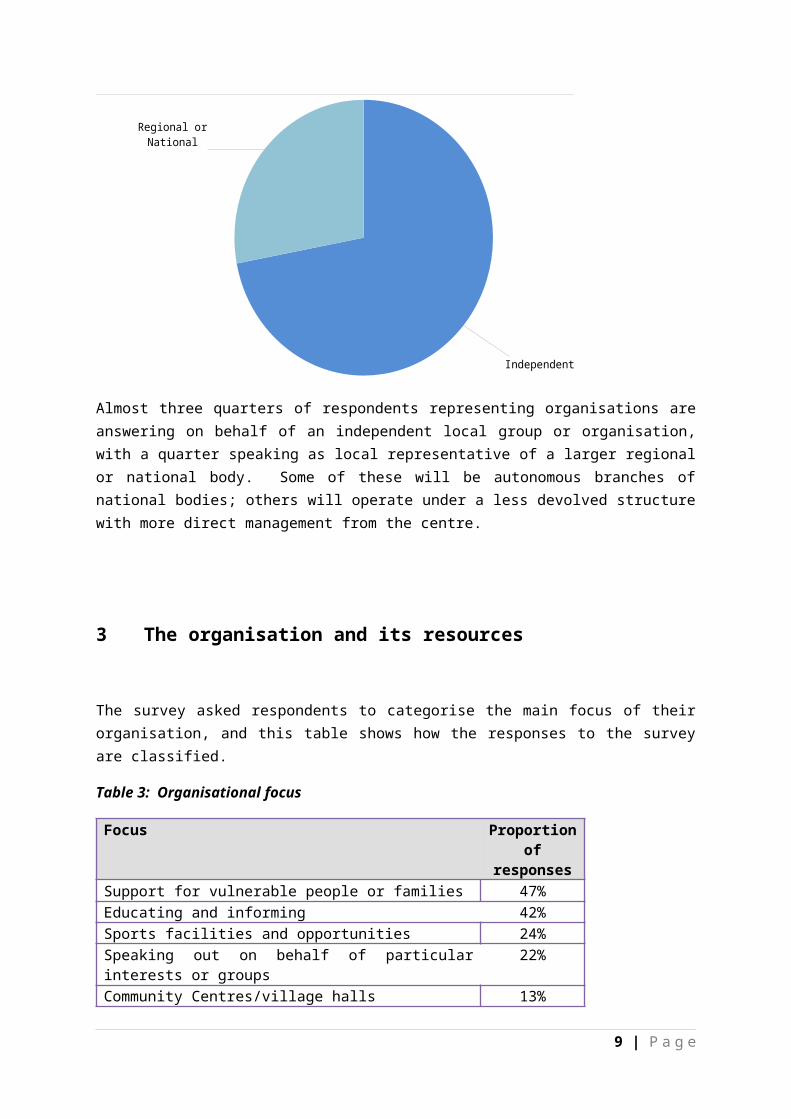
Chart 4: Service Delivery
Regular vols Casual vols Part-time paid staff
Full-time paid staff
Others Don't know0%
10%
20%
30%
40%
50%
60%
70%
80%
90%
Four out of five organisations rely on regular committed volunteer effort to deliver their services, and just under half make use of casual or occasional volunteers. Over a third of organisations in the survey have part-time paid staff and a smaller but similar proportion have full-time staff in post. A small proportion, around one in seven of the bodies responding to the survey, use other sources of labour, which might include internships or opportunities such as Community Payback.
Regular, committed volunteers are the backbone of the sector: three quarters of those groups working with vulnerable people, and four-fifths of those groups with an education/information role, make use of regular, committed volunteers, as do 85% of voluntary sports bodies, and 90% of environmental bodies. But casual volunteers are also important, with over half of organisations working with vulnerable people making use of them, and half of sports groups also using casuals. Levels of casual volunteering fall away a little for education/information, but casuals are still prominent in other groups, including environmental work.
Paid staff are more confined to specific activities. They are quite common among those working with vulnerable people and families, and these groups account for two thirds of all those with paid staff. Paid staff are also prominent among groups that have a role in educating and informing, and a number of paid staff work in groups that speak out of behalf of others, but other types of group are much less likely to use paid employment. Voluntary sports activity is an example; there are few paid staff working in this field, either full or part-time.
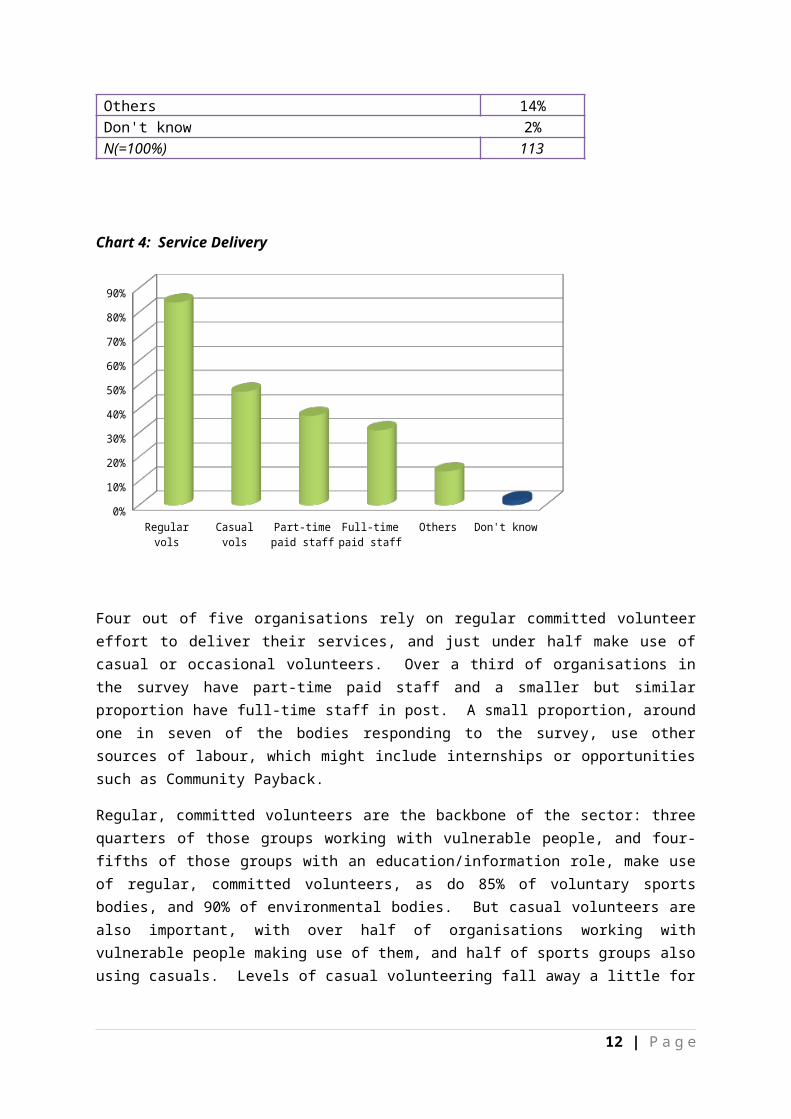
The proportions of organisations using different groups of staff are shown here:
Table 5: Paid staff
9 | P a g e
Staffing Proportion of responses
All paid staff are full time 6%All paid staff are part-time 12%Both full and part-time staff 26%No paid staff 56%N(=100%) 110
Chart 5: Paid staff
All paid staff are full time
All paid staff are part-time
Both full and part-time staff
No paid staff
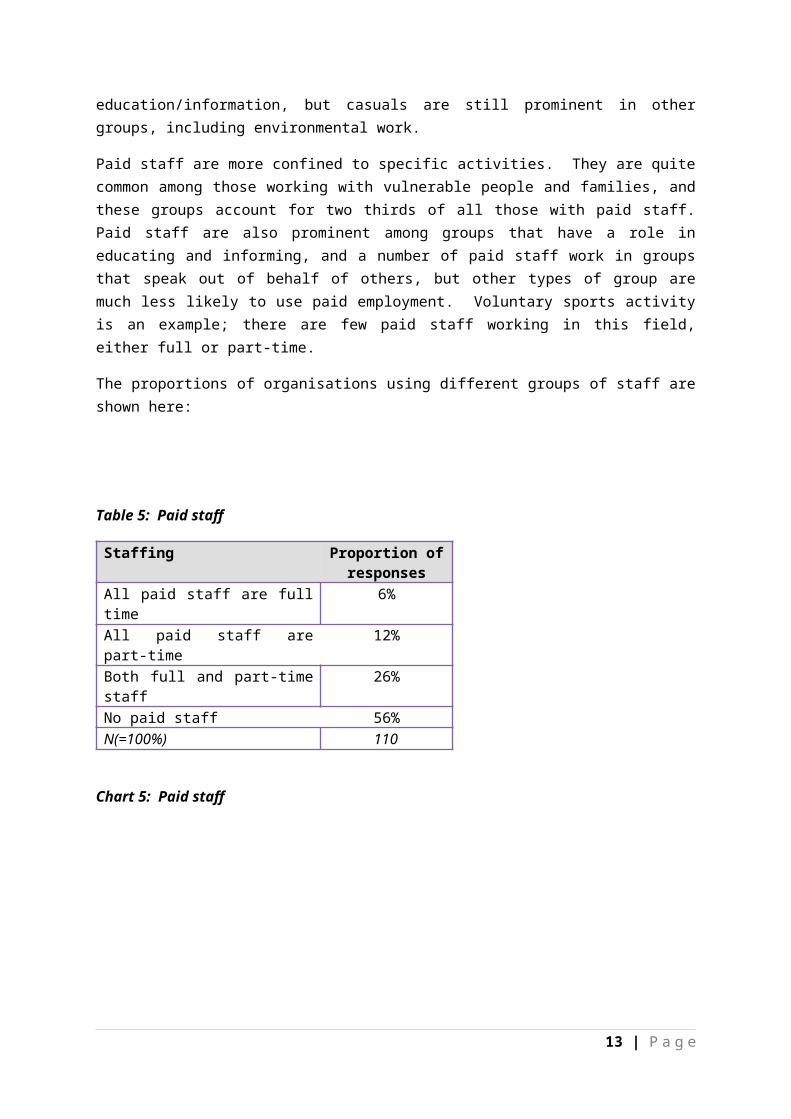
Over two fifths of organisations (44%) have paid staff of some description. Three fifths of these (59% of the sub-group) have both full and part-time staff on the payroll; but of the remainder, two thirds rely on part-time staff. Voluntary organisations where all the paid staff are full-time exist in Swindon, but their numbers are small.
Nearly three-fifths (56%) of organisations in the survey are wholly dependent on volunteers.
The numbers of staff and volunteers are shown here:
Table 6: Staff and volunteer numbers
Staffing numbers
Proportion of all organisations
Regular committed volunteers
Casual volunteers
Full time paid staff
Part-time paid staff
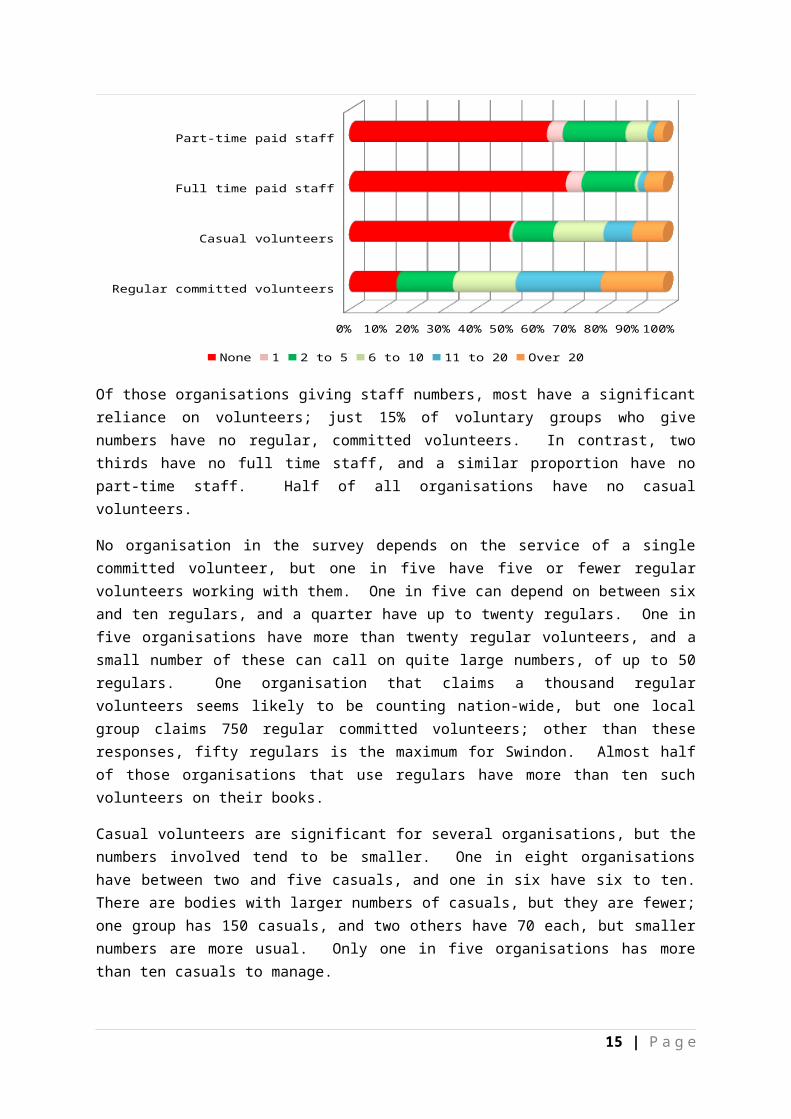
None 15% 51% 69% 63%1 0% 1% 5% 5%2-5 18% 13% 17% 20%6-10 20% 16% 1% 7%11-20 27% 9% 2% 2%Over 20 20% 10% 6% 3%N(=100%) 96
Chart 6: Staff and volunteer numbers
10 | P a g e
Regular committed volunteers
Casual volunteers
Full time paid staff
Part-time paid staff
0% 10% 20% 30% 40% 50% 60% 70% 80% 90% 100%
None 1 2 to 5 6 to 10 11 to 20 Over 20
Of those organisations giving staff numbers, most have a significant reliance on volunteers; just 15% of voluntary groups who give numbers have no regular, committed volunteers. In contrast, two thirds have no full time staff, and a similar proportion have no part-time staff. Half of all organisations have no casual volunteers.
No organisation in the survey depends on the service of a single committed volunteer, but one in five have five or fewer regular volunteers working with them. One in five can depend on between six and ten regulars, and a quarter have up to twenty regulars. One in five organisations have more than twenty regular volunteers, and a small number of these can call on quite large numbers, of up to 50 regulars. One organisation that claims a thousand regular volunteers seems likely to be counting nation-wide, but one local group claims 750 regular committed volunteers; other than these responses, fifty regulars is the maximum for Swindon. Almost half of those organisations that use regulars have more than ten such volunteers on their books.
Casual volunteers are significant for several organisations, but the numbers involved tend to be smaller. One in eight organisations have between two and five casuals, and one in six have six to ten. There are bodies with larger numbers of casuals, but they are fewer; one group has 150 casuals, and two others have 70 each, but smaller numbers are more usual. Only one in five organisations has more than ten casuals to manage.
Where full-time staff are employed, the numbers of such staff are inevitably quite small, although lone-worker full-time staff are rare. One in six organisations has between two and five full-time staff, but just one in twenty has just one paid full-time member of staff. Those organisations claiming more than twenty full-time staff are part of larger organisations and may be including all staff, not just those working locally. The same pattern is evident among organisations using part-time staff; where they are employed, there are usually a small number, but only rarely is there just one.
Organisations with paid staff tend to have larger numbers of volunteers: there is an average of 21 volunteers working in organisations with paid staff, but this falls to just 13 in organisations run entirely by volunteers.1
1 These figures exclude the small numbers of organisations reporting exceptionally large numbers of volunteers.
11 | P a g e
The next question looks at the way these numbers may have changed over the past twelve months:
Table 7: Trends in staff numbers
Staffing number trend
Proportion of all organisations
Regular committed volunteers
Casual volunteers
Full time paid staff
Part-time paid staff
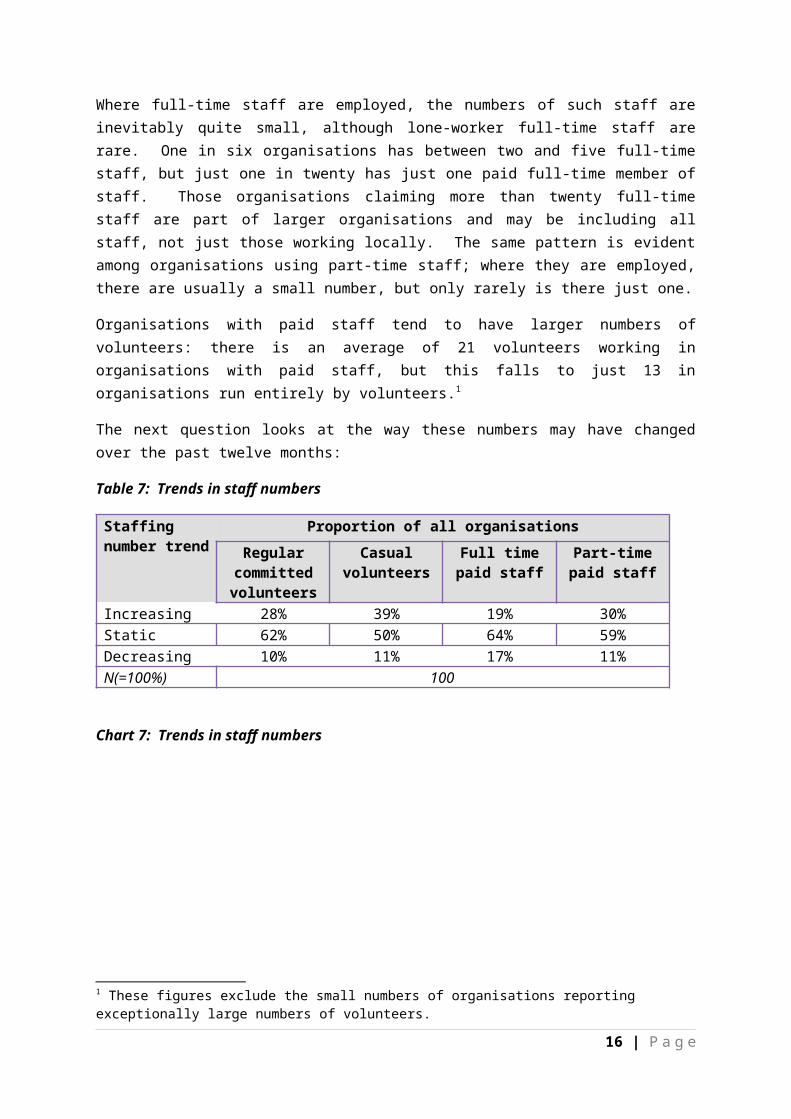
Increasing 28% 39% 19% 30%Static 62% 50% 64% 59%Decreasing 10% 11% 17% 11%N(=100%) 100
Chart 7: Trends in staff numbers
Regular committed volunteers
Casual volunteers
Full time paid staff
Part-time paid staff
0% 10% 20% 30% 40% 50% 60% 70%
Decreasing Static Increasing
Numbers are largely static year-on-year in all four staff groups. Half or more of the organisations with staff in each group report static numbers, and three in five bodies employing full-time staff report no change in numbers over the past twelve months.
Among groups using regular volunteers, three in five report static numbers, and a quarter say the numbers of volunteers they can call on is increasing. A small proportion of groups, about one in ten, find their pool of regular volunteers shrinking. Casual volunteers seem to be more volatile; half of all organisations that use casuals report static numbers, but two in five bodies report an increase in casual volunteering, while one in nine see a decrease over last year.
The greatest pressure is being felt by full-time staff. Even so, just one in six bodies report a decrease in numbers, while a slightly higher proportion say their numbers of full-time staff are increasing. There is also expansion taking place in part-time employment in the sector, with over a quarter of organisations reporting an increase in their part-time numbers.
12 | P a g e
These numbers are different from those in the 2013 survey, when just two in five groups were reliant wholly on volunteers; the proportion this year is well over half (56%).2 Clearly, the difference cannot be accounted for by changes in staff establishments, and it seems likely that this year's survey has enabled a greater response from that part of the voluntary sector which has no paid staff.
This table shows how organisations are funded:
Table 8: Sources of funding
Source Proportion of responses
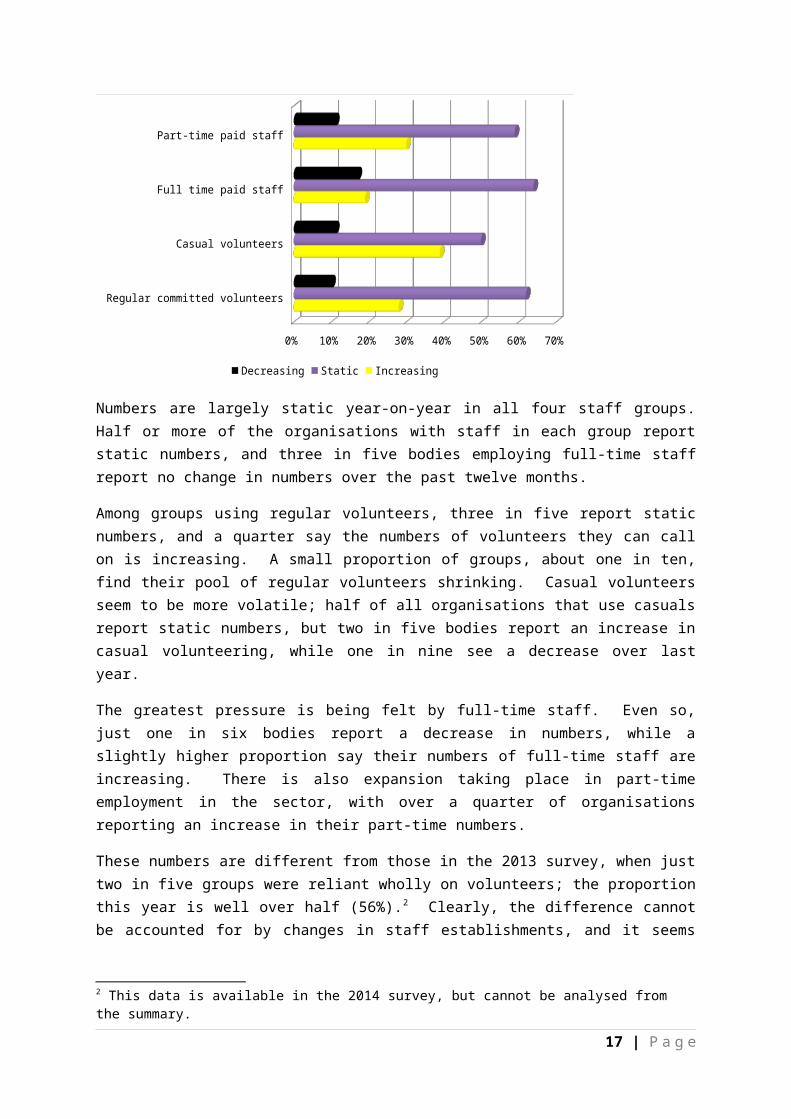
Grants from other orgs 55%Public donations 50%Lottery/charitable trust grants 39%Admission charges or fees 33%Contractual funding 22%Sales of donated goods 17%Other 33%N(=100%) 92
Chart 8: Sources of funding
Grants f
rom other orgs
Public donations
Lottery/ch
aritable t
rust gran
ts
Admission ch
arges o
r fees
Contractual f
unding
Sales o
f donated go
ods Other0%
10%
20%
30%
40%
50%
60%
Grants are by some distance the most important source of financial resources for the voluntary sector; two in five organisations in the survey receive grants from lottery or charitable trust sources, and just over half receive grants from other organisations. However, public engagement remains an important element in fundraising, and half of all groups receive donations direct from the public, while one in three groups receive admission charges and one in six receive income through the sale of items donated by the public. One
2 This data is available in the 2014 survey, but cannot be analysed from the summary.
13 | P a g e
in five groups responding to the survey receive funding though formal contractual arrangements.
Other arrangements for raising funds are predominantly membership fees, subscriptions and similar charges. Individual groups also mention fundraising events, and one group receives funding direct from central Government. Groups fortunate enough to own or manage buildings raise funds through rentals.
It is also clear from the table that many groups rely on several different sources of income, and have diversified their funding base. Around a third (37%) of groups, however, rely on a single funding stream, with admission charges especially important to arts and sports groups and membership subscriptions vital to those groups that use them. Just one group operates solely on the basis of a lottery grant or grants, while three groups in the survey are totally dependent on contracts and three others only receive money from public donation.
The simplification of the survey meant that questions about gift aid and legacies were not asked; but neither were these mentioned spontaneously as income sources. This is probably due to unfamiliarity with the more technical aspects of organisational finance, rather than an absence of these elements altogether.
The question was asked differently in previous years, and the results are not directly comparable on a line-by-line basis. However, the level of reliance on contracts is similar; up to a quarter of organisations in 2013 were using contractual sources of income, a similar level of activity to the current year; in the 2014 survey, the level of contractual funding was higher, but this probably reflects the pattern of response which leant towards the better resourced organisations. The indications are that lottery grants are being more widely spread this year; in the 2013 survey, up to a third of organisations said they received lottery or other grants, a figure which rose in 2014 and again is higher this year.3 Public donations are also more prominent this year; in the 2013 survey, just a third of bodies collected from the public, but this rose in 2014, and is half of organisations participating in 2015. This could suggest a degree of volatility, or an increased capacity to give, on the part of the public, but could also be attributed to the inclusion of more, smaller groups who may use this approach more.
Funding levels are not necessarily stable, and this table shows which of the most significant sources are increasing or decreasing.
Table 9: Trends in funding
Staffing number trend
Proportion of all organisations
Lottery and trusts
Other grants Contracts Public donations
Increasing 34% 13% 21% 24%
3 This data is available in the 2014 survey, but cannot be analysed from the summary.
14 | P a g e
Static 54% 64% 58% 55%Decreasing 12% 23% 21% 14%N(=100%) 92
Chart 9: Trends in funding
Lottery and trusts
Other grants
Contracts
Public donations
0% 10% 20% 30% 40% 50% 60% 70%
Decreasing Static Increasing
Over half of the organisations in the survey report stable funding, especially among those receiving 'other grants' (that is, not from lottery or trust sources) where two thirds say their income from this source is stable. Lottery/trust and contractual funding is often for more than twelve months, and this is reflected in the stability of funding from these sources, but even among those organisations that rely on the potentially more volatile public donations more than half say their income from this source is holding up.
Where funding income is changing, there are contrasting experiences. A third of lottery/trust grant recipients report an increase in funds from this source, against just one in eight recipients who report a reduction in income. A quarter of those receiving public donations say this source is growing, while just one in seven report a reduced income from this source. But the picture is different on contract income, where although one in five report an increased income, a similar proportion say their income is reducing; and on grants from other sources, a quarter of organisations report reduced income, against just one in eight experiencing an increase.
Looking at all sources for all organisations, about a quarter (24%) of organisations' individual sources of income are increasing, while one in seven (15% of all sources) are decreasing. This leaves three-fifths of funding sources (61%) that are stable in the past twelve months.
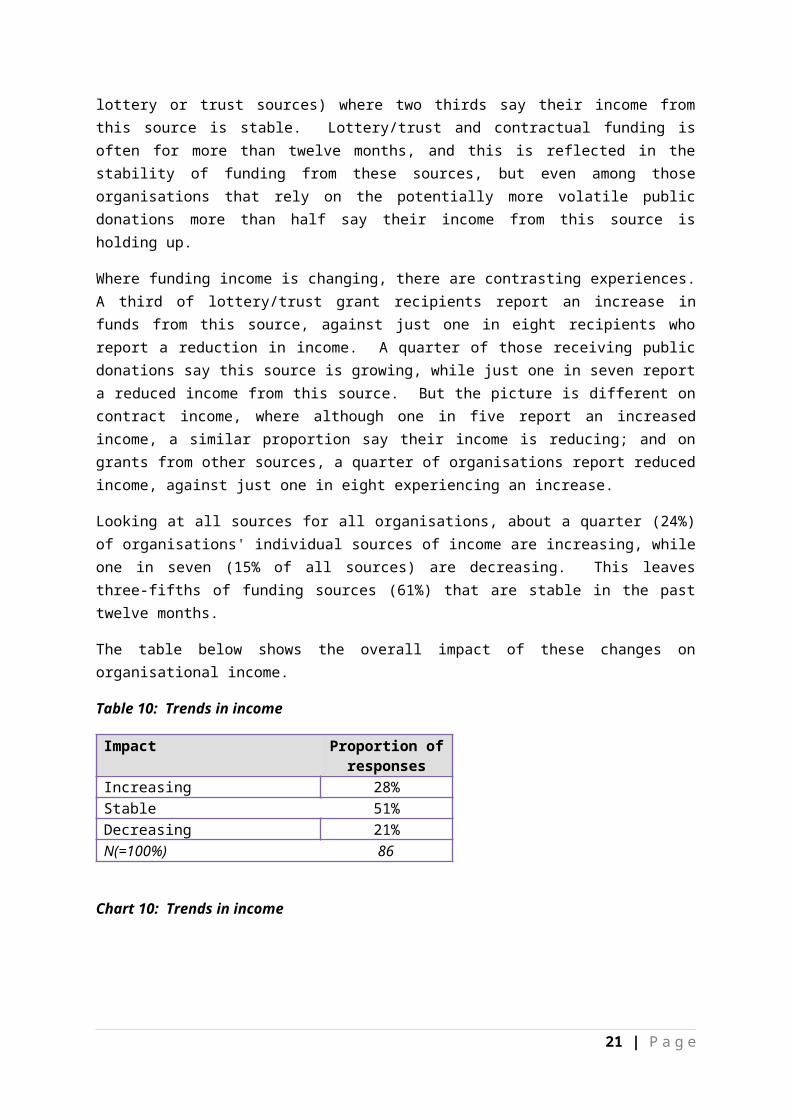
The table below shows the overall impact of these changes on organisational income.
Table 10: Trends in income
Impact Proportion of responses
Increasing 28%
15 | P a g e
Stable 51%Decreasing 21%N(=100%) 86
Chart 10: Trends in income
Increasing
Stable
Decreasing
0% 10% 20% 30% 40% 50% 60%
Around half of the organisations in this survey say their income has stayed about the same from last year to this. Of those reporting change, there are more who have experienced an increase in income than a reduction: over a quarter report an increase, while one in five say their income has declined. Sports, arts and emergency relief organisations are more likely to be experiencing pressure on their incomes; those with increasing income are largely, though not exclusively, groups working with vulnerable people.
Several organisations have taken active steps to address financial pressures, as this table shows:
Table 11: Actions to make ends meet
Action Proportion of responses
Changes in service delivery 22%Cut costs 14%Increased charges 13%Close down activities 7%Reduced hours 7%Reduced number of beneficiaries 3%Redundancies 3%Reduced numbers of volunteers 2%Reduced hours of service 1%None of the above 60%N(=100%) 90
Chart 11: Actions to make ends meet
16 | P a g e
Changes in service delivery
Cut costs
Increased charges
Close down activities
Reduced hours
Reduced number of beneficiaries
Redundancies
Reduced numbers of volunteers
Reduced hours of service
None of the above
0% 10% 20% 30% 40% 50% 60%
Three in five organisations in this survey say they have had to take no action to address financial pressures in the past twelve months. Those that have had to act have focussed their actions in three main areas: changes in the way the service is provided or managed, action to reduce costs and general spending, and increased charges for services. Some organisations have had to take more serious action, including reducing the level of service provided, restricting access to the service, or reducing staff hours and numbers, but these are limited in number; most organisations say they are not taking such measures.
Those organisations that have had to reduce staffing costs include two funded by central Government; redundancies are generally accompanied by reduced hours for other staff. It is also clear that a small number of organisations have had to combine several of these measures, with reductions in service, restrictions on eligibility and staff and volunteer reductions as well. Whilst most organisations are reporting a degree of stability, some are experiencing serious difficulties at present.
17 | P a g e
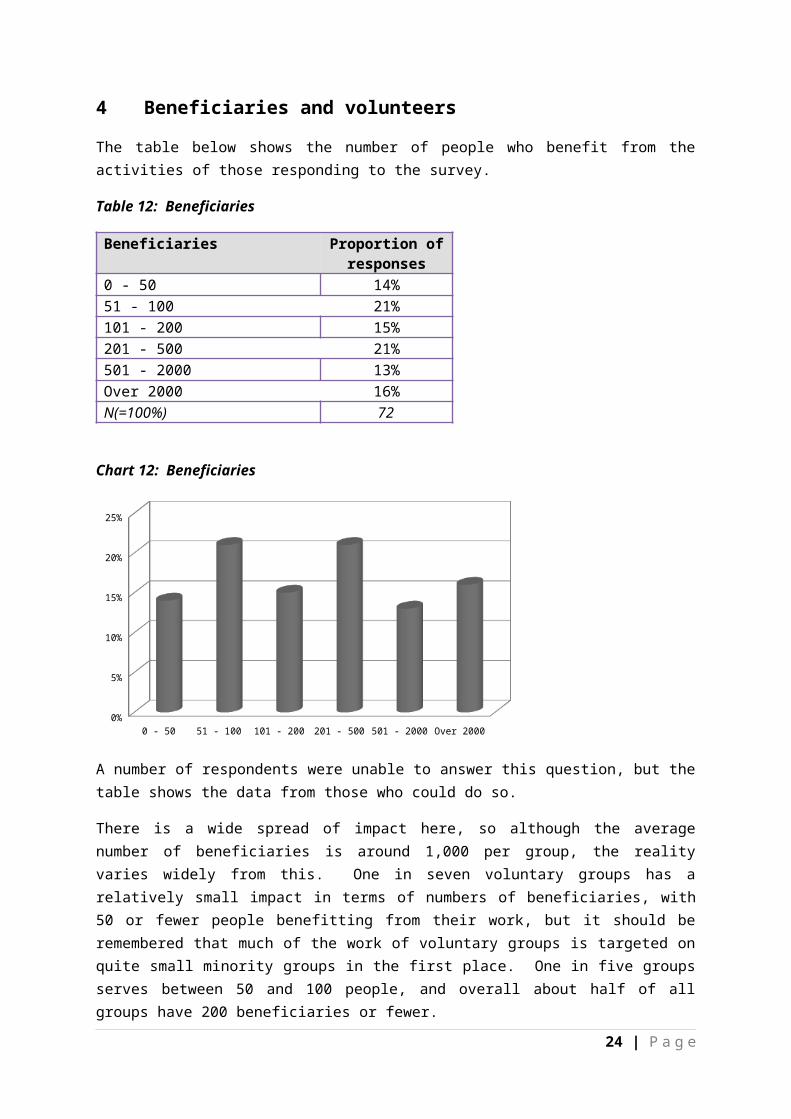
4 Beneficiaries and volunteers
The table below shows the number of people who benefit from the activities of those responding to the survey.
Table 12: Beneficiaries
Beneficiaries Proportion of responses
0 - 50 14%51 - 100 21%101 - 200 15%201 - 500 21%501 - 2000 13%Over 2000 16%N(=100%) 72
Chart 12: Beneficiaries
0 - 50 51 - 100 101 - 200 201 - 500 501 - 2000 Over 20000%
5%
10%
15%
20%
25%
A number of respondents were unable to answer this question, but the table shows the data from those who could do so.
There is a wide spread of impact here, so although the average number of beneficiaries is around 1,000 per group, the reality varies widely from this. One in seven voluntary groups has a relatively small impact in terms of numbers of beneficiaries, with 50 or fewer people benefitting from their work, but it should be remembered that much of the work of voluntary groups is targeted on quite small minority groups in the first place. One in five groups serves between 50 and 100 people, and overall about half of all groups have 200 beneficiaries or fewer.
This means that half of all voluntary groups have more than 200 beneficiaries, and the table shows that the impact of some groups is very significant in terms of numbers, with one in six groups benefitting over 2,000 people each. Two groups, both of them local and independent, claim over 10,000 beneficiaries each.
18 | P a g e

Organisations with paid staff tend to have higher numbers of beneficiaries, while groups led entirely by volunteers reach fewer people on the whole. Generally speaking, a group with staff has a relationship with at least twice as many beneficiaries as a group with no staff. The two local groups noted above buck this trend, however, as both are entirely supported by voluntary effort and have no paid staff, and yet have by some distance the largest numbers of beneficiaries.
The difference in the nature of response this year, with an apparently stronger participation by smaller groups, makes meaningful comparison with the 2013 and 2014 results difficult; these surveys included a larger proportion of respondents serving larger constituencies of beneficiaries, and correspondingly fewer small bodies with smaller numbers of people benefitting. It seems unlikely that the sector has changed as dramatically as the comparison might suggest, and the difference is almost certainly due to a changed pattern of response.
This table shows the trend in beneficiary numbers:
Table 13: Trends in beneficiary numbers
Beneficiaries Proportion of responses
Increasing 71%Static 25%Decreasing 4%N(=100%) 92
Chart 13: Trends in beneficiary numbers
Increasing
Static
Decreasing
0% 10% 20% 30% 40% 50% 60% 70% 80%
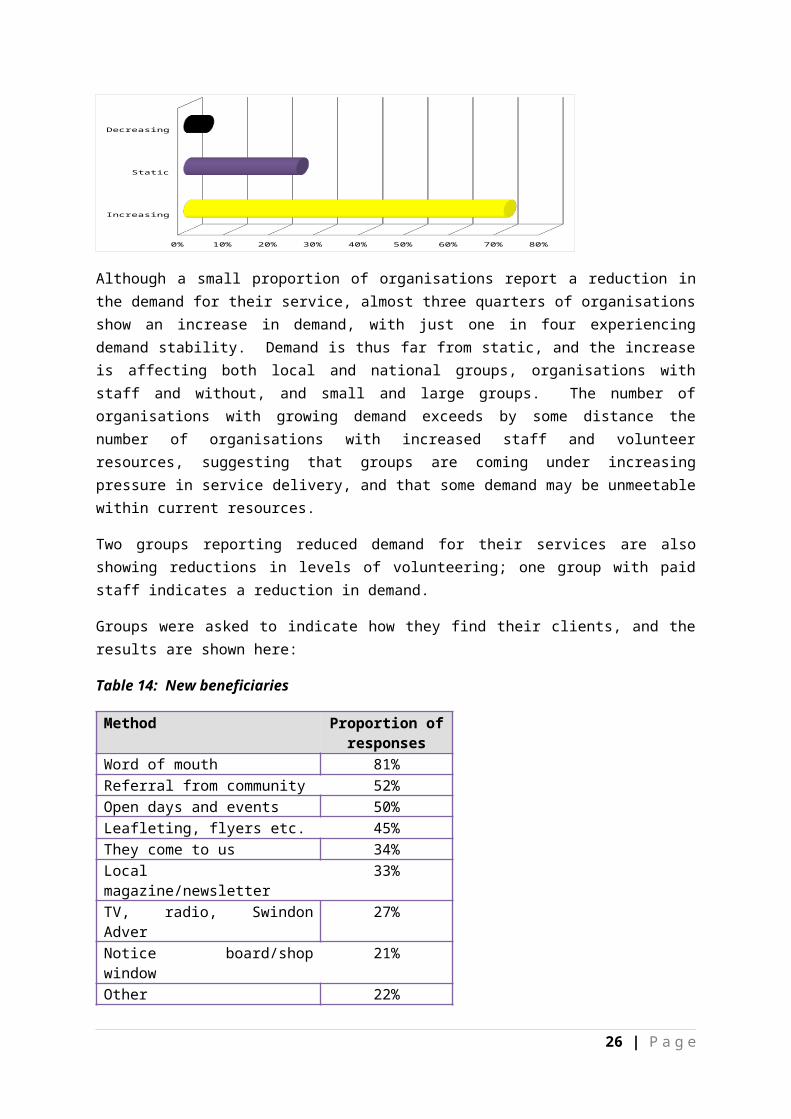
Although a small proportion of organisations report a reduction in the demand for their service, almost three quarters of organisations show an increase in demand, with just one in four experiencing demand stability. Demand is thus far from static, and the increase is affecting both local and national groups, organisations with staff and without, and small and large groups. The number of organisations with growing demand exceeds by some distance the number of organisations with increased staff and volunteer resources, suggesting that groups are coming under increasing pressure in service delivery, and that some demand may be unmeetable within current resources.
Two groups reporting reduced demand for their services are also showing reductions in levels of volunteering; one group with paid staff indicates a reduction in demand.
Groups were asked to indicate how they find their clients, and the results are shown here:
19 | P a g e

Table 14: New beneficiaries
Method Proportion of responses
Word of mouth 81%Referral from community 52%Open days and events 50%Leafleting, flyers etc. 45%They come to us 34%Local magazine/newsletter 33%TV, radio, Swindon Adver 27%Notice board/shop window 21%Other 22%N(=100%) 95
Chart 14: New beneficiaries
Word of mouth
Referral from community
Open days and events
Leafleting, flyers etc.
They come to us
Local magazine/newsletter
TV, radio, Swindon Adver
Notice board/shop window
Other
0% 10% 20% 30% 40% 50% 60% 70% 80% 90%
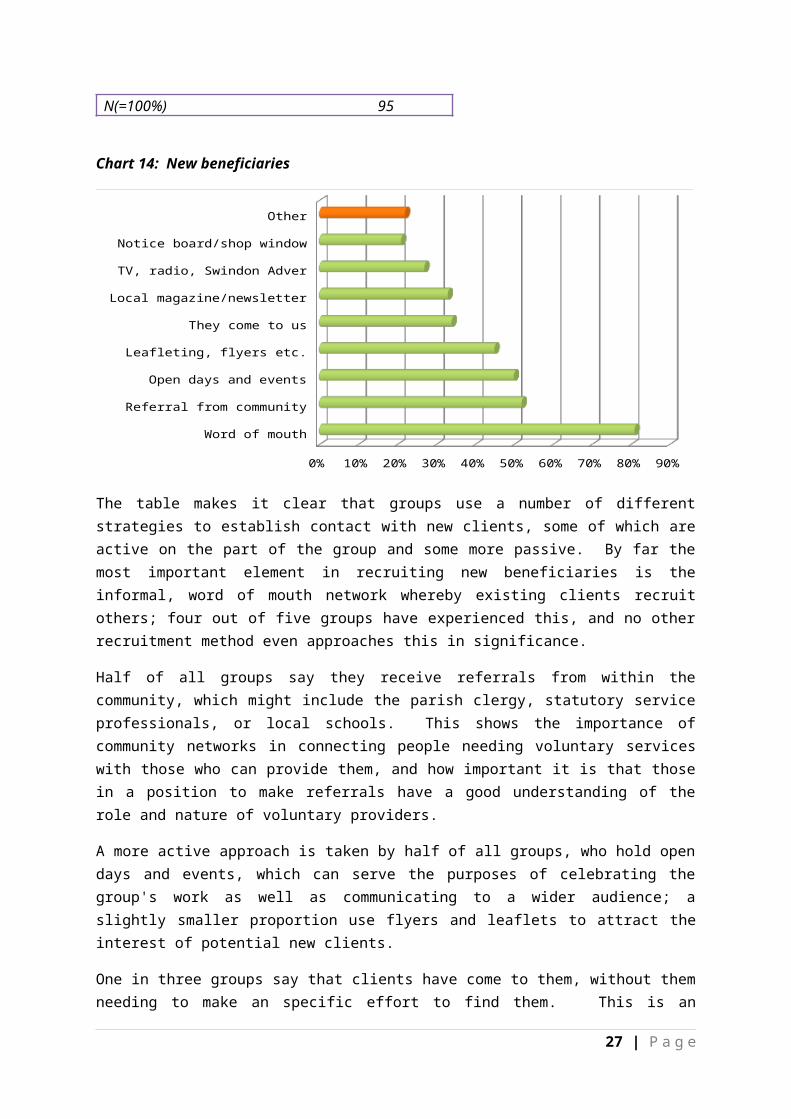
The table makes it clear that groups use a number of different strategies to establish contact with new clients, some of which are active on the part of the group and some more passive. By far the most important element in recruiting new beneficiaries is the informal, word of mouth network whereby existing clients recruit others; four out of five groups have experienced this, and no other recruitment method even approaches this in significance.
Half of all groups say they receive referrals from within the community, which might include the parish clergy, statutory service professionals, or local schools. This shows the importance of community networks in connecting people needing voluntary services with those who can provide them, and how important it is that those in a position to make referrals have a good understanding of the role and nature of voluntary providers.
A more active approach is taken by half of all groups, who hold open days and events, which can serve the purposes of celebrating the group's work as well as communicating to a wider audience; a slightly smaller proportion use flyers and leaflets to attract the interest of potential new clients.
20 | P a g e
One in three groups say that clients have come to them, without them needing to make an specific effort to find them. This is an interesting finding that suggests the effective operation of other mechanisms for connecting people with groups that might support them.
Two alternative media approaches were explored in the question, and both appear quite low down in the table; of the two, local media such as community magazines and newsletters are a little more widely used to recruit new clients than the local TV, radio and newspapers which have much larger audiences but which are less well targeted geographically. Just one in five groups use the most localised method of all, the local shop window or notice board.
Those using other methods of recruiting new clients are mainly groups using the internet or websites to raise awareness of their work. There are also a small number of groups using social media but these are very small in number. A couple of organisations have strong personal networks linked to the previous career or special interests of those leading them.
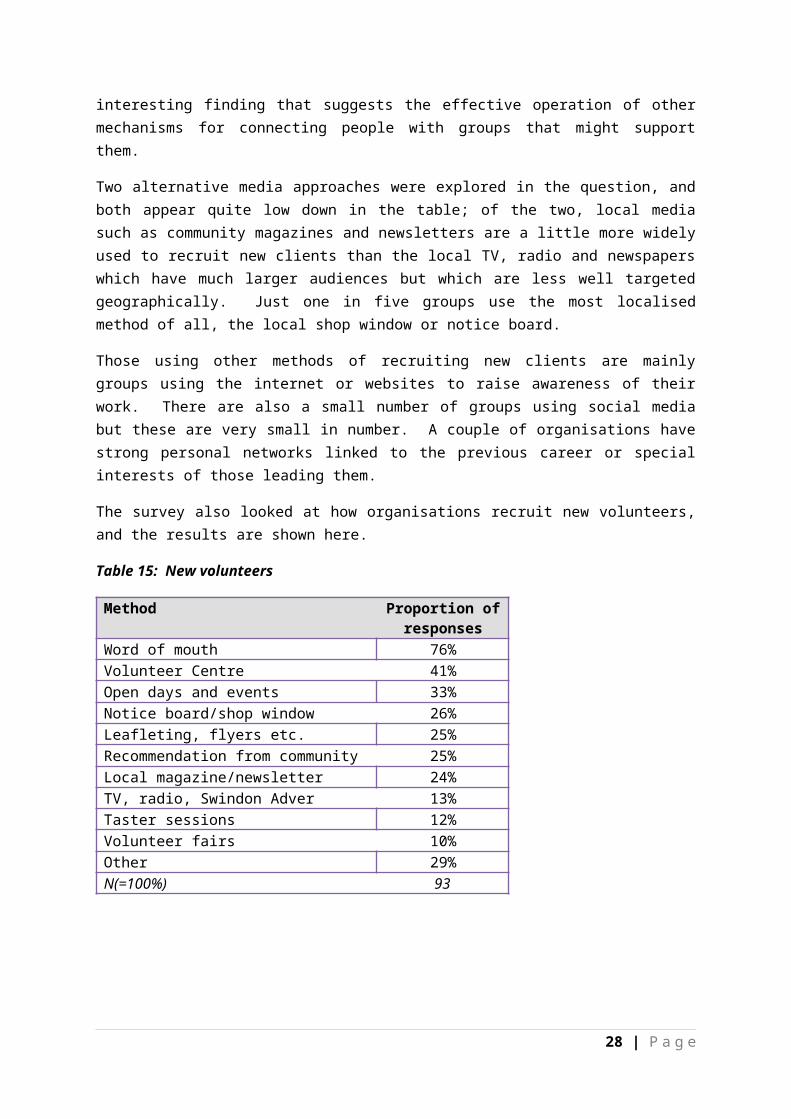
The survey also looked at how organisations recruit new volunteers, and the results are shown here.
Table 15: New volunteers
Method Proportion of responses
Word of mouth 76%Volunteer Centre 41%Open days and events 33%Notice board/shop window 26%Leafleting, flyers etc. 25%Recommendation from community 25%Local magazine/newsletter 24%TV, radio, Swindon Adver 13%Taster sessions 12%Volunteer fairs 10%Other 29%N(=100%) 93
21 | P a g e
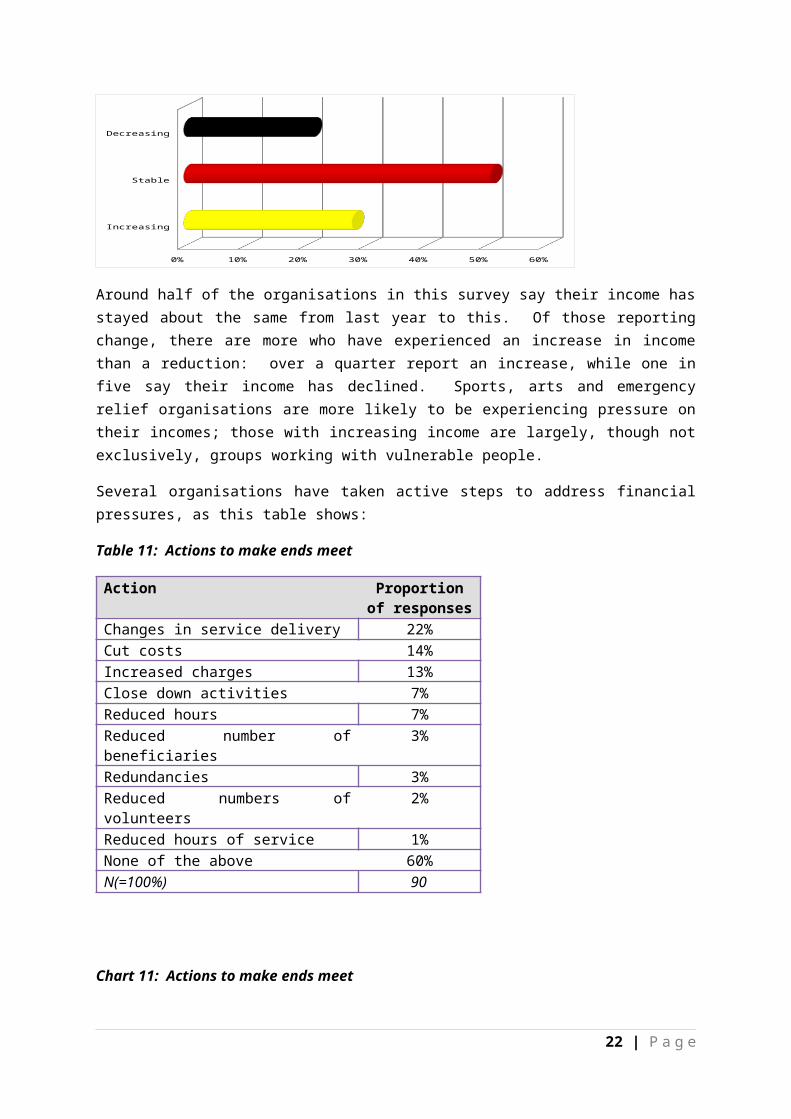
Chart 15: New volunteers
Word of mouth
Volunteer Centre
Open days and events
Notice board/shop window
Leafleting, flyers etc.
Recommendation from community
Local magazine/newsletter
TV, radio, Swindon Adver
Taster sessions
Volunteer fairs
Other
0% 10% 20% 30% 40% 50% 60% 70% 80%
Word of mouth is by far the most common way of recruiting new volunteers; existing volunteers are the main source of new volunteers as they interest their friends and associates to volunteer alongside them. But the Volunteer Centre is also important, and two in five organisations recruit their volunteers using this service, which seeks to link people wishing to serve as volunteers with opportunities that match their skills and interests.
No other recruitment activity matches these in importance, but a third of organisations use open days and events to attract new recruits to the cause, and a quarter use more passive measures such as notice boards and shop window advertising. A quarter use leaflets and flyers to recruit volunteers, and a similar proportion act on recommendations from community leaders; a quarter use local magazines or newsletters to interest potential volunteers.
Other methods are used, but not to the same extent. Just one in eight recruits through broadcast media, and although taster sessions and volunteer fairs are used, they are not commonplace with this group of respondents.
Other methods used include recruiting volunteers through members or adherents to the group (this is particularly useful for groups with membership, such as faith groups) or through their players in the case of sports clubs. Web recruitment is also used, but social media do not feature at all in this context.
The Volunteer Centre is prominent in this table, but closer analysis shows it is especially effective for recruitment to groups that support the vulnerable; two thirds of the groups that use the Volunteer Centre work in this field. The Volunteer Centre is also valuable to arts groups and to community centres, but seems to be little used by sports or heritage activities.
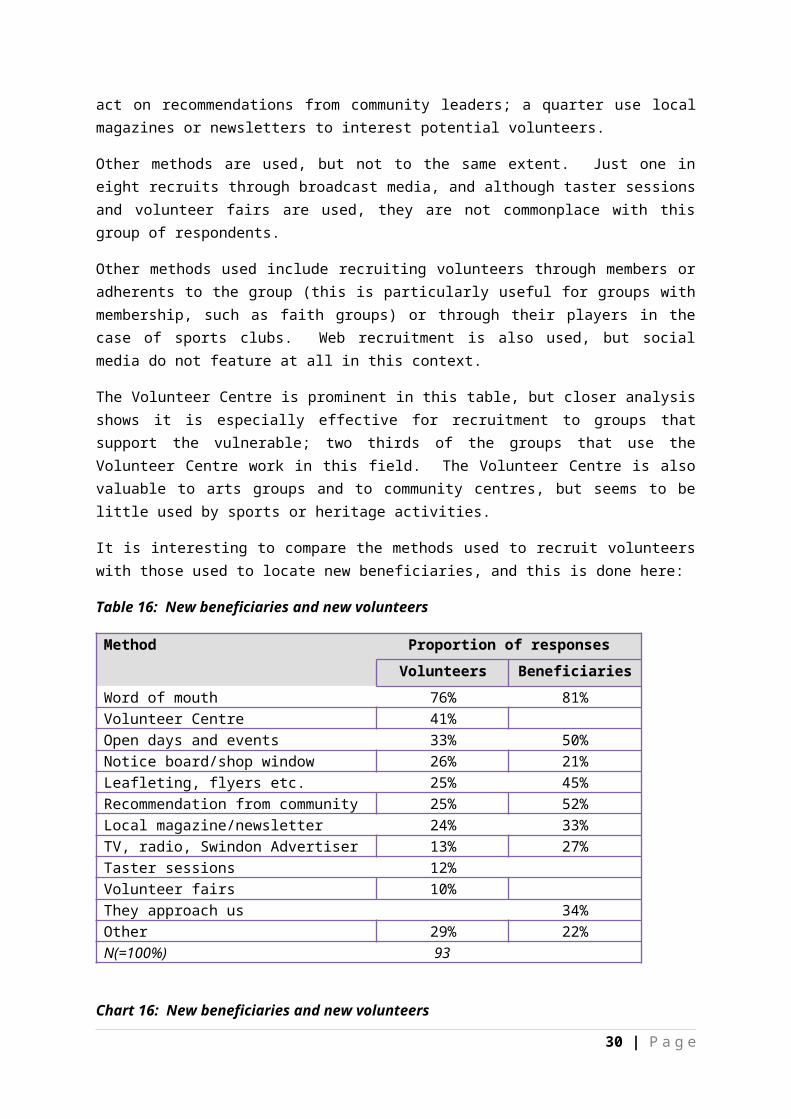
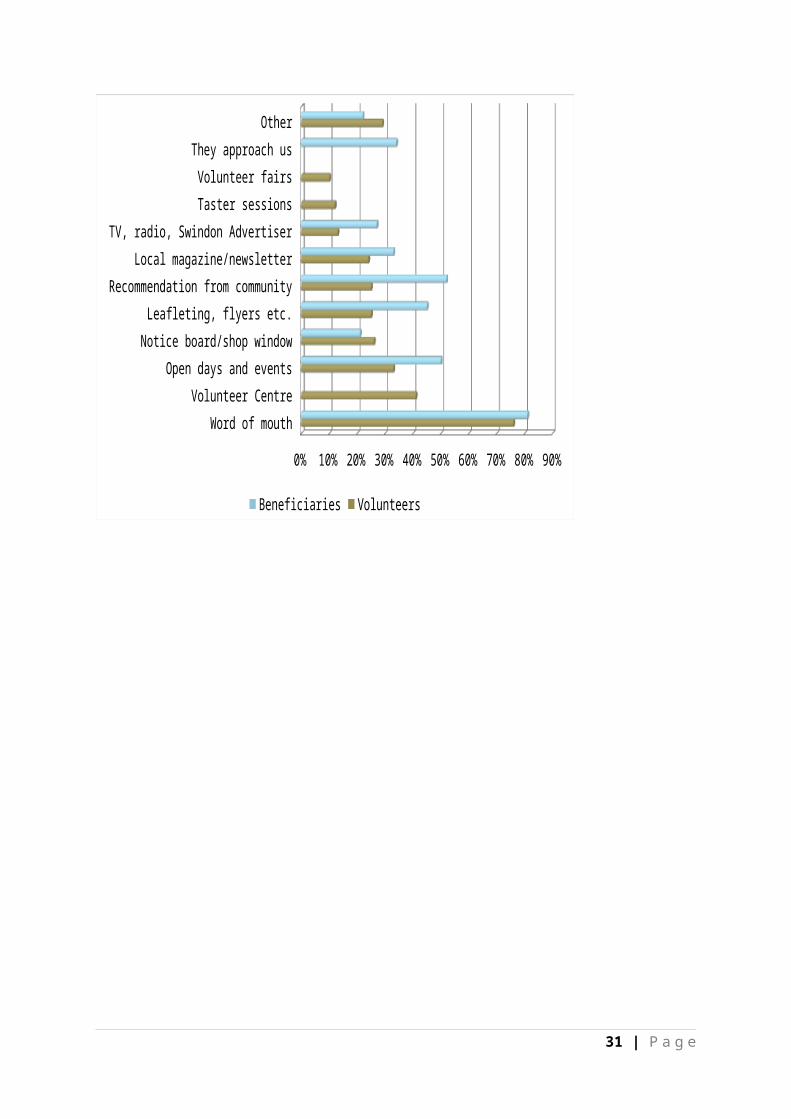
It is interesting to compare the methods used to recruit volunteers with those used to locate new beneficiaries, and this is done here:
22 | P a g e

Table 16: New beneficiaries and new volunteers
Method Proportion of responses
Volunteers Beneficiaries
Word of mouth 76% 81%Volunteer Centre 41%Open days and events 33% 50%Notice board/shop window 26% 21%Leafleting, flyers etc. 25% 45%Recommendation from community 25% 52%Local magazine/newsletter 24% 33%TV, radio, Swindon Advertiser 13% 27%Taster sessions 12%Volunteer fairs 10%They approach us 34%Other 29% 22%N(=100%) 93
Chart 16: New beneficiaries and new volunteers
Word of mouth
Volunteer Centre
Open days and events
Notice board/shop window
Leafleting, flyers etc.
Recommendation from community
Local magazine/newsletter
TV, radio, Swindon Advertiser
Taster sessions
Volunteer fairs
They approach us
Other
0% 10% 20% 30% 40% 50% 60% 70% 80% 90%
Beneficiaries Volunteers
23 | P a g e
There is a clear overlap in the use of these different approaches, but equally some are more effective in one marketplace than in the other. Word of mouth is significant both in recruitment of volunteers and in locating new clients for the service, but activities such as open days, leafleting and media placements are being used more to attract beneficiaries than to recruit volunteers, when clearly they all have some potential for both purposes. Community referral is much more widely used in placing clients with organisations than in identifying potential volunteers. Other activities, which as has been shown are largely web-based, are more commonly used to attract clients than to recruit additional volunteers.
24 | P a g e
5 Partnership and reputation
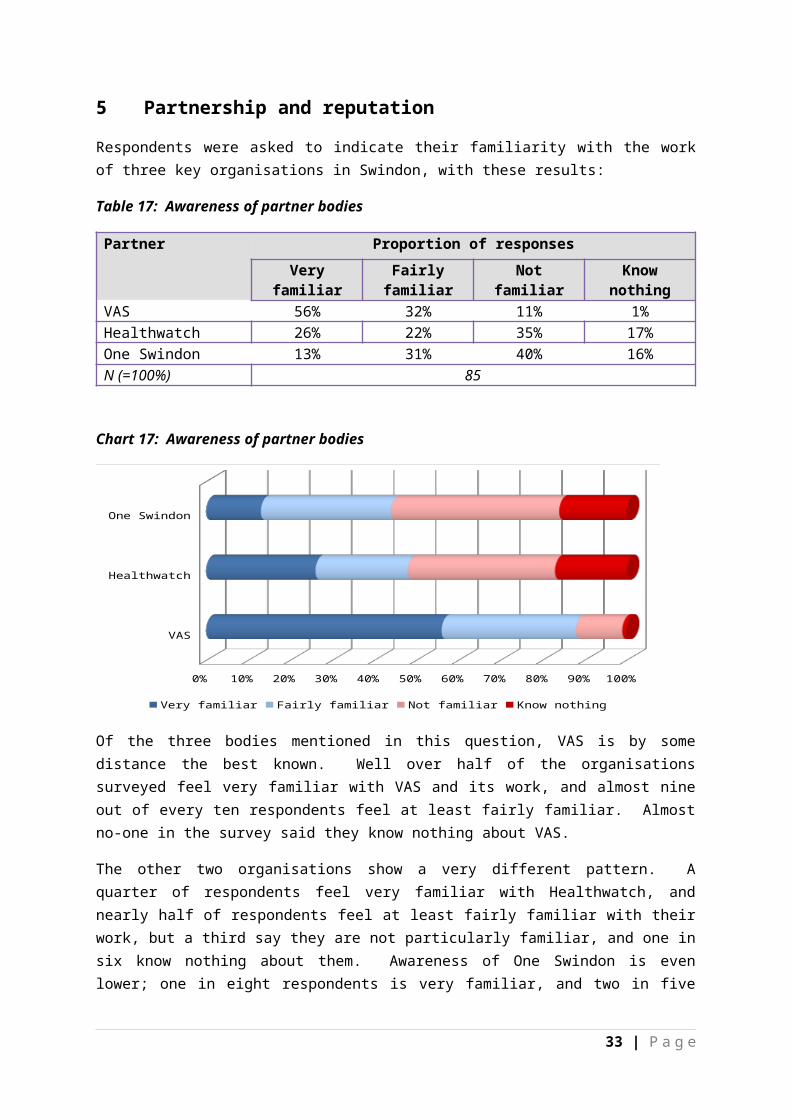
Respondents were asked to indicate their familiarity with the work of three key organisations in Swindon, with these results:
Table 17: Awareness of partner bodies
Partner Proportion of responses
Very familiar Fairly familiar Not familiar Know nothing
VAS 56% 32% 11% 1%Healthwatch 26% 22% 35% 17%One Swindon 13% 31% 40% 16%N (=100%) 85
Chart 17: Awareness of partner bodies
VAS
Healthwatch
One Swindon
0% 10% 20% 30% 40% 50% 60% 70% 80% 90% 100%
Very familiar Fairly familiar Not familiar Know nothing
Of the three bodies mentioned in this question, VAS is by some distance the best known. Well over half of the organisations surveyed feel very familiar with VAS and its work, and almost nine out of every ten respondents feel at least fairly familiar. Almost no-one in the survey said they know nothing about VAS.
The other two organisations show a very different pattern. A quarter of respondents feel very familiar with Healthwatch, and nearly half of respondents feel at least fairly familiar with their work, but a third say they are not particularly familiar, and one in six know nothing about them. Awareness of One Swindon is even lower; one in eight respondents is very familiar, and two in five are at least fairly familiar, but well over half have only a passing awareness at best, and again one in six know nothing about them.
Those bodies that are unfamiliar with the work of VAS are largely in the voluntary sports sector. Bodies that are very familiar with Healthwatch and One Swindon are concentrated among those working with the vulnerable, but also include some arts and sports bodies.
There is only limited comparability in this question with the 2013 and 2014 surveys; the questions are similar, but not identical. In 2013 two thirds of respondents said they knew
25 | P a g e
what One Swindon is, and how their organisation related to it; these proportions were lower in 2014. In this study, two-fifths say they have some degree of familiarity with the work of One Swindon. This difference could be because One Swindon has a lower profile than was the case two years ago, or because of the different nature of the response this year.
Organisations work with a range of partners, as this table shows:
Table 18: Partners
Partners Proportion of responses
Swindon Borough Council 70%VAS 42%Local schools or colleges 41%Town or Parish Councils 29%NHS 29%Wiltshire Police 27%Clinical Commissioning Group 17%Other public sector bodies 3%N(=100%) 86
Chart 18: Partners
Swindon Boro
ugh Council
VAS
Loca
l sch
ools or c
ollege
s
Town or P
arish
Councils
NHS
Wilts
hire Polic
e
Clinica
l Commiss
ioning Gro
up
Other
public se
ctor b
odies0%
10%
20%
30%
40%
50%
60%
70%
Organisations work with all the partners mentioned in the survey, but the Borough Council is by far the most significant in terms of relationship with the sector; seven out of ten voluntary bodies work with the local authority. No other partner body approaches the Council in terms of presence as a partner, although two out of five groups work with VAS.
Just over a quarter of groups work with town and parish councils, and a similar proportion with the NHS generally, although relationships with the CCG are confined to one in six organisations. Other public sector bodies mentioned include the fire service and Council-run community centres.
26 | P a g e
Those who work with VAS, with local schools and colleges and with town and parish councils range across the sector, but so too do those working with the NHS, who are by no means confined to health and care groups but also include community centres and sports activities. The CCG, in contrast, partners primarily with groups supporting the vulnerable.
Those who work with partner bodies were asked to assess their effectiveness, in terms of the partnership experience; organisations were asked only to rate those bodies they actually work with. The results have been converted into mean scores, to facilitate comparison.4
Table 19: Partner effectiveness
Partners Mean score
Wiltshire Police 1.26VAS 1.20Clinical Commissioning Group 1.13Local schools or colleges 0.89NHS 0.80Town or Parish Councils 0.75Swindon Borough Council 0.58N(=100%) Ranges from 11
to 57
Chart 19: Partner effectiveness
Wiltshire Police
VAS
Clinical Commissioning Group
Local schools or colleges
NHS
Town or Parish Councils
Swindon Borough Council
0 0.2 0.4 0.6 0.8 1 1.2 1.4
All the partners achieve a positive score, but clearly some are seen as more effective than others. The strongest positive view is of Wiltshire Police, which secured very few negative views at all; VAS is only just behind the Police, and actually achieves the highest proportion
4 Each response is assigned a value: 'Very effective' and 'fairly effective' attract scores of +2 and +1 respectively, while 'not very effective' and 'not at all effective' attract scores of -1 and -2. Neutral answers score zero, and don't knows are ignored. the resulting scores are averaged for all responses relating to the partner body, to arrive at a score between +2 and -2, indicting both the direction of opinion and its comparative strength.
27 | P a g e
of 'very effective' ratings. The CCG also achieves a strong positive score, again with few negative opinions.
Views on other bodies, whilst still positive, are more circumspect. These scores result from greater caution in the positive rating, rather than from negative ratings, apart from the Council which has a significant minority of partner bodies that are critical to a greater or lesser extent. Just one in seven bodies that work with the Council rate its partnership as 'very effective', whilst one in five partner bodies give the Council a negative rating.
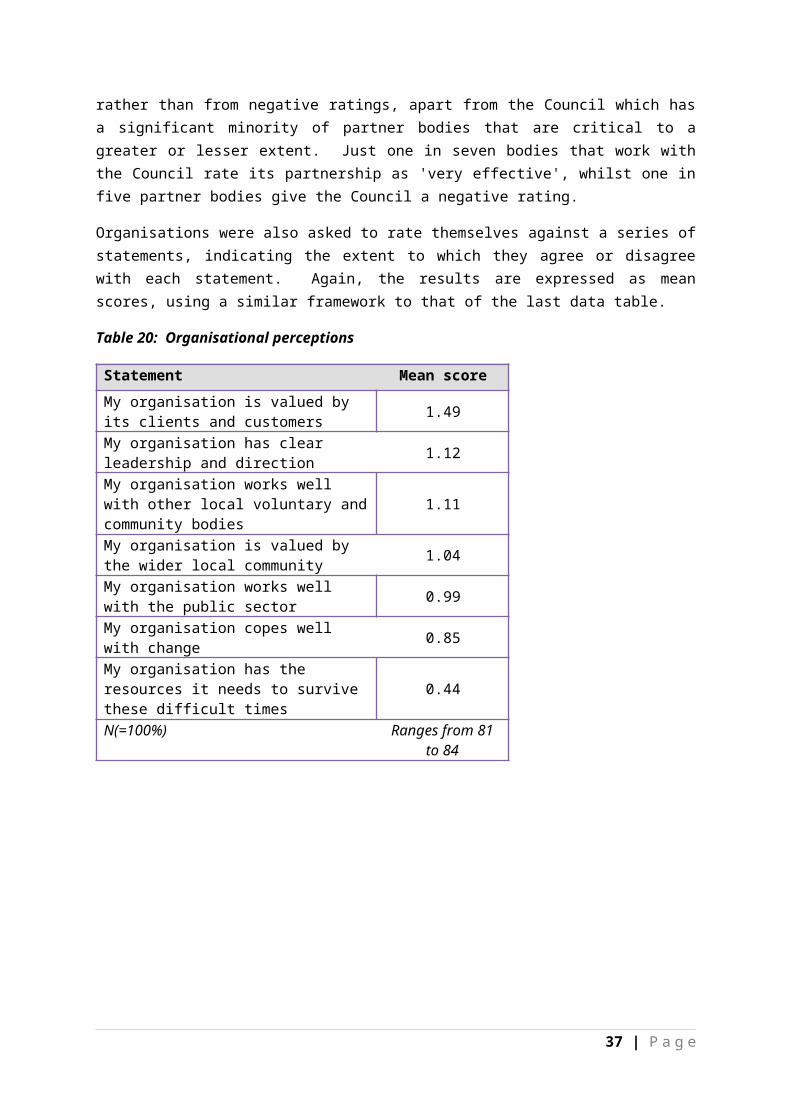
Organisations were also asked to rate themselves against a series of statements, indicating the extent to which they agree or disagree with each statement. Again, the results are expressed as mean scores, using a similar framework to that of the last data table.
Table 20: Organisational perceptions
Statement Mean score
My organisation is valued by its clients and customers 1.49
My organisation has clear leadership and direction 1.12
My organisation works well with other local voluntary and community bodies 1.11
My organisation is valued by the wider local community 1.04
My organisation works well with the public sector 0.99
My organisation copes well with change 0.85
My organisation has the resources it needs to survive these difficult times 0.44
N(=100%) Ranges from 81 to 84
28 | P a g e
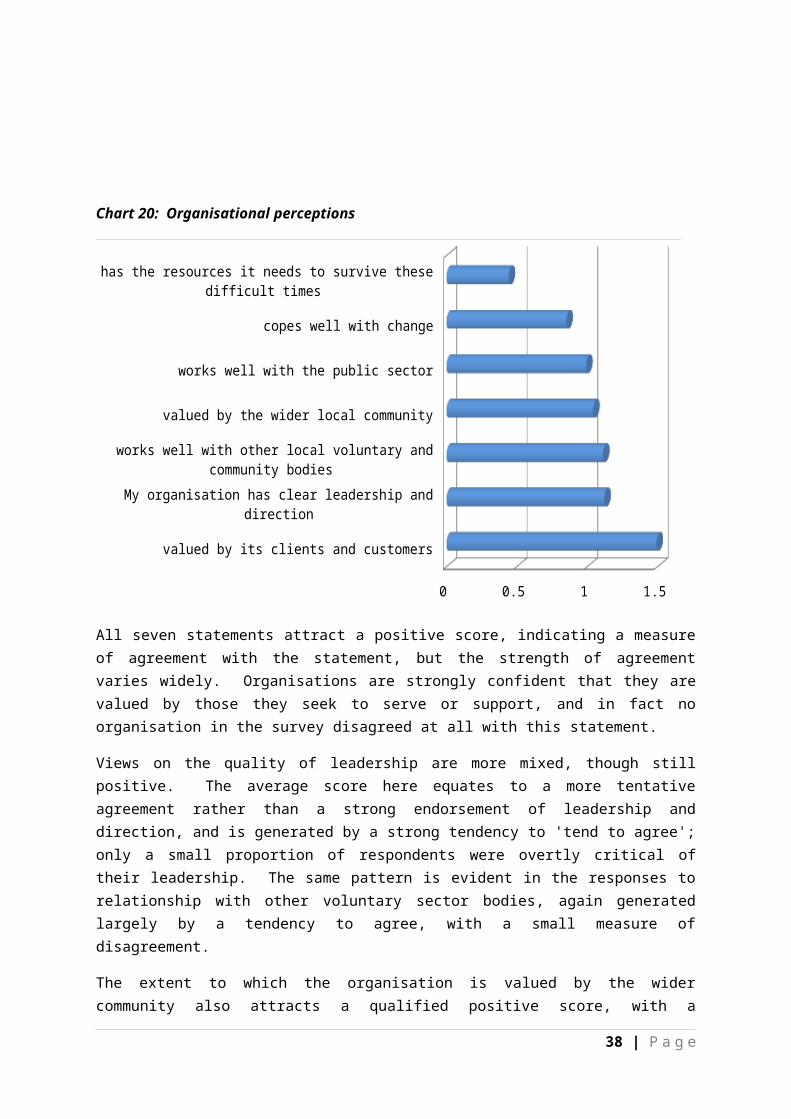
Chart 20: Organisational perceptions
valued by its clients and customers
My organisation has clear leadership and direction
works well with other local voluntary and community bodies
valued by the wider local community
works well with the public sector
copes well with change
has the resources it needs to survive these difficult times
0 0.2 0.4 0.6 0.8 1 1.2 1.4 1.6
All seven statements attract a positive score, indicating a measure of agreement with the statement, but the strength of agreement varies widely. Organisations are strongly confident that they are valued by those they seek to serve or support, and in fact no organisation in the survey disagreed at all with this statement.
Views on the quality of leadership are more mixed, though still positive. The average score here equates to a more tentative agreement rather than a strong endorsement of leadership and direction, and is generated by a strong tendency to 'tend to agree'; only a small proportion of respondents were overtly critical of their leadership. The same pattern is evident in the responses to relationship with other voluntary sector bodies, again generated largely by a tendency to agree, with a small measure of disagreement.
The extent to which the organisation is valued by the wider community also attracts a qualified positive score, with a substantial minority of people who feel neutral about this issue, suggesting that they feel the organisation is not as highly valued as it could be. The relationship with the public sector attracts a high proportion of respondents who 'tend to agree' indicating a qualified positive view that offers room for improvement, conforming the results of the previous question.
Disagreement starts to come into play in the final two assessments. A quarter of people (24%) agree strongly that their organisation copes well with change, but one in eight disagree and a similar proportion are neutral on this. Only one in ten respondents are confident that their organisation has the resources it needs to survive, and one in six disagrees, some of them strongly, suggesting that confidence is at a relatively low ebb at present in the sector.
29 | P a g e
Some of these statements were used in 2013, and this table shows the comparable mean scores from both surveys:
Table 21: Comparisons on organisational perceptions5
Statement Mean score
2015 2014 2013
My organisation is valued by its clients and customers 1.49 1.76 1.51
My organisation has clear leadership and direction 1.12 1.18 1.00
My organisation works well with other local voluntary and community bodies
1.11 1.19 1.04
My organisation is valued by the wider local community 1.04 1.02 0.75
My organisation copes well with change 0.85 1.12 1.06
N(=100%) Ranges from 81 to 84 Ranges from 49 to 51
Ranges from 63 to 70
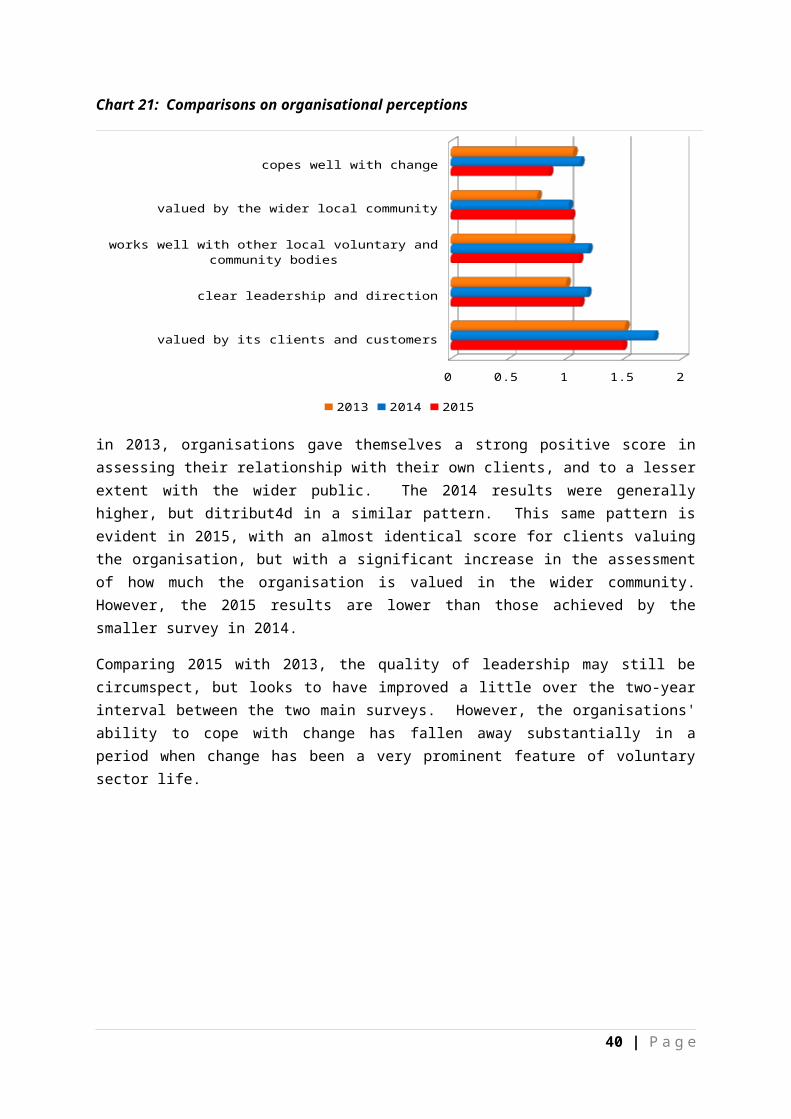
Chart 21: Comparisons on organisational perceptions
valued by its clients and customers
clear leadership and direction
works well with other local voluntary and community bodies
valued by the wider local community
copes well with change
0 0.2 0.4 0.6 0.8 1 1.2 1.4 1.6 1.8
2013 2014 2015
in 2013, organisations gave themselves a strong positive score in assessing their relationship with their own clients, and to a lesser extent with the wider public. The 2014 results were generally higher, but ditribut4d in a similar pattern. This same pattern is evident in 2015, with an almost identical score for clients valuing the organisation, but with a significant increase in the assessment of how much the organisation is valued in the wider
5 Note: the questions are not all identical, but the comparisons are reasonable. Where there is doubt, no comparison is offered.
30 | P a g e
community. However, the 2015 results are lower than those achieved by the smaller survey in 2014.
Comparing 2015 with 2013, the quality of leadership may still be circumspect, but looks to have improved a little over the two-year interval between the two main surveys. However, the organisations' ability to cope with change has fallen away substantially in a period when change has been a very prominent feature of voluntary sector life.
31 | P a g e

6 Awareness and development
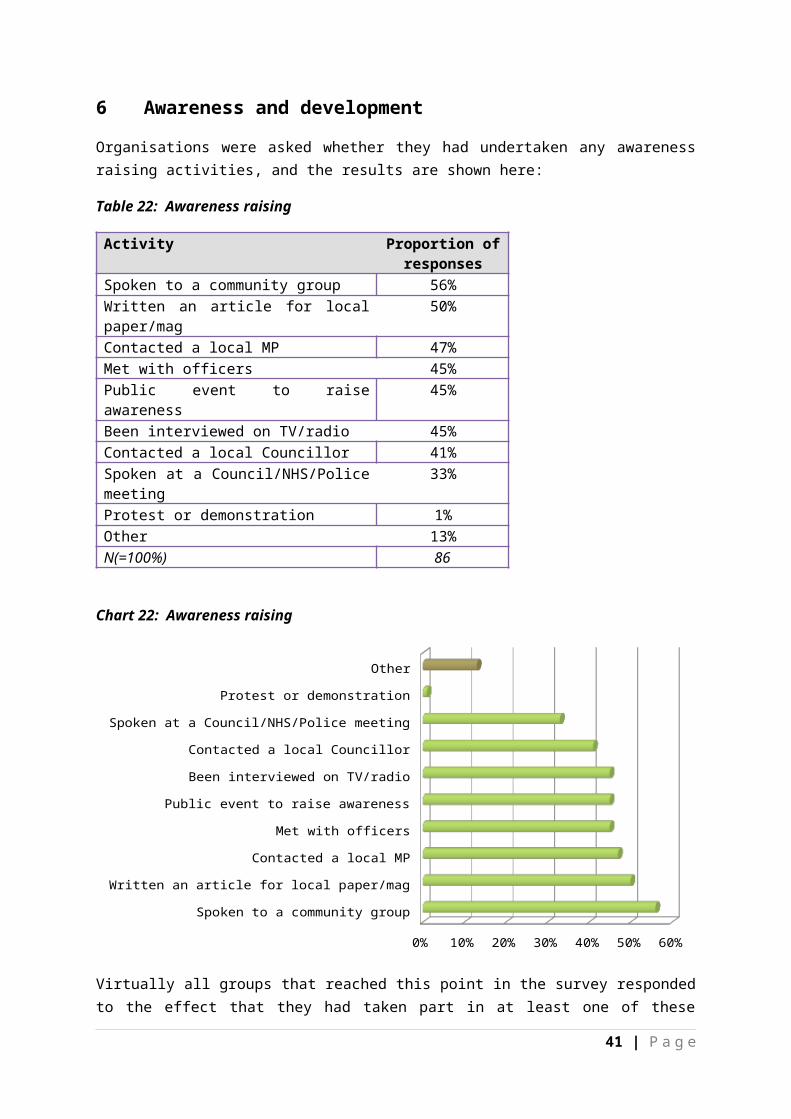
Organisations were asked whether they had undertaken any awareness raising activities, and the results are shown here:
Table 22: Awareness raising
Activity Proportion of responses
Spoken to a community group 56%Written an article for local paper/mag 50%Contacted a local MP 47%Met with officers 45%Public event to raise awareness 45%Been interviewed on TV/radio 45%Contacted a local Councillor 41%Spoken at a Council/NHS/Police meeting 33%Protest or demonstration 1%Other 13%N(=100%) 86
Chart 22: Awareness raising
Spoken to a community group
Written an article for local paper/mag
Contacted a local MP
Met with officers
Public event to raise awareness
Been interviewed on TV/radio
Contacted a local Councillor
Spoken at a Council/NHS/Police meeting
Protest or demonstration
Other
0% 10% 20% 30% 40% 50% 60%
Virtually all groups that reached this point in the survey responded to the effect that they had taken part in at least one of these activities; many groups have engaged in several of them. Well over half of all groups had spoken to community groups, and half had written something for publication in a local paper or magazine; a slightly smaller proportion had even been interviewed, during the past year, on the radio or television about their work. nearly half had held an awareness-raising public event.
Contact with representatives has also taken place: half of all groups have contacted a local MP about their work, and two in five have been in touch with a local Councillor, while nearly
32 | P a g e
half have net with the officers of a statutory body. Invitations to speak at meetings of statutory bodies are less common, and only a third of groups had done this in the past year.
There is very little participation in protests or demonstrations on the part of the local voluntary sector. Other activity includes a presence on social media, and responding to public sector consultation on service proposals.
Respondents were also asked about possible areas where their organisation could perhaps be better equipped than it is at present. The responses to this question have been assigned scores reflecting the degree to which development support is needed, with these results.6
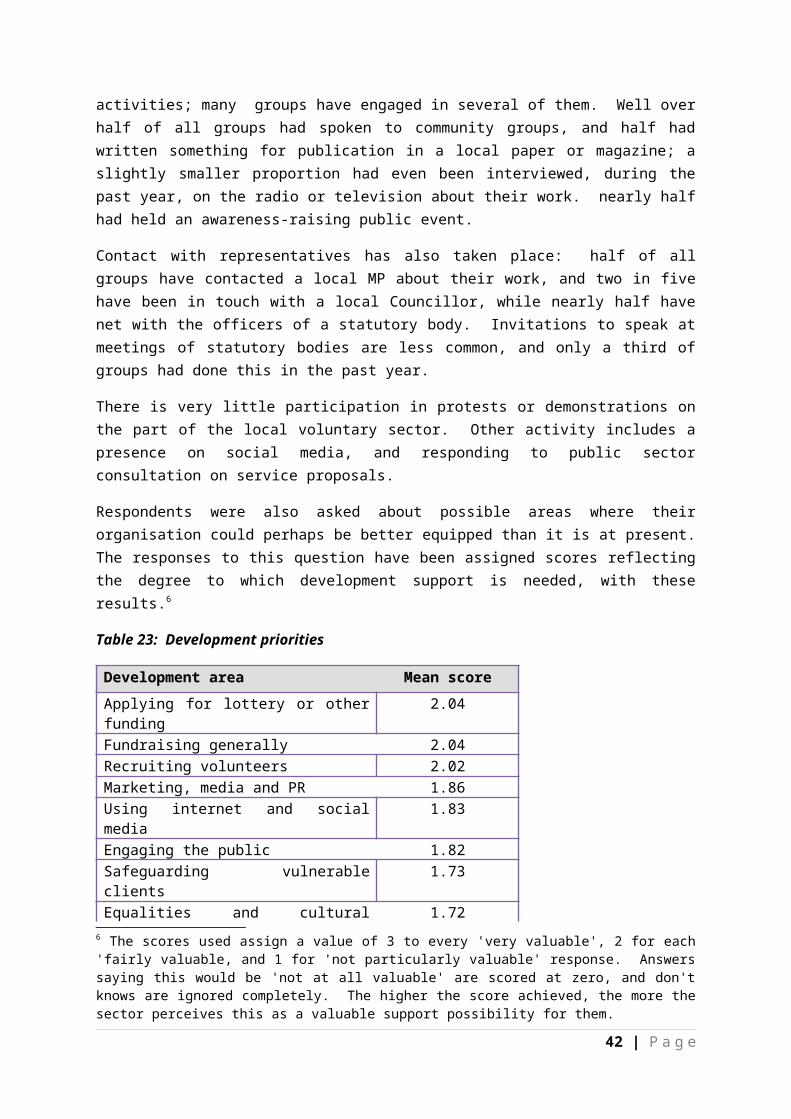
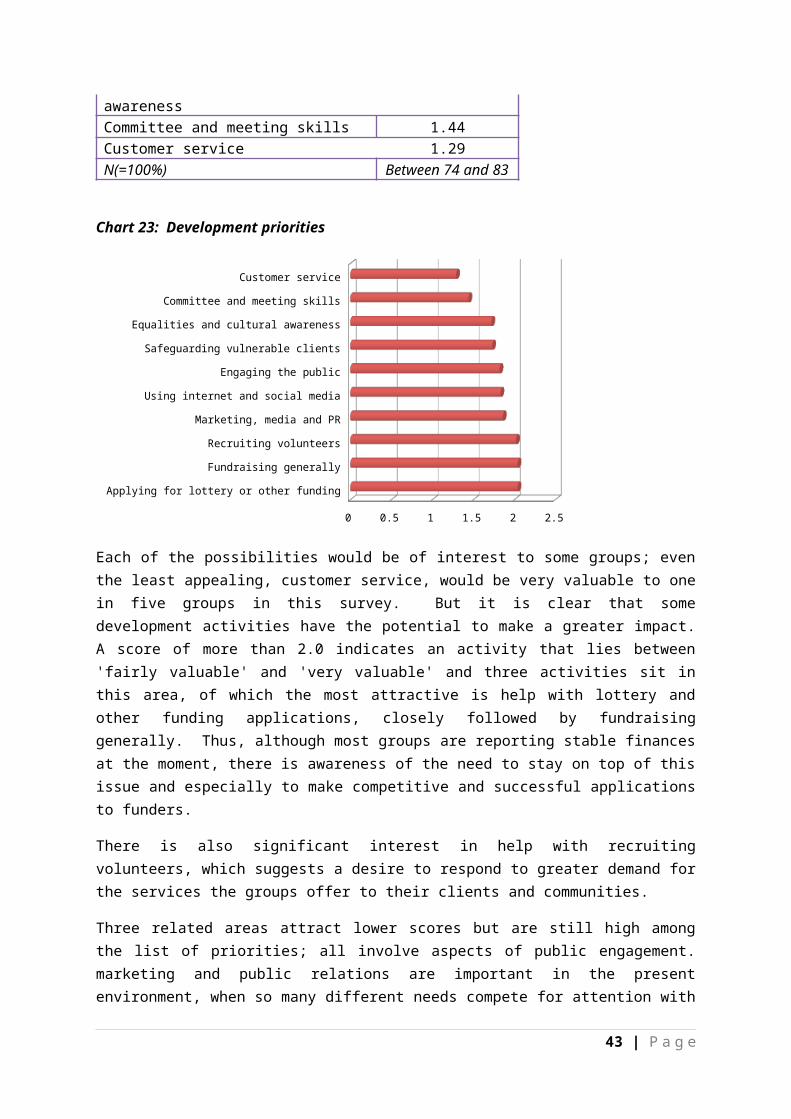
Table 23: Development priorities
Development area Mean score
Applying for lottery or other funding 2.04Fundraising generally 2.04Recruiting volunteers 2.02Marketing, media and PR 1.86Using internet and social media 1.83Engaging the public 1.82Safeguarding vulnerable clients 1.73Equalities and cultural awareness 1.72Committee and meeting skills 1.44Customer service 1.29N(=100%) Between 74 and
83
Chart 23: Development priorities
Applying for lottery or other funding
Fundraising generally
Recruiting volunteers
Marketing, media and PR
Using internet and social media
Engaging the public
Safeguarding vulnerable clients
Equalities and cultural awareness
Committee and meeting skills
Customer service
0 0.5 1 1.5 2 2.5
6 The scores used assign a value of 3 to every 'very valuable', 2 for each 'fairly valuable, and 1 for 'not particularly valuable' response. Answers saying this would be 'not at all valuable' are scored at zero, and don't knows are ignored completely. The higher the score achieved, the more the sector perceives this as a valuable support possibility for them.
33 | P a g e
Each of the possibilities would be of interest to some groups; even the least appealing, customer service, would be very valuable to one in five groups in this survey. But it is clear that some development activities have the potential to make a greater impact. A score of more than 2.0 indicates an activity that lies between 'fairly valuable' and 'very valuable' and three activities sit in this area, of which the most attractive is help with lottery and other funding applications, closely followed by fundraising generally. Thus, although most groups are reporting stable finances at the moment, there is awareness of the need to stay on top of this issue and especially to make competitive and successful applications to funders.
There is also significant interest in help with recruiting volunteers, which suggests a desire to respond to greater demand for the services the groups offer to their clients and communities.
Three related areas attract lower scores but are still high among the list of priorities; all involve aspects of public engagement. marketing and public relations are important in the present environment, when so many different needs compete for attention with people's busy lives, and there appears to be scope for expanding the sector's use of both the web and especially social media, especially as a bridge to younger members of their potential audience.
Help with clients is a lower priority, both in terms of safeguarding the vulnerable and in customer service generally; organisations also see only a limited role for help with committee skills, which attracts a score that suggests a fairly ambivalent view of the need for support in this area.
Organisations were asked about other training they might find helpful, and a limited number of possibilities are identified. they include succession planning, to help with the transfer of responsibilities from an experienced but ageing group of trustees to a younger but less experienced group; trustee training generally; help with partnership building; help in collecting and interpreting data for reporting to contract managers and the like; and health and safety training. A few groups can access specialist training within their own national structures and see little need for help from VAS.
The categories used this year differ from those used in 2013, but an assessment of skills in the earlier survey highlighted the relative weakness of the sector in fundraising and in aspects of marketing and promotion, both of the organisation and its wider cause.7 These issues remain dominant in the 2015 survey, with funding taking a more prominent position in organisations' development needs. In 2013, organisations identified VAS as the best placed body to give this support and advice, alongside the Charities' Information Bureau and the Borough Council; they felt reasonably well supported in these areas, but with room for improvement. Issues of safeguarding, management and governance were not highlighted as weaknesses in 2013 and remain a lower priority for development this year; these are areas where organisations also felt well supported in the previous survey.
Asked about how well they are responding to different challenges at the moment, groups respond thus:
7 The 2014 responses have not been analysed and cannot be compared.
34 | P a g e
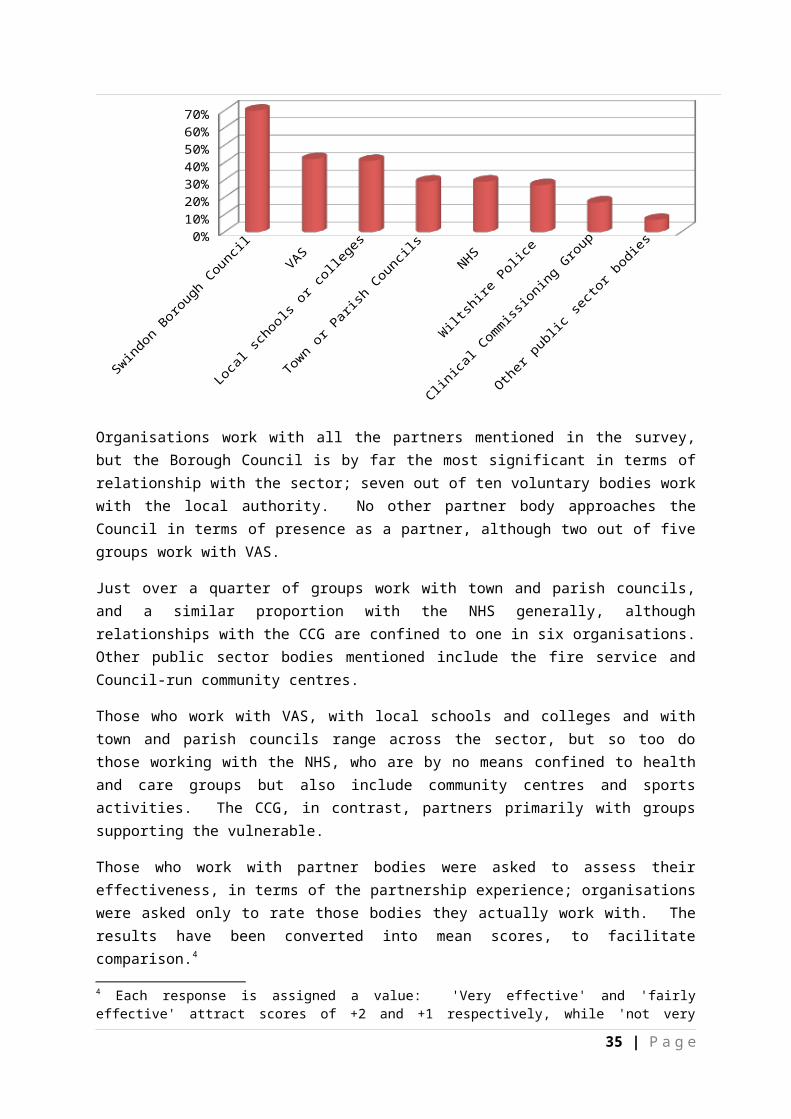
Table 24: Main challenges
Challenge Proportion of responses
Struggling Coping Not a challenge
Recruiting leaders 38% 41% 21%Recruiting new volunteers 32% 43% 25%Public engagement 26% 56% 18%Raising money 22% 58% 20%Publicity and promotion 19% 49% 32%Responding to demand for service 15% 49% 36%Finding suitable affordable premises 13% 26% 61%Training new volunteers 12% 42% 46%Legal obligations, policies 4% 36% 60%Managing premises and facilities 4% 29% 67%N(=100%) Ranges from 78 to 84
Chart 24: Main challenges
Recruiting leaders
Recruiting new volunteers
Public engagement
Raising money
Publicity and promotion
Responding to demand for service
Finding suitable affordable premises
Training new volunteers
Legal obligations, policies
Managing premises and facilities
0% 10% 20% 30% 40% 50% 60% 70% 80% 90% 100%
Struggling Coping Not a challenge
Each of these issues presents a challenge to at least some of the groups in the survey, but some are clearly more relevant generally while others are limited to a smaller proportion of the sector. The biggest challenges are recruiting new leaders and new volunteers; two in five groups admit that they are struggling with finding new leadership, and only one in five say this is not a challenge for them, while a third struggle to find new volunteers and a quarter say it is not an issue for them.
Public engagement is another area where groups admit they struggle; a quarter say they are struggling with this, and just one in five say it is not a challenge at all; over half say it's a
35 | P a g e

challenge they're dealing with. Raising money also presents a challenge to one in five groups; only one in five feel this is not an issue for them.
Areas which groups feel largely in control of include premises management, and meeting their legal obligations and policy issues. Training new volunteers also presents as an issue of limited significance; the challenge is in recruitment rather than training.
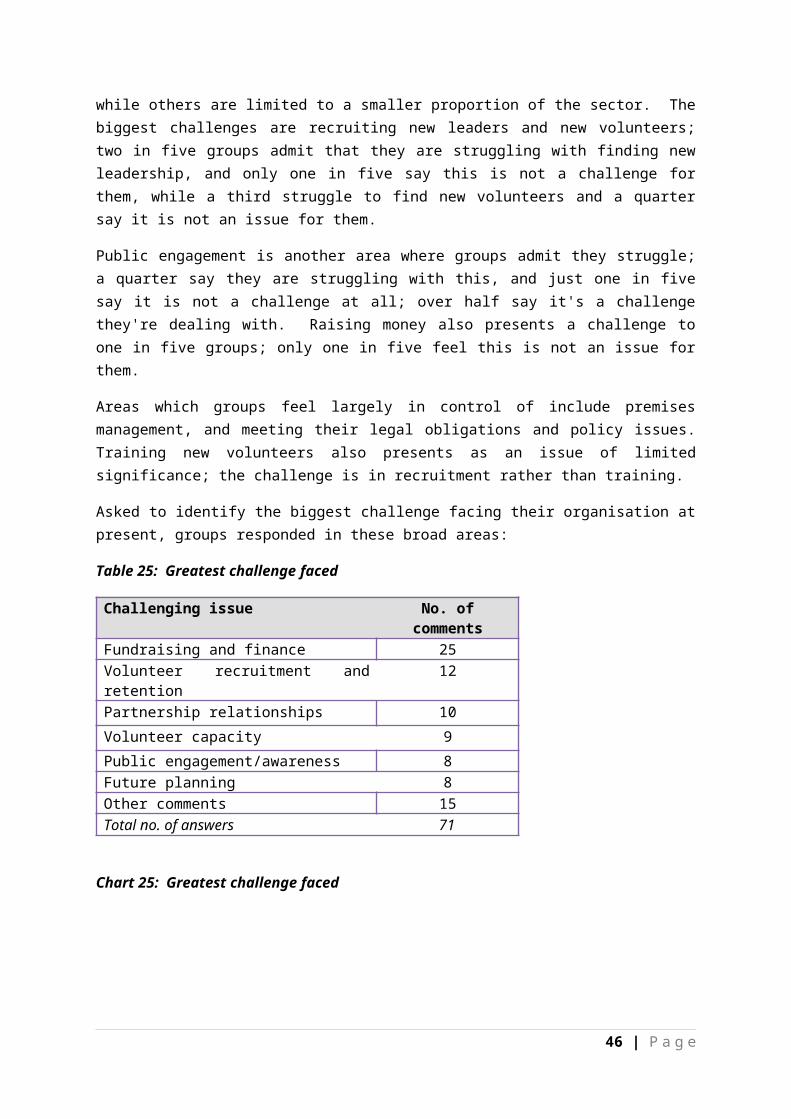
Asked to identify the biggest challenge facing their organisation at present, groups responded in these broad areas:
Table 25: Greatest challenge faced
Challenging issue No. of comments
Fundraising and finance 25Volunteer recruitment and retention 12Partnership relationships 10
Volunteer capacity 9
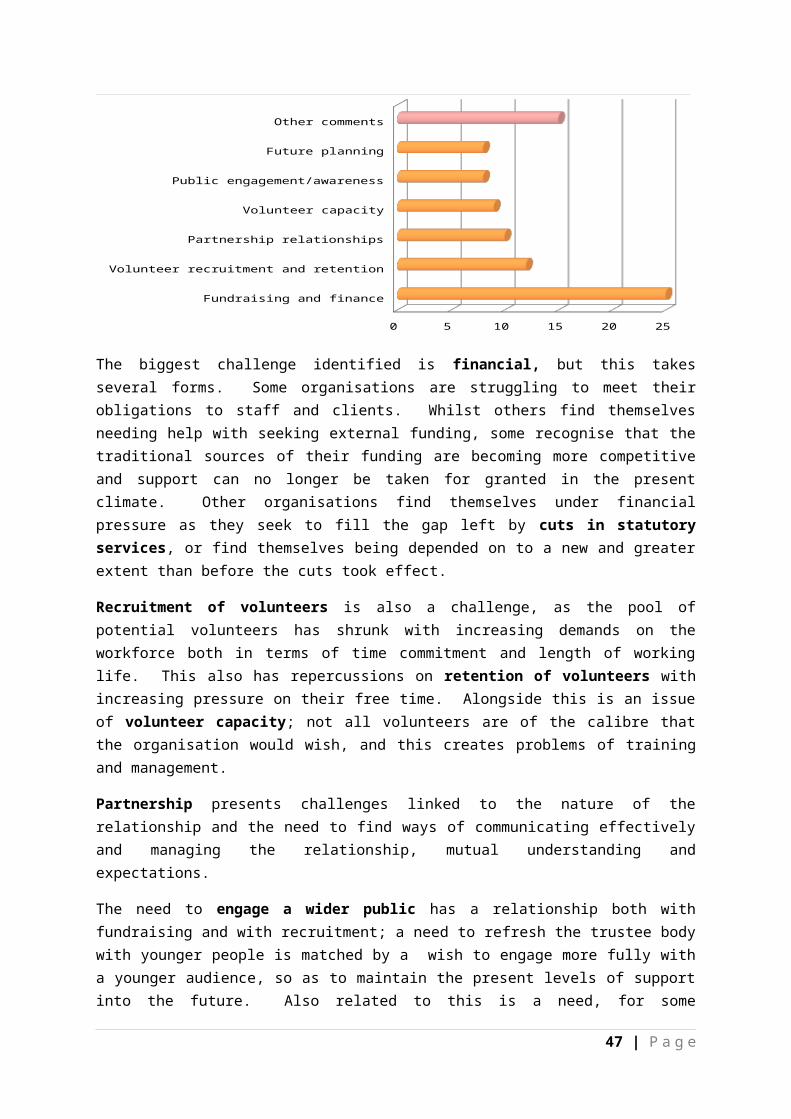
Public engagement/awareness 8Future planning 8Other comments 15Total no. of answers 71
Chart 25: Greatest challenge faced
Fundraising and finance
Volunteer recruitment and retention
Partnership relationships
Volunteer capacity
Public engagement/awareness
Future planning
Other comments
0 5 10 15 20 25
The biggest challenge identified is financial, but this takes several forms. Some organisations are struggling to meet their obligations to staff and clients. Whilst others find themselves needing help with seeking external funding, some recognise that the traditional sources of their funding are becoming more competitive and support can no longer be taken for granted in the present climate. Other organisations find themselves under financial pressure as they seek to fill the gap left by cuts in statutory services, or find themselves being depended on to a new and greater extent than before the cuts took effect.
Recruitment of volunteers is also a challenge, as the pool of potential volunteers has shrunk with increasing demands on the workforce both in terms of time commitment and
36 | P a g e
length of working life. This also has repercussions on retention of volunteers with increasing pressure on their free time. Alongside this is an issue of volunteer capacity; not all volunteers are of the calibre that the organisation would wish, and this creates problems of training and management.
Partnership presents challenges linked to the nature of the relationship and the need to find ways of communicating effectively and managing the relationship, mutual understanding and expectations.
The need to engage a wider public has a relationship both with fundraising and with recruitment; a need to refresh the trustee body with younger people is matched by a wish to engage more fully with a younger audience, so as to maintain the present levels of support into the future. Also related to this is a need, for some organisations at least, to plan for the future, whether that involves expansion or contraction; at least two organisations face challenges linked to expansion.
Other issues raised here include (surprisingly) a need to attract new beneficiaries, though this is largely a problem faced by voluntary sports clubs, affected both by ageing participants and changes in the popularity of different sports. There are also challenges of time and personal availability for those who feel their organisation is over-dependent on their commitment, and one person raises immigration as a challenge, without explaining further.
These challenges are very similar to those presented in 2013, when financial issues and volunteer recruitment were again the big issues, and when there were similar questions about capability and capacity within the organisation.8 One major difference is the raised profile of public engagement, suggesting that awareness of the need to relate more effectively to the public at large is something groups are increasingly aware of. On the other hand, few organisations seem to feel undervalued to the same extent as was the case previously.
8 The 2014 results have not been analysed and cannot therefore be compared.
37 | P a g e
Appendix 1: Organisations responding to the survey
Abbeyfieldabc affected by cancerBadmintonbereavementBig Breakfast +BIOSBlunsdon St Andrew Parish CouncilBritish Heart FoundationBritish Lung FoundationCCINChildren and adults with learning/physical disabilities .ChurchChurch of EnglandClub, League & County NetballCommunity FirstCounty Ground Bowls ClubCRICruse Bereavement CareCubsEastcott Community OrganisationFootball clubFriends of Swindon Young MusiciansFriends of the Railway PathHarbour Project HeadwayHealthwatch SwindonHighworth Community AssociationHighworth Community Partnership GroupHorseshoe Amateur Boxing ClubInner FlameLawn Community CentreMotor Neurone Disease AssociationMuseum of ComputingNo Added SugarOlive Tree CafeOpen DoorOver 65sParkinson's UK Swindon & District BranchParks Volunteer Resource & Retail OutletPenhill ForumPhoenix EnterprisesPinehurst Initiative ForumPinetrees Community Centre AssociationProspect HospicePunjabi Event Club SwindonQueen's Park CommunityRoyal British Legion/ ScoutsSalvation ArmySanfordlink TTCScoutsScouts 2nd SwindonService User Network Swindon (SUNS)
38 | P a g e

Slinn Allstars running clubSovereign Housing AssociationSpecial Olympics SwindonSplash WiltshireStanton Fitzwarren Parish CouncilStratton Churchway Bowls Club Swindon & District Talking Newspaper AssociationSwindon 10 to 18 Project (STEP)Swindon Black History GroupSwindon Carers CentreSwindon Churches TogetherSwindon Civic VoiceSwindon Croquet ClubSwindon Dial A RideSwindon Down's Syndrome GroupSwindon Equality GroupSwindon Hockey ClubSwindon Indian AssociationSwindon MelaSwindon Old Town FestivalSwindon Pegasus brassSwindon Puja GroupSwindon RestoreSwindon shin splintsSwindon Shock BasketballSwindon SocietySwindon Softball LeagueSwindon Sports ForumSwindon Tamil AssociationSwindon Therapy CentreTable Tennis Clubs and LeaguesTech4DTerrence Higgins TrustThreshold Housing LinkTWIGS Community GardenVictim SupportVision 4 WroughtonVoluntary Action SwindonVolunteer Centre SwindonWessex Squash ClubWestlecot Bowls ClubWillows Counselling ServiceWilts & Berks Canal TrustWiltshire Bobby Van TrustWiltshire Community FoundationWiltshire Family History SocietyWiltshire Fire & Rescue ServiceWiltshire Law centreWiltshire SightWroughton Folk Dance ClubYouth Action WiltshireZurich Community Trust
39 | P a g e
Appendix 2: Questionnaire
40 | P a g e
41 | P a g e
42 | P a g e
43 | P a g e
44 | P a g e

45 | P a g e
46 | P a g e
47 | P a g e
48 | P a g e
49 | P a g e
50 | P a g e


![INDEX [tubs.exceed-swindon.org]tubs.exceed-swindon.org/wp-content/uploads/2016/11/ppt_ss_2016_… · CONSTRUCTED WETLAND FOCUSING ON ORGANIC MATTER AND NITROGEN REMOVAL Vitor Cano](https://img.pdfslide.us/doc/110x75/60065ac5f3687d4d706c6cbc/index-tubsexceed-tubsexceed-constructed-wetland-focusing-on-organic-matter.jpg)