Embed Size (px)
Citation preview
27th Aug, 2010
Indian Software Product Markets,
VAS Offerings: Some Insights
This presentation is based on both publicly available data and interviews of key players in the
industry. Browne & Mohan takes no responsibility for any incorrect information supplied to us
by ISV, product vendors or users.
Browne & Mohan reports are limited publications containing valuable insights for CEO, policy
makers and analysts. Academic institutions (including Open Universities in UK and others) are
restricted from distributing this presentation as background material for any course work
without formal approval. Furthermore, no part may be reproduced, stored in a retrieval system,
or transmitted in any form or by any means, electronic, mechanical, photocopying, recording, or
otherwise, without the permission of Browne & Mohan.
Disclaimer
© Browne & Mohan, 2009

1
2 Indian Software Industry
3 VAS Product companies
Background
Content
4 Conclusions
Background
India has emerged as a major player in software services and
development. Most of the world‟s leading software companies have
established their subsidiaries and R&D centers in the country.
From self-doubt and bureaucratic apathy, they have grown in revenues,
stature and acquiring companies in India and abroad.
The number of software product firms is on the rise and is expected to
contribute to the economy through increased employment generation
and intellectual wealth creation. Their multiplier effect on augmenting
industrial growth and increased entrepreneurial activities are a few of
the compelling factors that warrant a focused study of this sector.
1
1
2 Indian Software Industry
3 VAS Product companies
Background
Content
4 Conclusions
© Browne & Mohan, 2009
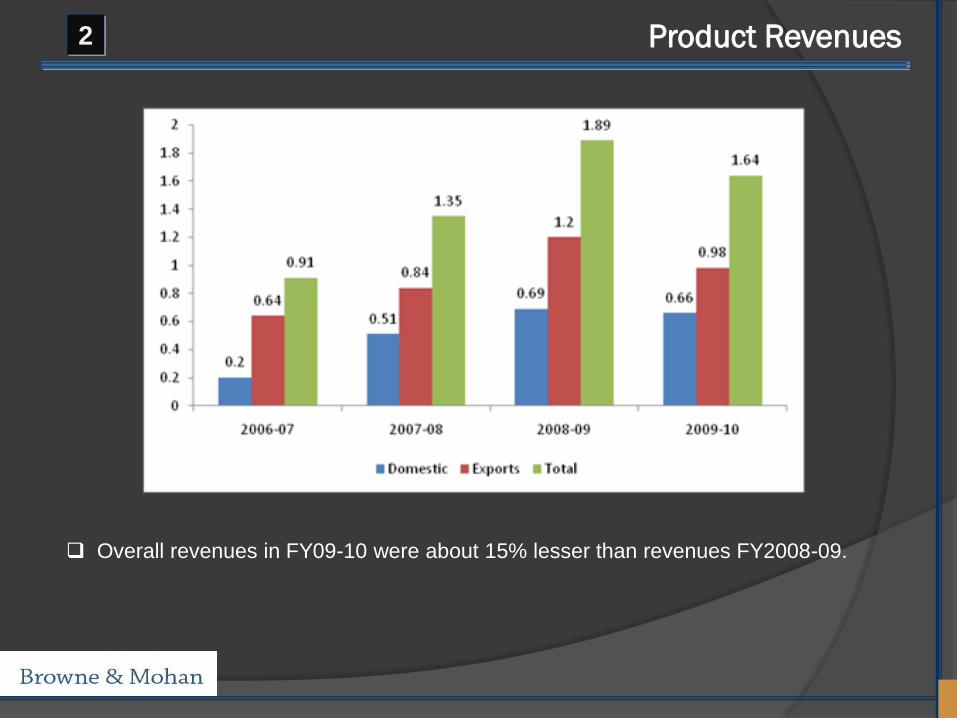
Product Revenues2
Overall revenues in FY09-10 were about 15% lesser than revenues FY2008-09.
© Browne & Mohan, 2009
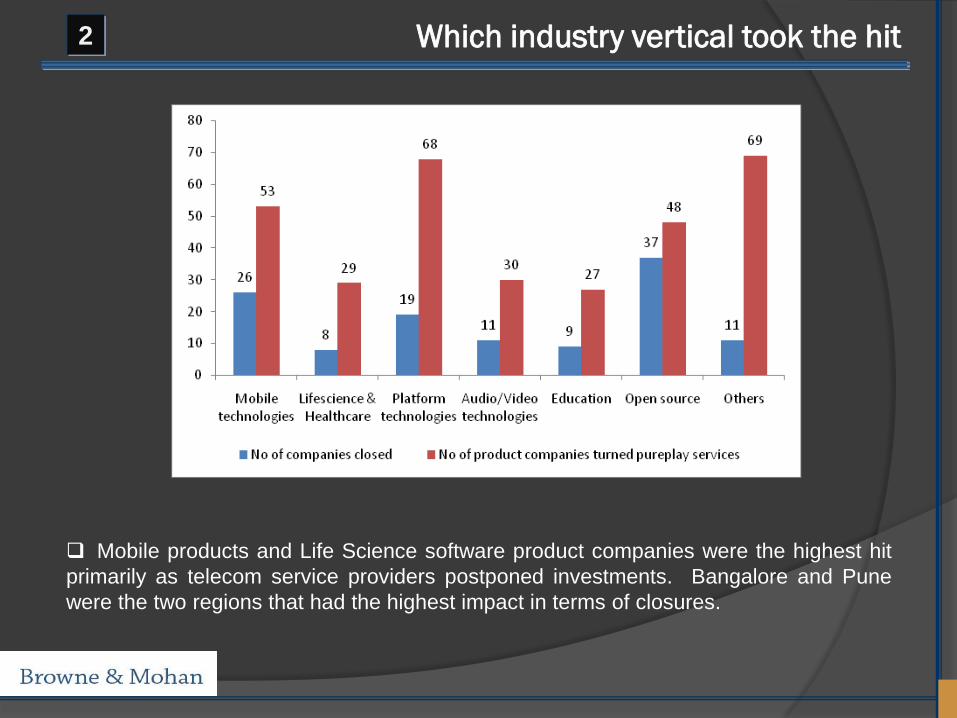
Which industry vertical took the hit2
Mobile products and Life Science software product companies were the highest hit
primarily as telecom service providers postponed investments. Bangalore and Pune
were the two regions that had the highest impact in terms of closures.

© Browne & Mohan, 2009
Is Geographical focus changing 2
Compared to FY2008-10, revenue contributions from geographies such as North America,
Europe and APAC dropped significantly, while Middle East revenues grew in FY2009-10.
Egypt, Qatar, Oman and Saudi Arabia became hot destination for product companies.
Polaris, Nucleus, Newgen, continued to benefit from multi-country approach.

1
2 Indian Software Industry
3 VAS Product companies
Background
Content
4 Conclusions
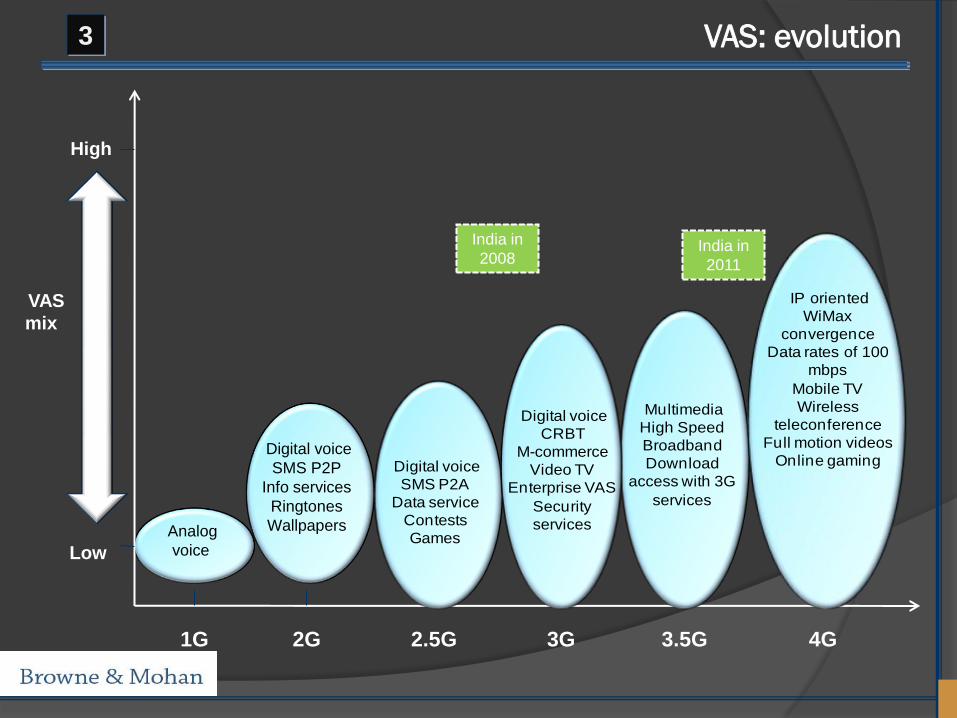
Low
Analog
voice
Digital voice
SMS P2P
Info services
Ringtones
Wallpapers
1G 2G 2.5G 3G 3.5G 4G
India in
2008
High
VAS
mix
India in
2011
Digital voice
SMS P2A
Data service
Contests
Games
Digital voice
CRBT
M-commerce
Video TV
Enterprise VAS
Security
services
Multimedia
High Speed
Broadband
Download
access with 3G
services
IP oriented
WiMax
convergence
Data rates of 100
mbps
Mobile TV
Wireless
teleconference
Full motion videos
Online gaming
VAS: evolution3
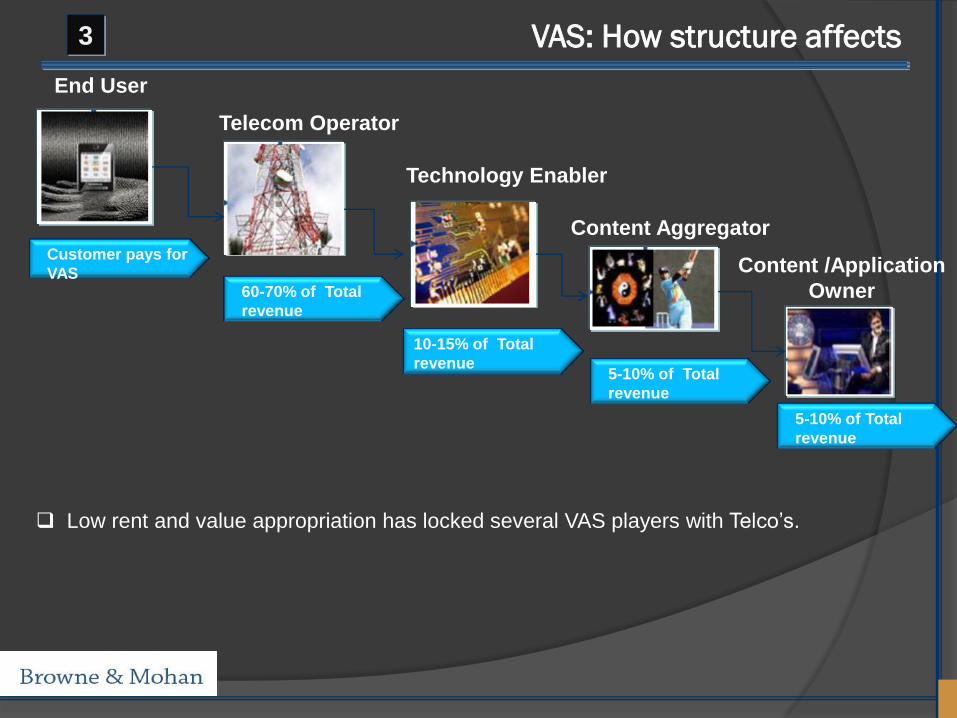
Customer pays for
VAS
Telecom Operator
Technology Enabler
Content Aggregator
Content /Application
Owner60-70% of Total
revenue
10-15% of Total
revenue5-10% of Total
revenue
5-10% of Total
revenue
End User
VAS: How structure affects 3
Low rent and value appropriation has locked several VAS players with Telco‟s.
© Browne & Mohan, 2009
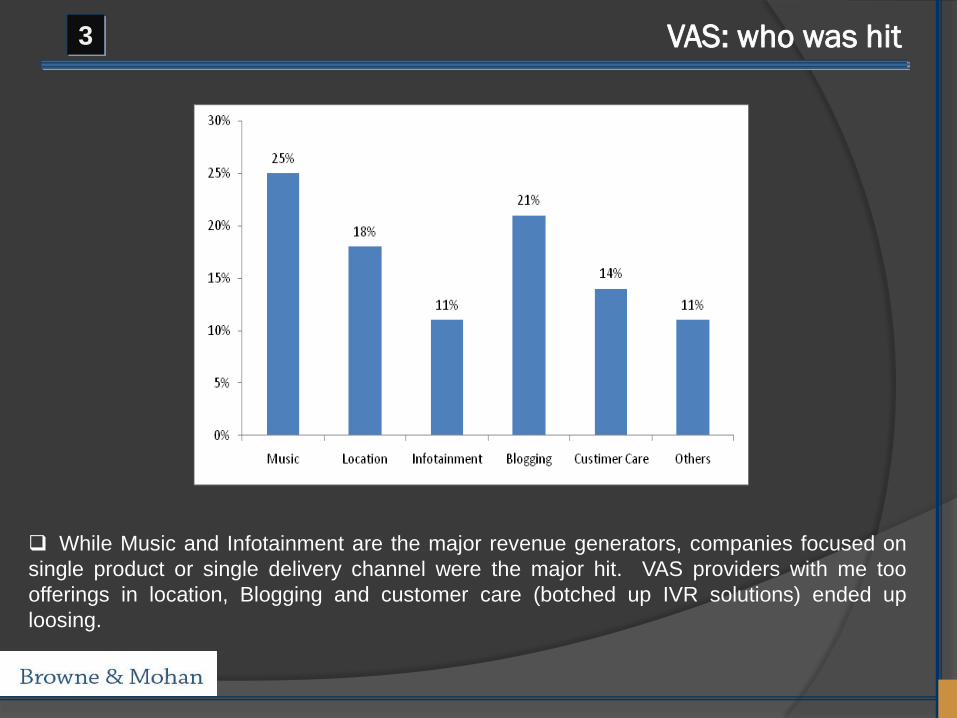
VAS: who was hit3
While Music and Infotainment are the major revenue generators, companies focused on
single product or single delivery channel were the major hit. VAS providers with me too
offerings in location, Blogging and customer care (botched up IVR solutions) ended up
loosing.
Major reasons for VAS Companies failures:
Single product, single vendor
Few applications with no common platform
Content aggregation
Built business around WAP or downloads
Why VAS firms failed3
Successful VAS strategies:
Platform play: Onmobile, Apalaya, MobME, One97
Focused on large customer base
Sticky Entertainment or Gaming experiences
Independent of Operators: Indiagames, Games2Win, Cellcast
VAS Successful companies3

1
2 Indian Software Industry
3 VAS Product companies
Background
Content
4 Conclusions
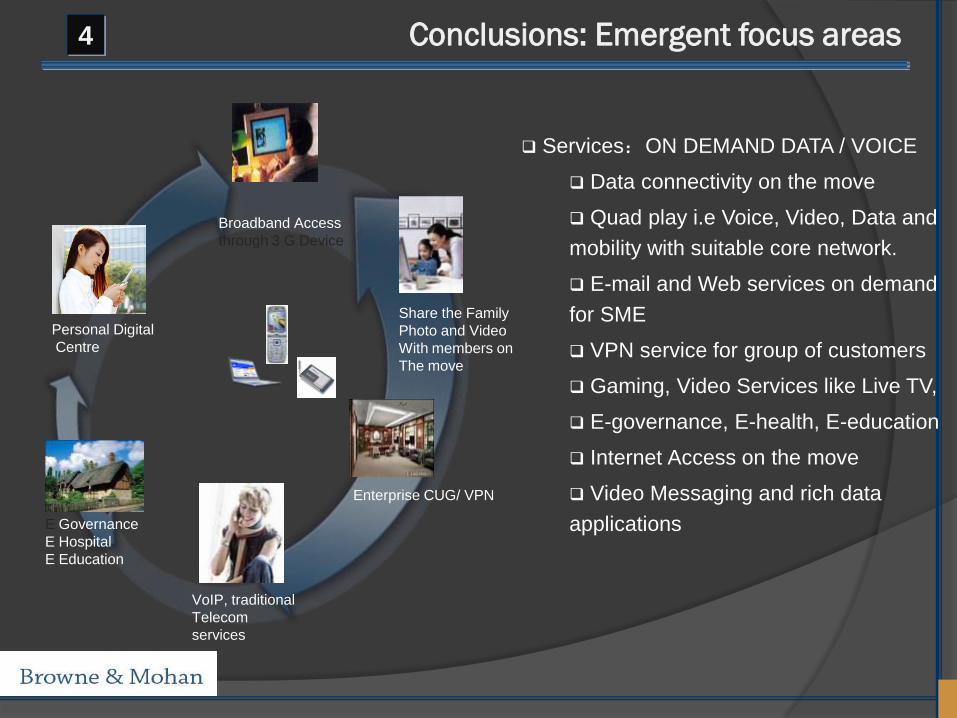
Services:ON DEMAND DATA / VOICE
Data connectivity on the move
Quad play i.e Voice, Video, Data and
mobility with suitable core network.
E-mail and Web services on demand
for SME
VPN service for group of customers
Gaming, Video Services like Live TV,
E-governance, E-health, E-education
Internet Access on the move
Video Messaging and rich data
applications
Personal Digital
Centre
Broadband Access
through 3 G Device
Share the Family
Photo and Video
With members on
The move
E Governance
E Hospital
E Education
VoIP, traditional
Telecom
services
Enterprise CUG/ VPN
4 Conclusions: Emergent focus areas
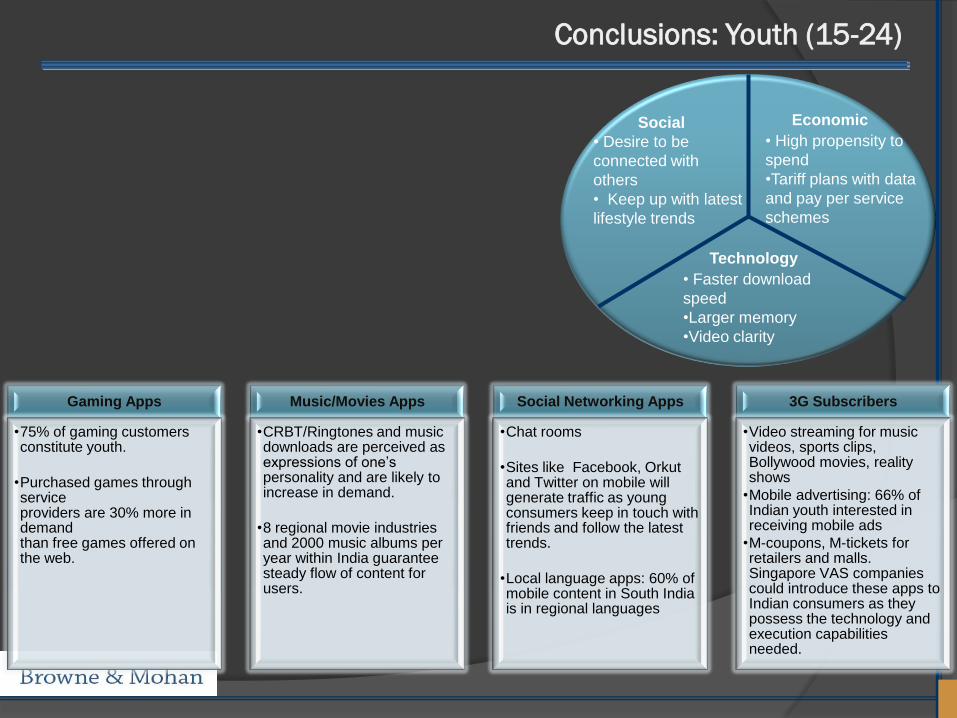
Gaming Apps
•75% of gaming customers constitute youth.
•Purchased games through service providers are 30% more in demand than free games offered on the web.
Music/Movies Apps
•CRBT/Ringtones and music downloads are perceived as expressions of one‟s personality and are likely to increase in demand.
•8 regional movie industries and 2000 music albums per year within India guarantee steady flow of content for users.
Social Networking Apps
•Chat rooms
•Sites like Facebook, Orkutand Twitter on mobile will generate traffic as young consumers keep in touch with friends and follow the latest trends.
•Local language apps: 60% of mobile content in South India is in regional languages
3G Subscribers
•Video streaming for music videos, sports clips, Bollywood movies, reality shows
•Mobile advertising: 66% of Indian youth interested in receiving mobile ads
•M-coupons, M-tickets for retailers and malls. Singapore VAS companies could introduce these apps to Indian consumers as they possess the technology and execution capabilities needed.
Technology
• Faster download
speed
•Larger memory
•Video clarity
Social
• Desire to be
connected with
others
• Keep up with latest
lifestyle trends
Economic
• High propensity to
spend
•Tariff plans with data
and pay per service
schemes
Conclusions: Youth (15-24)
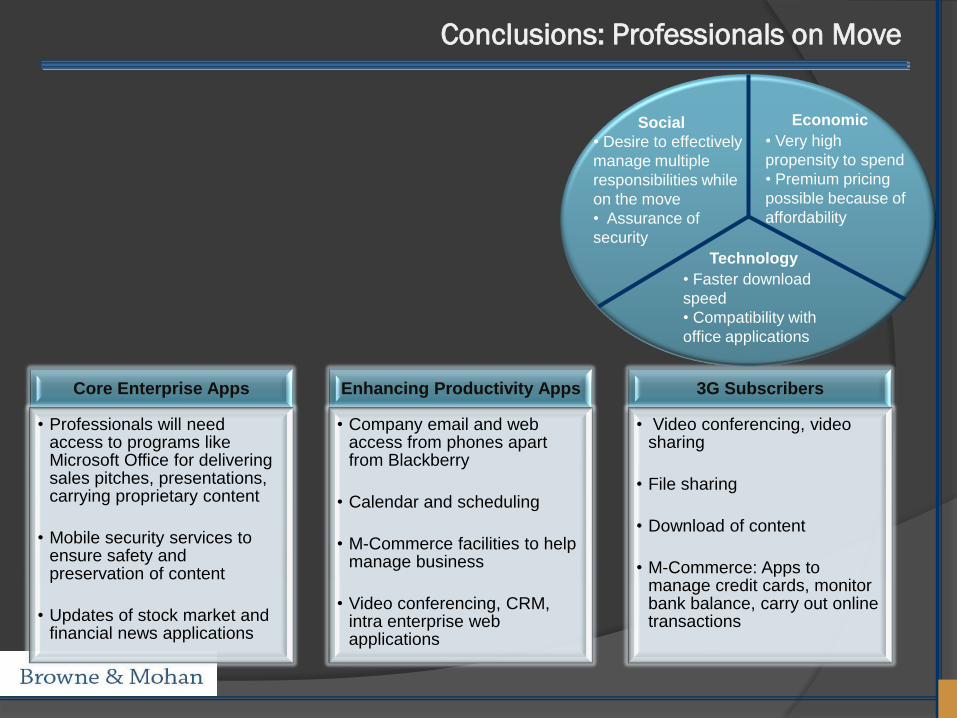
Core Enterprise Apps
• Professionals will need access to programs like Microsoft Office for delivering sales pitches, presentations, carrying proprietary content
• Mobile security services to ensure safety and preservation of content
• Updates of stock market and financial news applications
Enhancing Productivity Apps
• Company email and web access from phones apart from Blackberry
• Calendar and scheduling
• M-Commerce facilities to help manage business
• Video conferencing, CRM, intra enterprise web applications
3G Subscribers
• Video conferencing, video sharing
• File sharing
• Download of content
• M-Commerce: Apps to manage credit cards, monitor bank balance, carry out online transactions
Social Economic
TechnologyTechnology
• Faster download
speed
• Compatibility with
office applications
Social
• Desire to effectively
manage multiple
responsibilities while
on the move
• Assurance of
security
Economic
• Very high
propensity to spend
• Premium pricing
possible because of
affordability
Conclusions: Professionals on Move
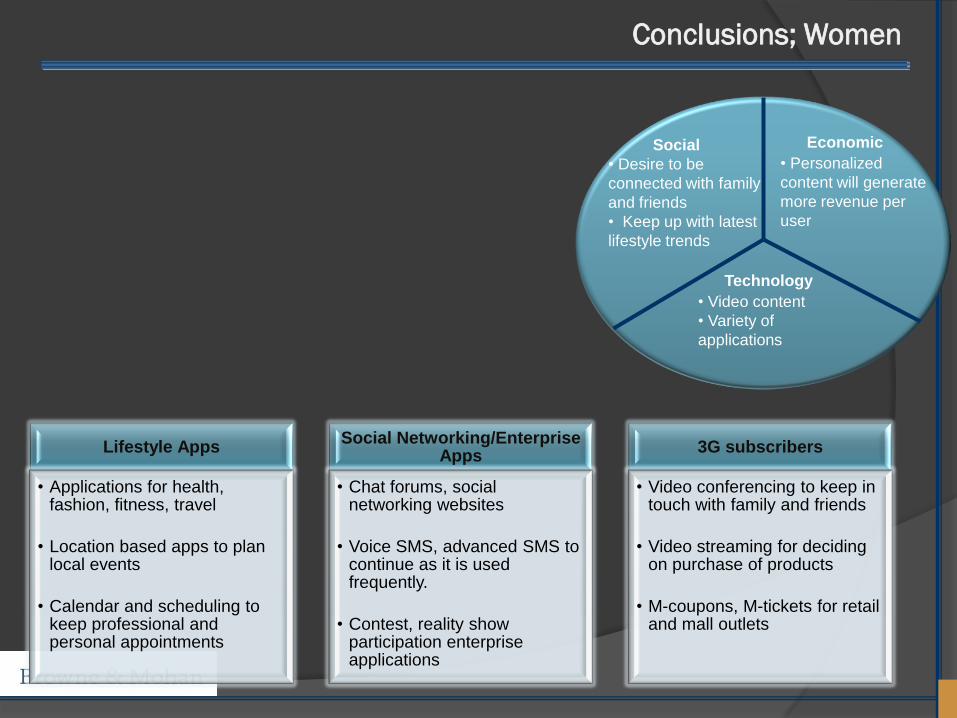
Lifestyle Apps
• Applications for health, fashion, fitness, travel
• Location based apps to plan local events
• Calendar and scheduling to keep professional and personal appointments
Social Networking/Enterprise Apps
• Chat forums, social networking websites
• Voice SMS, advanced SMS to continue as it is used frequently.
• Contest, reality show participation enterprise applications
3G subscribers
• Video conferencing to keep in touch with family and friends
• Video streaming for deciding on purchase of products
• M-coupons, M-tickets for retail and mall outlets
Technology
• Video content
• Variety of
applications
Social
• Desire to be
connected with family
and friends
• Keep up with latest
lifestyle trends
Economic
• Personalized
content will generate
more revenue per
user
Conclusions; Women
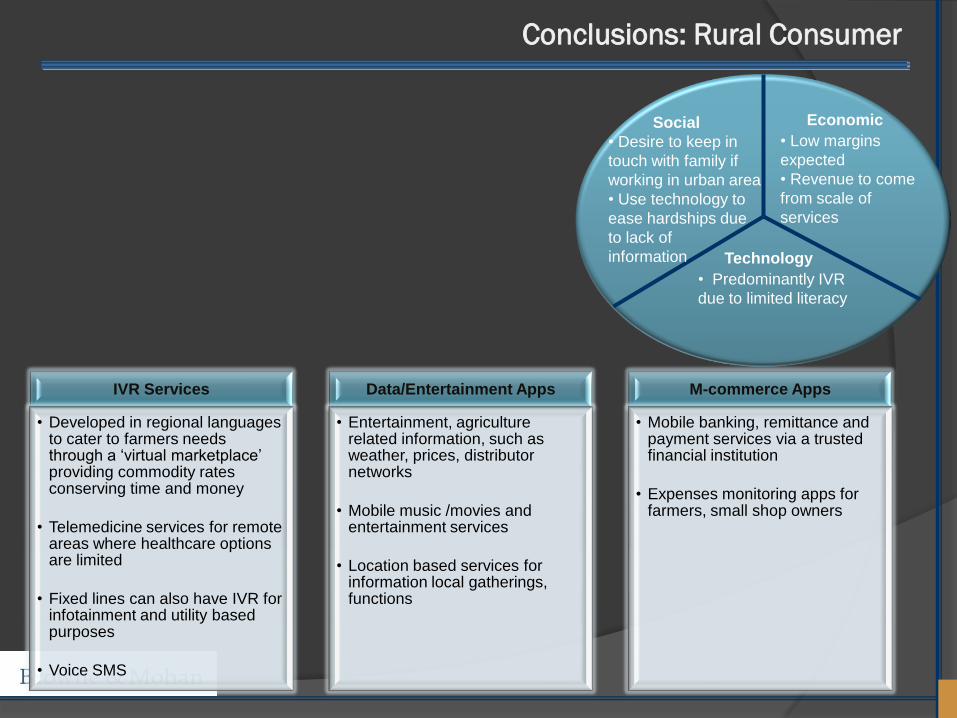
IVR Services
• Developed in regional languages to cater to farmers needs through a „virtual marketplace‟ providing commodity rates conserving time and money
• Telemedicine services for remote areas where healthcare options are limited
• Fixed lines can also have IVR for infotainment and utility based purposes
• Voice SMS
Data/Entertainment Apps
• Entertainment, agriculture related information, such as weather, prices, distributor networks
• Mobile music /movies and entertainment services
• Location based services for information local gatherings, functions
M-commerce Apps
• Mobile banking, remittance and payment services via a trusted financial institution
• Expenses monitoring apps for farmers, small shop owners
Technology
• Predominantly IVR
due to limited literacy
Social
• Desire to keep in
touch with family if
working in urban area
• Use technology to
ease hardships due
to lack of
information
Economic
• Low margins
expected
• Revenue to come
from scale of
services
Conclusions: Rural Consumer
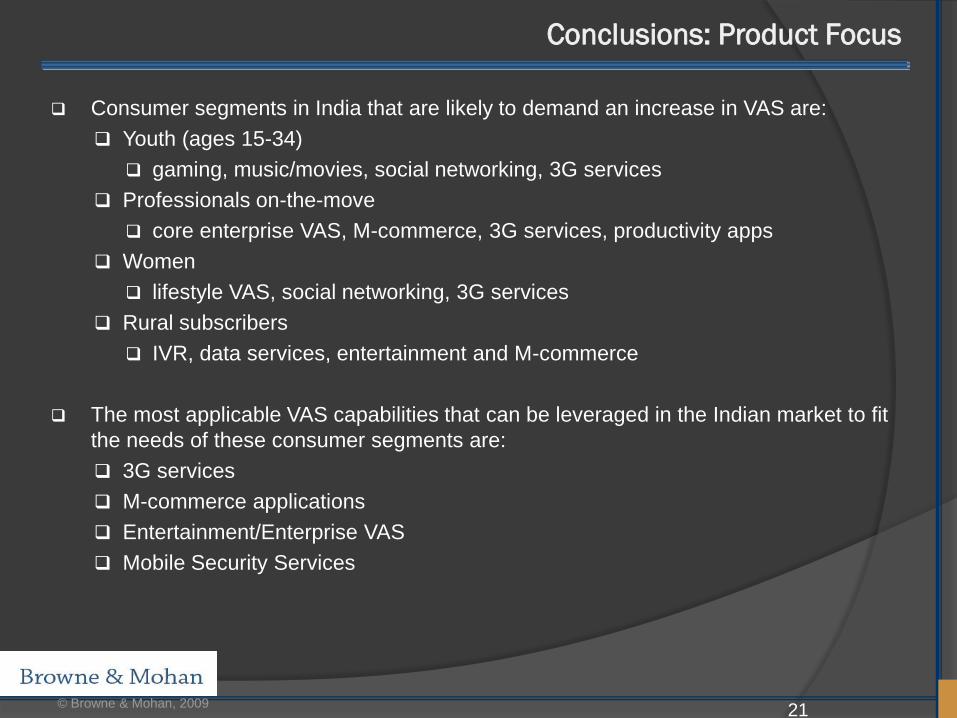
Consumer segments in India that are likely to demand an increase in VAS are:
Youth (ages 15-34)
gaming, music/movies, social networking, 3G services
Professionals on-the-move
core enterprise VAS, M-commerce, 3G services, productivity apps
Women
lifestyle VAS, social networking, 3G services
Rural subscribers
IVR, data services, entertainment and M-commerce
The most applicable VAS capabilities that can be leveraged in the Indian market to fit
the needs of these consumer segments are:
3G services
M-commerce applications
Entertainment/Enterprise VAS
Mobile Security Services
© Browne & Mohan, 2009 21
Conclusions: Product Focus
Thank You
For any query please contact
Ms Harmeet Kaur
Associate Consultant
157/A, 2nd Floor, 10th A Main
Jayanagar 1 Block
Bangalore. 560 01
91-80-26565164
9.1
References Adachi F. Wireless Past and Future- Evolving Mobile Communication Systems. IECE Trans. Fundamentals.
2001; E84(A): 55-60.
Annual Report 2007-08. Telecom Regulatory Authority of India. October 2008.
Boston Analytics. A Study of the Mobile Value Added Services (MVAS) Market in India. 2007.
Chitkara N. Market Entry Strategy for Indian Telecom Market As Mobile Virtual Network Operator (MVNO).
December 2007. <
http://insightory.com/view/202//market_entry_strategy_for_indian_telecom_market__:_as_mobile_virtual_network
_operator > Accessed July 24, 2009.
Economic Times. MTNL calls global telcos for 3G bids. July 16, 2009. <
http://economictimes.indiatimes.com/LATEST-NEWS/MTNL-calls-global-telcos-for-3G-
bids/articleshow/4782648.cms. > Accessed on August 17, 2009.
FICCI and BDA 3G & BWA: The Next Frontier.. January 2009.
IAMAI and eTechnology Group at IMRB. Mobile Value Added Services in India. August 2008.
Infocomm Development Authority of Singapore. Annual Survey on Infocomm Industry 2008. June 2009.
Kosnik T, Gundecha M, Bajaj K. Future of Mobile VAS in India. Stanford University & BDA. December 2007.
Livemint.com . BSNL revenue arrears. August 6, 2009. < http://www.livemint.com/2009/08/06150630/BSNL-
revenue-arrears-stand-at.html>. Accessed August 10, 2009.
© Browne & Mohan, 2009 23
9.2
References Mathew L, Mysore J, Nair V. Is the Indian Market Ready to go “Virtual” for Mobile? Diamond Management and
Technology Consultants. 2006.
Members List, Mobile Alliance. < http://mobilealliance.sg/memberlist.html>. Accessed July 25, 2009.
Medianama. Airtel mobile VAS revenues. July 27, 2008. < http://www.medianama.com/2008/07/223-airtel-mobile-vas-
revenues-at-rs-23555-crores-non-sms-57-of-vas-at-rs-13356-crores/> . Accessed on August 4, 2009.
Medianama. Rcom VAS Revenues. August 1, 2008. < http://www.medianama.com/2008/08/223-rcom-vas-revenues-at-
rs-109-crmonth-non-sms-vas-at-rs-91-crmonth-60-pc-of-data-card-market/>. Accessed August 10, 2009.
Mobile Europe. Freemium model to predominate in mobile apps. 13 May, 2009. <
http://www.mobileeurope.co.uk/news_wire/114806/'Freemium'_model_to_predominate_in_mobile_apps_with_VAS_reve
nues_reaching_$14bn_by_2014,_says_report.html>. Accessed July 31, 2009.
NDTV Profit. Bharti gears up for 3G leap. August 17, 2009. < http://profit.ndtv.com/2009/08/17233801/Bharti-gears-up-
for-a-3G-leap.html >. Accessed on August 17, 2009.
Press Release No 54. Telecom Regulatory Authority of India. June 2009. <
http://www.trai.gov.in/WriteReadData/trai/upload/PressReleases/687/pr1june09no54.pdf> Accessed July 15, 2009.
Times of India. Only 4 New Operators in 3G spectrum bid. August 19, 2009. < http://www.varindia.com/Mobility1.asp >.
Accessed August 19, 2009.
VARIndia. Indian Telcos Aggressive on Value Added Services. < http://www.varindia.com/Mobility1.asp >. Accessed
August 19, 2009.
VAS. TelecomLIVE. June 2009. < http://www.kirusa.com/press/2009/06-01-09a.pdf> Accessed July 20, 2009.
© Browne & Mohan, 2009 24