Embed Size (px)
Citation preview
IBRACON, October 9, 2012
Kamal Henri Khayat
54th Congresso Brasilleiro do Concreto
Maceio – Oct. 9, 2012
Evaluation of Thixotropy of SCC
and Inflence on Concrete Perfomance
IBRACON, October 9, 2012
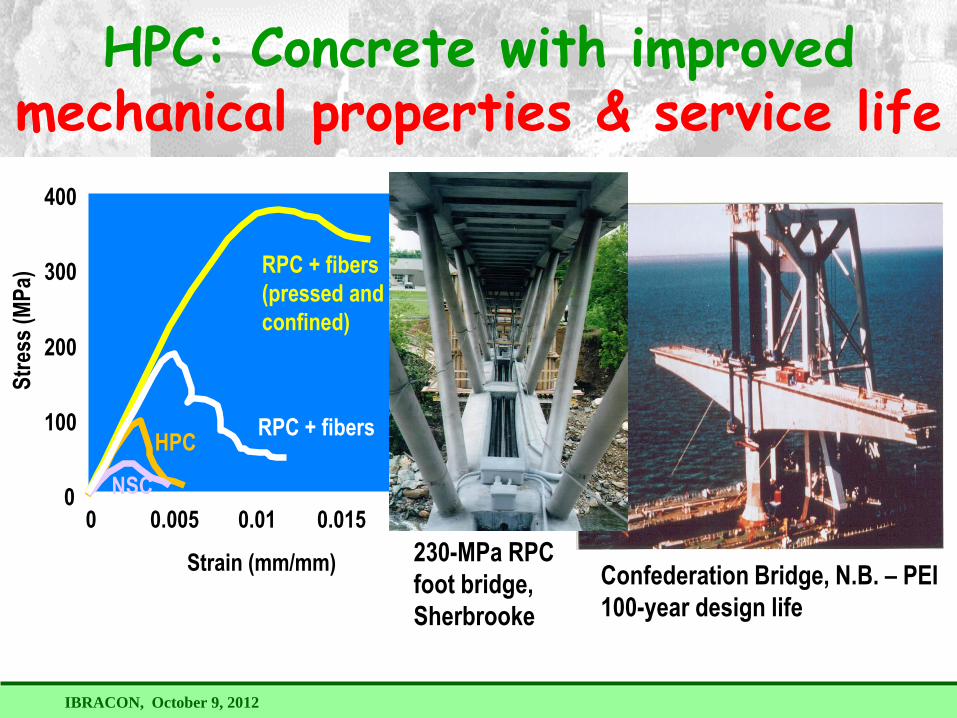
230-MPa RPC
foot bridge,
Sherbrooke
0
100
200
300
400
0 0.005 0.01 0.015
HPC
RPC + fibers
(pressed and
confined)
Str
ess
(MP
a)
Strain (mm/mm)
NSC
RPC + fibers
0.02
HPC: Concrete with improved mechanical properties & service life
Confederation Bridge, N.B. – PEI
100-year design life
IBRACON, October 9, 2012
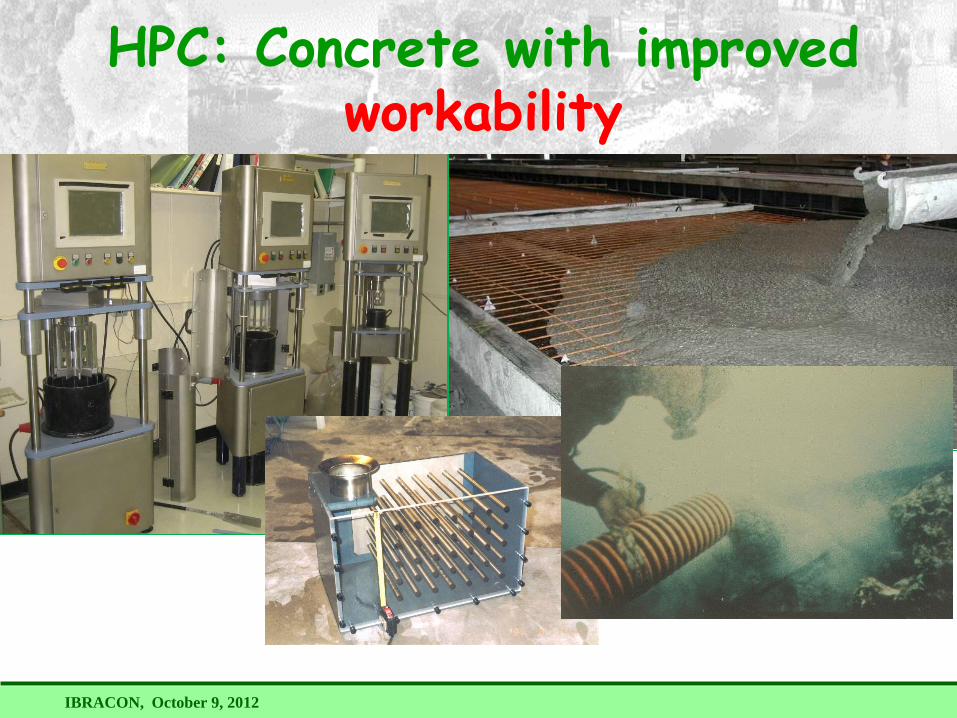
HPC: Concrete with improved workability
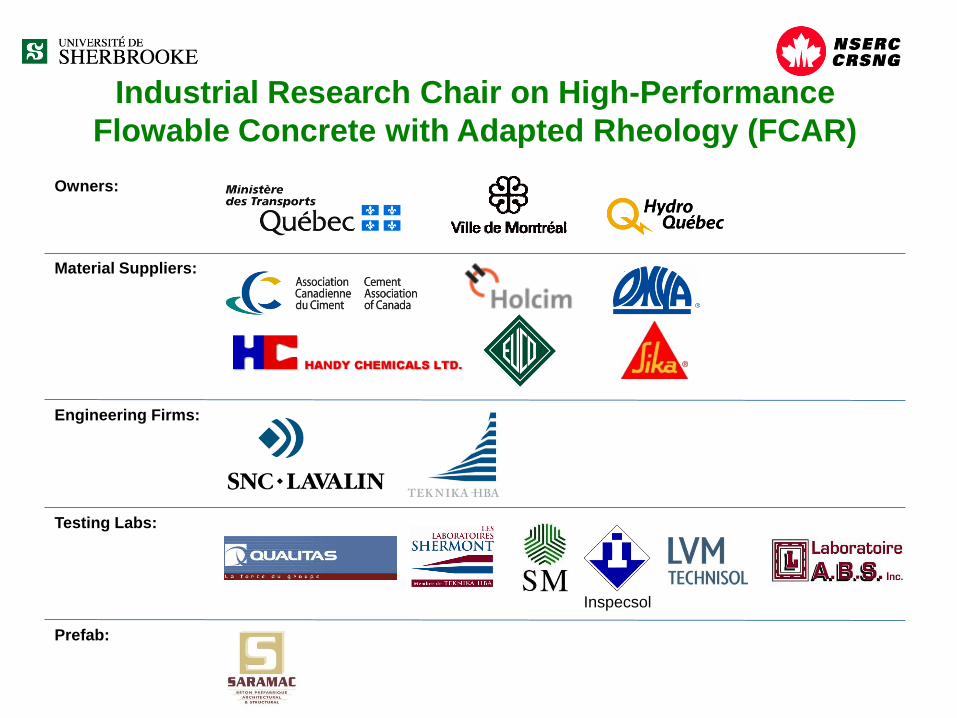
Owners:
Material Suppliers:
Engineering Firms:
Testing Labs:
Industrial Research Chair on High-Performance
Flowable Concrete with Adapted Rheology (FCAR)
Inspecsol
Prefab:
IBRACON, October 9, 2012 5
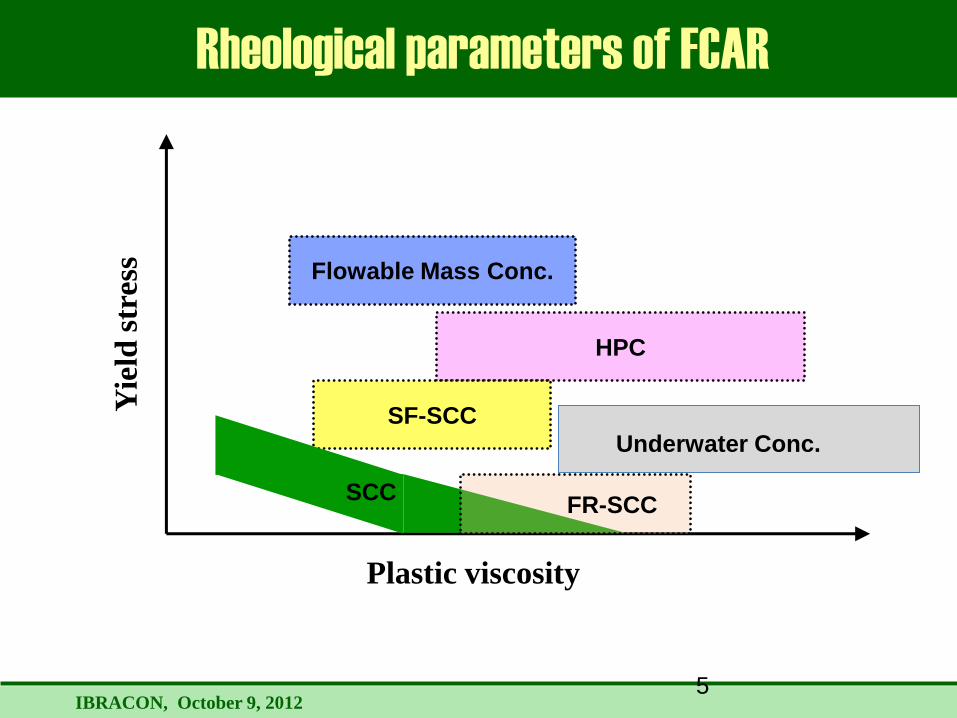
Yie
ld s
tres
s
Plastic viscosity
HPC
SF-SCC
Flowable Mass Conc.
FR-SCC SCC
Underwater Conc.
Rheological parameters of FCAR
IBRACON, October 9, 2012
6

IBRACON, October 9, 2012
Recommendations
for Design & Testing
of FCAR
Theme I – Influence of Mixture Constituents, Mix
Design, & Temperature on Rheology of FCAR
Theme III - Rheological Properties and
Granular Flow Modeling
Theme II – Test Methods to Evaluate Flow
Properties of FCAR
IRC Research Program
Theme V - Field Validation and
Guidelines
Theme IV – Mix Design
and Engineering
Properties of FCAR
IBRACON, October 9, 2012
Conventional
concrete
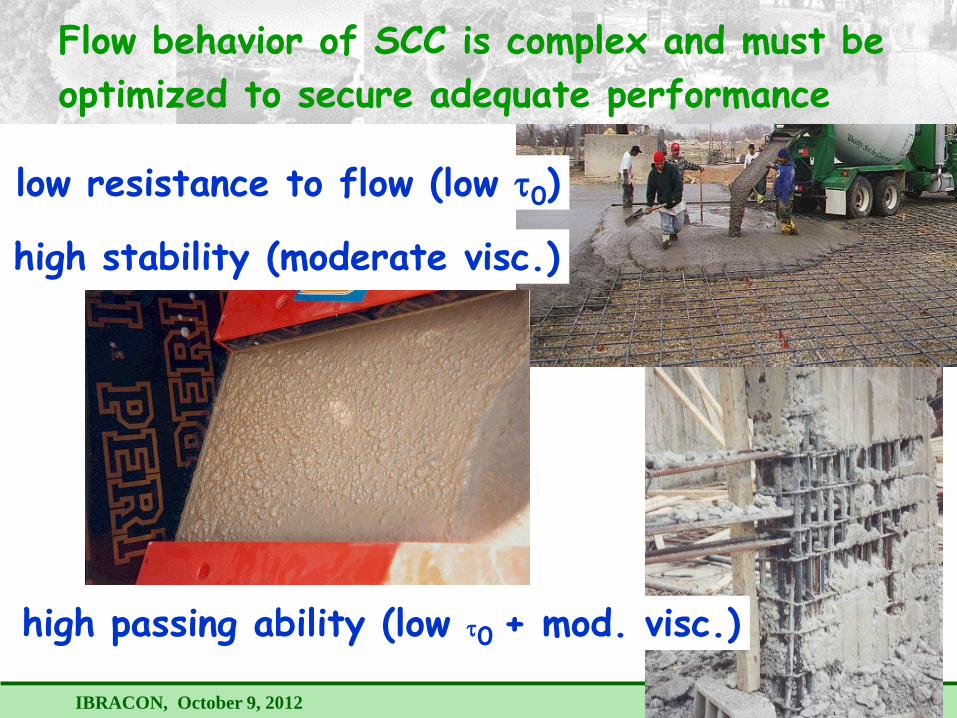
high passing ability (low t0 + mod. visc.)
low resistance to flow (low t0)
Flow behavior of SCC is complex and must be
optimized to secure adequate performance
high stability (moderate visc.)
IBRACON, October 9, 2012
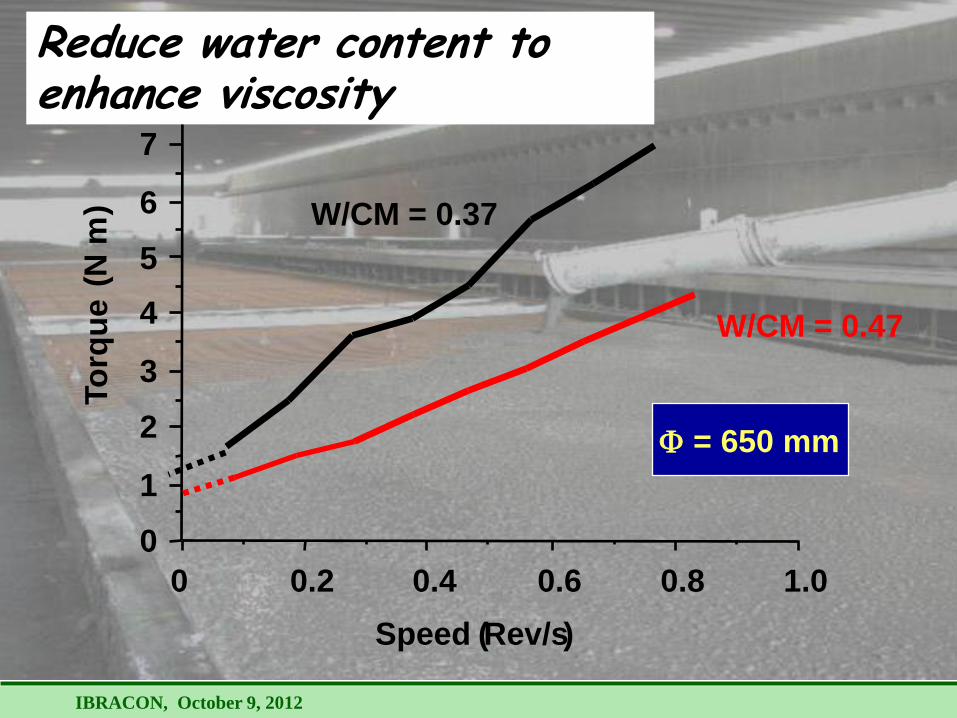
1.0 0.8 0.6 0.4 0.2 0
0
1
2
3
4
5
6
7
8
W/CM = 0.47
W/CM = 0.37
F = 650 mm
Speed ( Rev/s )
To
rqu
e (
N m
)
Reduce water content to enhance viscosity
IBRACON, October 9, 2012
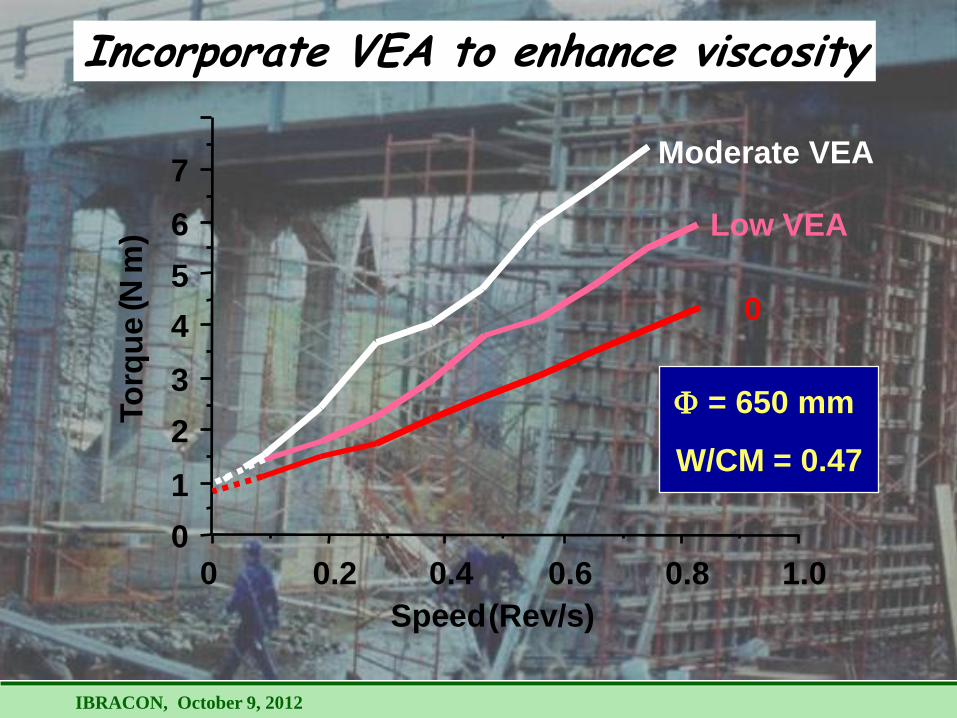
Incorporate VEA to enhance viscosity
1.0 0.8 0.6 0.4 0.2 0
0
1
2
3
4
5
6
7
0
Low VEA
Moderate VEA
Speed (Rev/s)
To
rqu
e (
N m
)
W/CM = 0.47
F = 650 mm
IBRACON, October 9, 2012
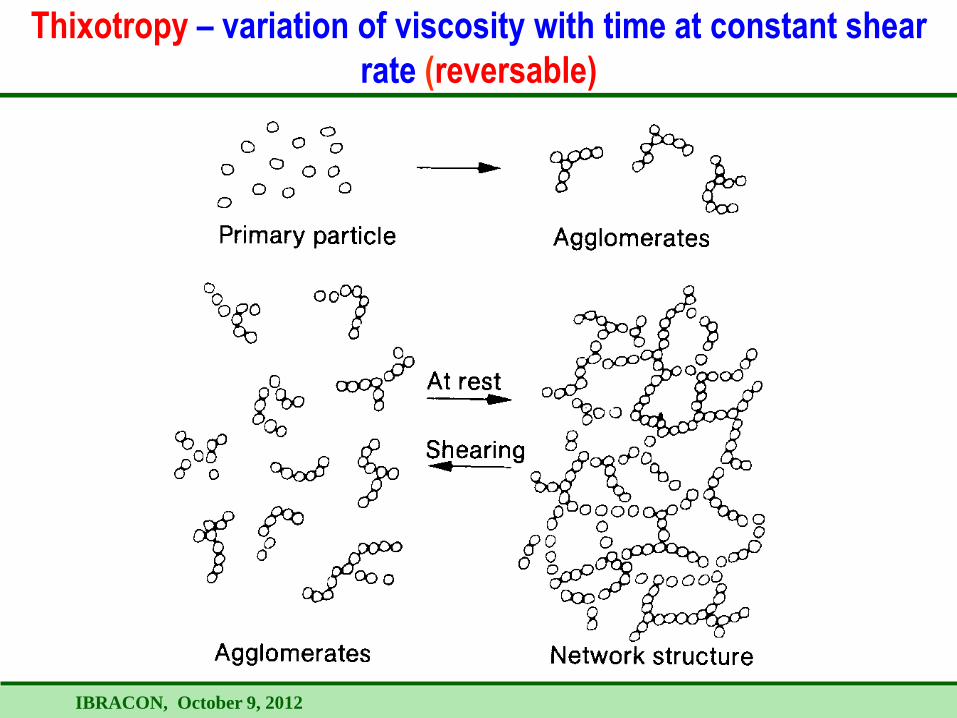
Thixotropy – variation of viscosity with time at constant shear
rate (reversable)
IBRACON, October 9, 2012
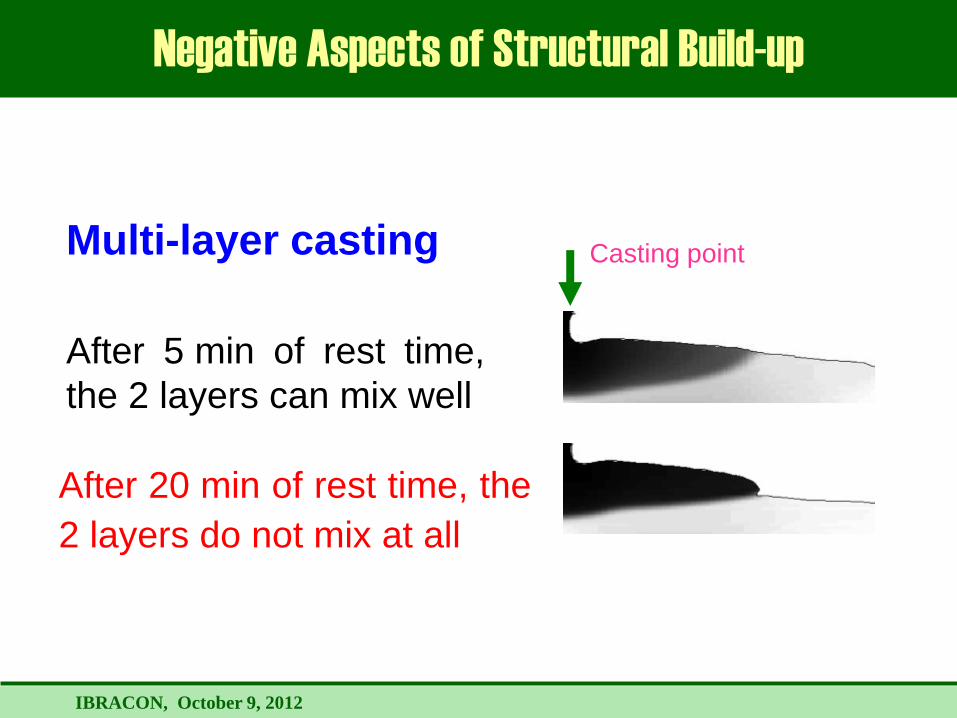
Negative Aspects of Structural Build-up
Multi-layer casting
After 5 min of rest time,
the 2 layers can mix well
After 20 min of rest time, the
2 layers do not mix at all
Casting point

IBRACON, October 9, 2012
Negative aspect of structural build-up (thixotropy)
IBRACON, October 9, 2012
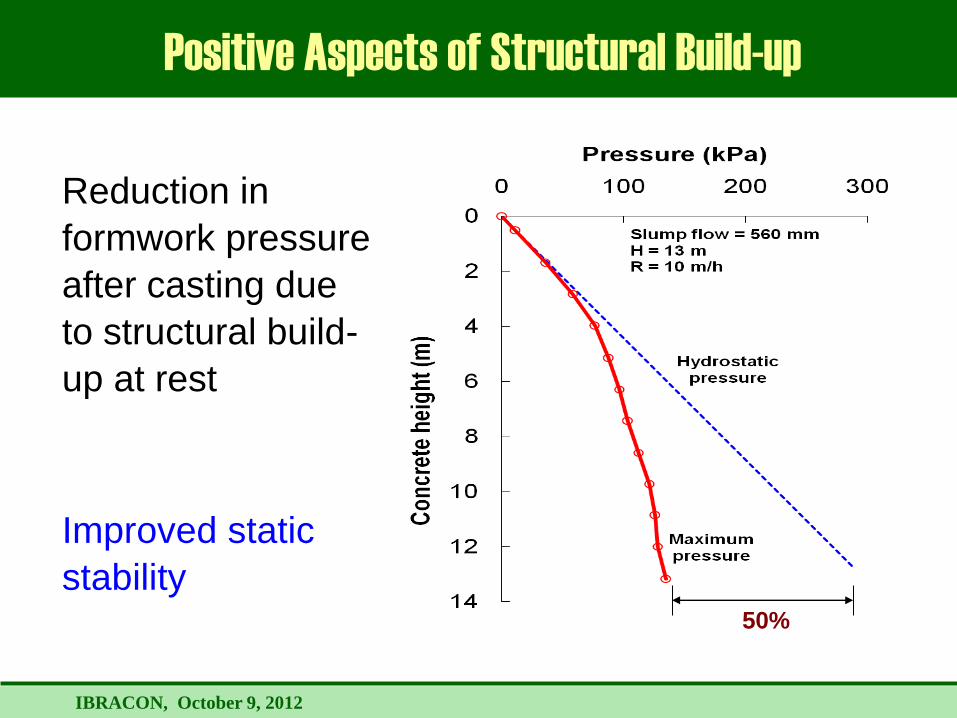
Positive Aspects of Structural Build-up
Reduction in
formwork pressure
after casting due
to structural build-
up at rest
Improved static
stability 50%
IBRACON, October 9, 2012
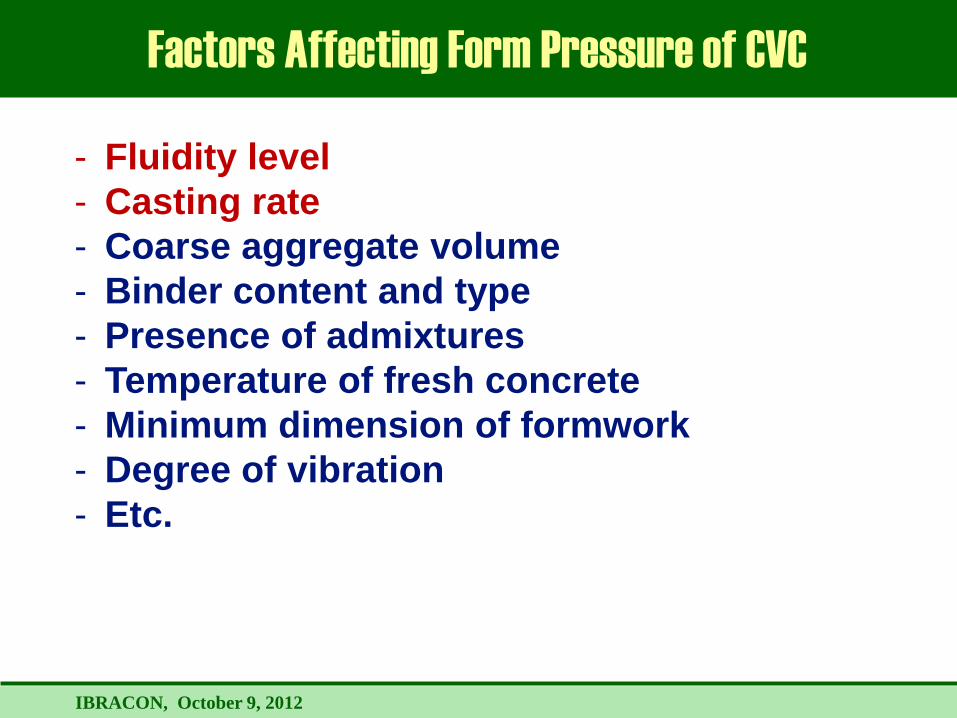
Factors Affecting Form Pressure of CVC
- Fluidity level
- Casting rate
- Coarse aggregate volume
- Binder content and type
- Presence of admixtures
- Temperature of fresh concrete
- Minimum dimension of formwork
- Degree of vibration
- Etc.
Rodin, 1952
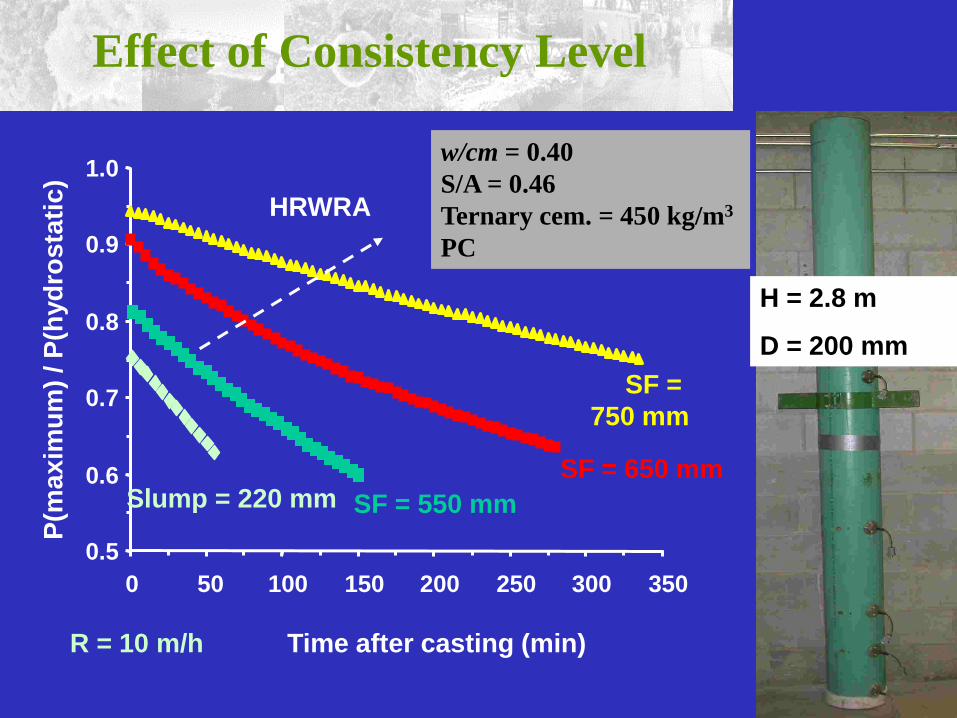
Effect of Consistency Level
0.5
0.6
0.7
0.8
0.9
1.0
0 50 100 150 200 250 300 350
Time after casting (min)
P(m
axim
um
) / P
(hyd
rosta
tic)
SF =
750 mm
SF = 650 mm
SF = 550 mm Slump = 220 mm
HRWRA
w/cm = 0.40
S/A = 0.46
Ternary cem. = 450 kg/m3
PC
R = 10 m/h
H = 2.8 m
D = 200 mm
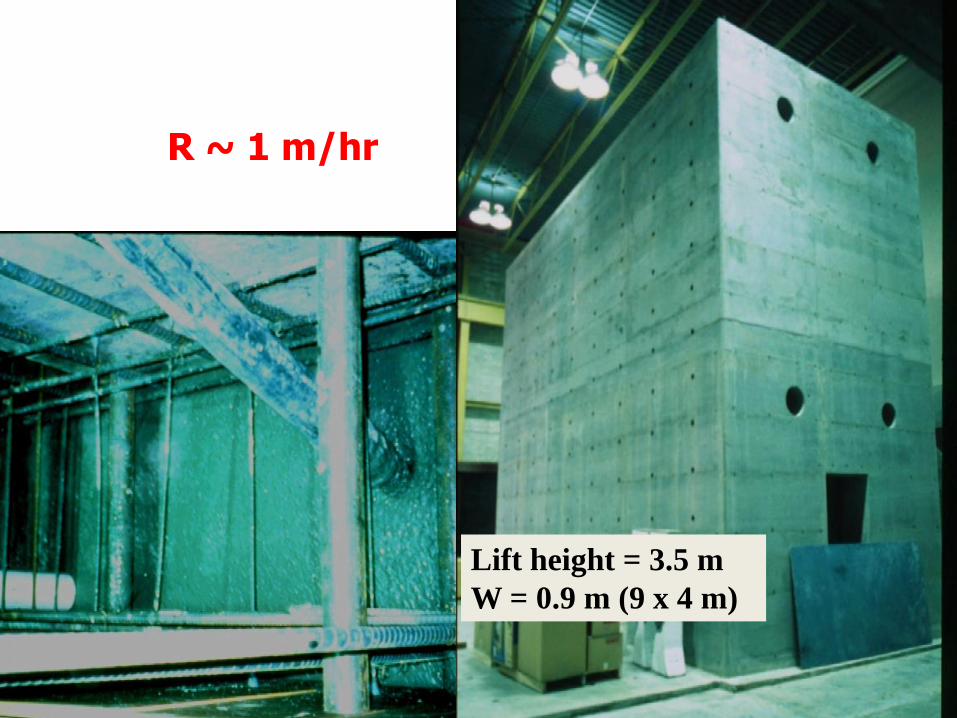
Lift height = 3.5 m
W = 0.9 m (9 x 4 m)
R ~ 1 m/hr
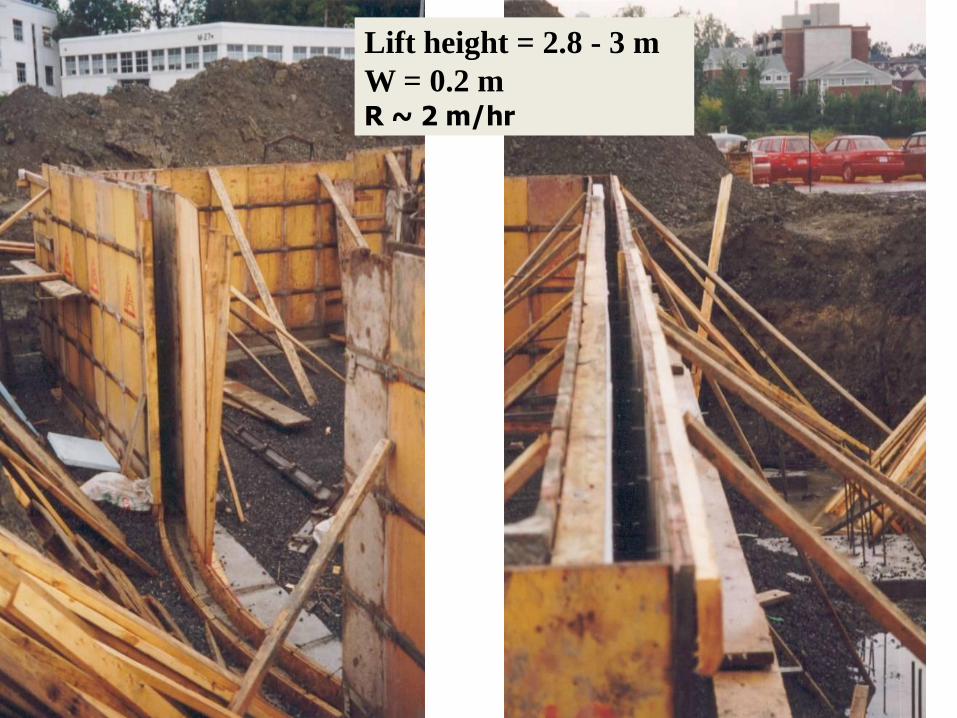
Lift height = 2.8 - 3 m
W = 0.2 m R ~ 2 m/hr
IBRACON, October 9, 2012
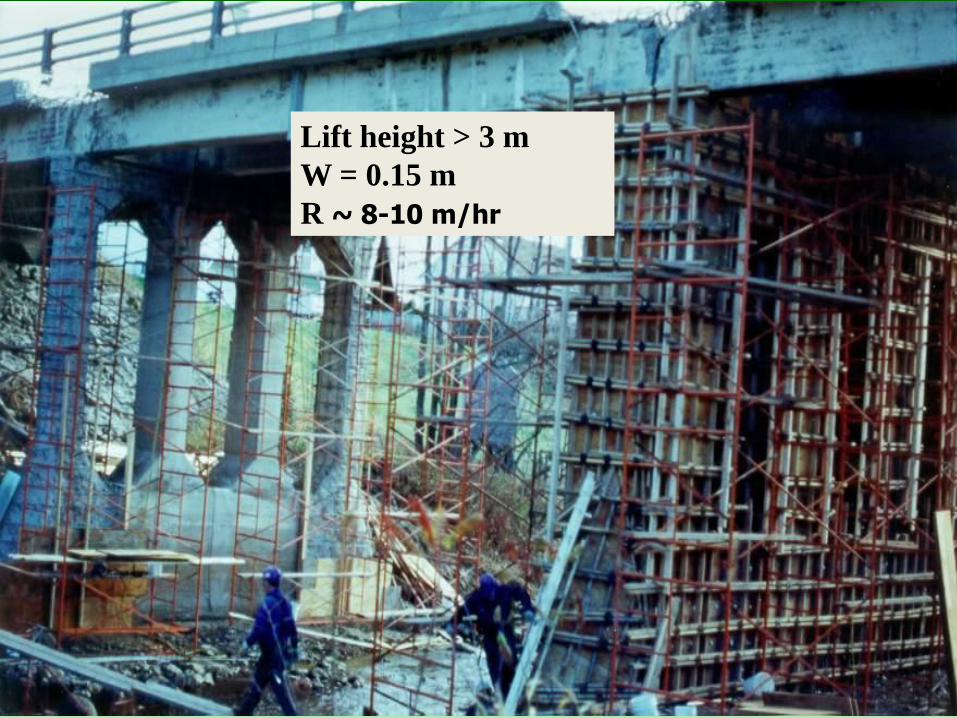
Lift height > 3 m
W = 0.15 m
R ~ 8-10 m/hr
IBRACON, October 9, 2012
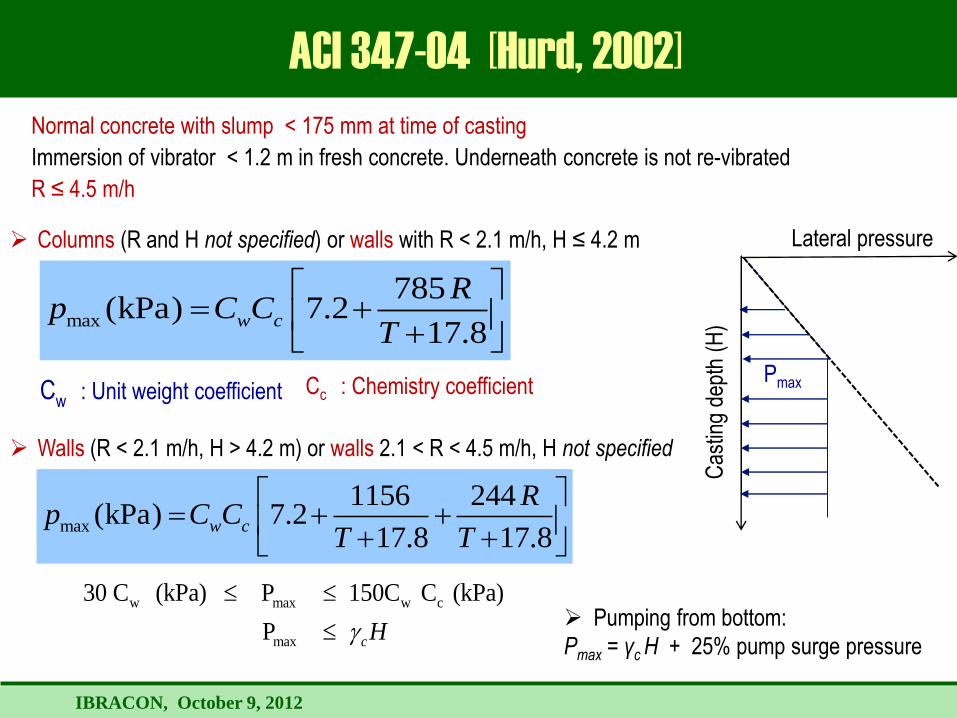
Normal concrete with slump < 175 mm at time of casting
Immersion of vibrator < 1.2 m in fresh concrete. Underneath concrete is not re-vibrated
R ≤ 4.5 m/h
ACI 347-04 [Hurd, 2002]
Pmax
Cas
ting
dept
h (H
)
Lateral pressure
Pumping from bottom:
Pmax = γc H + 25% pump surge pressure
max
785(kPa) 7.2
17.8
w c
Rp C C
T
Columns (R and H not specified) or walls with R < 2.1 m/h, H ≤ 4.2 m
Cw : Unit weight coefficient Cc : Chemistry coefficient
w max w c
max
30 C (kPa) P 150C C (kPa)
P cH
max
1156 244(kPa) 7.2
17.8 17.8
w c
Rp C C
T T
Walls (R < 2.1 m/h, H > 4.2 m) or walls 2.1 < R < 4.5 m/h, H not specified
IBRACON, October 9, 2012
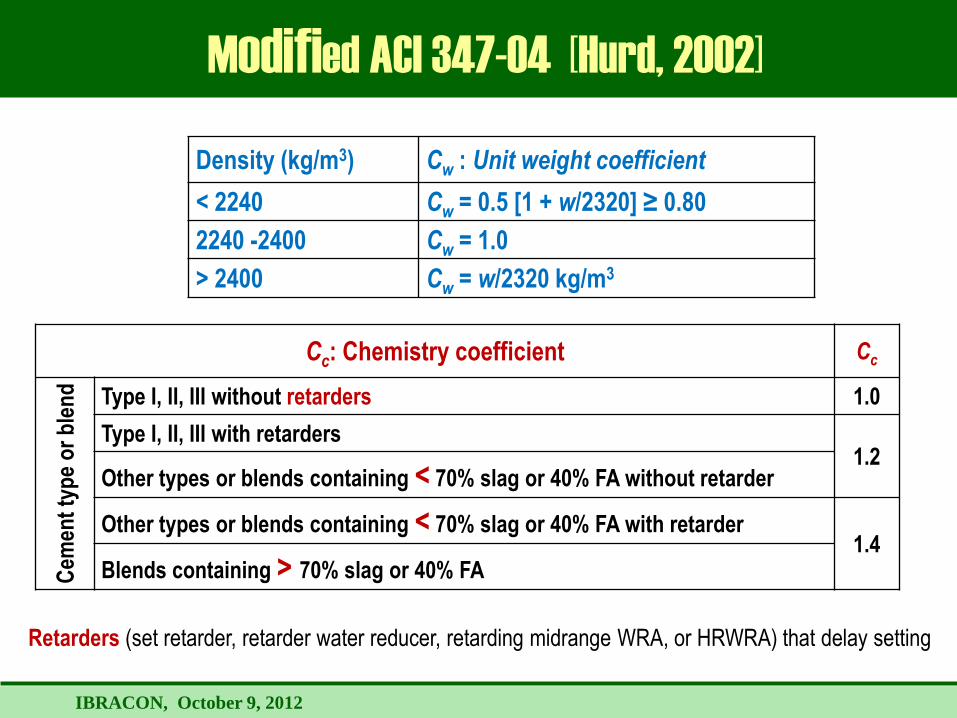
Modified ACI 347-04 [Hurd, 2002]
Density (kg/m3) Cw : Unit weight coefficient
< 2240 Cw = 0.5 [1 + w/2320] ≥ 0.80
2240 -2400 Cw = 1.0
> 2400 Cw = w/2320 kg/m3
Cc: Chemistry coefficient Cc
Cem
ent
typ
e o
r b
len
d
Type I, II, III without retarders 1.0
Type I, II, III with retarders 1.2
Other types or blends containing < 70% slag or 40% FA without retarder
Other types or blends containing < 70% slag or 40% FA with retarder 1.4
Blends containing > 70% slag or 40% FA
Retarders (set retarder, retarder water reducer, retarding midrange WRA, or HRWRA) that delay setting
IBRACON, October 9, 2012
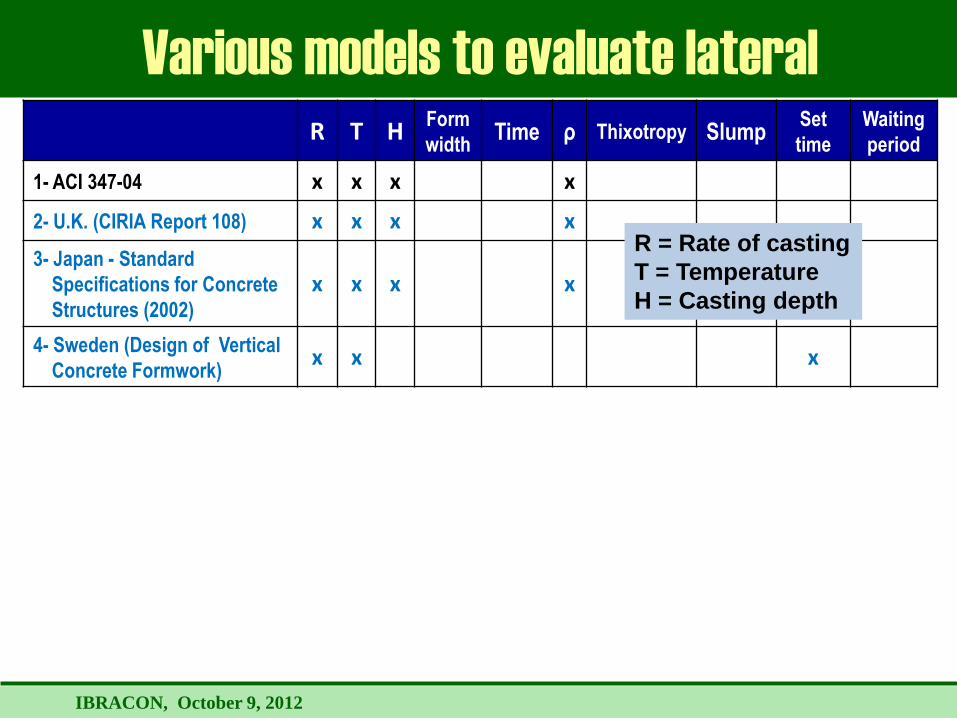
Various models to evaluate lateral
pressure R T H Form
width Time ρ Thixotropy Slump
Set
time
Waiting
period
1- ACI 347-04 x x x x
2- U.K. (CIRIA Report 108) x x x x
3- Japan - Standard
Specifications for Concrete
Structures (2002)
x x x x
4- Sweden (Design of Vertical
Concrete Formwork) x x x
R = Rate of casting
T = Temperature
H = Casting depth
IBRACON, October 9, 2012
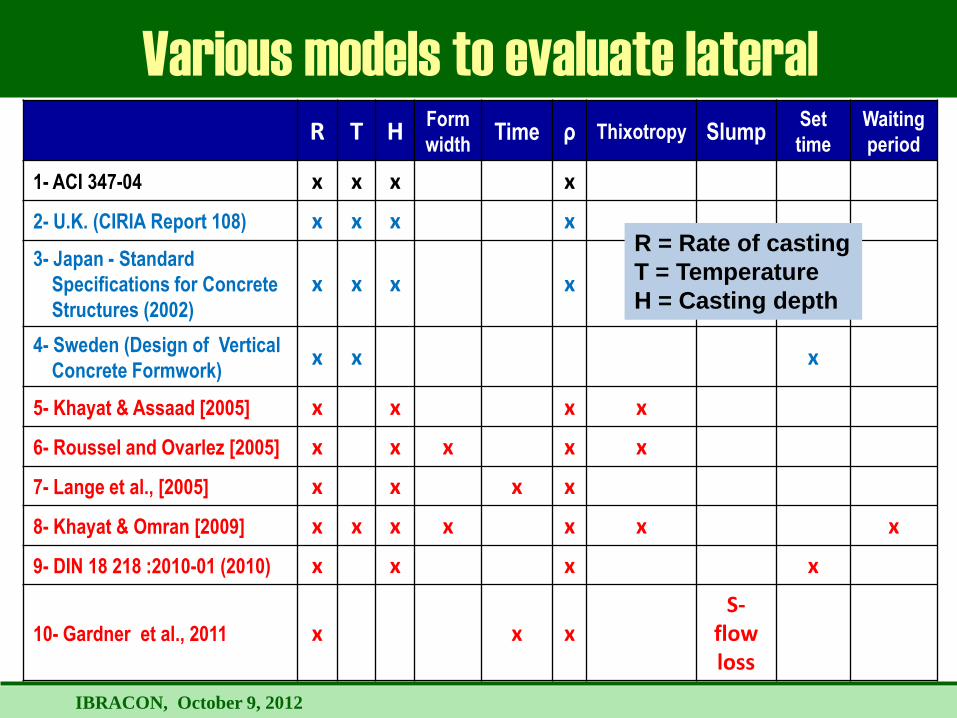
Various models to evaluate lateral
pressure R T H Form
width Time ρ Thixotropy Slump
Set
time
Waiting
period
1- ACI 347-04 x x x x
2- U.K. (CIRIA Report 108) x x x x
3- Japan - Standard
Specifications for Concrete
Structures (2002)
x x x x
4- Sweden (Design of Vertical
Concrete Formwork) x x x
5- Khayat & Assaad [2005] x x x x
6- Roussel and Ovarlez [2005] x x x x x
7- Lange et al., [2005] x x x x
8- Khayat & Omran [2009] x x x x x x x
9- DIN 18 218 :2010-01 (2010) x x x x
10- Gardner et al., 2011 x x x S-
flow loss
R = Rate of casting
T = Temperature
H = Casting depth
IBRACON, October 9, 2012
Outline
• Thixotropy determination: structural breakdown
and structural build-up at rest
• Thixotropy vs. form pressure exerted by SCC
• Structural build-up vs. drop in interlayer bond
IBRACON, October 9, 2012
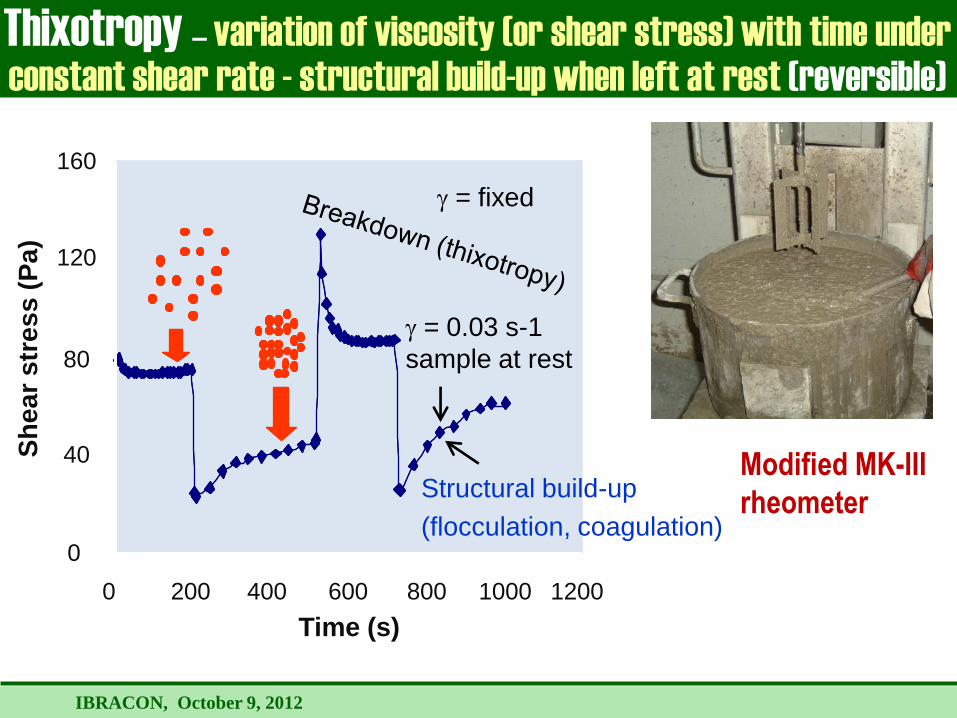
0
40
80
120
160
0 200 400 600 800 1000 1200
Time (s)
= fixed
= 0.03 s-1
sample at rest
Sh
ea
r s
tre
ss
(P
a)
Structural build-up
(flocculation, coagulation)
Thixotropy – variation of viscosity (or shear stress) with time under
constant shear rate - structural build-up when left at rest (reversible)
Modified MK-III
rheometer
IBRACON, October 9, 2012
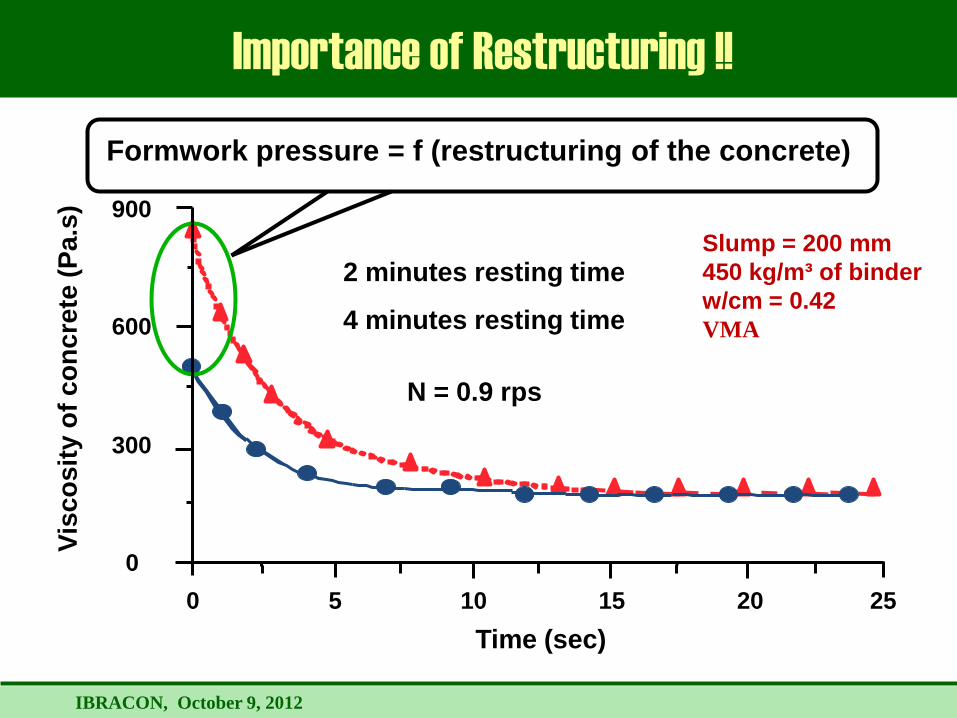
4 minutes resting time
Importance of Restructuring !!
0
300
600
900
0 5 10 15 20 25
Time (sec)
Vis
co
sit
y o
f c
on
cre
te (
Pa
.s)
2 minutes resting time
N = 0.9 rps
Formwork pressure = f (restructuring of the concrete)
Slump = 200 mm
450 kg/m³ of binder
w/cm = 0.42
VMA
IBRACON, October 9, 2012
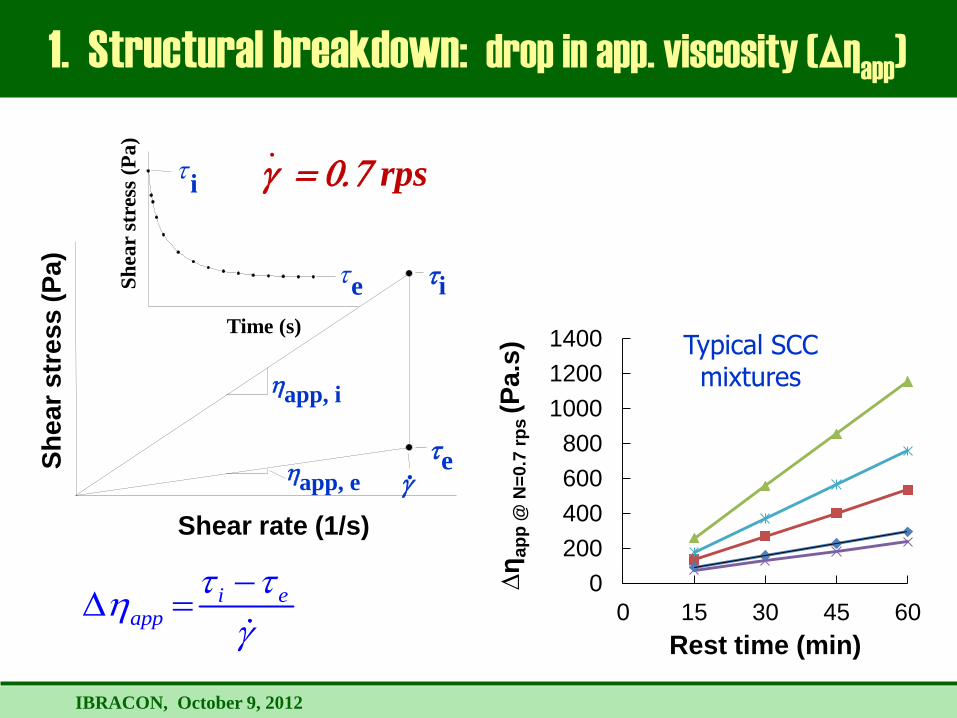
0
200
400
600
800
1000
1200
1400
0 15 30 45 60
∆η
ap
p @
N=
0.7
rp
s (P
a.s
)
Rest time (min)
1. Structural breakdown: drop in app. viscosity (∆ηapp
)
Typical SCC mixtures
Shear rate (1/s)
Sh
ea
r s
tre
ss
(P
a)
t i
t e . h app, e
h app, i
Time (s)
Sh
ear
stre
ss (
Pa
)
t e
t i
i eapp
t th
0.7 rps .
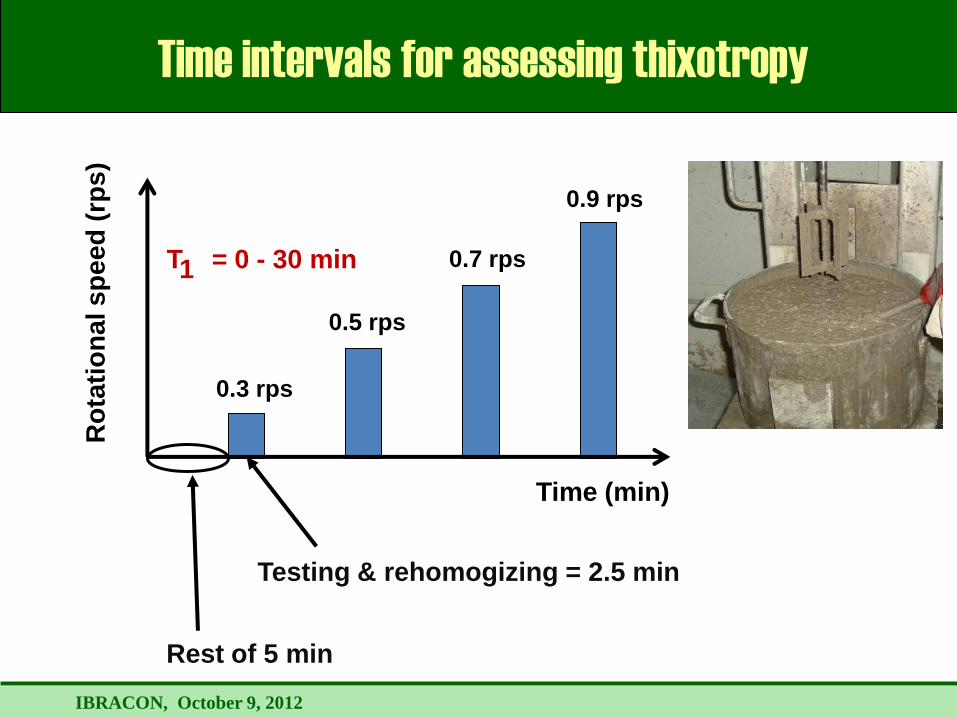
IBRACON, October 9, 2012
Time intervals for assessing thixotropy
1
Time (min)
Ro
tati
on
al s
pe
ed
(rp
s)
0.3 rps
0.5 rps
0.7 rps
0.9 rps
Rest of 5 min
Testing & rehomogizing = 2.5 min
T = 0 - 30 min
IBRACON, October 9, 2012
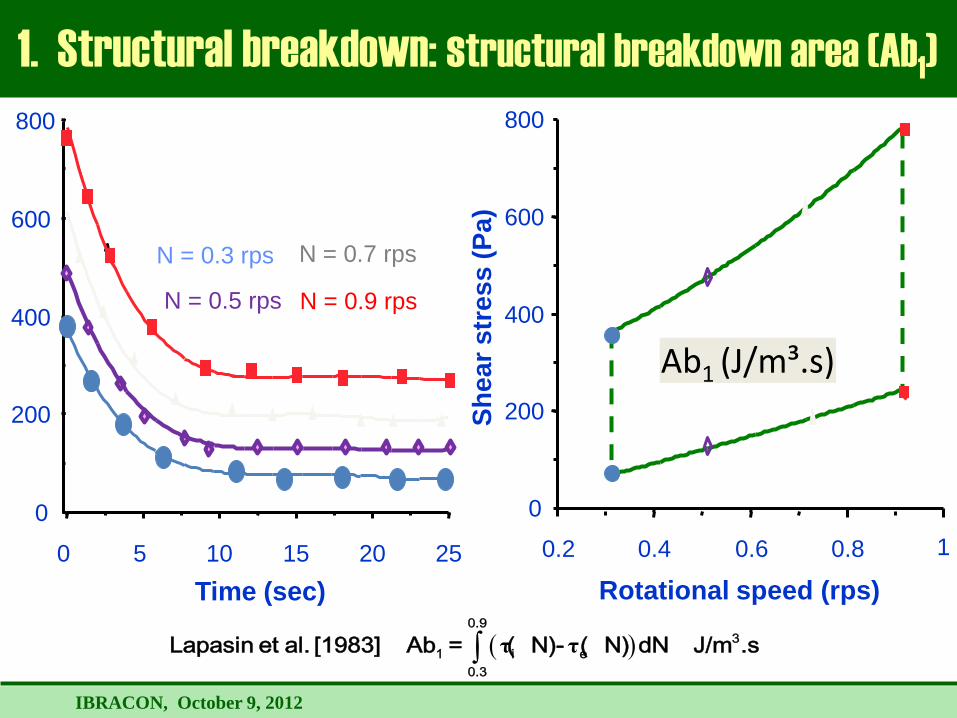
1
Sh
ea
r s
tre
ss
(P
a)
0
200
400
600
800
0 5 10 15 20 25
Time (sec)
0
200
400
600
800
0.2 0.4 0.6 0.8
Rotational speed (rps)
Ab1 (J/m³.s)
N = 0.3 rps
N = 0.9 rps N = 0.5 rps
N = 0.7 rps
1. Structural breakdown: structural breakdown area (Ab1)
τ τ
0.9
3
1 i e
0.3
Lapasin et al. [1983] Ab = (N)- (N)dN J/m .s
IBRACON, October 9, 2012
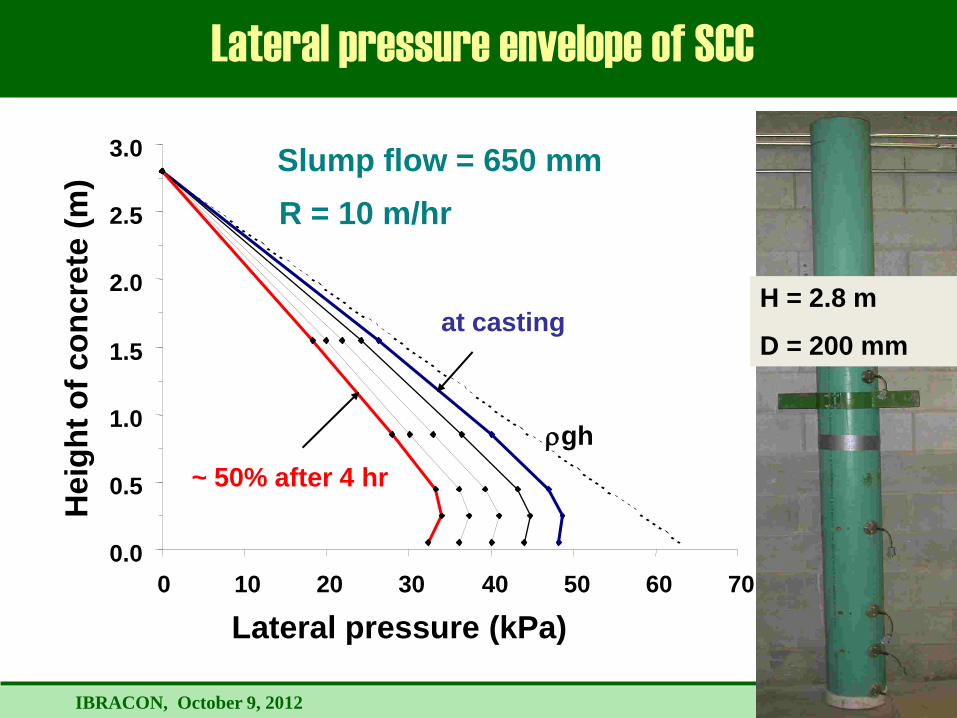
0.0
0.5
1.0
1.5
2.0
2.5
3.0
0 10 20 30 40 50
Lateral pressure (kPa)
Heig
ht
of
co
ncre
te (
m)
rgh
at casting
~ 50% after 4 hr
R = 10 m/hr
Lateral pressure envelope of SCC
Slump flow = 650 mm
60 70
H = 2.8 m
D = 200 mm
IBRACON, October 9, 2012
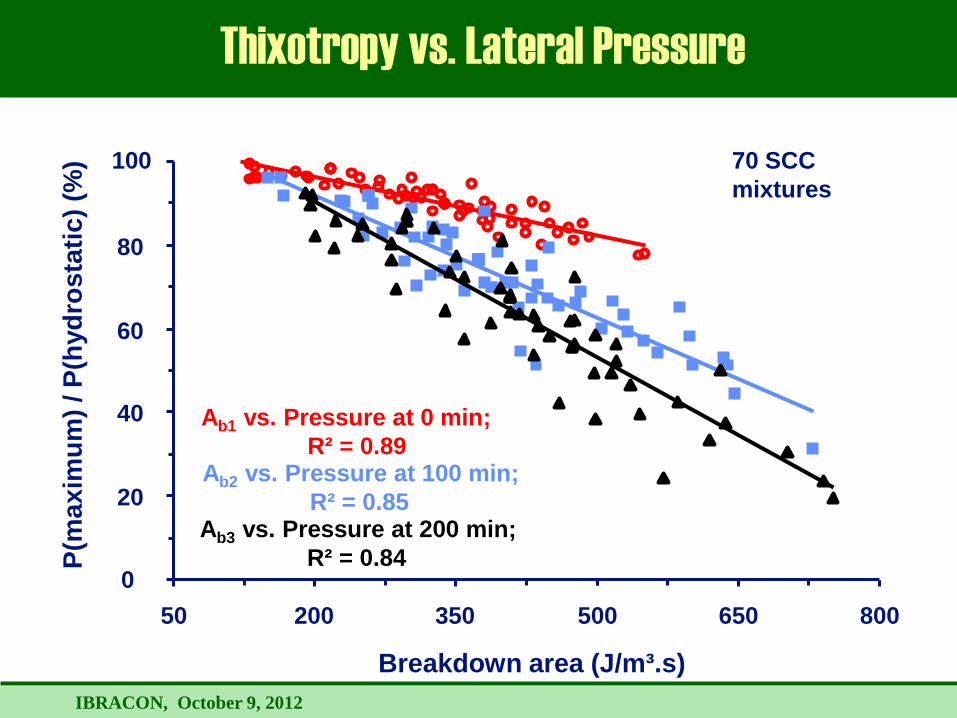
Thixotropy vs. Lateral Pressure
0
20
40
60
80
100
50 200 350 500 650 800
Breakdown area (J/m³.s)
P(m
ax
imu
m)
/ P
(hyd
ros
tati
c)
(%)
Ab1 vs. Pressure at 0 min;
R² = 0.89 Ab2 vs. Pressure at 100 min;
R² = 0.85 Ab3 vs. Pressure at 200 min;
R² = 0.84
70 SCC
mixtures
IBRACON, October 9, 2012
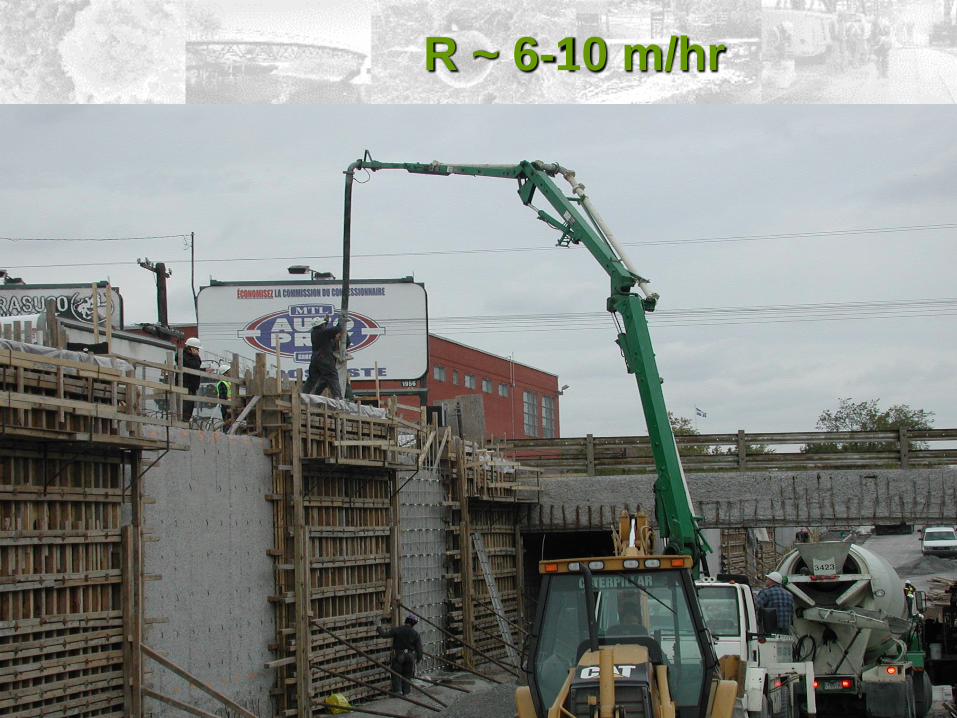
R ~ 6-10 m/hr
IBRACON, October 9, 2012
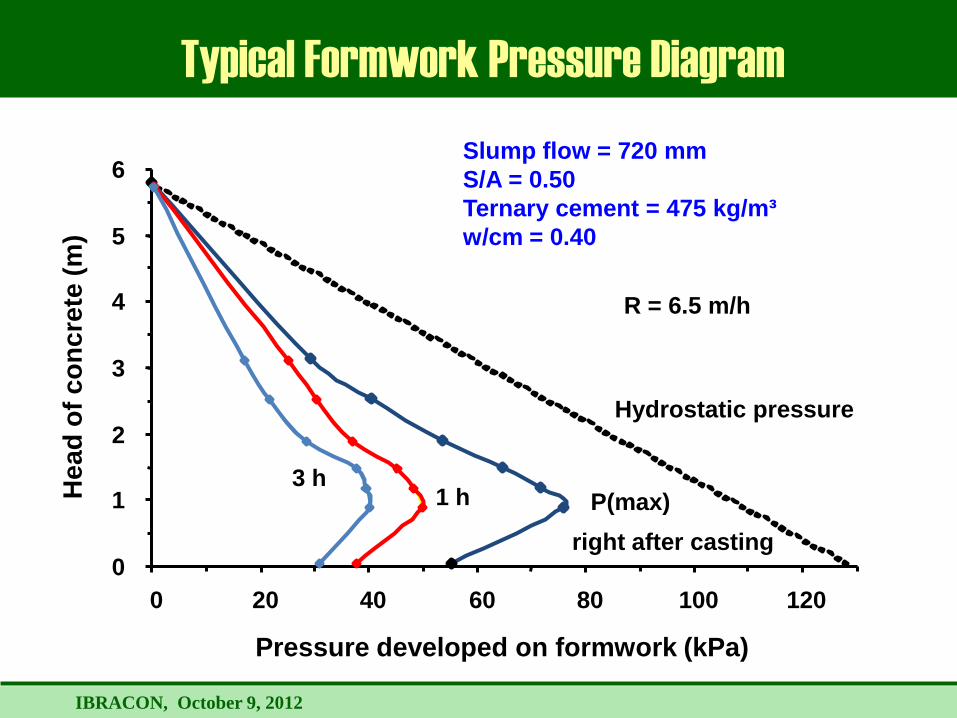
Typical Formwork Pressure Diagram
0
1
2
3
4
5
6
0 20 40 60 80 100 120
Pressure developed on formwork (kPa)
He
ad
of
co
nc
rete
(m
)
Hydrostatic pressure
Slump flow = 720 mm
S/A = 0.50
Ternary cement = 475 kg/m³
w/cm = 0.40
R = 6.5 m/h
right after casting
1 h 3 h
P(max)
IBRACON, October 9, 2012
Time after casting (min)
P(m
ax
imu
m)
/ P
(hyd
ros
tati
c)
0.0
0.2
0.4
0.6
0 200 400 600 800 1000 1200
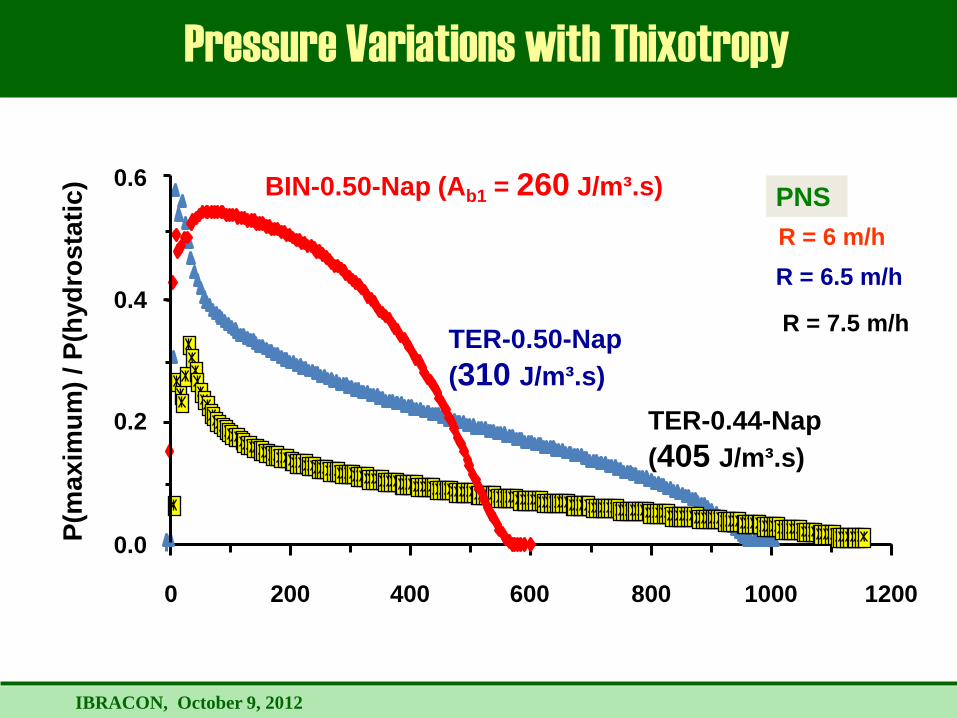
Pressure Variations with Thixotropy
BIN-0.50-Nap (Ab1 = 260 J/m³.s)
TER-0.50-Nap
(310 J/m³.s)
TER-0.44-Nap
(405 J/m³.s)
S / A
PNS
R = 6 m/h
R = 6.5 m/h
R = 7.5 m/h
IBRACON, October 9, 2012
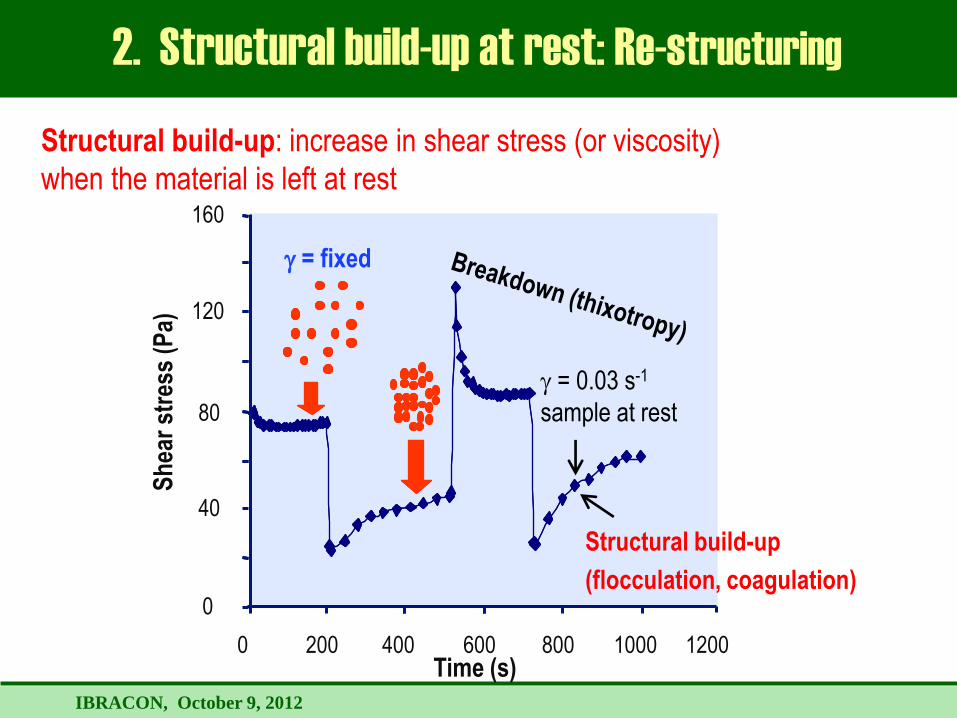
0
40
80
120
160
0 200 400 600 800 1000 1200 Time (s)
= fixed
= 0.03 s-1
sample at rest
Sh
ear
stre
ss (
Pa)
Structural build-up
(flocculation, coagulation)
Structural build-up: increase in shear stress (or viscosity)
when the material is left at rest
2. Structural build-up at rest: Re-structuring
IBRACON, October 9, 2012
0
500
1000
1500
2000
2500
0 15 30 45 60
Rh
eom
eter
-τ0
rest
(Pa)
Rest time (min)
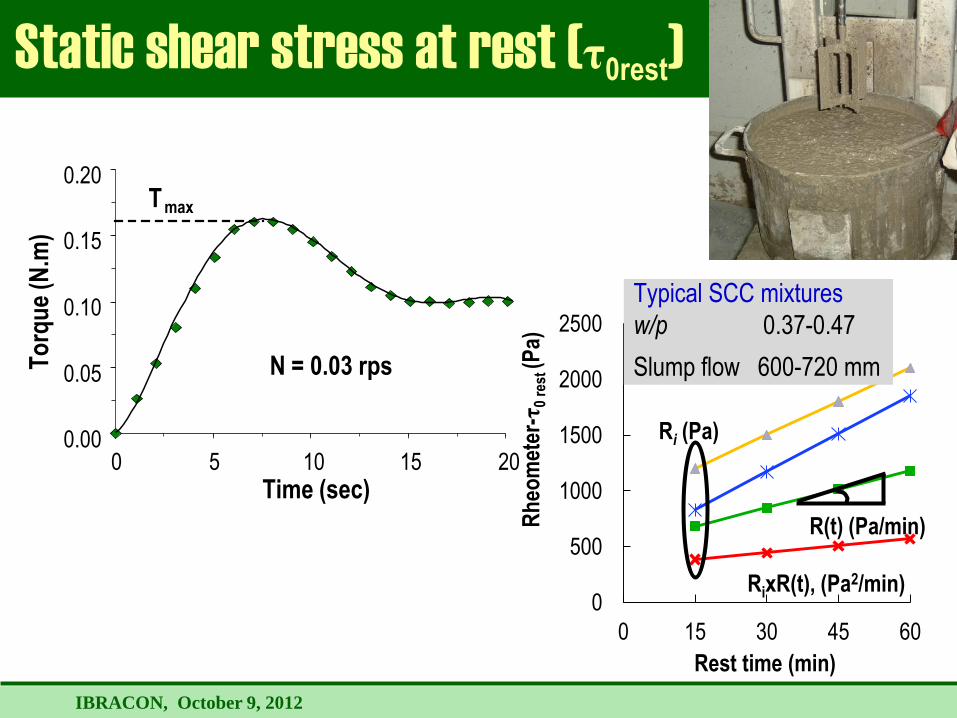
Static shear stress at rest (τ0rest)
R(t) (Pa/min)
Ri (Pa)
Typical SCC mixtures
w/p 0.37-0.47
Slump flow 600-720 mm N = 0.03 rps
0.00
0.05
0.10
0.15
0.20
0 5 10 15 20
To
rqu
e (N
.m)
T max
Time (sec)
RixR(t), (Pa2/min)
IBRACON, October 9, 2012
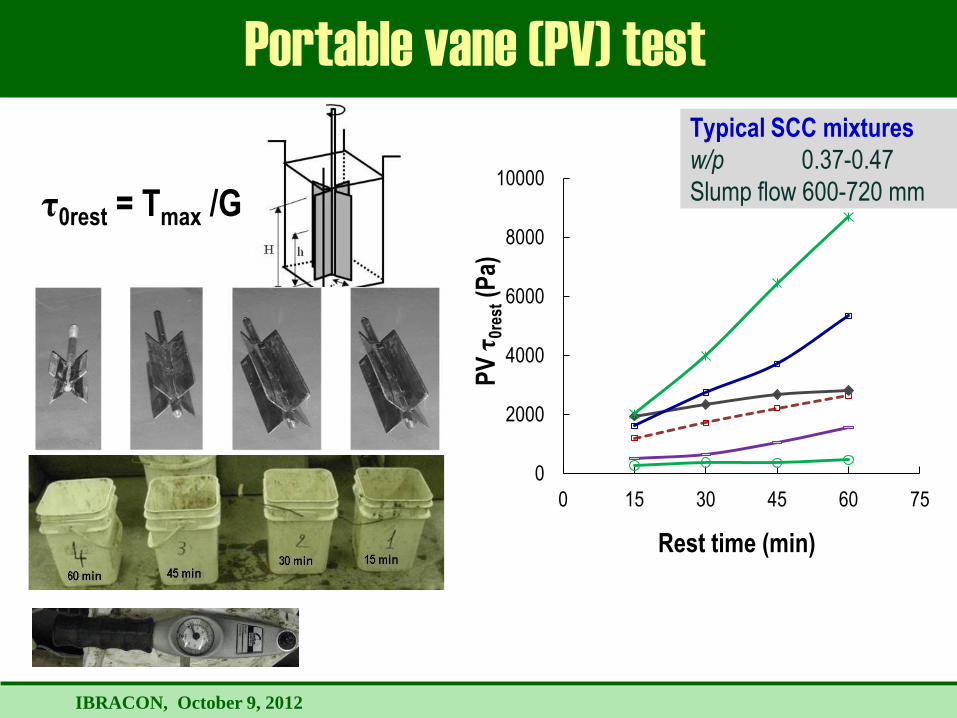
Portable vane (PV) test
Typical SCC mixtures
w/p 0.37-0.47
Slump flow 600-720 mm
0
2000
4000
6000
8000
10000
0 15 30 45 60 75 P
V τ
0res
t (P
a)
Rest time (min)
τ0rest = Tmax /G
IBRACON, October 9, 2012
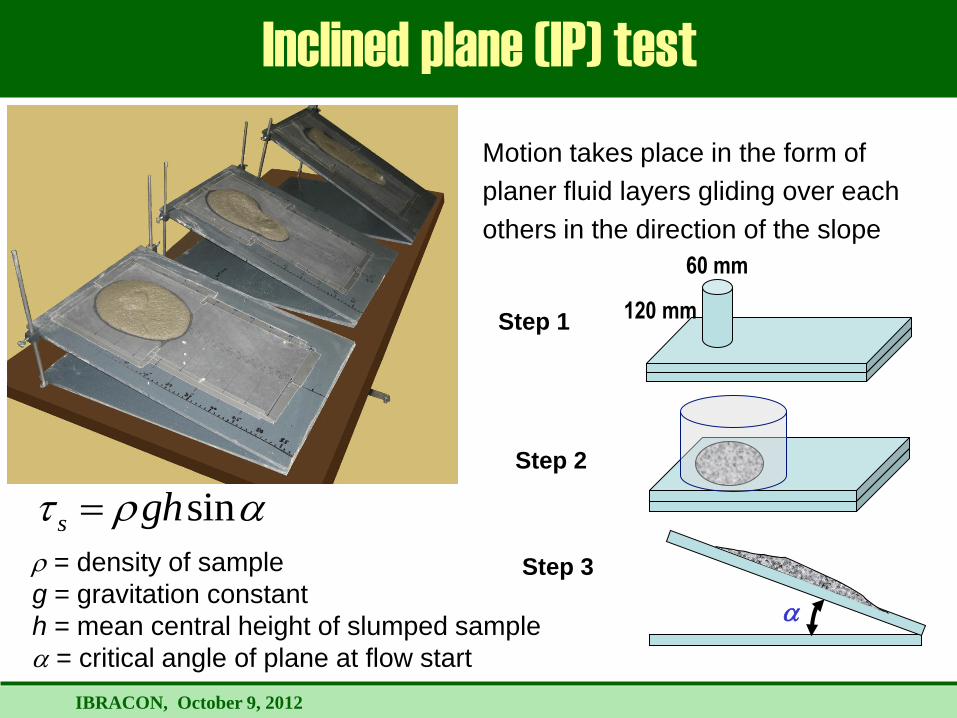
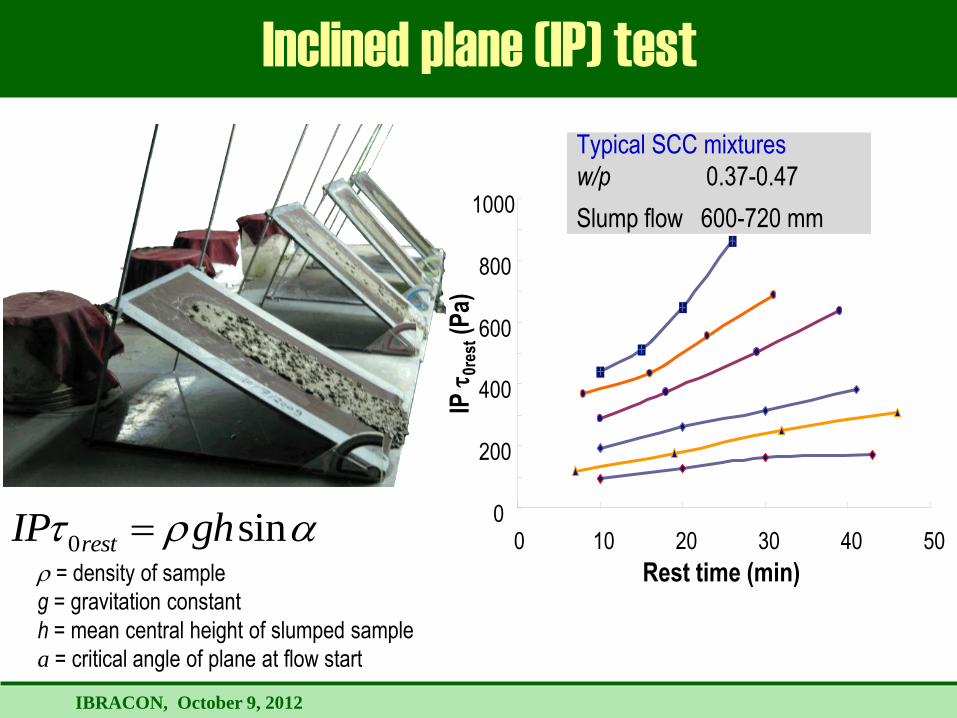
Motion takes place in the form of
planer fluid layers gliding over each
others in the direction of the slope
r = density of sample
g = gravitation constant
h = mean central height of slumped sample
a = critical angle of plane at flow start
sins ght r a
Step 1
60 mm
120 mm
Step 2
a
Step 3
Inclined plane (IP) test
IBRACON, October 9, 2012
Inclined plane (IP) test
r = density of sample
g = gravitation constant
h = mean central height of slumped sample
a = critical angle of plane at flow start
0 sinrestIP ght r a0
200
400
600
800
1000
0 10 20 30 40 50
Rest time (min)
IP t
0res
t (P
a)
Typical SCC mixtures
w/p 0.37-0.47
Slump flow 600-720 mm
IBRACON, October 9, 2012
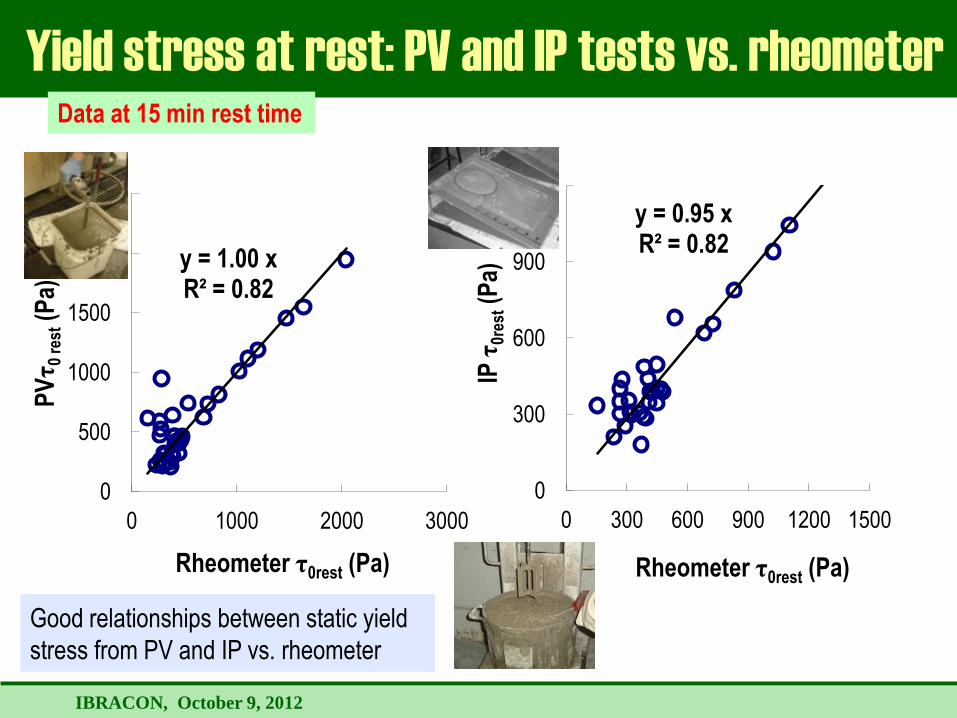
y = 0.95 x R² = 0.82
0
300
600
900
1200
0 300 600 900 1200 1500
IP τ
0res
t (P
a)
Rheometer τ0rest (Pa)
Yield stress at rest: PV and IP tests vs. rheometer
y = 1.00 x R² = 0.82
0
500
1000
1500
2000
2500
0 1000 2000 3000
PV
τ0
rest
(P
a)
Rheometer τ0rest (Pa)
Good relationships between static yield
stress from PV and IP vs. rheometer
Data at 15 min rest time
IBRACON, October 9, 2012
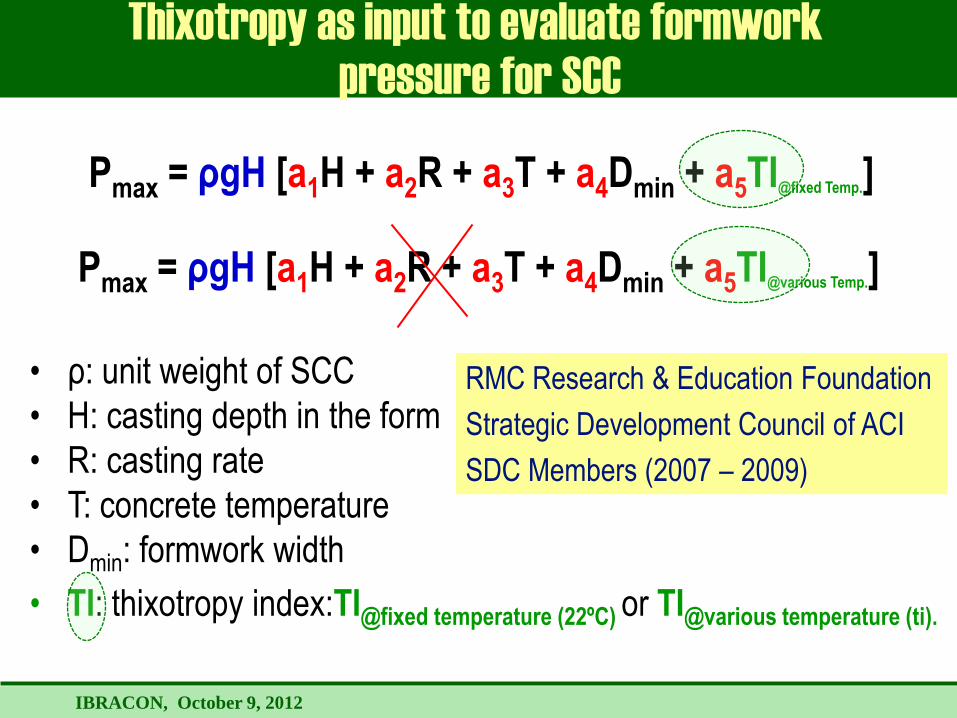
• ρ: unit weight of SCC
• H: casting depth in the form
• R: casting rate
• T: concrete temperature
• Dmin: formwork width
• TI: thixotropy index:TI@fixed temperature (22ºC) or TI@various temperature (ti).
Thixotropy as input to evaluate formwork
pressure for SCC
P
Pmax = ρgH [a1H + a2R + a3T + a4Dmin + a5TI@fixed Temp.]
Pmax = ρgH [a1H + a2R + a3T + a4Dmin + a5TI@various Temp.]
RMC Research & Education Foundation
Strategic Development Council of ACI
SDC Members (2007 – 2009)
IBRACON, October 9, 2012
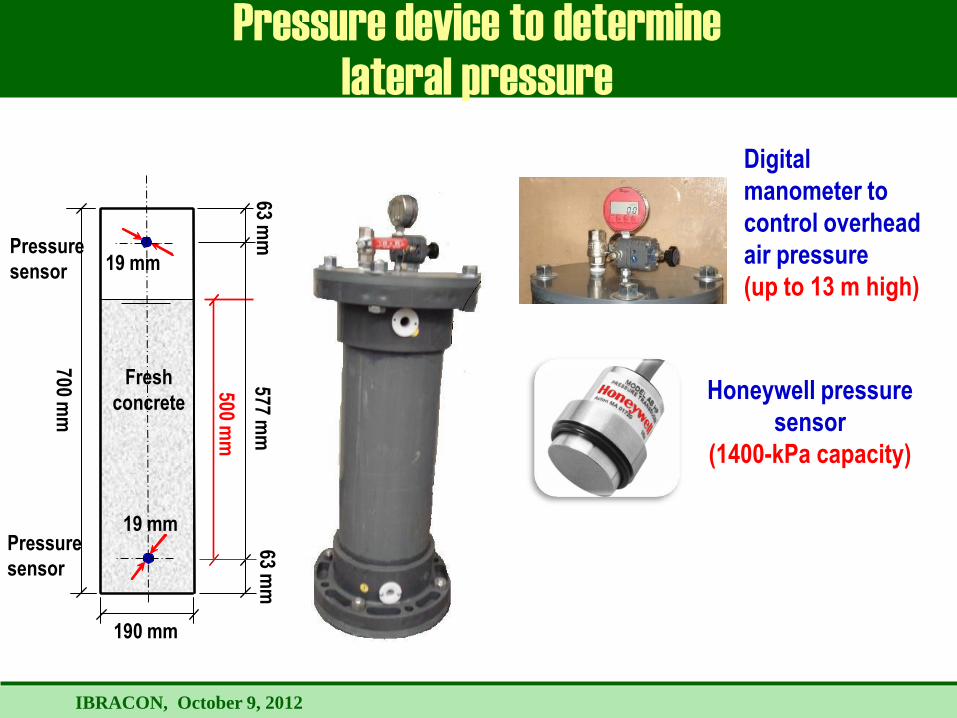
Pressure device to determine
lateral pressure
Digital
manometer to
control overhead
air pressure
(up to 13 m high)
190 mm
63 mm
577 m
m
700 mm
63 mm
Fresh
concrete
500 mm
19 mm
19 mm Pressure
sensor
Pressure
sensor
Honeywell pressure
sensor
(1400-kPa capacity)
IBRACON, October 9, 2012
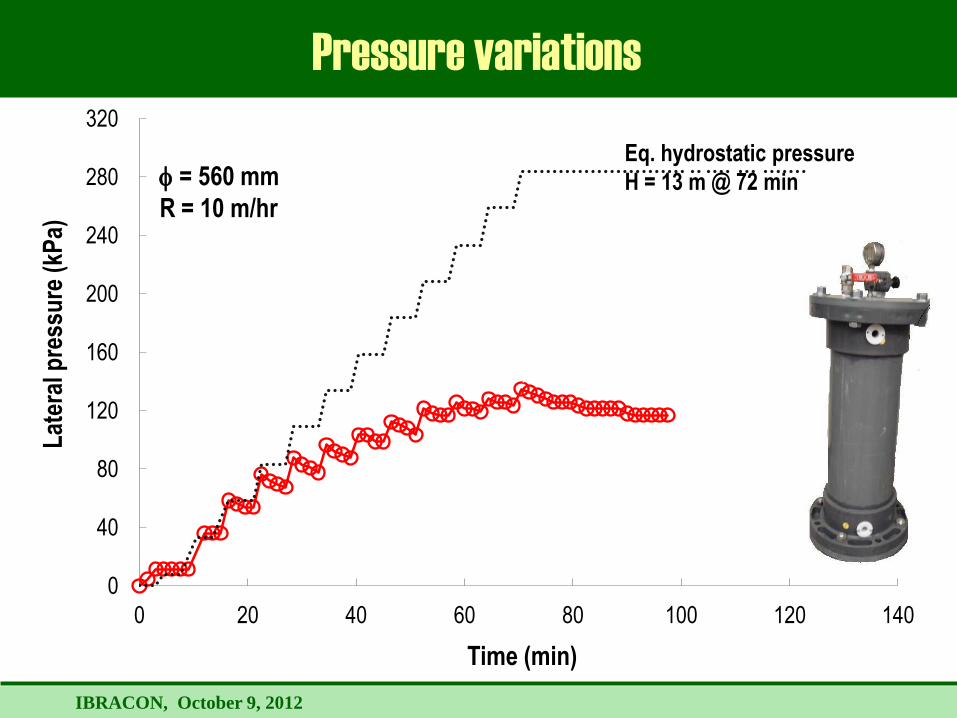
Pressure variations
0
40
80
120
160
200
240
280
320
0 20 40 60 80 100 120 140
Pre
ss
ure
(k
Pa
)
Time (min)
Hydrostatic pressure
H = 0.5 m
H = 0.35 m
SCC4
Ф= 560 mm
R = 10 m/hr
VMA = 2.8 L/m3
Sudden
increase in
pressure
reflects "blow-
up" of
overhead
pressure at
sensor location decrease in pressure
reflects material
restructuring
Reach to hydrostatic
0
40
80
120
160
200
240
280
320
0 20 40 60 80 100 120 140
Lat
eral
pre
ssu
re (
kPa)
Time (min)
= 560 mm
R = 10 m/hr
Eq. hydrostatic pressure
H = 13 m @ 72 min
IBRACON, October 9, 2012
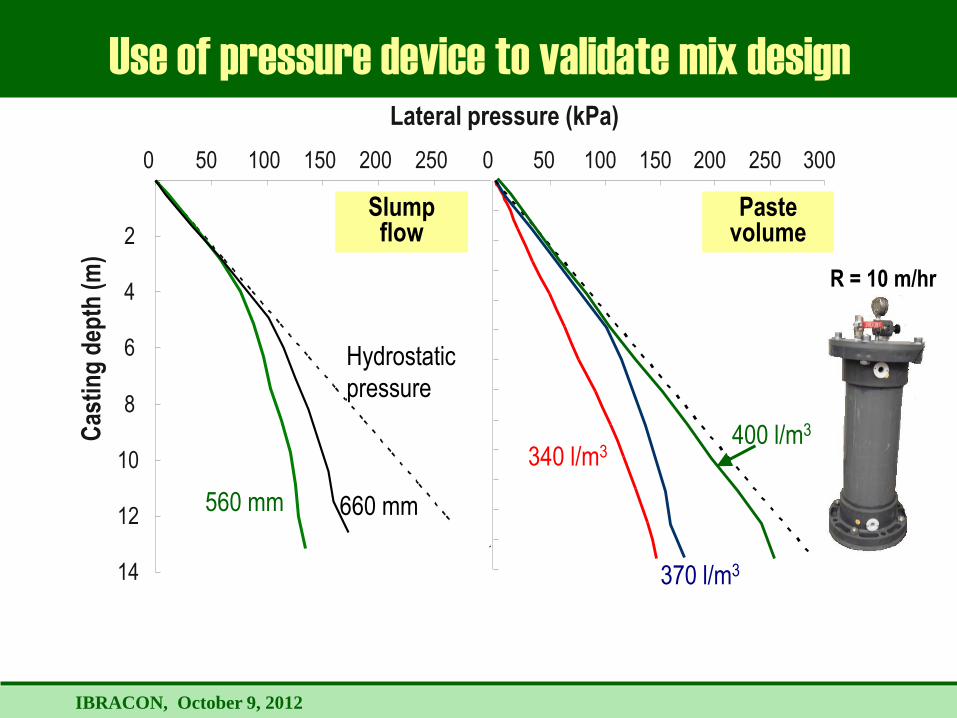
2
4
6
8
10
12
14
0 50 100 150 200 250
Lateral pressure (kPa) C
asti
ng
dep
th (
m)
560 mm 660 mm
Slump flow
0 50 100 150 200 250 300
400 l/m3
370 l/m3
340 l/m3
Paste volume
Use of pressure device to validate mix design
R = 10 m/hr
Hydrostatic
pressure
IBRACON, October 9, 2012
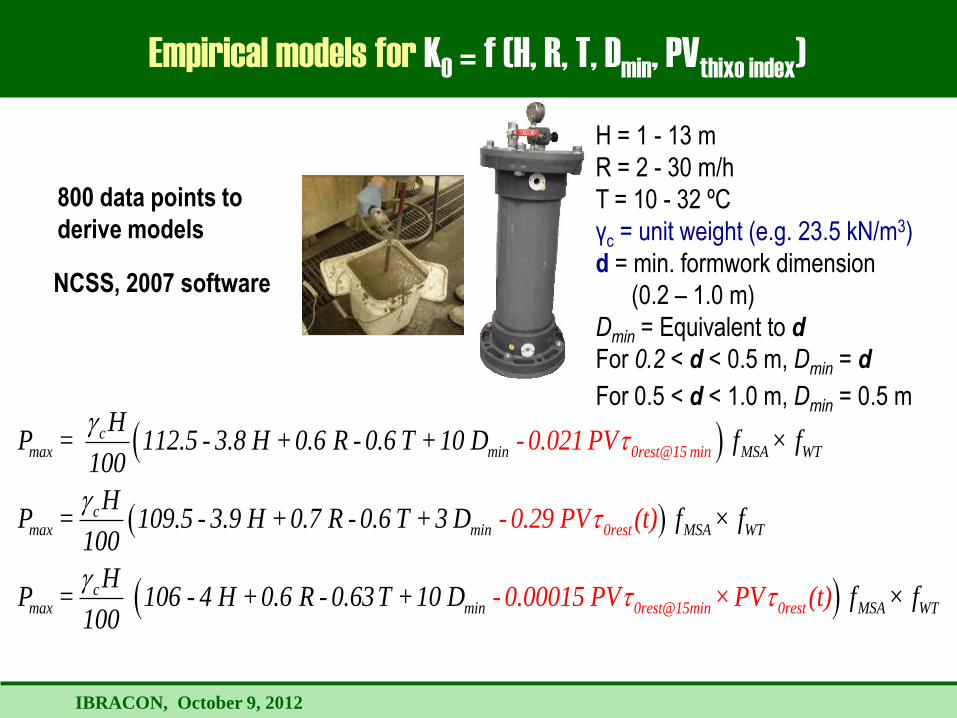
NCSS, 2007 software
800 data points to
derive models
H = 1 - 13 m
R = 2 - 30 m/h
T = 10 - 32 ºC
γc = unit weight (e.g. 23.5 kN/m3)
d = min. formwork dimension
(0.2 – 1.0 m)
Dmin = Equivalent to d
For 0.2 < d < 0.5 m, Dmin = d
For 0.5 < d < 1.0 m, Dmin = 0.5 m
t
t
cmax min MSA WT0
cmax min MSA WT
cmax
rest@15 min
0rest
HP = 112.5 - 3.8 H + 0.6 R - 0.6 T + 10 D f × f
100
HP = 109.5 - 3.9 H + 0.7 R - 0.6 T + 3 D f × f
1
- 0.021 PV
- 0.29 P00
HP = 106 - 4 H + 0.6 R -
100
V (t)
t t0rest@15min 0rmin MSA Wes Tt 0.63 -T + 10 D 0.00015 PV × PV (t f × f)
Empirical models for K0 = f (H, R, T, D
min, PV
thixo index)
IBRACON, October 9, 2012
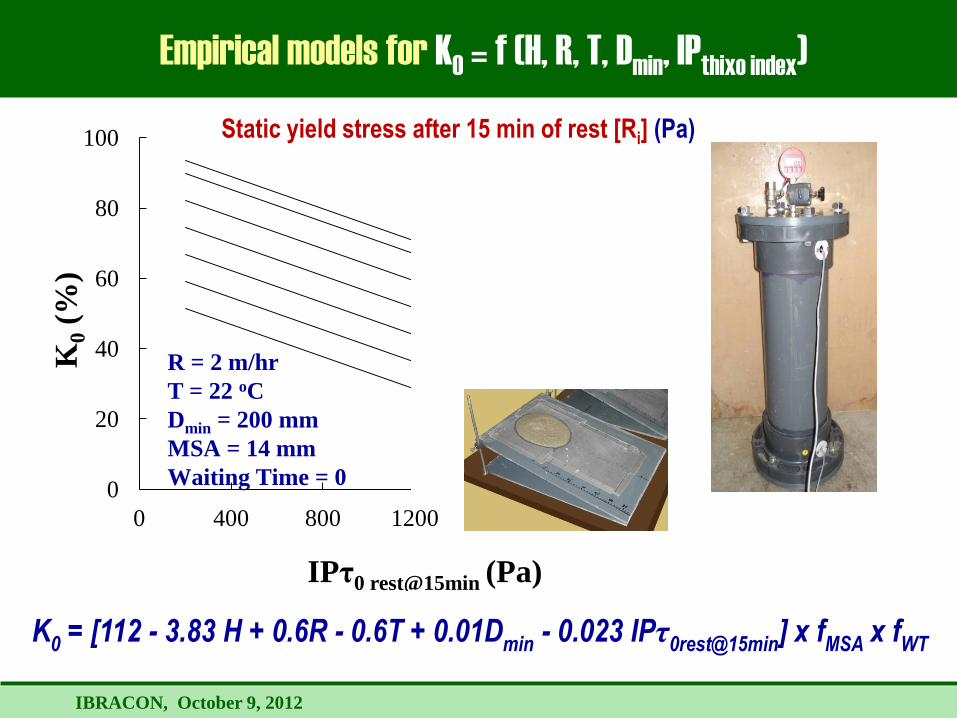
Empirical models for K0 = f (H, R, T, D
min, IP
thixo index)
K0 = [112 - 3.83 H + 0.6R - 0.6T + 0.01Dmin - 0.023 IPτ0rest@15min] x fMSA x fWT
0
20
40
60
80
100
0 400 800 1200 1600 2000
K0 (
%)
IPτ0 rest@15min (Pa)
K0@H=1m K0@H=2m
K0@H=4m
K0@H=6m
K0@H=8m
K0@H=10m
K0@H=12m
R = 2 m/hr
T = 22 oC
Dmin = 200 mm
MSA = 14 mm
Waiting Time = 0
Static yield stress after 15 min of rest [Ri] (Pa)
IBRACON, October 9, 2012
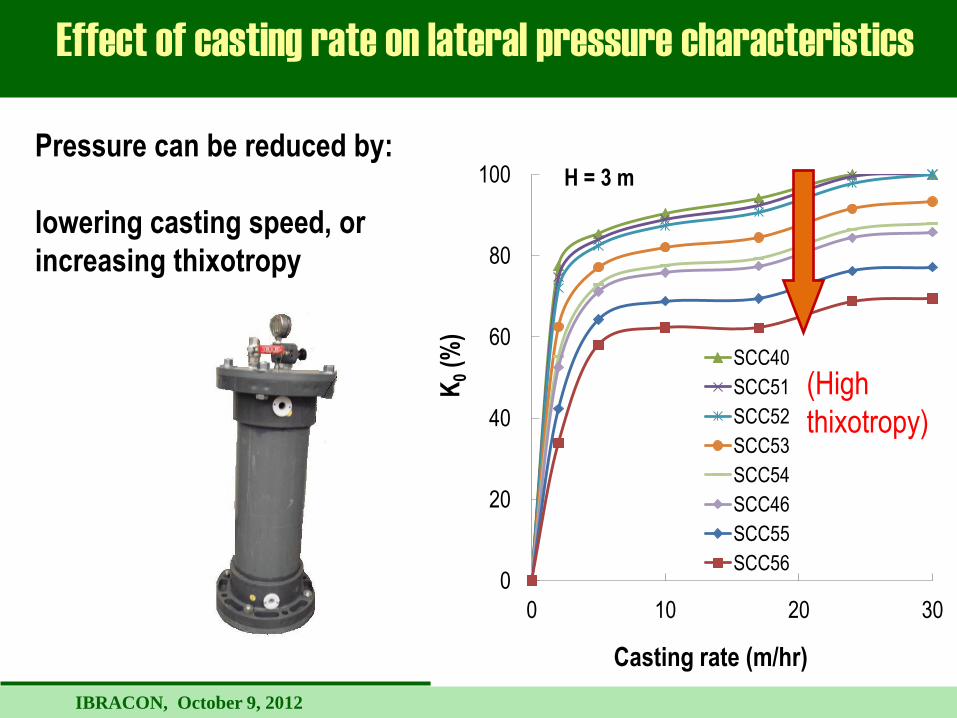
Effect of casting rate on lateral pressure characteristics
0
20
40
60
80
100
0 10 20 30
K0
(%)
Casting rate (m/hr)
SCC40
SCC51
SCC52
SCC53
SCC54
SCC46
SCC55
SCC56
H = 3 m
(
(High
thixotropy)
Pressure can be reduced by:
lowering casting speed, or
increasing thixotropy
IBRACON, October 9, 2012
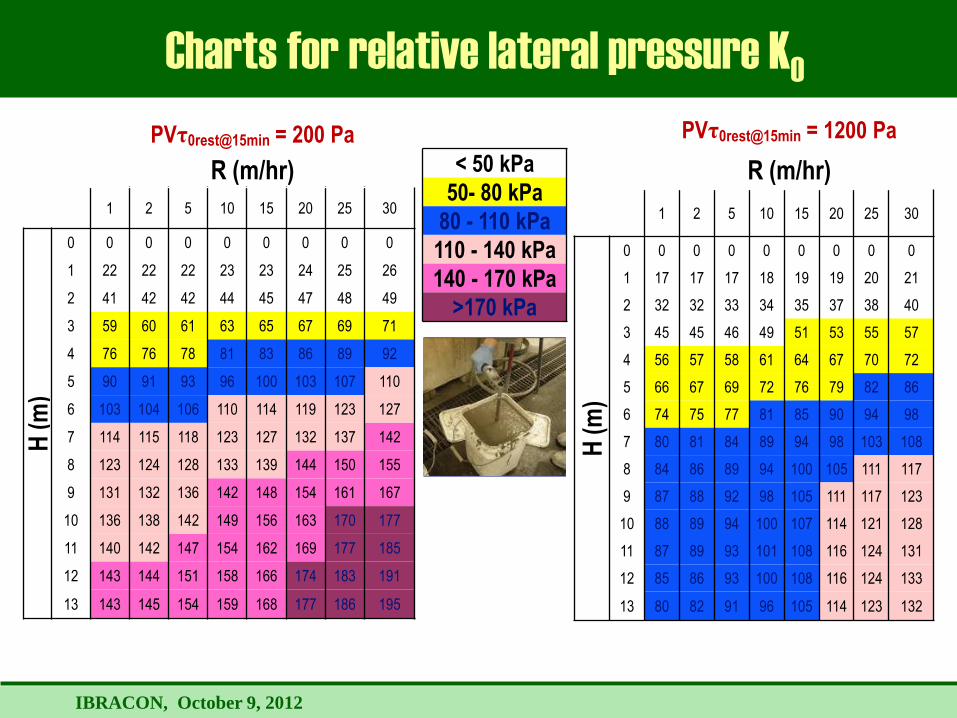
PVτ0rest@15min = 1200 Pa
R (m/hr)
1 2 5 10 15 20 25 30
H (
m)
0 0 0 0 0 0 0 0 0
1 17 17 17 18 19 19 20 21
2 32 32 33 34 35 37 38 40
3 45 45 46 49 51 53 55 57
4 56 57 58 61 64 67 70 72
5 66 67 69 72 76 79 82 86
6 74 75 77 81 85 90 94 98
7 80 81 84 89 94 98 103 108
8 84 86 89 94 100 105 111 117
9 87 88 92 98 105 111 117 123
10 88 89 94 100 107 114 121 128
11 87 89 93 101 108 116 124 131
12 85 86 93 100 108 116 124 133
13 80 82 91 96 105 114 123 132
< 50 kPa
50- 80 kPa
80 - 110 kPa
110 - 140 kPa
140 - 170 kPa
>170 kPa
PVτ0rest@15min = 200 Pa
R (m/hr)
1 2 5 10 15 20 25 30
H (
m)
0 0 0 0 0 0 0 0 0
1 22 22 22 23 23 24 25 26
2 41 42 42 44 45 47 48 49
3 59 60 61 63 65 67 69 71
4 76 76 78 81 83 86 89 92
5 90 91 93 96 100 103 107 110
6 103 104 106 110 114 119 123 127
7 114 115 118 123 127 132 137 142
8 123 124 128 133 139 144 150 155
9 131 132 136 142 148 154 161 167
10 136 138 142 149 156 163 170 177
11 140 142 147 154 162 169 177 185
12 143 144 151 158 166 174 183 191
13 143 145 154 159 168 177 186 195
Charts for relative lateral pressure K0
IBRACON, October 9, 2012
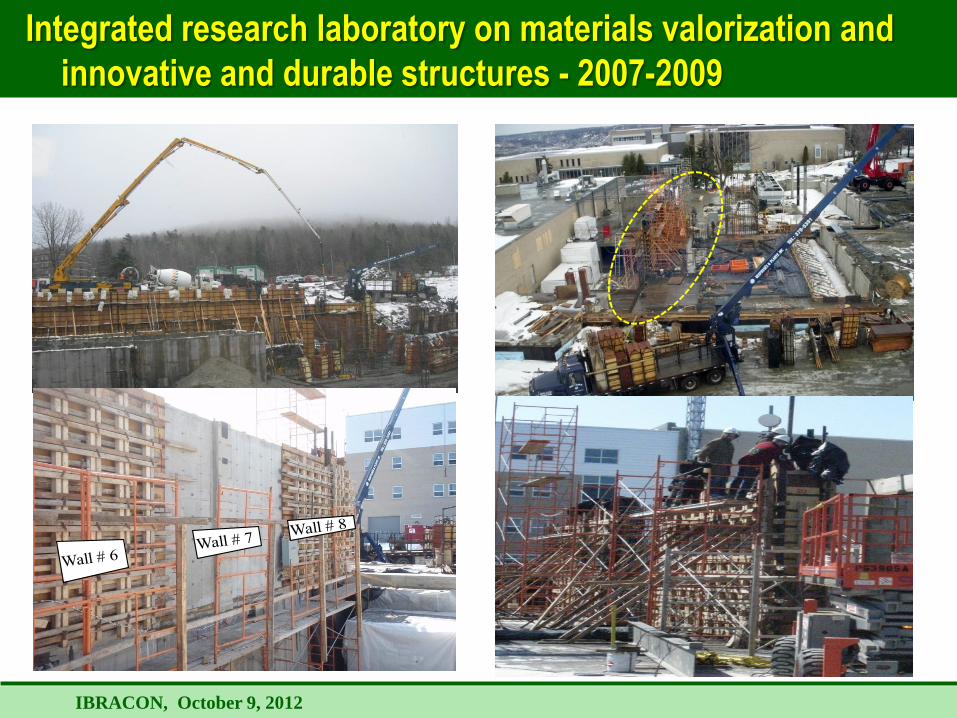
Integrated research laboratory on materials valorization and
innovative and durable structures - 2007-2009
IBRACON, October 9, 2012
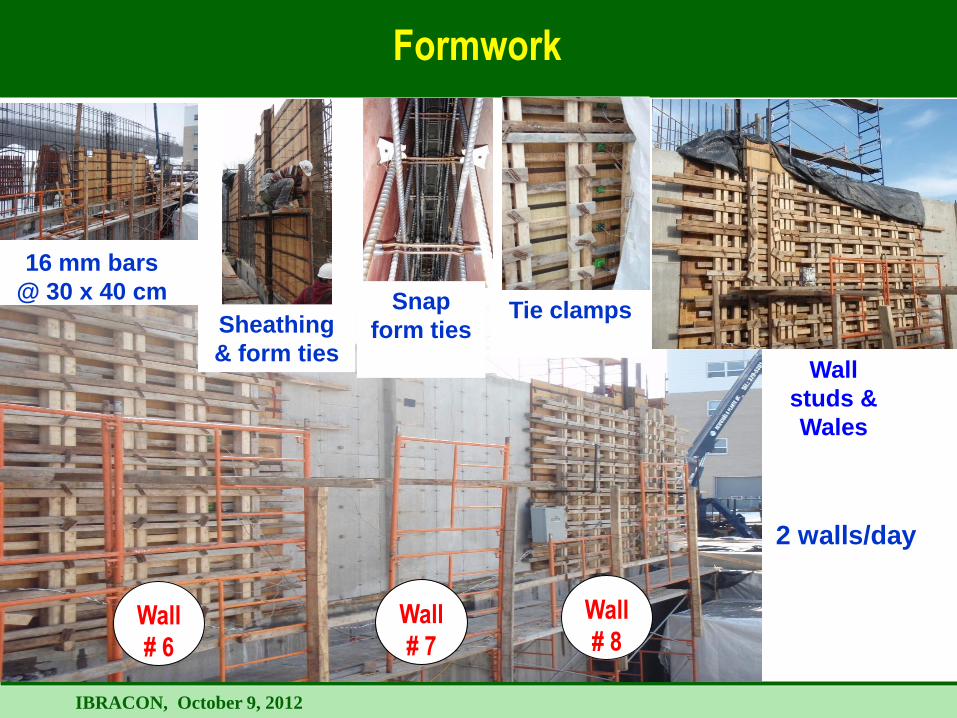
Snap
form ties Tie clamps
16 mm bars
@ 30 x 40 cm
Formwork
Wall
# 7
Wall
# 8 Wall
# 6
2 walls/day
Sheathing
& form ties Wall
studs &
Wales
IBRACON, October 9, 2012
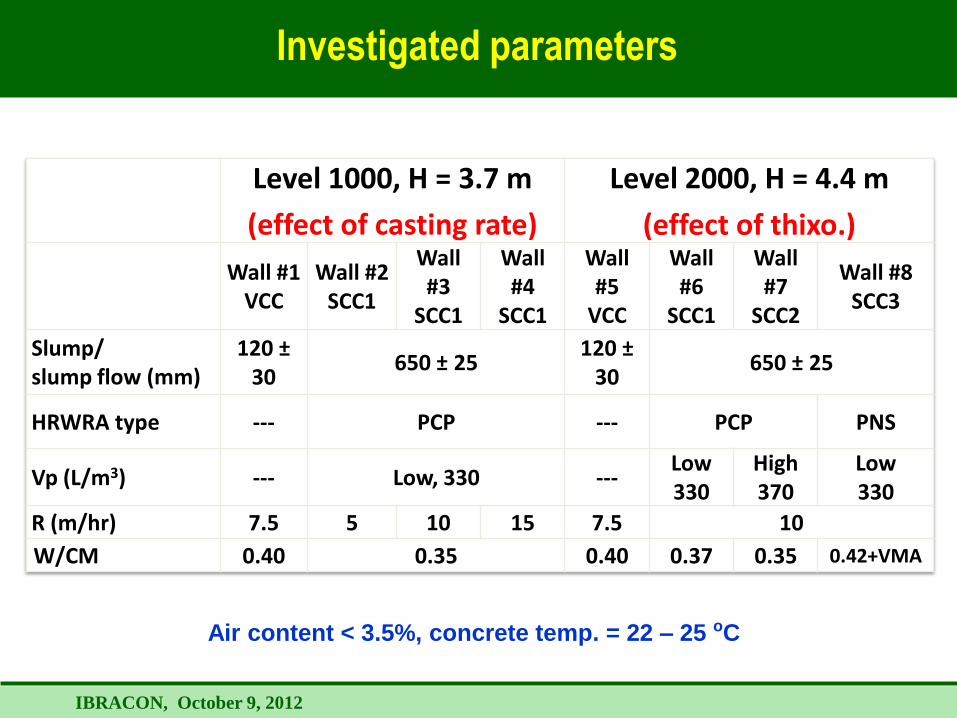
Level 1000, H = 3.7 m
(effect of casting rate)
Level 2000, H = 4.4 m
(effect of thixo.)
Wall #1 VCC
Wall #2 SCC1
Wall #3
SCC1
Wall #4
SCC1
Wall #5
VCC
Wall #6
SCC1
Wall #7
SCC2
Wall #8 SCC3
Slump/ slump flow (mm)
120 ± 30
650 ± 25 120 ±
30 650 ± 25
HRWRA type --- PCP --- PCP PNS
Vp (L/m3) --- Low, 330 --- Low 330
High 370
Low 330
R (m/hr) 7.5 5 10 15 7.5 10
W/CM 0.40 0.35 0.40 0.37 0.35 0.42+VMA
Air content < 3.5%, concrete temp. = 22 – 25 oC
Investigated parameters
IBRACON, October 9, 2012
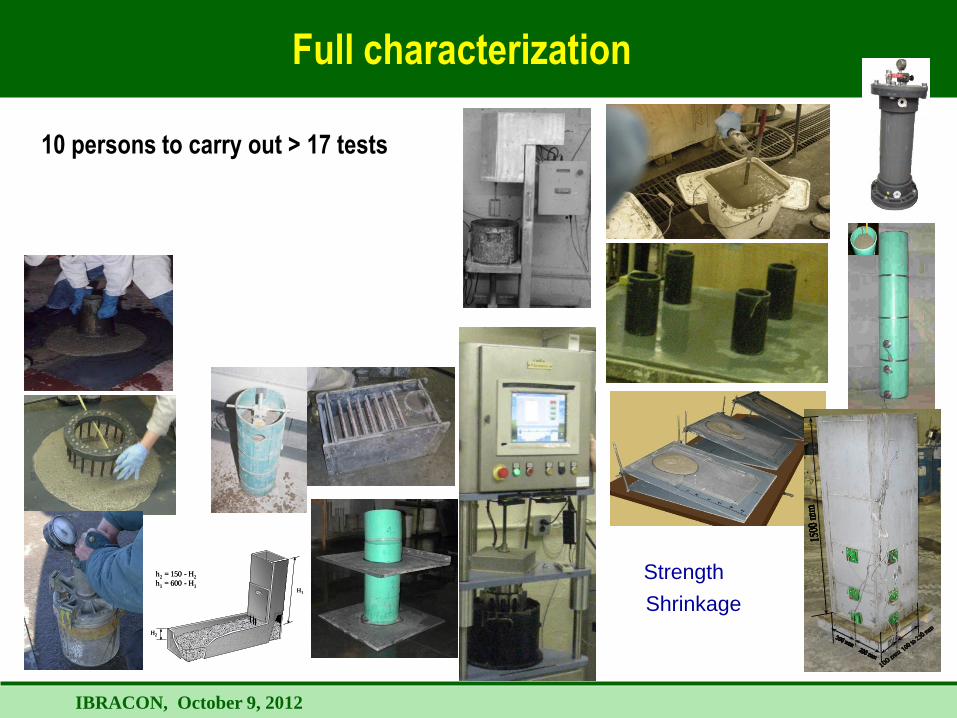
Full characterization
10 persons to carry out > 17 tests
H2
H1
h2 = 150 - H2
h1 = 600 - H1
H2
H1
h2 = 150 - H2
h1 = 600 - H1
Strength
Shrinkage
IBRACON, October 9, 2012
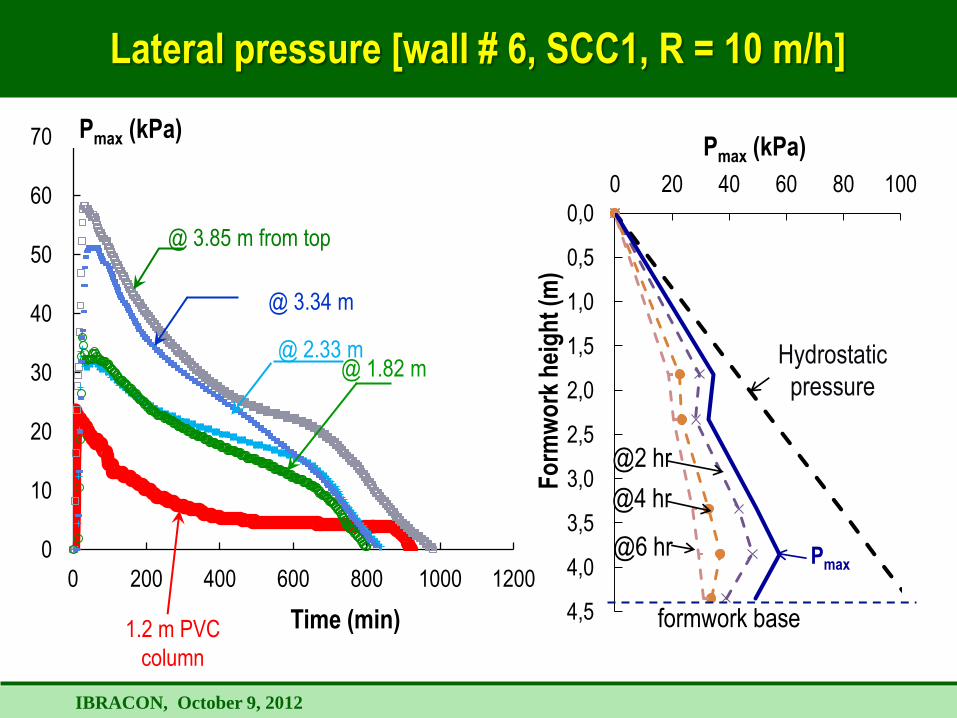
Lateral pressure [wall # 6, SCC1, R = 10 m/h]
0
10
20
30
40
50
60
70
0 200 400 600 800 1000 1200
Time (min)
Pmax (kPa)
1.2 m PVC
column
@ 1.82 m @ 2.33 m
@ 3.85 m from top
@ 3.34 m
0,0
0,5
1,0
1,5
2,0
2,5
3,0
3,5
4,0
4,5
0 20 40 60 80 100
Fo
rmw
ork
hei
gh
t (m
)
Pmax (kPa)
Hydrostatic
pressure
@2 hr
@6 hr Pmax
formwork base
@4 hr
IBRACON, October 9, 2012
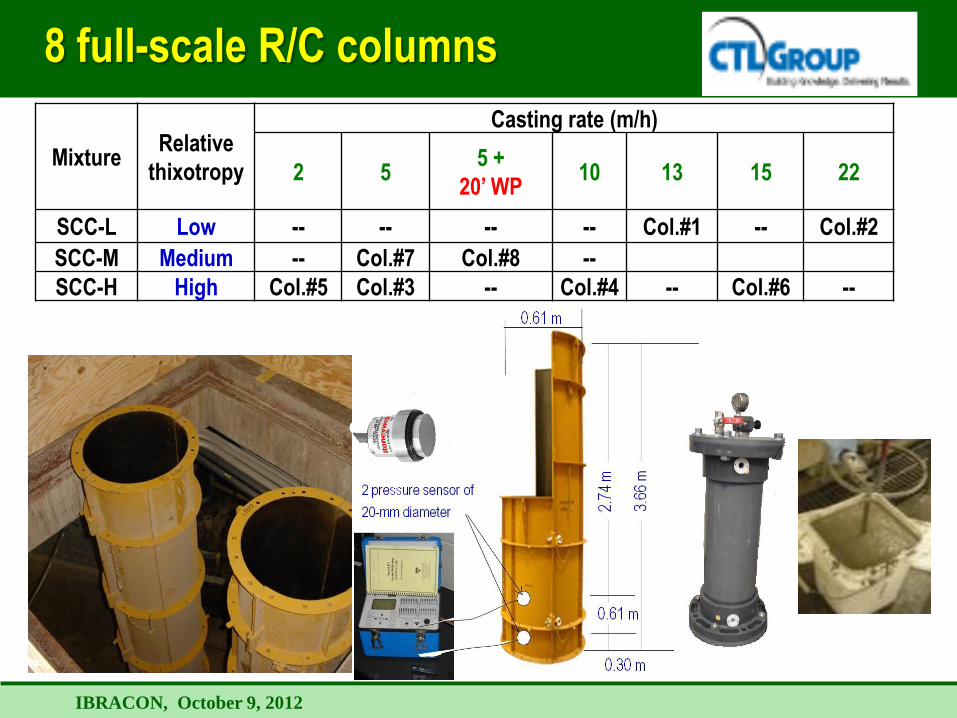
8 full-scale R/C columns
Mixture Relative
thixotropy
Casting rate (m/h)
2 5 5 +
20’ WP 10 13 15 22
SCC-L Low -- -- -- -- Col.#1 -- Col.#2
SCC-M Medium -- Col.#7 Col.#8 --
SCC-H High Col.#5 Col.#3 -- Col.#4 -- Col.#6 --
IBRACON, October 9, 2012
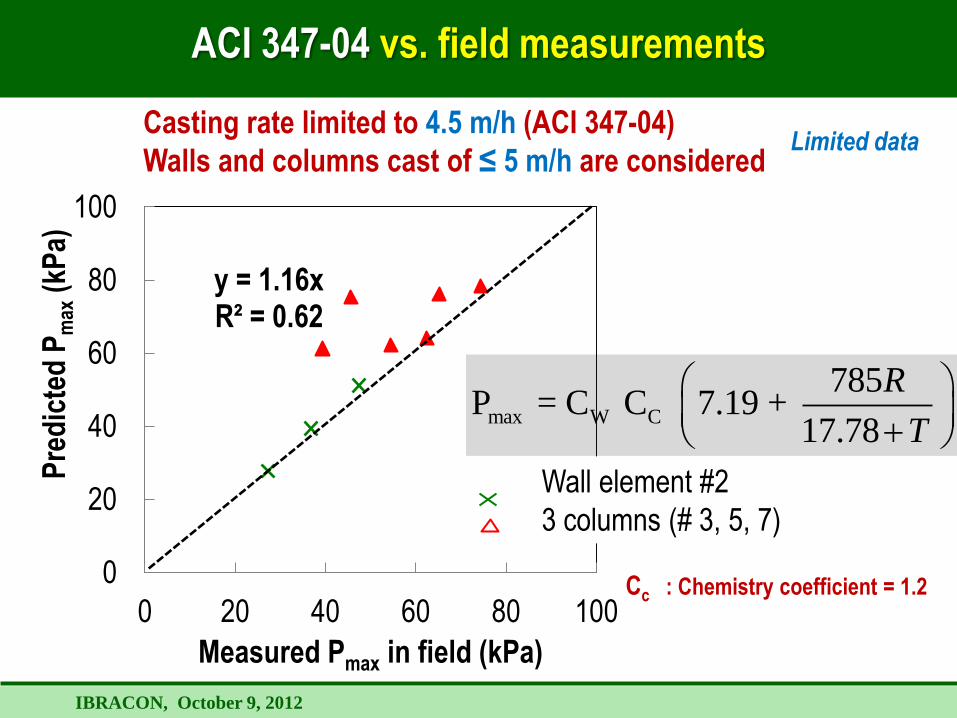
ACI 347-04 vs. field measurements
Casting rate limited to 4.5 m/h (ACI 347-04)
Walls and columns cast of ≤ 5 m/h are considered
max W C
785P = C C 7.19 +
17.78
R
T
y = 1.16x R² = 0.62
0
20
40
60
80
100
0 20 40 60 80 100
Pre
dic
ted
Pm
ax (
kPa)
Measured Pmax in field (kPa)
Wall element #2
3 columns (# 3, 5, 7)
Cc : Chemistry coefficient = 1.2
Limited data
IBRACON, October 9, 2012
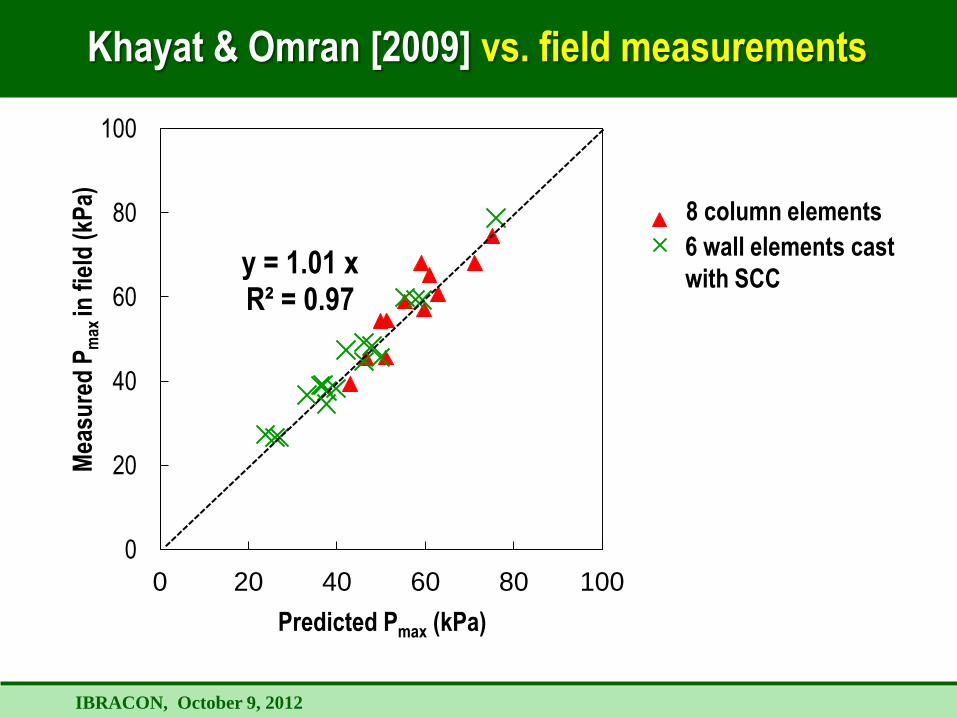
Khayat & Omran [2009] vs. field measurements
y = 1.01 x R² = 0.97
0
20
40
60
80
100
0 20 40 60 80 100
Mea
sure
d P
max
in f
ield
(kP
a)
Predicted Pmax (kPa)
C… C…
8 column elements
6 wall elements cast
with SCC
IBRACON, October 9, 2012
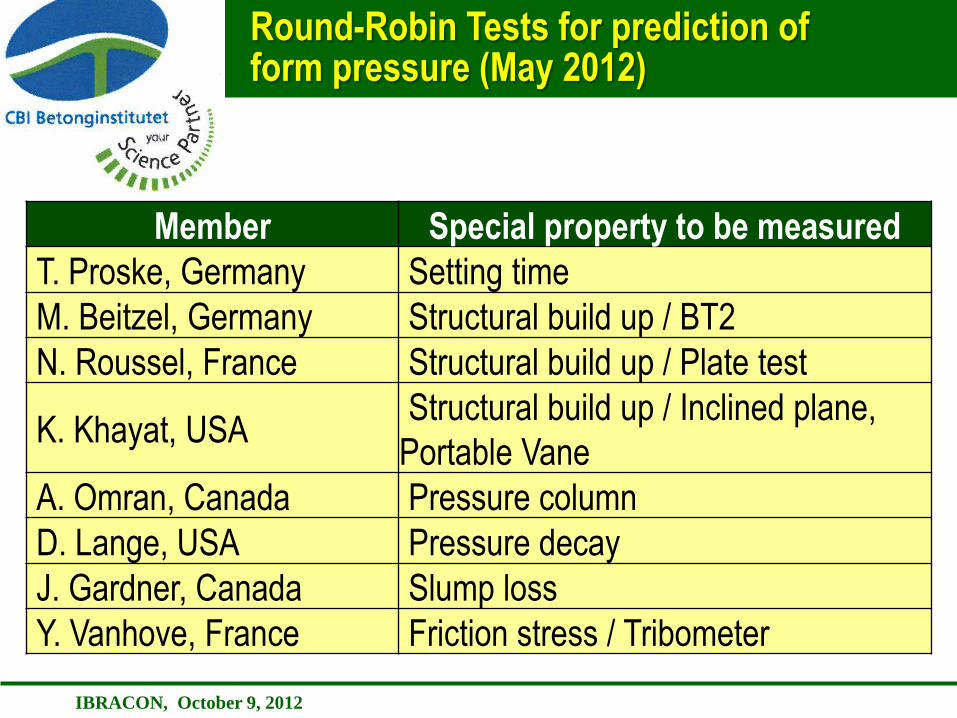
Round-Robin Tests for prediction of form pressure (May 2012)
:.
Member Special property to be measured
T. Proske, Germany Setting time
M. Beitzel, Germany Structural build up / BT2
N. Roussel, France Structural build up / Plate test
K. Khayat, USA Structural build up / Inclined plane,
Portable Vane
A. Omran, Canada Pressure column
D. Lange, USA Pressure decay
J. Gardner, Canada Slump loss
Y. Vanhove, France Friction stress / Tribometer
IBRACON, October 9, 2012
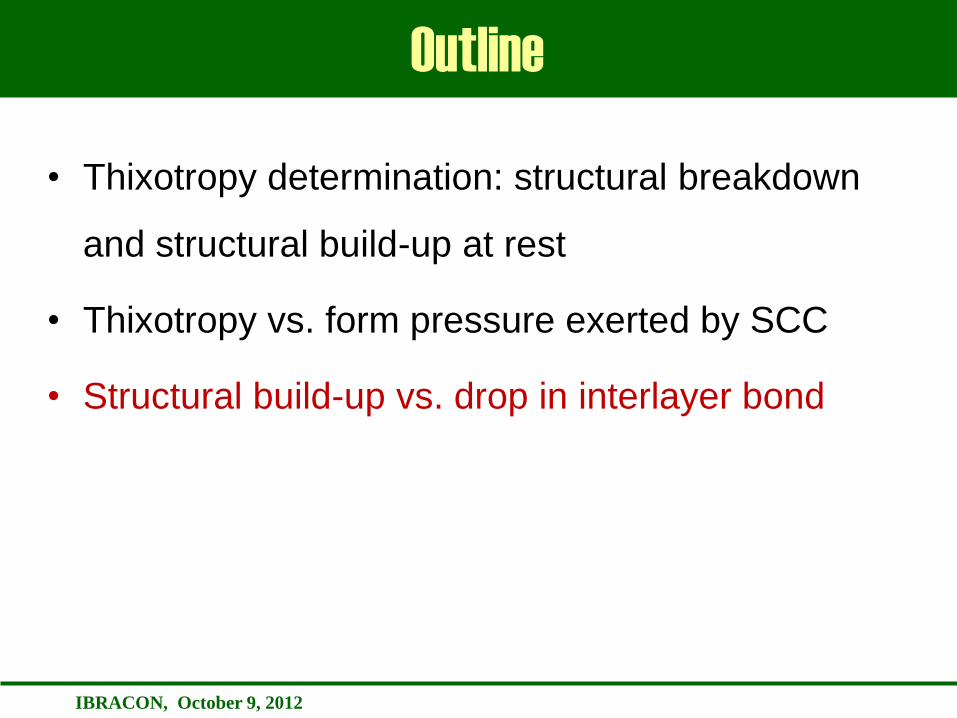
Outline
• Thixotropy determination: structural breakdown
and structural build-up at rest
• Thixotropy vs. form pressure exerted by SCC
• Structural build-up vs. drop in interlayer bond
IBRACON, October 9, 2012
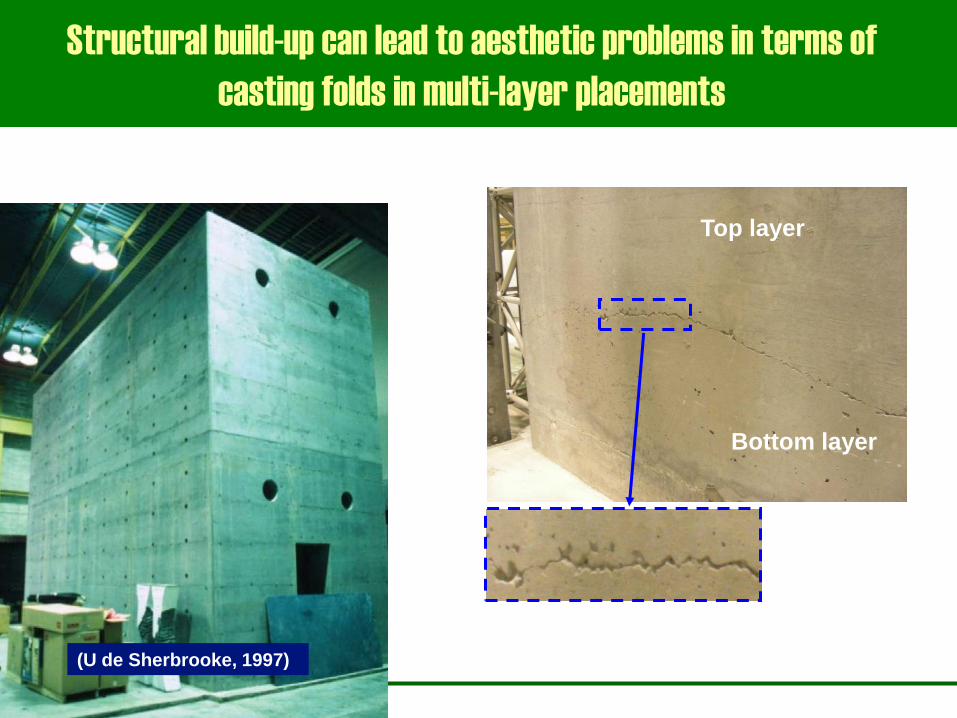
Structural build-up can lead to aesthetic problems in terms of
casting folds in multi-layer placements
New layer
(U de Sherbrooke, 1997)
Top layer
Bottom layer
Lift line
IBRACON, October 9, 2012
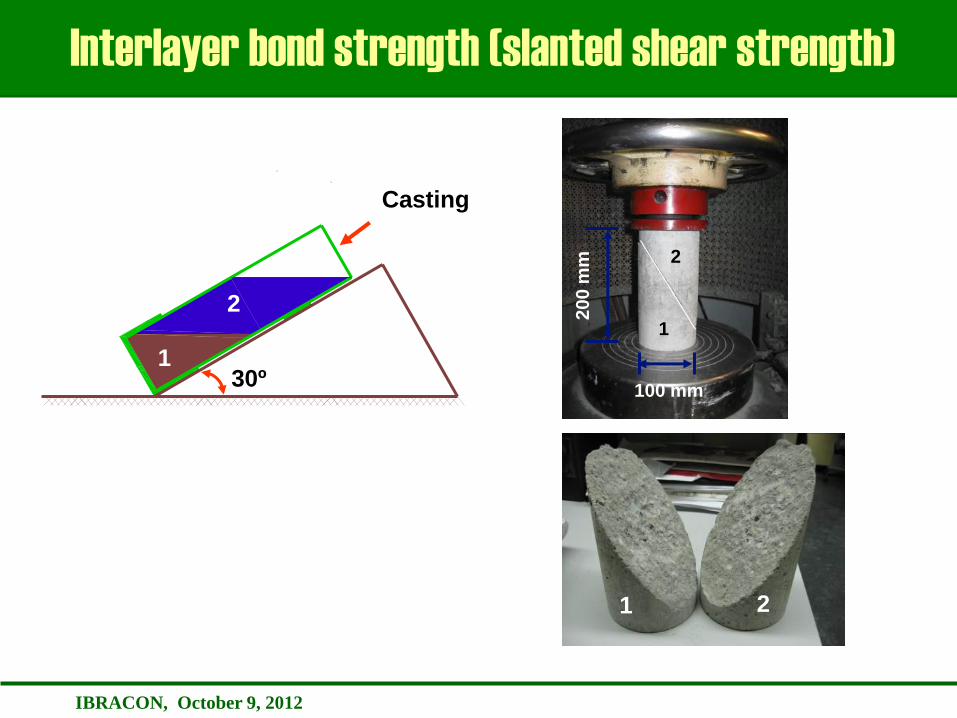
Interlayer bond strength (slanted shear strength)
Casting
30º
Small notch
1
2
100 mm
20
0 m
m
1
2
2 1
1
2
IBRACON, October 9, 2012
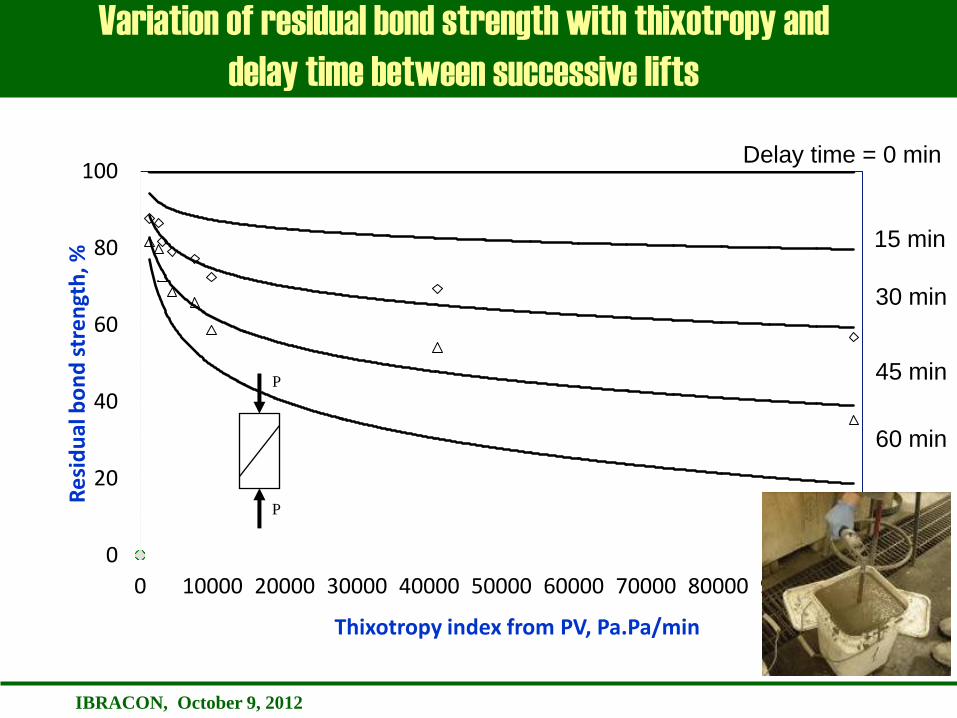
Variation of residual bond strength with thixotropy and
delay time between successive lifts
0
20
40
60
80
100
0 10000 20000 30000 40000 50000 60000 70000 80000 90000 100000
Re
sid
ual
bo
nd
str
en
gth
, %
Thixotropy index from PV, Pa.Pa/min
Delay time = 0 min
15 min
30 min
45 min
60 min
P
P
IBRACON, October 9, 2012
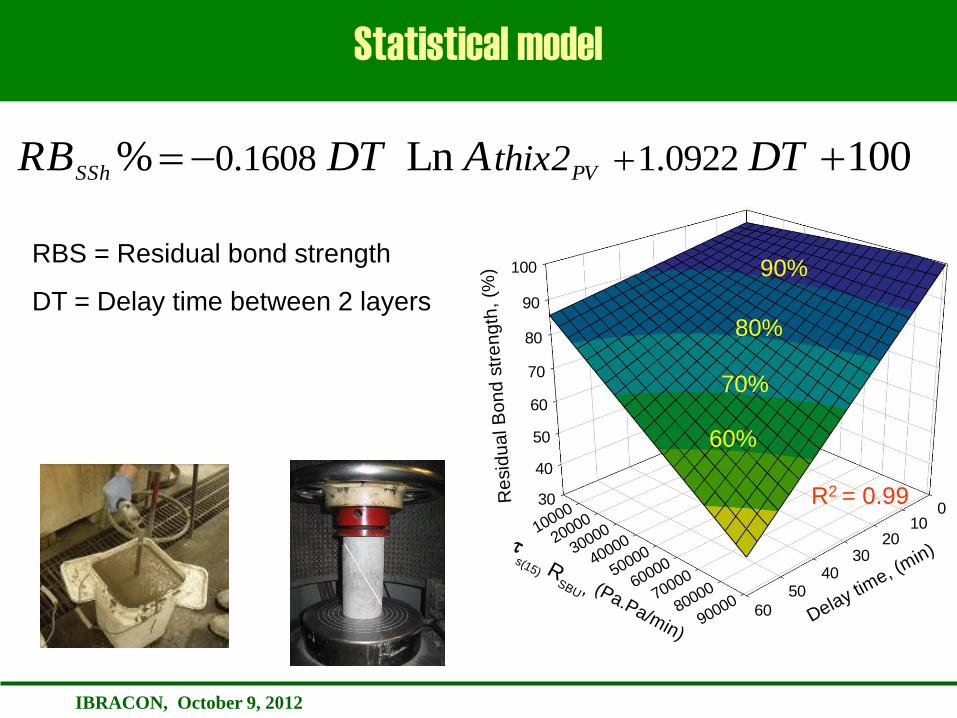
Statistical model
RBS = Residual bond strength
DT = Delay time between 2 layers
30
40
50
60
70
80
90
100
010
2030
4050
60
10000
20000
30000
40000
50000
60000
70000
80000
90000
Re
sid
ua
l B
on
d s
tre
ng
th,
(%)
Delay time, (m
in)ts(15) R
SBU , (Pa.Pa/min)
R2 = 0.99
90%
80%
70%
60%
0.1608 1.0922 % Ln 100 Eq. E.10SSh PVthix2RB DT A DT
IBRACON, October 9, 2012
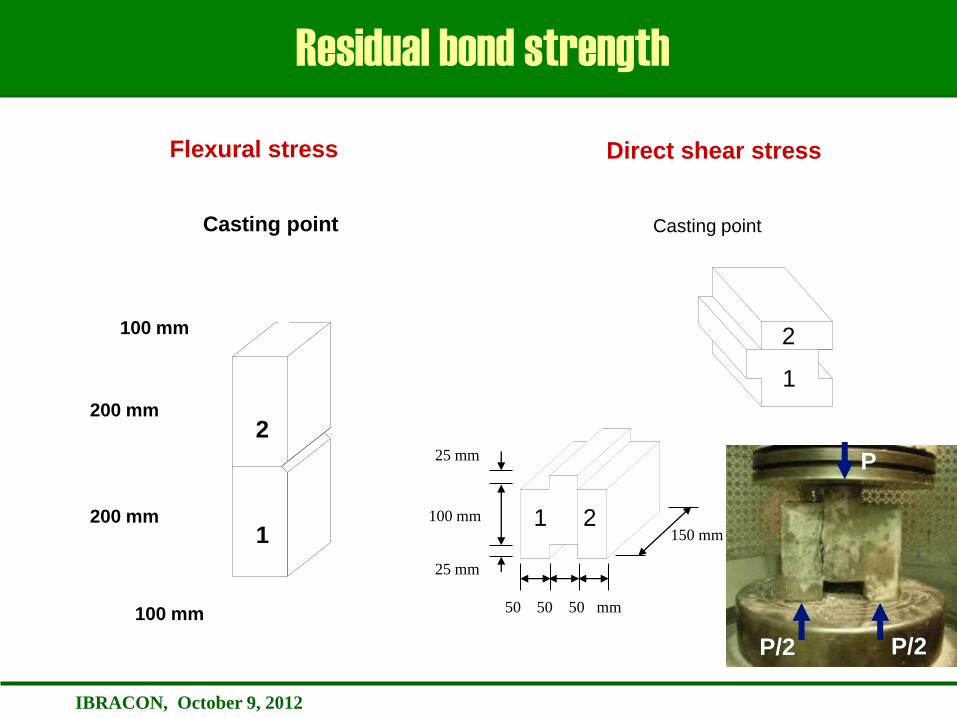
Residual bond strength
1
2
Casting point
100 mm
200 mm
200 mm
100 mm
Flexural stress
150 mm
25 mm
100 mm
25 mm
50 50 50 mm
1 2
Casting point
1
2
Direct shear stress
P
P/2 P/2
IBRACON, October 9, 2012
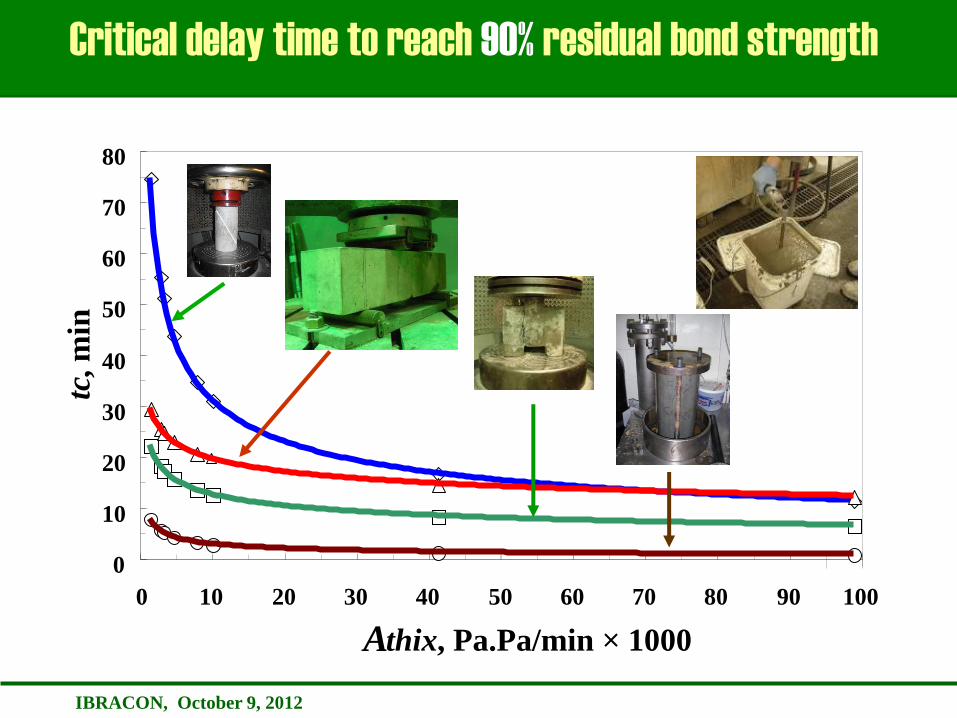
Variation in residual bond with thixotropy and test methods
0
10
20
30
40
50
60
70
80
0 10 20 30 40 50 60 70 80 90 100
A thix , Pa.Pa/min × 1000
tc , m
in
Critical delay time to reach 90% residual bond strength
IBRACON, October 9, 2012
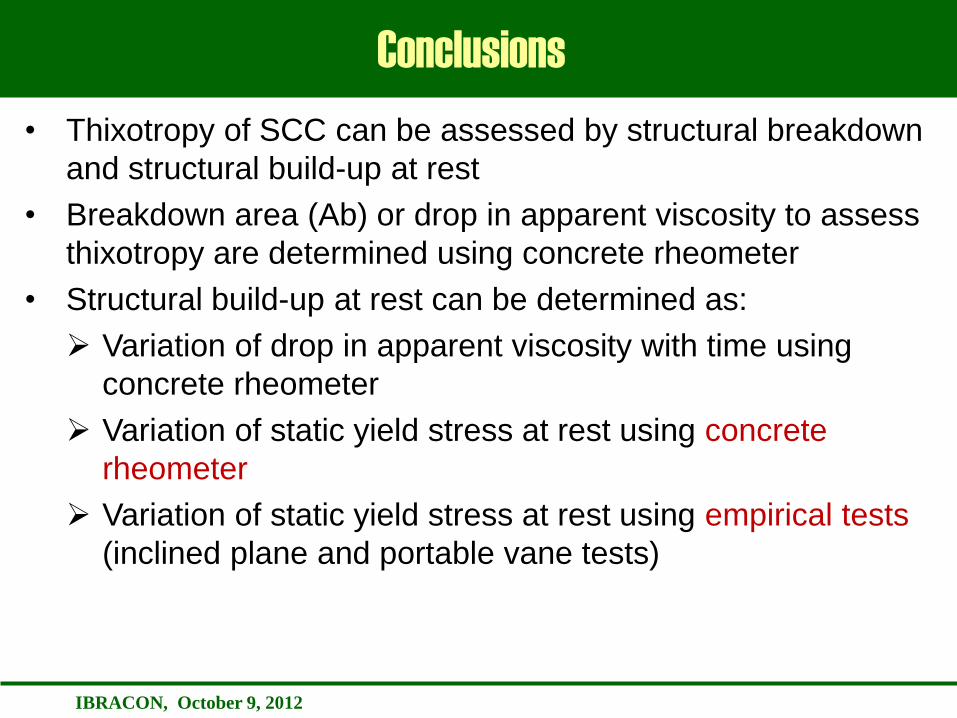
• Thixotropy of SCC can be assessed by structural breakdown
and structural build-up at rest
• Breakdown area (Ab) or drop in apparent viscosity to assess
thixotropy are determined using concrete rheometer
• Structural build-up at rest can be determined as:
Variation of drop in apparent viscosity with time using
concrete rheometer
Variation of static yield stress at rest using concrete
rheometer
Variation of static yield stress at rest using empirical tests
(inclined plane and portable vane tests)
Conclusions
IBRACON, October 9, 2012
Conclusions
• Increase of thioxotropy leads to reduction in form pressure
exerted by SCC
• Residual interlayer bond of SCC increases with decrease
thixotropy (structural build-up at rest)
• Long delayed time between casting two successive SCC
layers leads to reduction in interlayer bond
• Residual inter-layer bond strength is more critical in shear
than in flexural or compression failure modes

IBRACON, October 9, 2012
NRMC Research & Education Foundation, ACI Foundation
NSERC IRC HP-Flowable Concrete with Adapted Rheology
J. Assaad, A. Omran, W. Magdi
S. Naji, P. Billberg, A. Yahia,
O. Bonneau, N. Petrov
R. Morin, M. D’Ambrosia
Acknowledgment
IBRACON, October 9, 2012
Outline
• Thixotropy determination: structural breakdown
and structural build-up at rest
• Thixotropy vs. form pressure exerted by SCC
• Structural build-up vs. drop in interlayer bond
• Mixture parameters affecting thixotropy (form
pressure) of SCC
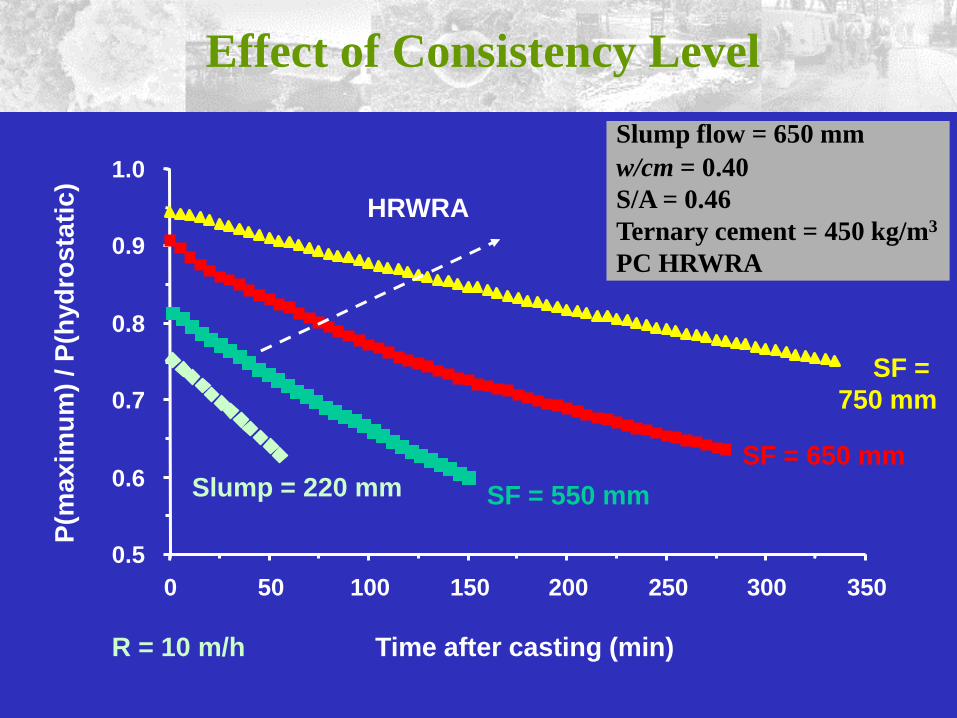
Effect of Consistency Level
0.5
0.6
0.7
0.8
0.9
1.0
0 50 100 150 200 250 300 350
Time after casting (min)
P(m
ax
imu
m)
/ P
(hyd
ros
tati
c)
SF =
750 mm
SF = 650 mm
SF = 550 mm Slump = 220 mm
HRWRA
Slump flow = 650 mm
w/cm = 0.40
S/A = 0.46
Ternary cement = 450 kg/m3
PC HRWRA
R = 10 m/h
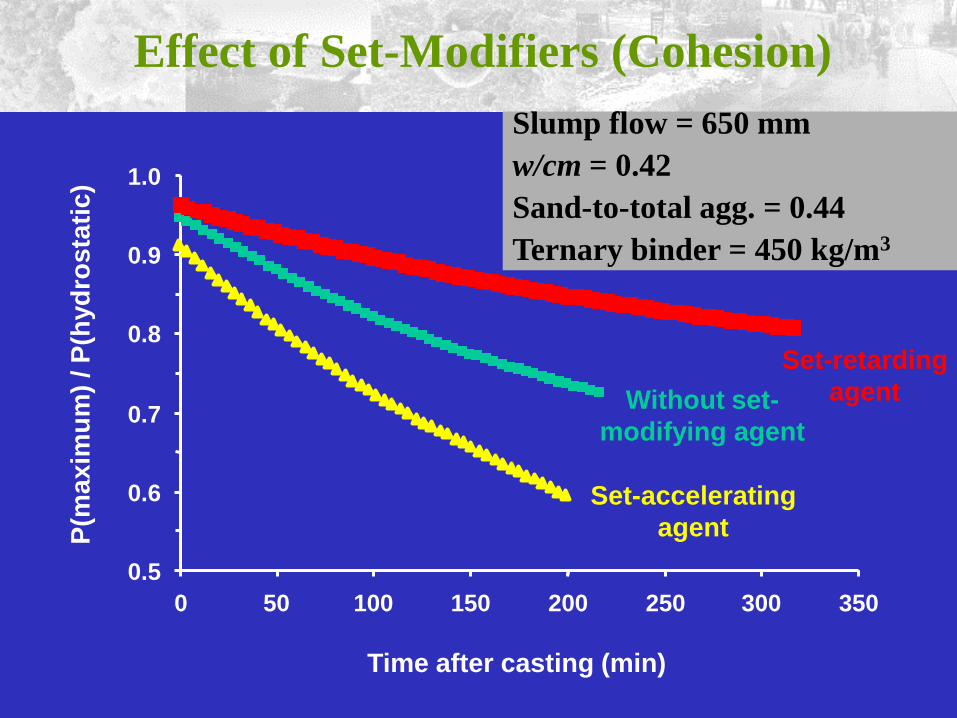
Effect of Set-Modifiers (Cohesion)
0.5
0.6
0.7
0.8
0.9
1.0
0 50 100 150 200 250 300 350
Time after casting (min)
P(m
ax
imu
m)
/ P
(hyd
ros
tati
c)
Set-retarding
agent
Set-accelerating
agent
Without set-
modifying agent
Slump flow = 650 mm
w/cm = 0.42
Sand-to-total agg. = 0.44
Ternary binder = 450 kg/m3
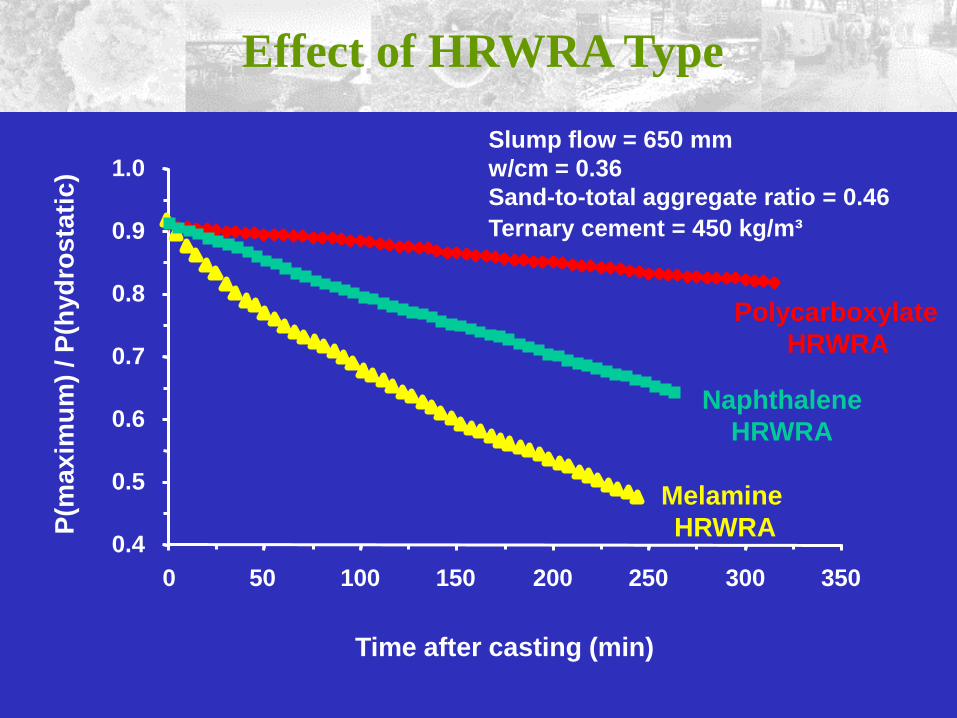
Effect of HRWRA Type
0.4
0.5
0.6
0.7
0.8
0.9
1.0
0 50 100 150 200 250 300 350
Time after casting (min)
P(m
ax
imu
m)
/ P
(hyd
ros
tati
c)
Melamine
HRWRA
Naphthalene
HRWRA
Polycarboxylate
HRWRA
Slump flow = 650 mm
w/cm = 0.36
Sand-to-total aggregate ratio = 0.46
Ternary cement = 450 kg/m³
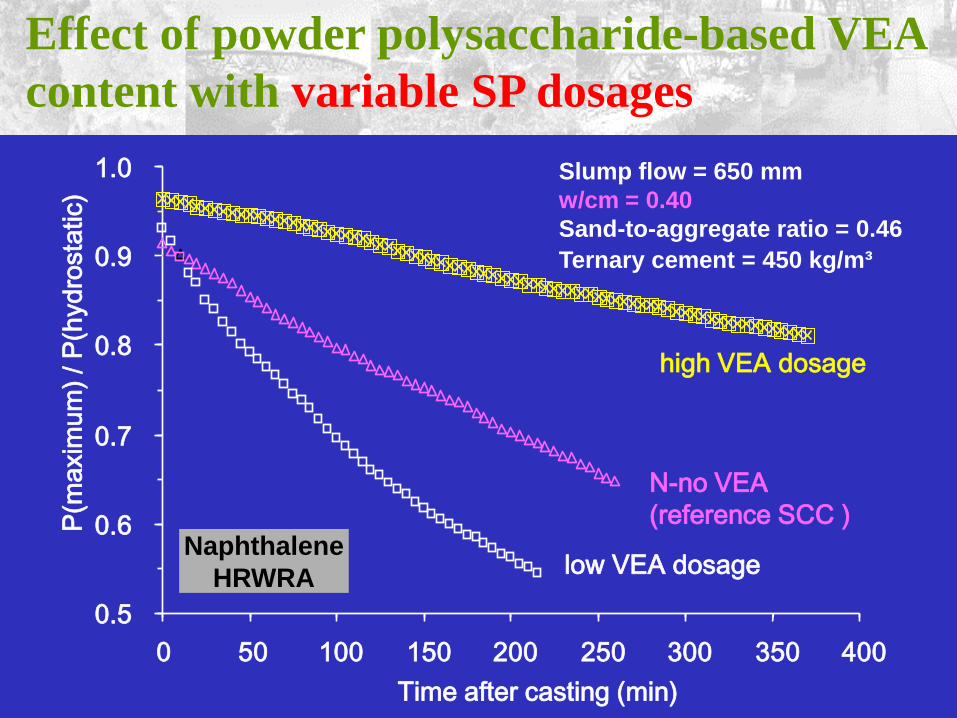
Effect of powder polysaccharide-based VEA
content with variable SP dosages
0.5
0.6
0.7
0.8
0.9
1.0
0 50 100 150 200 250 300 350 400
Time after casting (min)
P(m
axim
um
) /
P(h
yd
rosta
tic)
N-no VEA
(reference SCC )
high VEA dosage
low VEA dosage
Slump flow = 650 mm
w/cm = 0.40
Sand-to-aggregate ratio = 0.46
Ternary cement = 450 kg/m³
Naphthalene
HRWRA
Incorporation of low thickener VEA in SCC with 0.40
w/cm can lead to lower lateral pressure than in SCC
with 0.36 w/cm and no VEA
Medium or high content of polysaccharide-based
VEA + PNS-based HRWRA resulted in higher
residual pressure and lower rate of pressure drop
after casting compared to SCC with low dosage of
VEA (attributed to increased HRWRA demand)
Similar results with cellulose VEA + polycarboxylate-
based HRWRA
Effect of Stabilizers
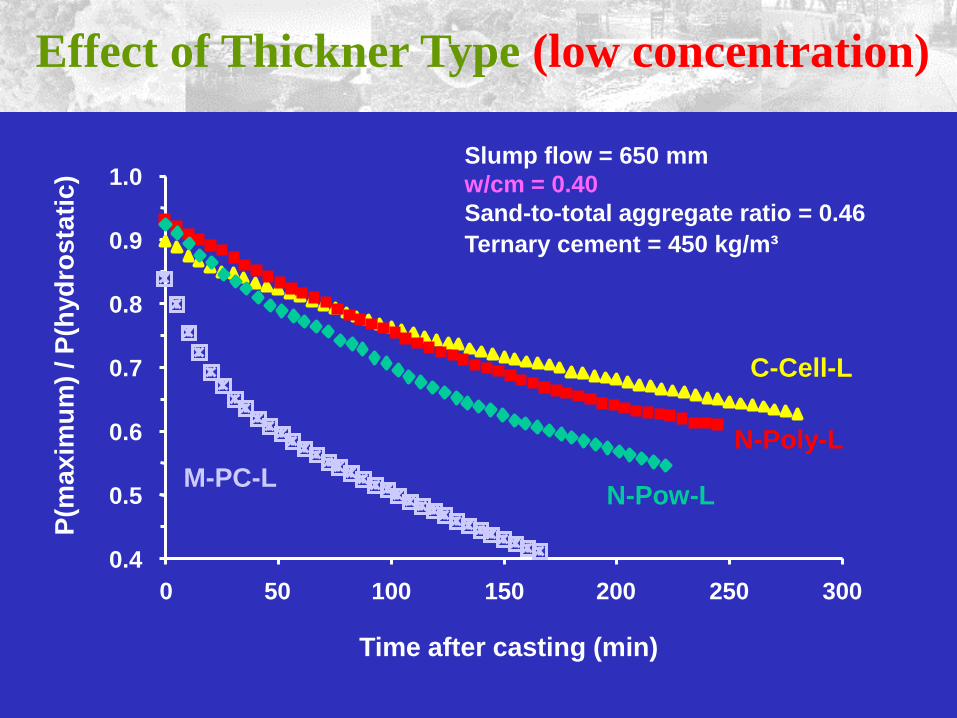
Effect of Thickner Type (low concentration)
0.4
0.5
0.6
0.7
0.8
0.9
1.0
0 50 100 150 200 250 300
Time after casting (min)
P(m
ax
imu
m)
/ P
(hyd
ros
tati
c)
C-Cell-L
N-Poly-L
N-Pow-L M-PC-L
Slump flow = 650 mm
w/cm = 0.40
Sand-to-total aggregate ratio = 0.46
Ternary cement = 450 kg/m³
Mixtures incorporating TEA exhibited the lowest
initial pressure and the fastest rate of pressure drop
Unlike conventional VEA, increase in TEA lead to
further reduction in initial pressure and increased
rate of drop in pressure
Effect of Stabilizers
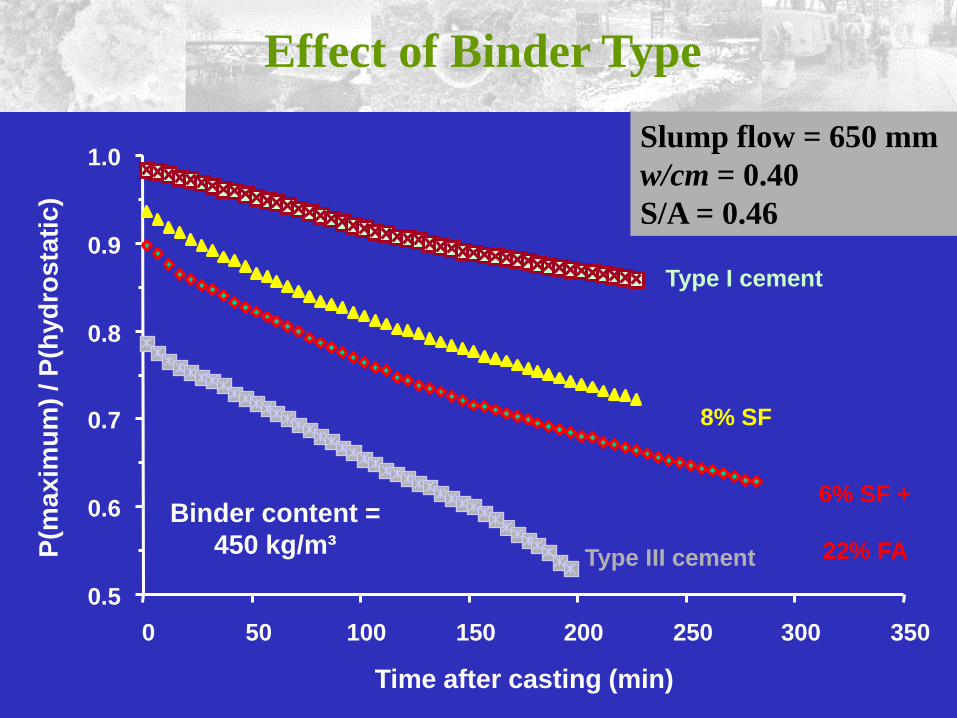
Effect of Binder Type
0.5
0.6
0.7
0.8
0.9
1.0
0 50 100 150 200 250 300 350
Time after casting (min)
P(m
ax
imu
m)
/ P
(hyd
ros
tati
c)
6% SF +
22% FA
8% SF
Type I cement
Type III cement
Binder content =
450 kg/m³
Slump flow = 650 mm
w/cm = 0.40
S/A = 0.46
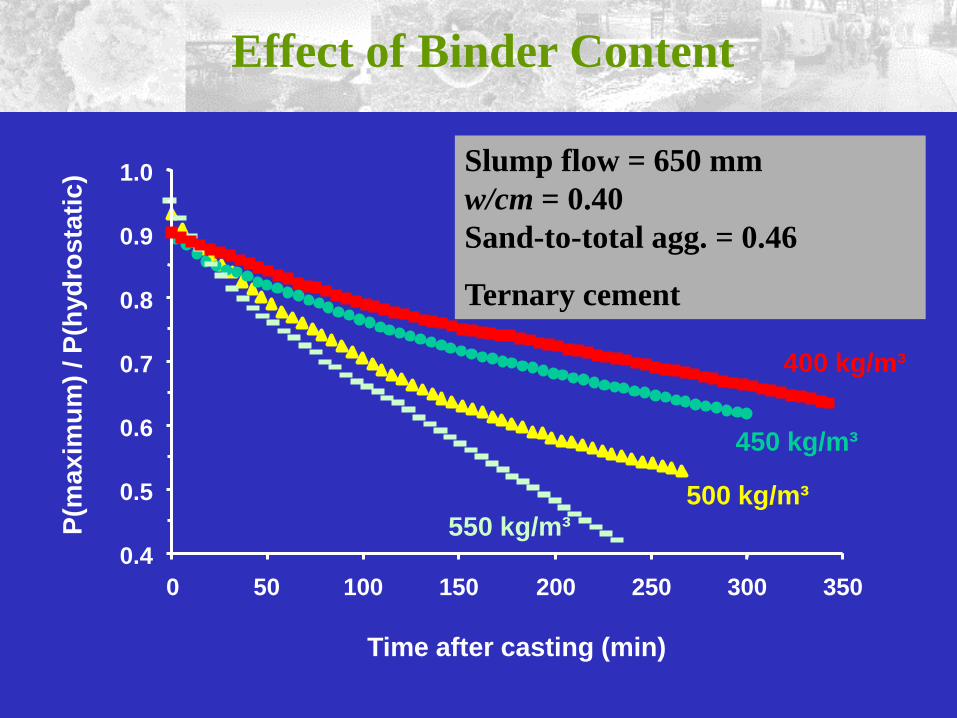
500 kg/m³
450 kg/m³
550 kg/m³
Effect of Binder Content
0.4
0
0.5
0.6
0.7
0.8
0.9
1.0
50 100 150 200 250 300 350
Time after casting (min)
P(m
ax
imu
m)
/ P
(hyd
ros
tati
c)
400 kg/m³
Slump flow = 650 mm
w/cm = 0.40
Sand-to-total agg. = 0.46
Ternary cement
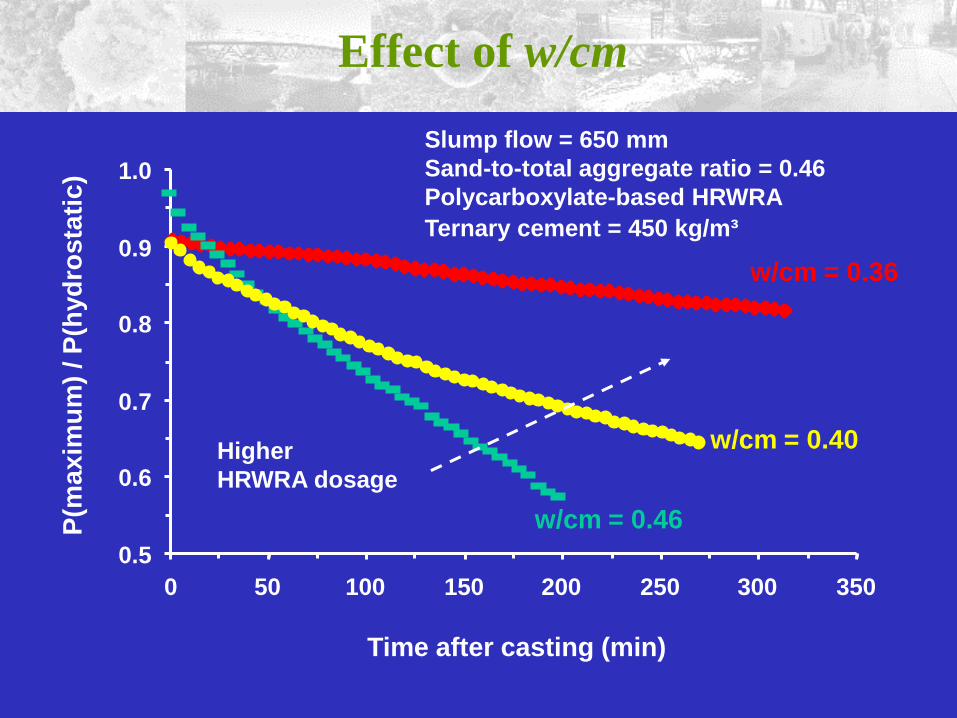
Effect of w/cm
0.5
0.6
0.7
0.8
0.9
1.0
0 50 100 150 200 250 300 350
Time after casting (min)
P(m
ax
imu
m)
/ P
(hyd
ros
tati
c)
w/cm = 0.36
Slump flow = 650 mm
Sand-to-total aggregate ratio = 0.46
Polycarboxylate-based HRWRA
Ternary cement = 450 kg/m³
w/cm = 0.46
w/cm = 0.40 Higher
HRWRA dosage
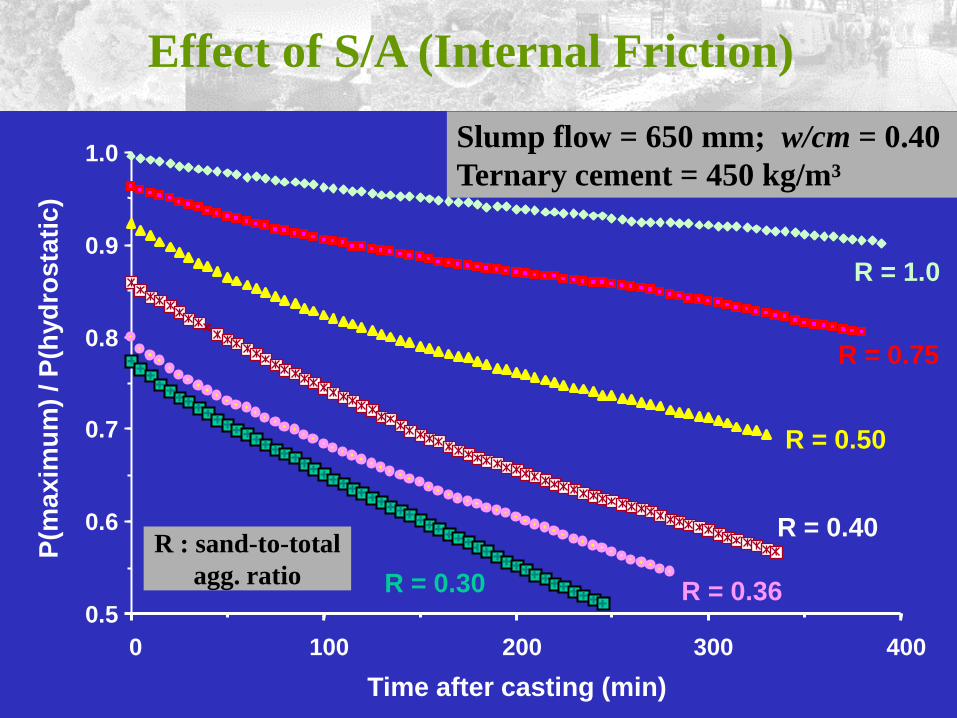
Effect of S/A (Internal Friction)
0.5
0.6
0.7
0.8
0.9
1.0
0 100 200 300 400
Time after casting (min)
P(m
ax
imu
m)
/ P
(hyd
ros
tati
c)
Slump flow = 650 mm; w/cm = 0.40
Ternary cement = 450 kg/m³
R = 1.0
R = 0.75
R = 0.50
R = 0.40
R = 0.36 R = 0.30
R : sand-to-total
agg. ratio
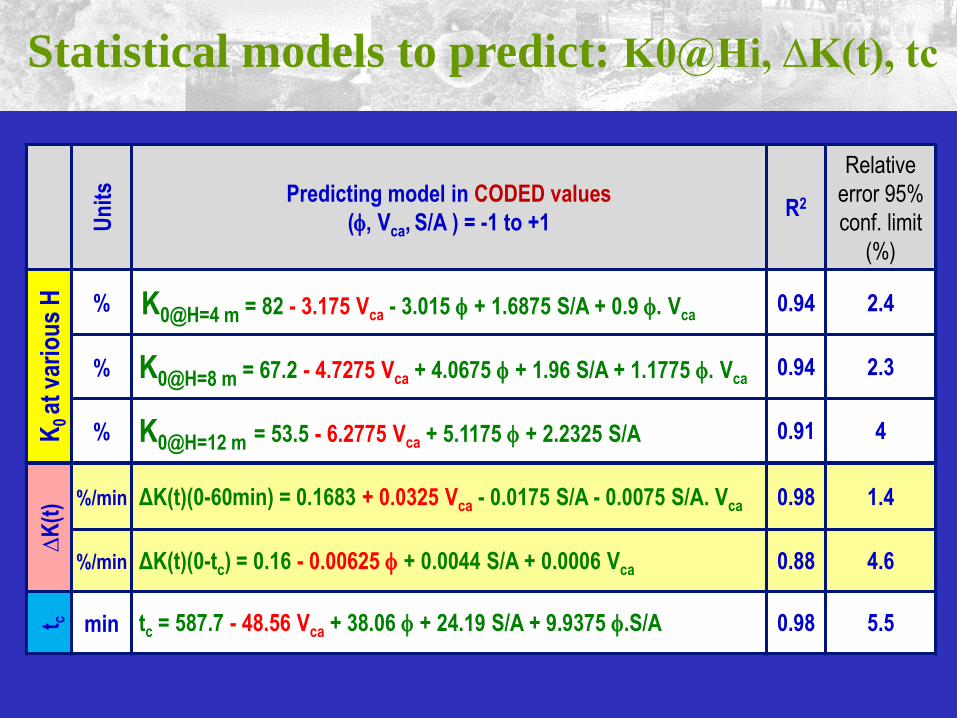
Statistical models to predict: K0@Hi, ∆K(t), tc U
nit
s Predicting model in CODED values
(, Vca, S/A ) = -1 to +1 R2
Relative
error 95%
conf. limit
(%)
K0 at
var
iou
s H
% K0@H=4 m = 82 - 3.175 Vca - 3.015 + 1.6875 S/A + 0.9 . Vca 0.94 2.4
% K0@H=8 m = 67.2 - 4.7275 Vca + 4.0675 + 1.96 S/A + 1.1775 . Vca 0.94 2.3
% K0@H=12 m = 53.5 - 6.2775 Vca + 5.1175 + 2.2325 S/A 0.91 4
∆K
(t) %/min ΔK(t)(0-60min) = 0.1683 + 0.0325 Vca - 0.0175 S/A - 0.0075 S/A. Vca 0.98 1.4
%/min ΔK(t)(0-tc) = 0.16 - 0.00625 + 0.0044 S/A + 0.0006 Vca 0.88 4.6
t c
min tc = 587.7 - 48.56 Vca + 38.06 + 24.19 S/A + 9.9375 .S/A 0.98 5.5
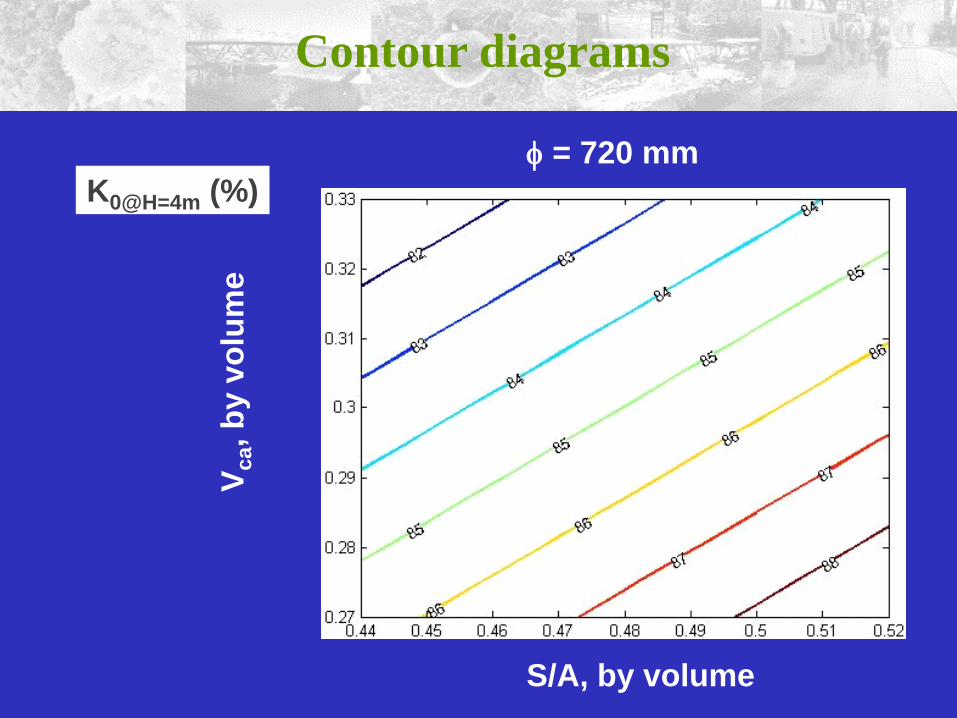
Contour diagrams
= 720 mm
S/A, by volume
Vc
a, b
y v
olu
me
K0@H=4m (%)
IBRACON, October 9, 2012
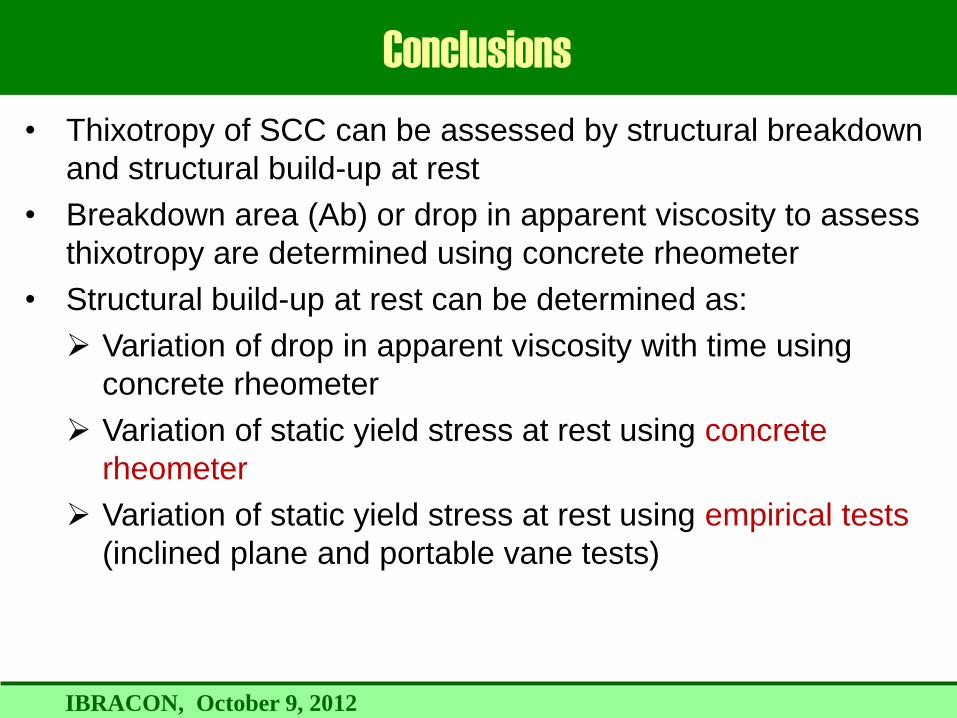
Conclusions
• Thixotropy of SCC can be assessed by structural breakdown
and structural build-up at rest
• Breakdown area (Ab) or drop in apparent viscosity to assess
thixotropy are determined using concrete rheometer
• Structural build-up at rest can be determined as:
Variation of drop in apparent viscosity with time using
concrete rheometer
Variation of static yield stress at rest using concrete
rheometer
Variation of static yield stress at rest using empirical tests
(inclined plane and portable vane tests)
IBRACON, October 9, 2012
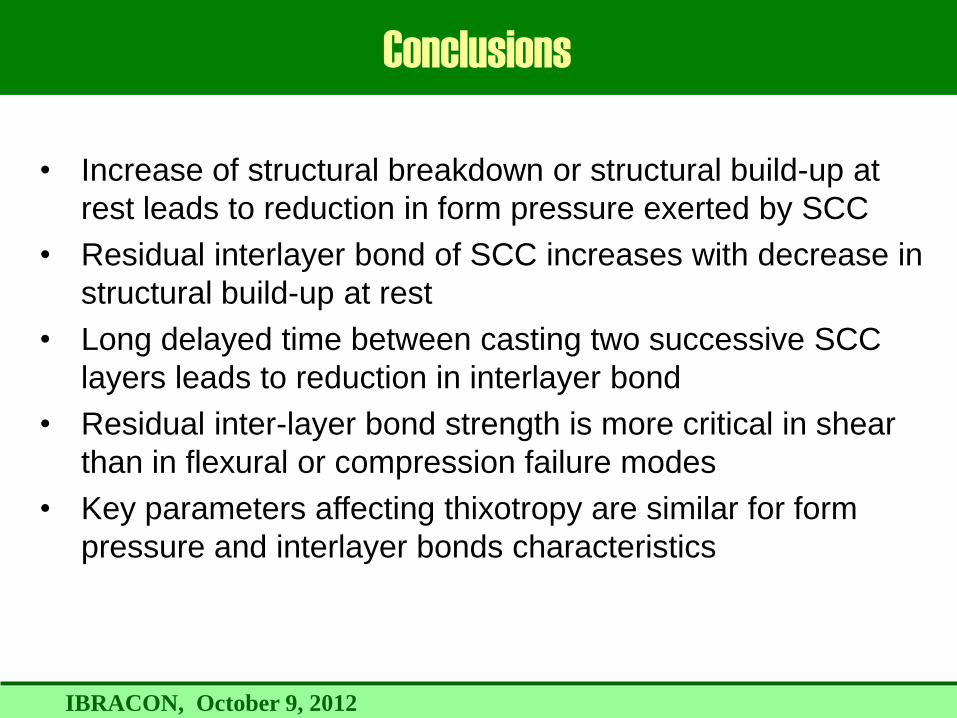
Conclusions
• Increase of structural breakdown or structural build-up at
rest leads to reduction in form pressure exerted by SCC
• Residual interlayer bond of SCC increases with decrease in
structural build-up at rest
• Long delayed time between casting two successive SCC
layers leads to reduction in interlayer bond
• Residual inter-layer bond strength is more critical in shear
than in flexural or compression failure modes
• Key parameters affecting thixotropy are similar for form
pressure and interlayer bonds characteristics
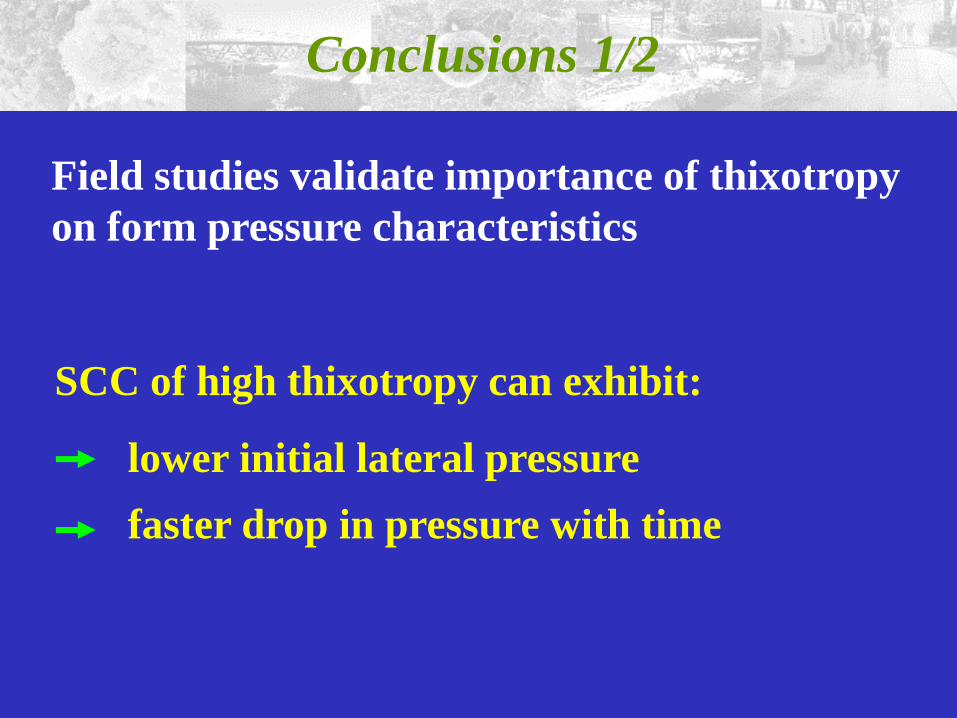
Conclusions 1/2
SCC of high thixotropy can exhibit:
lower initial lateral pressure
faster drop in pressure with time
Field studies validate importance of thixotropy
on form pressure characteristics
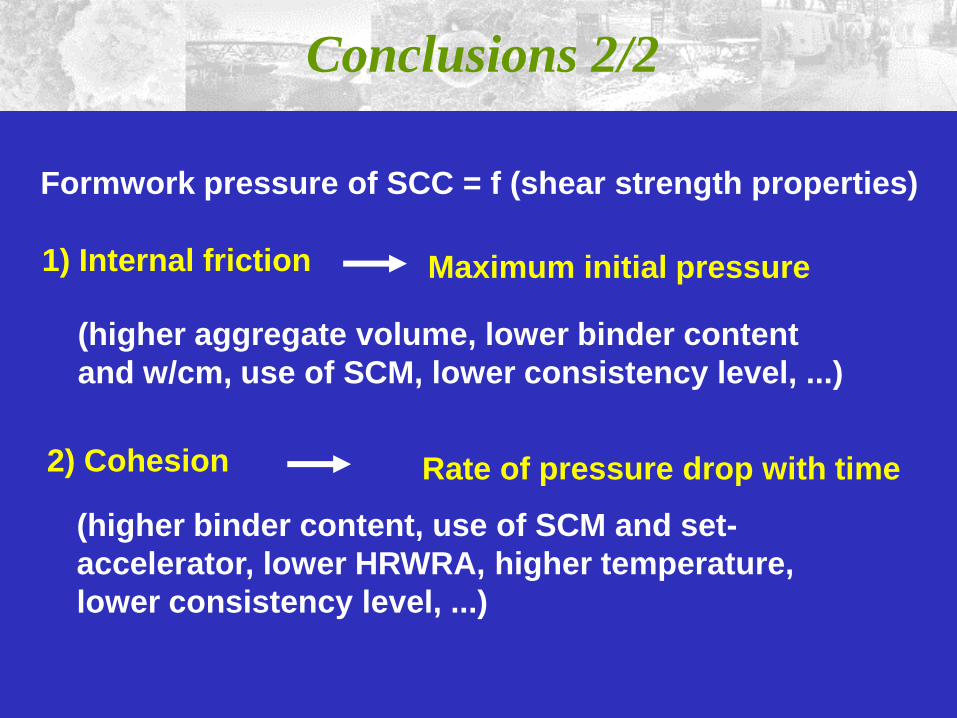
Conclusions 2/2
Formwork pressure of SCC = f (shear strength properties)
1) Internal friction Maximum initial pressure
(higher aggregate volume, lower binder content
and w/cm, use of SCM, lower consistency level, ...)
2) Cohesion Rate of pressure drop with time
(higher binder content, use of SCM and set-
accelerator, lower HRWRA, higher temperature,
lower consistency level, ...)
IBRACON, October 9, 2012

IBRACON, October 9, 2012

IBRACON, October 9, 2012

IBRACON, October 9, 2012