Embed Size (px)
Citation preview
Avoiding SAN Performance Problems Whitepaper
1
The Top Ten Things to look for to avoid Fibre Channel SAN performance problems Introduction
Maintaining peak performance while simultaneously addressing the root cause of SAN errors is challenging. This paper presents a high level summary of the most common SAN problems and explores new ways to dramatically improve application performance and availability.
Background – “Blaming the Storage” Syndrome
Today’s large, complex, heterogeneous IT infrastructures present formidable challenges to IT administrators and storage admins in particular. To the legacy physical infrastructures have been added abstraction layers in the form of virtualized servers, file systems, and storage. Getting insight into root cause, determining which physical host, application or virtual machine is impacting the performance of which LUN is more difficult than ever.
When the application managers complain of slowdowns, the server team’s host based tools will often point to an I/O slowdown, so the SAN team is pretty much guilty until proven innocent. It’s pretty common for the SAN team to spend hours, days, weeks, and sometimes months determining where the problem is, often to find that the problem is not due to the SAN infrastructure at all. In their defense, their Fibre Channel SAN tools are often pretty primitive, offering perhaps simple IOPS or MB/s metrics at the various SAN component level, with almost no effective way of correlating events to track down root causes. A device-specific view is rarely enough, and simply knowing which metrics are the meaningful indicators seems to be some sort of voodoo science. “Needle in a haystack” is the operative term and in truth, the root cause is
Summary:
• Instrumentation allows SAN events to be addressed in a timely, methodical manner, rather than as part of a critical issue when enough events combine to cause application impacts
• CRC errors, code violation, loss of sync, Class 3 discards, and other metrics can be reliably used to predict and avoid slowdowns
• Exchange Completion Time can definitively prove, in real-time, where a slowdown is attributable to a host or a SAN issue
• VirtualWisdom is the leading solution for providing access to the widest range of metrics across a heterogeneous fibre channel SAN
• Proactive optimization and real-time root cause analysis puts the SAN team in a new, revolutionary position
Avoiding SAN Performance Problems Whitepaper
2
rarely a single needle, and is rarely producible “on demand”. In a 10,000 port SAN, where do you even start?
In this scenario, there needs to be a method to empower the storage team to become proactive rather than just reactive. And there is. Often, aborts, CRC errors, Class 3 discards, unnecessary logins or those used to restore credit, failed SCSI transactions, etc. are present on an infrastructure that hasn’t been instrumented. Instrumentation allows the events to be addressed in a timely methodical manner rather than as part of a critical issue when enough events combine to cause impact.
Recap of Fibre Channel Frame, Sequence, and Exchange
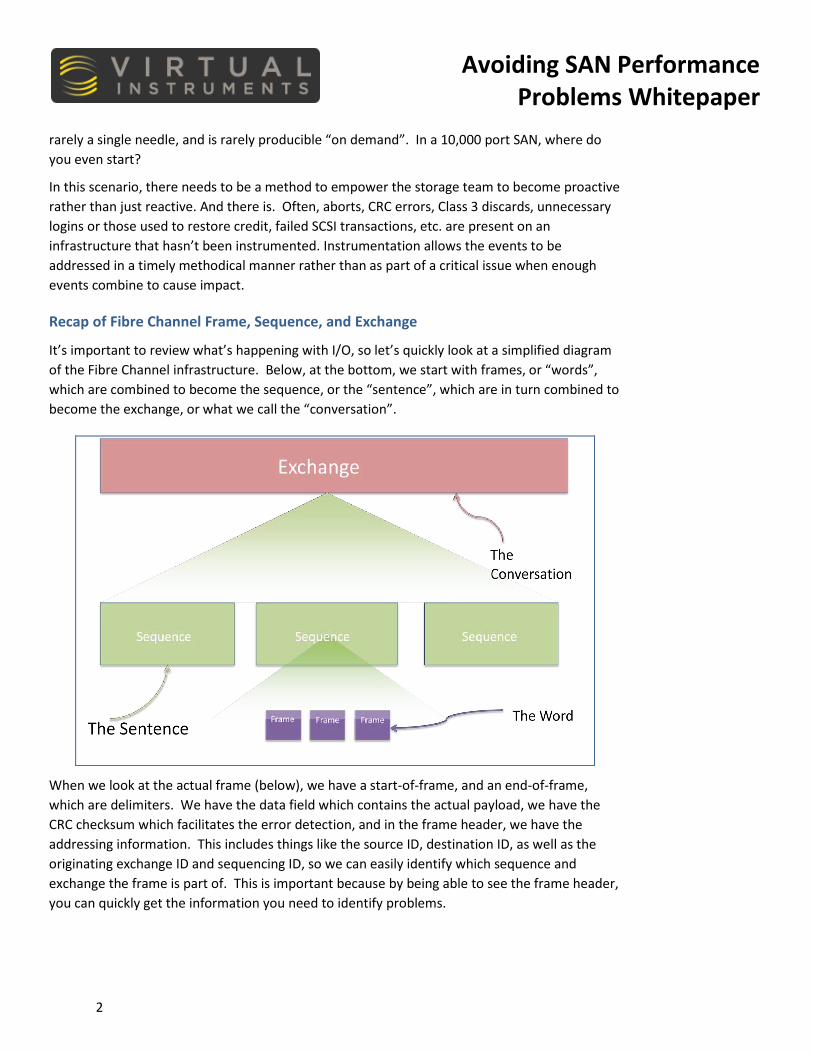
It’s important to review what’s happening with I/O, so let’s quickly look at a simplified diagram of the Fibre Channel infrastructure. Below, at the bottom, we start with frames, or “words”, which are combined to become the sequence, or the “sentence”, which are in turn combined to become the exchange, or what we call the “conversation”.
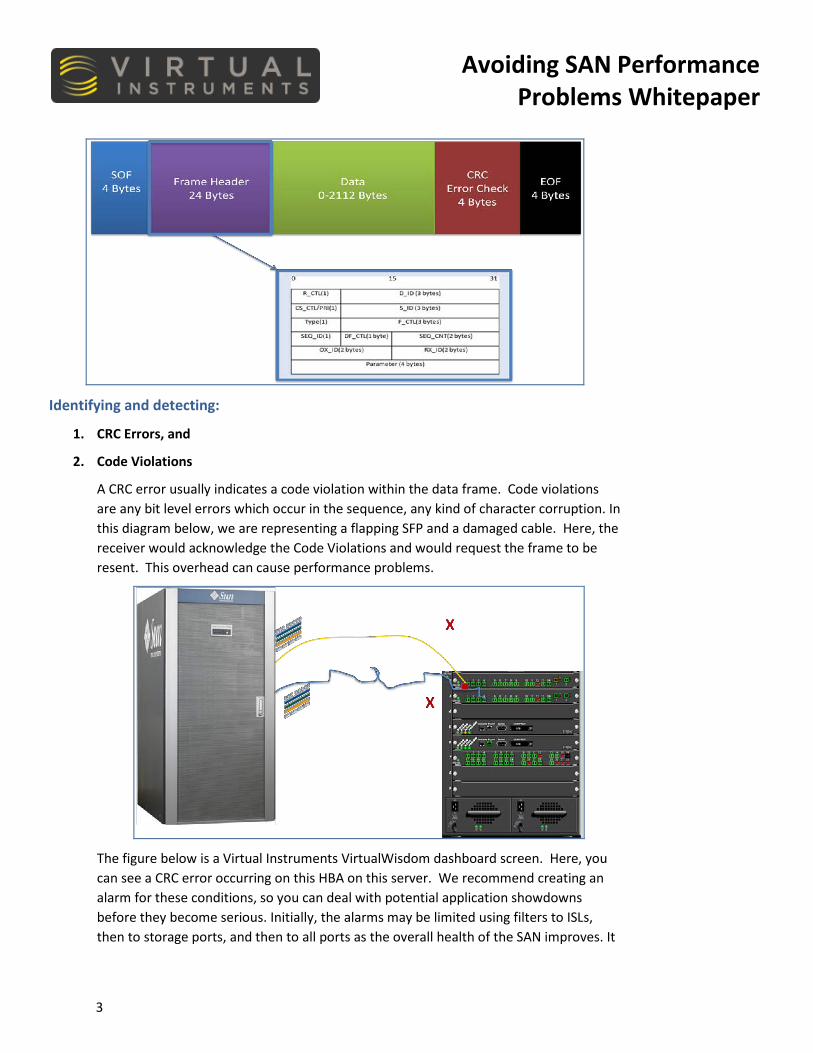
When we look at the actual frame (below), we have a start-of-frame, and an end-of-frame, which are delimiters. We have the data field which contains the actual payload, we have the CRC checksum which facilitates the error detection, and in the frame header, we have the addressing information. This includes things like the source ID, destination ID, as well as the originating exchange ID and sequencing ID, so we can easily identify which sequence and exchange the frame is part of. This is important because by being able to see the frame header, you can quickly get the information you need to identify problems.
Avoiding SAN Performance Problems Whitepaper
3
Identifying and detecting:
1. CRC Errors, and
2. Code Violations
A CRC error usually indicates a code violation within the data frame. Code violations are any bit level errors which occur in the sequence, any kind of character corruption. In this diagram below, we are representing a flapping SFP and a damaged cable. Here, the receiver would acknowledge the Code Violations and would request the frame to be resent. This overhead can cause performance problems.
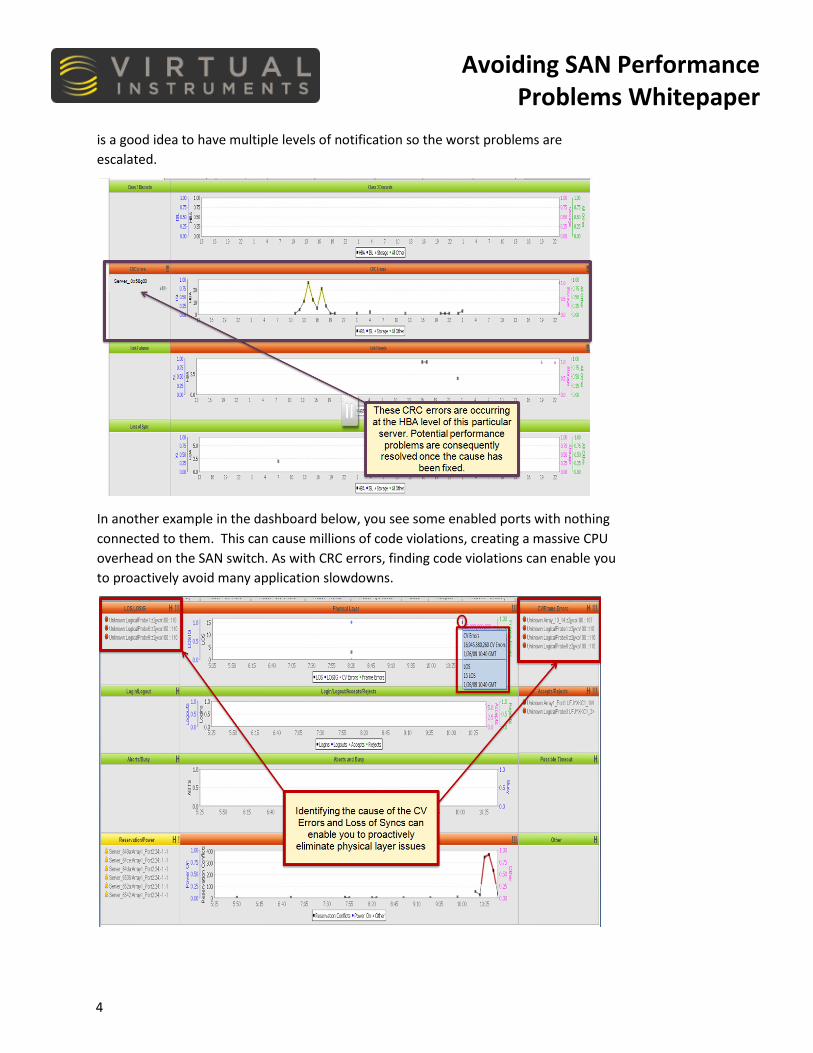
The figure below is a Virtual Instruments VirtualWisdom dashboard screen. Here, you can see a CRC error occurring on this HBA on this server. We recommend creating an alarm for these conditions, so you can deal with potential application showdowns before they become serious. Initially, the alarms may be limited using filters to ISLs, then to storage ports, and then to all ports as the overall health of the SAN improves. It
Avoiding SAN Performance Problems Whitepaper
4
is a good idea to have multiple levels of notification so the worst problems are escalated.
In another example in the dashboard below, you see some enabled ports with nothing connected to them. This can cause millions of code violations, creating a massive CPU overhead on the SAN switch. As with CRC errors, finding code violations can enable you to proactively avoid many application slowdowns.
Avoiding SAN Performance Problems Whitepaper
5
3. Loss of Sync, and
4. Loss of Signal
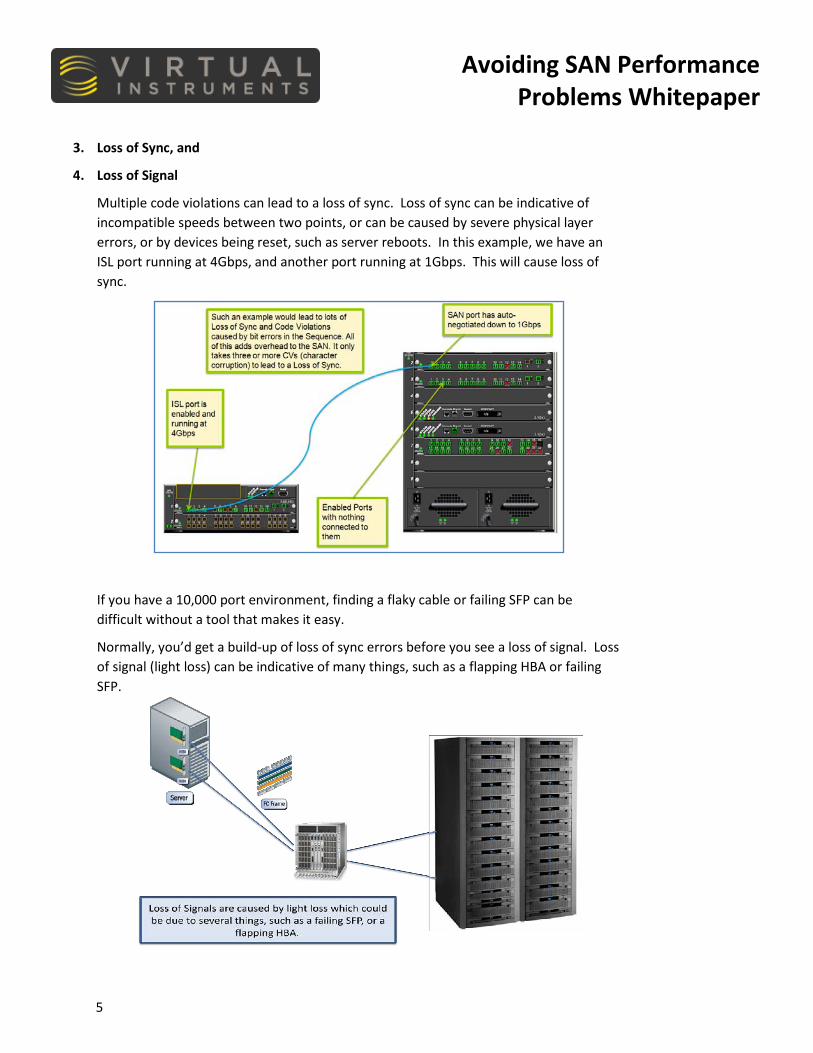
Multiple code violations can lead to a loss of sync. Loss of sync can be indicative of incompatible speeds between two points, or can be caused by severe physical layer errors, or by devices being reset, such as server reboots. In this example, we have an ISL port running at 4Gbps, and another port running at 1Gbps. This will cause loss of sync.
If you have a 10,000 port environment, finding a flaky cable or failing SFP can be difficult without a tool that makes it easy.
Normally, you’d get a build-up of loss of sync errors before you see a loss of signal. Loss of signal (light loss) can be indicative of many things, such as a flapping HBA or failing SFP.
Avoiding SAN Performance Problems Whitepaper
6
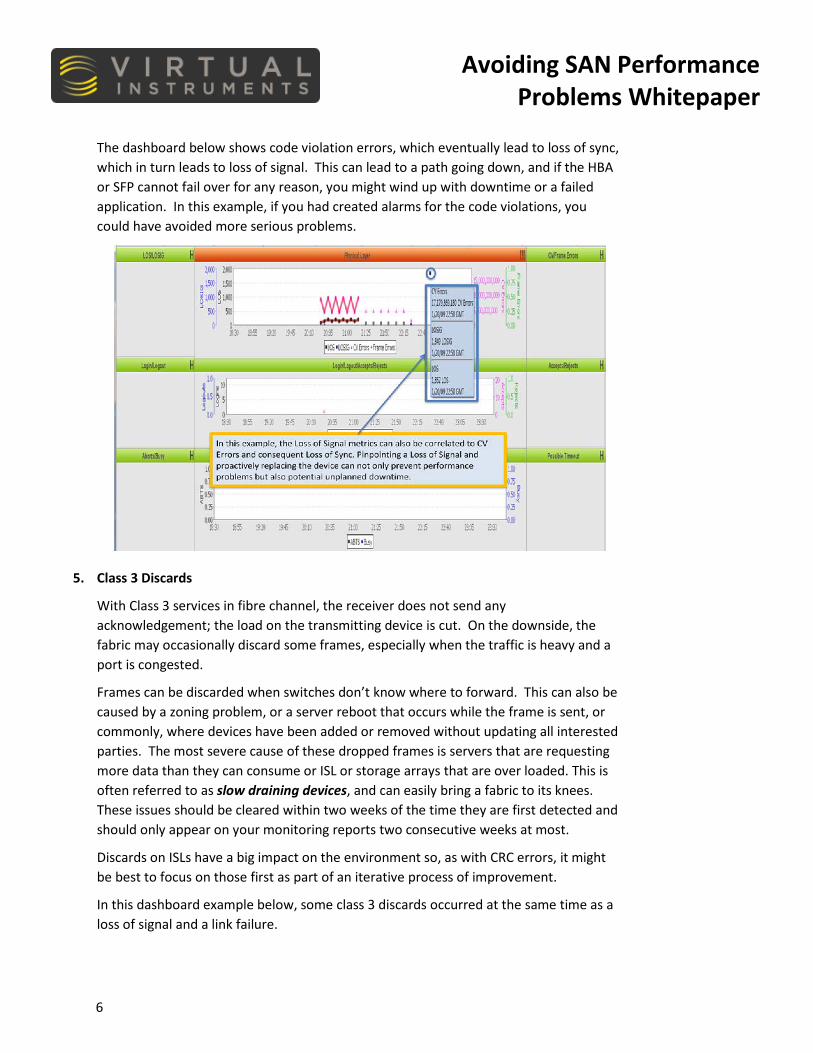
The dashboard below shows code violation errors, which eventually lead to loss of sync, which in turn leads to loss of signal. This can lead to a path going down, and if the HBA or SFP cannot fail over for any reason, you might wind up with downtime or a failed application. In this example, if you had created alarms for the code violations, you could have avoided more serious problems.
5. Class 3 Discards
With Class 3 services in fibre channel, the receiver does not send any acknowledgement; the load on the transmitting device is cut. On the downside, the fabric may occasionally discard some frames, especially when the traffic is heavy and a port is congested.
Frames can be discarded when switches don’t know where to forward. This can also be caused by a zoning problem, or a server reboot that occurs while the frame is sent, or commonly, where devices have been added or removed without updating all interested parties. The most severe cause of these dropped frames is servers that are requesting more data than they can consume or ISL or storage arrays that are over loaded. This is often referred to as slow draining devices, and can easily bring a fabric to its knees. These issues should be cleared within two weeks of the time they are first detected and should only appear on your monitoring reports two consecutive weeks at most.
Discards on ISLs have a big impact on the environment so, as with CRC errors, it might be best to focus on those first as part of an iterative process of improvement.
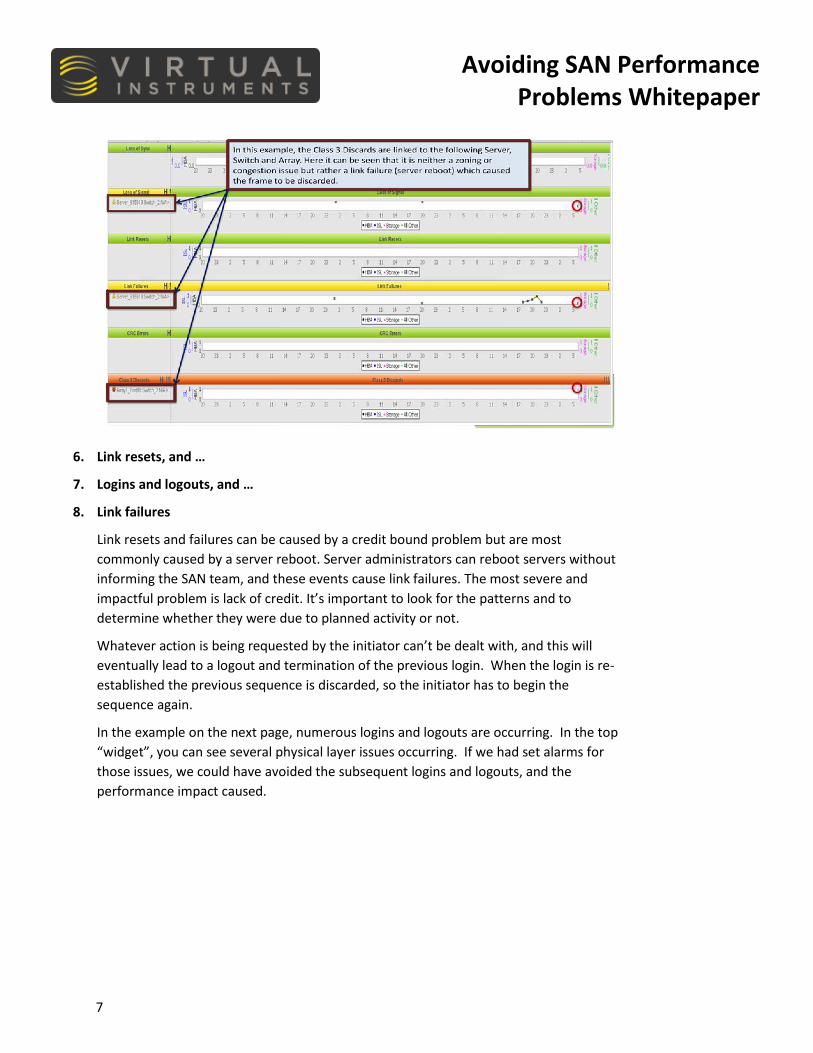
In this dashboard example below, some class 3 discards occurred at the same time as a loss of signal and a link failure.
Avoiding SAN Performance Problems Whitepaper
7
6. Link resets, and …
7. Logins and logouts, and …
8. Link failures
Link resets and failures can be caused by a credit bound problem but are most commonly caused by a server reboot. Server administrators can reboot servers without informing the SAN team, and these events cause link failures. The most severe and impactful problem is lack of credit. It’s important to look for the patterns and to determine whether they were due to planned activity or not.
Whatever action is being requested by the initiator can’t be dealt with, and this will eventually lead to a logout and termination of the previous login. When the login is re-established the previous sequence is discarded, so the initiator has to begin the sequence again.
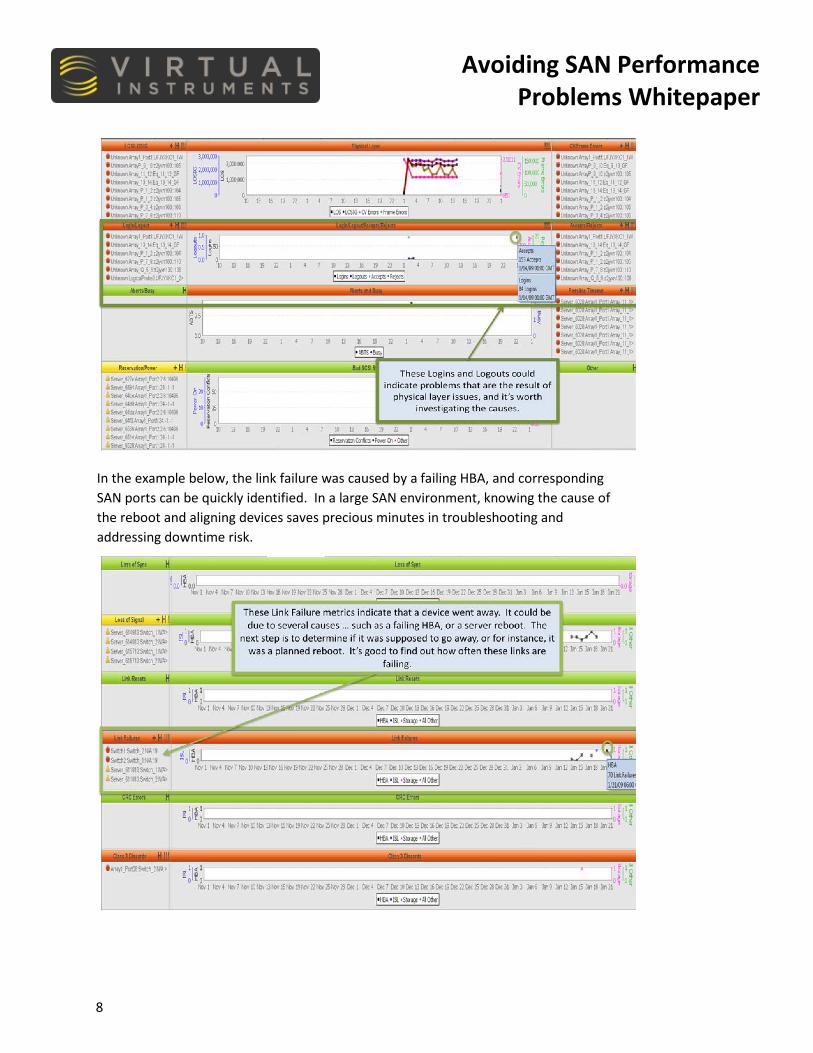
In the example on the next page, numerous logins and logouts are occurring. In the top “widget”, you can see several physical layer issues occurring. If we had set alarms for those issues, we could have avoided the subsequent logins and logouts, and the performance impact caused.
Avoiding SAN Performance Problems Whitepaper
8
In the example below, the link failure was caused by a failing HBA, and corresponding SAN ports can be quickly identified. In a large SAN environment, knowing the cause of the reboot and aligning devices saves precious minutes in troubleshooting and addressing downtime risk.
Avoiding SAN Performance Problems Whitepaper
9
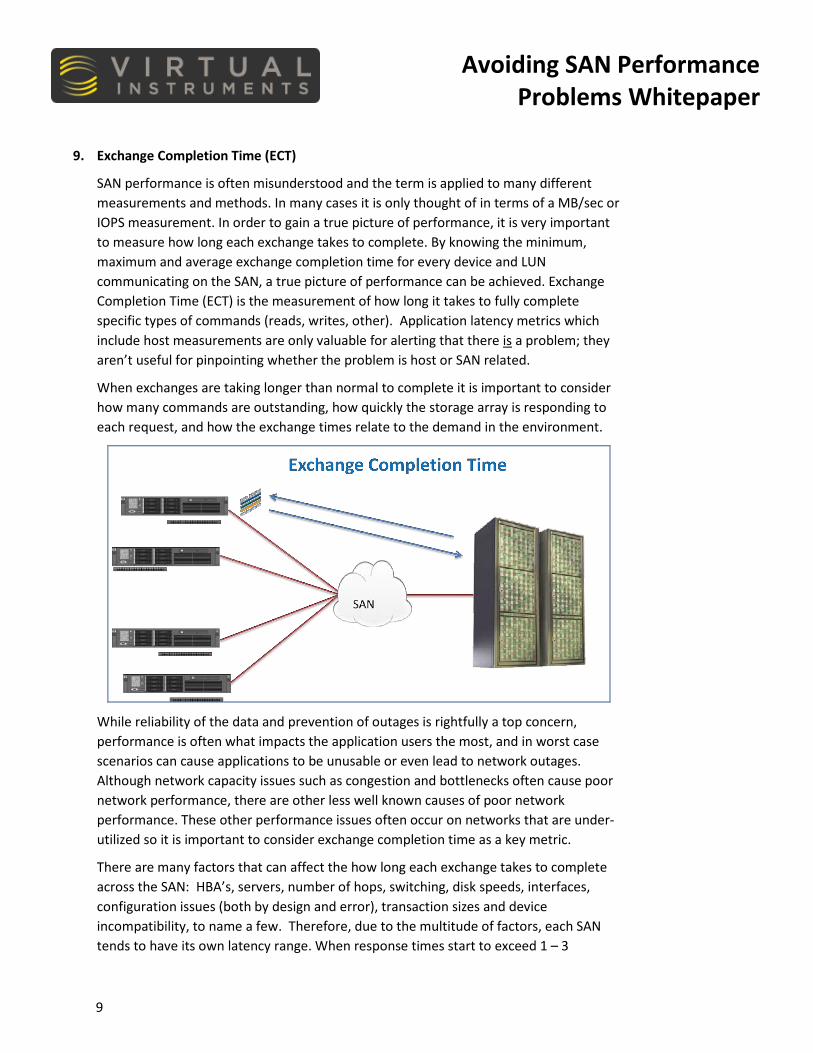
9. Exchange Completion Time (ECT)
SAN performance is often misunderstood and the term is applied to many different measurements and methods. In many cases it is only thought of in terms of a MB/sec or IOPS measurement. In order to gain a true picture of performance, it is very important to measure how long each exchange takes to complete. By knowing the minimum, maximum and average exchange completion time for every device and LUN communicating on the SAN, a true picture of performance can be achieved. Exchange Completion Time (ECT) is the measurement of how long it takes to fully complete specific types of commands (reads, writes, other). Application latency metrics which include host measurements are only valuable for alerting that there is a problem; they aren’t useful for pinpointing whether the problem is host or SAN related.
When exchanges are taking longer than normal to complete it is important to consider how many commands are outstanding, how quickly the storage array is responding to each request, and how the exchange times relate to the demand in the environment.
While reliability of the data and prevention of outages is rightfully a top concern, performance is often what impacts the application users the most, and in worst case scenarios can cause applications to be unusable or even lead to network outages. Although network capacity issues such as congestion and bottlenecks often cause poor network performance, there are other less well known causes of poor network performance. These other performance issues often occur on networks that are under-utilized so it is important to consider exchange completion time as a key metric.
There are many factors that can affect the how long each exchange takes to complete across the SAN: HBA’s, servers, number of hops, switching, disk speeds, interfaces, configuration issues (both by design and error), transaction sizes and device incompatibility, to name a few. Therefore, due to the multitude of factors, each SAN tends to have its own latency range. When response times start to exceed 1 – 3
Avoiding SAN Performance Problems Whitepaper
10
seconds, it is typically an indication that there is a problem. Because of the extreme latency difference between the typical average and the typical maximum values, occasional outliers can occur without indicating application impact if they occur during low I/O periods preventing the typical maximum from being averaged with many other transactions as it normally would.
For some high latency applications the ideal infrastructure response times are in the 4-7ms range. For most applications, the response times should remain below 20-40ms as a high-end average.
Ideally, you want to track exchange completion times down to an Initiator, Target-LUN (ITL) granularity. This enables problems in communication where the Initiator (or Server) has good response times when all the Target-LUN’s it is accessing are aggregated together. Similarly, the aggregated response times for a Target or Target-LUN may appear fine when all Initiators that are accessing it. There can still be problems for a specific Initiator accessing a specific Target-LUN. At the same time that this is the most granular way to find issues, it will also be the most severely impacted by issues that span multiple devices.
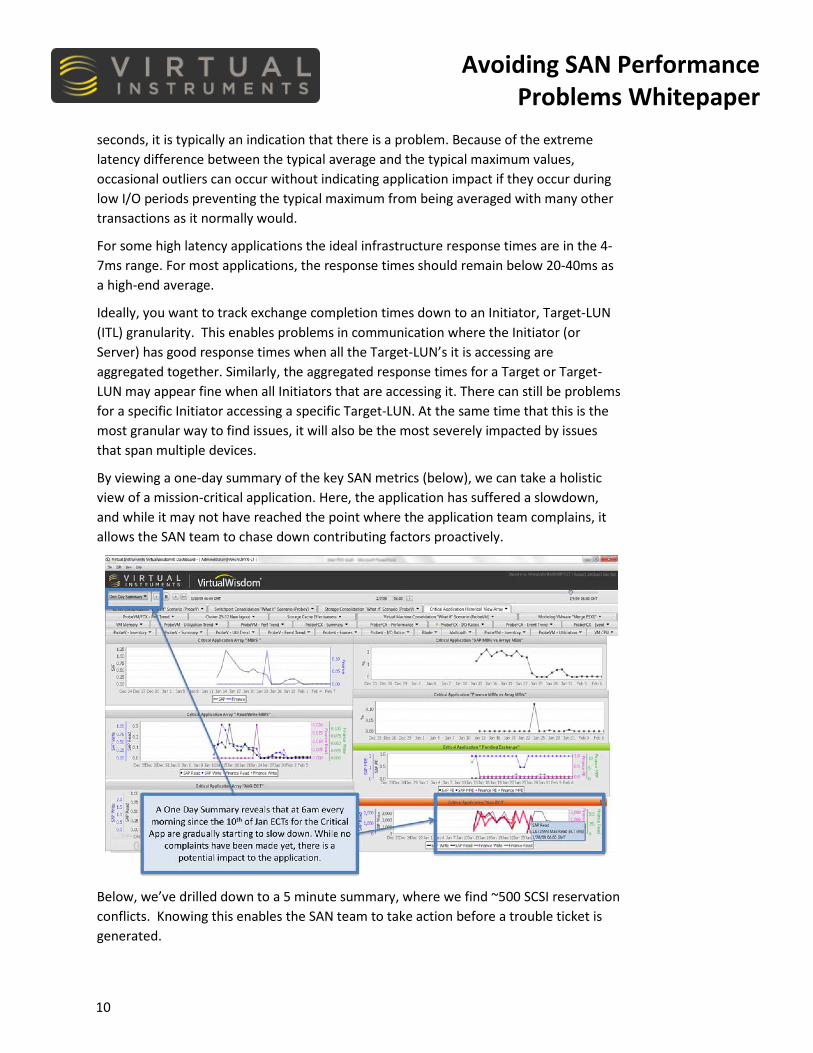
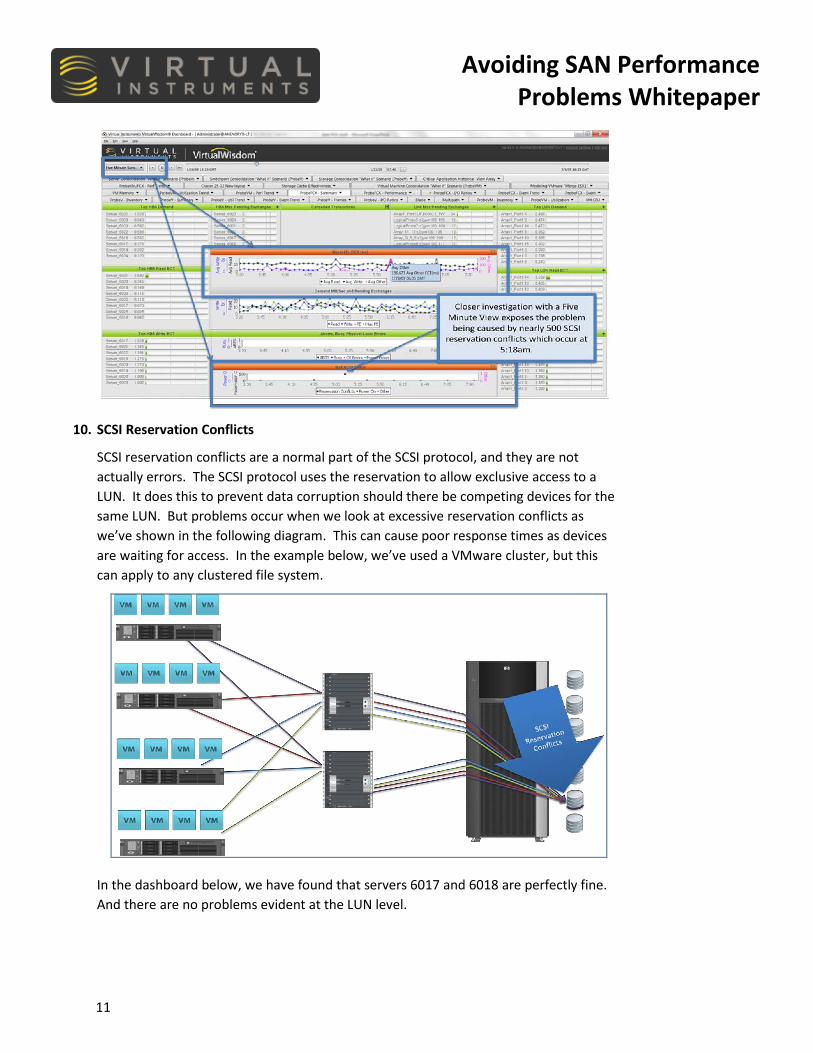
By viewing a one-day summary of the key SAN metrics (below), we can take a holistic view of a mission-critical application. Here, the application has suffered a slowdown, and while it may not have reached the point where the application team complains, it allows the SAN team to chase down contributing factors proactively.
Below, we’ve drilled down to a 5 minute summary, where we find ~500 SCSI reservation conflicts. Knowing this enables the SAN team to take action before a trouble ticket is generated.
Avoiding SAN Performance Problems Whitepaper
11
10. SCSI Reservation Conflicts
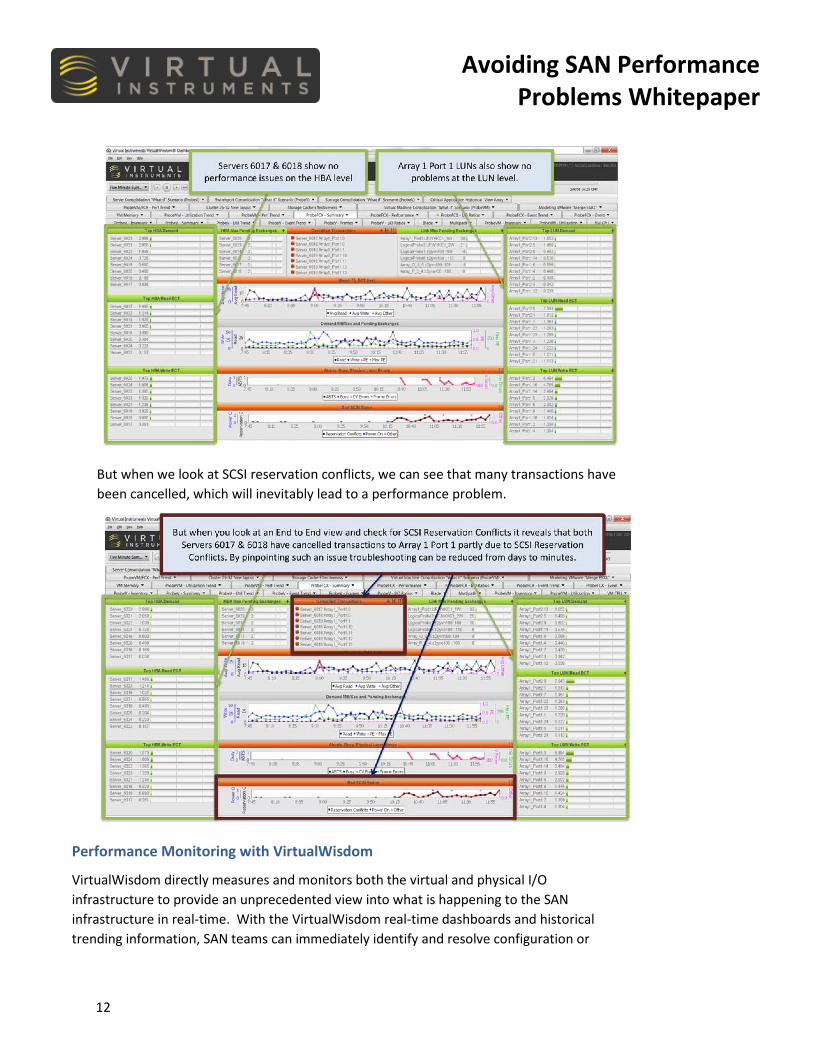
SCSI reservation conflicts are a normal part of the SCSI protocol, and they are not actually errors. The SCSI protocol uses the reservation to allow exclusive access to a LUN. It does this to prevent data corruption should there be competing devices for the same LUN. But problems occur when we look at excessive reservation conflicts as we’ve shown in the following diagram. This can cause poor response times as devices are waiting for access. In the example below, we’ve used a VMware cluster, but this can apply to any clustered file system.
In the dashboard below, we have found that servers 6017 and 6018 are perfectly fine. And there are no problems evident at the LUN level.
Avoiding SAN Performance Problems Whitepaper
12
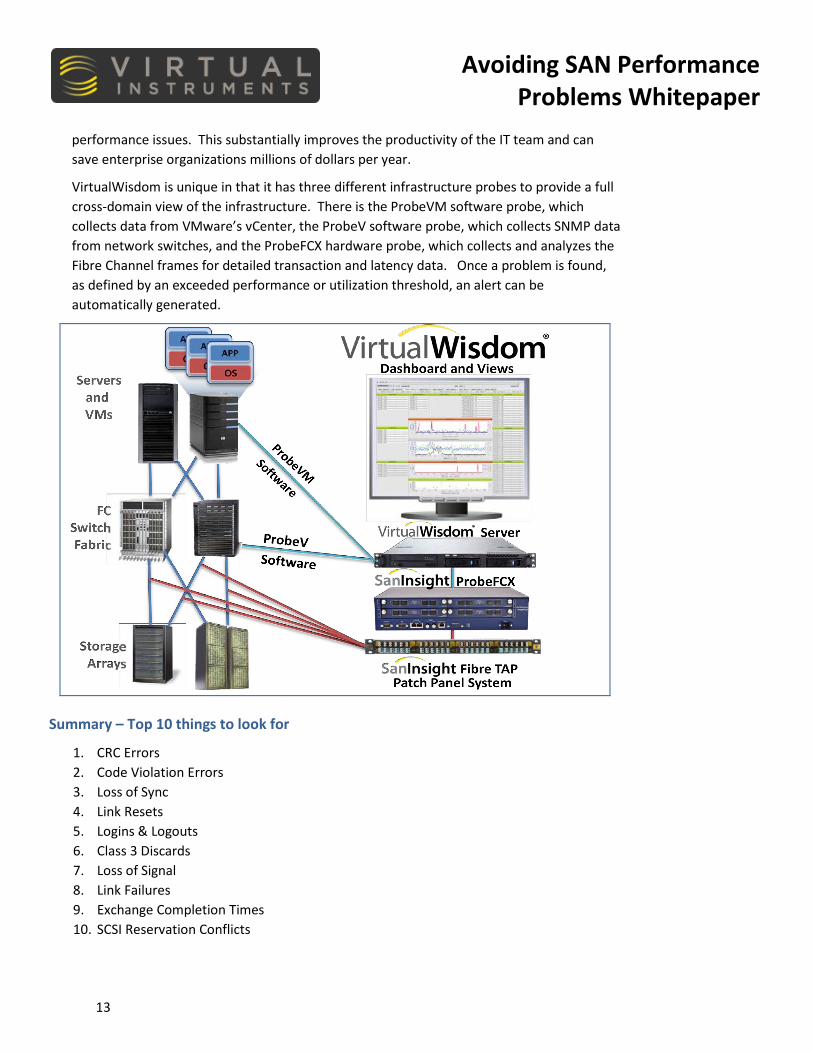
But when we look at SCSI reservation conflicts, we can see that many transactions have been cancelled, which will inevitably lead to a performance problem.
Performance Monitoring with VirtualWisdom
VirtualWisdom directly measures and monitors both the virtual and physical I/O infrastructure to provide an unprecedented view into what is happening to the SAN infrastructure in real-time. With the VirtualWisdom real-time dashboards and historical trending information, SAN teams can immediately identify and resolve configuration or
Avoiding SAN Performance Problems Whitepaper
13
performance issues. This substantially improves the productivity of the IT team and can save enterprise organizations millions of dollars per year.
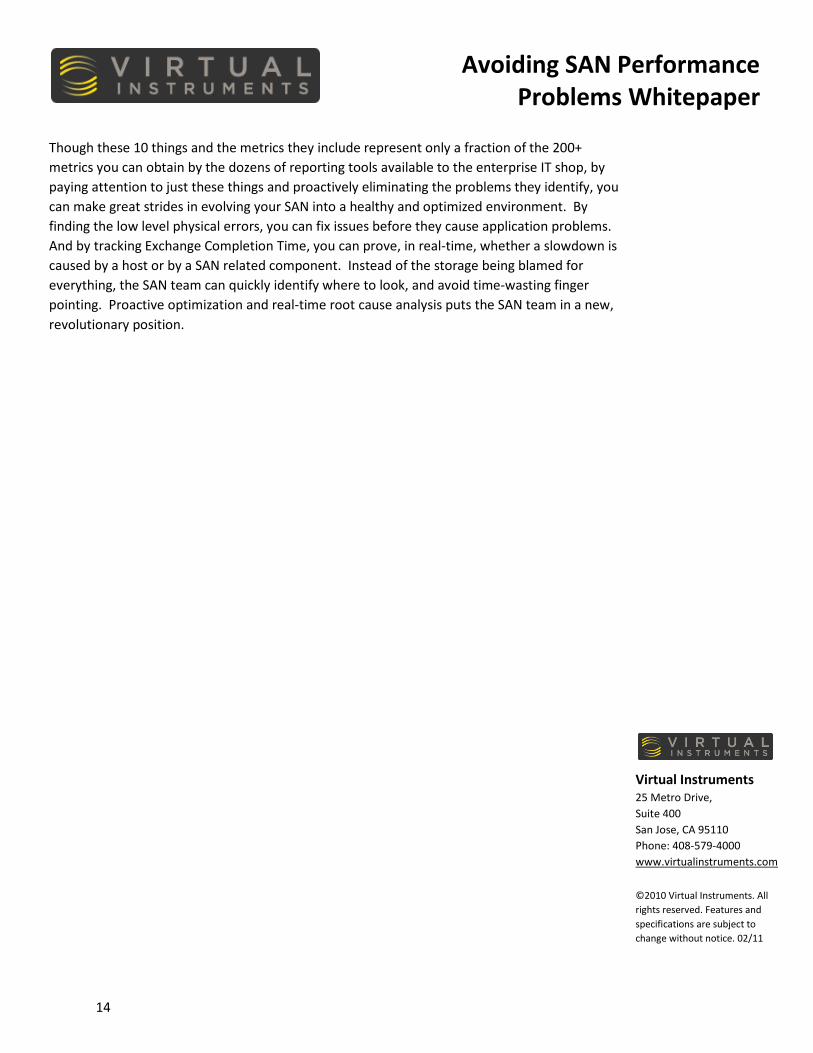
VirtualWisdom is unique in that it has three different infrastructure probes to provide a full cross-domain view of the infrastructure. There is the ProbeVM software probe, which collects data from VMware’s vCenter, the ProbeV software probe, which collects SNMP data from network switches, and the ProbeFCX hardware probe, which collects and analyzes the Fibre Channel frames for detailed transaction and latency data. Once a problem is found, as defined by an exceeded performance or utilization threshold, an alert can be automatically generated.
Summary – Top 10 things to look for
1. CRC Errors 2. Code Violation Errors 3. Loss of Sync 4. Link Resets 5. Logins & Logouts 6. Class 3 Discards 7. Loss of Signal 8. Link Failures 9. Exchange Completion Times 10. SCSI Reservation Conflicts
Avoiding SAN Performance Problems Whitepaper
14
Though these 10 things and the metrics they include represent only a fraction of the 200+ metrics you can obtain by the dozens of reporting tools available to the enterprise IT shop, by paying attention to just these things and proactively eliminating the problems they identify, you can make great strides in evolving your SAN into a healthy and optimized environment. By finding the low level physical errors, you can fix issues before they cause application problems. And by tracking Exchange Completion Time, you can prove, in real-time, whether a slowdown is caused by a host or by a SAN related component. Instead of the storage being blamed for everything, the SAN team can quickly identify where to look, and avoid time-wasting finger pointing. Proactive optimization and real-time root cause analysis puts the SAN team in a new, revolutionary position.
Virtual Instruments 25 Metro Drive, Suite 400 San Jose, CA 95110 Phone: 408-579-4000 www.virtualinstruments.com ©2010 Virtual Instruments. All rights reserved. Features and specifications are subject to change without notice. 02/11
![QUALITY MATTERS AVOIDING COMMON PAINTING PROBLEMS · 2 Professional Builder August 2019 [QUALITY MATTERS]AVOIDING COMMON PAINTING PROBLEMS W hile it’s a no-brainer to say that paint](https://img.pdfslide.us/doc/110x75/6041fca272bbbb43ef59d62c/quality-matters-avoiding-common-painting-2-professional-builder-august-2019-quality.jpg)