Embed Size (px)
Citation preview
Supporting information for:
Evaluation of the aggregation process in a
mixture of propofol and benzocaine
Iker León,†,‡ A. Lesarri± and José A. Fernández†*.
†Department of Physical Chemistry, Faculty of Science and Technology, University of
the Basque Country (UPV/EHU), Barrio Sarriena s/n, 48940 Leioa, Spain.
‡Present address: Grupo de Espectrocopía Molecular (GEM), Edificio Quifima,
Laboratorios de Espectroscopia y Bioespectroscopia, Unidad Asociada CSIC, Parque
Científico UVa, Universidad de Valladolid, 47011, Valladolid, Spain.
±Department of Physical Chemistry and Inorganic Chemistry, Faculty of Science,
University of Valladolid, Valladolid E-47005, Spain.
AUTHOR INFORMATION
Corresponding Author
*Dr. José A. Fernández
email: [email protected]
Phone: +34946015387
Fax: 34946013500
Web site: https://sites.google.com/site/gesemupv/
Electronic Supplementary Material (ESI) for Physical Chemistry Chemical Physics.This journal is © the Owner Societies 2018

Reference S1
M. J. Frisch, G. W. Trucks, H. B. Schlegel, G. E. Scuseria, M. A. Robb, J. R. Cheeseman, G. Scalmani,
V. Barone, B. Mennucci, G. A. Petersson, H. Nakatsuji, M. Caricato, X. Li, H. P. Hratchian, A. F.
Izmaylov, J. Bloino, G. Zheng, J. L. Sonnenberg, M. Hada, M. Ehara, K. Toyota, R. Fukuda, J.
Hasegawa, M. Ishida, T. Nakajima, Y. Honda, O. Kitao, H. Nakai, T. Vreven, J. A. Montgomery, J. E.
Peralta, F. Ogliaro, M. Bearpark, J. J. Heyd, E. Brothers, K. N. Kudin, V. N. Staroverov, R. Kobayashi, J.
Normand, K. Raghavachari, A. Rendell, J. C. Burant, S. S. Iyengar, J. Tomasi, M. Cossi, N. Rega, J. M.
Millam, M. Klene, J. E. Knox, J. B. Cross, V. Bakken, C. Adamo, J. Jaramillo, R. Gomperts, R. E.
Stratmann, O. Yazyev, A. J. Austin, R. Cammi, C. Pomelli, J. W. Ochterski, R. L. Martin, K. Morokuma,
V. G. Zakrzewski, G. A. Voth, P. Salvador, J. J. Dannenberg, S. Dapprich, A. D. Daniels, Farkas, J. B.
Foresman, J. V Ortiz, J. Cioslowski and D. J. Fox, Gaussian 09, Revis. D.01, Gaussian, Inc., Wallingford
CT, 2009
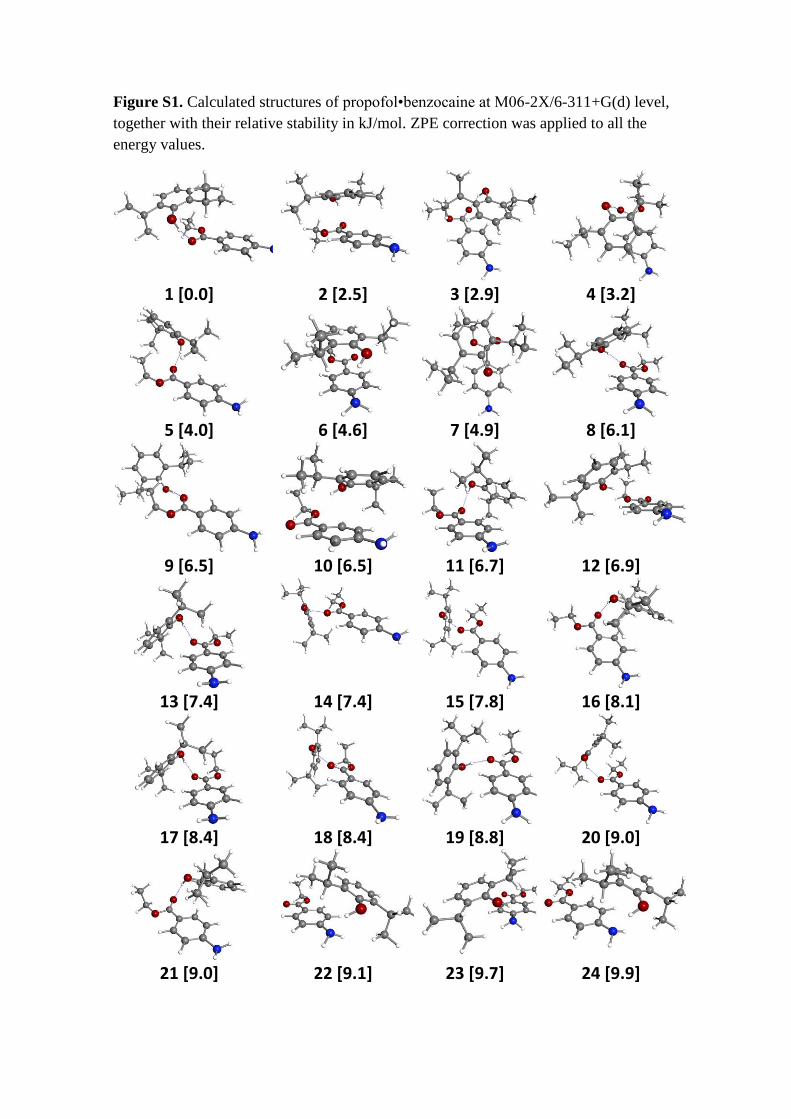
Figure S1. Calculated structures of propofol•benzocaine at M06-2X/6-311+G(d) level,
together with their relative stability in kJ/mol. ZPE correction was applied to all the
energy values.
1 [0.0] 2 [2.5] 3 [2.9] 4 [3.2]
5 [4.0] 6 [4.6] 7 [4.9] 8 [6.1]
9 [6.5] 10 [6.5] 11 [6.7] 12 [6.9]
13 [7.4] 14 [7.4] 15 [7.8] 16 [8.1]
17 [8.4] 18 [8.4] 19 [8.8] 20 [9.0]
21 [9.0] 22 [9.1] 23 [9.7] 24 [9.9]
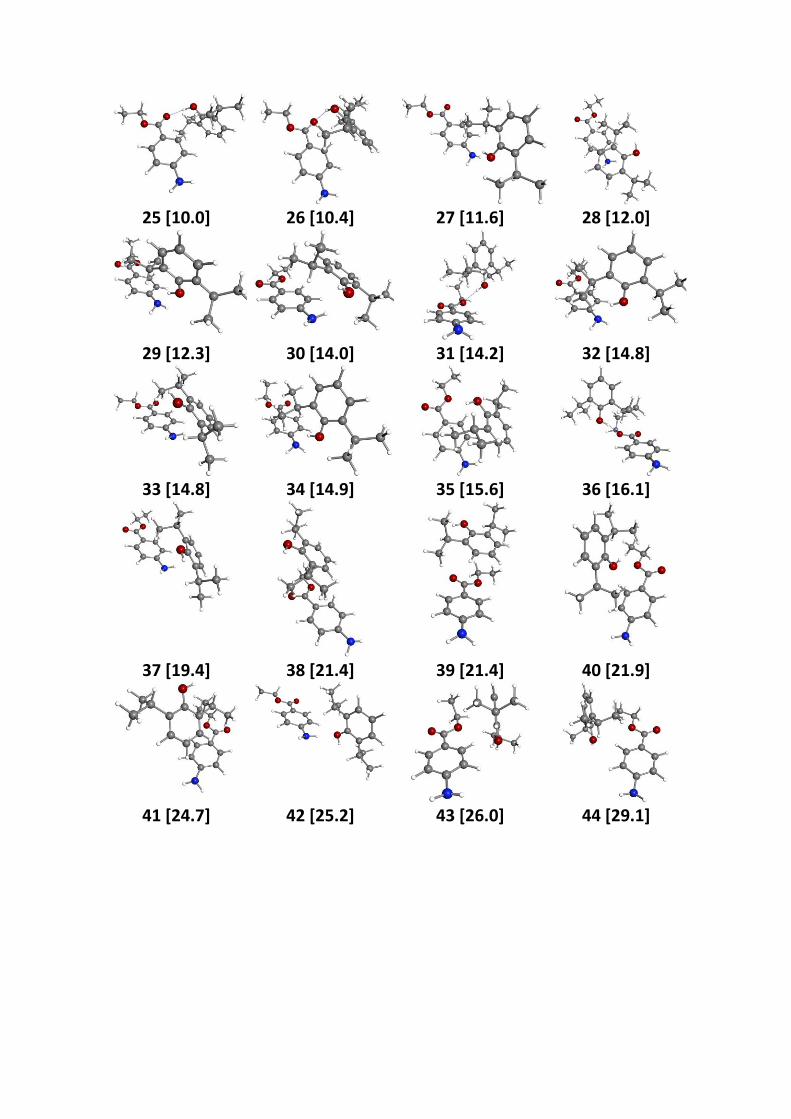
25 [10.0] 26 [10.4] 27 [11.6] 28 [12.0]
29 [12.3] 30 [14.0] 31 [14.2] 32 [14.8]
33 [14.8] 34 [14.9] 35 [15.6] 36 [16.1]
37 [19.4] 38 [21.4] 39 [21.4] 40 [21.9]
41 [24.7] 42 [25.2] 43 [26.0] 44 [29.1]
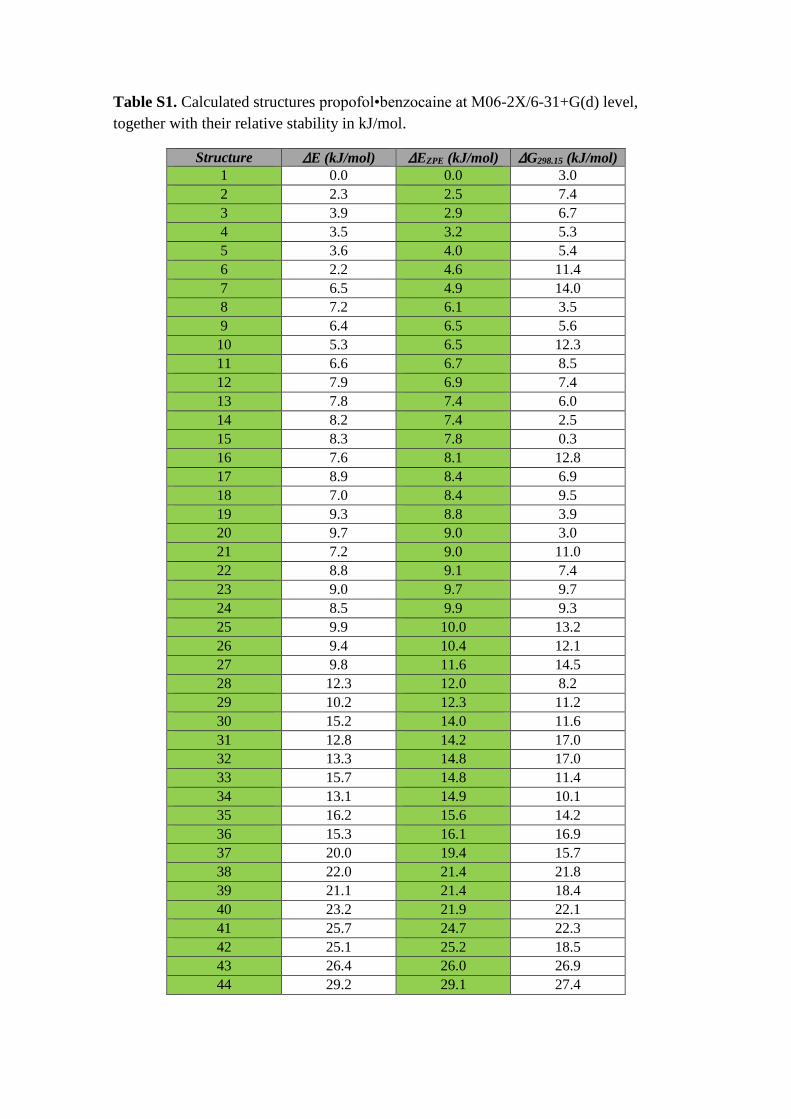
Table S1. Calculated structures propofol•benzocaine at M06-2X/6-31+G(d) level,
together with their relative stability in kJ/mol.
Structure ∆E (kJ/mol) ∆EZPE (kJ/mol) ∆G298.15 (kJ/mol) 1 0.0 0.0 3.0
2 2.3 2.5 7.4
3 3.9 2.9 6.7
4 3.5 3.2 5.3
5 3.6 4.0 5.4
6 2.2 4.6 11.4
7 6.5 4.9 14.0
8 7.2 6.1 3.5
9 6.4 6.5 5.6
10 5.3 6.5 12.3
11 6.6 6.7 8.5
12 7.9 6.9 7.4
13 7.8 7.4 6.0
14 8.2 7.4 2.5
15 8.3 7.8 0.3
16 7.6 8.1 12.8
17 8.9 8.4 6.9
18 7.0 8.4 9.5
19 9.3 8.8 3.9
20 9.7 9.0 3.0
21 7.2 9.0 11.0
22 8.8 9.1 7.4
23 9.0 9.7 9.7
24 8.5 9.9 9.3
25 9.9 10.0 13.2
26 9.4 10.4 12.1
27 9.8 11.6 14.5
28 12.3 12.0 8.2
29 10.2 12.3 11.2
30 15.2 14.0 11.6
31 12.8 14.2 17.0
32 13.3 14.8 17.0
33 15.7 14.8 11.4
34 13.1 14.9 10.1
35 16.2 15.6 14.2
36 15.3 16.1 16.9
37 20.0 19.4 15.7
38 22.0 21.4 21.8
39 21.1 21.4 18.4
40 23.2 21.9 22.1
41 25.7 24.7 22.3
42 25.1 25.2 18.5
43 26.4 26.0 26.9
44 29.2 29.1 27.4
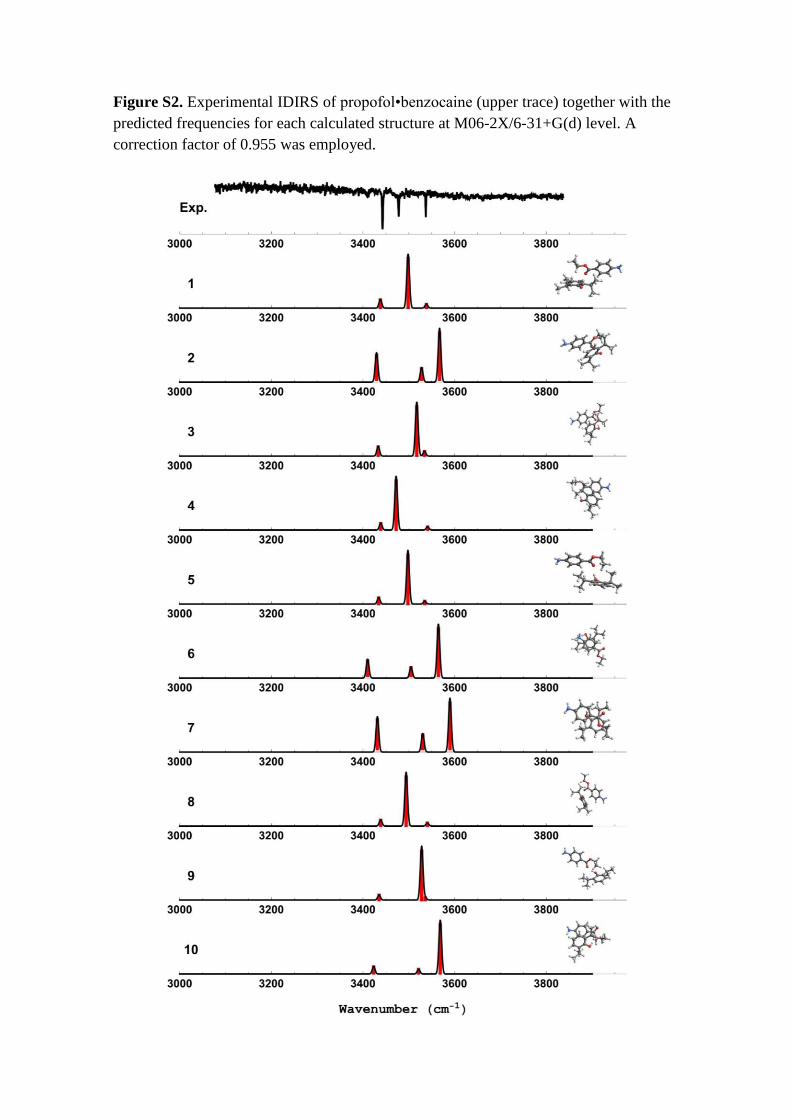
Figure S2. Experimental IDIRS of propofol•benzocaine (upper trace) together with the
predicted frequencies for each calculated structure at M06-2X/6-31+G(d) level. A
correction factor of 0.955 was employed.
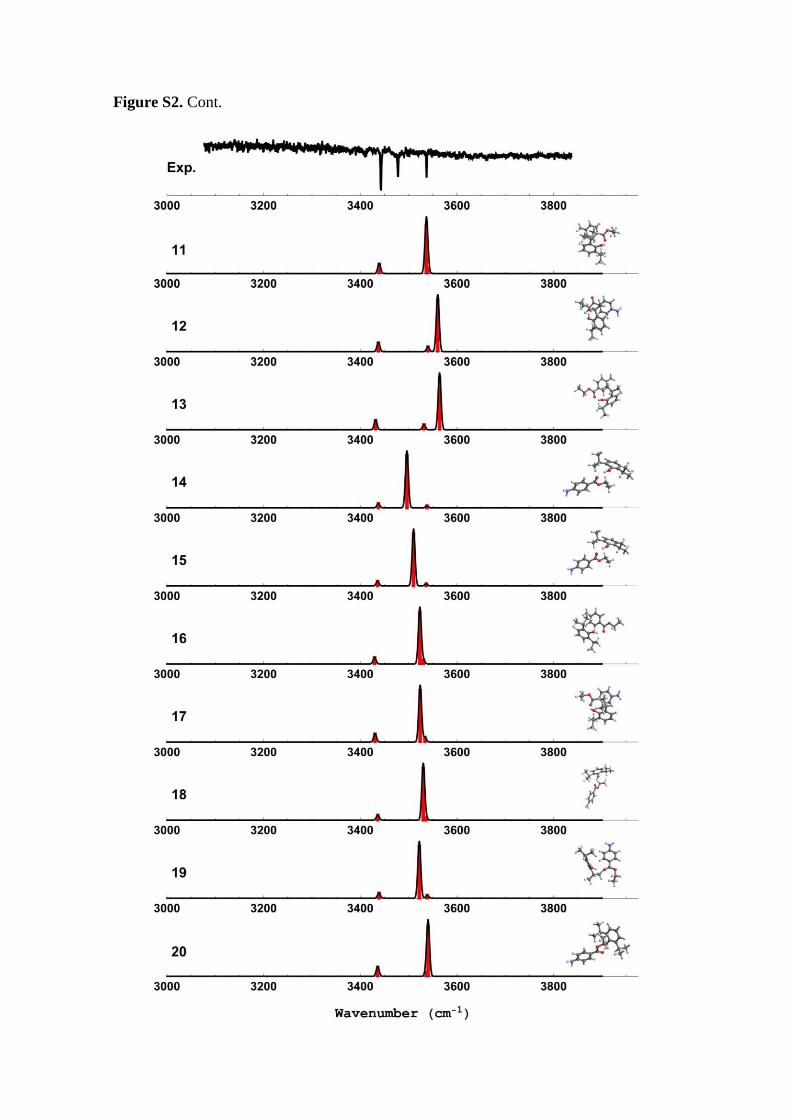
Figure S2. Cont.
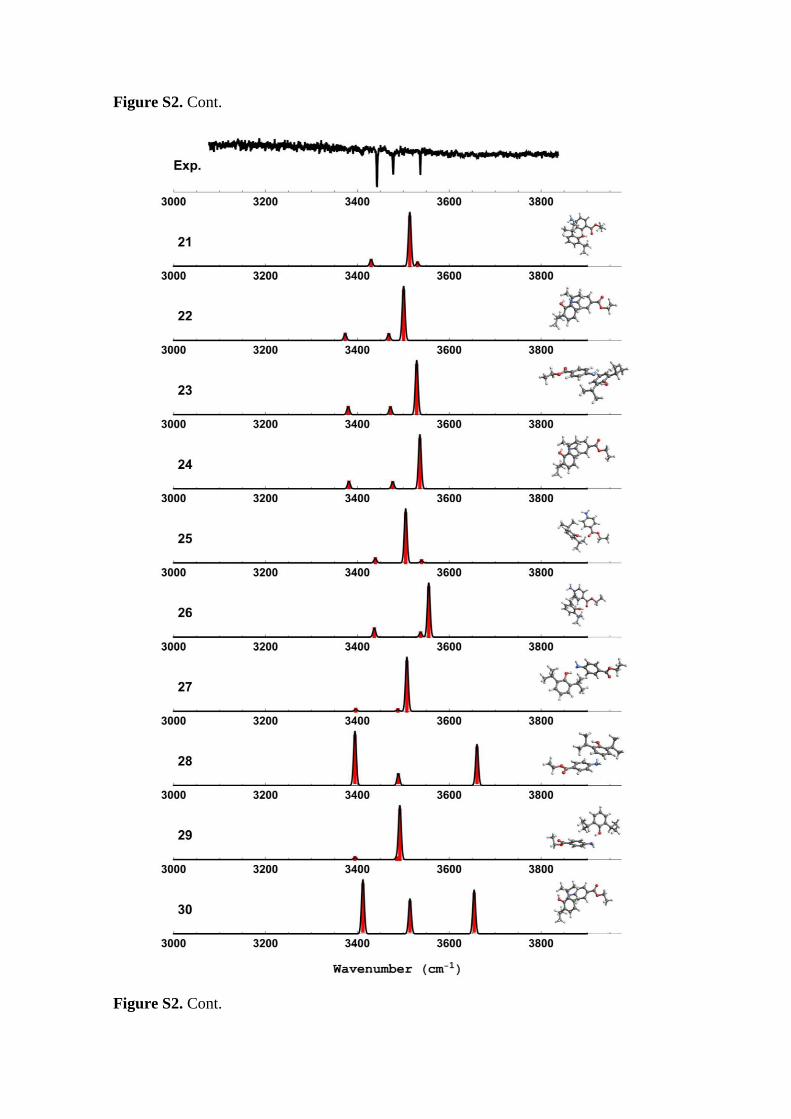
Figure S2. Cont.
Figure S2. Cont.
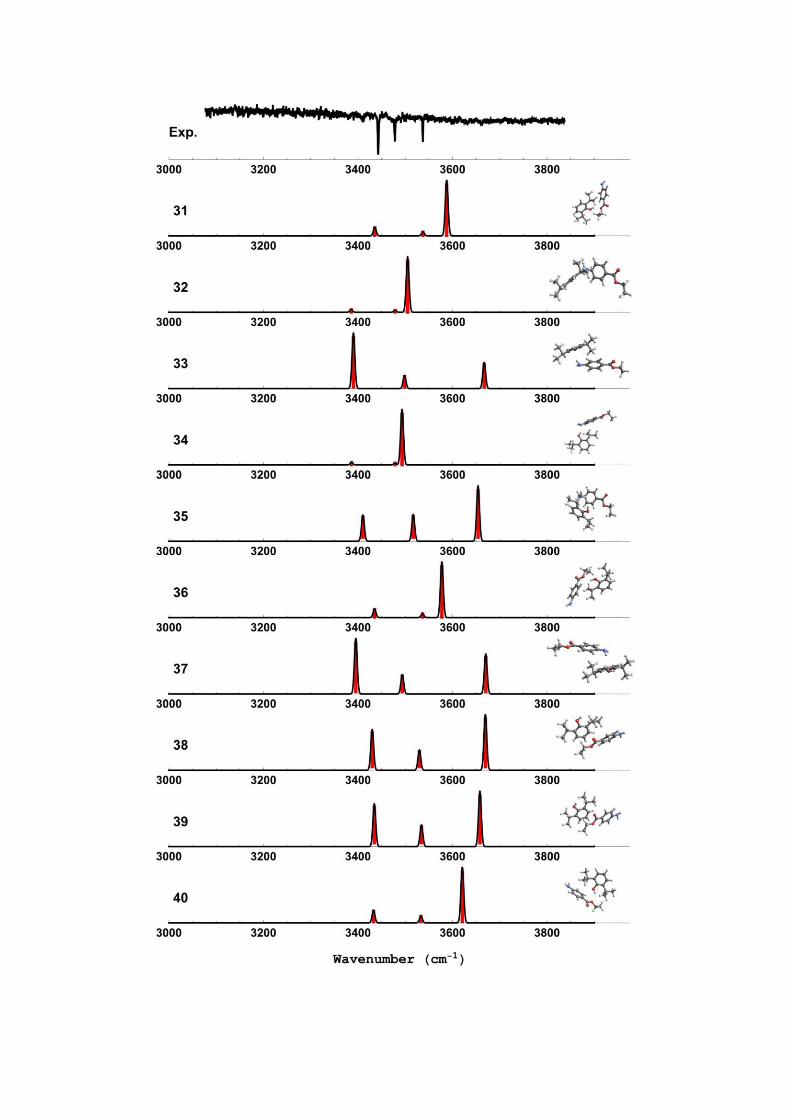
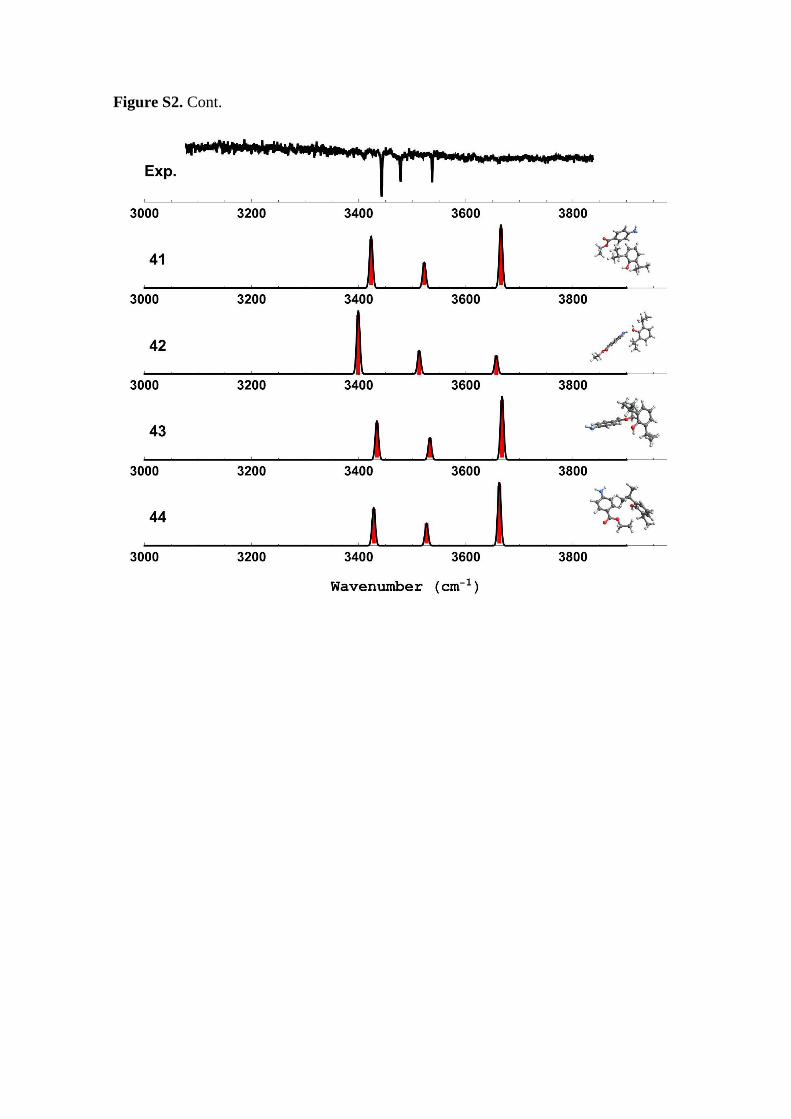
Figure S2. Cont.
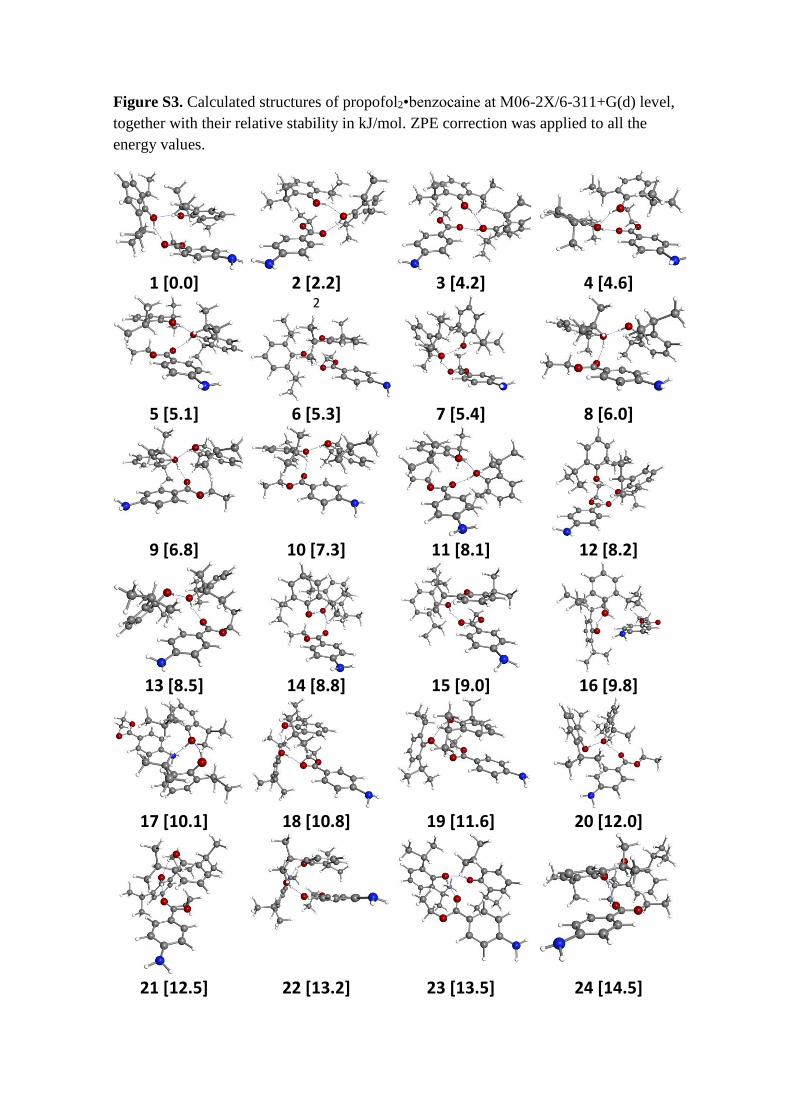
Figure S3. Calculated structures of propofol2•benzocaine at M06-2X/6-311+G(d) level,
together with their relative stability in kJ/mol. ZPE correction was applied to all the
energy values.
1 [0.0] 2 [2.2] 3 [4.2] 4 [4.6]
2
5 [5.1] 6 [5.3] 7 [5.4] 8 [6.0]
9 [6.8] 10 [7.3] 11 [8.1] 12 [8.2]
13 [8.5] 14 [8.8] 15 [9.0] 16 [9.8]
17 [10.1] 18 [10.8] 19 [11.6] 20 [12.0]
21 [12.5] 22 [13.2] 23 [13.5] 24 [14.5]
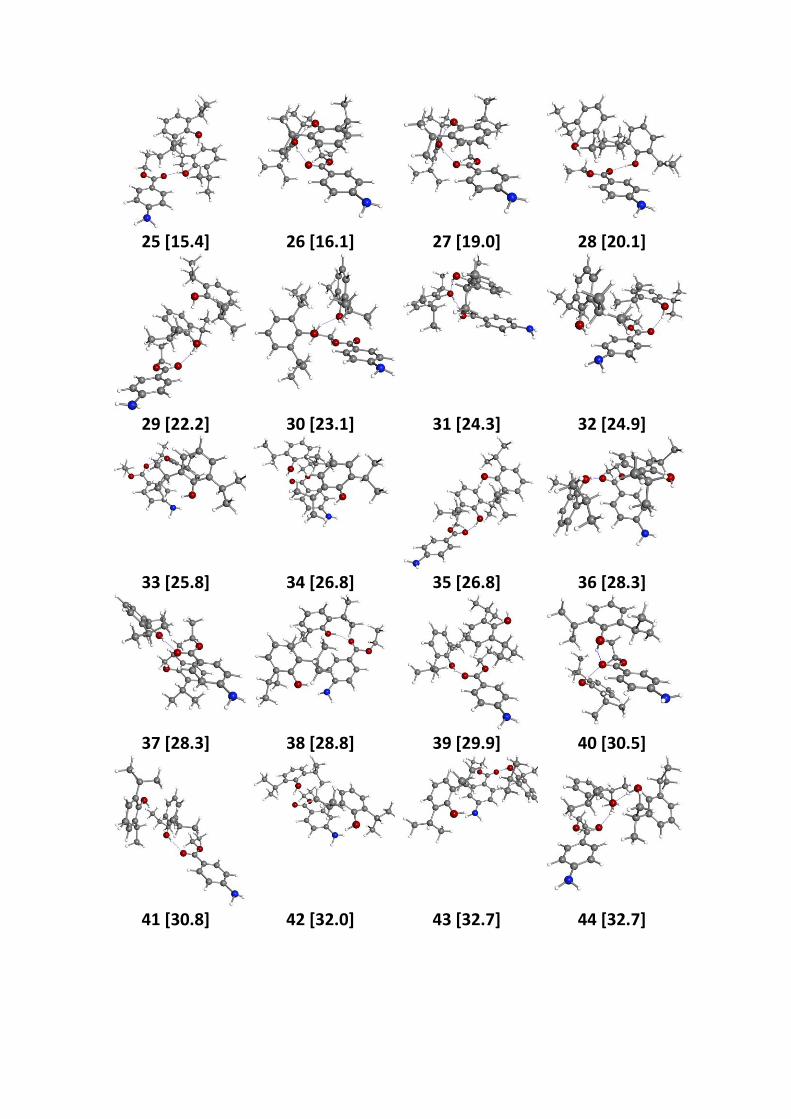
25 [15.4] 26 [16.1] 27 [19.0] 28 [20.1]
29 [22.2] 30 [23.1] 31 [24.3] 32 [24.9]
33 [25.8] 34 [26.8] 35 [26.8] 36 [28.3]
37 [28.3] 38 [28.8] 39 [29.9] 40 [30.5]
41 [30.8] 42 [32.0] 43 [32.7] 44 [32.7]
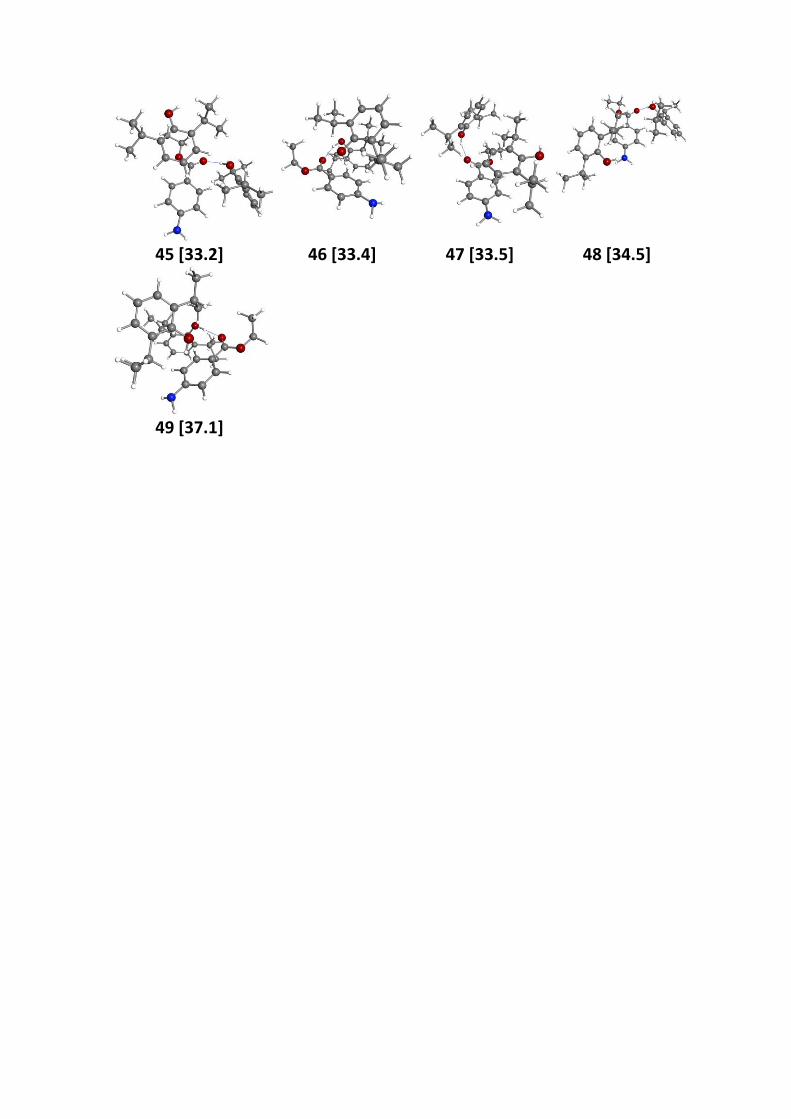
45 [33.2] 46 [33.4] 47 [33.5] 48 [34.5]
49 [37.1]
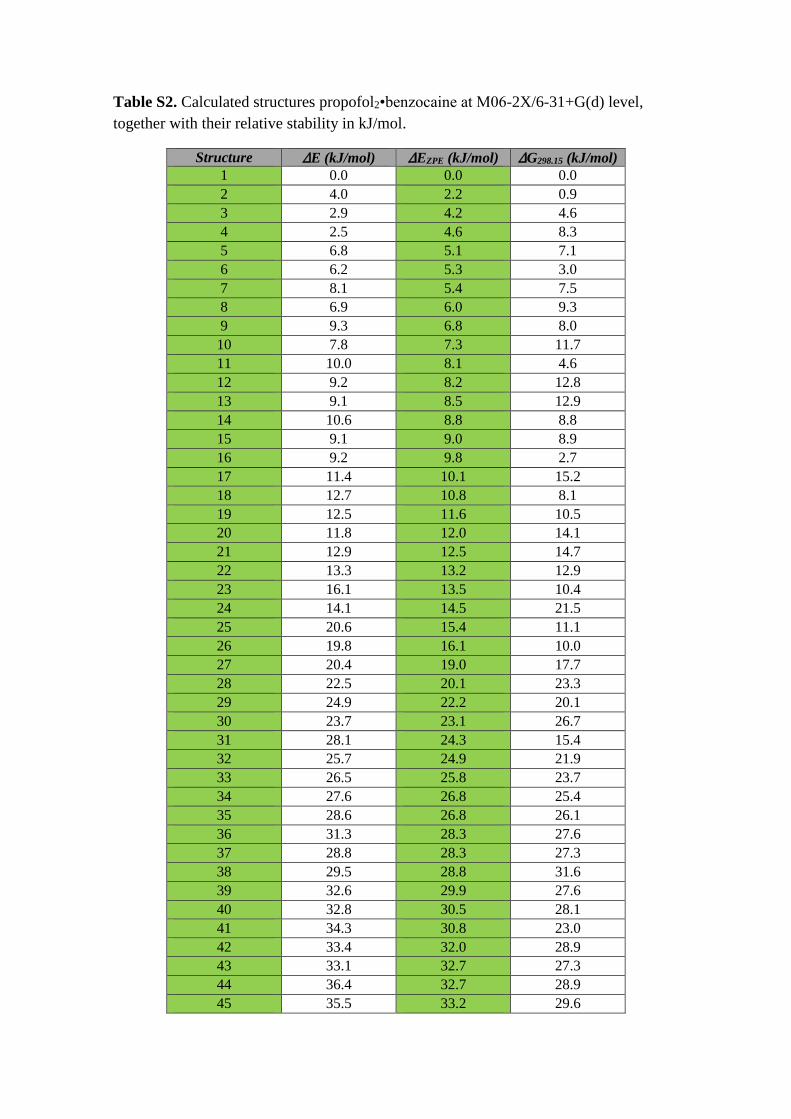
Table S2. Calculated structures propofol2•benzocaine at M06-2X/6-31+G(d) level,
together with their relative stability in kJ/mol.
Structure ∆E (kJ/mol) ∆EZPE (kJ/mol) ∆G298.15 (kJ/mol) 1 0.0 0.0 0.0
2 4.0 2.2 0.9
3 2.9 4.2 4.6
4 2.5 4.6 8.3
5 6.8 5.1 7.1
6 6.2 5.3 3.0
7 8.1 5.4 7.5
8 6.9 6.0 9.3
9 9.3 6.8 8.0
10 7.8 7.3 11.7
11 10.0 8.1 4.6
12 9.2 8.2 12.8
13 9.1 8.5 12.9
14 10.6 8.8 8.8
15 9.1 9.0 8.9
16 9.2 9.8 2.7
17 11.4 10.1 15.2
18 12.7 10.8 8.1
19 12.5 11.6 10.5
20 11.8 12.0 14.1
21 12.9 12.5 14.7
22 13.3 13.2 12.9
23 16.1 13.5 10.4
24 14.1 14.5 21.5
25 20.6 15.4 11.1
26 19.8 16.1 10.0
27 20.4 19.0 17.7
28 22.5 20.1 23.3
29 24.9 22.2 20.1
30 23.7 23.1 26.7
31 28.1 24.3 15.4
32 25.7 24.9 21.9
33 26.5 25.8 23.7
34 27.6 26.8 25.4
35 28.6 26.8 26.1
36 31.3 28.3 27.6
37 28.8 28.3 27.3
38 29.5 28.8 31.6
39 32.6 29.9 27.6
40 32.8 30.5 28.1
41 34.3 30.8 23.0
42 33.4 32.0 28.9
43 33.1 32.7 27.3
44 36.4 32.7 28.9
45 35.5 33.2 29.6

46 38.0 33.4 32.3
47 35.5 33.5 33.1
48 35.5 34.5 26.9
49 40.8 37.1 31.6
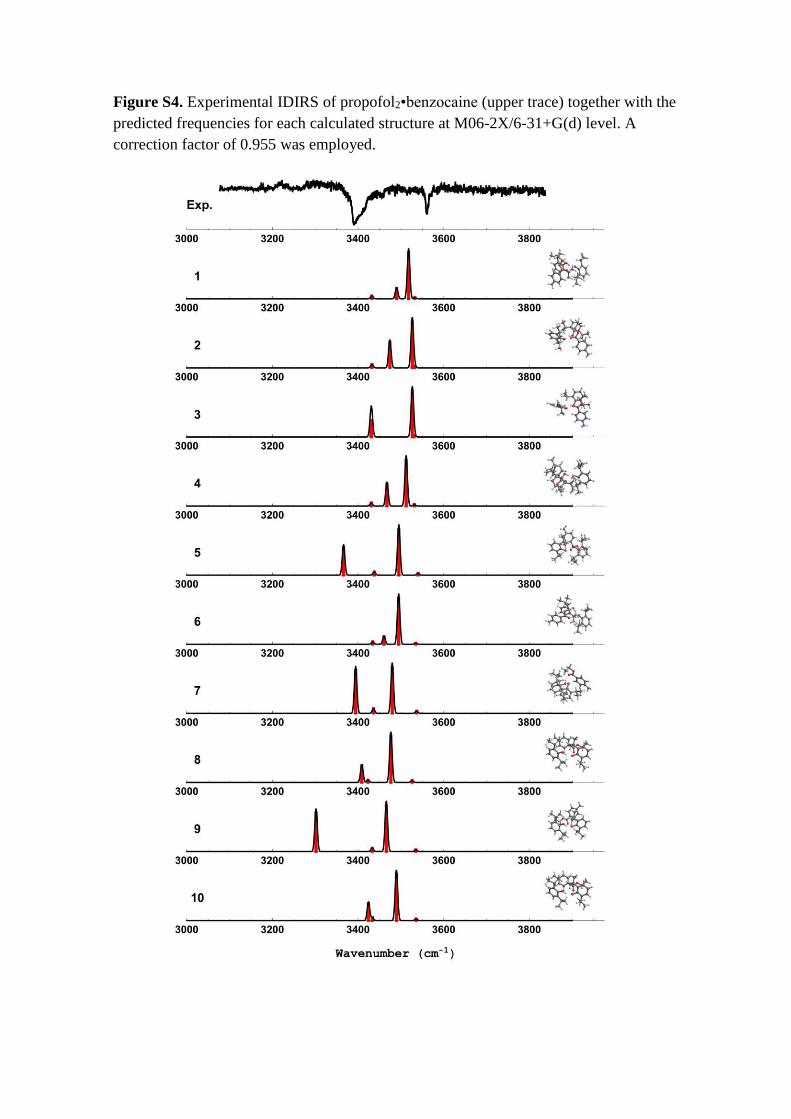
Figure S4. Experimental IDIRS of propofol2•benzocaine (upper trace) together with the
predicted frequencies for each calculated structure at M06-2X/6-31+G(d) level. A
correction factor of 0.955 was employed.
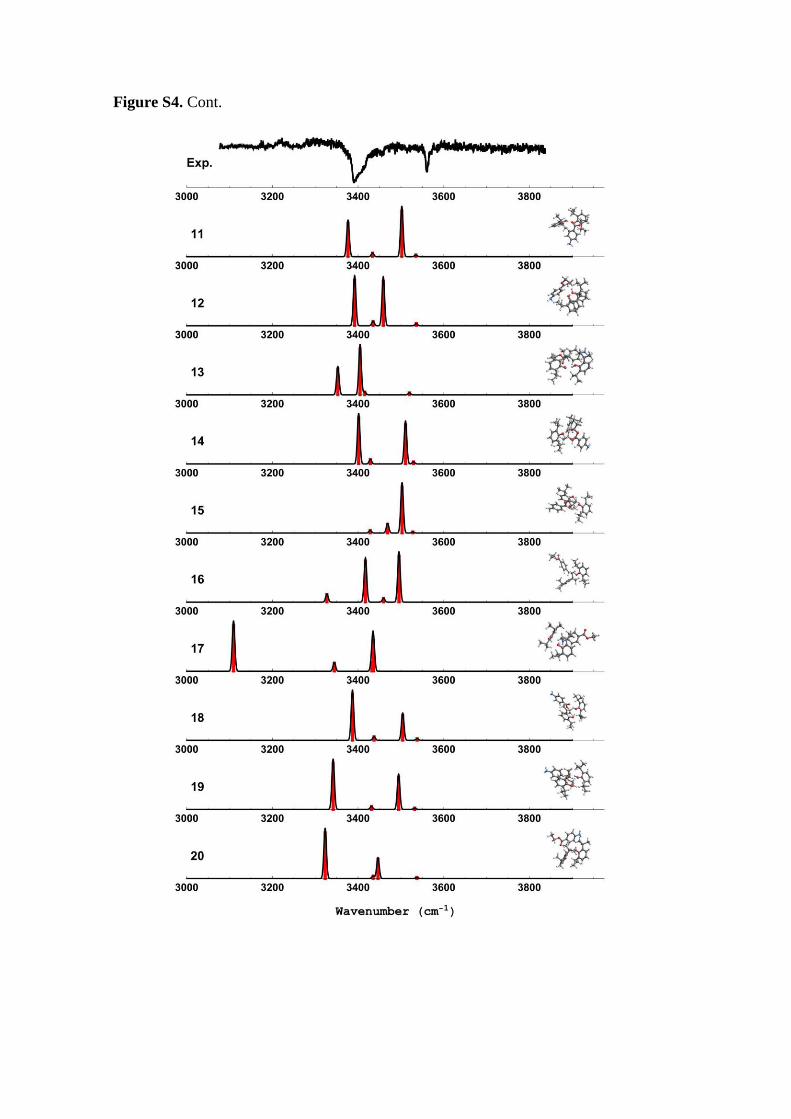
Figure S4. Cont.
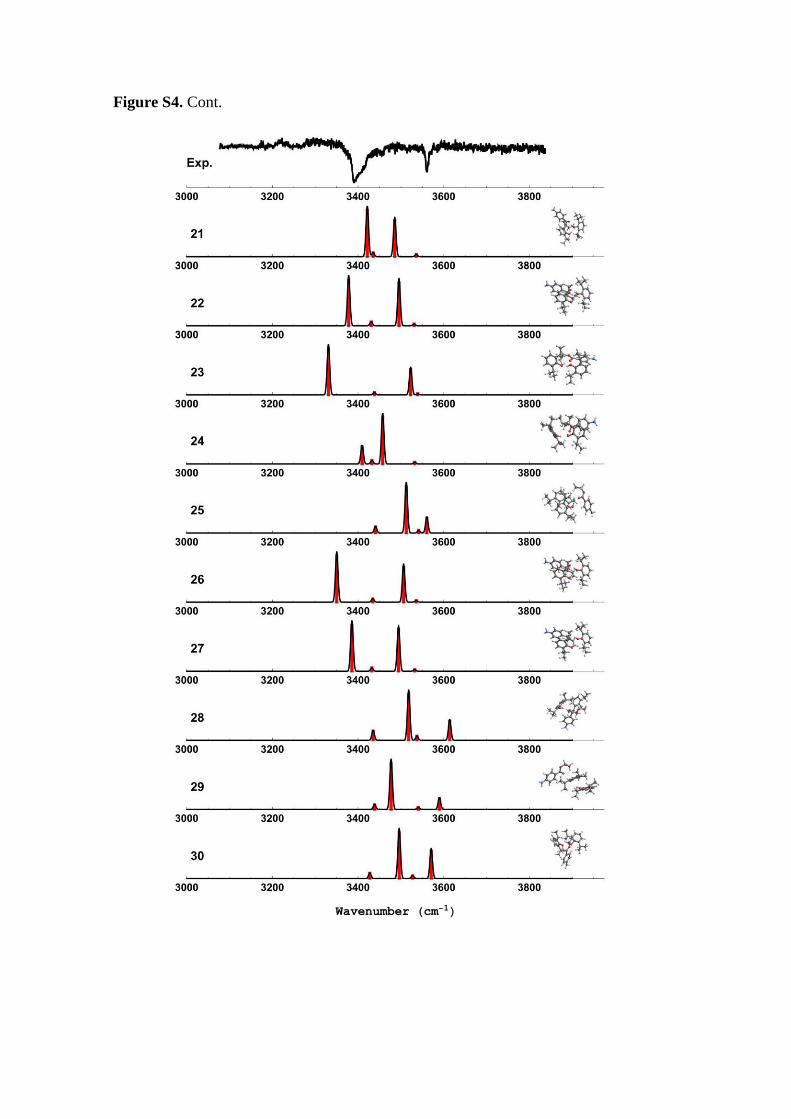
Figure S4. Cont.
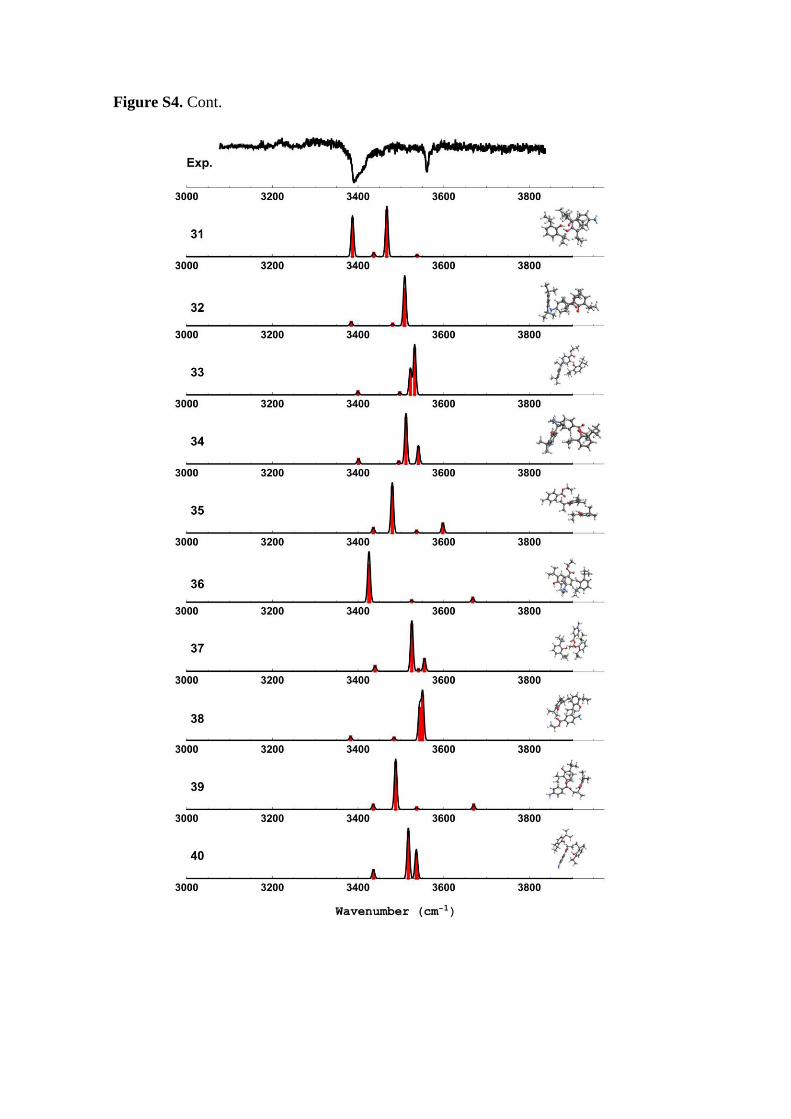
Figure S4. Cont.
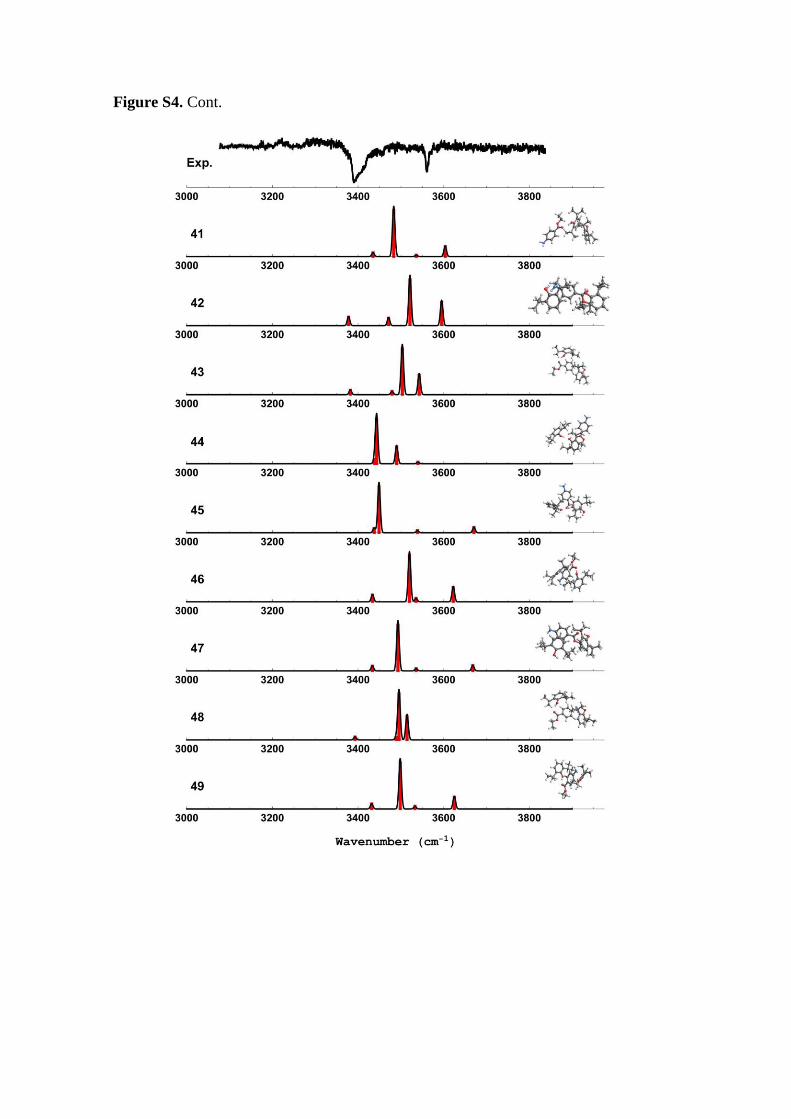
Figure S4. Cont.