Embed Size (px)
Citation preview
EUROPEAN ORGANISATIONFOR THE SAFETY OF AIR NAVIGATION
EUROCONTROL EXPERIMENTAL CENTRE
1999 ATFM SIMULATIONS
EEC Note No.10/2000
Project CFM-B-E1
Issued: June 2000
The information contained in this document is the property of the EUROCONTROL Agency and no part should be reproduced in any formwithout the Agency’s permission.
The views expressed herein do not necessarily reflect the official views or policy of the Agency
EUROCONTROL

REPORT DOCUMENTATION PAGE
Reference:EEC Note No 10/2000
Security Classification:Unclassified
Originator:EEC - FDR(Flight Data Research)
Originator (Corporate Author) Name/Location:EUROCONTROL Experimental CentreBP1591222 Brétigny-sur-Orge CEDEXFRANCETelephone : (33-1) 69 88 75 00
Sponsor:Central Flow Management Unit
Sponsor (Contract Authority) Name/Location:Director CFMUrue de la Fusée 96B -1130 BRUXELLES
TITLE:
1999 ATFM SIMULATIONS
AuthorA. Vidal
Date06/00
Pagesviii + 40
Figures12
Tables32
Annexes References--
EATMP TaskSpecification
-
Project
CFM-B-E1
Sponsor Task N° Period
1999
Distribution Statement:(a) Controlled by: Head of FDR(b) Special Limitations: None(c) Copy to NTIS: YES / NO
Descriptors (keywords):
ATFM CASA, TACOT, AMOC, capacity, delay, taxi-time
Abstract:
This document describes the results of the ATFM (Air Traffic Flow Management) studies programmeconducted by the Centre of Expertise Flight Data Research in 1999.

This document has been collated by mechanical means. Should there be missing pages, please report to:
EUROCONTROL Experimental CentrePublications Office
Centre des Bois des BordesB.P. 15
91222 - BRETIGNY-SUR-ORGE CEDEXFrance
EEC ATFM Studies - Results 1999
Project CFM-B-E1 EATMP V
EUROCONTROL
TABLE OF CONTENTSEXECUTIVE SUMMARY................................................................................................................................................ VII
1 INTRODUCTION.......................................................................................................................................................... 1
2 TOOLS............................................................................................................................................................................ 1
2.1 TACOT (TACT AUTOMATED COMMAND TOOL)..................................................................................................... 12.2 AMOC (ATFM MODELLING CAPABILITY) ............................................................................................................... 12.3 COSAAC (COMMON SIMULATOR TO ASSESS ATFM CONCEPTS)........................................................................... 22.4 CARAT (COMPUTER AIDED ROUTE ALLOCATION TOOL)......................................................................................... 2
3 OPERATIONAL STUDIES : CEU REQUESTS ........................................................................................................ 3
3.1 ARNV3.2 IMPLEMENTATION ( MARCH 1999) .......................................................................................................... 33.2 INS ( APRIL 1999) .................................................................................................................................................... 53.3 KINES (MAY 1999) ................................................................................................................................................. 93.4 MARSEILLE/BARCELONA (AUGUST 1999)............................................................................................................... 133.5 ZURICH REGULATIONS ( NOVEMBER 1999)............................................................................................................. 17
4 OPERATIONAL STUDIES : EXTERNAL REQUESTS......................................................................................... 19
4.1 DUALIZATION OF UR11 ( FEBRUARY 1999)............................................................................................................ 194.2 GREECE AERODROMES ( MARCH 1999) .................................................................................................................. 214.3 MILAN TMA ( JUNE 1999) ..................................................................................................................................... 224.4 IMPLEMENTATION OF 8.33 KHZ CHANNEL SPACING ( SEPTEMBER 1999) ............................................................... 294.5 TRANSFER OF FRANKFURT ACC ( SEPTEMBER 1999)............................................................................................. 334.6 DATALINK 2000+ ( SEPTEMBER 1999).................................................................................................................... 35
5 CONCLUSIONS .......................................................................................................................................................... 37
6 ABBREVIATIONS ...................................................................................................................................................... 39
7 CONTACTS ................................................................................................................................................................. 40

EEC ATFM Studies - Results 1999
VI Project CFM-B-E1 EATMP
EUROCONTROL
EEC ATFM Studies - Results 1999
Project CFM-B-E1 EATMP VII
EUROCONTROL
EXECUTIVE SUMMARY
This document describes the results of the ATFM (Air Traffic Flow Management) studies conducted within theCentre of Expertise “Flight Data Research” (FDR) on behalf of the CFMU (Central Flow Management Unit) in1999. The EEC Task number CFM-B-E1 was assigned to this project.The work programme and the objectives of the different studies were defined by CFMU and EEC (EurocontrolExperimental Centre) representatives and were approved by the directors of the CFMU and the EEC in ameeting held in Brétigny in December 1998.
The 1999 work programme consisted of the following studies
1 Operational studies
1.1 CEU Requests
1.1.1 Definition and validation of SRS simulation schemes (top priority for the preparation of summer1999)
1.1.2 Evaluation of the increase in individual sector capacity necessary to handle an increase in traffic of8% with decrease of total delay down to 1997 total ATFM delay (microscopic study)
1.1.3 Contingency plan evaluation (update of the departure rates)
1.2 FDO Requests
1.2.1 Validation of new major ENV data releases: ARNV3 phase 2
1.3 External Clients Requests
To Be Defined (Simulations for Langen transfer, Greece, Prague )
2 ATFM Operations
2.1 Study of CASA behaviour
2.1.1 Operational evaluation and studies to assist the ATFM working group
2.1.2 Evaluation of the variable Window Width and saving on smoothing delays
2.2 Pre-tactical operations
2.2.1 Pre-tactical using simulations, procedures and definition of the input Data
2.3 Airport Regulations
2.3.1 Co-ordination of departure ATFM slots with departure sequence: single runway operations
2.3.2 Airport Capacity Management
3 Conclusions
EEC ATFM Studies - Results 1999
VIII Project CFM-B-E1 EATMP
EUROCONTROL
This note presents the results for the main ATFM studies conducted within the Flight Data Research Centre ofExpertise . Nevertheless, others studies were conducted on behalf of the Central Flow Management Unit orexternal clients; the list of the different studies conducted is given below :
• Analyse of delays in 1999, evaluation of capacity• Analyse of the load on sector GA from Brest UAC• Canadian capacity shortfall impact on transatlantic flights• Impact of Airport constraints on departure management• Impact of global Traffic Volume on the Lower sectors of Zurich ACC• Impact of LECB(Barcelona) regulations on LFMM (Marseilles)sectors• Impact of shortfall of capacity for Greek aerodromes• Impact on delays of the implementation of new equipment , 8__33• Microscopic study delay vs capacity, evaluation of capacity• New opening sectors scheme for Bordeaux ACC/UAC• New regulation scheme on CTL/PON/PTV area• New sectorisation for Barcelona and Marseilles in the framework of CHIEF• re-orientation of traffic from a centre (Karlsruhe) to another one (Munchen)• Shortfall of capacities linked to the implementation of ARNV3• Shortfall of capacity on Traffic Volumes LSAZUA14, WSL and NSL – Zurich• Simulation of exchange of messages when all flights are in RDY status, Studies to assist the
ATFM Working Group• Simulation of increase of capacity for sectors LFEE (Reims), LFEUE and LFEUR• Simulation of re-routing for INS, KINES (Geneva sectors)• Study of the exemption of arrivals/departures to/from LIMC from the Milano regulations• Transfer of Frankfurt ACC to Langen• translation of the R/T workload reduction in capacity increase for the Data Link 2000+• Update of the departure rates Contingency plan evaluation• Usability of the routes generated by CARAT Operational Evaluation of the Quality of CARAT
Generated Routes
In 1999, 46 simulations were conducted in regard to the 7 simulations conducted in 1997 or the 17simulations made in 1998; this was due to the availability of the tools, less failures of TACOT forexample and the quality of technical and operational people.
EEC ATFM Studies - Results 1999
EATMP Project CFM-B-E1 1
EUROCONTROL
1 INTRODUCTION
This document describes the results of the main ATFM (Air Traffic Flow Management) studies conductedwithin the Centre of Expertise Flight Data Research on behalf of the CFMU (Central Flow Management Unit)in 1999. The EEC Task number CFM-B-E1 was assigned to this project.The work programme and the objectives of the different studies were defined by CFMU and EECrepresentatives and were approved by the directors of the CFMU and the EEC in a meeting held in Brétignyin December 1998.
2 TOOLS
The achievement of the study objectives were facilitated by the use of a range of ATFM Tools as TACOT(TACT Automated Command Tool), AMOC (Atfm Modeling Capability) , COSAAC (Common Simulator toAssess Atfm Concepts) and CARAT(Computer Aided Route Allocation Tool).
2.1 TACOT (TACT Automated Command Tool)
The TACT Automated Command Tool is a simulation tool used for studies and simulations in support ofCFMU Operations.TACOT is based on existing tools currently in use within the TACT system.TACOT sends automatically commands to the kernel of the CFMU TACT system; the input is a scriptcontaining service commands read, interpreted and propagated to TACT to create regulation, to cancel flightsfor example.TACOT can run as a real part of TACT network, but it is used in ATFM simulations as a stand-alone process.Special services are provided so that TACOT can configure itself to a specific mode of execution.
In order to speed up the process, a time control gives to TACOT the capability to accelerate time, withoutaffecting the integrity of the TACT system.TACOT allows replaying special events, to create regulations and to analyse the results.
2.2 AMOC (ATFM Modelling Capability)
AMOC is the ATFM Modelling Capability, one of the EEC ATFM simulators.It is composed of several modules :• ATAC to generate 4D profiles (+ elementary sectors and times of entry) from the CFMU archives.• FIPS to generate future traffic samples, using the STATFOR data and a parameterised programme for
the hourly distribution.• SELFLOW and FRED to select flights in specified traffic volumes.• CASA to allocate slots to regulated flights.• Several other functionalities such as “slot swapping”.
Several analysis programmes (in addition to the CFMU QC tools, fully integrated into AMOC) such as ISO(Index of Smoothing and Overload), Index of Equity, slot lists per regulation, per Airport, per AO…, to be ableto compare different Slot Allocation Strategies.
An interface was made between AMOC and MECA (Economical Model) to make Cost Benefit Analysis of anATFM simulation scheme (cost of capacity, made on CRCO basis, and cost of delay, using IATA figures andtraffic distribution).
EEC ATFM Studies - Results 1999
2 Project CFM-B-E1 EATMP
EUROCONTROL
2.3 COSAAC (COmmon Simulator to Assess ATFM Concepts)
COSAAC is an ATFM simulation tool which can be used at pre-tactical phase.
COSAAC makes use of the following data input:
• ECAC maps: ACC sectors and beacons;• CFMU archived data: flights and environment data;• European ATC capacities;• European ATC sectors configurations.
The current available functions are:
• Graphic display: flights lists, flow graph…• Traffic demand/Capacity comparison for an entire ACC, hour per hour for a H24 period
(superposition grids);• Traffic flows creation and graphic display of them with possibility to apply parameters
(increase, decrease) to those flows and creation by the system of new flights;• Slot allocation module to manage aerodrome or ATC sectors constraints;• Regulation impact display directly on superposition grids;• Delays reports;• Manual re-routing (waiting for CARAT results) of flights or flows;• Re-routing impact display: on sector load, flights lists (before and after re-routing).
2.4 CARAT (Computer Aided Route Allocation Tool)
CARAT is a tool developed to validate, by iterative steps, an innovative system of flight plan re-routing,taking into account the operational constraints. These are defined by the necessity to pass by or to avoid ATCpoints or pieces of airspace, to respect the level restrictions and the time intervals accessibility ofthe route components (e.g. the CDR categories).
The first objective was to provide support to the CFMU route catalogue maintenance, with the furtherobjective of playing the role of a dynamic and interactive resource to re-routing specific flights.
Another objective was to provide support to EEC activities involving massive re-routing, like contribution toSRS elaboration and validation (or CDR studies ).
The method used for the system processing is based on an improvement of an algorithm mainly taking intoaccount vertical profile and temporal restriction.
A significant effort of continuous adaptation to the numerous evolutions of CFMU environment databases hasbeen sustained in the recent period.
For integration of SRS constraints, a protocol of exchange with an external, CFMU-provided, SRS checkerhas been defined and is being implemented, with the objective of delivering to CFMU an integrable system insummer 2000.
EEC ATFM Studies - Results 1999
EATMP Project CFM-B-E1 3
EUROCONTROL
3 OPERATIONAL STUDIES : CEU REQUESTS
3.1 ARNV3.2 Implementation ( March 1999)
3.1.1 Study Objective
The objective of the simulation was to evaluate, in term of delays, the impact of the implementation of a newroute network and the capacity shortfall requested by several countries during this period.
3.1.2 ARN V3 First Day
3.1.2.1 Reference DayThe simulation was done with the data of February 27, 1998, using the TACOT simulator
3.1.2.1.1 Rates decreased by 50%
For the reference day, only French, Swiss regulations plus EGLL arrivals were implemented.
The first conclusion was that all traffic could not fly through the Geneva airspace if rates were decreased by 50%.Even with regulations running until midnight , significant bunching on LSAGSUP,KIN and INN were found.
3.1.2.1.2 Rates decreased by 30 %
The same simulation has been done, with TACOT, with a decrease of 30% in LSAG.
3.1.3 ARN V3 Continuation
The simulation was made with the data of March 13, 1998, with TACOT.For the reference day, only French, Swiss regulations with some UK and German regulations.
LSAG : -20%LSAZ : -30%LFMM : -15%LFEE : East -20%
North-West -15%On simulation scheme 1, UNXN and ESE were collapsed.On simulation scheme 2, the 4 sectors were split.
LFFF : -15%LFBB : -20%
The situation in terms of regulations depended on the number of opened sectors and then checked on pre-tactical (J-2).
EEC ATFM Studies - Results 1999
4 Project CFM-B-E1 EATMP
EUROCONTROL
3.1.4 ARN V3 Continuation-Final
The simulation was made, with TACOT, using the data of March 27, 1998For the reference day, all major regulations were implemented.
For simulation scheme 1 :
LSAG : -10%LSAZ : -20%LFMM : -15%LFEE : East -20%
North-West -15%On simulation scheme 1 ,UNXN and ESE were collapsed.On simulation scheme 2 , the 4 sectors are split.
LFFF : NilLFBB : -10%
For simulation scheme 2 :
LFEE : -10%
3.1.5 Conclusion
The objective of this set of simulations was to evaluate, in term of delays, the impact of the capacity shortfallrequested by several countries during this period.According to the date of the implementation of the new route network and the late request of severalcountries for a capacity shortfall ,the study was conducted rapidly, the results were sent to the CFMU andwere useful to prepare the AIM and to inform the ACCs.
EEC ATFM Studies - Results 1999
EATMP Project CFM-B-E1 5
EUROCONTROL
3.2 INS ( April 1999)
3.2.1 Study Objective
The Standard Route Scheme (SRS) is a strategically planned routing system designed to make the mosteffective use of ATC capacity. They enables ATC to maximise capacity by defining routings that provide anorganised system of major traffic flows through congested areas and reduce the crossing of major flows atcritical points.According to the definition of SRS and to the Work Programme defined between the CFMU and the EEC, theCEU asked the Centre of Expertise Flight Data Research to define operational simulation schemes and tofind available routings to avoid INS sector in the Geneva airspace.
3.2.2 Study Method
The study approach consisted in re-routing some flows in order to decrease the number of flights enteringINS sector and then reducing delays but taking into account the load of other Sectors around the Genevaairspace.
Data of Friday 19/03/1999 was used for this study and were used in TACOT.These data were extracted from ARC data of the CFMUFor the purpose of regulations, several traffic volumes were used.A traffic volume is a set of flights crossing an airspace (Sector or point), coming from an area and going to another area.
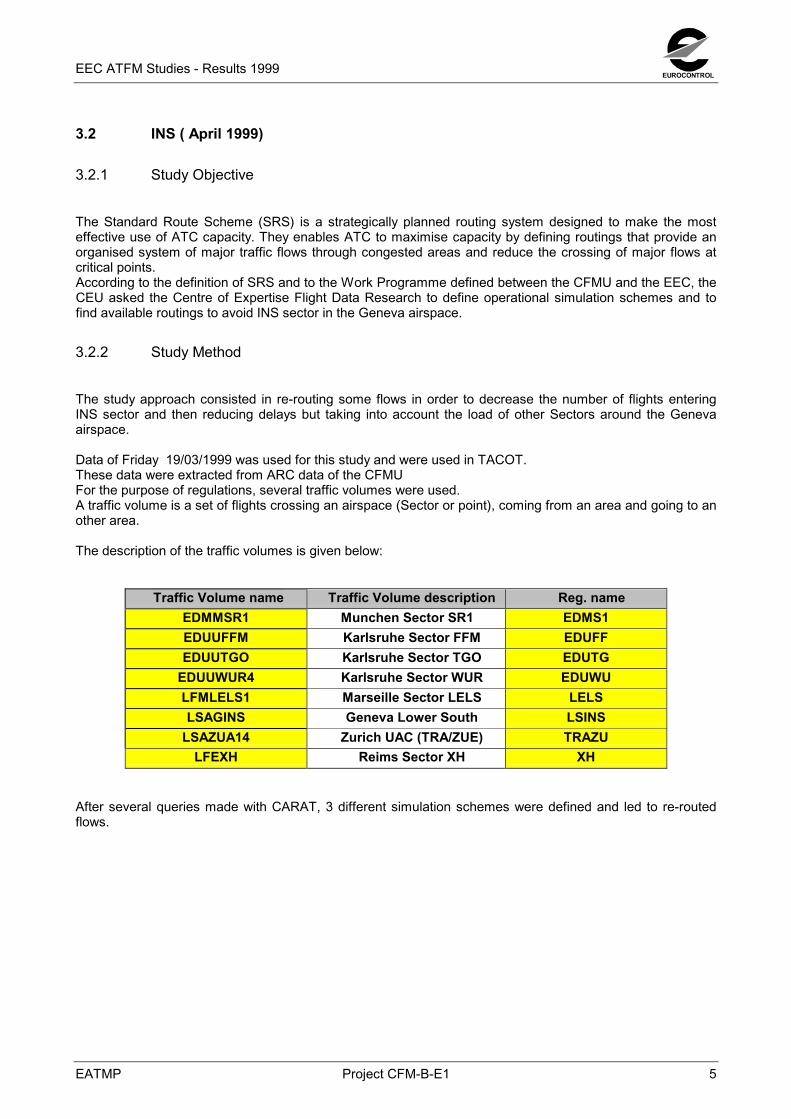
The description of the traffic volumes is given below:
Traffic Volume name Traffic Volume description Reg. nameEDMMSR1 Munchen Sector SR1 EDMS1EDUUFFM Karlsruhe Sector FFM EDUFFEDUUTGO Karlsruhe Sector TGO EDUTG
EDUUWUR4 Karlsruhe Sector WUR EDUWULFMLELS1 Marseille Sector LELS LELSLSAGINS Geneva Lower South LSINS
LSAZUA14 Zurich UAC (TRA/ZUE) TRAZULFEXH Reims Sector XH XH
After several queries made with CARAT, 3 different simulation schemes were defined and led to re-routedflows.
EEC ATFM Studies - Results 1999
6 Project CFM-B-E1 EATMP
EUROCONTROL
The following airports were involved in the re-routing
AirportEBBR Brussels-NationalEDDK KholnEDDL DusseldorfEHAM Amsterdam-SchipholELLX LuxembourgLFLL Lyon-SatolasLFML Marseille-ProvenceLFST Strasbourg-EntzheimLIMC Milano-MalpensaLIME Bergamo-Orio Al SerioLIMJ Genova-SestriLIRF Roma-FiumicinoLSZH Zurich
3.2.3 Simulation schemes
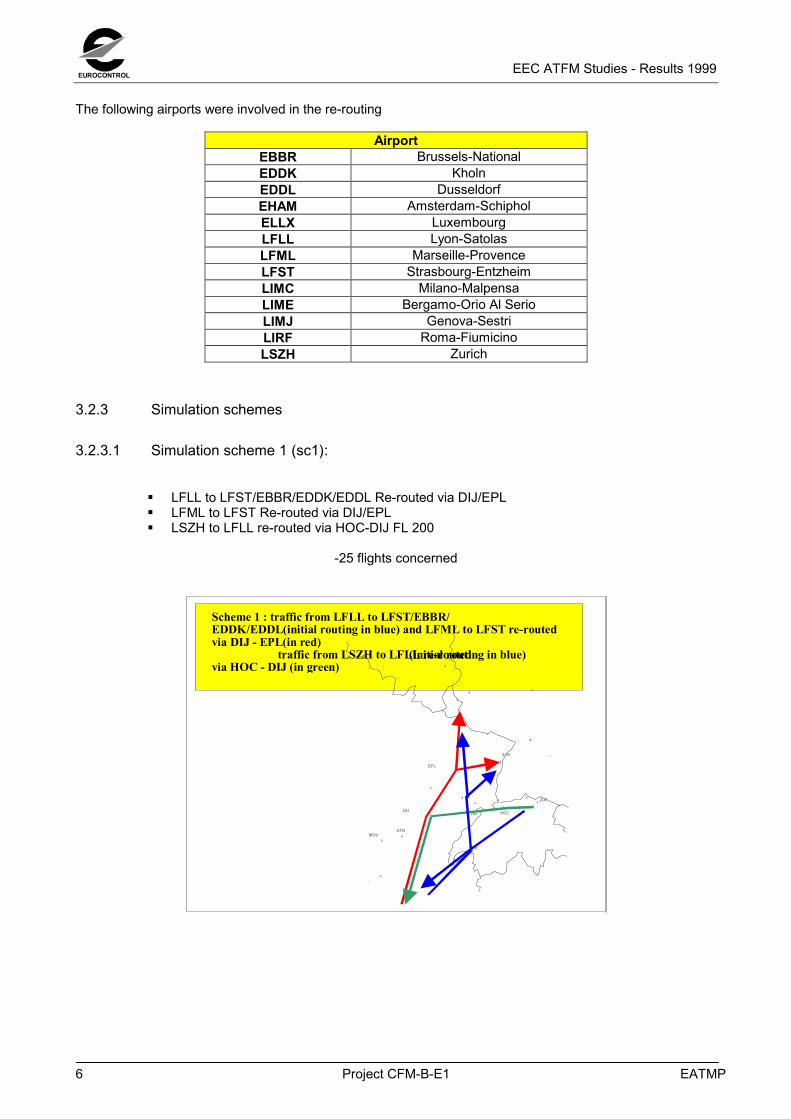
3.2.3.1 Simulation scheme 1 (sc1):
� LFLL to LFST/EBBR/EDDK/EDDL Re-routed via DIJ/EPL� LFML to LFST Re-routed via DIJ/EPL� LSZH to LFLL re-routed via HOC-DIJ FL 200
-25 flights concerned
Scheme 1 : traffic from LFLL to LFST/EBBR/EDDK/EDDL(initial routing in blue) and LFML to LFST re-routedvia DIJ - EPL(in red) traffic from LSZH to LFLL re-routedvia HOC - DIJ (in green)
(initial routing in blue)
ATN
DIJ
EPL
HOCHR
MOU
PAS
SPR
STR
ZUE
EEC ATFM Studies - Results 1999
EATMP Project CFM-B-E1 7
EUROCONTROL
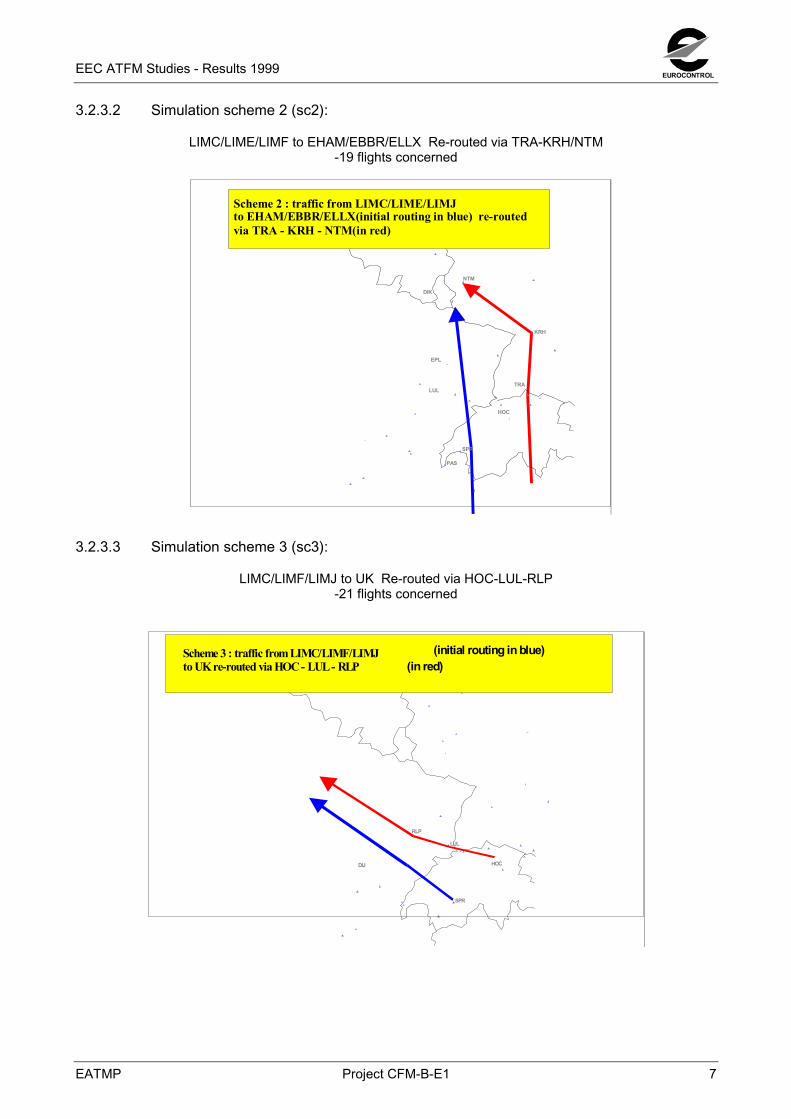
3.2.3.2 Simulation scheme 2 (sc2):
LIMC/LIME/LIMF to EHAM/EBBR/ELLX Re-routed via TRA-KRH/NTM-19 flights concerned
DIK
EPL
HOC
KRH
LUL
NTM
PAS
SPR
TRA
Scheme 2 : traffic from LIMC/LIME/LIMJto EHAM/EBBR/ELLX(initial routing in blue) re-routedvia TRA - KRH - NTM(in red)
3.2.3.3 Simulation scheme 3 (sc3):
LIMC/LIMF/LIMJ to UK Re-routed via HOC-LUL-RLP-21 flights concerned
DIJ HOC
LUL
RLP
SPR
Scheme 3 : traffic from LIMC/LIMF/LIMJto UK re-routed via HOC - LUL - RLP
(initial routing in blue)(in red)
EEC ATFM Studies - Results 1999
8 Project CFM-B-E1 EATMP
EUROCONTROL
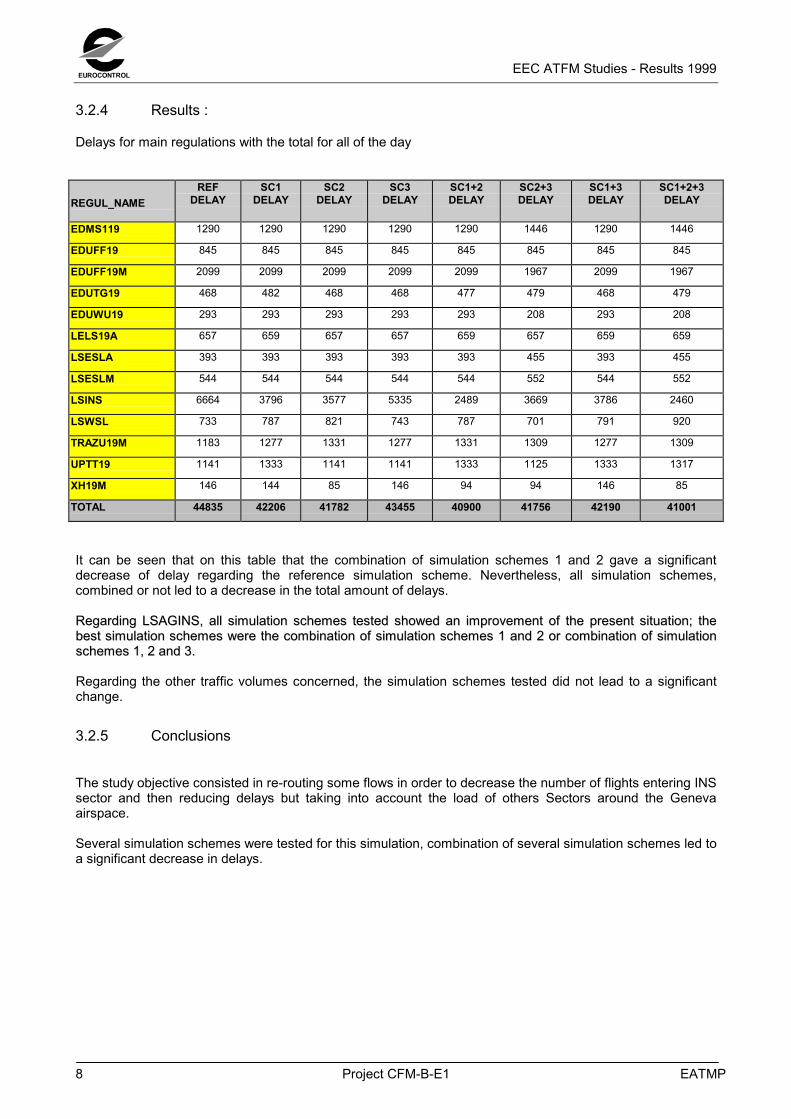
3.2.4 Results :
Delays for main regulations with the total for all of the day
REGUL_NAMEREF
DELAYSC1
DELAYSC2
DELAYSC3
DELAYSC1+2DELAY
SC2+3DELAY
SC1+3DELAY
SC1+2+3DELAY
EDMS119 1290 1290 1290 1290 1290 1446 1290 1446
EDUFF19 845 845 845 845 845 845 845 845
EDUFF19M 2099 2099 2099 2099 2099 1967 2099 1967
EDUTG19 468 482 468 468 477 479 468 479
EDUWU19 293 293 293 293 293 208 293 208
LELS19A 657 659 657 657 659 657 659 659
LSESLA 393 393 393 393 393 455 393 455
LSESLM 544 544 544 544 544 552 544 552
LSINS 6664 3796 3577 5335 2489 3669 3786 2460
LSWSL 733 787 821 743 787 701 791 920
TRAZU19M 1183 1277 1331 1277 1331 1309 1277 1309
UPTT19 1141 1333 1141 1141 1333 1125 1333 1317
XH19M 146 144 85 146 94 94 146 85
TOTAL 44835 42206 41782 43455 40900 41756 42190 41001
It can be seen that on this table that the combination of simulation schemes 1 and 2 gave a significantdecrease of delay regarding the reference simulation scheme. Nevertheless, all simulation schemes,combined or not led to a decrease in the total amount of delays.
RReeggaarrddiinngg LLSSAAGGIINNSS,, aallll ssiimmuullaattiioonn sscchheemmeess tteesstteedd sshhoowweedd aann iimmpprroovveemmeenntt ooff tthhee pprreesseenntt ssiittuuaattiioonn;; tthheebbeesstt ssiimmuullaattiioonn sscchheemmeess wweerree tthhee ccoommbbiinnaattiioonn ooff ssiimmuullaattiioonn sscchheemmeess 11 aanndd 22 oorr ccoommbbiinnaattiioonn ooff ssiimmuullaattiioonnsscchheemmeess 11,, 22 aanndd 33..
Regarding the other traffic volumes concerned, the simulation schemes tested did not lead to a significantchange.
3.2.5 Conclusions
The study objective consisted in re-routing some flows in order to decrease the number of flights entering INSsector and then reducing delays but taking into account the load of others Sectors around the Genevaairspace.
Several simulation schemes were tested for this simulation, combination of several simulation schemes led toa significant decrease in delays.
EEC ATFM Studies - Results 1999
EATMP Project CFM-B-E1 9
EUROCONTROL
3.3 KINES (May 1999)
3.3.1 Study objective
According to the definition of SRS and to the Work Programme defined between the CFMU and the EEC, theCEU asked the Centre of Expertise Flight Data Research to define operational simulation schemes and tofind available routings to avoid KINES sector in the Geneva airspace
3.3.2 Study Method
The flows of traffic into the specified sector were analysed to find possible re-routings.The simulation schemes were validated by simulations to estimate the costs/benefits (additional mileage,delays…).
3.3.3 Study approach and simulation schemes
The study approach consisted in re-routing some flows in order to decrease the number of flights entering theKINES sector and then reducing delays but taking into account the load of others Sectors around Genevaairspace.
Data of Friday 04/02/1999 was used for this study with TACOT.These data were extracted from ARC data of the CFMU.For the purpose of regulations, several traffic volumes were used.A traffic volume is a set of flights crossing an airspace (Sector or point), coming from an area and going to another area.
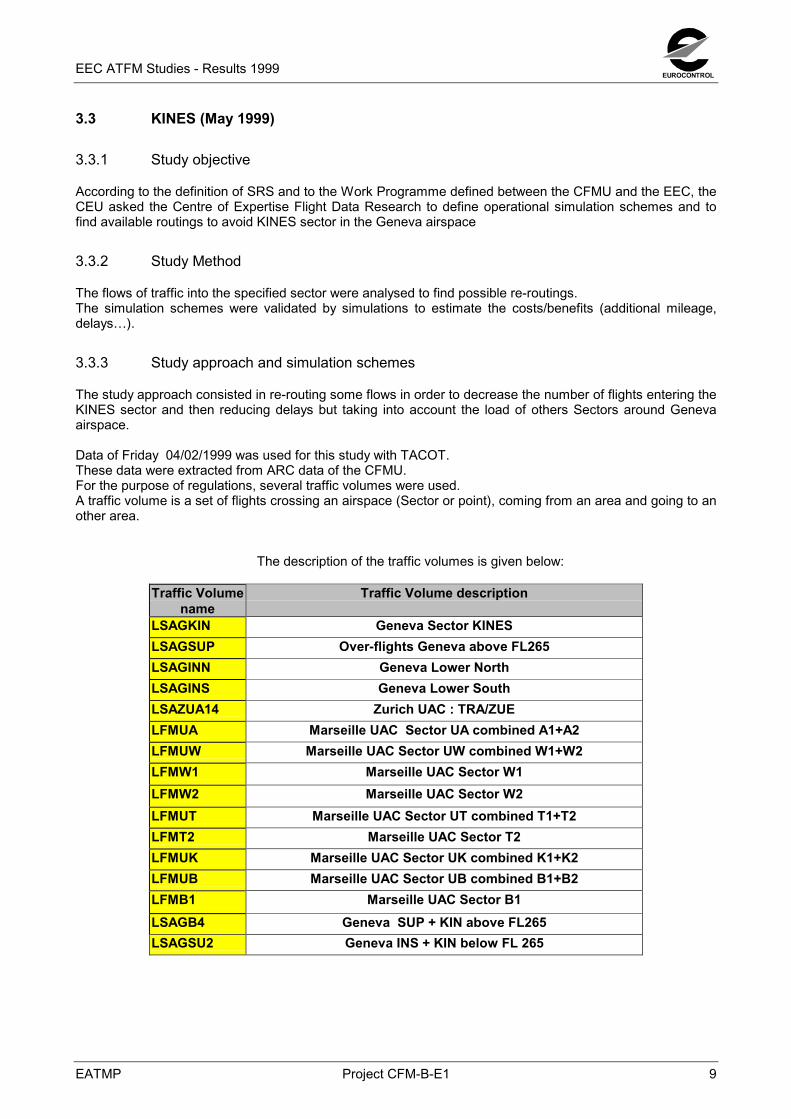
The description of the traffic volumes is given below:
Traffic Volumename
Traffic Volume description
LSAGKIN Geneva Sector KINESLSAGSUP Over-flights Geneva above FL265LSAGINN Geneva Lower NorthLSAGINS Geneva Lower SouthLSAZUA14 Zurich UAC : TRA/ZUELFMUA Marseille UAC Sector UA combined A1+A2LFMUW Marseille UAC Sector UW combined W1+W2LFMW1 Marseille UAC Sector W1LFMW2 Marseille UAC Sector W2LFMUT Marseille UAC Sector UT combined T1+T2LFMT2 Marseille UAC Sector T2LFMUK Marseille UAC Sector UK combined K1+K2LFMUB Marseille UAC Sector UB combined B1+B2LFMB1 Marseille UAC Sector B1LSAGB4 Geneva SUP + KIN above FL265LSAGSU2 Geneva INS + KIN below FL 265
EEC ATFM Studies - Results 1999
10 Project CFM-B-E1 EATMP
EUROCONTROL
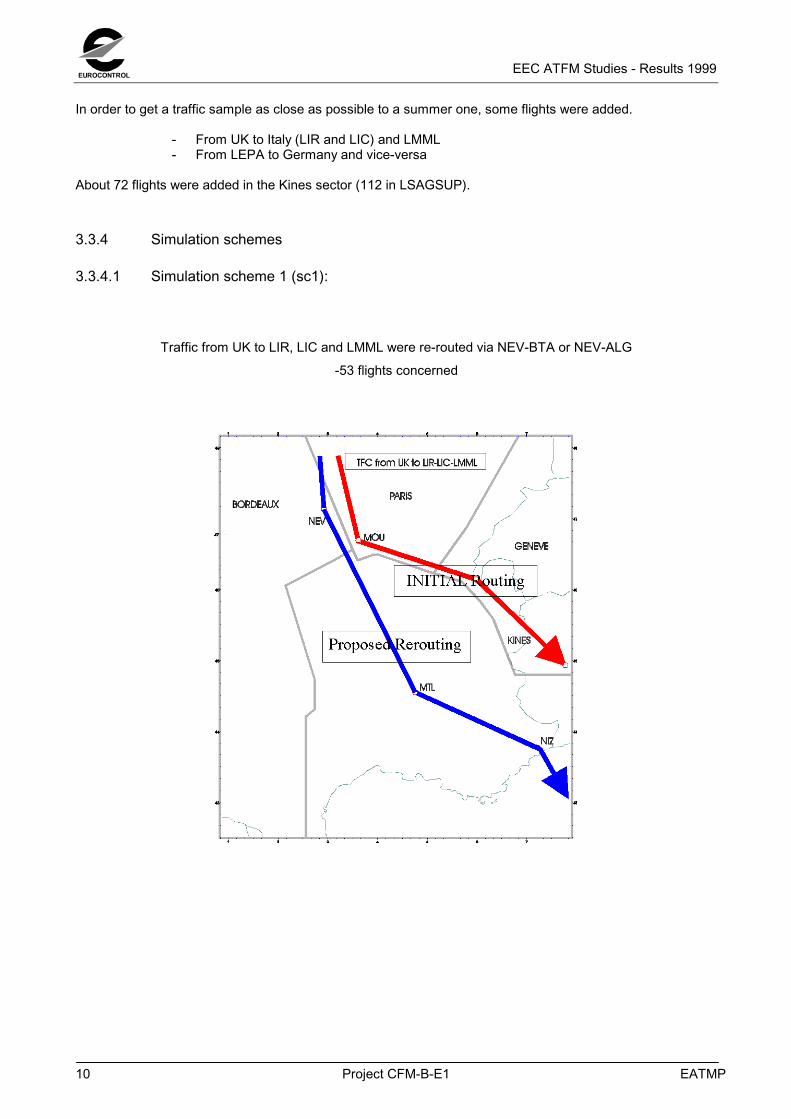
In order to get a traffic sample as close as possible to a summer one, some flights were added.
- From UK to Italy (LIR and LIC) and LMML- From LEPA to Germany and vice-versa
About 72 flights were added in the Kines sector (112 in LSAGSUP).
3.3.4 Simulation schemes
3.3.4.1 Simulation scheme 1 (sc1):
Traffic from UK to LIR, LIC and LMML were re-routed via NEV-BTA or NEV-ALG
-53 flights concerned
EEC ATFM Studies - Results 1999
EATMP Project CFM-B-E1 11
EUROCONTROL
3.3.4.2 Simulation scheme 2 (sc2):
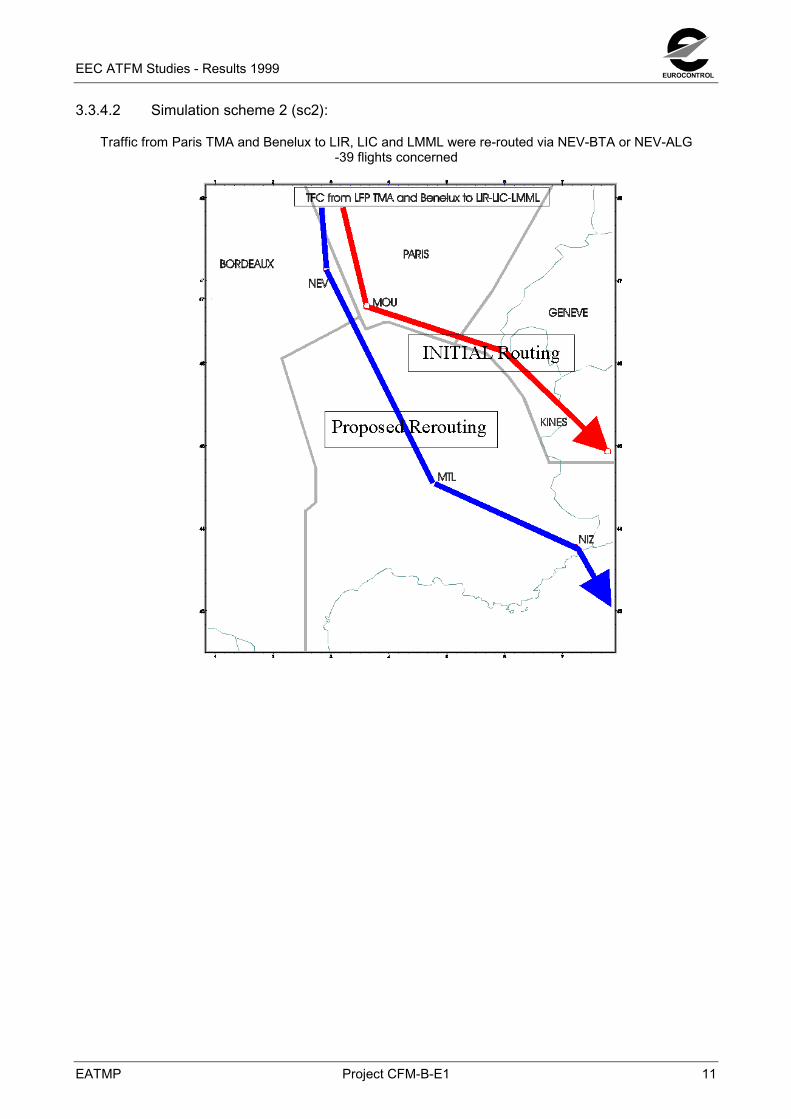
Traffic from Paris TMA and Benelux to LIR, LIC and LMML were re-routed via NEV-BTA or NEV-ALG-39 flights concerned
EEC ATFM Studies - Results 1999
12 Project CFM-B-E1 EATMP
EUROCONTROL
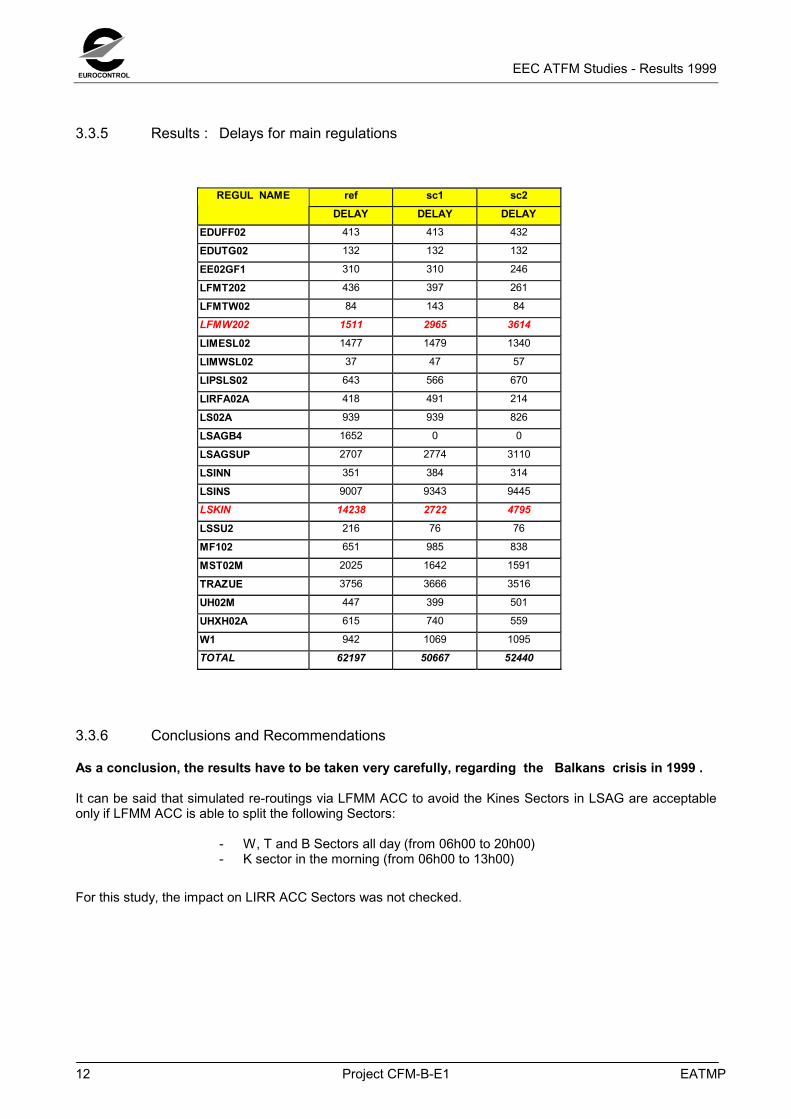
3.3.5 Results : Delays for main regulations
ref sc1 sc2REGUL NAMEDELAY DELAY DELAY
EDUFF02 413 413 432
EDUTG02 132 132 132
EE02GF1 310 310 246
LFMT202 436 397 261
LFMTW02 84 143 84
LFMW202 1511 2965 3614
LIMESL02 1477 1479 1340
LIMWSL02 37 47 57
LIPSLS02 643 566 670
LIRFA02A 418 491 214
LS02A 939 939 826
LSAGB4 1652 0 0
LSAGSUP 2707 2774 3110
LSINN 351 384 314
LSINS 9007 9343 9445
LSKIN 14238 2722 4795
LSSU2 216 76 76
MF102 651 985 838
MST02M 2025 1642 1591
TRAZUE 3756 3666 3516
UH02M 447 399 501
UHXH02A 615 740 559
W1 942 1069 1095
TOTAL 62197 50667 52440
3.3.6 Conclusions and Recommendations
As a conclusion, the results have to be taken very carefully, regarding the Balkans crisis in 1999 .
It can be said that simulated re-routings via LFMM ACC to avoid the Kines Sectors in LSAG are acceptableonly if LFMM ACC is able to split the following Sectors:
- W, T and B Sectors all day (from 06h00 to 20h00)- K sector in the morning (from 06h00 to 13h00)
For this study, the impact on LIRR ACC Sectors was not checked.
EEC ATFM Studies - Results 1999
EATMP Project CFM-B-E1 13
EUROCONTROL
3.4 Marseille/Barcelona (August 1999)
3.4.1 Study Objectives
In congested areas, regulations are in force to protect this airspace, but it was interesting to analyse, in a verycrowed area, the impact of regulations from an airspace to an other one.
Heavy regulations to protect Barcelona ACC create delays and push back a lot of traffic to the beginning ofevening when the number of opened Sectors in Marseille ACC decrease.The study must show the real impact of LECB regulations on LFMM ones.
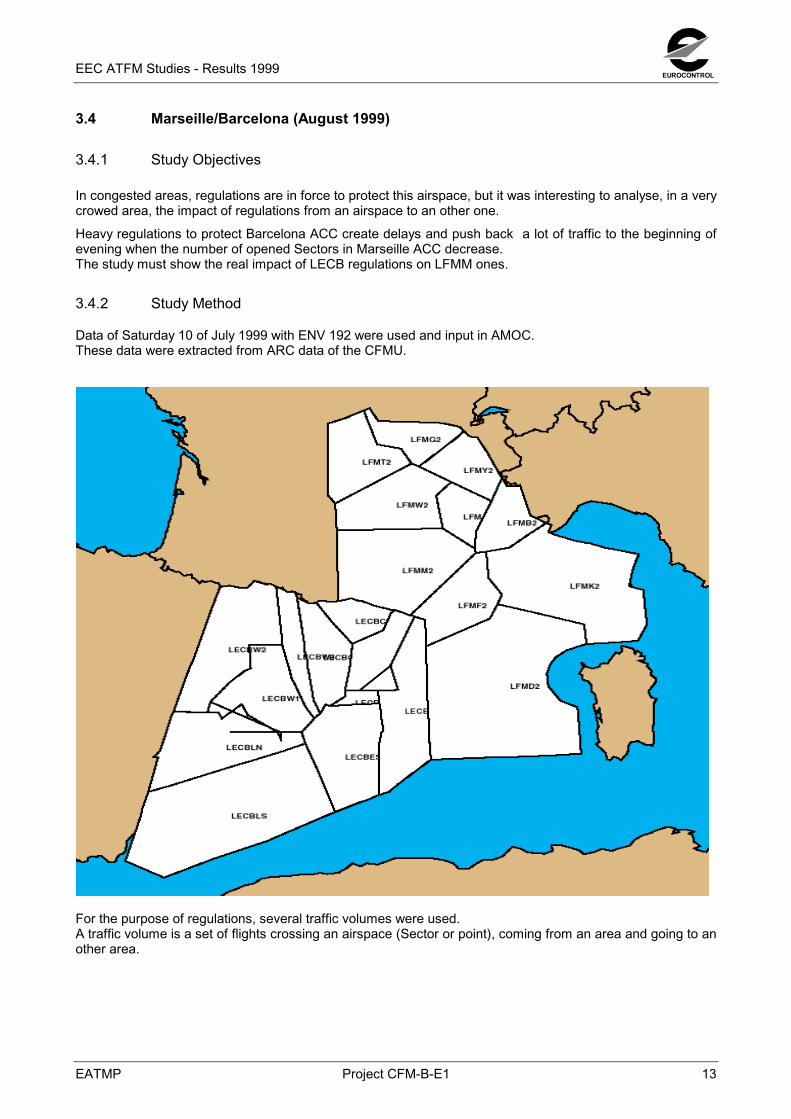
3.4.2 Study Method
Data of Saturday 10 of July 1999 with ENV 192 were used and input in AMOC.These data were extracted from ARC data of the CFMU.
For the purpose of regulations, several traffic volumes were used.A traffic volume is a set of flights crossing an airspace (Sector or point), coming from an area and going to another area.
EEC ATFM Studies - Results 1999
14 Project CFM-B-E1 EATMP
EUROCONTROL
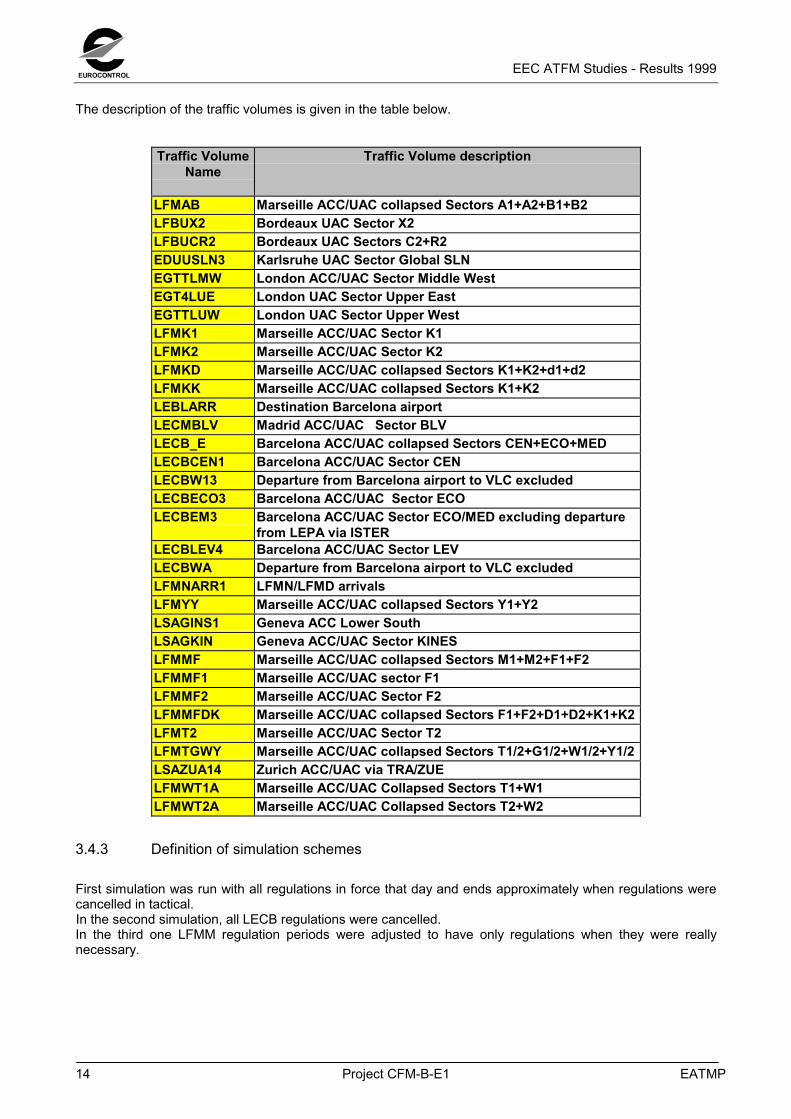
The description of the traffic volumes is given in the table below.
Traffic VolumeName
Traffic Volume description
LFMAB Marseille ACC/UAC collapsed Sectors A1+A2+B1+B2LFBUX2 Bordeaux UAC Sector X2LFBUCR2 Bordeaux UAC Sectors C2+R2EDUUSLN3 Karlsruhe UAC Sector Global SLNEGTTLMW London ACC/UAC Sector Middle WestEGT4LUE London UAC Sector Upper EastEGTTLUW London UAC Sector Upper WestLFMK1 Marseille ACC/UAC Sector K1LFMK2 Marseille ACC/UAC Sector K2LFMKD Marseille ACC/UAC collapsed Sectors K1+K2+d1+d2LFMKK Marseille ACC/UAC collapsed Sectors K1+K2LEBLARR Destination Barcelona airportLECMBLV Madrid ACC/UAC Sector BLVLECB_E Barcelona ACC/UAC collapsed Sectors CEN+ECO+MEDLECBCEN1 Barcelona ACC/UAC Sector CENLECBW13 Departure from Barcelona airport to VLC excludedLECBECO3 Barcelona ACC/UAC Sector ECOLECBEM3 Barcelona ACC/UAC Sector ECO/MED excluding departure
from LEPA via ISTERLECBLEV4 Barcelona ACC/UAC Sector LEVLECBWA Departure from Barcelona airport to VLC excludedLFMNARR1 LFMN/LFMD arrivalsLFMYY Marseille ACC/UAC collapsed Sectors Y1+Y2LSAGINS1 Geneva ACC Lower SouthLSAGKIN Geneva ACC/UAC Sector KINESLFMMF Marseille ACC/UAC collapsed Sectors M1+M2+F1+F2LFMMF1 Marseille ACC/UAC sector F1LFMMF2 Marseille ACC/UAC Sector F2LFMMFDK Marseille ACC/UAC collapsed Sectors F1+F2+D1+D2+K1+K2LFMT2 Marseille ACC/UAC Sector T2LFMTGWY Marseille ACC/UAC collapsed Sectors T1/2+G1/2+W1/2+Y1/2LSAZUA14 Zurich ACC/UAC via TRA/ZUELFMWT1A Marseille ACC/UAC Collapsed Sectors T1+W1LFMWT2A Marseille ACC/UAC Collapsed Sectors T2+W2
3.4.3 Definition of simulation schemes
First simulation was run with all regulations in force that day and ends approximately when regulations werecancelled in tactical.In the second simulation, all LECB regulations were cancelled.In the third one LFMM regulation periods were adjusted to have only regulations when they were reallynecessary.
EEC ATFM Studies - Results 1999
EATMP Project CFM-B-E1 15
EUROCONTROL
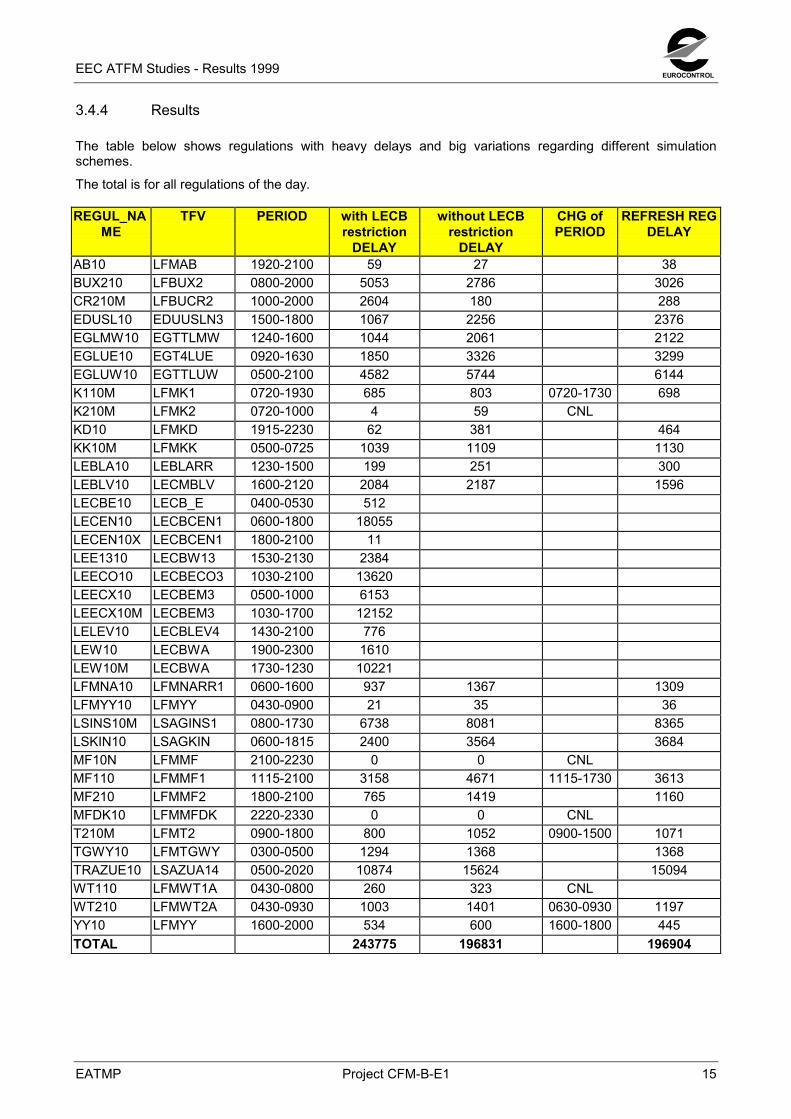
3.4.4 Results
The table below shows regulations with heavy delays and big variations regarding different simulationschemes.
The total is for all regulations of the day.
REGUL_NAME
TFV PERIOD with LECBrestriction
DELAY
without LECBrestriction
DELAY
CHG ofPERIOD
REFRESH REGDELAY
AB10 LFMAB 1920-2100 59 27 38BUX210 LFBUX2 0800-2000 5053 2786 3026CR210M LFBUCR2 1000-2000 2604 180 288EDUSL10 EDUUSLN3 1500-1800 1067 2256 2376EGLMW10 EGTTLMW 1240-1600 1044 2061 2122EGLUE10 EGT4LUE 0920-1630 1850 3326 3299EGLUW10 EGTTLUW 0500-2100 4582 5744 6144K110M LFMK1 0720-1930 685 803 0720-1730 698K210M LFMK2 0720-1000 4 59 CNLKD10 LFMKD 1915-2230 62 381 464KK10M LFMKK 0500-0725 1039 1109 1130LEBLA10 LEBLARR 1230-1500 199 251 300LEBLV10 LECMBLV 1600-2120 2084 2187 1596LECBE10 LECB_E 0400-0530 512LECEN10 LECBCEN1 0600-1800 18055LECEN10X LECBCEN1 1800-2100 11LEE1310 LECBW13 1530-2130 2384LEECO10 LECBECO3 1030-2100 13620LEECX10 LECBEM3 0500-1000 6153LEECX10M LECBEM3 1030-1700 12152LELEV10 LECBLEV4 1430-2100 776LEW10 LECBWA 1900-2300 1610LEW10M LECBWA 1730-1230 10221LFMNA10 LFMNARR1 0600-1600 937 1367 1309LFMYY10 LFMYY 0430-0900 21 35 36LSINS10M LSAGINS1 0800-1730 6738 8081 8365LSKIN10 LSAGKIN 0600-1815 2400 3564 3684MF10N LFMMF 2100-2230 0 0 CNLMF110 LFMMF1 1115-2100 3158 4671 1115-1730 3613MF210 LFMMF2 1800-2100 765 1419 1160MFDK10 LFMMFDK 2220-2330 0 0 CNLT210M LFMT2 0900-1800 800 1052 0900-1500 1071TGWY10 LFMTGWY 0300-0500 1294 1368 1368TRAZUE10 LSAZUA14 0500-2020 10874 15624 15094WT110 LFMWT1A 0430-0800 260 323 CNLWT210 LFMWT2A 0430-0930 1003 1401 0630-0930 1197YY10 LFMYY 1600-2000 534 600 1600-1800 445TOTAL 243775 196831 196904
EEC ATFM Studies - Results 1999
16 Project CFM-B-E1 EATMP
EUROCONTROL
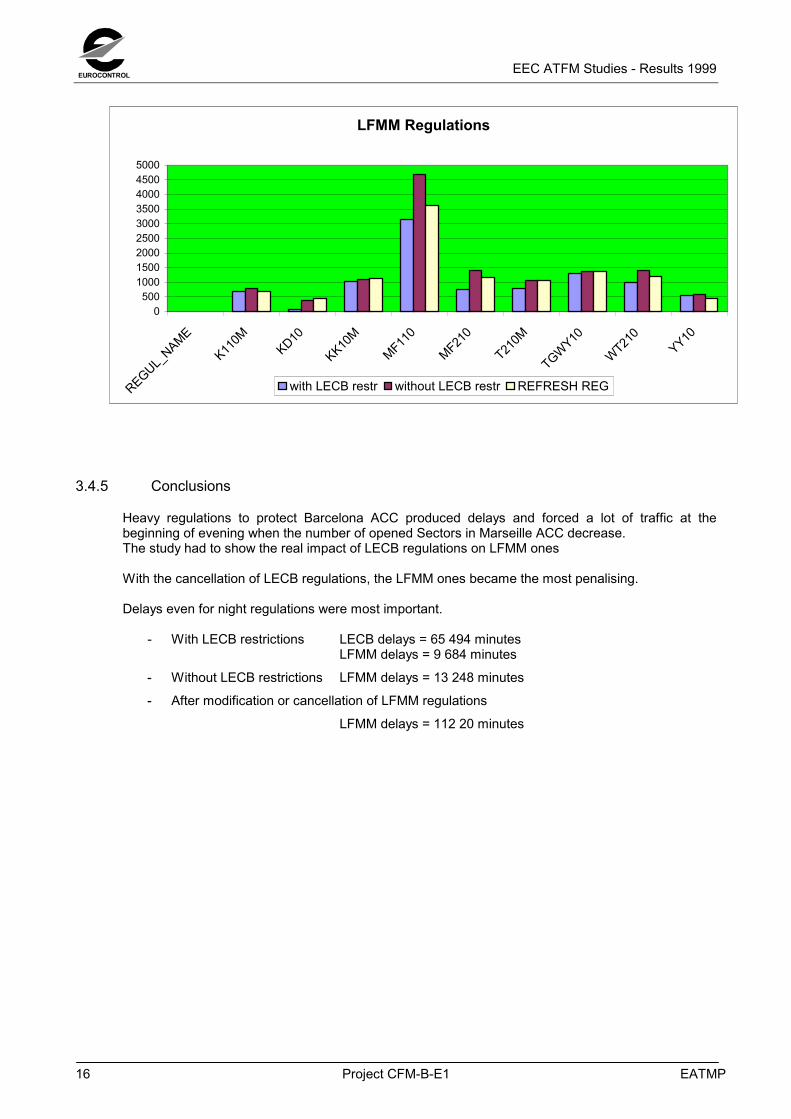
LFMM Regulations
0500
100015002000250030003500400045005000
REGUL_NAME
K110M
KD10
KK10M
MF110
MF210
T210M
TGWY10
WT210
YY10
with LECB restr without LECB restr REFRESH REG
3.4.5 Conclusions
Heavy regulations to protect Barcelona ACC produced delays and forced a lot of traffic at thebeginning of evening when the number of opened Sectors in Marseille ACC decrease.The study had to show the real impact of LECB regulations on LFMM ones
With the cancellation of LECB regulations, the LFMM ones became the most penalising.
Delays even for night regulations were most important.
- With LECB restrictions LECB delays = 65 494 minutesLFMM delays = 9 684 minutes
- Without LECB restrictions LFMM delays = 13 248 minutes
- After modification or cancellation of LFMM regulations
LFMM delays = 112 20 minutes
EEC ATFM Studies - Results 1999
EATMP Project CFM-B-E1 17
EUROCONTROL
3.5 Zurich regulations ( November 1999)
3.5.1 General purpose of the study.
Regulations for lower sectors in Zurich ACC (LSAZ AC) used traffic volumes which exclude some flows (i.e.domestic flights or flights of city pairs LSGG-LSZH).
So a certain number of flights were not regulated and there was no equity in term of delays between all flightsentering the Zurich lower airspace.
3.5.2 Study Objectives
The objective of this study was to measure the benefit of the use of global traffic volumes in terms of load anddelays.
3.5.3 Selected Study Approach
5 simulations were run with TACOT and compared with the reference which was the result of regulations inforce during the day of reference.
3.5.4 Data Requirements and simulation schemes
Data of Friday 3rd of September 1999 has been used . This day was a very busy one with a demand of27871 flights and 241 regulations.
3 new traffic volumes were created to implement new regulations
-LSAZESL instead of LSAZESL2-LSAZWSL instead of LSAZWSL3-LSAZNSL instead of LSAZNSL1
Using global traffic volumes it can be noted that, for the full day
- 63 flights are excluded in ESL sector-114 flights are excluded in NSL sector-171 flights are excluded in WSL sector
5 runs were made with global traffic volumes, with different periods, rates and/or window width.
3.5.5 Results
All results are on the tables below
� In run 1 : global traffic volumes were used, changing rates and adjusting periods regarding thedemand, and with a window width of 10 minutes.The simulation gave a decrease of delays in ESL and NSL but an increase in WSL
� In run 2 : periods of regulations were the same as in the reference and rates as in run1 - thesimulation gave less delays in ESL, approximately the same delays as in NSL and an increaseof delays in WSL during the morning period.
� In run 3 : with the same periods of regulations as in the reference rates were increased for NSLand WSL, the window width was still at 10 minutes and the simulation gave less delays in ESLand NSL and the same delays as in the reference in WSL.
EEC ATFM Studies - Results 1999
18 Project CFM-B-E1 EATMP
EUROCONTROL
� In run 4 :with the same periods and rates as in run3 but the window width was set at 4 minutesthe situation was better for NSL but worst for WSL (morning period) and no real change for ESL.
� In run 5 :rates were increased for NSL and WSL regulations and the simulation gave lowerdelays in NSL and globally equals in the others Loads.
On the reference ,the maximum number of flights in 1 hour is :-for ESL =46-for NSL =44-for WSL =47
In all runs theses numbers were exceeded-for ESL =45-for NSL =41-for WSL =45
3.5.6 Conclusions
It can be said that, using global traffic volumes for implementation of regulations in lower sectors of ZurichACC, does not create overloads and gives less delays with a better equity between all flights.The run 5 would be the best solution to be checked in real time ,giving less average delays as well as lessmaximum delays with acceptable loads for the 3 sectors.
EEC ATFM Studies - Results 1999
EATMP Project CFM-B-E1 19
EUROCONTROL
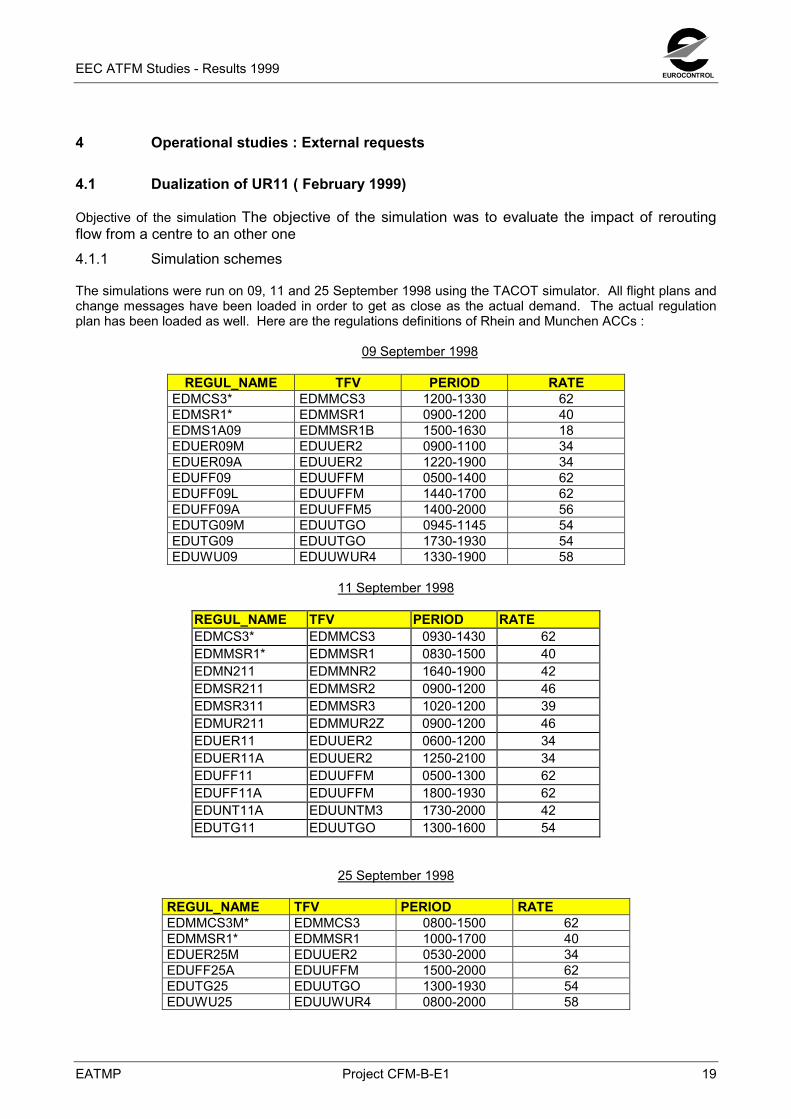
4 Operational studies : External requests
4.1 Dualization of UR11 ( February 1999)
Objective of the simulation The objective of the simulation was to evaluate the impact of reroutingflow from a centre to an other one4.1.1 Simulation schemes
The simulations were run on 09, 11 and 25 September 1998 using the TACOT simulator. All flight plans andchange messages have been loaded in order to get as close as the actual demand. The actual regulationplan has been loaded as well. Here are the regulations definitions of Rhein and Munchen ACCs :
09 September 1998
REGUL_NAME TFV PERIOD RATEEDMCS3* EDMMCS3 1200-1330 62EDMSR1* EDMMSR1 0900-1200 40EDMS1A09 EDMMSR1B 1500-1630 18EDUER09M EDUUER2 0900-1100 34EDUER09A EDUUER2 1220-1900 34EDUFF09 EDUUFFM 0500-1400 62EDUFF09L EDUUFFM 1440-1700 62EDUFF09A EDUUFFM5 1400-2000 56EDUTG09M EDUUTGO 0945-1145 54EDUTG09 EDUUTGO 1730-1930 54EDUWU09 EDUUWUR4 1330-1900 58
11 September 1998
REGUL_NAME TFV PERIOD RATEEDMCS3* EDMMCS3 0930-1430 62EDMMSR1* EDMMSR1 0830-1500 40EDMN211 EDMMNR2 1640-1900 42EDMSR211 EDMMSR2 0900-1200 46EDMSR311 EDMMSR3 1020-1200 39EDMUR211 EDMMUR2Z 0900-1200 46EDUER11 EDUUER2 0600-1200 34EDUER11A EDUUER2 1250-2100 34EDUFF11 EDUUFFM 0500-1300 62EDUFF11A EDUUFFM 1800-1930 62EDUNT11A EDUUNTM3 1730-2000 42EDUTG11 EDUUTGO 1300-1600 54
25 September 1998
REGUL_NAME TFV PERIOD RATEEDMMCS3M* EDMMCS3 0800-1500 62EDMMSR1* EDMMSR1 1000-1700 40EDUER25M EDUUER2 0530-2000 34EDUFF25A EDUUFFM 1500-2000 62EDUTG25 EDUUTGO 1300-1930 54EDUWU25 EDUUWUR4 0800-2000 58
EEC ATFM Studies - Results 1999
20 Project CFM-B-E1 EATMP
EUROCONTROL
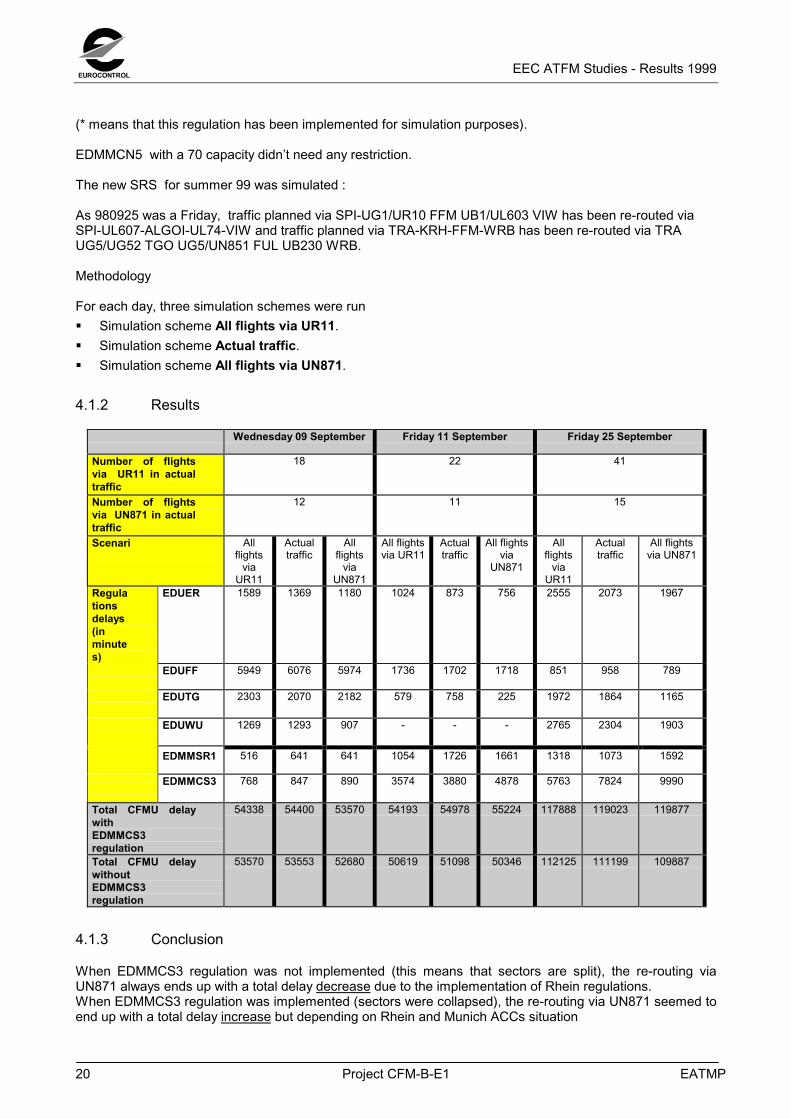
(* means that this regulation has been implemented for simulation purposes).
EDMMCN5 with a 70 capacity didn’t need any restriction.
The new SRS for summer 99 was simulated :
As 980925 was a Friday, traffic planned via SPI-UG1/UR10 FFM UB1/UL603 VIW has been re-routed viaSPI-UL607-ALGOI-UL74-VIW and traffic planned via TRA-KRH-FFM-WRB has been re-routed via TRAUG5/UG52 TGO UG5/UN851 FUL UB230 WRB.
Methodology
For each day, three simulation schemes were run� Simulation scheme All flights via UR11.� Simulation scheme Actual traffic.� Simulation scheme All flights via UN871.
4.1.2 Results
Wednesday 09 September Friday 11 September Friday 25 September
Number of flightsvia UR11 in actualtraffic
18 22 41
Number of flightsvia UN871 in actualtraffic
12 11 15
Scenari Allflights
viaUR11
Actualtraffic
Allflights
viaUN871
All flightsvia UR11
Actualtraffic
All flightsvia
UN871
Allflights
viaUR11
Actualtraffic
All flightsvia UN871
Regulationsdelays(inminutes)
EDUER 1589 1369 1180 1024 873 756 2555 2073 1967
EDUFF 5949 6076 5974 1736 1702 1718 851 958 789
EDUTG 2303 2070 2182 579 758 225 1972 1864 1165
EDUWU 1269 1293 907 - - - 2765 2304 1903
EDMMSR1 516 641 641 1054 1726 1661 1318 1073 1592
EDMMCS3 768 847 890 3574 3880 4878 5763 7824 9990
Total CFMU delaywithEDMMCS3regulation
54338 54400 53570 54193 54978 55224 117888 119023 119877
Total CFMU delaywithoutEDMMCS3regulation
53570 53553 52680 50619 51098 50346 112125 111199 109887
4.1.3 Conclusion
When EDMMCS3 regulation was not implemented (this means that sectors are split), the re-routing viaUN871 always ends up with a total delay decrease due to the implementation of Rhein regulations.When EDMMCS3 regulation was implemented (sectors were collapsed), the re-routing via UN871 seemed toend up with a total delay increase but depending on Rhein and Munich ACCs situation
EEC ATFM Studies - Results 1999
EATMP Project CFM-B-E1 21
EUROCONTROL
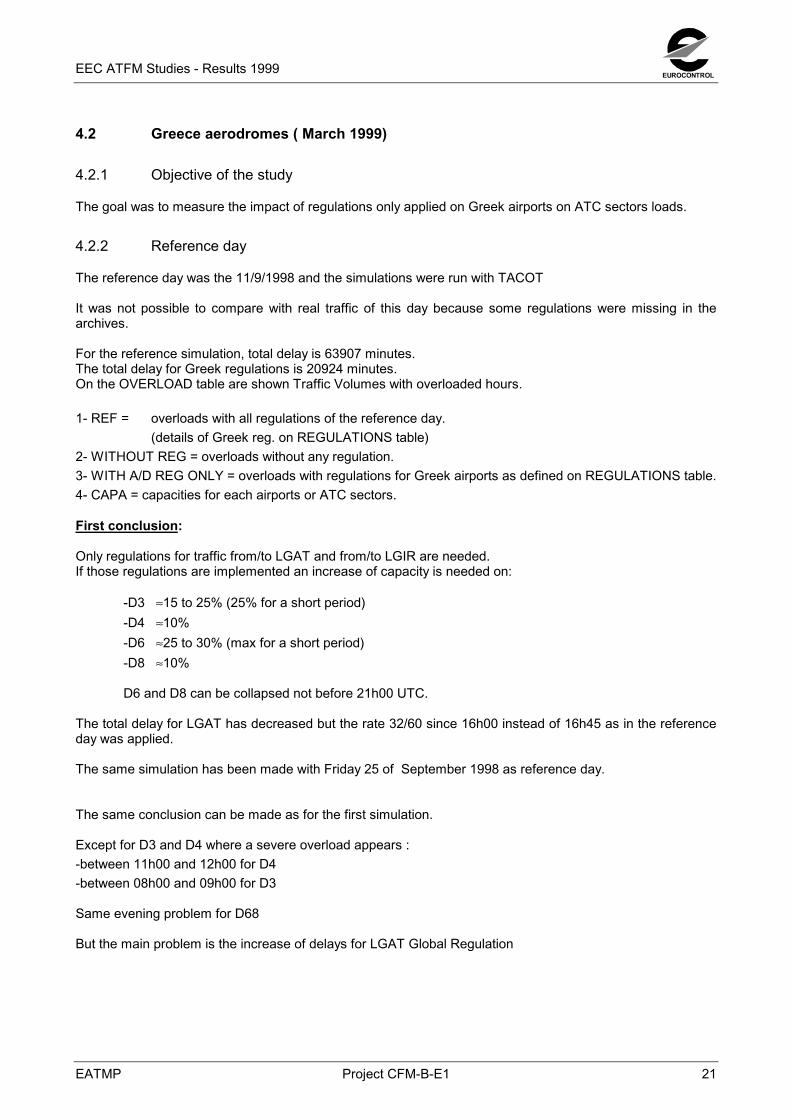
4.2 Greece aerodromes ( March 1999)
4.2.1 Objective of the study
The goal was to measure the impact of regulations only applied on Greek airports on ATC sectors loads.
4.2.2 Reference day
The reference day was the 11/9/1998 and the simulations were run with TACOT
It was not possible to compare with real traffic of this day because some regulations were missing in thearchives.
For the reference simulation, total delay is 63907 minutes.The total delay for Greek regulations is 20924 minutes.On the OVERLOAD table are shown Traffic Volumes with overloaded hours.
1- REF = overloads with all regulations of the reference day.(details of Greek reg. on REGULATIONS table)
2- WITHOUT REG = overloads without any regulation.3- WITH A/D REG ONLY = overloads with regulations for Greek airports as defined on REGULATIONS table.4- CAPA = capacities for each airports or ATC sectors.
First conclusion:
Only regulations for traffic from/to LGAT and from/to LGIR are needed.If those regulations are implemented an increase of capacity is needed on:
-D3 ≈15 to 25% (25% for a short period)-D4 ≈10%-D6 ≈25 to 30% (max for a short period)-D8 ≈10%
D6 and D8 can be collapsed not before 21h00 UTC.
The total delay for LGAT has decreased but the rate 32/60 since 16h00 instead of 16h45 as in the referenceday was applied.
The same simulation has been made with Friday 25 of September 1998 as reference day.
The same conclusion can be made as for the first simulation.
Except for D3 and D4 where a severe overload appears :-between 11h00 and 12h00 for D4-between 08h00 and 09h00 for D3
Same evening problem for D68
But the main problem is the increase of delays for LGAT Global Regulation
EEC ATFM Studies - Results 1999
22 Project CFM-B-E1 EATMP
EUROCONTROL
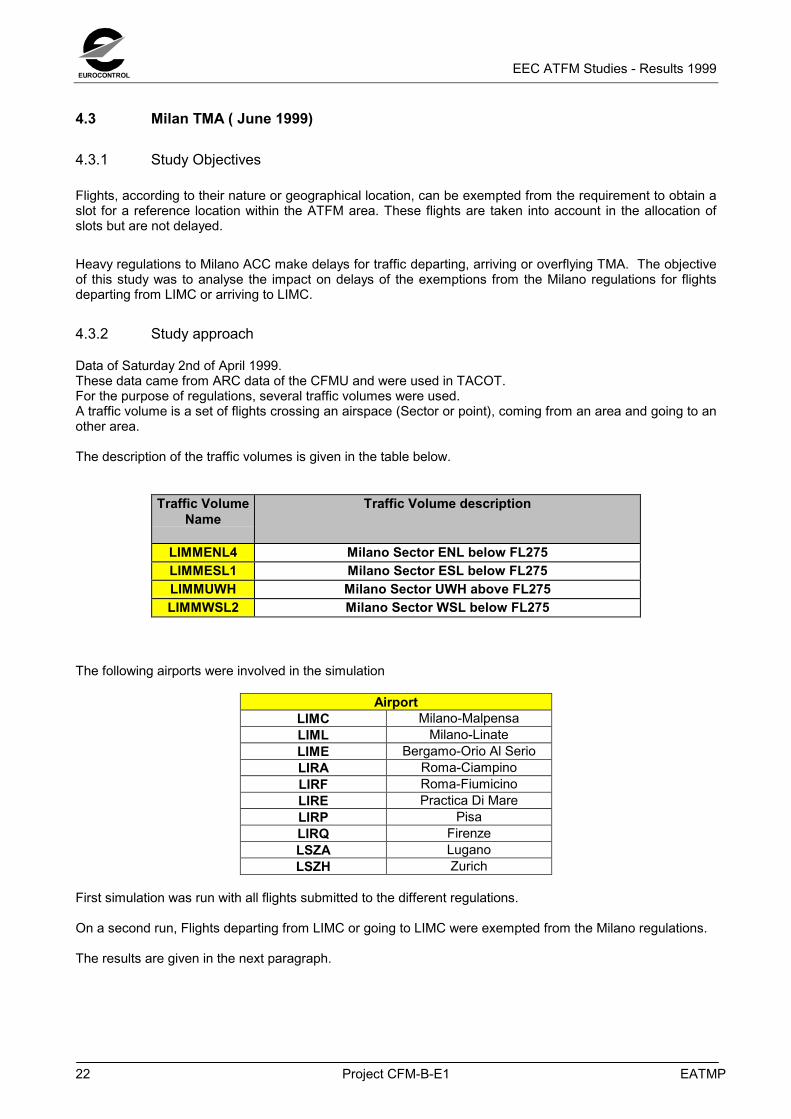
4.3 Milan TMA ( June 1999)
4.3.1 Study Objectives
Flights, according to their nature or geographical location, can be exempted from the requirement to obtain aslot for a reference location within the ATFM area. These flights are taken into account in the allocation ofslots but are not delayed.
Heavy regulations to Milano ACC make delays for traffic departing, arriving or overflying TMA. The objectiveof this study was to analyse the impact on delays of the exemptions from the Milano regulations for flightsdeparting from LIMC or arriving to LIMC.
4.3.2 Study approach
Data of Saturday 2nd of April 1999.These data came from ARC data of the CFMU and were used in TACOT.For the purpose of regulations, several traffic volumes were used.A traffic volume is a set of flights crossing an airspace (Sector or point), coming from an area and going to another area.
The description of the traffic volumes is given in the table below.
Traffic VolumeName
Traffic Volume description
LIMMENL4 Milano Sector ENL below FL275LIMMESL1 Milano Sector ESL below FL275LIMMUWH Milano Sector UWH above FL275LIMMWSL2 Milano Sector WSL below FL275
The following airports were involved in the simulation
AirportLIMC Milano-MalpensaLIML Milano-LinateLIME Bergamo-Orio Al SerioLIRA Roma-CiampinoLIRF Roma-FiumicinoLIRE Practica Di MareLIRP PisaLIRQ FirenzeLSZA LuganoLSZH Zurich
First simulation was run with all flights submitted to the different regulations.
On a second run, Flights departing from LIMC or going to LIMC were exempted from the Milano regulations.
The results are given in the next paragraph.
EEC ATFM Studies - Results 1999
EATMP Project CFM-B-E1 23
EUROCONTROL
4.3.3 Results
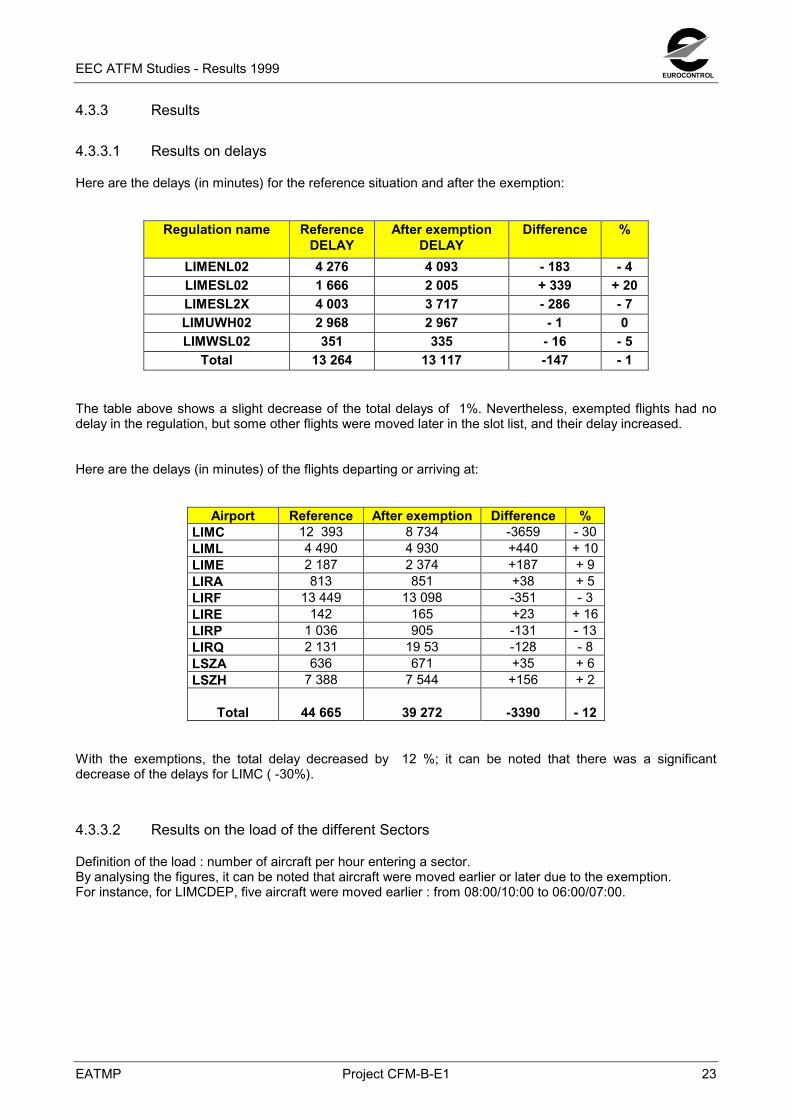
4.3.3.1 Results on delays
Here are the delays (in minutes) for the reference situation and after the exemption:
Regulation name ReferenceDELAY
After exemptionDELAY
Difference %
LIMENL02 4 276 4 093 - 183 - 4LIMESL02 1 666 2 005 + 339 + 20LIMESL2X 4 003 3 717 - 286 - 7LIMUWH02 2 968 2 967 - 1 0LIMWSL02 351 335 - 16 - 5
Total 13 264 13 117 -147 - 1
The table above shows a slight decrease of the total delays of 1%. Nevertheless, exempted flights had nodelay in the regulation, but some other flights were moved later in the slot list, and their delay increased.
Here are the delays (in minutes) of the flights departing or arriving at:
Airport Reference After exemption Difference %LIMC 12 393 8 734 -3659 - 30LIML 4 490 4 930 +440 + 10LIME 2 187 2 374 +187 + 9LIRA 813 851 +38 + 5LIRF 13 449 13 098 -351 - 3LIRE 142 165 +23 + 16LIRP 1 036 905 -131 - 13LIRQ 2 131 19 53 -128 - 8LSZA 636 671 +35 + 6LSZH 7 388 7 544 +156 + 2
Total 44 665 39 272 -3390 - 12
With the exemptions, the total delay decreased by 12 %; it can be noted that there was a significantdecrease of the delays for LIMC ( -30%).
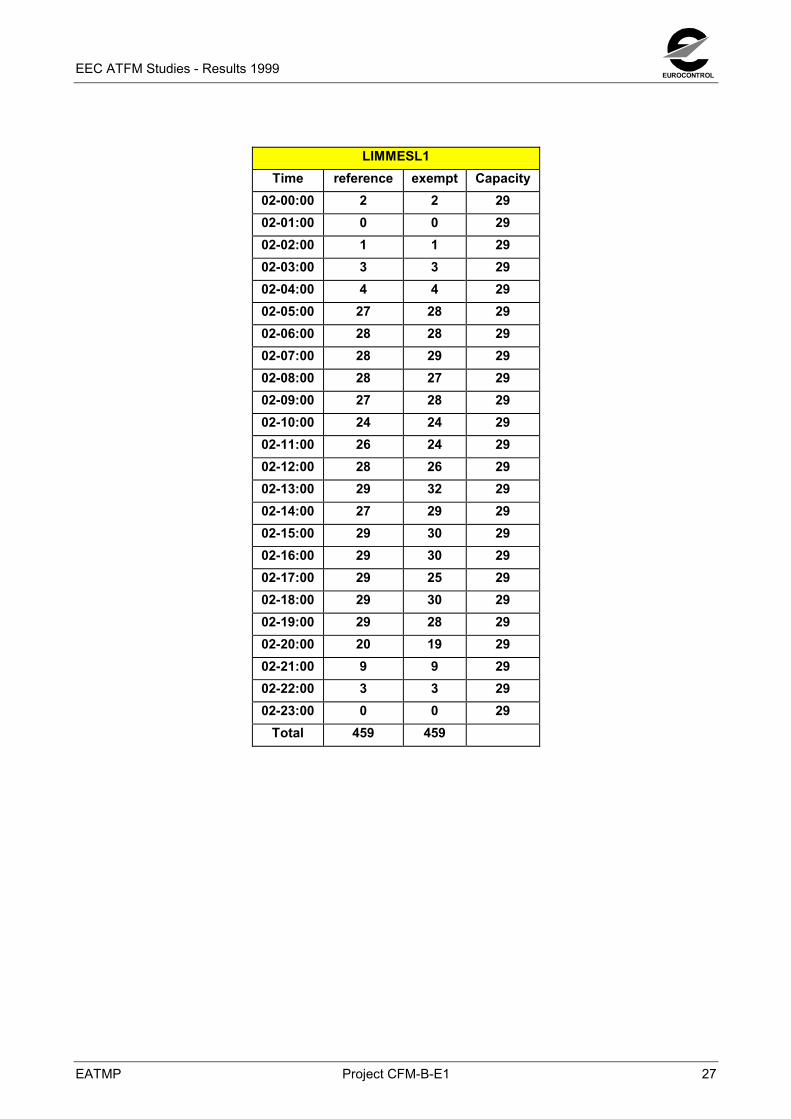
4.3.3.2 Results on the load of the different Sectors
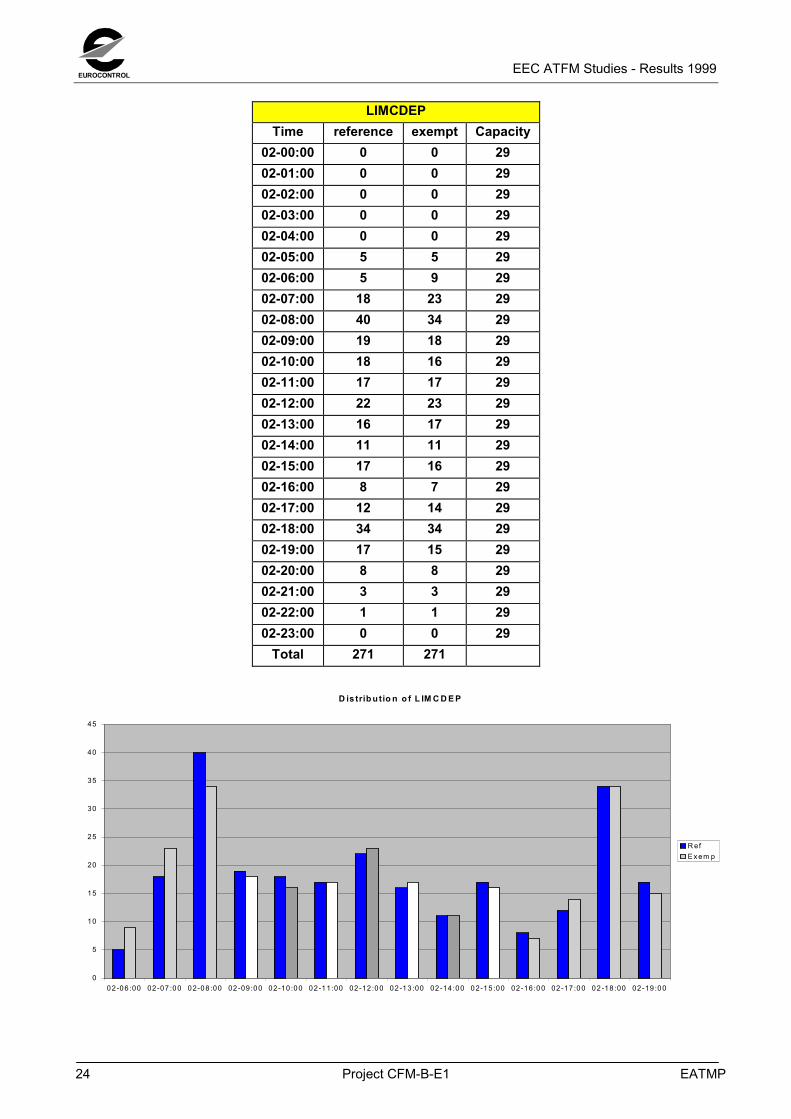
Definition of the load : number of aircraft per hour entering a sector.By analysing the figures, it can be noted that aircraft were moved earlier or later due to the exemption.For instance, for LIMCDEP, five aircraft were moved earlier : from 08:00/10:00 to 06:00/07:00.
EEC ATFM Studies - Results 1999
24 Project CFM-B-E1 EATMP
EUROCONTROL
LIMCDEPTime reference exempt Capacity
02-00:00 0 0 2902-01:00 0 0 2902-02:00 0 0 2902-03:00 0 0 2902-04:00 0 0 2902-05:00 5 5 2902-06:00 5 9 2902-07:00 18 23 2902-08:00 40 34 2902-09:00 19 18 2902-10:00 18 16 2902-11:00 17 17 2902-12:00 22 23 2902-13:00 16 17 2902-14:00 11 11 2902-15:00 17 16 2902-16:00 8 7 2902-17:00 12 14 2902-18:00 34 34 2902-19:00 17 15 2902-20:00 8 8 2902-21:00 3 3 2902-22:00 1 1 2902-23:00 0 0 29
Total 271 271
D is trib u tio n o f L IM C D E P
0
5
10
15
20
25
30
35
40
45
02-06 :00 02 -07 :00 02-08 :00 02 -09 :00 02 -10 :00 02 -11 :00 02 -12 :00 02 -13 :00 02 -14 :00 02-15 :00 02 -16 :00 02 -17 :00 02 -18 :00 02 -19 :00
R efE x em p
EEC ATFM Studies - Results 1999
EATMP Project CFM-B-E1 25
EUROCONTROL
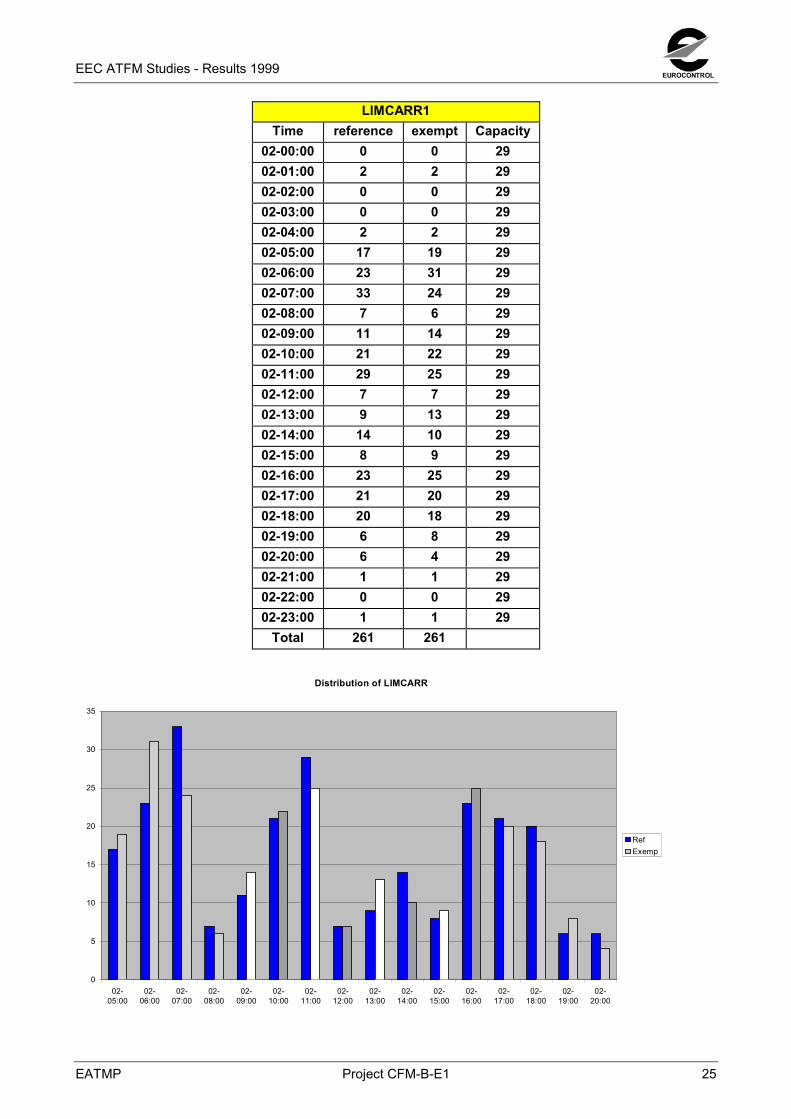
LIMCARR1Time reference exempt Capacity
02-00:00 0 0 2902-01:00 2 2 2902-02:00 0 0 2902-03:00 0 0 2902-04:00 2 2 2902-05:00 17 19 2902-06:00 23 31 2902-07:00 33 24 2902-08:00 7 6 2902-09:00 11 14 2902-10:00 21 22 2902-11:00 29 25 2902-12:00 7 7 2902-13:00 9 13 2902-14:00 14 10 2902-15:00 8 9 2902-16:00 23 25 2902-17:00 21 20 2902-18:00 20 18 2902-19:00 6 8 2902-20:00 6 4 2902-21:00 1 1 2902-22:00 0 0 2902-23:00 1 1 29
Total 261 261
Distribution of LIMCARR
0
5
10
15
20
25
30
35
02-05:00
02-06:00
02-07:00
02-08:00
02-09:00
02-10:00
02-11:00
02-12:00
02-13:00
02-14:00
02-15:00
02-16:00
02-17:00
02-18:00
02-19:00
02-20:00
RefExemp
EEC ATFM Studies - Results 1999
26 Project CFM-B-E1 EATMP
EUROCONTROL
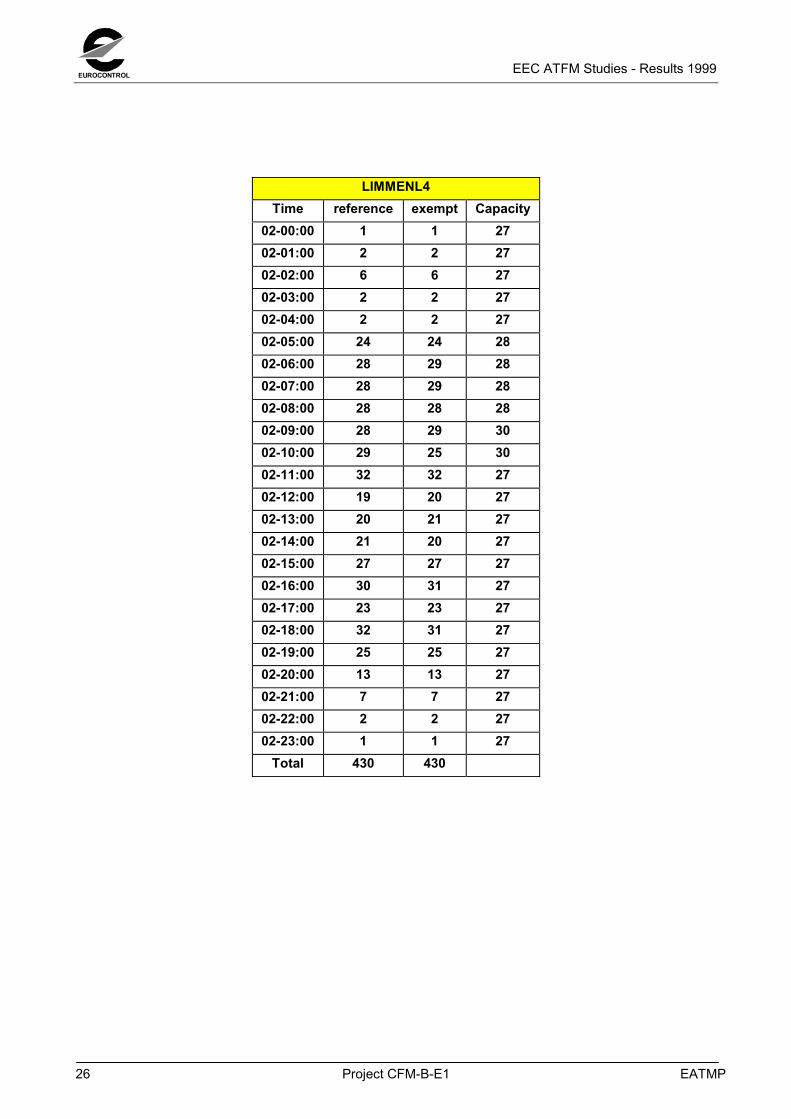
LIMMENL4Time reference exempt Capacity
02-00:00 1 1 2702-01:00 2 2 2702-02:00 6 6 2702-03:00 2 2 2702-04:00 2 2 2702-05:00 24 24 2802-06:00 28 29 2802-07:00 28 29 2802-08:00 28 28 2802-09:00 28 29 3002-10:00 29 25 3002-11:00 32 32 2702-12:00 19 20 2702-13:00 20 21 2702-14:00 21 20 2702-15:00 27 27 2702-16:00 30 31 2702-17:00 23 23 2702-18:00 32 31 2702-19:00 25 25 2702-20:00 13 13 2702-21:00 7 7 2702-22:00 2 2 2702-23:00 1 1 27
Total 430 430
EEC ATFM Studies - Results 1999
EATMP Project CFM-B-E1 27
EUROCONTROL
LIMMESL1Time reference exempt Capacity
02-00:00 2 2 2902-01:00 0 0 2902-02:00 1 1 2902-03:00 3 3 2902-04:00 4 4 2902-05:00 27 28 2902-06:00 28 28 2902-07:00 28 29 2902-08:00 28 27 2902-09:00 27 28 2902-10:00 24 24 2902-11:00 26 24 2902-12:00 28 26 2902-13:00 29 32 2902-14:00 27 29 2902-15:00 29 30 2902-16:00 29 30 2902-17:00 29 25 2902-18:00 29 30 2902-19:00 29 28 2902-20:00 20 19 2902-21:00 9 9 2902-22:00 3 3 2902-23:00 0 0 29
Total 459 459
EEC ATFM Studies - Results 1999
28 Project CFM-B-E1 EATMP
EUROCONTROL
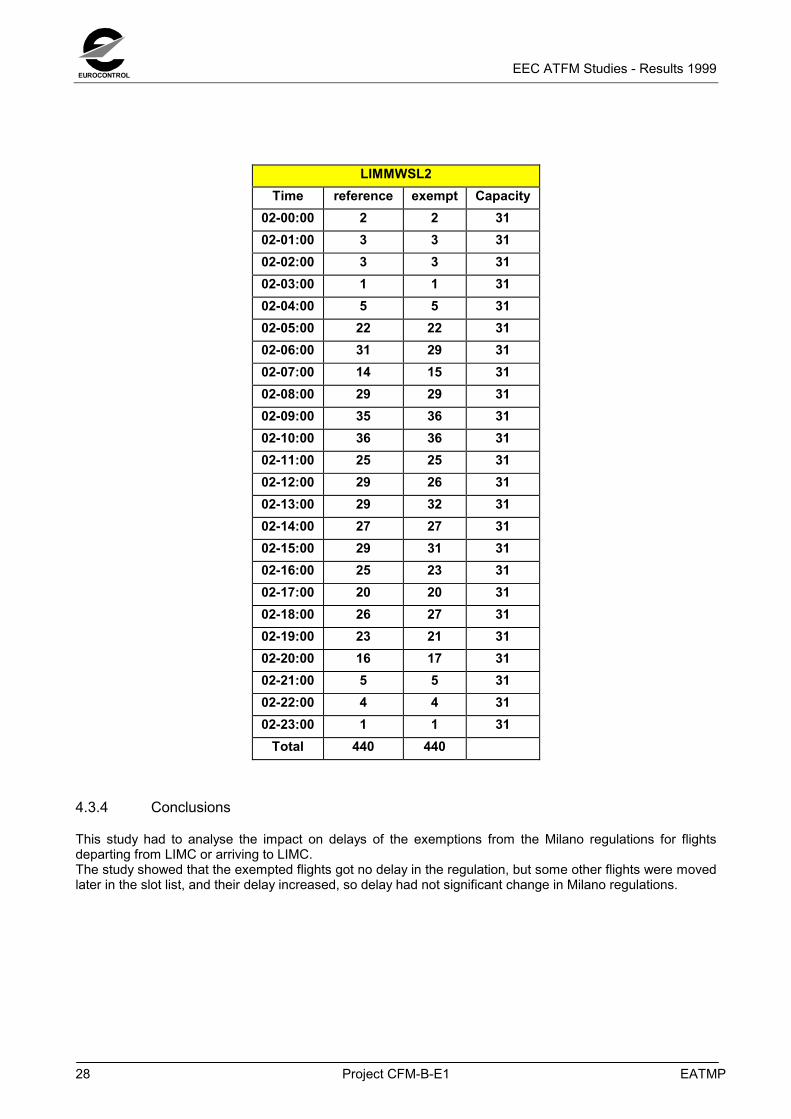
LIMMWSL2Time reference exempt Capacity
02-00:00 2 2 3102-01:00 3 3 3102-02:00 3 3 3102-03:00 1 1 3102-04:00 5 5 3102-05:00 22 22 3102-06:00 31 29 3102-07:00 14 15 3102-08:00 29 29 3102-09:00 35 36 3102-10:00 36 36 3102-11:00 25 25 3102-12:00 29 26 3102-13:00 29 32 3102-14:00 27 27 3102-15:00 29 31 3102-16:00 25 23 3102-17:00 20 20 3102-18:00 26 27 3102-19:00 23 21 3102-20:00 16 17 3102-21:00 5 5 3102-22:00 4 4 3102-23:00 1 1 31
Total 440 440
4.3.4 Conclusions
This study had to analyse the impact on delays of the exemptions from the Milano regulations for flightsdeparting from LIMC or arriving to LIMC.The study showed that the exempted flights got no delay in the regulation, but some other flights were movedlater in the slot list, and their delay increased, so delay had not significant change in Milano regulations.
EEC ATFM Studies - Results 1999
EATMP Project CFM-B-E1 29
EUROCONTROL
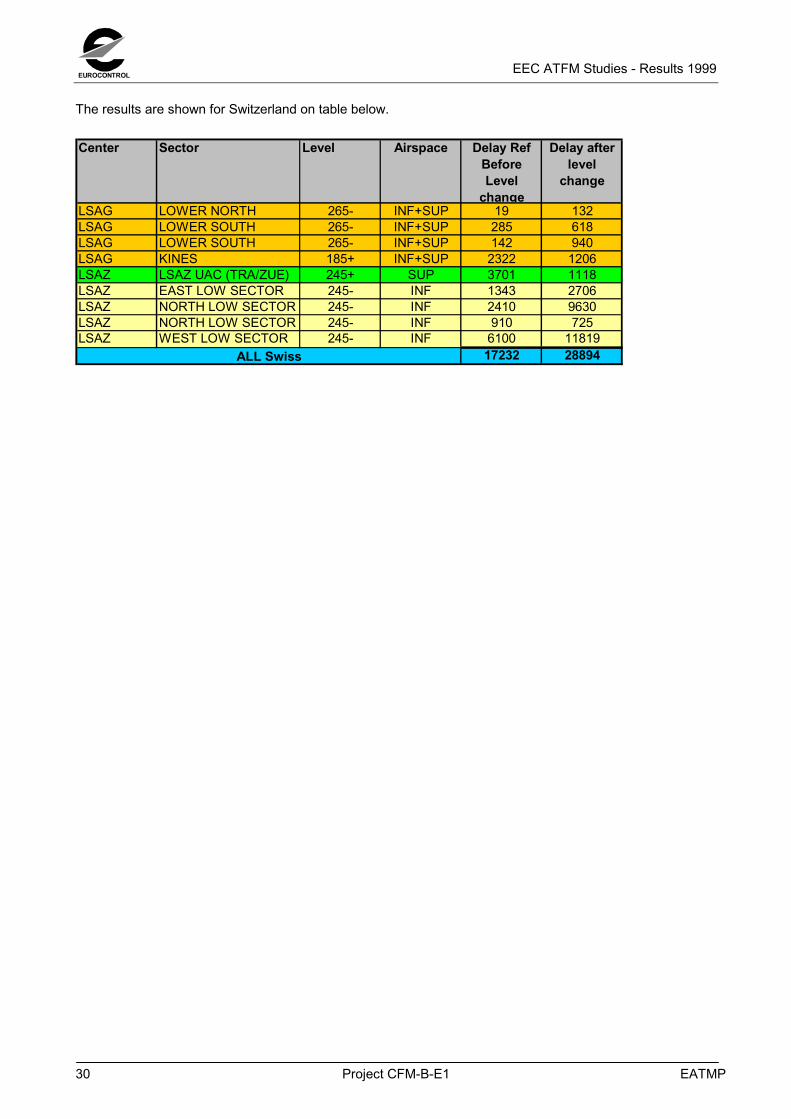
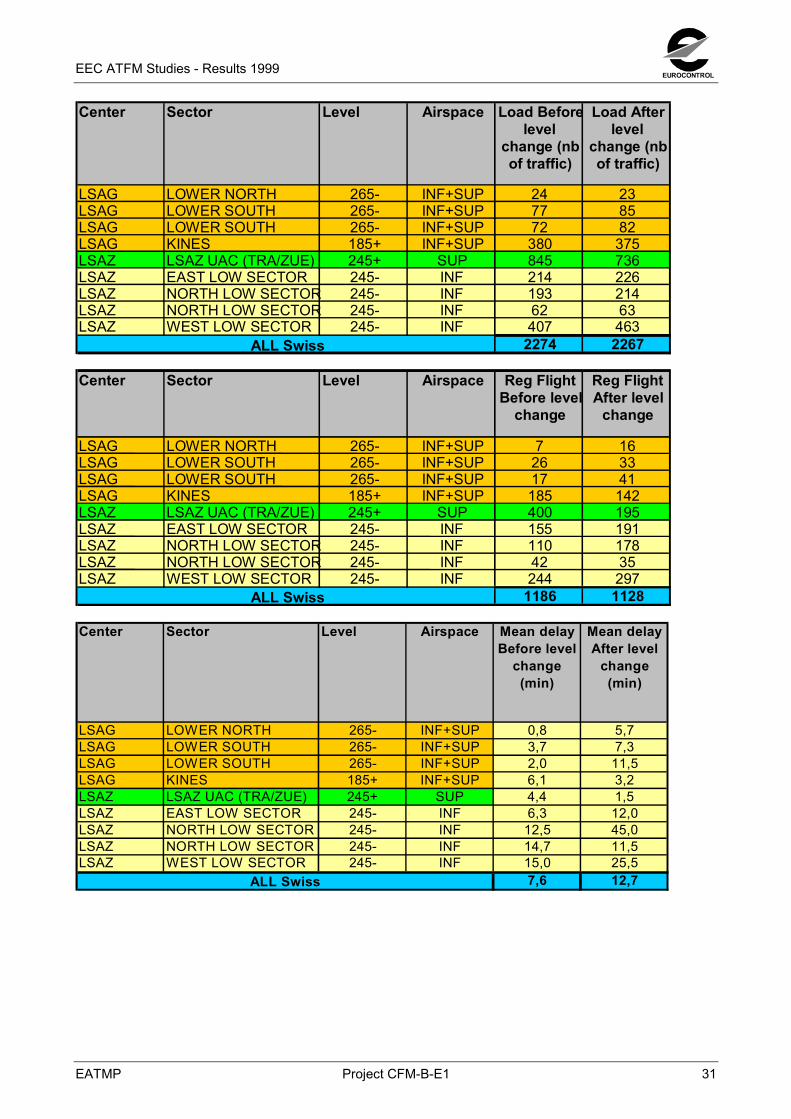
4.4 Implementation of 8.33 kHz Channel Spacing ( September 1999)4.4.1 ObjectivesThe main objective of 8.33 study was to measure the potential delay increase due to the implementation plan ofthe 8.33 kHz Channel Spacing equipment over seven countries :
- France,- Netherlands,- Belgium,- Luxembourg,- Switzerland,- Austria,- Germany.
This study had an other significant aspectsThe change of flight levels for traffic not equipped ; Only 8.33 kHz equipped aircraft were allowed to enter theairspace for which the carriage and operation of 8.33 kHz channel spacing capable radio equipment wasdeclared mandatory., so flights not equipped with 8.33 instrumentation had to fly below flight level 245 overthe 8.33 zone.
4.4.2 Study Approach
The measure of the delay and the load into specific sectors: A reference simulation was completed with theTACOT tool to know the load and delay before the flight level change.
All the results were produced according to this reference.
To measure the load, all the modified flight plans were injected in the tool.
To measure the delay change, a new regulation plan according to the load, to the true regulation scheme,and to the opening scheme of the day, was implemented.
4.4.3 Data and Tools
For the purpose of the study, the following data were used to simulate the reference days in ATFM studies:
- Flight plan,- Regulations data,- Environment data (points, airports, sector definitions).
These data were used with three tools:
- TACOT for ATFM results as close as possible as operational TACT system,- AMOC for rapid simulations,- COSAAC for pre-tactical study.- Change the flight level for the point over the 8.33 zone,- Write the correct flight plans for any simulation tool.
EEC ATFM Studies - Results 1999
30 Project CFM-B-E1 EATMP
EUROCONTROL
The results are shown for Switzerland on table below.
Center Sector Level Airspace Delay Ref Before Level
change
Delay after level
change
LSAG LOWER NORTH 265- INF+SUP 19 132LSAG LOWER SOUTH 265- INF+SUP 285 618LSAG LOWER SOUTH 265- INF+SUP 142 940LSAG KINES 185+ INF+SUP 2322 1206LSAZ LSAZ UAC (TRA/ZUE) 245+ SUP 3701 1118LSAZ EAST LOW SECTOR 245- INF 1343 2706LSAZ NORTH LOW SECTOR 245- INF 2410 9630LSAZ NORTH LOW SECTOR 245- INF 910 725LSAZ WEST LOW SECTOR 245- INF 6100 11819
17232 28894ALL Swiss
EEC ATFM Studies - Results 1999
EATMP Project CFM-B-E1 31
EUROCONTROL
Center Sector Level Airspace Load Beforelevel
change (nbof traffic)
Load Afterlevel
change (nbof traffic)
LSAG LOWER NORTH 265- INF+SUP 24 23LSAG LOWER SOUTH 265- INF+SUP 77 85LSAG LOWER SOUTH 265- INF+SUP 72 82LSAG KINES 185+ INF+SUP 380 375LSAZ LSAZ UAC (TRA/ZUE) 245+ SUP 845 736LSAZ EAST LOW SECTOR 245- INF 214 226LSAZ NORTH LOW SECTOR 245- INF 193 214LSAZ NORTH LOW SECTOR 245- INF 62 63LSAZ WEST LOW SECTOR 245- INF 407 463
2274 2267
Center Sector Level Airspace Reg FlightBefore level
change
Reg FlightAfter level
change
LSAG LOWER NORTH 265- INF+SUP 7 16LSAG LOWER SOUTH 265- INF+SUP 26 33LSAG LOWER SOUTH 265- INF+SUP 17 41LSAG KINES 185+ INF+SUP 185 142LSAZ LSAZ UAC (TRA/ZUE) 245+ SUP 400 195LSAZ EAST LOW SECTOR 245- INF 155 191LSAZ NORTH LOW SECTOR 245- INF 110 178LSAZ NORTH LOW SECTOR 245- INF 42 35LSAZ WEST LOW SECTOR 245- INF 244 297
1186 1128
ALL Swiss
ALL Swiss
Center Sector Level Airspace Mean delay Before level
change (min)
Mean delay After level
change (min)
LSAG LOWER NORTH 265- INF+SUP 0,8 5,7LSAG LOWER SOUTH 265- INF+SUP 3,7 7,3LSAG LOWER SOUTH 265- INF+SUP 2,0 11,5LSAG KINES 185+ INF+SUP 6,1 3,2LSAZ LSAZ UAC (TRA/ZUE) 245+ SUP 4,4 1,5LSAZ EAST LOW SECTOR 245- INF 6,3 12,0LSAZ NORTH LOW SECTOR 245- INF 12,5 45,0LSAZ NORTH LOW SECTOR 245- INF 14,7 11,5LSAZ WEST LOW SECTOR 245- INF 15,0 25,5
7,6 12,7ALL Swiss
EEC ATFM Studies - Results 1999
32 Project CFM-B-E1 EATMP
EUROCONTROL
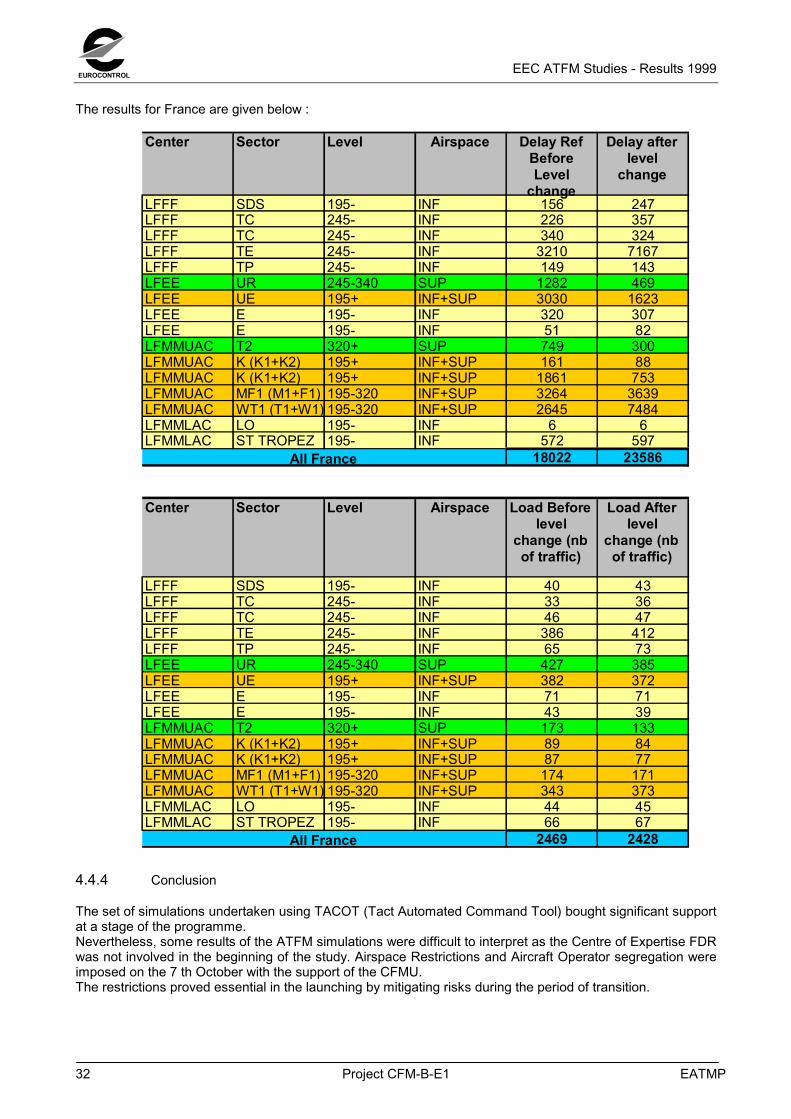
The results for France are given below :
Center Sector Level Airspace Delay RefBeforeLevel
change
Delay afterlevel
change
LFFF SDS 195- INF 156 247LFFF TC 245- INF 226 357LFFF TC 245- INF 340 324LFFF TE 245- INF 3210 7167LFFF TP 245- INF 149 143LFEE UR 245-340 SUP 1282 469LFEE UE 195+ INF+SUP 3030 1623LFEE E 195- INF 320 307LFEE E 195- INF 51 82LFMMUAC T2 320+ SUP 749 300LFMMUAC K (K1+K2) 195+ INF+SUP 161 88LFMMUAC K (K1+K2) 195+ INF+SUP 1861 753LFMMUAC MF1 (M1+F1) 195-320 INF+SUP 3264 3639LFMMUAC WT1 (T1+W1) 195-320 INF+SUP 2645 7484LFMMLAC LO 195- INF 6 6LFMMLAC ST TROPEZ 195- INF 572 597
18022 23586
Center Sector Level Airspace Load Beforelevel
change (nbof traffic)
Load Afterlevel
change (nbof traffic)
LFFF SDS 195- INF 40 43LFFF TC 245- INF 33 36LFFF TC 245- INF 46 47LFFF TE 245- INF 386 412LFFF TP 245- INF 65 73LFEE UR 245-340 SUP 427 385LFEE UE 195+ INF+SUP 382 372LFEE E 195- INF 71 71LFEE E 195- INF 43 39LFMMUAC T2 320+ SUP 173 133LFMMUAC K (K1+K2) 195+ INF+SUP 89 84LFMMUAC K (K1+K2) 195+ INF+SUP 87 77LFMMUAC MF1 (M1+F1) 195-320 INF+SUP 174 171LFMMUAC WT1 (T1+W1) 195-320 INF+SUP 343 373LFMMLAC LO 195- INF 44 45LFMMLAC ST TROPEZ 195- INF 66 67
2469 2428All France
All France
4.4.4 Conclusion
The set of simulations undertaken using TACOT (Tact Automated Command Tool) bought significant supportat a stage of the programme.Nevertheless, some results of the ATFM simulations were difficult to interpret as the Centre of Expertise FDRwas not involved in the beginning of the study. Airspace Restrictions and Aircraft Operator segregation wereimposed on the 7 th October with the support of the CFMU.The restrictions proved essential in the launching by mitigating risks during the period of transition.
EEC ATFM Studies - Results 1999
EATMP Project CFM-B-E1 33
EUROCONTROL
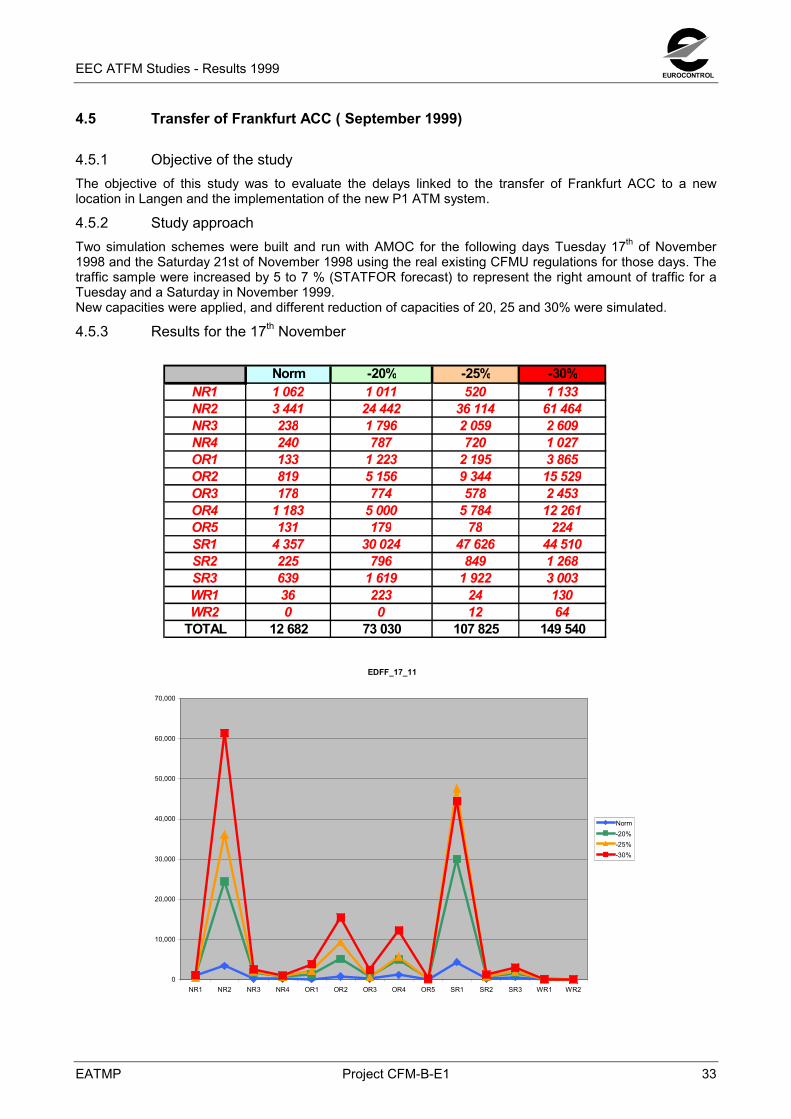
4.5 Transfer of Frankfurt ACC ( September 1999)
4.5.1 Objective of the studyThe objective of this study was to evaluate the delays linked to the transfer of Frankfurt ACC to a newlocation in Langen and the implementation of the new P1 ATM system.
4.5.2 Study approachTwo simulation schemes were built and run with AMOC for the following days Tuesday 17th of November1998 and the Saturday 21st of November 1998 using the real existing CFMU regulations for those days. Thetraffic sample were increased by 5 to 7 % (STATFOR forecast) to represent the right amount of traffic for aTuesday and a Saturday in November 1999.New capacities were applied, and different reduction of capacities of 20, 25 and 30% were simulated.
4.5.3 Results for the 17th November
Norm -20% -25% -30%NR1 1 062 1 011 520 1 133NR2 3 441 24 442 36 114 61 464NR3 238 1 796 2 059 2 609NR4 240 787 720 1 027OR1 133 1 223 2 195 3 865OR2 819 5 156 9 344 15 529OR3 178 774 578 2 453OR4 1 183 5 000 5 784 12 261OR5 131 179 78 224SR1 4 357 30 024 47 626 44 510SR2 225 796 849 1 268SR3 639 1 619 1 922 3 003WR1 36 223 24 130WR2 0 0 12 64
TOTAL 12 682 73 030 107 825 149 540
EDFF_17_11
0
10,000
20,000
30,000
40,000
50,000
60,000
70,000
NR1 NR2 NR3 NR4 OR1 OR2 OR3 OR4 OR5 SR1 SR2 SR3 WR1 WR2
Norm-20%-25%-30%
EEC ATFM Studies - Results 1999
34 Project CFM-B-E1 EATMP
EUROCONTROL
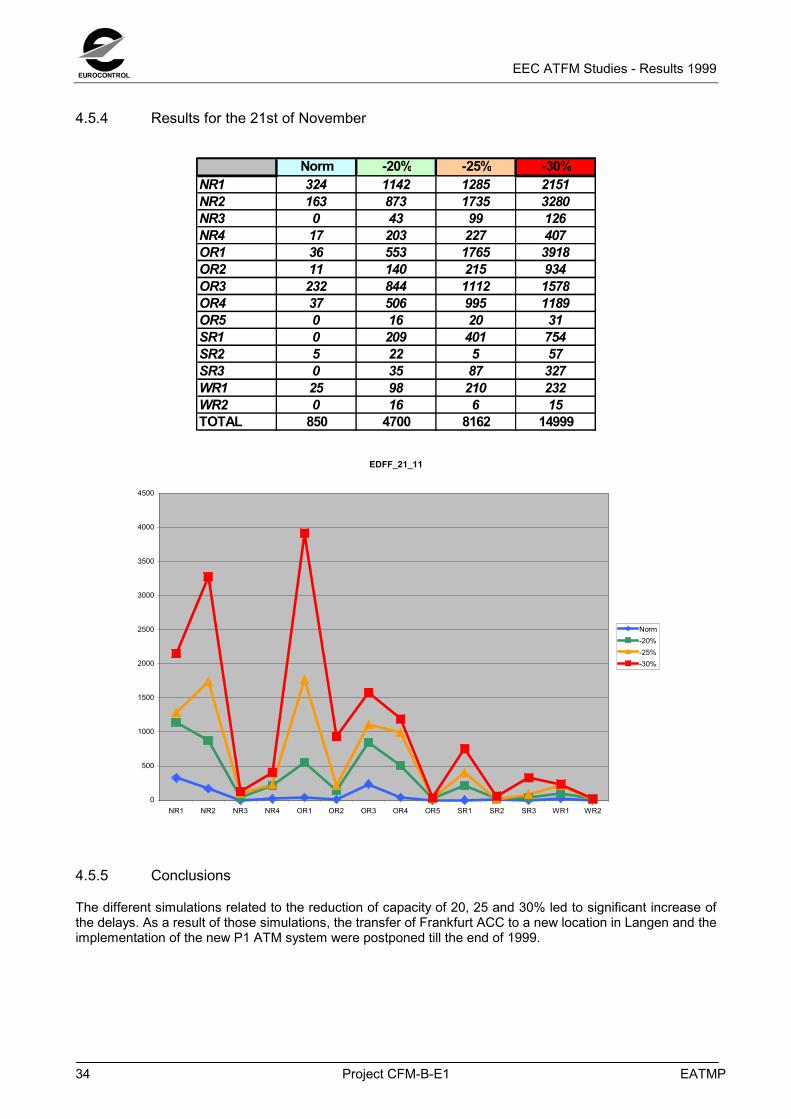
4.5.4 Results for the 21st of November
Norm -20% -25% -30%NR1 324 1142 1285 2151NR2 163 873 1735 3280NR3 0 43 99 126NR4 17 203 227 407OR1 36 553 1765 3918OR2 11 140 215 934OR3 232 844 1112 1578OR4 37 506 995 1189OR5 0 16 20 31SR1 0 209 401 754SR2 5 22 5 57SR3 0 35 87 327WR1 25 98 210 232WR2 0 16 6 15TOTAL 850 4700 8162 14999
EDFF_21_11
0
500
1000
1500
2000
2500
3000
3500
4000
4500
NR1 NR2 NR3 NR4 OR1 OR2 OR3 OR4 OR5 SR1 SR2 SR3 WR1 WR2
Norm-20%-25%-30%
4.5.5 Conclusions
The different simulations related to the reduction of capacity of 20, 25 and 30% led to significant increase ofthe delays. As a result of those simulations, the transfer of Frankfurt ACC to a new location in Langen and theimplementation of the new P1 ATM system were postponed till the end of 1999.

EEC ATFM Studies - Results 1999
EATMP Project CFM-B-E1 35
EUROCONTROL
4.6 Datalink 2000+ ( September 1999)
The LINK2000+simulation showed controller workload reductions of respectively:
• for 50% datalink equipage - 16% workload reduction• for 75% datalink equipage - 22% workload reduction• for 100% datalink equipage - 28% workload reduction
It can be safely assumed (according to the CAPAN) that this led to sector capacity increases of respectively:
• for 50% datalink equipage – 8% capacity increase• for 75% datalink equipage - 11% capacity increase• for 100% datalink equipage - 14% capacity increase
These results were used for the ATFM simulations made with COSAAC
For such a study, a reference simulation was done first with the standard capacities, and then with thedifferent capacity increases: +8%, +11% and +14%.The reference day was the 16/04/1999 with 25319 flights. The regulation scheme was quite the same thanthe one applied on that day by CFMU/CEU.The capacity increase is only applied on the requested geographical zone and only on sectors capacities (nochange for restriction applied on aerodromes).
Here are the global results:
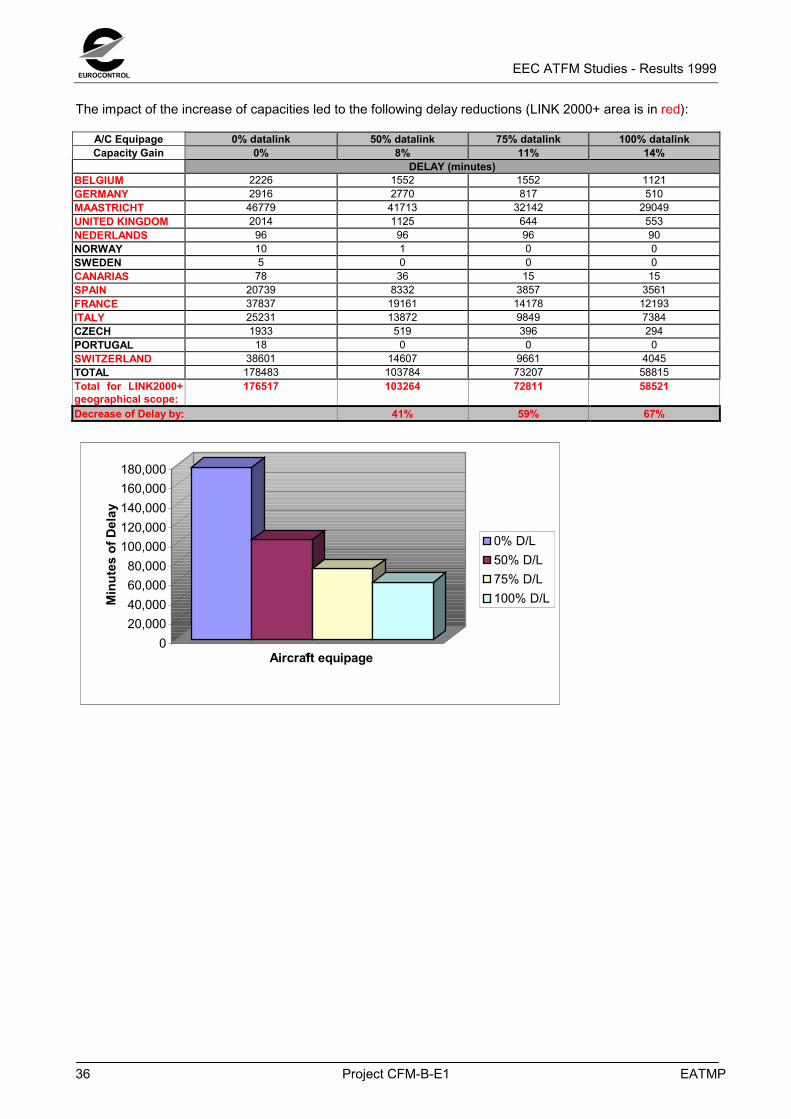
If the capacity increases per 8%, the delay decreases per 45%.If the capacity increases per 11%, the delay decreases per 58%.If the capacity increases per 14%, the delay decreases per 66%.
EEC ATFM Studies - Results 1999
36 Project CFM-B-E1 EATMP
EUROCONTROL
The impact of the increase of capacities led to the following delay reductions (LINK 2000+ area is in red):
A/C Equipage 0% datalink 50% datalink 75% datalink 100% datalinkCapacity Gain 0% 8% 11% 14%
DELAY (minutes)BELGIUM 2226 1552 1552 1121GERMANY 2916 2770 817 510MAASTRICHT 46779 41713 32142 29049UNITED KINGDOM 2014 1125 644 553NEDERLANDS 96 96 96 90NORWAY 10 1 0 0SWEDEN 5 0 0 0CANARIAS 78 36 15 15SPAIN 20739 8332 3857 3561FRANCE 37837 19161 14178 12193ITALY 25231 13872 9849 7384CZECH 1933 519 396 294PORTUGAL 18 0 0 0SWITZERLAND 38601 14607 9661 4045TOTAL 178483 103784 73207 58815Total for LINK2000+geographical scope:
176517 103264 72811 58521
Decrease of Delay by: 41% 59% 67%
020,00040,00060,00080,000
100,000120,000140,000160,000180,000
Min
utes
of D
elay
1 Aircraft equipage
0% D/L50% D/L75% D/L100% D/L
EEC ATFM Studies - Results 1999
EATMP Project CFM-B-E1 37
EUROCONTROL
5 CONCLUSIONS
This note presents the results for the main studies conducted by the Centre of Expertise Flight DataResearch. Nevertheless, others studies were conducted on behalf of the Central Flow Management Unit orexternal clients; the list of the different studies conducted is given below :
• Analyse of delays in 1999 evaluation of capacity• Analyse of the load on sector GA from Brest UAC• Canadian capacity shortfall impact on transatlantic flights• Impact of Airport constraints on departure management• Impact of global Traffic Volume on the Lower sectors of Zurich ACC• Impact of LECB(Barcelona) regulations on LFMM (Marseilles)sectors• Impact of shortfall of capacity for Greek aerodromes• Impact on delays of the implementation of new equipment , 8__33• Microscopic study delay vs. capacity, evaluation of capacity• New opening sectors scheme for Bordeaux ACC/UAC• New regulation scheme on CTL/PON/PTV area• New sectorisation for Barcelona and Marseilles in the framework of CHIEF• re-orientation of traffic from a centre (Karlsruhe) to another one (Munchen)• Shortfall of capacities linked to the implementation of ARNV3• Shortfall of capacity on Traffic Volumes LSAZUA14, WSL and NSL – Zurich• Simulation of exchange of messages when all flights are in RDY status, Studies to assist the ATFM
Working Group• Simulation of increase of capacity for sectors LFEE (Reims), LFEUE and LFEUR• Simulation of re-routing for INS, KINES (Geneva sectors)• Study of the exemption of arrivals/departures to/from LIMC from the Milano regulations• Transfer of Frankfort ACC to Langen• translation of the R/T workload reduction in capacity increase for the Data Link 2000+• Update of the departure rates Contingency plan evaluation• Usability of the routes generated by CARAT Operational Evaluation of the Quality of CARAT
Generated Routes
In 1999, 46 simulations were conducted in regard to the 7 simulations conducted in 1997 or the 17simulations made in 1998; this was due to the availability of the tools, less failures of TACOT for example andthe quality of technical and operational people.
This document described only the main results, more detailed results of the different studies can be asked tothe Head of Flight Data Research or representatives.
EEC ATFM Studies - Results 1999
38 Project CFM-B-E1 EATMP
EUROCONTROL
ACKNOWLEDGEMENTS
The 1999 work programme was done through the improvement of the different tools (TACOT,AMOC, ASCOT, COSAAC), the increase and the quality of technical and operational people.
The Project Team would like to thank the ATFM experts of CFMU for their assistance and co-operation.
The author would also like to thank all the team of Eurocontrol staff, as well the operationalexperts, Roger Guerreau, Elisabeth Gérard, Georges Fortunet and Bernard Kerstenne, as thesoftware experts, Dominique Latge, Jérome Lebreton, Eric Allard and Nicolas Bunoz, NicolasDufour, who worked on the 1999 ATFM studies and simulations.
EEC ATFM Studies - Results 1999
EATMP Project CFM-B-E1 39
EUROCONTROL
6 ABBREVIATIONS
ACC Area Control Centre
AMOC Atfm Modelling Capability
ARC CFMU Archives System
ARN ATS Routes and associated Navigation means
ASCOT Airport Slot Compliance Tool
ATC Air Traffic Control
ATFM Air Traffic Flow Management
ATM Air Traffic Management
CARAT Computer Aided Route Allocation Tool
CASA Computer Assisted Slot Allocation
CEU Central Executive Unit
CFMU Central Flow Management Unit
COHOR Comité des Horaires
COSAAC Common Simulator to Assess ATFM Concepts
ENV CFMU Environment Database
SRS Standard Route Scheme
TACT CFMU TACTical system
TACOT TACT Automated Command Tool
EEC ATFM Studies - Results 1999
40 Project CFM-B-E1 EATMP
EUROCONTROL
7 CONTACTS
Flight Data ResearchEurocontrol Experimental CentreBP15 – 91222 Brétigny sur Orge CEDEX – France
Antoine Vidal +33(0)1 69 88 75 53 [email protected] Guerreau +33(0)1 69 88 74 31 [email protected] Bisiaux +33(0)1 69 88 76 43 [email protected] Kerstenne +33(0)1 69 88 76 53 [email protected]érome Lebreton +33(0)1 69 88 76 04 jé[email protected]édéric Croq +33(0)1 69 88 [email protected] Bunoz +33(0)1 69 88 78 42 [email protected] Dufour +33(0)1 69 88 [email protected]