Embed Size (px)
Citation preview

Essays on the Economics of High School-to-College Transition Programs and Teacher
Effectiveness
Cecilia Speroni
Submitted in partial fulfillment of the
requirements for the degree of Doctor of Philosophy
under the Executive Committee of the Graduate
School of Arts and Sciences
COLUMBIA UNIVERSITY
2011

© 2011
Cecilia Speroni
All rights reserved

ABSTRACT
Essays on the Economics of High School-to-College Transition Programs and Teacher
Effectiveness
Cecilia Speroni
This dissertation is comprised of three essays on the economics of high school-to-
college transition programs and teacher effectiveness. The first essay studies the two largest
credit-based transition programs in the United States: Advanced Placement and Dual En-
rollment. While these programs are distinct, both of them allow students to earn college
credits while in high school. Using student-level statewide data from Florida, I examine the
relative power of these two programs for predicting students’ college access and success.
In the second essay, I gauge the causal effect of one of the programs, Dual Enrollment,
exploiting Florida’s eligibility requirements for participation. I conduct two regression-
discontinuity analyses. The first analysis evaluates the effect of dual enrollment using a
general grade point average requirement for participation in any course. The second anal-
ysis measures the effect of one particular challenging and popular dual enrollment course,
college algebra, using an eligibility criterion that is specific to that course. While the stan-
dard regression-discontinuity methods are appropriate for the first analysis, the participa-
tion criterion for college algebra is used not only for dual enrollment but also for college
students. I therefore propose an extension of standard regression-discontinuity methods to
account for sequential treatments. My third essay, coauthored with Jonah Rockoff, consid-
ers ways in which policymakers can improve teacher accountability systems. Using data
from New York City public schools, we study the relative predictive power of value-added
performance data and subjective evaluations (made by mentors or hiring committees) on
teachers’ future performance as measured by students’ achievement gains.

Contents
Acknowledgement vii
Preface ix
1 Determinants of Students’ Success: The Role of Advanced Placement andDual Enrollment Programs 11.1 Introduction . . . . . . . . . . . . . . . . . . . . . . . . . . . . . . . . . . 1
1.2 Prior Literature . . . . . . . . . . . . . . . . . . . . . . . . . . . . . . . . 5
1.3 Advanced Placement and Dual Enrollment Programs in Florida . . . . . . . 7
1.4 Data . . . . . . . . . . . . . . . . . . . . . . . . . . . . . . . . . . . . . . 11
1.5 Profile of Advanced Placement and Dual Enrollment Students . . . . . . . 12
1.6 Methodological Approach . . . . . . . . . . . . . . . . . . . . . . . . . . 17
1.7 Estimation Results . . . . . . . . . . . . . . . . . . . . . . . . . . . . . . 21
1.7.1 Predictive Effect of Advanced Placement and Dual Enrollment on
College Outcomes . . . . . . . . . . . . . . . . . . . . . . . . . . 21
1.7.2 Effect Heterogeneity . . . . . . . . . . . . . . . . . . . . . . . . . 25
1.8 Conclusion . . . . . . . . . . . . . . . . . . . . . . . . . . . . . . . . . . 30
1.9 Appendix . . . . . . . . . . . . . . . . . . . . . . . . . . . . . . . . . . . 31
2 High School Dual Enrollment Programs: Are We Fast-Tracking Students TooFast? 332.1 Introduction . . . . . . . . . . . . . . . . . . . . . . . . . . . . . . . . . . 33
2.2 Dual Enrollment Program . . . . . . . . . . . . . . . . . . . . . . . . . . 38
2.2.1 Dual Enrollment Conceptual Framework . . . . . . . . . . . . . . 38
i

2.2.2 Florida’s Dual Enrollment Policy . . . . . . . . . . . . . . . . . . 40
2.2.2.1 Dual Enrollment Eligibility and Enrollment Process . . . 41
2.3 Data . . . . . . . . . . . . . . . . . . . . . . . . . . . . . . . . . . . . . . 42
2.4 Econometric Framework: Sequential RD design . . . . . . . . . . . . . . . 48
2.4.1 Intuition Behind the Approach . . . . . . . . . . . . . . . . . . . . 48
2.4.2 Setup . . . . . . . . . . . . . . . . . . . . . . . . . . . . . . . . . 51
2.4.3 Assumptions . . . . . . . . . . . . . . . . . . . . . . . . . . . . . 53
2.4.4 Deriving the Sequential RD Estimand . . . . . . . . . . . . . . . . 54
2.4.5 Policy interpretation of the RD estimand . . . . . . . . . . . . . . . 59
2.4.6 Estimation . . . . . . . . . . . . . . . . . . . . . . . . . . . . . . 60
2.4.6.1 Standard RD estimation . . . . . . . . . . . . . . . . . . 60
2.4.6.2 Sequential RD estimation . . . . . . . . . . . . . . . . . 62
2.4.7 Specific assumptions for the current application . . . . . . . . . . . 64
2.5 Validity of the RD Design . . . . . . . . . . . . . . . . . . . . . . . . . . . 65
2.5.1 Discontinuity: the GPA and CPT Samples . . . . . . . . . . . . . . 65
2.5.1.1 Descriptive Statistics for Selected Samples . . . . . . . . 69
2.5.2 Instrument Validity . . . . . . . . . . . . . . . . . . . . . . . . . . 70
2.5.3 Discontinuity in Other Treatments . . . . . . . . . . . . . . . . . . 76
2.6 Results . . . . . . . . . . . . . . . . . . . . . . . . . . . . . . . . . . . . . 79
2.6.1 Effect of Dual Enrollment on Academic Outcomes . . . . . . . . . 79
2.6.2 The Effect of Dual Enrollment Algebra on Academic Outcomes . . 84
2.7 Robustness . . . . . . . . . . . . . . . . . . . . . . . . . . . . . . . . . . 90
2.7.1 Robustness for GPA Analysis . . . . . . . . . . . . . . . . . . . . 90
2.7.2 Robustness for CPT Analysis . . . . . . . . . . . . . . . . . . . . 92
2.8 Conclusion . . . . . . . . . . . . . . . . . . . . . . . . . . . . . . . . . . 95
2.9 Remarks from Chapter 1 and Chapter 2 and Directions for Future Research 97
2.10 Appendix . . . . . . . . . . . . . . . . . . . . . . . . . . . . . . . . . . . 100
3 Subjective and Objective Evaluations of Teacher Effectiveness: Evidence fromNew York City 1033.1 Introduction . . . . . . . . . . . . . . . . . . . . . . . . . . . . . . . . . . 104
3.2 Prior Literature . . . . . . . . . . . . . . . . . . . . . . . . . . . . . . . . 105
ii

3.3 Data and Descriptive Statistics . . . . . . . . . . . . . . . . . . . . . . . . 107
3.4 Methodology and Regression Estimates . . . . . . . . . . . . . . . . . . . 114
3.4.1 Interaction of Subjective and Objective Evaluations and the Impact
of Evaluator Experience . . . . . . . . . . . . . . . . . . . . . . . 120
3.5 Conclusion . . . . . . . . . . . . . . . . . . . . . . . . . . . . . . . . . . 122
Bibliography 124
iii

List of Tables
1.1 Advanced Placement and Dual Enrollment Program Comparison in Florida 9
1.2 Descriptive Statistics by Student Subgroup . . . . . . . . . . . . . . . . . . 14
1.3 Regression of Students’ Outcomes on Dual Enrollment and Advanced
Placement Participation . . . . . . . . . . . . . . . . . . . . . . . . . . . 23
1.4 Heterogeneity of Dual Enrollment and Advanced Placement Effect by Stu-
dents’ Minority Status . . . . . . . . . . . . . . . . . . . . . . . . . . . . . 27
1.5 Heterogeneity of Dual Enrollment and Advanced Placement Effect by
Quartiles of Students’ Prior Scores . . . . . . . . . . . . . . . . . . . . . . 28
1.6 Participation Rate in AP or DE for High-Ability Students by District . . . . 32
2.1 Descriptive Statistics of Dual Enrollment Participants and Non-participants 47
2.2 Relevant Student Types . . . . . . . . . . . . . . . . . . . . . . . . . . . . 55
2.3 Descriptive Statistics for Dual Enrollment Participants . . . . . . . . . . . 71
2.4 Discontinuity in Baseline Characteristics . . . . . . . . . . . . . . . . . . . 73
2.5 Regression Discontinuity Estimates of the Effect of Dual Enrollment on
Student Outcomes, GPA Sample . . . . . . . . . . . . . . . . . . . . . . . 83
2.6 Assessing the Matching Quality, CPT Sample . . . . . . . . . . . . . . . . 88
2.7 Regression Discontinuity Estimates of the Effect of Dual Enrollment Alge-
bra on Student Outcomes, CPT Sample . . . . . . . . . . . . . . . . . . . 89
2.8 Sensitivity of Dual Enrollment Effect to Sample Selection and Model Spec-
ification . . . . . . . . . . . . . . . . . . . . . . . . . . . . . . . . . . . . 93
2.9 Estimated Discontinuity in Dual Enrollment (any course) in 12th grade by
Community College . . . . . . . . . . . . . . . . . . . . . . . . . . . . . . 101
2.10 Estimated Discontinuity in Dual Enrollment Algebra by Community College102
iv

3.1 Descriptive Statistics by Teacher Program . . . . . . . . . . . . . . . . . . 112
3.2 Descriptive Statistics by Evaluation . . . . . . . . . . . . . . . . . . . . . 113
3.3 Subjective Evaluations and Student Achievement in a Teacher’s First Year . 116
3.4 Subjective and Objective Evaluations and Student Achievement in a
Teacher’s Second Year . . . . . . . . . . . . . . . . . . . . . . . . . . . . 119
3.5 Interactions of Subjective and Objective Evaluations for Mentored Teachers 120
3.6 Predictive Power of Evaluations and Evaluator Experience . . . . . . . . . 121
v

List of Figures
1.1 Statewide Participation in Advanced Courses by 10th grade Score . . . . . 15
1.2 Advanced Placement and Dual Enrollment Participation in Selected Districts 16
1.3 Heterogeneity of the Effect of Advanced Placement and Dual Enrollment
by Students’ Ability . . . . . . . . . . . . . . . . . . . . . . . . . . . . . . 29
2.1 Example . . . . . . . . . . . . . . . . . . . . . . . . . . . . . . . . . . . . 49
2.2 Dual Enrollment Participation (12th grade) . . . . . . . . . . . . . . . . . 68
2.3 Dual Enrollment Algebra Participation . . . . . . . . . . . . . . . . . . . . 69
2.4 Distribution of 11th grade High School GPA . . . . . . . . . . . . . . . . . 74
2.5 Distribution of CPT Math Score . . . . . . . . . . . . . . . . . . . . . . . 75
2.6 Probability of Math College Remediation by CPT Math Score . . . . . . . 78
2.7 Algebra Participation on First Term in College . . . . . . . . . . . . . . . . 79
2.8 Outcomes by 11th grade High School GPA . . . . . . . . . . . . . . . . . 82
2.9 Outcomes by CPT Math Score . . . . . . . . . . . . . . . . . . . . . . . . 87
vi

Acknowledgement
I am deeply thankful to Thomas Bailey, Judith Scott-Clayton, and Jonah Rockoff for their
advice during my graduate studies. Tom provided constant support and encouragement
to pursue my own interests and entrusted me with data and great responsibility. Judy’s
thoughtful comments about my research helped me question the assumptions and the policy
relevance of my inquiries. I am especially thankful to Jonah for his countless hours listening
and discussing my ideas, challenging my thoughts, editing my drafts, and providing advise
and mentorship throughout. Having the opportunity to work with him has been the most
enriching and stimulating experience of my PhD.
I also thank Miguel Urquiola for helpful feedback and for being the chair of my disserta-
tion defense, and Josh Angrist, Bridget Long, Randy Reback, and Melinda Karp for useful
discussions about my dissertation or job market process. Juan Carlos Calcagno’s inside-
out secrets for navigating school’s bureaucracy and making the most out of my years at
Teachers College have been incredibly helpful. I also extend my appreciation to Matt Zei-
denberg for his invaluable work and assistance preparing the Florida data for the analyses,
to Tammy Duncan from the Florida Department of Education for answering all my data
questions, and to all dual enrollment coordinators who shared their knowledge about the
program.
I am grateful to the Association for Institutional Research, the Community College Re-
search Center, the Institute of Education Sciences, Teachers College, and MDRC for their
vii

generosity in providing financial support for my studies. Part of the research in Chapter 2
of this dissertation was conducted at MDRC (New York) and NBER (Cambridge). I thank
both organizations and their staff for their hospitality during my stay.
I am also thankful to my friends, Tania Lugones, Andrea Prado, Maria Jose Prados,
Nanda Abella, and Veronica Tomaselli, who filled my New York City years with great
food, music, theater, arts, and, most importantly, great companionship.
Special thanks go to my family. My mother has always been my inspirational example
of how to balance a professional career and family and how to maintain the highest moral
standards. My father has been an inexhaustible source of hugs, kisses, and self-confidence,
and my brother an ever-present friend and ear.
Above all, I want to thank my husband, Nacho. I would have not pursued a PhD let
alone finish it if it weren’t for his contagious drive and passion for research. He was a
constant academic and emotional support throughout all these years. He challenged myself
to always take the hardest road, to dare be creative and question the standard school of
thought, and to be patient and forgiving when ideas don’t work out. This dissertation
greatly benefited from his incisive comments, clarity of thought, and exacting attention to
details. Last, but not least, he has been my emotional pillar, helping me find confidence at
moments of doubt and providing unflagging support and love. I dedicate this dissertation
to him and our little one: with you life only gets better!
viii

Preface
About one third of high school graduates do not go to college, and a third of those that do are
not academically prepared for college level work (National Center for Education Statistics
2003, 2004). Arguably, one of the most important transformations of high school education
over the last couple of decades is the rapid expansion of Advanced Placement (AP) and
Dual Enrollment (DE) programs. By allowing high school students to take college-level
courses and earn college credits, these programs are widely believed to raise the quality of
secondary education and improve students’ transition from high school to college. Today,
it is estimated that about 67% of all public high schools offer AP and 71% offer DE (Waits
et al. 2005). Yet, despite the growth and popularity of these programs, there is little to no
evidence on how these programs fare in terms of improving college access and success.
The scarcity of research in the area stems from two main difficulties: i) having data that
track students as they transition from high school to college, and ii) having a credible
source of random variation in participation to isolate the programs’ influence on students’
educational outcomes. The first two chapters of the dissertation address these empirical
challenges.
In Chapter 1, I use student-level longitudinal data from the state of Florida that links
high school and postsecondary transcript information for two cohorts of high school stu-
dents. Controlling for schools’ and students’ characteristics (including prior achievement
ix

and schools’ fixed effects), I examine the relative power of AP and DE in predicting stu-
dents’ college access and success. I find that both AP and DE are strongly associated with
positive outcomes, though participation across programs is not an equal predictor of stu-
dents’ success. While DE students are more likely to go to college after high school, AP
students are more likely to first enroll in a four-year institution. Despite this disparity in
initial enrollment, the difference between DE and AP in terms of bachelor’s degree attain-
ment is much smaller and not consistently statistically significant. Notably, the effect of
DE is driven by courses taken at the local community college campus, with no effect for
DE courses taken at the high school. From a policy perspective, these findings have po-
tentially important implications. In light of current concerns about high schools’ ability to
deliver college-level instruction coupled with the lack of a standardized curriculum in DE
courses, the results may call for increased quality control for DE college credits earned at
high school campuses. Taken at face value, these results may also inform policies such as
high schools’ grade point average weighting or college admission rules designed to signal
or screen highly motivated and able students.
Assessing the impact of the programs is difficult because of the well-known problem
of selection bias. The selection problem is two-fold: not only students choose to take col-
lege course while in high school based on their academic ability, motivation, and expected
gains from participation, but districts or colleges are allowed to set their own admission
requirements to ensure the integrity of their academic programs. In Chapter 2, which was
my job market paper, I address the selection problem in DE participation by exploiting a
mandate in Florida that requires high school students to have a minimum academic stand-
ing in order to participate. I conduct two regression-discontinuity (RD) analyses using data
from a subset of Florida’s districts. The first analysis evaluates the effect of DE using
grade point average as the eligibility criterion. The second analysis evaluates the effect of
x

a particularly challenging and popular DE course, college algebra, using an eligibility cri-
terion that is specific to that course. While the standard regression-discontinuity methods
are appropriate for the first analysis, the participation criterion for college algebra is used
not only for DE but also for college students. Therefore, I extend regression-discontinuity
methods to account for sequential treatments. The “Sequential-RD” proposed provides a
framework that could potentially be applied to other empirical applications where the el-
igibility criterion is used for more than one treatment that occur with a temporal lag but
individuals only take one of the treatments. A special feature of the framework is that the
Standard-RD is as special case of the more general Sequential-RD when there is no second
treatment. I find no evidence that simply taking a DE course improved outcomes among
students whose high school GPA placed them at the margin of participation eligibility for
DE. However, for students on the margin of participation eligibility for college algebra, I
found that taking such a challenging DE course had large and significant positive effects
on college enrollment and graduation rates. Taken together, these findings suggest that
DE programs have the potential to improve college access and success but that the quality,
subject area, or difficulty of the DE experience might be important considerations when
assessing the value of DE programs as a policy intervention.
Chapter 3, coauthored with Jonah Rockoff, shifts the focus from schools’ instructional
programs to individual teacher accountability.1 A substantial body of evidence documents
that teachers do matter for student achievement and that, aside from experience, the qualifi-
cations used to pay and certify teachers have little predictive power in identifying effective
teachers. In the current era of increased accountability, improving teacher evaluation sys-
tems is warranted. We examine whether subjective evaluations can predict teacher’s ability
to raise students’ scores and, importantly, whether they add valuable information not cap-
tured by teacher’s previous value-added or objective measures of performance. We use1A shorter version of this essay was published in the American Economic Review, Papers and Proceedings, May 2010,
100:261-266 and a slightly revised version is forthcoming in Labour Economics.
xi

New York City’s (NYC) administrative panel data of public students (grades 3 to 8) and
two sources of teachers’ subjective evaluations: the Teaching Fellows program and the
NYC mentoring program. We find that teachers who receive better subjective evaluations
of teaching ability prior to hire or in their first year of teaching produce greater gains in
achievement, on average, with their future students. The predictive power of subjective
evaluation is comparable with and complementary to objective measures of teacher effec-
tiveness, providing support for a hybrid teacher evaluation system that incorporates mul-
tiple measures of teacher performance. However, we also find that subjective evaluations
are not always comparable across individuals responsible for making the evaluations. This
highlights the importance of training raters on the implementation of the rating standards.
Despite current budgetary deficits, education remains a priority in the federal policy
agenda. President Obama’s plan of becoming the world’s leading nation with the high-
est proportion of college graduate by 2020 can only begin to be conceivable with radical
steps in the alignment of the high school and college education as well as in the recruit-
ing, rewarding, and retaining of effective teachers. The essays in this dissertation hope to
contribute to the national debate on education reform by providing empirical evidence on
potentially promising strategies designed to ensure that students are ready for college and
classrooms get filled with a better-qualified teaching force.
xii

Chapter 1
Determinants of Students’ Success: TheRole of Advanced Placement and DualEnrollment Programs
[Advanced Placement is] the best for kids. ... How long are you going to wait to do theright thing? I can’t wait. Every time we have another graduating class, and we haven’tgiven them the courses they need to be prepared for [college], we haven’t done what weneeded to do. ... This isn’t a guinea pig deal. ... This is a way to really open up thepathways for all students to be successful.
- Florida’s Hillsborough superintendent, MaryEllen Elia, after signing a 3.6-million-a-year 3-year partnership with the College Board (The EXCELerator program) to expandAdvanced Placement (Matus 2009).
1.1 Introduction
Advanced Placement (AP) and Dual Enrollment (DE) are two programs that allow high
school students to take college-level courses and earn college credits. The recent growth of
these programs has been unprecedented. While there are no national data on the number
of students taking AP courses, the number of AP exam-takers increased from 537,428 in
1995 to over 1.3 million in 2005 (College Board 2008). Over the same period, part-time
1

CHAPTER 1. ADVANCED PLACEMENT AND DUAL ENROLLMENT 2
enrollment under the age of 18 at public 2-year colleges presumably mostly comprised
of DE students more than doubled, while high school enrollment growth was only about
19 percent (National Center for Education Statistics [NCES] 1998, 2006, 2008). Today,
it is estimated that about 67 percent of all public high schools offer AP and 71 percent
offer DE (Waits et al. 2005). Yet, despite the fact that AP and DE are the two largest
acceleration programs in the nation, there is little evidence on how the programs fare in
terms of increasing college access and success.
AP programs differ from DE programs in a number of ways. An important distinction
concerns the curriculum they employ. DE students take a course with an actual college
syllabus and receive college credit when they pass it. AP courses are taught using a stan-
dardized curriculum intended to be college level and students can receive college credit
only by taking an optional exam. While AP and DE programs can be regarded as close
substitutes, there is disagreement over whether they provide equivalent college preparatory
experiences. Proponents of AP programs argue that AP is more beneficial to students than
DE because it provides smaller class sizes than college courses, more class hours, continual
monitoring of progress, and a standardized curriculum that serves as a benchmark for the
quality of the course. Conversely, proponents of DE argue that DE courses are real college
courses (rather than college-level courses) and therefore may better prepare students for
college by exposing them to a more authentic college experience. Based on these different
perceptions, and given the lack of empirical evidence directly comparing both programs,
educators and policymakers often have strong feelings about which program “is the best for
kids” or the “right thing to do”, as illustrated by the quotes above. Thus, it is not uncommon
for state or local policies to treat these programs differently. Notably, many districts and
universities assign more weight to AP than DE courses when calculating students’ GPA to
determine high school class ranks or college admissions and course placements.

CHAPTER 1. ADVANCED PLACEMENT AND DUAL ENROLLMENT 3
While both programs were initially limited to academically advanced students, they are
increasingly serving a wider student population, including middle- and even low-achieving
students. Several states now subsidize AP exam fees for low-income students or have
AP-incentive programs specifically targeted to schools predominantly serving minorities
or low-income students. In addition, private-led initiatives, such as the Bill and Melinda
Gates Foundation’s Early College Initiative, are increasingly funding DE programs in high-
poverty areas. Despite concerted efforts to increase participation among traditionally un-
derrepresented students, the distributional consequences of participation remain largely un-
explored.
This paper investigates the extent to which participation in AP and DE programs is
associated with students’ likelihood of enrolling in college, first enrolling in a four-year
college, and obtaining a bachelor’ degree. In addition, it assesses whether the relative
predictive power of these programs depends on students’ minority status and academic
ability. In order to compare the programs fairly, I focus on DE academic (not vocational)
course participation, which counts toward college degree requirements, and on AP course
participation (not AP exam taking) since not all AP students take the AP exams.
The main challenge to isolate the effect of the programs is that it is likely that AP and
DE students are highly motivated and, therefore, would have better outcomes than non-
AP/DE students in the absence of participation. In addition, students often choose which
of these two programs to take and schools may have different eligibility criteria for en-
rollment in each program. I address these selection problems in two ways. First, I use
a detailed administrative dataset to control for a large set of individual background char-
acteristics—inlcuding pre-participation standardized scores in reading and math, and for
schools’ fixed effects. Second, I exploit differences in the regional supply of DE and AP
programs to assess the sensitivity of the results to situations where students are faced with

CHAPTER 1. ADVANCED PLACEMENT AND DUAL ENROLLMENT 4
contraint choices: a) schools where no AP is offered, and b) AP- and DE-dominant dis-
tricts where there is empirical evidence that one program is strictly preferred. While these
approaches cannot fully circumvent the selection problem, taken together they provide a
careful attempt to understand how AP and DE relate to students’ college outcomes.
Using data from two cohorts of all public high school students in Florida, I find that
both AP and DE course-taking bear a significant relationship with students’ likelihood of
college enrollment after high school, enrollment in four-year institutions, and attainment
of a bachelor’s degree. However, participation across programs is not an equal predictor of
students’ success. While DE students enroll in college at a higher rate than observationally
similar AP students, they enroll in four-year institutions at a lower rate. Having DE credits
is associated with a 12 and 7 percentage point increase in the rate of college enrollment and
of four-year college enrollment, respectively, relative to having no DE/AP credits. This
compares with a 6 and 18 percentage point increase in these same rates associated with
having AP credits. Importantly, this large difference in students’ initial enrollment in four-
year colleges does not translate into bachelor’s degree attainment, where the AP advantage
over DE is at most 4 percentage points and not consistently statistically significant. For all
outcomes, students who combine both DE and AP courses fare better than those who only
participate in one programs, suggesting important complementarities between the them.
Notably, the effect of DE only comes from courses taken at the local community college
campus, with no effect for DE courses taken at the high school.
The DE-AP college enrollment gap, while negligible for students with very low ability,
is fairly constant for students along most of the ability distribution. Instead, the relative
advantage of AP students in four-year enrollment is increasing on students’ ability, with
high-ability students with AP credits getting an extra edge in college admissions relative to
those with DE credits. Last, I find no evidence that the predictive power of the programs

CHAPTER 1. ADVANCED PLACEMENT AND DUAL ENROLLMENT 5
differs for minorities and non-minorities in terms of college enrollment or degree attain-
ment. However, AP non-minority students are more likely to enroll in four-year colleges
than their AP minority counterparts.
The paper is organized as follows. I first provide a brief summary of the prior literature
and describe the AP and DE programs in Florida. In Section 4 and 5, I present the data and
portrait AP and DE participants. In Section 6 and 7, I explain the methodological approach
and present the results. I conclude the paper in Section 8.
1.2 Prior Literature
A substantial body of the AP literature focuses on students who take and/or pass an AP
exam and not on students who take an AP course. This focus provides a limited view
of the impact of AP since a large fraction of AP course-takers do not take AP examina-
tions (Commission on the Future of the Advanced Placement program 2001). A few recent
studies have contributed to our understanding of the effect of simply taking an AP course,
controlling for a wide range of students’ characteristics and/or other rigorous high school
curriculum (Geiser and Santelices 2004; Dougherty et al. 2005; Klopfenstein and Thomas
2006). This non-experimental evidence suggests that both taking AP courses and passing
AP exams are associated with college success, though when carefully controlling for stu-
dents’ preparation, the effects of just passing an AP course tend to be small in magnitude,
often insignificant or limited to selected AP subject areas.
Jackson (2009, 2010) provides the only quasi-experimental evidence on the causal im-
pact of AP. Using a difference-in-difference estimation strategy, the author exploits Texas’
variation in the timing of schools’ implementation of AP cash incentives that reward stu-
dents and teachers for good performance on AP exams. Despite the fact that AP incentives
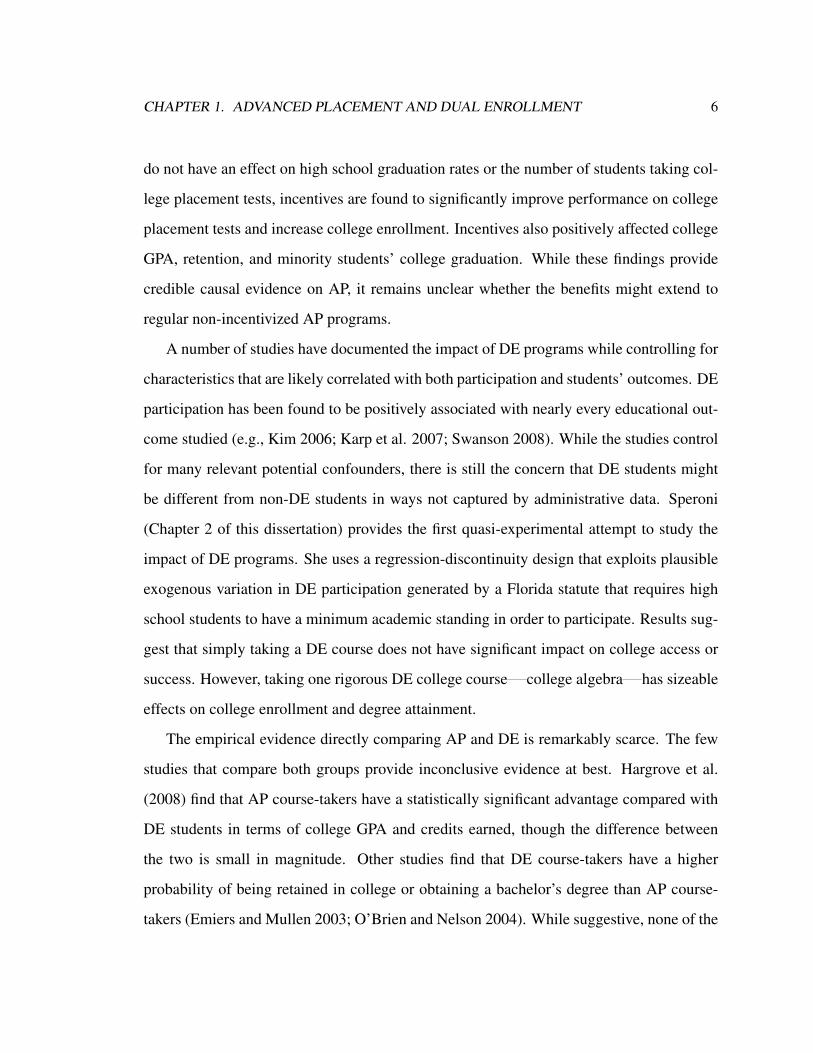
CHAPTER 1. ADVANCED PLACEMENT AND DUAL ENROLLMENT 6
do not have an effect on high school graduation rates or the number of students taking col-
lege placement tests, incentives are found to significantly improve performance on college
placement tests and increase college enrollment. Incentives also positively affected college
GPA, retention, and minority students’ college graduation. While these findings provide
credible causal evidence on AP, it remains unclear whether the benefits might extend to
regular non-incentivized AP programs.
A number of studies have documented the impact of DE programs while controlling for
characteristics that are likely correlated with both participation and students’ outcomes. DE
participation has been found to be positively associated with nearly every educational out-
come studied (e.g., Kim 2006; Karp et al. 2007; Swanson 2008). While the studies control
for many relevant potential confounders, there is still the concern that DE students might
be different from non-DE students in ways not captured by administrative data. Speroni
(Chapter 2 of this dissertation) provides the first quasi-experimental attempt to study the
impact of DE programs. She uses a regression-discontinuity design that exploits plausible
exogenous variation in DE participation generated by a Florida statute that requires high
school students to have a minimum academic standing in order to participate. Results sug-
gest that simply taking a DE course does not have significant impact on college access or
success. However, taking one rigorous DE college course college algebra has sizeable
effects on college enrollment and degree attainment.
The empirical evidence directly comparing AP and DE is remarkably scarce. The few
studies that compare both groups provide inconclusive evidence at best. Hargrove et al.
(2008) find that AP course-takers have a statistically significant advantage compared with
DE students in terms of college GPA and credits earned, though the difference between
the two is small in magnitude. Other studies find that DE course-takers have a higher
probability of being retained in college or obtaining a bachelor’s degree than AP course-
takers (Emiers and Mullen 2003; O’Brien and Nelson 2004). While suggestive, none of the

CHAPTER 1. ADVANCED PLACEMENT AND DUAL ENROLLMENT 7
studies provide compelling evidence of the superiority of one program over the other given
the lack of sufficient control variables in their analyses and, as pointed by Jackson (2009),
given the likely bias incurred by looking at college outcomes for only college attendees.
Furthermore, there is still a limited understanding in this literature of the types of students
that these programs serve.
This study contributes to this strand of literature by providing a thorough descriptive
analysis of students who choose AP, DE, or both, using data from the entire state of Florida.
Owing to the richness of the data, I am able to control for a large set of high school pre-
AP/DE measures of students’ abilities and other characteristics. In addition, I use the full
cohort of high school students as the target population of these programs, thus avoiding the
particular sample selection bias mentioned before. Like Jackson’s research (2009, 2010),
the data come from a state that provides cash incentives for AP exam performance and
results might not generalize to AP programs more broadly.
1.3 Advanced Placement and Dual Enrollment Programs in Florida
AP, a long-established program sponsored by the College Board, and DE, a more recent
grassroots program involving close interaction between the high school and college, con-
stitute the two largest acceleration mechanisms in Florida.1 The “acceleration” designation
describes a core characteristic of the programs: They allow students to accrue college-
credits while still in high school. While AP courses were offered in 55 districts in 2001
(around the period studied in this paper), all 67 districts in Florida had an agreement with
the local community college to offer DE.1Other acceleration programs include the International Baccalaureate (IB), the Advanced International Certificate of
Education (AICE), and the Credit by Examination Program (CLEP).

CHAPTER 1. ADVANCED PLACEMENT AND DUAL ENROLLMENT 8
Program Component Differences. Despite the fact that AP and DE can be conceptually
regarded as close high school substitutes for earning college credits, the programs differ in
a number of ways. Table 1.1 provides a comparison of the programs in Florida. As opposed
to AP, DE students take an actual college course with a college syllabus and immediately
receive the college credit when they successfully meet the requirements of the course with-
out taking an additional standardized end-of-course exam. DE students in Florida are also
granted a high school credit that counts towards the requirements for graduation: a type
of DE arrangement called “Dual Credit.” DE in Florida is almost exclusively sponsored by
the local two-year community college and the courses can be taken at the high school cam-
pus (depending on availability) or directly at the college campus. Regardless of location,
all DE courses are taught by teachers who meet the certification requirements, based on
accreditation standards, of a college faculty member.
AP courses are different from DE courses in that they are high school courses that
follow a standardized curriculum intended to be college level and are taught by a regular
high school teacher who might have received non-mandatory College Board training. In
order to get the college credits for the course, AP students are required to take an optional
exam (administered once a year by the College Board), and postsecondary institutions have
the discretion to set their own policies for granting college credits or advanced placement
into higher level courses. Most commonly, students with a score of 3 in a 5-point scale
exam are given college credit.
DE students have a broader scope of curricular options than AP students. With the
exception of physical education and remedial (pre-college) courses, which are excluded
from Florida’s DE program, students can take any course in the college catalog provided
they meet the course prerequisites. Conversely, the AP program offers about 30 courses
in selected subject areas, with school-level offering varying considerably across schools.
A common criticism of DE is the lack of a uniform quality standard across colleges (e.g.,

CHAPTER 1. ADVANCED PLACEMENT AND DUAL ENROLLMENT 9
Tabl
e1.
1:A
dvan
ced
Plac
emen
tand
Dua
lEnr
ollm
entP
rogr
amC
ompa
riso
nin
Flor
ida
CHAPTER 1. ADVANCED PLACEMENT AND DUAL ENROLLMENT 10
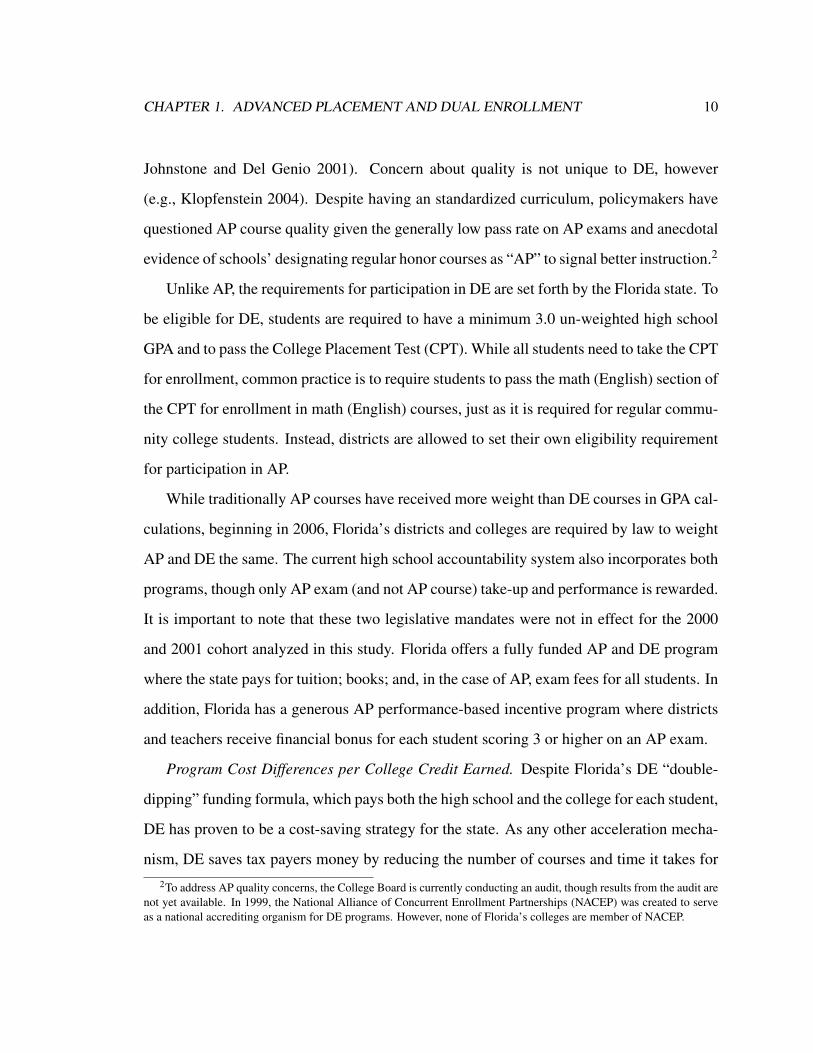
Johnstone and Del Genio 2001). Concern about quality is not unique to DE, however
(e.g., Klopfenstein 2004). Despite having an standardized curriculum, policymakers have
questioned AP course quality given the generally low pass rate on AP exams and anecdotal
evidence of schools’ designating regular honor courses as “AP” to signal better instruction.2
Unlike AP, the requirements for participation in DE are set forth by the Florida state. To
be eligible for DE, students are required to have a minimum 3.0 un-weighted high school
GPA and to pass the College Placement Test (CPT). While all students need to take the CPT
for enrollment, common practice is to require students to pass the math (English) section of
the CPT for enrollment in math (English) courses, just as it is required for regular commu-
nity college students. Instead, districts are allowed to set their own eligibility requirement
for participation in AP.
While traditionally AP courses have received more weight than DE courses in GPA cal-
culations, beginning in 2006, Florida’s districts and colleges are required by law to weight
AP and DE the same. The current high school accountability system also incorporates both
programs, though only AP exam (and not AP course) take-up and performance is rewarded.
It is important to note that these two legislative mandates were not in effect for the 2000
and 2001 cohort analyzed in this study. Florida offers a fully funded AP and DE program
where the state pays for tuition; books; and, in the case of AP, exam fees for all students. In
addition, Florida has a generous AP performance-based incentive program where districts
and teachers receive financial bonus for each student scoring 3 or higher on an AP exam.
Program Cost Differences per College Credit Earned. Despite Florida’s DE “double-
dipping” funding formula, which pays both the high school and the college for each student,
DE has proven to be a cost-saving strategy for the state. As any other acceleration mecha-
nism, DE saves tax payers money by reducing the number of courses and time it takes for2To address AP quality concerns, the College Board is currently conducting an audit, though results from the audit are
not yet available. In 1999, the National Alliance of Concurrent Enrollment Partnerships (NACEP) was created to serveas a national accrediting organism for DE programs. However, none of Florida’s colleges are member of NACEP.

CHAPTER 1. ADVANCED PLACEMENT AND DUAL ENROLLMENT 11
a student to get a postsecondary degree. But DE is more cost effective than AP because
of the following: (a) the rate at which students accumulate college credits is considerably
higher in DE than in AP (Office of Program Policy Analysis and Government Account-
ability [OPPAGA] 2006a), (b) DE courses are almost exclusively offered by the relatively
low-cost local community college, and (c) AP has an additional performance-based incen-
tive funding (OPPAGA 2006b). A recent report from the Florida legislature concludes that:
“The incentive funding paid for each credit hour earned by passing an AP exam cost nearly
twice what it would have cost for students to earn the same credits by passing the course at
a Florida community college or university” (OPPAGA 2006a, p. 4).
1.4 Data
I use detailed student-level administrative records obtained from the Florida Department of
Education which include all public school students in the 2000-01 and 2001-02 high school
graduating cohort: a total of 229, 828 students. The dataset contains transcript information
on all the courses taken in both high school and college (up to 2006), with a unique identifier
for AP and DE courses, as well as the location where the DE was taught (high school or
college campus). The data also include demographic characteristics such as age, gender,
race/ethnicity, English language proficiency, and free lunch eligibility, as well as 8th and
10th grade state standardized test scores (FCAT) and college degree attainment. In addition,
I complement Florida state records with National Student Clearinghouse data, which track
postsecondary enrollment of students at out-of-state colleges or private institutions. An
important limitation of this dataset is that the National Student Clearinghouse records only
cover college enrollment and do not indicate degree attainment for students who enroll in
a private or out-of-Florida college. Insofar as AP or DE students are systematically more

CHAPTER 1. ADVANCED PLACEMENT AND DUAL ENROLLMENT 12
likely to enroll outside Florida’s public system, the estimates of a program on attainment
of a bachelor’s degree would be downward biased. Last, districts characteristics such as
median-income and urbanicity are obtained from the 2000 Common Core Data and Census.
1.5 Profile of Advanced Placement and Dual Enrollment Students
Student Similarities and Differences. Table 1.2 shows students’ descriptive statistics by
program participation. I focus on participation in the 11th or 12th grade, when most of
students participate in acceleration programs.3 Students labeled on the table as DE(AP)
only participate exclusively in one program whereas DE & AP students combine both type
of courses. For comparison purposes, the table also depicts students who do not participate
in any acceleration program. AP is the largest acceleration mechanism in Florida, with
almost 19 percent of the students participating, followed by DE with about 13 percent.
Most of acceleration students only participate in one of the programs; less than 6 percent
of the students combine both an AP and a DE experience.4
While the gender composition of DE and AP participants is similar, the AP program
serves almost twice the proportion of black and Hispanics than DE (36 percent versus 19
percent), reflecting AP program’s concerted efforts over the last decades to reach tradi-
tionally underrepresented minority students (Klopfenstein 2004). Both programs attract
students from a similar socioeconomic background (proxied by free or reduced price lunch
eligibility), though students who choose to participate in both AP and DE are relatively
more affluent.3AP/DE course participation exclusively before the 11th grade is very rare: less than 4 percent of the AP/DE students.4These statistics exclude a small share of students who combine AP/DE with IB courses. The corresponding statistics
including IB students are: 20.5 percent AP, 13.8 percent DE, and 6.0 percent for AP and DE.

CHAPTER 1. ADVANCED PLACEMENT AND DUAL ENROLLMENT 13
There is systematic sorting of students into AP and DE by academic ability. Specifically,
AP-only participants have substantially better academic preparation than their DE coun-
terparts, as measured by their 10th grade scores on Florida’s standardized exam (FCAT),
though students who combine both programs are among the most able. AP students have,
on average, scores 9 and 10 points higher in reading and math, respectively; roughly a 0.3
standard deviation gap in academic background. Residuals from a school-level fixed effect
regression on the scores (normalized at the grade-cohort level), indicate that AP and DE
students’ differences in ability do not purely reflect sorting of students into schools with
different course offerings, but also a persistent sorting of students within schools. Inter-
estingly, the AP-DE achievement gap using the 10th grade cumulative GPA is small and
not consistent with that reflected by the FCAT scores, highlighting the importance of using
standardized measures for making comparisons.
Most DE students have a DE experience that combines courses taken at the high school
and at the college campus (58 percent) or take DE exclusively at the college campus (37
percent); only 5 percent of the students take DE only at the high school. To the extent that
part of the returns to DE comes from familirizing students with college life or exposing
them to college peers, at equal quality of instruction at different locations, DE courses
taken at the college campus would be preferred.
With the exception of college enrollment and early college persistence, where both DE
and AP students have a similar rate, mean college outcomes across programs correlate
closely with measures of academic performance prior to participation. AP-only students
have a relative advantage in terms of four-year college enrollment and bachelor’s degree at-
tainment, and have a higher GPA in college than DE-only students, but students combining
both AP and DE take the lead.

CHAPTER 1. ADVANCED PLACEMENT AND DUAL ENROLLMENT 14
Table 1.2: Descriptive Statistics by Student Subgroup

CHAPTER 1. ADVANCED PLACEMENT AND DUAL ENROLLMENT 15
Figure 1.1: Statewide Participation in Advanced Courses by 10th grade Score
Participation by Academic Ability and Districts’ Preferences. Figure 1.1 provides a vi-
sual description of statewide participation in advanced courses (AP, DE, International Bac-
calaurete [IB], and Honors) as a function of 10th grade score percentiles (calculated based
on the average math and reading FCAT scores). As expected, participation across advanced
high school courses monotonically increases with students’ academic ability. While par-
ticipation in AP and DE remains relatively low among students below the state’s median,
it increases rapidly for higher level achievers. Instead, students of all ability levels have
access to Honors courses—advanced courses that are not college level. Participation in IB,
an alternative acceleration program, is very low (only 2.5 percent of students statewide)
and restricted to students at the very top of the academic distribution.
While both AP and DE programs are available in most Florida school districts, there
is considerable difference in students’ program choice across districts. To illustrate this,

CHAPTER 1. ADVANCED PLACEMENT AND DUAL ENROLLMENT 16
Figure 1.2: Advanced Placement and Dual Enrollment Participation in Selected Districts
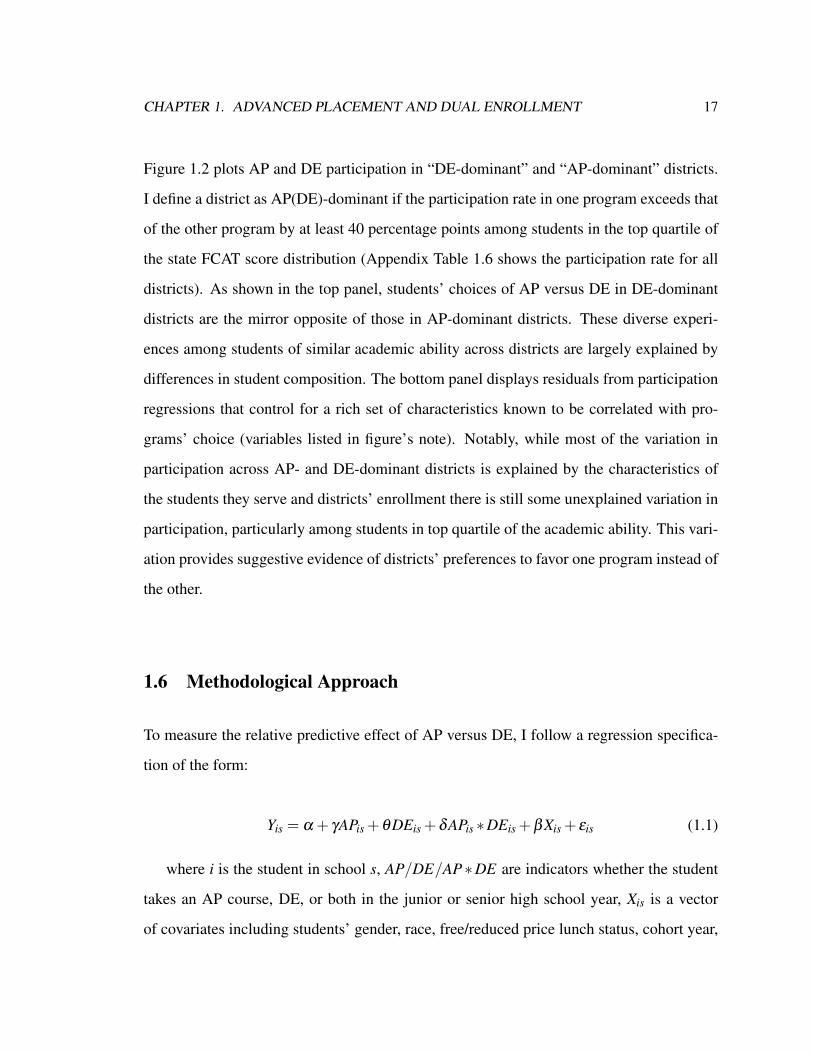
CHAPTER 1. ADVANCED PLACEMENT AND DUAL ENROLLMENT 17
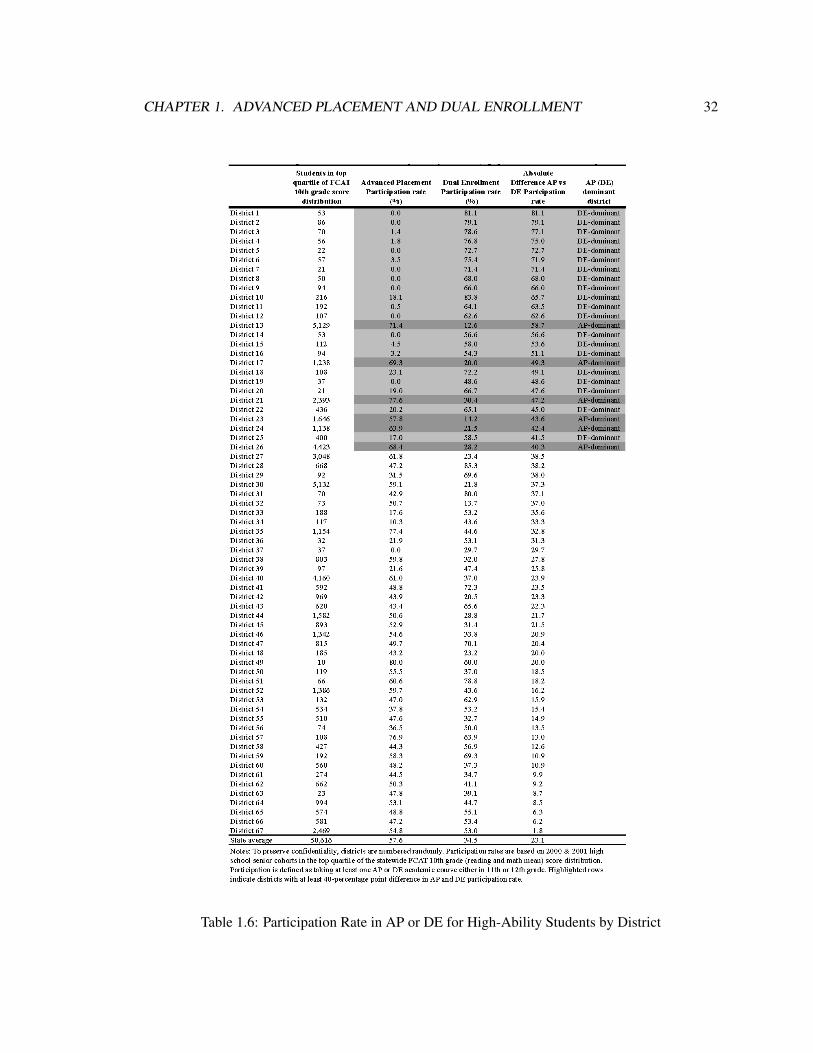
Figure 1.2 plots AP and DE participation in “DE-dominant” and “AP-dominant” districts.
I define a district as AP(DE)-dominant if the participation rate in one program exceeds that
of the other program by at least 40 percentage points among students in the top quartile of
the state FCAT score distribution (Appendix Table 1.6 shows the participation rate for all
districts). As shown in the top panel, students’ choices of AP versus DE in DE-dominant
districts are the mirror opposite of those in AP-dominant districts. These diverse experi-
ences among students of similar academic ability across districts are largely explained by
differences in student composition. The bottom panel displays residuals from participation
regressions that control for a rich set of characteristics known to be correlated with pro-
grams’ choice (variables listed in figure’s note). Notably, while most of the variation in
participation across AP- and DE-dominant districts is explained by the characteristics of
the students they serve and districts’ enrollment there is still some unexplained variation in
participation, particularly among students in top quartile of the academic ability. This vari-
ation provides suggestive evidence of districts’ preferences to favor one program instead of
the other.
1.6 Methodological Approach
To measure the relative predictive effect of AP versus DE, I follow a regression specifica-
tion of the form:
Yis = α + γAPis +θDEis +δAPis ∗DEis +βXis + εis (1.1)
where i is the student in school s, AP/DE/AP∗DE are indicators whether the student
takes an AP course, DE, or both in the junior or senior high school year, Xis is a vector
of covariates including students’ gender, race, free/reduced price lunch status, cohort year,

CHAPTER 1. ADVANCED PLACEMENT AND DUAL ENROLLMENT 18
8th and 10th grade standardized scores, 10th grade GPA, high school and districts demo-
graphics, and ε is is an idiosyncratic error term. In order to account for an obvious potential
confounding factor, students’ endogenous sorting across schools, an additional specifica-
tion includes high school fixed effects.5,6 I formally test whether the coefficients for AP and
DE are statistically different. The basic specification in equation (1.1) is extended to assess
whether the returns to DE vary depending on the course location by interacting the partic-
ipation dummy with an indicator for whether students have a DE experience at the college
campus, at the high school campus, and an interaction term for both locations. Standard
errors allow for clustering at the district-level and are robust to heteroskedasticity.
Even after controlling for a rich set of covariates and measures of academic preparation
prior to participation, there is still the concern that unobserved differences between AP
and DE students within the same school may be driving the results. After all, the determi-
nants of students’ program choice are largely unknown, schools’ might have participation
criteria systematically more selective for one program than the other, or counselors might
endogenously encourage participation in a particular program based on perceived differ-
ences among their students.
In an attempt to alleviate concerns about omitted variable bias, I provide a second set
of analyses that exploit schools’ variation in the supply of the programs. In the spirit of5FCAT 8th grade exam was first administered for the 2001 cohort. Regressions set missing scores to zero for the
2000 cohort and include a dummy for missing values. One particular AP course type, AP Studio Art portfolios, doesnot necessarily involve actual instruction time. Students get the credits by submitting art projects at the end of the yearfollowing detailed guidelines. Since only 1.2 percent of AP students would only take this type of AP course, I includethem in the analysis. Admittedly, there is likely important heterogeneity in the returns to different courses within eachprogram (e.g., Klopfenstein and Thomas 2009, Speroni in Chapter 2 of this dissertation). However, disaggregating theanalysis by course subject area is challenging in a non-experimental setting due the multicollinearity problem that arisesbecause most students take multiple acceleration courses (Camara and Michaelides 2005).
6While the dichotomous nature of the outcomes calls for a logit or probit model, nonlinear models with fixed effectssuffer from the incidental parameters problem (see Greene 2003, p. 697, for an econometric discussion of the problem). Aparticular type of nonlinear model, the conditional logit, can accommodate fixed effects but requires making assumptionsabout the magnitude of the fixed effects to calculate the marginal effects of interest. For consistency, I report ordinaryleast squares estimates for all models, though logit estimates for models without high school fixed effects (availableupon request) indicate programs’ differences of comparable magnitude—within 0.1 to 2 percentage point difference incollege-going and bachelor’s degree attainment and about 5 percentage point smaller difference in four-year enrollment.

CHAPTER 1. ADVANCED PLACEMENT AND DUAL ENROLLMENT 19
Rosenbaum (1987), I utilize the fact that a student may be a control group either because
the program was not offered or because it was offered but declined. For example, not all
schools offer the AP program or strongly promote participation, and those that do only a
small share of students elect to participate. Thus, these two groups of students provide
two natural control groups that can be used to assess whether the model proposed in spec-
ification (1.1) sufficiently captures selection into the programs or, in Rosenbaum’s terms,
whether selection into the treatment is ignorable conditional on the vector Xis.
I implement Rosenbaum’s idea in two separate analyses. In the first analysis, I assess
the impact of DE in situations where students have no choice of AP by estimating equation
(1.1) in the subsample of schools where no student takes any AP course.7 Even in situations
where students have access to both programs, as shown in Section 5, AP- and DE-dominant
districts might favor one program at the expense of the other, effectively limiting the choice
set of high-ability students. The second analysis takes advantage of these potentially id-
iosyncratic preferences by comparing outcomes of ‘high-ability’ students (top quartile of
the 10th grade FCAT score distribution) versus ‘medium-to-low-ability’ in an AP-dominant
versus DE-dominant district (districts identified in Section 5). While high-ability students
might be different than the rest and AP-dominant districts might be different than DE-
dominant, this difference-in-difference framework assumes that high-ability students (i.e.,
potential AP/DE takers) are not different across districts conditional on all the characteris-
tics included in the model. Using data from the subsample of districts where one program
strictly dominates the other, the comparison is given by the coefficient on the interaction
term in the following regression:
Yisd = α +θHAisd + γHAisd ∗AP−dominantsd +∑d
πdDdis +βXisd + εisd (1.2)
7The parallel analysis for measuring the effect of AP is not feasible since all districts and virtually every school haveDE students.

CHAPTER 1. ADVANCED PLACEMENT AND DUAL ENROLLMENT 20
where HA is an indicator that student i in school s in district d is a high-ability student,
HAisd ∗AP−dominantsd is the interaction term between high-ability and an AP-dominant
dummy, and Dd is an indicator for whether the student i attends a school s located in district
d.8 Since not all high-ability students participate in an acceleration program and if they do,
not all participate in the district “favored” program, this analysis provides an intent-to-
treat effect of pushing one program. Even though these point estimates are not directly
comparable with the other models, consistency with statewide analyses using specification
(1.1) provides some robustness that the covariates in the models are caputring students’
selection into the program relatively well.
It is important to emphasize that, to the extent that students’ participation is driven by
unobserved factors, the result would only speak to the predictive power of participation and
cannot be interpreted as causal estimates of the program. Exploiting variation in participa-
tion in scenarios of constraint choice provides an exercise to advance our understanding of
the potential impact of these programs but does not represent a quasi-experimental analyt-
ical exercise.9
Heterogeneity of the Effect by Students’ Minority Status and Ability. In order to gauge
whether the predictive effect of the programs vary by students’ subgroups, I estimate (1.1)
separately for minority (black and Hispanic) and non-minority students. Last, to examine
whether the relative effectiveness of AP and DE programs varies with respect to students’
academic preparation, I classify students by their pre-participation test score quartile (and
decile) using the 10th grade FCAT average math and reading score. I then estimate a version
of (1.1) in which AP and DE is interacted with quartiles (and deciles) dummies of students’
initial ability. For simplicity, I omit the DE*AP interaction term.8Using district fixed effects is virtually analogous to including a dummy for AP-dominant district.9Since college’s location was determined long before the advent of (and for reasons unrelated to) DE programs, and
students in Florida are only allowed to take the program sponsored by the local community college, high school’s distancefrom the college might provide, in theory, a source of plausible exogenous inducement to participation. Unfortunately,distance to college does not strongly predict DE participation in these data and an instrumental variable approach is notfeasible.

CHAPTER 1. ADVANCED PLACEMENT AND DUAL ENROLLMENT 21
A Methodological Consideration for the Effect on Bachelor’s Degree Attainment. Ide-
ally, we would be interested in measuring the effect of AP/DE on students’ probability of
going to college and then, conditional on college attendance, the effect of the programs
on the probability of finishing college. However, to the extent that AP/DE has an effect
on college-going, disentangling both effects is methodologically challenging even in a ran-
domized setting. For a randomized study to uncover the causal effect of AP/DE on college
success once in college (i.e., conditional on college access) it would have to be the case
that all students (both randomized in and out of each program in high school) are forced
to go to college an experiment practically unfeasible. To avoid the sample selection bias
derived from looking at college outcomes for only college attendees, when measuring the
effect of AP/DE on bachelor’s degree attainment I consider the entire sample of high school
students in the analyses and use a zero for students who do not go to college. This effect
should be interpreted as an overall effect of the programs that captures both changes in the
composition of college goers as well as improvements in college readiness conditional on
college-going.
1.7 Estimation Results
1.7.1 Predictive Effect of Advanced Placement and Dual Enrollment on College Out-
comes
Table 1.3 presents the main regression results. The first column of each outcome shows the
results controlling for the full set of covariates; the second column adds school fixed effects,
and the third column breaks down the effect of DE by location of the course (high school or
college). The remaining columns present the analyses using different sample restrictions.

CHAPTER 1. ADVANCED PLACEMENT AND DUAL ENROLLMENT 22
Overall, there is significant positive relationship between both AP and DE participation and
students’ likelihood of enrolling in college after high school, first enrolling in a four-year
institution, and obtaining a bachelor’s degree. There are, however, apparent differences in
outcomes between students with AP credits and those with DE credits when compared to
those with no AP or DE credits.
After controlling for students’ and schools’ characteristics, including preexisting mea-
sures of academic ability, DE students are more likely than AP students to go to college,
but are less likely to enroll in a four-year college. Adding high school fixed effects to
account for endogenous migrations (such as families with high value for education mov-
ing to areas with a strong program) do not materially change the point estimates. In both
outcomes, I reject the hypothesis that the coefficients on AP and DE are the same. The
programs differ by about 6 percentage points for college enrollment and almost double, 12
percentage points, for four-year enrollment (columns 1 and 6). Naturally, these differences
between the programs might reflect a tendency of students who have already decided to
go to college or to a two-year college to prefer DE as well as status quo ante admission
practices in selective four-year colleges to favor AP students. The results on bachelor’s
degree attainment mirror that of four-year enrollment with a relative advantage of the AP
program, though the AP-DE gap is considerably smaller (ranging from 0. 2 to 4 percentage
points depending on specification, columns 11 through 13) and only statistically signifi-
cant when dropping students for whom degree attainment is missing due to out-of-state or
private college enrollment.
Since both AP and DE main effects are included in the model, a negative coefficient for
the interaction term does not imply that combining both programs lowers the likelihood of
college access or success. Rather, results indicate that taking both AP and DE is associated
with better outcomes than taking solely one of the programs, but the magnitude is smaller

CHAPTER 1. ADVANCED PLACEMENT AND DUAL ENROLLMENT 23
Tabl
e1.
3:R
egre
ssio
nof
Stud
ents
’Out
com
eson
Dua
lEnr
ollm
enta
ndA
dvan
ced
Plac
emen
tPar
ticip
atio
n

CHAPTER 1. ADVANCED PLACEMENT AND DUAL ENROLLMENT 24
than the sum of the individual program effects (particularly in college enrollment and en-
rollment type). This group of students is mostly composed of those who exhaust the AP
courses available at the high school and turn to DE for even higher level courses offered at
the college.
Dual Enrollment Effect by Location of Course. Interestingly, DE students who take
DE exclusively at the local high school perform no differently from high school students
who do not participate in either AP or DE (columns 3, 8, and 14). In addition, students
who combine DE courses at both high school and college locations appear to derive no
benefit from those courses taken at the high school (i.e., point estimates on both DE in the
high school and DE in both locations are small and statistically insignificant across all out-
comes). This correlation is consistent with lower quality of DE high school courses (which
are often taught by a high school teacher) and with important returns to giving students a
first-hand experience of the college environment, expectations, and peers. While I cannot
rule out endogenous selection of students into different locations, with highly motivated or
unobservable “better” students choosing a DE experience directly at the college campus,
the regressions control for a rich set of student characteristics.
Sensitivity Analyses Exploiting Constraints in Program Supply. In order to assess the
robustness of the results, I complement the statewide analyses with a second estimation
strategy that exploits regional differences in programs’ offerings to measure the effect in
situations where students do not have much choice of program either because the pro-
gram is not offered or not popular. Results from this exercise are broadly consistent with
the more precise estimates constructed using the larger sample, supporting the notion that
much of the selection into the programs is being captured by the covariates included the
model. Across outcomes, the point estimates for DE-taking in schools where no AP is of-
fered are very similar to those estimated using all schools, and highly significant despite the
reduction in sample size. The last columns for each outcome in Table 1.3 show the results

CHAPTER 1. ADVANCED PLACEMENT AND DUAL ENROLLMENT 25
using specification (1.2) on the subsample of AP- and DE-dominant districts. High-ability
students in a district where the most popular program is AP (i.e., AP-dominant), enroll
in college at a lower rate than high-ability students in a DE-dominant district (column 5)
but are more likely to enroll in a four-year institution (column 10). Also consistent with
statewide results, the effect of encouraging AP among high-ability students on bachelor’s
degree attainment is very small (0.008) and not significant compared to encouraging DE
(column 16). Even though this approach ameliorate concerns about students self-selecting
into one program as opposed to the other, it still assumes that schools’ encouragement of
one particular program is exogenous (of their students characteristics), that the effect of
program does not vary across districts, and that students do not sort themselves in different
schools. Thus, results speak of a correlation which does not necessarily imply causation.
1.7.2 Effect Heterogeneity
Effect by Minority Status. Table 1.4 investigates the extent to which the relative pre-
dictive effectiveness of an AP and DE experience depends on students’ minority status
(black/Hispanic versus other ethnicities). For reference, the first columns for each outcome
restate the main results in Table 1.3 columns 1, 6, and 11. Results indicate that AP and
DE minority students are equally likely to go to college than observationally similar non-
minority students point estimates for both subgroups are virtually identical (columns 2
and 3). In contrast, non-minority AP students are almost twice as likely to enroll in a four-
year institution than AP minorities (about a 10-percentage point difference in rate, columns
5 and 6), suggesting that AP, by itself, is not enough to close the ethnicity gap in college
aspirations, applications, or admissions. These large differences by minority status in AP
students’ likelihood of enrolling in a four-year college do not translate to bachelor’s degree

CHAPTER 1. ADVANCED PLACEMENT AND DUAL ENROLLMENT 26
attainment: The ethnicity gap in bachelor’s degree is less than 4 percentage points com-
pared to a 10 percentage point gap in four-year enrollment. Minority AP students, despite
being disproportionally more likely to initially enroll at a community college, are able to
transfer up to a four-year college and graduate with a bachelor’s degree at higher rates than
minorities who do not participate in any acceleration program.
Effect by Students’ Ability. Table 1.5 assesses non-linearities in the AP and DE pro-
grams impact with respect to students’ quartile of initial ability. Figure 1.3 displays a more
nuanced analysis by students’ decile. Both sets of results indicate important heterogeneity
in the impact of the programs on college enrollment and enrollment type though not in
bachelor’s degree. AP and DE participants at the bottom of the ability distribution (quar-
tile 1 in Table 1.5 and decile 1 and 2 in Figure 1.3) are equally likely to enroll in college.
However, middle- to high-ability DE participants are significantly more likely to do it, with
a DE-AP gap fairly stable at around 6 percentage points. In terms of four-year enrollment,
the AP effect increases with ability while the DE effect remains constant. The difference
between the two programs is small and statistically insignificant for students at the lower
levels of ability, but becomes large and significant for above-median students. In other
words, students who were academically successful prior to participation drive the advan-
tage of AP relative to DE in four-year enrollment. Lastly, I cannot reject the hypothesis that
the difference between AP and DE in students’ likelihood of obtaining a bachelor’s degree
is statistically significantly different from zero at conventional levels along the distribution
of ability.

CHAPTER 1. ADVANCED PLACEMENT AND DUAL ENROLLMENT 27
Tabl
e1.
4:H
eter
ogen
eity
ofD
ualE
nrol
lmen
tand
Adv
ance
dPl
acem
entE
ffec
tby
Stud
ents
’Min
ority
Stat
us

CHAPTER 1. ADVANCED PLACEMENT AND DUAL ENROLLMENT 28
Table 1.5: Heterogeneity of Dual Enrollment and Advanced Placement Effect by Quartiles of Stu-dents’ Prior Scores

CHAPTER 1. ADVANCED PLACEMENT AND DUAL ENROLLMENT 29
Figure 1.3: Heterogeneity of the Effect of Advanced Placement and Dual Enrollment by Students’Ability

CHAPTER 1. ADVANCED PLACEMENT AND DUAL ENROLLMENT 30
1.8 Conclusion
I use Florida’s statewide data for two cohorts of high school students to assess the rel-
ative power of Advanced Placement (AP) and Dual Enrollment (DE) course experiences
for predicting students’ success. Basing identification on statistical controls for previous
achievement and schools and family background, I find that both AP and DE are strongly
associated with college access and success, though important differences across programs
exist. While DE students are, on average, more likely to go to college after high school, AP
students are more likely to first enroll in a four-year institution. Despite this difference in
initial enrollment, the difference between DE and AP in terms of bachelor’s degree attain-
ment is much smaller and even not statistically significant for some specifications. Taken
together, these results suggest a relative underrepresentation of DE students at four-year
colleges that has important implications for college admission practices that are unduly
influenced by AP participation, and for policies addressing factors other than academic
readiness that affect DE students’ ability-college undermatch.
While DE participation is associated with positive outcomes, the effect is seen only in
students who take DE courses at the community college; DE participation has no effect
for students who take courses at the high school. In light of current concerns about high
schools’ ability to deliver college-level instruction and the lack of standardized curriculum
in DE courses, the results may call for increased quality control for DE college credits
earned at high school campuses.
AP and DE programs have become a prominent feature of the high school education
system and their growth is expected to continue. AP participation is increasingly being
used by selective colleges for screening highly motivated and able students in their ad-
mission process (Breland et al. 2002). Amidst budgetary deficits, state governments are
turning to these programs as a mean of shortening the time and decreasing the number

CHAPTER 1. ADVANCED PLACEMENT AND DUAL ENROLLMENT 31
of credits needed for students to get through the education pipeline. At the same time,
there is a growing perception that both programs are effective interventions for improving
educational outcomes not only for high-ability students but also for middle- to even low-
achievers. As these programs continue to expand, it is important to increase our knowledge
about which students choose to participate in each program, how their choice affects their
educational prospects, and whether high-stake policies that treat these programs differently
are justified.
1.9 Appendix
CHAPTER 1. ADVANCED PLACEMENT AND DUAL ENROLLMENT 32
Table 1.6: Participation Rate in AP or DE for High-Ability Students by District

Chapter 2
High School Dual Enrollment Programs:
Are We Fast-Tracking Students Too
Fast?
2.1 Introduction
Roughly one third of high school graduates do not enroll in postsecondary institutions,
and a third of those that do are required to first take remedial education to prepare them
for college level work (National Center for Education Statistics [NCES] 2003, 2004). One
program designed to address these problems is Dual Enrollment (hereafter DE), an arrange-
ment by which high school students (typically juniors and seniors) enroll in college courses
and earn college credits. DE is based on the notion that participation would promote college
enrollment and completion by giving students a stronger preparation and a realistic idea of
college academics. However, fast-tracking students through the educational system could
potentially discourage students, particularly those academically or emotionally not ready to
33

CHAPTER 2. DUAL ENROLLMENT PROGRAMS 34
handle college demands, or might simply not have an effect if it only serves college-bound
students.
While there are no nationwide statistics on the growth of DE programs, two recent
reports by the NCES estimate that about 5% of all high school students (nearly a million
students) took a college course during the 2002-03 school year (Kleiner and Lewis 2003),
and about 71% of all public high schools offer DE programs (Waits et al. 2005).1 In this
paper I analyze data from Florida, where about 14% of high school students take at least
one college course via DE.2
Despite the prevalence of DE programs, there is little quantitative evidence of their
effectiveness. Two extensive reviews of the literature (Bailey and Karp 2003; Lerner and
Brand 2006) conclude that there is no sound evidence showing that DE programs contribute
to students’ college access and academic success. Assessing the impact of DE is difficult
because of the well-known problem of selection bias. The selection problem is two-fold:
students choose to take college courses while in high school based on their academic ability,
motivation, and expected gains from participation, and colleges are allowed to set their own
admission requirements to ensure the integrity of their academic programs. In addition,
students who have already decided to go to college would likely consider DE an attractive
head start, causing a spurious correlation between participation and outcomes.
In an effort to statistically control for students’ differences, a handful of studies employ
a regression framework, though the availability and quality of the data used vary consider-
ably (e.g., Crook 1990; Goodman et al. 2001; Nitzke 2002; Eimers and Mullen 2003; Kim
2006; Karp et al. 2007; Swanson 2008).3 DE participation has been found to be strongly1Part-time enrollment growth under the age of 18 at public 2-year colleges presumably mostly comprised of DE
students could be taken as evidence of a rapid expansion. Between 1995 and 2005, the number of these students morethan doubled (NCES 1998, 2006), while high school enrollment growth was only about 19% over the same time period(NCES 2008).
2DE is the second largest high school acceleration program after Advanced Placement. About 20% of Florida studentstake an Advanced Placement course.
3Abstracting from the potential failure to properly account for the selection problem, the DE literature suffers from twoadditional shortcomings— both highlighted by Jackson (2009) in the literature on Advanced Placement. First, all studies

CHAPTER 2. DUAL ENROLLMENT PROGRAMS 35
positively associated with nearly every educational outcome studied. For example, Karp et
al. (2007) find that, compared to non-DE students, DE students in Florida are 17 percent-
age points more likely to enroll in college and 8 percentage points more likely to initially
enroll in a 4-year institution, among other positive outcomes, after controlling for charac-
teristics that are likely correlated with both DE participation and students’ outcomes such
as race, gender, academic background, free/reduced price lunch status at school, and school
demographics. While these findings are encouraging, a more rigorous analysis is needed.
This paper constitutes the first attempt to use a quasi-experimental method namely,
the Regression-Discontinuity (RD) design to gauge the causal effect of DE on students’
likelihood of high school graduation, college access, and college success.4 I exploit a
statutory mandate in Florida that restricts enrollment, generating a source of plausible ex-
ogenous variation in DE participation. Under Florida’s policy, students are mandated to
have a minimum grade point average (GPA) in high school in order to take a DE course
and, for enrollment in specific courses such as college algebra, to have a minimum score
in a college placement test (CPT). I exploit both features of the policy in two separate RD
analyses.
I first examine the effect of taking at least one DE course exploiting the GPA eligibil-
ity requirement. With the exception of a few courses (typically in math and English), an
eligible GPA suffices for placement in most freshman community college courses. Since
estimate regressions that control for variables determined after DE participation, such as overall HS GPA, placementtests taken in college, or even college choice or enrollment patterns. Controlling for post-treatment variables, potentiallyaffected by DE participation, may induce bias in the estimation of the treatment effect in a regression framework. Thesecond limitation derives from the fact that studies, aiming to uncover the effect of DE on college outcomes, restrictthe sample of analysis to college-goers. To the extent that DE affects students’ likelihood of going to college, thencomparisons of DE and non-DE no longer have a valid causal interpretation (see Angrist and Pischke (2009) for adescription of the problem). Both of these shortcomings are often inevitable due to data limitations, since most studiesonly have access to college transcript files. Even high-school-to-college longitudinal datasets, such as the NELS: 88/00,have this limitation since they identify DE courses from college transcripts which were collected exclusively for studentsthat enroll in college after high school.
4The regression discontinuity approach is increasingly being used to assess causal impact of interventions in observa-tional studies, both in education and elsewhere. Imbens and Lemieux (2008) and Lee and Lemieux (2010) provide tworecent surveys of the methods.

CHAPTER 2. DUAL ENROLLMENT PROGRAMS 36
GPA by itself cannot strongly predict participation in courses with additional test require-
ments, this analysis captures mostly the average effect of all other DE courses for which
eligibility is determined by the GPA. Hence, I refer to this analysis as the effect of DE-
basic. While this effect is of interest in its own right, DE encompasses a wide range of
course experiences, with varying degree of difficulty and subject area focus. Owning to the
generality of the GPA requirement, this analysis cannot separately identify the effect of any
particular course. A more nuanced understanding of the potential effect of DE as a policy
intervention would point to assessing the heterogeneity of the effect by DE course experi-
ence. To this end, I conduct a second RD analysis that examines a particularly challenging
course college-level algebra which is the second most popular DE course after English
Composition.5
The second RD analysis exploits the course-specific CPT requirement for enrollment
in algebra. An important analytical complication in measuring the effect of DE-algebra
derives from the fact that the CPT math requirement is the same for all (high school and
college) students. Thus, an eligible student who does not take the course as DE while in
high school can still take the course in college. Standard RD estimation cannot accommo-
date the presence of a second treatment discontinuously changing at the same cutoff, and
therefore cannot disentangle the effect of algebra in high school from the effect of algebra
in college. I propose a new RD estimator (referred to as Sequential RD-matching estima-
tor) that extends the traditional RD identification strategy to situations where a subsequent
treatment also changes discontinuously at the eligibility cutoff.6 The empirical estimation5While English Composition also has a CPT requirement for enrollment, the cutoff used for placement into this course
also determines need of college remediation— non-credit-bearing courses designed to help academically unpreparedstudents for college-level work. CPT re-testing among students who barely fail Florida’s cutoff for English remediationhas been documented in most colleges, raising concerns about the validity of an RD design on this course (Calcagno& Long 2008). Instead, the cutoff score used for placement into college algebra is higher than the one used for mathremediation.
6This setup is distinct from a “dynamic RD” (Cellini et al. 2010) in two ways. First, the dynamic RD is characterizedby one treatment and multiple opportunities to be assigned to the treatment. Instead the sequential RD allows for twotreatments that occur with a temporal lag. Second, in the dynamic RD agents may be assigned to the treatment more thanonce, whereas in the sequential RD agents can only take one of the treatments.

CHAPTER 2. DUAL ENROLLMENT PROGRAMS 37
relies partially on matching techniques, which directly capitalize on the RD assumptions to
make inferences. This sequential RD approach allows one to sort out whether any observed
effect on outcomes experienced after college can be solely attributed to the DE experience.
I estimate the effect of DE in a subset of Florida’s districts where there is empirical evi-
dence that the eligibility requirements for participation are binding. Using both high school
and college transcripts for the 2000 and 2001 graduating high school cohorts, I find little
indication that taking a DE-basic course significantly affects students’ educational progress
among students with a high school GPA on the margin of eligibility. The point estimates
are generally negative, though I cannot consistently reject that taking DE has no effect
across outcome measures. Drawing from a subsample of students who took Florida’s CPT
exam, I find, however, that taking college level algebra while in high school has a substan-
tial influence on students’ likelihood of going to college and obtaining a college degree,
with some indication of positive effects on high school graduation. Specifically, I find that
taking DE-algebra increases college access by about 16-percentage points (standard RD
estimate) and both associate’s and bachelor’s degree attainment by about 23-percentage
points (sequential RD estimates).
Taken together, these findings suggest that DE programs have the potential to increase
college access and success but that the quality, subject area, or level of difficulty of the DE
experience might be important considerations when assessing the value of DE programs
as a policy intervention. It is important to highlight, however, that the RD estimates only
speak to the local effect of DE among students on the margin of eligibility and may not be
representative of the gains from participation for students with different academic prepa-
ration. In addition, the two RD analyses inevitably draw inference from different sets of
students and I cannot rule out the possibility of DE impact heterogeneity with respect to
students’ characteristics, in addition to the subject area or quality of the DE experience.

CHAPTER 2. DUAL ENROLLMENT PROGRAMS 38
The remainder of the paper is organized as follows. Section 2 provides background
on DE programs, the potential mechanisms by which they affect students’ outcomes, and
Florida’s DE policy. Section 3 describes the data. Section 4 explains the empirical strategy
and derives the proposed Sequential RD estimator. Section 5 discusses the validity of the
RD assumptions. Section 6 presents the main results and Section 7 provides robustness
checks. Section 8 concludes the paper.
2.2 Dual Enrollment Program
DE differs from other high school programs which also allow high school students to
earn college credits such as Advanced Placement (AP), International Baccalaureate (IB),
or the more recent Advanced International Certificate of Education (AICE).7 The main dif-
ference is that DE consists of a regular college course, which grants credits to students who
pass. Other programs follow a standardized college-level curriculum and college credits
are only obtained with a satisfactory score on an external (often optional) end-of-course
examination. Since some courses are taught at the high school campus, not all DE courses
involve a true college experience where high school students are mixed with college stu-
dents. Nevertheless, DE instructors must meet the faculty qualifications for an adjunct
community college instructor in most states.
2.2.1 Dual Enrollment Conceptual Framework
There are several potential channels through which a DE experience could foster col-
lege access and success. First, DE might help students build human capital by providing a
broader and more rigorous curriculum than traditional high school courses, facilitating the
‘academic transition’ to the demands of college (Bailey et al. 2002). Second, DE could7College Level Examination Program (CLEP) is also considered an acceleration mechanism but, unlike others, it does
not involve enrolling in a course and the college credit does not count towards high school graduation.

CHAPTER 2. DUAL ENROLLMENT PROGRAMS 39
have a signaling value for students preparing for admission at selective colleges as it con-
veys information about students’ own abilities and motivation, mitigating the information
asymmetry in college applications. Third, DE could potentially give students more accurate
information about the institutions and their own college readiness, providing an early call to
strengthen the skills in particular areas if necessary. Consistent with the theory of “school-
ing as experimentation” (Manski 1989), DE would allow students to ‘test the waters’ in
college before making their postsecondary school choice. This may translate into better
matches between students and institutions, and may improve college persistence and de-
gree completion (Light and Strayer 2004). Last, by reducing the cost of college, DE might
also foster college access. Students can reduce the time (and forgone earnings) required to
get a college degree and, in states with subsidized DE programs, the direct cost of a degree.
These financial benefits might be a key factor for pursuing a college degree among low-
income students (Greenberg 1989). In addition, DE might also overcome other barriers to
college by helping students make the ‘psychological transition’ to college demands (Bailey
et al. 2002).
While DE can be viewed as a potential tool to increase college access and success, it is
not without controversy. A common concern of DE programs is that they might lower
students’ self-esteem and educational aspirations: It is not clear that students who are
marginally successful in high school can do college level work (Bailey and Karp 2003).
Course failure might discourage postsecondary education altogether or set students on a
non-academic path. Given that DE programs are mostly offered through 2-year colleges,
the DE experience might also induce students that would have otherwise attended a 4-year
college after HS graduation to enroll in community colleges, reducing their educational
attainment due to high transfer costs and less emphasis on bachelor’s degree, among other
barriers. In addition, the ability of DE programs to provide college-level curricula has been
questioned (e.g., Johnstone and Del Genio 2001). Allowing high school students into the

CHAPTER 2. DUAL ENROLLMENT PROGRAMS 40
class could also dilute the quality of education at the college campus, and many observers
are skeptical about the quality of DE courses taught by high school teachers in the high
school campus.
2.2.2 Florida’s Dual Enrollment Policy
Florida has been at the forefront of many innovations in educational policy, including
DE. Florida is one of 6 states that pay for DE courses, while most other states require the
school district or the students themselves to pay for them (WICHE 2006). This funding
provision not only promotes program participation but also enables access for students
from low-income households. In addition, Florida funds both high schools and colleges for
DE courses (OPPAGA 2006), encouraging schools to support students’ participation.
Florida is also one of only 15 states that allows students to earn both a high school credit
and a postsecondary credit simultaneously, and guarantees that the credits counts towards
high school graduation requirements (WICHE 2006). Successfully completed courses may
apply towards the requirements necessary to earn a certificate or degree thereby shortening
the time it takes to earn a postsecondary award. Florida has also developed a statewide
course numbering system that eases the transfer of credits among the state’s public insti-
tutions and, beginning in 2006, the legislature requires state’s public universities to weight
DE courses the same as AP, IB, or AICE courses when calculating their own GPA for ad-
missions decisions. This policies, coupled with the fact that students in Florida are exempt
from the payment of registration, tuition, books, and laboratory fees related to the course,
makes the DE program an attractive acceleration mechanism.
Florida’s strong support for DE has been crystallized in a widespread program, with all
28 community colleges having an articulation agreement in place with its serving district
and all school districts taking advantage of such possibility. DE is the second most popular
choice among different acceleration mechanisms—the first choice being AP. Overall, about
CHAPTER 2. DUAL ENROLLMENT PROGRAMS 41
14% of the high school students in this study took at least one academic DE course, while
20% took AP and 3% IB.
2.2.2.1 Dual Enrollment Eligibility and Enrollment Process
To be eligible for DE in Florida, students are mandated to have a minimum of 3.0 un-
weighted GPA and demonstrate college readiness with the College Placement Test (CPT)
(Florida Statute 1007.271).8 The statute is not specific regarding what portions of the CPT
are appropriate for admission into specific courses. However, common practice has been
to set the same requirements for both DE and regular college students.9 That is, while
all candidates need to take a placement test, only a few college courses (typically in math
and English) have a minimum score requirement for enrollment. In particular, students
must pass the math (English) portion of the CPT for math (English) courses, and/or fulfill
any course pre-requisites when required.10 Colleges must follow statewide cutoff scores
for placement into certain introductory courses such as intermediate algebra or freshman
English composition, but are free to define the cutoffs for placement into more advanced
courses. For example, students can bypass intermediate algebra and place directly into
college algebra, a particular course analyzed in this paper, provided they meet the college-
specific cutoff score.8The Florida statute also stipulates a minimum of 2.0 un-weighted GPA for DE vocational courses. Vocational DE
students are a small and distinct group of DE students, with very few combining both vocational and academic courses.Unfortunately, a separate RD analysis on DE vocational is not feasible due to small sample sizes.
9The only difference between DE and regular college students is that DE students whose placement CPT score isbelow the state minimum required score for ‘college-readiness’ (defined in Rule 6A-10.0315) are not allowed to enroll inremediation. Remedial as well as physical education courses are excluded from the DE program.
10The Florida College Entry Level Placement Test, known as CPT, is a computer adaptive test developed by the CollegeBoard at the request of the Florida Department of Education to establish common standards across community colleges.Students are allowed to substitute a CPT score with appropriate SAT or ACT scores.

CHAPTER 2. DUAL ENROLLMENT PROGRAMS 42
Students can only take DE from their local community college.11 Each community
college has agreements with the school districts in its attendance area laying out the re-
quirements for participation. I compiled DE agreements and college catalogs for the rel-
evant years to this study. Most colleges set their GPA requirements at the minimum 3.0
required by statute. The statute also allows districts and colleges to make exceptions to the
GPA requirement or set additional admission criteria for participation if those are written
on their inter-institutional articulation agreement. The exceptions are often granted on a
case-by-case basis based on a joint decision between the college DE coordinator and the
high school counselor or principal. The most common additional admission requirement
is a letter of recommendation from the teacher or counselor (about 65% of the districts ac-
cording to Florida board of Education 2003), with only a few colleges placing restrictions
on students’ age or grade level.
A standard DE application process involves close interaction between students and the
high school counselor. Based on students’ scores and career goals, counselors help students
make an appropriate course selection and complete the application form. The form is typi-
cally a one-page document with students’ information, the course selected, and a statement
(often signed by the high school counselor) of the current GPA and CPT scores. Students
and parents sign the application and allow the release of students’ scores and high school
transcript to the college. After the application form is submitted, the student is considered
a college student and is subject to the same standards as a regular matriculated student.
2.3 Data
This study uses data from the Florida Department of Education, which includes all pub-
lic school students in the 2000-01 and 2001-02 high school senior cohorts, and tracks their11Some four-year colleges offer DE but these courses are not subsidized by the state and participation is very low.

CHAPTER 2. DUAL ENROLLMENT PROGRAMS 43
postsecondary outcomes in the state’s public system through summer 2007. State’s admin-
istrative records provide transcript information on all the courses taken in high school and
college along with their grades. The data contain basic demographic characteristics such as
gender, race, English language proficiency, and free lunch eligibility, as well as students’
10th grade state standardized test scores (FCAT), and college placement test scores. State
records on postsecondary enrollment (though not degree attainment) are complemented
with the National Student Clearinghouse data, which tracks postsecondary enrollment of
students as they enroll in out-of-state colleges or in private institutions.12 Last, district
characteristics such as median income and urbanicity are obtained from the 2000 Common
Core Data and decennial Census.13
There are two key features of the data that are particular relevant for a study of DE.
First, the data tracks individual students as they transition from high school to college. Most
previous studies on DE use college transcript records, and therefore restrict the analysis to
students that go to college. Given that DE might change the composition of students that
go to college, limiting the sample to college-goers induces sample selection bias, though
the direction of this bias is unclear. Not only might DE students that go to college be
different than those DE students who do not, but they might also be different to non-DE
students who go to college without the program’s help. Second, the data contain a unique12Since Clearinghouse data are limited to enrollment, degree attainment is only identified for students who enrolled in
Florida’s public higher education system. In order to address this missing data problem, I follow the standard approachof imputing zero when students have no postsecondary records. This approach would induce bias in an RD estimationif students that barely pass the DE eligibility cutoff were disproportionately more likely to attend college out-of-state orin one of Florida’s private institutions than students who barely fail the cutoff. However, I show that the probability ofenrolling outside Florida’s public postsecondary sector does not significantly change at the DE eligibility cutoff (Table2.4). In addition, the number of students that would be incorrectly classified as not having a college degree is likely tobe small since only 7.7% of the students in the full sample went to college outside Florida and 4.5% attended a Floridaprivate institution.
13This study uses the same cohort of students as Karp et al. (2009) but employs an augmented dataset that includes 10th
grade standardized test scores (FCAT), college placement tests, and clearinghouse data. In addition, the data in this papertracks students for two years longer into college, allowing sufficient time to evaluate the effect of DE on college degreeattainment. I follow, however, different sample restrictions: I a) define DE as students who took at least one academic DEcourse (i.e., not vocational courses), b) identify DE using college transcripts instead of the high school transcript (whichmatch on about 75% of the DE courses), c) restrict to public school students with the entire high school education inFlorida (grades 10th through 12th) in order to accurately calculate the cumulative GPA.

CHAPTER 2. DUAL ENROLLMENT PROGRAMS 44
identifier for DE courses, and indicates their location (high school or college campus) and
type (academic or vocational). Identifying DE students, let alone the course location or
type, is often challenging when only college transcripts are available. This is because not
all students transfer their DE credits, and when they do, credits are recorded as transfer-
credits, requiring high school graduation dates (not always available in college transcripts)
to accurately identify DE credits.
I collected GPA eligibility requirements for DE from the inter-institutional articula-
tion agreements between the districts and colleges, personal communication with DE co-
ordinators, or directly from the college catalogs for the years relevant for the study. The
CPT cutoff scores for placement into the college algebra course are obtained from the
college catalogs and, when missing, augmented with state documentation on placement
scores.14Appendices A.1. and A.2. provides a list of requirements by college.
I examine the effect of DE with two separate RD analyses. The first analysis mea-
sures the effect of taking at least one academic DE course (regardless of the subject area),
exploiting the general GPA eligibility requirement for participation in the program.15 A
course is considered academic if it counts towards the requirements of an associate degree,
as opposed to vocational courses that are only applicable towards certificates. I focus on
participation in 12th grade since that is when most of the DE experience takes place: 82%
of DE students take a DE course in their senior year.16,17 It is important to highlight that,14http://www.fldoe.org/articulation/pdf/acc_102506ada.pdf, Appendix B (retrieved on April 30th, 2009). This survey-
based information was collected by the Florida Department of Education in 2006. To the extent cutoff scores changedbetween 2000 and 2006, the college would be excluded from the analysis due to no discontinuity in participation atthe mis-specified cutoff. Visual inspection of the data, however, rules out strong evidence consistent with the use ofalternative cutoffs in all but one college whose cutoff was changed accordingly.
15I exclude academic DE courses taken at the state university system, at special education centers, or taken on a full-time basis (i.e., early enrollments). Only about 0.7% of all DE courses are not directly offered by a community collegeand about 2.5% are early enrollments. These courses are typically subject to different eligibility requirements. DE courseswith missing enrollment date are also excluded.
16The data does not provide enough variation in course taking patterns to identify the effect of taking DE at differenttimes in high school (e.g., junior vs. senior year). Most of DE students take DE exclusively in 12th grade (about 55%),with the majority of the remaining students taking both in 11th and 12th grade. .
17One potential drawback of the data is that it only includes the cohort of students who persisted to the 12th grade,but does not include data on earlier dropouts. To the extent that previous DE experience contributed to early dropout

CHAPTER 2. DUAL ENROLLMENT PROGRAMS 45
despite “treatment” being defined as “any course”, this analysis only captures variation in
DE participation that is generated by the GPA cutoff requirements, largely excluding valu-
able information about other courses that have additional (test) requirements. While most
college courses do not have a test requirement, a few (typically math, English, and some
science courses) do. I refer to this analysis as the effect of “DE-basic”.
The second RD analysis examines the effect of taking one particular challenging DE
course, college algebra, which covers topics such as graphing functions and solving sys-
tems of equations and is the first course in the math sequence that counts towards the state
requirements for an associates degree. This analysis exploits the course-specific CPT math
score requirement for participation.18 One limitation of the placement test data is that for
the cohorts used in this study, the state only kept a record of a student’s highest score (if the
test was taken multiple times) and did not collect information about the test date, making
it impossible to infer whether the test was used for eligibility in high school or college. As
I discuss further in Section 2.4.7, students whose score was not used for eligibility do not
generate variation in DE participation and thus are not a concern to the identification. In
addition, by examining the density of the score, I show no evidence of “re-testing bias”
being present in the sample analyzed. Because of the absence of test-date information, I
define treatment as either taking the DE-algebra in 11th or 12th grade, covering 93% of all
course takers.
This paper measures the effect of DE on several academic outcomes. The first outcome
of interest is high school graduation, which includes any type of diploma offered in Florida
(regular or special education diplomas, certificate of completion, and GED). Second, I
examine the effect of DE on college access using two measures: whether students enroll
behavior, the estimation of the effect of DE will be biased. However, the incidence of DE before 12th grade is low (lessthan 6% of all students), and it is unlikely that at-risk students would be on the margin of eligibility for DE since academicrequirements for participation are relatively high.
18While students are allowed to substitute CPT scores with appropriate SAT or ACT scores, I only exploit the variationin participation that comes from the CPT test because that is the test where most of the variation in participation at thecutoff is observed.

CHAPTER 2. DUAL ENROLLMENT PROGRAMS 46
in college (either 2-year or 4-year) after high school graduation and whether they first
enroll in a 4-year college. College access is observed for all students regardless of their
choice of public vs. private or in- vs. out-of-state institution, owing to the National Student
Clearinghouse data. Last, I examine the effect of DE on college success as measured by
the likelihood of obtaining an associate’s degree (AA), a bachelor’s (BA) degree, or either
AA or BA, within a 5-year window from the year the high school cohort was expected
to start college. The empirical approach in this paper is to include in the sample all high
school students and assign a zero on college degree outcomes for students that do not go
to college. The effect on college degree outcomes represent an overall effect of DE a
combined effect given the effect on college-going and given improvements in academic
performance.
Table 2.1 shows descriptive statistics broken down by DE participation. DE is a vol-
untary program, and participants are very different than non-participants. DE students are
more likely to be female, white, native English speakers, and come from economically
advantaged households (as proxied by free/reduced price lunch status) when compared to
non-DE students. DE students also have a stronger academic preparation than non-DE stu-
dents according to their 10th grade standardized scores in both reading and math and high
school GPA. Given these differences, it is not surprising that DE students are more likely
to experience positive postsecondary education outcomes than non-DE students. They are
about 30 percentage points more likely to enroll in college after high school and 25 percent-
age points more likely to first enroll in a 4-year institution. DE students also have a lower
incidence of college remediation and earn college degrees at significantly higher rates than
non-DE students.

CHAPTER 2. DUAL ENROLLMENT PROGRAMS 47
Table 2.1: Descriptive Statistics of Dual Enrollment Participants and Non-participants

CHAPTER 2. DUAL ENROLLMENT PROGRAMS 48
2.4 Econometric Framework: Sequential RD design
This section presents the sequential RD framework, which extends the standard RD
framework to the case where participation in a subsequent treatment also changes discon-
tinuously at the cutoff but participants only take one of the treatments. While the standard
RD design is appropriate to estimate the effect of DE-basic or the effect of DE-algebra
on pre-college outcomes, the sequential RD design is appropriate to estimate the effect of
DE-algebra on college outcomes.
The section starts with a simple example to convey the intuition behind the approach,
followed by a formal treatment of the RD design.
2.4.1 Intuition Behind the Approach
Suppose that student participation is determined by the value of their score. Students
can be divided into 3 groups: Always-takers participate in DE whether their score is below
or above some cutoff z0; never-takers do not participate, irrespective of their score; compli-
ers participate if their score is above the cutoff and do not participate if their score is below
the cutoff. Suppose that there are 40% never-takers, 40% always-takers, and 20% compli-
ers in the population. In addition, suppose that the average effect of DE on compliers is
to increase their college graduation rates from x to y. Then Figure 2.1 plots the data that
would be used by a researcher to infer the effect of DE.
The left panel in the figure shows participation rates in DE as a function of a score. The
jump of 20 percentage points is explained by the proportion of compliers in the population.
The middle panel shows college graduation rates as a function of the score. Given the
assumption that the outcome changes continuously in the score, then the jump in outcome
at the cutoff ∆Y must be driven by compliers. In particular,

CHAPTER 2. DUAL ENROLLMENT PROGRAMS 49
.2.4
.6.8
z0 Score
Participation rate
.2.4
.6.8
z0 Score
(One-treatment case)
College graduation rate
.2.4
.6.8
z0 Score
(Two-treatment case)
College graduation rate
Figure 2.1: Example
∆Y = P(C)× τC = .2× .5 = .1
where the proportion of compliers (or jump in participation) is P(C) = .2 and where the
effect of DE on compliers is τC = y− x = .5. In practice, the researcher can obtain the
effect of DE on compliers by dividing the jump in outcome by the jump in participation,
τC =∆Y
P(C).
The above is the standard RD estimate and it is sufficient in this paper to estimate the
effect of DE on pre and post college outcomes as well as the the effect of DE-algebra on
pre-college outcome.
Next, consider the objective of estimating the effect of DE-algebra on post-college out-
comes. The issue is that the cutoff z0 is also used for eligibility to take algebra while in
college. Therefore, there is a further jump in the outcome at the cutoff that is now driven by
never-takers of DE that benefit from taking algebra as college students. For example, sup-
pose that 25% of never-takers are “compliers in the second treatment”, meaning that they
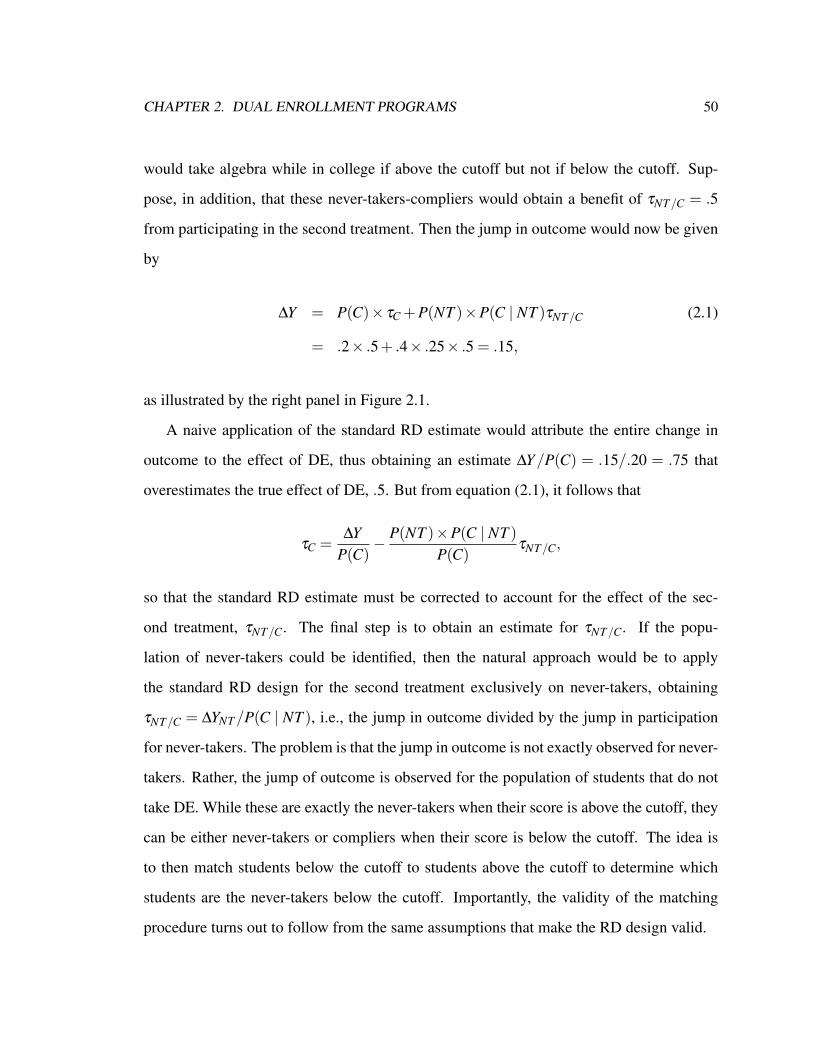
CHAPTER 2. DUAL ENROLLMENT PROGRAMS 50
would take algebra while in college if above the cutoff but not if below the cutoff. Sup-
pose, in addition, that these never-takers-compliers would obtain a benefit of τNT/C = .5
from participating in the second treatment. Then the jump in outcome would now be given
by
∆Y = P(C)× τC +P(NT )×P(C | NT )τNT/C (2.1)
= .2× .5+ .4× .25× .5 = .15,
as illustrated by the right panel in Figure 2.1.
A naive application of the standard RD estimate would attribute the entire change in
outcome to the effect of DE, thus obtaining an estimate ∆Y/P(C) = .15/.20 = .75 that
overestimates the true effect of DE, .5. But from equation (2.1), it follows that
τC =∆Y
P(C)− P(NT )×P(C | NT )
P(C)τNT/C,
so that the standard RD estimate must be corrected to account for the effect of the sec-
ond treatment, τNT/C. The final step is to obtain an estimate for τNT/C. If the popu-
lation of never-takers could be identified, then the natural approach would be to apply
the standard RD design for the second treatment exclusively on never-takers, obtaining
τNT/C = ∆YNT/P(C | NT ), i.e., the jump in outcome divided by the jump in participation
for never-takers. The problem is that the jump in outcome is not exactly observed for never-
takers. Rather, the jump of outcome is observed for the population of students that do not
take DE. While these are exactly the never-takers when their score is above the cutoff, they
can be either never-takers or compliers when their score is below the cutoff. The idea is
to then match students below the cutoff to students above the cutoff to determine which
students are the never-takers below the cutoff. Importantly, the validity of the matching
procedure turns out to follow from the same assumptions that make the RD design valid.

CHAPTER 2. DUAL ENROLLMENT PROGRAMS 51
2.4.2 Setup
During high school, students obtain a score that determines eligibility to participate in
a DE course. As explained earlier, the score may be either the cumulative GPA or the
score on the CPT. Given their score, some students participate in DE and some do not. In
addition, some of these students end up going to college. Those students that end up going
to college but did not participate in DE now have the option of taking the course in college.
This second chance to take the course corresponds to a second treatment intended for those
students that did not participate in the first treatment. The goal of the framework introduced
in this section is to show how the effect of DE can be disentangled from the effect of the
second treatment.
Following Rubin’s (1974), a student is represented by a vector of potential outcomes
Y = (Y H1 ,Y H
0 ,YC1 ,YC
00,YC01), a real-valued random score Z, random participation functions
DH : Z→{0,1} and DC : Z→{0,1}, and a vector of covariates X . A student’s high-school
outcome is given by Y H1 if she participates in DE and by Y H
0 if she does not. In what follows,
the high-school outcome will be equal to 1 if the student goes to college and 0 otherwise.
If the student participates in DE and goes to college, then her college outcome is YC1 . The
college outcome of a student that does not participate in DE and that attends college is YC01
if she decides to participate in the second treatment and YC00 if she does not. In what follows,
the college outcome will be equal to 1 if, conditional on attending college, a student would
have finished college (i.e., obtained a college degree), and will be equal to 0 otherwise.
The random participation functions indicate whether the student would participate in the
first (DH) and second (DC) treatments depending on her score Z. In general, participation
in a treatment depends not only on the student’s desire to participate but also on eligibility
criteria and possible exceptions to such criteria.

CHAPTER 2. DUAL ENROLLMENT PROGRAMS 52
The researcher does not observe the potential outcomes. However, the researcher ob-
serves whether a student enrolls in college and whether she finishes college. Let
Y H(z) = DH(z)Y H1 +
(1−DH(z)
)Y H
0 (2.2)
indicate whether a student with score z goes to college. Similarly, let
Y ∗(z) = DH(z)Y ∗1 +(1−DH(z)
)Y ∗0 (z) (2.3)
indicate whether a student with score z finishes college, where
Y ∗1 = Y H1 YC
1
indicates whether a student that participates in DE finishes college (an event that occurs if
the student both goes to college and graduates from college), and where
Y ∗0 (z) = DC(z)Y H0 YC
01 +(
1−DC(z))
Y H0 YC
00 (2.4)
indicates whether a student with score z that does not participate in DE finishes college (an
event that depends on whether the student participates in the second treatment or not).
Suppose that there are n individuals drawn randomly from a population (Y,DH(·),
DC(·),Z,X). The researcher only observes (Z,DH(Z),DC(Z),Y H(Z),Y ∗(Z)): the score,
participation in each of the two treatments, and whether the student enrolled in college and
graduated from college. The main objective is to estimate the effect of partipation in DE
(the first treatment) on both high-school and college outcomes.
The standard RD design suffices for cases where the outcomes occur before the second
treatment or where the score that determines eligibility in the first treatment does not affect
eligibility in the second treatment (i.e., GPA sample and pre-college outcomes in CPT

CHAPTER 2. DUAL ENROLLMENT PROGRAMS 53
sample). The more general sequential RD design is necessary, however, for cases where
the above conditions do not hold (i.e., college outcomes in CPT sample).
2.4.3 Assumptions
The validity of the research design depends on the following assumptions.
Assumptions. There exists a cutoff score z0 and ε > 0 such that
A1: (Instrument) For all ω ∈ [z0− ε,z0 + ε], the joint distribution of (Y,DH(ω),
DC(ω),X) conditional on Z = z0 is the same for all z ∈ [z0− ε,z0 + ε].
A2: (Monotonicity) For all realizations of DH(·) and DC(·) and for all z,ω ∈ [z0−
ε,z0 + ε] such that z≥ ω ,
DH(z)≥ DH(ω) and DC(z)≥ DC(ω).
A3: (Discontinuity) For all ε such that 0 < ε < ε ,
Pr(DH(z0 + ε) = 1,DH(z0− ε) = 0 | Z = z0
)> 0.
Assumption A1 is the standard assumption that requires the score, Z, to be a valid
instrument (Angrist et al. 1996) for scores near a cutoff score z0 (Hahn et al. 2001). An
equivalent statement of Assumption A2 is that each student is characterized by two random
personal cutoffs, one for each treatment: A student participates in a treatment if and only
if her score is above her personal cutoff for that treatment. Finally, assumption A3 requires
a discontinuity in the participation for the first treatment. In other words, the assumption
requires that for some fraction of the population the personal cutoff for treatment 1 is at z0,
so that the eligibility cutoff for participation is binding.

CHAPTER 2. DUAL ENROLLMENT PROGRAMS 54
Sections 2.5.1 and 2.5.2 provide evidence that the conditions imposed by A1 and A3
that are testable are satisfied in the data. On the other hand, A2 is untestable, since the
researcher does not observe whether a student would have participated with a different
score. This assumption rules out the existence of students who would take (either) treatment
if ineligble but not take it if eligible, which appears to be reasonable in this empirical
application.19
2.4.4 Deriving the Sequential RD Estimand
The standard RD design exploits assumptions A1 and A3 above: Since participation
is discontinuous at the cutoff but potential outcomes are continuous, then any change in
outcome around the cutoff must be attributed to changes in the treatment. The role of
assumption A2 is to obtain an estimate of the effect of taking the treatment on a population
of interest. The assumptions play a very similar role in the sequential RD design introduced
in this paper. The important difference is that now a change in outcome may also be the
result of participation in the second treatment.
Fix any ε such that 0 < ε < ε . For simplicity in the notation, a + subscript is used
whenever a function is evaluated at z0 + ε and a − subscript is used whenever a function is
evaluated at z0−ε (e.g., DH+ = DH(z0+ε) and DH
− = DH(z0−ε)). In addition, the notation
D̄H and D̄C is introduced to denote the vector of participation indicators below and above
the cutoff, i.e., D̄H =(DH−,D
H+
)and D̄C =
(DC−,D
C+
). Finally, let D̄ =
(D̄H , D̄C) be the type
of a student in the population.
Using the previous notation, it follows that19This assumption would be violated if, for example, it is easier to get an exception as a high school student than as a
college student. If true, then a highly sophisticated, well-informed, and forward-looking student with a score just belowthe cutoff would attempt to take the course as DE, even if taking it in college is strictly preferred. There are two reasonswhy this situation is, however, unlikely. First, as can be seen in Figures 2.3 and 2.7, the data shows that exceptions wherestudents below the cutoff are allowed to participate in either one of the two treatments are generally low and equallylikely in high school and college. Second, what appears to be exceptions in the CPT sample are likely to be explained bythe use of an alternative test.

CHAPTER 2. DUAL ENROLLMENT PROGRAMS 55
Table 2.2: Relevant Student TypesType D̄ = (DH
−,DH+,D
C−,D
C+) z0− ε z0 + ε Change
(0,1,0,0) Y H0 YC
00 Y ∗1(0,1,0,1) Y H
0 YC00 Y ∗1 Y ∗1 −Y ∗0−
(0,1,1,1) Y H0 YC
01 Y ∗1(0,0,0,1) Y H
0 YC00 Y H
0 YC01 Y H
0 (YC01−YC
00)
E[Y ∗+ | z0 + ε
]−E
[Y ∗− | z0− ε
]=
= E[DH+
(Y ∗1 −Y ∗0+
)+Y ∗0+ | z0 + ε
]−E
[DH−(Y ∗1 −Y ∗0−
)+Y ∗0− | z0− ε
]= E
[DH+
(Y ∗1 −Y ∗0+
)+Y ∗0+−DH
−(Y ∗1 −Y ∗0−
)−Y ∗0− | z0
]= E
[(DH+−DH
−)(
Y ∗1 −Y ∗0−)+(1−DH
+
)(Y ∗0+−Y ∗0−
)| z0]
= E[(
DH+−DH
−)(
Y ∗1 −Y ∗0−)+(1−DH
+
)(DC+−DC
−
)Y H
0
(YC
01−YC00
)| z0
]= Pr
(D̄H = (0,1) | z0
)E[Y ∗1 −Y ∗0− | D̄H = (0,1),z0
]+Pr(D̄ = (0,0,0,1) | z0)E
[Y H
0
(YC
01−YC00
)| D̄ = (0,0,0,1),z0
], (2.5)
where the first line follows from equation (2.3), the second from A1, the third by adding
and subtracting DH+Y ∗0−, the fourth from equation (2.4), and the last line from A2.
Equation (2.5) has a straightforward interpretation. The left hand side of equation (2.5)
is the difference in (college) outcome for students with scores slightly to the right of the
cutoff z0 compared with students slightly to the left of the cutoff. For most student types,
being slightly to the right or to the left of the cutoff will not make a difference in outcomes,
since participation of these types is not affected for either treatment and outcomes are

CHAPTER 2. DUAL ENROLLMENT PROGRAMS 56
continuous around the cutoff. However, as illustrated in Table 2.2, there are four types of
students for which the outcome may change due to changes in participation.
First, types that are characterized by D̄H = (0,1) participate in DE if above the cutoff
but do not participate if below the cutoff. In the case of no participation, the outcome
is determined by whether the student participates or not in the second treatment: Types
D̄ that are either (0,1,0,0) or (0,1,0,1) have the property that DC− = 0, and therefore
their outcome below the cutoff is the outcome of no participation in either treatment. For
type (0,1,1,1), the outcome below the cutoff is participation in the second treatment. In
particular, the formula takes into account that type (0,1,1,1) would have taken the second
treatment had it not been eligible to participate in DE. As shown in Table 2.2, the difference
in outcome of these three types with D̄H = (0,1) corresponds to the first term in the last
line of equation (2.5).
In addition, one needs to take into account that the change in outcome may be driven
by those students that do not participate in DE but that participate in the second treatment
if above the cutoff and do not participate otherwise. These students are those of type
D̄ = (0,0,0,1) in Table 2.2, and they correspond to the second term in the last line of
equation (2.5).
Finally, equation (2.5) and A3 imply that the estimand of interest (to be interpreted in
the next subsection) can be written as
E[Y ∗1 −Y ∗0− | D̄H = (0,1),z0
]=
E[Y ∗+ | z0 + ε
]−E
[Y ∗− | z0− ε
]Pr(D̄H = (0,1) | z0)
−Pr(D̄ = (0,0,0,1) | z0)E
[Y H
0(YC
01−YC00)| D̄ = (0,0,0,1),z0
]Pr(D̄H = (0,1) | z0)
. (2.6)
A special case of this formula occurs when there is no second treatment, i.e., when
participation in the second treatment does not jump at z0 for those that do not participate
in DE, so that Pr(D̄ = (0,0,0,1)) = 0 | z0) and therefore the second term in the right hand

CHAPTER 2. DUAL ENROLLMENT PROGRAMS 57
side of equation (2.6) disappears. The resulting formula is then the standard RD formula.
In this paper, this is the case for the GPA analysis (since the GPA determines eligibility to
participate in the first treatment but not in the second treatment). It is also the case for those
outcomes that are observed before the first year in college (such as enrollment in college)
for the analysis using the CPT.
The more general formula is relevant for evaluating outcomes such as college gradua-
tion for the CPT analysis, since in that case the score is used to determine eligibility both
in the first and second treatments. The “bias” term corresponds to the effect of the second
treatment, given by the second term on the right hand side of equation (2.6).
If those students of type D̄H = (0,0) could be identified in the population, then a nat-
ural solution would be to restrict attention to that population and conduct the standard RD
design exclusively for the second treatment, where the outcomes are now given by Y ∗0 .
Calculations similar to those that led to equation (2.5) would then establish that
E[Y ∗0+ | z0 + ε, D̄H = (0,0)
]−E
[Y ∗0− | z0− ε, D̄H = (0,0)
]=
= Pr(
D̄C = (0,1) | z0,DH = (0,0))
E[Y H
0
(YC
01−YC00
)| z0, D̄ = (0,0,0,1),z0
](2.7)
Using (2.7) to rewrite the “bias” term in equation 2.6, the general formula becomes
E[Y ∗1 −Y ∗0− | D̄H = (0,1),z0
]=
E[Y ∗+ | z0 + ε
]−E
[Y ∗− | z0− ε
]Pr(D̄H = (0,1) | z0)
−Pr(D̄H = (0,0) | z0
)Pr(D̄H = (0,1) | z0)
(E[Y ∗0+ | z0 + ε, D̄H = (0,0)
]−E
[Y ∗0− | z0− ε, D̄H = (0,0)
]).(2.8)
Equation (2.8) shows that the estimand of the effect of DE can be written as the sum of
two terms. The first term is the standard RD term and it can be obtained by measuring the

CHAPTER 2. DUAL ENROLLMENT PROGRAMS 58
outcome above and below the cutoff and dividing it by the jump in participation in the first
treatment, given by Pr(D̄H = (0,1) | z0
). Part of the second term, however, is not readily
available in the data. The researcher observes the outcome above the cutoff for those that
do not to participate in DE, which, by A2, satisfies
E[Y ∗0+ | z0 + ε,DH(z0 + ε) = 0
]= E
[Y ∗0+ | z0 + ε, D̄H = (0,0)
], (2.9)
However, the researcher does not directly observe
E[Y ∗0− | z0− ε, D̄H = (0,0)
].
Instead, the researcher observes the outcome below the cutoff for those that do not partici-
pate in DE, which, by A2, satisfies
E[Y ∗0− | z0− ε,DH(z0− ε) = 0
]= E
[Y ∗0− | z0− ε, D̄H = (0,0) or D̄H = (0,1)
],
While students of type D̄H = (0,0) can be perfectly identified above the cutoff (equation
(2.9)), the goal of the estimation procedure is to identify the students that are below the
cutoff and do not participate in DE that are of type D̄H = (0,0) rather than D̄H = (0,1).
This goal is accomplished by matching students above the cutoff which are known to be
of type D̄H = (0,0) with students below the cutoff in terms of observable covariates X .
There are two differences between the standard application of matching estimation in the
literature (Imbens 2004) and the procedure conducted in this paper. First, the validity of
the estimation procedure is justified by the standard RD assumption A1: Whether a student
falls slightly below or above the cutoff is random, so that the distribution of observables X
for type D̄H = (0,0) is the same whether students of such a type are below or above the
cutoff. Second, the researcher observes the proportion of students below the cutoff that are

CHAPTER 2. DUAL ENROLLMENT PROGRAMS 59
of type D̄H = (0,0) as opposed to D̄H = (0,1). This information can be used to aid in the
matching of students.
2.4.5 Policy interpretation of the RD estimand
In the standard (one-treatment) RD design, the estimand of the effect of DE is
E[Y ∗1 −Y ∗0 | D̄H = (0,1),z0
],
where Y ∗0 = Y ∗0+ = Y ∗0− does not depend on the score because there is no second treatment.
The estimand represents the average effect of DE on the population of “compliers”, D̄H =
(0,1), with a score at the cutoff. A “complier” is a student that participates in DE if slightly
above the cutoff but does not participate if slightly below the cutoff. As is well-known,
this estimand (called “local average treatment effect”) also has a policy interpretation: It
measures the average change in outcome from slightly decreasing the eligibility cutoff z0
evaluated for the population that is affected by such a policy change.
In the sequential RD design, the estimand of the effect of DE is
E[Y ∗1 −Y ∗0− | D̄H = (0,1),z0
].
This estimand also has a policy interpretation: It is the average change in outcome from
slightly decreasing the eligibility cutoff z0 for DE (but keeping it constant for the second
treatment) evaluated for the population of compliers D̄H = (0,1).
There are two potential differences with respect to the standard RD policy interpreta-
tion. First, while in the standard RD case the negative of the estimand measures the effect
of an increase in the cutoff, this symmetry does not necessarily hold in the sequential RD
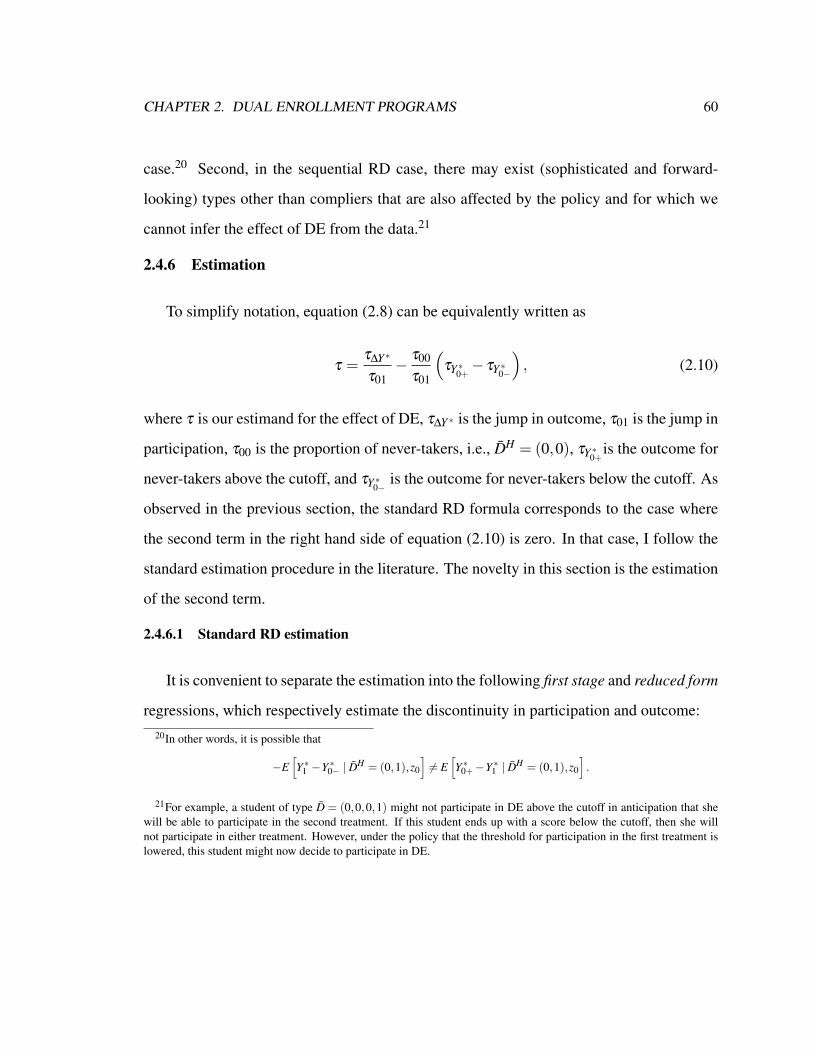
CHAPTER 2. DUAL ENROLLMENT PROGRAMS 60
case.20 Second, in the sequential RD case, there may exist (sophisticated and forward-
looking) types other than compliers that are also affected by the policy and for which we
cannot infer the effect of DE from the data.21
2.4.6 Estimation
To simplify notation, equation (2.8) can be equivalently written as
τ =τ∆Y ∗
τ01− τ00
τ01
(τY ∗0+− τY ∗0−
), (2.10)
where τ is our estimand for the effect of DE, τ∆Y ∗ is the jump in outcome, τ01 is the jump in
participation, τ00 is the proportion of never-takers, i.e., D̄H = (0,0), τY ∗0+is the outcome for
never-takers above the cutoff, and τY ∗0− is the outcome for never-takers below the cutoff. As
observed in the previous section, the standard RD formula corresponds to the case where
the second term in the right hand side of equation (2.10) is zero. In that case, I follow the
standard estimation procedure in the literature. The novelty in this section is the estimation
of the second term.
2.4.6.1 Standard RD estimation
It is convenient to separate the estimation into the following first stage and reduced form
regressions, which respectively estimate the discontinuity in participation and outcome:20In other words, it is possible that
−E[Y ∗1 −Y ∗0− | D̄H = (0,1),z0
]6= E
[Y ∗0+−Y ∗1 | D̄H = (0,1),z0
].
21For example, a student of type D̄ = (0,0,0,1) might not participate in DE above the cutoff in anticipation that shewill be able to participate in the second treatment. If this student ends up with a score below the cutoff, then she willnot participate in either treatment. However, under the policy that the threshold for participation in the first treatment islowered, this student might now decide to participate in DE.
CHAPTER 2. DUAL ENROLLMENT PROGRAMS 61
DHi = β0+β11{zi ≥ z0i}+β2 f (zi− z0i)∗1{zi ≥ z0i}+β3 f (zi− z0i)∗1{zi < z0i}+Xiδ +εi
(2.11)
and
Y ∗i = α0+α11{zi≥ z0i}+α2 f (zi−z0i)∗1{zi≥ z0i}+α3 f (zi−z0i)∗1{zi < z0i}+Xiλ +εi,
(2.12)
where i is the student, DHi is an indicator that takes the value one if the student i took a DE
course in 12th grade (or DE-algebra in 11th or 12th grade) and zero otherwise, 1{zi ≥ z0i}
(1{zi < z0i}) is an indicator that the student is above (below) their designated college cutoff
z0i, (zi− z0i) is the 11th GPA or CPT score centered around the cutoff, and Xi is a vector
of covariates including students’ gender, race, free/reduced price lunch status, 10th grade
standardized scores, cohort fixed effects, and high school level demographics.22
In the standard RD design with one treatment, the effect of DE could then be estimated
as
τ̂ =τ̂∆Y ∗
τ̂01=
α̂1
β̂1.
As explained by Imbens and Lemieux (2008), the estimator for τ can be equivalently
characterized as a two-stage least squares estimator. I estimate τ using a standard RD-IV
model
Y ∗i = γ0 + τD̂Hi + γ2 f (zi− z0i)∗1{zi ≥ z0i}+ γ3 f (zi− z0i)∗1{zi < z0i}+Xiγ + εi, (2.13)
22Controlling for additional covariates is not necessary for identification since, given A1, close to the cutoff participa-tion is “as good as” randomized (i.e., conditional on the score being close to the cutoff, other covariates are independent ofparticipation). However, just like in a pure randomized study adding controls helps improve the precision of the estimateby reducing residual variation.

CHAPTER 2. DUAL ENROLLMENT PROGRAMS 62
where D̂Hi is the predicted probability from the first stage in equation (2.11). The model
is estimated locally using data incrementally close to the cutoff following different band-
widths around the cutoff. The function f (.) is specified as quadratic and, following Imbens
and Lemieux (2008), linear when using a narrow bandwidth of the data around the cutoff.
In all specifications, standard errors are heteroskedasticity-robust and clustered at the score
level.23
2.4.6.2 Sequential RD estimation
I estimate the first term in equation (2.10) following the standard RD estimation. For
the second term, I proceed as follows. Since
Pr(D̄H = (0,0) | z0
)= Pr
(DH+ = 0 | z0
),
I use a version of the first stage equation (2.11)24 to obtain an estimate for the proportion
of never-takers around the cutoff by
τ̂00 = 1− (β̂0 + β̂1).
Based on equation (2.9), I estimate the reduced form equation (2.12) on those students
that do not take DE and get an estimate of the outcome for students slightly above the
cutoff by
τY ∗0+ = α̂0 + α̂1.
23Lee and Card (2008) recommend clustering standard errors when the variable that determines eligibility is discretesuch as the CPT. I also report clustered standard errors when using the GPA though the difference is immaterial.
24To facilitate the estimation of terms defined at the boundary of eligibility, all covariates were fully interacted with anindicator variable for the CPT above and below the cutoff and the score (centered at the cutoff).

CHAPTER 2. DUAL ENROLLMENT PROGRAMS 63
In both of the previous cases, I am careful to interact the observables X in equations (2.11)
and (2.12) with the score and an indicator for whether the score is above or below the
cutoff.25
Finally, I estimate τY ∗0− in several steps. I begin by identifying for each non-DE student
below the cutoff the closest match to a non-DE student above based on the full set of co-
variates used in the regressions. I employ the nearest neighbor matching algorithm (with
replacement) developed by Abadie, Herr, Imbens, and Drukker (2004) (Stata nnmatch rou-
tine). I then estimate the proportion of never-takers below the cutoff, which is given by
τ̂ 0000or01
=τ̂00
τ̂00or01,
where
τ̂00or01 = 1− β̂0.
Using the cumulative distribution function of students’ distance to their nearest match26,
I then identify the closest τ̂ 0000or01
% of the matches. Based on this subsample of students, I
then estimate a regression of the form
Y ∗0Mi = τY ∗0−+φ1(zi− z0i)+Xiλ + εi for zi < z0i (2.14)
to get an estimate of τY ∗0− .
The validity of the matching hinges on A1: around the cutoff students are similar and
the proportions of student-types are constant. Since the assumption holds in a narrow mar-
gin around the cutoff, I estimate (2.14) using only observations close to the cutoff (band-
width of 15 points), though I also experiment with alternative bandwidths as sensitivity25This modification is not necessary when estimating equation (2.13), since the specification is such that the disconti-
nuity does not depend on covariates, but it is important when using equations (2.11) and (2.12) to estimate a level effectthat does not depend on covariates.
26The distance is a metric that synthesizes the difference between the matched-pair vector of covariates (see Abadie etal. 2004).

CHAPTER 2. DUAL ENROLLMENT PROGRAMS 64
checks. The drawback of the selection criterion is that, in practice, the differences in ob-
servable characteristics of student-types are likely to be smooth over the support of the
matching distance, and the selection criterion would misclassify some students. I deal with
this issue by using more stringent selection criterion for robustness.
Finally, I plug all the previous estimates in equation (2.10) and obtain an estimate τ̂
of the effect of DE-algebra. As opposed to the standard RD case, where standard errors
can be obtained with two-stage least squares, there is no explicit analytic solution for the
standard errors in the sequential approach. Standard errors for the Sequential RD matching
estimator are, therefore, obtained by bootstrap.27
2.4.7 Specific assumptions for the current application
While the sequential RD is general enough to be applicable to settings beyond DE, there
are two issues that deserve further scrutiny in the current application. First, the previous
setup assumes that students take the CPT exam once and that the researcher observes the
test score. In practice, students may take the exam during high school and then again during
college, and I only observe the highest score. It is not difficult to show that all the previous
results extend provided that assumption A1 is appropriately modified. In particular, (high
school and college) test scores above and below the cutoff must induce the same distribution
over participation, outcomes, and additional test scores.28 The sequential RD estimate now
measures the effect of DE on the (as usual, unobserved) population of compliers whose
observed test scores are the high school test scores. The reason is that the changes in27The implementation of the bootstrapping consists of re-sampling the data (randomly with replacement) N times
and re-estimating the results in each bootstrap draw. To estimate the last term in the equation, each draw selects asubsample of the matched-identified sample. The mean and standard deviation of these estimates approximates thesampling distribution of the population parameter of interest. Given the small sample of observations in each CPT score,it is not feasible to accommodate a clustered resampling in the bootstrap estimation.
28For example, students that take the test while in high school could be different than those that take it in college. Theymight have different unobserved academic motivation or a different CPT score if there is an age-effect in test outcomes.However, as long as these factors do not induce differential sorting of students around the cutoff (such as older studentssystematically scoring just above the cutoff), they do not pose a threat to the RD internal validity.

CHAPTER 2. DUAL ENROLLMENT PROGRAMS 65
participation and outcomes at the cutoff are exclusively driven by students whose observed
test scores are the actual high school test scores.
Second, not all colleges in the selected samples have the same cutoff scores. Different
cutoffs, however, do not present a challenge for an RD identification strategy. The reason
is that that students in Florida are required to take DE courses sponsored by their local
community college, therefore avoiding concerns about self-selection bias associated with
students choosing DE courses at colleges based on their cutoff policies. But the pooling of
colleges with different cutoffs to provide an estimate of the effect of DE implicitly assumes
homogeneity of the treatment effect for students on the margin of those different cutoffs.
2.5 Validity of the RD Design
In this section, I assess the validity of applying the RD design of Section 2.4 to the data.
First, I select the sample of colleges that exhibit a significant discontinuity in participation
in DE at the GPA cutoff (GPA sample) and in DE-algebra at the CPT cutoff (CPT sam-
ple). I then examine the validity of using GPA and CPT eligibility as an instrument in the
selected samples. Finally, I consider evidence of other treatments that may be affected by
the same eligibility criteria as DE. The conclusion is that the standard RD-IV strategy is
appropriate for all outcomes under the GPA analysis and for pre-college outcomes under
the CPT analysis, but that the Sequential-RD strategy is needed for post-college outcomes
under the CPT analysis.
2.5.1 Discontinuity: the GPA and CPT Samples
While an RD approach requires participation in DE to jump at the cutoff (see A3 in
Section 2.4.3), I find that, for most colleges, there is no evidence of discontinuity.29 To29The lack of discontinuity in participation at the official cutoffs in most colleges may be due to a number of factors.
First, since colleges typically base admission decisions on the GPA as reported by the high school counselor in students’DE application form, any discrepancy between this self-reported GPA and the actual GPA in the transcripts (e.g., dueto rounding of GPA decimals points) would tend to attenuate the discontinuity estimates. Another plausible explanation
CHAPTER 2. DUAL ENROLLMENT PROGRAMS 66
avoid confounding an increase in participation at the cutoff with random noise, I restrict
the analyses to those colleges that show a discontinuity that is significant and robust across
bandwidth choice and model specification. Specifically, for each treatment (DE-basic and
DE-algebra), I estimate a linear probability model of participation in 12th grade as a func-
tion of the score (11th grade cumulative high school GPA30 and CPT math score, respec-
tively) on an eligibility indicator (to capture the jump) using data incrementally close to the
cutoff (within 0.5/0.4/0.3 GPA points, and 40/20/10 CPT points around respective cutoffs),
controlling for a quadratic function of the score (linear in smaller bandwidths) which is
allowed to vary on either side of the cutoff.
The discontinuity in DE as a function of the GPA is estimated conditional on having
a college placement test, reflecting the fact that students need to present placement scores
as part of their DE application regardless of the course subject in which they intend to
enroll. In theory, students willing to take DE-algebra are required to have an eligible GPA
in addition to a passing CPT math score. In practice, however, the CPT math score cutoffs
are sufficiently high that most students with scores around those cutoffs have an eligible
GPA. Thus, I estimate the discontinuity in DE-algebra using only the CPT math score, and
show in the robustness section that results are not sensitive to considering both criteria. The
findings are reported in Tables 2.9 and 2.10 in the appendix.31
relates to Florida’s severe overcrowding problem during this time period exacerbated by class-size reduction pressures.DE was regarded as an effective strategy to alleviate overpopulated classrooms (Florida Board of Education 2003) anddistricts and colleges may have waived GPA requirements to rapidly increase DE participation. The lack of discontinuityin DE-algebra in some colleges may also be attributed to the fact that some colleges have additional testing requirementsabove and beyond the CPT for direct placement into algebra (e.g., the College Level Math test a score not available inthe data). While students may be using SAT or ACT scores instead of CPT scores in their DE application, using the CPTscore for students that took multiple tests would not prevent detecting sizeable discontinuities as long as the CPT test isused for eligibility for a fraction of students and CPT barely failers are not SAT/ACT barely passers or vice-versa.
30Since the largest DE enrollment occurs in the fall semester of students’ senior year, I use the cumulative 11th gradeGPA up through the summer before the senior year to determine eligibility for 12th grade courses. High schools withnon-standard academic calendars were normalized to a semester calendar (fall, spring, summer) in the calculation ofGPA. An un-weighted GPA was used for all but 3 colleges that indicated the use of weights to determine DE eligibility.Weighted GPA was calculated using 1 additional grade-point for AP, IB, DE, and Honors courses, following the mostfrequent weighting scheme reported by districts (Florida Board of Education 2003).
31Since students in a given district can only take DE from the local community college, the discontinuity is estimatedby college attendance area.

CHAPTER 2. DUAL ENROLLMENT PROGRAMS 67
I select colleges with a significant (10% confidence level) discontinuity in any two of
the three models for the main analyses, though I relax the criterion for robustness checks.
Six colleges were selected for the DE-basic analysis (hereafter “GPA sample”), and seven
colleges for the DE-algebra analysis (hereafter “CPT sample”32). Overall, the analyses use
data from 11 different colleges (two colleges are included in both GPA and CPT samples),
serving 42% of Florida’s 67 school districts and educating about a third of all DE students
in the state.
Figures 2.2 and 2.3 plot mean participation as a function of the score, along with the
first stage fitted values from equation (2.11) (without controlling for additional covariates).
Participation in DE-basic increases from 13% for a GPA score slightly below the eligibility
cutoff to 21% for a GPA score slightly above the cutoff.33 Participation in DE-algebra
increases from 12% for a CPT math score slightly below the eligibility cutoff to 31% for
a CPT score slightly above the cutoff. As expected, participation eventually decreases
for high CPT scores, since those students place directly into higher-level math courses.34
While exceptions to the GPA requirement below the cutoff are allowed with joint agreement
of the high school counselor and the DE college coordinator, participation in DE-algebra
below the cutoff is likely attributed to students substituting CPT scores with SAT or ACT
scores.

CHAPTER 2. DUAL ENROLLMENT PROGRAMS 68
Figure 2.2: Dual Enrollment Participation (12th grade)

CHAPTER 2. DUAL ENROLLMENT PROGRAMS 69
Figure 2.3: Dual Enrollment Algebra Participation
2.5.1.1 Descriptive Statistics for Selected Samples
Table 2.3 compares the average DE student in the GPA and CPT samples with the av-
erage student in the state. The racial composition of DE participants in the GPA sample is
quite similar to the state average, but participants in the CPT sample are slightly more likely
to be white. Despite the higher representation of minorities, DE students in the GPA sam-
ple are less likely to come from an economically disadvantaged household: 17% receive32Two colleges that use the same cutoff to determine both algebra participation and math remediation were excluded
from the main analysis. Including these colleges, however, do not materially affect the results (Section 2.7).33The discontinuity of ever taking DE is remarkably similar (0.068 with a standard deviation of 0.019). This is because
most students take DE for the first time in fall of their senior year, and the few that take DE exclusively during the springwould typically still use the 11th grade GPA for enrollment since spring applications begin before the end of the fallsemester.
34These discontinuities, despite being arguably small in magnitude, are strong instruments for DE participation. The F-test on the excluded instrument renders statistics of about 25.6 and 25.8 for DE-basic and DE-algebra, respectively—bothabove the rule-of-thumb of 10 (Stock et al. 2002).

CHAPTER 2. DUAL ENROLLMENT PROGRAMS 70
free/reduced-price lunch compared to roughly 23% in the entire state and CPT sample. Set-
ting aside differences in race and economic standing, DE students in the selected samples
are quite similar to the state average in terms of academic ability or preparation.
DE participation rates in the selected samples are significantly higher than the state
average: the percentage of high school students taking at least one DE course is 25% in the
GPA sample and 34% in the CPT sample, compared to a state average of 14%. A typical DE
student takes about 4 DE courses and earns about 10 college credits while in high school
(success rate of about 77%), with averages being similar across samples. DE-algebra is the
single most popular course among DE students after freshman English composition, with a
take-up rate of about 18%. Finally, most DE students take DE courses either at the college
and high school campuses (58%) or at the college campus (37%). Interestingly, only 5%
of DE students take DE courses exclusively at the high school campus.
2.5.2 Instrument Validity
The RD approach requires that determinants of the outcome, with the exception of the
treatment, vary smoothly around the cutoff (see A1 in Section 2.4.3). While this assumption
is at some level fundamentally non-testable, I assess whether students above and below
the cutoff are observationally similar.35 A direct assessment of the similarity of students
just above and below the cutoffs is shown in Table 2.4. The table displays discontinuity
estimates in pre-determined students’ characteristics at the GPA and CPT cutoffs using
data incrementally close to the cutoff. Overall, there is no evidence that students above the
cutoff are statistically significantly different than those below in characteristics known to
affect students’ outcomes (gender, race, English fluency, poverty, and pre-DE English and
math test scores). The last rows in the table provide two comprehensive tests which assess
whether the data are consistent with no discontinuity for any of the observed covariates.35For the sequential RD design, this assessment provides direct evidence for the validity of the matching estimation.

CHAPTER 2. DUAL ENROLLMENT PROGRAMS 71
Table 2.3: Descriptive Statistics for Dual Enrollment Participants

CHAPTER 2. DUAL ENROLLMENT PROGRAMS 72
The first one consists of testing that the predicted probability of participation given the
full set of covariates used in the regression analyses do not change discontinuously at the
eligibility cutoffs. Following Lee and Lemieux (2010), the second diagnostic is a Chi-
square test that all the covariates discontinuities are jointly zero. Both test results support
the hypothesis that students in a narrow bandwidth around the GPA and CPT cutoff are
indeed similar.
Another common concern is that highly motivated students who barely missed the cut-
off exert additional effort (or choose their courses strategically) to boost their GPA or that
they re-take the CPT exam in order to become eligible. This type of gaming behavior would
render students on either side of the cutoff who are different in unobservable ways, violat-
ing the RD assumption. A diagnostic test for this endogenous sorting of students involves
an analysis of the density of the score around the cutoff (McCrary 2008).
Figure 2.4 (top) presents the histogram for the GPA, which follows a bell-shaped density
with a spike at the number of students with an exact 3.0 GPA. This spike, however, does not
appear to be caused by endogenous sorting. By the nature of the GPA, spikes occur not only
at the 3.0 cutoff used for DE eligibility, but also at rounded GPA values that correspond to
specific letter grades such as 1, 2, 2.5, 4. In fact, the bottom graph of Figure 2.4 (placebo
sample) shows a very similar GPA distribution in schools served by the colleges where the
DE cutoff is not binding for participation.36
Figure 2.5 shows the density of the CPT score, which does not support the idea of
students re-testing the exam to become eligible for the algebra course. The estimated dis-
continuity in the empirical density is small and statistically insignificant (coefficient of
0.002 with standard error of 0.001).37 This finding is not surprising given the low stakes36McCrary’s estimate of the discontinuity (log difference in height) around the cutoff for the GPA sample and Placebo
sample is 0.28(0.03) and 0.23(0.02), respectively. This similarity alleviates concerns about teachers grading more gener-ously to make students on the margin eligible for DE.
37McCrary (2008) suggests an alternative formal test to estimate the discontinuity in the density in RD designs. UsingMcCrary’s Stata code (downloaded from his personal website), I obtained a significant discontinuity at the CPT cutoff(log difference in height=0.42, std=0.05). However, as pointed by Martorell and McFarlin (2009), McCrary test assumes

CHAPTER 2. DUAL ENROLLMENT PROGRAMS 73
Table 2.4: Discontinuity in Baseline Characteristics
involved: Students who are slightly below the CPT cutoff can enroll in a lower-level course
(intermediate algebra) which also grants college-level credits.

CHAPTER 2. DUAL ENROLLMENT PROGRAMS 74
Figure 2.4: Distribution of 11th grade High School GPA

CHAPTER 2. DUAL ENROLLMENT PROGRAMS 75
Figure 2.5: Distribution of CPT Math Score

CHAPTER 2. DUAL ENROLLMENT PROGRAMS 76
2.5.3 Discontinuity in Other Treatments
In addition to the treatment of interest, there may exist other treatments where partici-
pation is determined by the same eligibility cutoff. These other treatments may be simul-
taneous or sequential. A simultaneous treatment is one which may be taken by those that
took the original treatment and which affects the outcome of interest either because it
occurs at the same time as the treatment of interest or occurs after but before the outcome
of interest. On the other hand, a sequential treatment is one that occurs after the treatment
of interest and that is only taken by those that did not participate in the original treat-
ment. While the standard RD design is invalid both in the presence of simultaneous and
sequential additional treatments, the sequential RD design is only invalid in the presence of
simultaneous treatments. In this section, I establish the lack of simultaneous or sequential
treatments for the GPA sample (standard RD) and the lack of simultaneous but presence of
a sequential treatment for the CPT sample (sequential RD).
Table 2.4 shows that there is no evidence that schools in the GPA sample are using the
GPA eligibility cutoff that is used for DE for placement into other advanced courses such
as AP, IB, or Honors courses in high school. If anything, there is a small indication that
students with an eligible GPA substitute away from other advanced courses in their senior
year, though the effect is not significant. Similarly, participation in other advanced courses
does not change discontinuously at the CPT math cutoff score.
While the state merit scholarship (Florida Medallion Scholars Award, which pays 75%
of college tuition) is awarded to students with a 3.0 GPA or higher, eligibility is deter-
mined with a different GPA formula using selected high school courses and a particular
weighting scheme. To the extent that a 3.0 high school GPA is considered a milestone for
a continuous and well-behaved distribution along the support of the variable which does not hold in the CPT where thenumber of students “piled-up” at certain discrete values. If instead of using McCrary framework, I test the discontinuityin the empirical density at the cutoff locally, controlling for a linear term in the CPT on either side of the cutoff, theestimate is small and insignificant.

CHAPTER 2. DUAL ENROLLMENT PROGRAMS 77
college enrollment, I cannot rule out the possibility that the 11th grade GPA employed in
the analysis might by itself position students just above and just below a 3.0 GPA score
different in terms of college admissions. However, it is unlikely that this occurs since it is
common practice among selective colleges to re-calculate high school GPA using weights
for admissions decisions.
The CPT math cutoff score for DE-algebra does not determine eligibility for other likely
candidates such as college scholarship, college admissions, or college remediation. First,
the only state scholarship that requires a CPT score is a vocational scholarship (Florida
Gold Seal) but has a 72 score cutoff which is considerably lower than the 83-97 range of
scores used for placement into algebra. Second, the CPT score is only used in Florida’s
community college system for placement (not admission) purposes since these are open-
admission institutions. Four-year colleges require instead an SAT or ACT for admissions.
Third, unlike freshman English composition, the cutoff score that places students into col-
lege remediation is different than the one used for placement into college algebra.38 This
is shown in Figure 2.6 which displays enrollment patterns in math college remediation and
shows that the state-mandated cutoff score for remediation (solid line) is lower than the one
used for college algebra, which is defined by the college (range in dotted lines).
Finally, the eligibility cutoff in the CPT sample is not only used for DE-algebra but also
for college algebra, and there is a jump in participation in college algebra for college stu-
dents in their first postsecondary enrollment term (Figure 2.8).39 This jump in participation
in the second treatment motivates the need for the Sequential RD design developed in this
paper. Finally, the sequential RD framework assumes that participants in the first treatment38While conceptually remediation could be incorporated into the sequential RD framework, CPT re-testing among
students that barely fail Florida’s cutoff for remediation has been previously documented in a large number of colleges(Calcagno and Long 2008).
39Interestingly, the likelihood of students ever taking algebra once in college does not change discontinuously at thecutoff (result not shown). This is explained by the fact that ineligible students take algebra after passing the lower-levelcourse: intermediate algebra (MAT 1033). Nevertheless, taking algebra “sooner” rather than “later” in college might havean independent impact of the likelihood of obtaining a college degree.

CHAPTER 2. DUAL ENROLLMENT PROGRAMS 78
Figure 2.6: Probability of Math College Remediation by CPT Math Score
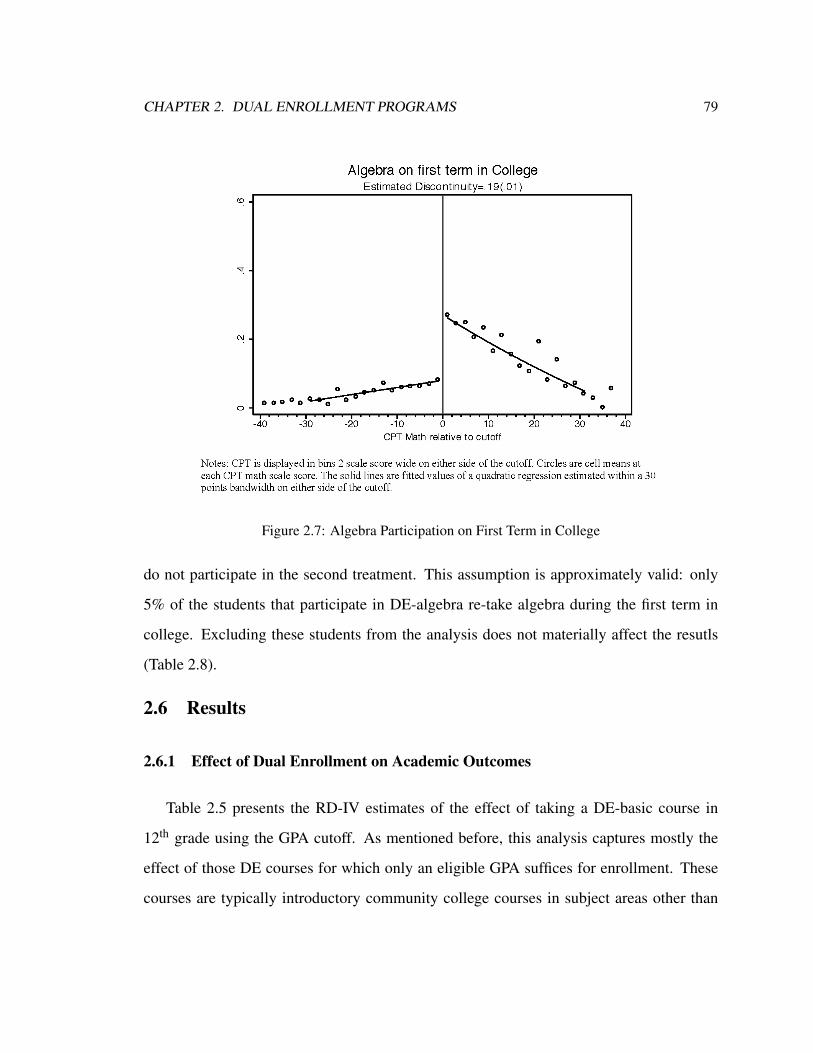
CHAPTER 2. DUAL ENROLLMENT PROGRAMS 79
Figure 2.7: Algebra Participation on First Term in College
do not participate in the second treatment. This assumption is approximately valid: only
5% of the students that participate in DE-algebra re-take algebra during the first term in
college. Excluding these students from the analysis does not materially affect the resutls
(Table 2.8).
2.6 Results
2.6.1 Effect of Dual Enrollment on Academic Outcomes
Table 2.5 presents the RD-IV estimates of the effect of taking a DE-basic course in
12th grade using the GPA cutoff. As mentioned before, this analysis captures mostly the
effect of those DE courses for which only an eligible GPA suffices for enrollment. These
courses are typically introductory community college courses in subject areas other than

CHAPTER 2. DUAL ENROLLMENT PROGRAMS 80
math or English.40 For reference, column (1) shows the mean value of the outcome for
students just below the cutoff41 and column (2) the ordinary least square (OLS) estimates
which ignore students’ self-selection into DE. The next columns report the RD-IV effect
estimated using alternative bandwidth of the data and control variables, though additional
sensitivity analyses are discussed in Section 2.7. The last two columns display the reduced
form effect in the GPA sample and in the rest of the colleges (placebo sample) where DE
participation does not increase discontinuously at the cutoff. Before introducing the formal
estimates, Figure 2.8 provides a graphical preview of DE impact. To the extent that DE
participation benefit students, we should be able to see a discontinuous increase in mean
outcomes at the GPA cutoff. Visual inspection of the graphs, however, does not suggest
positive effects. Because not every eligible student and some ineligible students take DE
when granted an exception, the RD-IV in Table 2.5 scales up these differences in outcomes
around the cutoff by the probability of participation (first stage shown in row 1).
First, I consider whether DE increases the likelihood of obtaining a high school
diploma. There is no evidence that DE-basic has significant leverage on high school grad-
uation, but there is little variability in this outcome measure given that the data consists of
students who already made it to 12th grade. The next set of outcomes describes students’
postsecondary access: college enrollment (any type) or college enrollment at 4-year insti-
tutions (both measured across the private vs. public or in- and out-of-state divide). The
point estimate on the effect of DE-basic on postsecondary enrollment is negative (-0.068),
though small in size and statistically insignificant, with standard errors of 0.11 (column40The dicontinuity in 12th grade DE math and English courses with respect to the GPA is very small: 0.016 (std=0.006)
for DE-algebra and 0.029 (std=0.009) for DE-English composition, compared to the overall discontinuity in 12th gradeparticipation of 0.081(std=0.016) reported in Table 2.5, column 3.
41Mean outcomes below the cutoff represent a weighted average of the outcomes for three types of students: thosethat would never take DE (never-takers), those that would manage to get an exception to take DE if not eligible (always-takers), and those that would only take DE if eligible (compliers). The RD-IV draws inference from the latter. In addition,the appropriate benchmark reference for the estimates should be based on the sample of students who took the CPT examduring high school. Since students may take the exam while in college and I do not observe the test date, mean outcomesbelow the cutoff are likely higher than what the benchmark outcome is. Students that take the exam in college affect thelevel of the outcome (e.g., higher postsecondary enrollment) but do not affect the discontinuity estimate.
CHAPTER 2. DUAL ENROLLMENT PROGRAMS 81
7). Interestingly, the reduced form effect on college access is remarkably similar to that
experienced by students in other “placebo colleges” where DE participation does not jump
discontinuously at the cutoff, further assuring that the program is unlikely to be affecting
students’ college enrollment decisions (column 9 and 10).
Given the relative advantage that local community colleges may have in attracting DE
students after high school graduation (for example, DE students are considered returning
students and need not reapply to the college or transfer the accrued college credits), the
next outcome evaluates whether DE “diverts” students who would have otherwise gone to
4-year institutions into 2-year colleges. While there is some indication of a negative effect
on 4-year enrollment, the estimate is only statistically significant in the larger bandwidth
and becomes insignificant (and smaller in size) using a narrower sample of the data around
the cutoff (columns 5-8), making it difficult to draw any conclusive answer.
There is substantial policy interest in finding effective interventions not only to get
students into college but also to help them succeed in college. To this end, the final set
of outcomes examines measures of students’ college attainment.42 Relative to students
below the cutoff, DE-basic students just above the cutoff are not significantly more likely
to obtain an AA degree. The point estimates on baccalaureate attainment roughly mirror
the evidence in 4-year enrollment. However, the effects are fairly imprecisely estimated
across bandwidths, and only statistically distinguishable from zero with the inclusion of
additional controls in the regression, despite arguably large sample size. The effect on
college degree (either AA or BA) corresponds closely to the basic pattern found in BA:
large point estimates that are instable across discontinuity samples and not consistently
significantly different than zero to draw a definitive conclusion. Overall, point estimates
and standard errors would rule out that DE-basic has a sizeable beneficial impact in terms42As explained before, college outcomes are defined over the entire population of high school students (i.e., not just
over college-goers).

CHAPTER 2. DUAL ENROLLMENT PROGRAMS 82
Figu
re2.
8:O
utco
mes
by11
thgr
ade
Hig
hSc
hool
GPA

CHAPTER 2. DUAL ENROLLMENT PROGRAMS 83
Tabl
e2.
5:R
egre
ssio
nD
isco
ntin
uity
Est
imat
esof
the
Eff
ecto
fDua
lEnr
ollm
ento
nSt
uden
tOut
com
es,G
PASa
mpl
e

CHAPTER 2. DUAL ENROLLMENT PROGRAMS 84
of college degree attainment (95% confidence interval upper bound are small positive or
slightly negative) and, if anything, would point to a relative decline in the probability of
obtaining a degree.
2.6.2 The Effect of Dual Enrollment Algebra on Academic Outcomes
Dual enrollment, as defined in the previous section, might encompass a wide range of
experiences that range from taking courses in life-learning skills to courses in accounting.
This section examines the impact of taking one challenging, college algebra, which requires
a particular score on the CPT math test for enrollment.
The effect of DE-algebra on college degree attainment is measured using the sequen-
tial RD estimator, which relies partially on matching techniques.43 Before presenting the
results, Table 2.6 assesses the quality of the match by comparing mean characteristics of
never-takers above and the matched-identified never-takers below the cutoff. In nearly all
dimensions, the average characteristics of the matched never-takers resemble the distribu-
tion of characteristics never-takers are known to have.44 The only salient difference is in
10th grade math standardized scores, where the matched-identified sample has an average
score about 0.15 standard deviations lower than expected to have. However, to the ex-
tend this sample is thought to be ‘negatively selected’ (i.e., have characteristics associated
with worst outcomes), the estimates of the DE-algebra effect would be biased downwards.
While admittedly I can only assess whether the matched-based criteria identifies a similar
group of students in terms of observables characteristics, these statistics suggests that the
sample is able to characterize the student-type fairely accurately.43Recall from Section 2.4.4 that the mean outcome below the cutoff for DE-algebra never-takers is not readily available
in the data. An implication of assumption A1 is that DE-algebra never-takers are similar around the cutoff. The validity ofthis assumption, assessed in Section 2.5.2, provides the fundamental justification for using the observable characteristicsof non-DE students above the cutoff (known to be “never-takers”) as the basis for identifying similar students below thecutoff.
44Mean characteristics of never-takers at the cutoff is estimated with a local linear regression specification using dataon non-DE (matched) students within 15 CPT math score points (below) above the cutoff.

CHAPTER 2. DUAL ENROLLMENT PROGRAMS 85
Figure 2.9 provides a visual preview of the results. It displays the mean outcome vari-
ables by the CPT score (centered at each college cutoff), traced by the fitted values of a
regression of the outcome on a quadratic term in the CPT estimated separately on each
side of the cutoff. The reduced form estimates, shown at the top of each graph, are only
indicative of the program effect for pre-college outcomes (figures in first row). Because
students can use the same score for placement into algebra as DE or as a regular course
once in college, the reduced form figures per-se are no longer informative of the program
impact (see equation (2.5)).
Table 2.7 presents the standard RD-IV estimates of taking college algebra as DE on
high school outcomes (top panel) and sequential RD-matching estimates on college out-
comes (bottom panel). For reference, the table also reports the standard RD-IV estimates
on college outcomes which ignore the bias due to the sequential treatment. To save space, I
only show estimates with and without additional controls using one bandwidth of the data,
though results across bandwidth samples are not sensitive to the use additional controls.
There is some indication that, for students with a CPT score around the cutoff used for
placement, taking DE-algebra increases the likelihood of obtaining a high school diploma.
However, the effect is small ranging from a 4 to 7 percentage point increase depending
on the discontinuity sample, and not always statistically significant at conventional levels.
Turning to college access, there is evidence of a beneficial DE-algebra impact. The
coefficients are large, statistically significant, and generally robust to discontinuity sample
or regression specifications. The most conservative estimate suggests a 16-percentage point
increase in postsecondary enrollment (column 4). Although DE-algebra takers appear to be
more likely to go to college after high school, they are not more likely to enroll in a 4-year
institution. While positive, estimates are fairly unstable across most discontinuity samples
and, in all cases, zero effects on enrollment in a 4-year institution cannot be ruled out.

CHAPTER 2. DUAL ENROLLMENT PROGRAMS 86
The largest effects of DE-algebra are found in college degree attainment, both in the
likelihood of obtaining an AA or a BA degree. The effects are substantial; estimates close
to the cutoff are 0.23 and 0.24 for AA and BA (column 7), respectively, and are highly sig-
nificant despite arguably small sample size in a narrow bandwidth around the cutoff. To put
the results in context, taking college algebra while in high school increase AA attainment
by 23 percentage points from a base of 17% just below the cutoff and BA attainment by 24
percentage points from a base of 13%.45 As expected, DE is also found to have a positive
impact when looking at degree attainment as a general indicator for either AA or BA de-
gree. Interestingly, the effect on this measure is generally larger than the individual degree
effects, suggesting that some of the effect is coming from students that get one degree but
not the other.46
College algebra is a gatekeeper course and having it out of the way at the onset of col-
lege seems to help students make progress towards a degree. One potential explanation
for this finding is that students faced with more rigorous curriculum while in high school
might be better prepared for college academically and therefore more likely to persist to-
wards obtaining a degree. DE students might have a better experience with the course (e.g.,
have higher passing rate) by taking advantage of the lower work overload in high school
or high school support (counselors are supposed to monitor their progress in DE courses)
than if they were to take it once in college. A different hypothesis is that students that have
already done college-level algebra start college with higher self-esteem and confidence of
their abilities to obtain a degree. In addition, the effect of DE-algebra on degree attainment45Mean outcome just below the cutoff is estimated for the DE-algebra compliers subgroup identified using matching.
These averages are lower than the corresponding 27% (AA) and 21% (BA) for DE-algebra never-takers, consistent withthe idea that students induced to take DE have more to gain from the experience.
46A positive effect for DE-algebra with a close-to-zero reduced form effect (Figure 2.8) is explained by a negative effectof college algebra for the D̄ = (0,0,0,1) type, characterized by being DE never-takers but algebra in college compliers(see equation (2.8)). This suggest that, for students on the margin of eligibility who are induced to take the course only incollege, taking the intermediate-algebra instead of placing directly into college algebra provides them with a more solidmath foundation to successfully complete the math sequence necessary for an BA degree.

CHAPTER 2. DUAL ENROLLMENT PROGRAMS 87
Figu
re2.
9:O
utco
mes
byC
PTM
ath
Scor
e

CHAPTER 2. DUAL ENROLLMENT PROGRAMS 88
Table 2.6: Assessing the Matching Quality, CPT Sample

CHAPTER 2. DUAL ENROLLMENT PROGRAMS 89
Tabl
e2.
7:R
egre
ssio
nD
isco
ntin
uity
Est
imat
esof
the
Eff
ecto
fDua
lEnr
ollm
entA
lgeb
raon
Stud
entO
utco
mes
,CPT
Sam
ple

CHAPTER 2. DUAL ENROLLMENT PROGRAMS 90
might not only come through improvements in academic performance but also through the
increase in college-going rate.47
2.7 Robustness
Table 2.8 examines the sensitivity of the DE-basic effect (Panel A) and DE-algebra
effect (Panel B) to sample selection and model specification. Specifically, I use a narrow
discontinuity sample (bandwidth of 0.3 GPA points and 10 CPT points around the cutoff)
and examine whether these baseline estimates are robust to different sample of students,
to the inclusion of more colleges in the sample, and to an alternative estimation of the
unobserved term in the Sequential RD (for DE-algebra on college degree outcomes). For
ease of comparison, the baseline estimates in the main results are restated at the top of each
panel.
2.7.1 Robustness for GPA Analysis
While all the colleges in the GPA sample present a statistically significant discontinuity
at the official GPA cutoffs, the estimates could be biased if the cutoff is not the one that
maximizes the likelihood of participation. This could happen if, for example, some high
schools systematically round GPA between 2.95 to 2.99 as an eligible 3.0 GPA in students’
DE application forms. Following Kane (2003) and Chay et al. (2005), I estimate colleges’
empirical cutoff as those that maximize the log-likelihood function of participation on a
dummy indicating eligibility based on alternative cutoffs in increments of 0.05 (i.e., 2.9,
2.95, 3, 3.05, etc) controlling for a quadratic function of the GPA using a probit model on
data 0.5 points around the given cutoff (empirical cutoffs reported in Table 2.9 in appendix).
I find supporting evidence that, in fact, for two colleges in the GPA sample the empirical47Since degrees are measured within a 5-year window from expected college start year, one cannot rule out the pos-
sibiliy that some of the relative DE advantage (particularly in BA degree) would be explained away had we followedstudents for a longer period of time.

CHAPTER 2. DUAL ENROLLMENT PROGRAMS 91
cutoff is 2.95 instead of 3. In order to address the concern of cutoff mis-specification, Table
2.8 (second row) reports estimates discarding students whose GPA fall in the marginal area
[0.05,0). While the point estimates are generally smaller in magnitude to the main results,
they have comparable statistical power and none of the effects are statistically significant.
The next five rows in Panel A show estimates using different samples of students. First,
I exclude students with a GPA at the exact value of the cutoff. Since there is a disproportion-
ate number of students with such a GPA, this analysis addresses concerns of endogenous
sorting of students around the eligibility cutoff. Results are very similar to the main es-
timates, providing further evidence that the “stacking” of students at certain GPA values
respond to the nature of the GPA determination based on a letter grade system. Second,
I exclude students who took DE before 12th grade. To the extent that there is variation in
the GPA around the cutoff over time, 11th grade participation should not be correlated with
12thgrade eligibility status. Indeed, results eliminating students with early exposure to DE
are similar to the baseline, though there is a loss in precision when reducing the sample
size by 8%.
The previous section suggests that the returns to DE are likely heterogeneous in course
type, though the GPA and CPT analyses inevitabily draw inferences from different sample
of students. Despite the fact that most of the variation from DE participation in the GPA
sample is driven by courses for which there is no specific test requirements, as long as col-
leges enforce both GPA and test requirements there is still some variation driven by courses
known to be gatekeepers. I therefore assess the sensitivity of the results to the exclusion
of students in the GPA sample who took either DE-English composition or DE-algebra
(Panel A, row 5) and those that took DE-algebra (Panel A, row 6). Consistent with larger
returns to particularly rigourous course experiences, estimates excluding these challeng-
ing courses are considerably lower than baseline results (i.e., more negative), specially for
4-year college enrollment and BA degree attainment.

CHAPTER 2. DUAL ENROLLMENT PROGRAMS 92
Next, I examine whether the results are robust to the inclusion of other students with
no college placement score. Baseline estimates are indicative of the effect of DE on the
margin of the GPA cutoff among those students who took the test necessary for applica-
tion. It is possible that a student interested in DE might have been discouraged to take the
college placement test altogether because, for example, she did not meet other participation
requirements (GPA, letter of recommendation, etc). Unconditional analysis suggests lower
DE returns for these types of students, though estimates are still highly imprecise despite a
40% increase in the sample size.
Last, I explore whether the results are robust to the selection of colleges in the sample.
Since students who would be induced to participate in a high-exception program might be
different than those in a low-exception college, I remove from the analysis DE programs
where more than 10% of the DE students have an ineligible GPA. While point estimates
are lower than baseline, suggesting that high-exception programs make exceptions to stu-
dents with positive unobservable, all coefficients are not significant at conventional levels.
Finally, I include in the sample other DE programs where there is some indication of a dis-
continuity in participation though not robust across model specification. Estimates remain
largely unchanged using this bigger sample.
2.7.2 Robustness for CPT Analysis
Panel B shows robustness checks for the CPT sample analysis. Given that students are
mandated to have an eligible GPA in addition to the CPT score in order to take DE-algebra,
the first sensitivity test estimates the effect at the CPT cutoff for those with an eligible
GPA. The results are not materially affected. This outcome is expected since the GPA
requirement is not binding for participation in some of the colleges in the CPT sample and
students at the CPT cutoff have on average an eligible GPA (mean GPA at the CPT math
cutoffs is 3.2).

CHAPTER 2. DUAL ENROLLMENT PROGRAMS 93
Tabl
e2.
8:Se
nsiti
vity
ofD
ualE
nrol
lmen
tEff
ectt
oSa
mpl
eSe
lect
ion
and
Mod
elSp
ecifi
catio
n

CHAPTER 2. DUAL ENROLLMENT PROGRAMS 94
An assumption of the sequential RD framework is that students can only take algebra
once (either in high school or in college). In practice, however, about 5% of the students
that take DE-algebra re-take the course in college; typically, because they fail the course the
first time. Estimates in Table 2.8 show that excluding algebra repeaters from the analysis
does not change the results.
The next four rows in Panel B assess the robustness of the estimates to alternative es-
timation of the last term in the sequential RD estimator (equation (2.8)) that is not readily
available in data. I first estimate the term based on matching students within a larger and
narrower bandwidth of the data around the cutoff than that used for the main analysis (20
and 10 points instead of 15). I then examine whether using a more stringent criteria to
identify DE-algebra never-takers below the cutoff would affect the results. Specifically, I
use 75% of the known share of DE-algebra never-takers instead of the actual share to get
a sample that most closely matches a student above. Last, I use an alternative specification
of the covariates used in the matching that includes students’ course-taking choices in high
school (number of math, english, science, and history courses, and an indicator for taking
math courses in the senior year). None of these exercises materially affect the results.
In addition, Table 2.8 also shows the estimates using all non-DE-algebra students below
the cutoff instead of the matched-identified sample. While this analysis does not rely on
matching, it is based on a likely strong assumption: Students that would have never taken
DE-algebra D̄H = (0,0) are in fact similar to those that would have taken it if eligible D̄H =
(0,1). The effect of DE-algebra on college degree attainment is still large and significant,
albeit smaller in size. Points estimates are 15 percentage points for AA and 18 for BA
vs. 23 percentage points in baseline. In the case of AA, the estimate is significant using
larger bandwidths of the data (not shown) but trends towards significant in the reported
bandwidth.

CHAPTER 2. DUAL ENROLLMENT PROGRAMS 95
The following robustness checks include a larger sample of colleges by relaxing the
criteria used for selecting colleges for the main analysis. First, I include two additional
colleges in the sample that have a sizeable discontinuity in DE-algebra participation but
use the same cutoff to determine enrollment in algebra as for math remediation. Despite
the fact that ineligible students face different course-taking options in these colleges than
in all others in the sample, results including them remain mostly unchanged. The last row
reports the estimates using a larger sample of colleges with significant discontinuities in
DE-algebra, though not all being robust across model specification. Overall, this analysis
includes a total of 12 DE programs (a addition of 5 colleges and almost 2 times the number
of students), with a precise first stage of 16-percentage points. Notably, the effects on
the likelihood of obtaining a High School diploma and on postsecondary enrollment are
smaller in magnitude than the baseline and no longer statistically significant; indicating
some heterogeneity in the effect on these outcomes across programs. The main conclusion
on the DE-algebra effect on degree attainment still holds in this broader set of colleges.
The consistency and stability of the positive and significant estimates on college degree
outcomes across samples and model specifications is reassuring.
2.8 Conclusion
In the presence of discouraging statistics on postsecondary enrollment and attainment,
there is a growing need to find effective ways to help high school students in their transition
to higher education. There is a growing body of literature providing reliable evidence that a
rigorous high school curriculum, particularly one rich in math, is a key determinant of stu-
dents’ educational progress and earnings (e.g., Rose and Betts 2004; Goodman 2009). To
this end, policymakers are increasingly viewing dual enrollment programs which allow
students to take college courses while in high school an appropriate intervention. This
enthusiasm about dual enrollment programs has been accompanied by remarkable growth

CHAPTER 2. DUAL ENROLLMENT PROGRAMS 96
in state legislation that governs their structure and funding. While 23 states had dual en-
rollment legislation in 2000 (Frazier 2000), 42 states had passed one by the end of 2005
(WICHE 2006). As the program continues to expand, it is important to understand its
impact on students’ academic progress.
This paper provides empirical evidence of the effect of dual enrollment using data from
Florida, a state with a well-developed, highly regulated, and fully-funded dual enrollment
program. Florida provides a unique opportunity to assess the effect of dual enrollment par-
ticipation since participation requirements are set forth by the state. In particular, students
are required to have a minimum 3.0 high school GPA in order to take an academic dual
enrollment course and, for courses such as college algebra, a minimum proficiency in a
college placement test (CPT). These features of the program allow using two regression-
discontinuity designs to gauge the causal effect of the program by comparing the outcomes
of students who barely pass with those that barely miss the required GPA or CPT cutoff (for
algebra). An analytical complication of the particular analysis of dual enrollment algebra
derives from the fact that an eligible student who does not take the course while in high
school has the opportunity to take the course later, while in college. I propose a new RD
estimator, the sequential RD-matching estimator, that extends the standard RD design to
accommodate for a subsequent treatment with the same eligibility requirement.
Using data from the 2000 and 2001 high school graduating cohorts in selected Florida
counties, I find no evidence that simply taking dual enrollment significantly increases stu-
dents’ likelihood of high school graduation, college enrollment or college success for stu-
dents who are on the margin of Florida’s minimum GPA requirement. While the estimates
are generally negative, large standard errors imply that we cannot rule out sizable effects
in either direction. However, dual enrollment participation conceals important variation in
course experience. Based on a sample of students who took Florida’s college placement
test, I find that taking one popular challenging course as dual enrollment, college algebra,

CHAPTER 2. DUAL ENROLLMENT PROGRAMS 97
significantly increases students’ likelihood of enrolling in college by about 16-percentage
points and obtaining a college degree by about 23-percentage points, with some indication
of positive effects on high school graduation.
This research presents the first attempt to use a quasi-experimental method to examine
the causal effect of participation in an academic DE program. From a policy perspective,
it provides credible evidence that dual enrollment programs can play a significant role in
improving students’ college access and success. It also highlights that factors such as the
subject area, quality, or level of difficulty of the dual enrollment experience should be taken
into account when expanding these programs with the objective of addressing the needs of
high school students as they transition to postsecondary education.
2.9 Remarks from Chapter 1 and Chapter 2 and Directions for Future
Research
DE estimates from Chapter 1 and 2 are not directly comparable due to a number of
factors, including different samples of the data (statewide vs. selected districts), different
definition of treatment (DE participation in general vs. DE-basic courses or DE-algebra),
and different estimands (average treatment effect vs. local average treatment effect). While
ordinary least squares (OLS) employed in Chapter 1 provides an indication of the average
expected gain from participation among all students, regression-discontinuity methods in
Chapter 2 estimate an effect “locally” for students with a level of ability close to the eli-
gibility cutoff and for a small subgroup of those students who would participate if eligible
(known as Compliers). In addition, OLS is likely to provide an upwardly biased estimate of
the average treatment effect due to unobserved selection into participation. Despite these
differences, it is natural to try to compare the results. Taken together, Chapter 1 suggests

CHAPTER 2. DUAL ENROLLMENT PROGRAMS 98
that DE participation is associated with students’ success across outcomes, whereas Chap-
ter 2 indicates that the returns to DE is limited to certain outcomes and for a particular
rigorous course. However, when effects are found in Chapter 2, those are larger than com-
parable OLS estimates using only students close to the eligibility cutoff. This is consistent
with the vast literature on returns to education that generally finds that instrumental vari-
ables estimates are larger than OLS estimates. One recurrent explanation to rationalize this
evidence is that regression-discontinuity or instrumental variable speak for the effect on a
particular group of students with high marginal returns to the program (Card 2001).
Chapter 2 results point an important direction for future research. In a nutshell, DE-
algebra is found to increase college degree attainment (AA/BA) by about 34 percentage
points from approximately 27% to 61%. Two factors can explain this large increase on
degree. One is because DE-algebra induces more students to go to college, and second
because those that go to college are now more likely to obtain a degree. From a policy
perspective, it is important to understand the extent to which each of these factors is driv-
ing the effect. The effect of DE-algebra on college-going was estimated in Chapter 2 to be
about 16 percentage points from a rough benchmark of 77% to 93%.48 With these numbers
we can calculate that the probability of obtaining a degree conditional on going to college
increases from 35% (27 over 77) without DE to 65% (61 over 93) with DE. This simple
back-of-the-envelope calculation suggest that most of the effect on degree attainment is not
coming from the increase in college-going rate but rather from a large increase in degree
attainment conditional on going to college.49 An important implication for future research48Recall from Chapter 2 that average outcome just below the cutoff is the not appropriate benchmark for the estimates
in a fuzzy regression discontinuity design. The estimates speak for the effect on a subgroup characterized as complierswhose observed score in the data is that obtained while in high school. For this exercise, benchmarks are approximatedusing the mean degree outcomes for the matched-identified sample of compliers and the mean college going rate forstudents with a high school GPA of 3.0, though using alternative benchmarks would not affect the qualitative conclusion.
49The effect on degree conditional on going to college should not be interpreted as the effect of DE if you go to college.Rather, it is the effect on compliers students that decided to go to college, taking into account that DE might have affectedtheir college decision
CHAPTER 2. DUAL ENROLLMENT PROGRAMS 99
is then to understand the factors behind the improvement in students’ success-rate. Specifi-
cally, to what extend DE changes students’ college-readiness or changes the composition or
type of college-goers. Conceptually, DE might not only improve the academic preparation
but also the college-student match of those who decide to go to college, as students get a
realistic idea of what college is all about and their own abilities to be in college. Arguably,
certain challenging or degree-required core-courses such as DE-algebra are able to covey
this information to students more effectively.
While there is a natural mapping between the college-readiness and college-information
component of a DE experience and the heterogeneity of the DE effect by course content
(Chapter 2) and by course location (high school vs. college, Chapter 1), none of the analy-
ses in this dissertation can disentangle these components. Since the eligibility requirements
for participation in DE are the same for courses taught at the high school or the college
campus, Chapter 2 results only speak for the return to a particular coursework and can-
not disaggregate the effect by location. Instead, Chapter 1 provides associations between
course-location and outcomes but the effect might be confounded by endogenous students’
choices (such as students who take DE at the college campus enrolling in more and/or more
difficult courses) and differences in the quality of the instruction across sites.
Further research is needed to understand to what extent DE changes the quality of
college-goers (through improvements in college-readiness) or their composition (through
improvements in college-information). Conceptually, this would also provide a framework
to compare Advanced Placement and Dual Enrollment programs, as both are designed to
increase college-readiness but only the later can provide students a first hand experience
with college life. A simple experiment that would allow to specifically address this ques-
tion would involve randomizing students interested in a given DE course into different
course locations, but having the same instructor teaching both courses as a mean to control

CHAPTER 2. DUAL ENROLLMENT PROGRAMS 100
for course-quality. The research in this dissertation also highlights the likely important het-
erogeneity of the DE effect by course-content or difficulty, though offers evidence on only
one college math course. A demonstration that considers a range of popular DE courses
would further advance our understanding about which courses render a more meaningful
college experience.
2.10 Appendix

CHAPTER 2. DUAL ENROLLMENT PROGRAMS 101
Table 2.9: Estimated Discontinuity in Dual Enrollment (any course) in 12th grade by CommunityCollege

CHAPTER 2. DUAL ENROLLMENT PROGRAMS 102
Table 2.10: Estimated Discontinuity in Dual Enrollment Algebra by Community College

Chapter 3
Subjective and Objective Evaluations of
Teacher Effectiveness: Evidence from
New York City
(coauthored with Jonah E. Rockoff)1
“I have an open mind about teacher evaluation, but we need to find a way to measureclassroom success and teacher effectiveness. Pretending that student outcomes are not partof the equation is like pretending that professional basketball has nothing to do with thescore.”
- Arne Duncan, U.S. Secretary of Education, Remarks to the Education Writers Asso-ciation April 30th, 2009
1A slightly enhanced version of this essay is forthcoming in Labour Economics and a shorter version is published inthe American Economic Review, Papers and Proceedings, May 2010, 100:261-266.
103

CHAPTER 3. TEACHER EFFECTIVENESS 104
3.1 Introduction
A large body of research demonstrates the importance of teacher effectiveness in rais-
ing student achievement. This literature has extensive roots (e.g., Hanushek 1971; Brophy
and Good 1986), and has grown due to the availability of large administrative datasets that
link student outcomes to classroom teachers (e.g., Sanders and Rivers 1996; Rockoff 2004;
Rivkin et al. 2005; Harris and Sass 2006; Aaronson et al. 2007; and Clotfelter et al. 2007).
Two stylized facts from this work are that (1) teacher effectiveness (sometimes referred to
as “value-added”) varies widely and (2) outside of teaching experience, the characteristics
used to certify and pay teachers bear little relation to student outcomes. These findings pro-
vide motivation to understand better how effective and ineffective teachers can be identified
early in their careers.
In this paper, we measure the extent to which a set of subjective and objective evalua-
tions of teacher effectiveness can predict teachers’ future impacts on student achievement.
The subjective evaluations come from two sources: an alternative certification program that
evaluates its applicants prior to the start of their teaching careers, and a mentoring program
in which experienced educators work with new teachers and submit evaluations of new
teachers’ effectiveness throughout the school year. The objective evaluations of effective-
ness we use are estimates of teachers’ impacts on student achievement in the first year of
their careers.
We find that both subjective and objective evaluations bear significant relationships with
the achievement of teachers’ future students. Moreover, when both subjective and objective
evaluations are entered as predictors in a regression of future students’ test scores, their
coefficients are only slightly attenuated. Thus, each type of evaluation contains information
on teacher effectiveness that is distinct from the other.
CHAPTER 3. TEACHER EFFECTIVENESS 105
Notably, we also find evidence of significant variation in the leniency with which stan-
dards of evaluation were applied by some evaluators of new teachers. Specifically, for eval-
uations by mentors, variation in evaluations within evaluators is a much stronger predictor
of teacher effectiveness than variation between evaluators. This highlights the importance
of reliability in the procedures used to generate subjective evaluations.
The paper proceeds as follows. We provide a brief summary of previous literature in
Section 2 and describe our data in Section 3. Our methodology and empirical estimates are
presented in Section 4, and Section 5 concludes.
3.2 Prior Literature
Several recent studies have examined how objective data on student learning from early
in a teacher’s career can be used to predict how teachers will impact student outcomes
in the future. For example, Gordon et al. (2006) take measures of the effectiveness of
teachers in Los Angeles using data from the first two years of their careers and, grouping
teachers by quartiles, examine students’ outcomes in these teachers’ classrooms during the
following year. They find large differences across quartiles—students with teachers in the
top quartile gained 10 percentile points more than those assigned to teachers in the bottom
quartile, about half the national Black- White achievement gap—and conclude that using
data on student performance to identify and selectively retain teachers could yield large
benefits for student achievement. Goldhaber and Hansen (2009) draw similar conclusions
in their analysis of data from North Carolina.
Tempering such findings is the reality that sampling variation and classroom level id-
iosyncratic shocks introduce noise into measures of teacher effectiveness solely based on
student test scores, so that some teachers who initially appear effective may perform poorly
in the future, and vice versa. Of equal concern is that estimates of teacher effectiveness may
be biased if some teachers are persistently assigned students that are more or less difficult to

CHAPTER 3. TEACHER EFFECTIVENESS 106
teach in ways that administrative data sets do not measure. For these reasons, it is important
to understand how other measures of effectiveness can be used to achieve greater stability
and accuracy in measures of effective teaching. Moreover, it is unlikely that any system
of teacher evaluation purely based on student test score data would ever be implemented,
given considerable opposition from teachers’ unions (see Weingarten 2007).
There is a considerable literature on the power of subjective teaching evaluations to
predict gains in student achievement. The largest focus has been on evaluations of teachers
by the school principal, motivated by principals’ authority in making personnel decisions.2
A second strand of work examines the relation between teacher effectiveness and formal
evaluations based on classroom observation protocols or “rubrics” (e.g. Holtzapple 2003;
Schacter and Thum 2004; Gallagher 2004; Kimball et al. 2004; Milanowski 2004). With
few exceptions, principal evaluations and classroom observations have been found to have
significant predictive power to predict student achievement. For example, Jacob and Lef-
gren (2008) find that a one standard deviation increase in a principals’ evaluation of a
teacher is associated with higher test score performance of 0.10 and 0.05 standard devia-
tions in math and English, respectively.3
The findings from these studies are quite encouraging, but there are two notable short-
comings that limit what we can learn from them about identifying effective new teachers
using subjective evaluations. First and foremost, they investigate the power of evaluations
to predict the exam performance of current, not future, students. A teacher may be highly2This topic has been studied over a long period of time by educators (e.g., Hill 1921; Brookover 1945; Gotham 1945;
Anderson 1954; Medley and Coker 1987; Manatt and Daniels 1990; Wilkerson et al. 2000), but economists have alsomade significant contributions (e.g., Murnane 1975; Armor et al. 1976; Harris and Sass 2007a; Jacob and Lefgren 2008;Rockoff et al. 2009).
3Another related set of studies focus on teachers who are certified by the National Board of Professional TeachingStandards (NBPTS) via review of a portfolio which includes student work, a self-assessment, and sample video of class-room instruction (e.g., Cavalluzzo 2004; Goldhaber and Anthony 2007; Cantrell et al. 2007; Harris and Sass 2007b). Theevidence, while somewhat mixed, generally suggests that NBPTS selects more effective teachers among its applicantsand that teachers certified by NBPTS are more effective than teachers who lack this certification.

CHAPTER 3. TEACHER EFFECTIVENESS 107
rated because she has a group of students who are well behaved, cohesive, and highly mo-
tivated in ways that cannot be controlled for using regression analysis and available data.
A stronger test of the power of these evaluations would be to predict gains produced by
the teacher with a new group of students in a subsequent year (as done by Gordon et al.
(2006) using objective performance data). Second, it is unclear the extent to which princi-
pal evaluations represent a subjective assessment of teacher effectiveness or whether they
are influenced by objective data on the performance of a teacher’s previous students.
Ours is the first study to focus on subjective evaluations made prior to or just at the start
of a teacher’s career. It is also one of the few studies that tests how multiple sources of
subjective evaluation predict teacher effectiveness.4 Because our data are administrative,
rather than survey based, we also use a relatively large sample, i.e., thousands of teachers,
rather than hundreds. In addition, our study is distinct from prior work (outside of Tyler
et al. (2009)) in that both sets of subjective evaluations we examine were made by profes-
sionals as part of their job, and one was a high-stakes evaluation. This is important to the
extent that individuals change the way they do assessments in different contexts.
3.3 Data and Descriptive Statistics
Our analysis uses data on students and teachers in the public schools of New York
City. First are administrative data on demographics, behavior, and achievement test scores
in math and English for students in grades 3 to 8 in the school years 2003-04 through
2007-08. These data also link students to their math and English teacher(s). We also use
data on teachers’ characteristics: demographics, possession of a master’s degree, type of4Most studies of subjective evaluations by different groups—principals, peer teachers, students, parents, and the
teachers themselves—only examine correlations among these measures (e.g., Epstein 1985; Peterson 1987). We know oftwo studies that examine the relation between multiple subjective evaluations and teacher effectiveness (Anderson 1954and Wilkerson 2000), but both are based on very small samples.

CHAPTER 3. TEACHER EFFECTIVENESS 108
certification/program, and teaching experience (as proxied by their position in the salary
schedule).
Using the linked student-teacher data, we can objectively evaluate teachers’ impacts on
student test scores in their first year using an empirical Bayes’ method. This estimation
of a teacher’s value-added is a fairly standard procedure and follows closely the method
described in Kane et al. (2008). However, rather than obtain a single estimate of teacher
value-added using all years of data, we run a series of regressions, each of which uses
two years of data, and the residuals from each regression are used to produce estimates
for a single cohort of first-year teachers (e.g., data from 2004-05 and 2005-06 are used to
estimate value-added for teachers who began their careers in school year 2005-06). This
avoids using data from teachers’ second years to evaluate their first-year performance.5
Data on subjective evaluations come from two programs for new teachers in New York
City. The first program is the New York City Teaching Fellows (TF), an alternative path
to teaching certification taken by about a third of new teachers in New York City.6 After
submitting an application, approximately 60 percent of applicants are invited for a day-long
interview process, which includes a mock teaching lesson, a written essay on a topic not
given in advance, a discussion with other candidates, and a personal interview.5We lack value-added estimates on some teachers that received subjective evaluations and were linked to students in
their second year of teaching, but were not linked their first year. To include these teachers in our analysis, we set theirvalue-added estimates to zero and include a variable indicating that these teachers were missing an estimate.
6Fellows are required to attend an intensive pre-service training program designed to prepare them to teach and topursue a (subsidized) master’s degree in education while teaching in a public school. Boyd et al. (2006) and Kane et al.(2008) provide more detailed descriptions and analyses of this program.

CHAPTER 3. TEACHER EFFECTIVENESS 109
Starting with applications for school year 2004-2005, applicants brought in for inter-
views have been rated on a 5-point scale.7 In order to be accepted into the program, can-
didates must receive one of the top three evaluations; only about five percent of applicants
receiving either of the two lowest evaluations are accepted into the program, based on a re-
view by a committee that makes final recruitment decisions. Because very few candidates
received the second-lowest evaluation (reserved for borderline cases), we combine Fellows
receiving the two lowest evaluations into one group for our analysis. We use evaluations
on TF applicants who began teaching in the school years 2004-2005 through 2006-2007.
The second source of subjective evaluations data is a program which provided mentor-
ing to new teachers in New York City during the school years 2004-2005 through 2006-
2007.8 Under this centrally administered program, a group of trained, full-time mentors
worked with new teachers over the course of their first year to improve their teaching skills.
Typically, a mentor would meet with each teacher once every one or two weeks, starting
sometime between late September and mid-October and extending through June.
As part of this program, mentors submitted ongoing evaluations of teachers’ progress
in mastering a detailed set of teaching standards. Mentors provided monthly summative7The first evaluations on a 5 point scale were entered starting in November of 2003. Applicants that had already
been interviewed in September and October were assigned a mark regarding acceptance or rejection and, sometimes, adesignation of “top 20” or “borderline.” We use these marks to recode these candidates under the 5 point scale in thefollowing manner: “top 20” applicants are given the best evaluation, accepted candidates with no additional designationare given the second best evaluation, “borderline” accepted candidates are given the third best evaluation, “borderline”rejected applicants are given the second lowest evaluation, and rejected applicants with no additional designation aregiven the lowest evaluation. Personal correspondence with Teaching Fellows program administrators confirmed thatthese classifications are appropriate.
8See Rockoff (2008) for a detailed description and analysis of this program. Mentoring is required for all new teachersin New York State. The New York City mentoring program targeted all new teachers in school years 2004- 2005 and2005-2006, but in 2006-2007 it did not serve teachers at roughly 300 “empowerment” schools that were given greaterautonomy (including control of how to conduct mentoring) in return for greater accountability. The mentoring programdid not continue in the school year 2007-2008, when all principals were given greater autonomy.

CHAPTER 3. TEACHER EFFECTIVENESS 110
evaluations and bimonthly formative evaluations of teachers on a five point scale.9 Sum-
mative and formative evaluations are highly correlated (coefficient of correlation 0.84) and
we therefore average them into a single measure of teacher effectiveness.
Mentors could not observe teachers prior to the start of the school year, and their eval-
uations may be affected by the students to whom teachers were assigned in their first year.
Nevertheless, it is still interesting to ask whether mentors’ impressions after only a few
meetings with the teacher are predictive of performance in the first year. We therefore
calculate mentors’ evaluations of teachers using evaluations submitted up until November
15. We use evaluations submitted from March through June to examine effectiveness in
teachers’ second years.
The individuals working as evaluators (TF interviewers and mentors) had all been
trained on a set of evaluation standards, but it is possible that some individuals were
“tougher” in applying these standards than others. Fortunately, over the course of this pe-
riod each TF interviewer saw dozens of applicants, and each mentor worked with roughly
15 teachers per year (some working for multiple years). In addition, interviewers were
assigned randomly to TF applicants, and Rockoff (2008) shows that, conditional on a
teacher’s subject area, the pairing of mentors with new teachers appears quasi-random. We
therefore examine specifications that separate variation in absolute evaluation levels from9Formative evaluations were much more detailed than summative evaluations. Teachers were rated on six compe-
tencies: engaging and supporting all students in learning, creating and maintaining an effective environment for studentlearning, understanding and organizing subject matter for student learning, planning instruction and designing learningexperiences for all students, assessing student learning, and developing as a professional educator. Moreover, each ofthese competencies had between 5 and 8 items. However, not all mentors rated teachers in all competencies, and, whenthey did, evaluations were highly correlated (and often identical) across competencies. Results of a simple factor analysis(available upon request) reveal that variation in evaluations for all competencies was mainly driven by a single underlyingtrait. Thus, we construct a single formative evaluation using the average of all non-missing subcategory evaluations. Allevaluations were entered electronically into a centralized database. However, some mentors did not complete all evalua-tions for their teachers, and some evaluations were submitted quite late. We drop the two percent of evaluations that weresubmitted more than 60 days after the month to which they related. As one might expect, the distribution of evaluationschanged considerably over the course of the school year. In the early months of the year, most teachers received the lowestevaluation, so the distribution is skewed with long right hand tail. By the end of the year, the distribution is more normallydistributed; some teachers were still at the lowest stage and others had reached the top, but most were somewhere in themiddle. Because evaluation data were not completed every month for every teacher, we account the timing of teachers’evaluations by normalizing evaluations by the month and year they were submitted.
CHAPTER 3. TEACHER EFFECTIVENESS 111
relative variation within evaluators. To do so, we measure the average of the evaluations
given out by each mentor (TF interviewer) and include these averages in our regression
specifications as additional covariates.
Because we are interested in how both subjective and objective evaluations relate to
teacher effectiveness, we restrict the analysis to teachers who taught tested subjects (math
and/or English) and grades (four to eight). Table 3.1 provides descriptive statistics for
teachers in these grades and subjects who received subjective evaluations; for comparison
purposes, we also include statistics based on other teachers working in the same years,
subjects, and grades throughout New York City. Teachers with evaluations are new and,
not surprisingly, considerably younger, less experienced, and less likely to have a master’s
degree than other teachers. They are also teaching students who are more likely to be Black
or Hispanic and have lower prior test scores, reflecting the tendency for higher turnover
(and thus more hiring) in schools serving these students. While Teaching Fellows and the
mentoring program are distinct, there is considerable overlap between them: 27 percent of
mentored teachers were Teaching Fellows and 90 percent of the Teaching Fellows received
evaluations via the mentoring program. However, the descriptive statistics of their students
suggest that Teaching Fellows are hired to work in relatively disadvantaged schools, as has
been documented in prior studies (Boyd et al. 2008; Kane et al. 2008).
We present a second set of summary statistics in Table 3.2, grouping new teachers by
their subjective evaluations. Mentored teachers are divided by tercile of their beginning-
of-year evaluation and TF teachers by their evaluation score, combining the lowest two
evaluations into a single group. The table also displays the p-values from a test for whether
the mean values for each characteristic are statistically different across these groups.
These tests indicate that teachers receiving high evaluations by their mentors at the be-
ginning of the school year are less likely to teach minority students and students receiving
Free/Reduced Price Lunch; they also have slightly larger classes. More importantly, their

CHAPTER 3. TEACHER EFFECTIVENESS 112
Table 3.1: Descriptive Statistics by Teacher Program
students have substantially higher prior test scores than those taught by teachers that re-
ceived lower evaluations. However, these differences are eliminated if we look at residuals
of prior test scores from a regression of school fixed effects.10 Thus, if mentor evalua-
tions are valid measures of teaching skills, then more highly skilled new teachers are, on
average, being hired by schools with higher achieving students. In contrast, we find very
little systematic variation in the student characteristics for Fellows who received different
evaluations during recruitment.
Since most Teaching Fellows also received mentor evaluations, we present the average
mentor evaluations from the beginning and end of the first year by TF evaluation (bottom
of Table 3.2). Interestingly, the relationship between the two evaluations at the start of the
year is fairly weak. Fellows receiving initially unacceptable evaluations (i.e., the two lowest10Moving from raw to residual scores, the gaps between top and bottom tercile mentored teachers move from 0.15 to
0.03 in math and from 0.10 to 0.01 in English.

CHAPTER 3. TEACHER EFFECTIVENESS 113
Tabl
e3.
2:D
escr
iptiv
eSt
atis
tics
byE
valu
atio
n

CHAPTER 3. TEACHER EFFECTIVENESS 114
scores of the 5 point scale) received the lowest mentor evaluations on average, but Fellows
with the third highest TF evaluations (i.e. on the border of acceptance into the program)
received the highest average mentor evaluation. In contrast, the relationship between TF
evaluations and mentor evaluations at the end of the first year are monotonic. It is also worth
noting that Teaching Fellows received low evaluations by mentors on average, though there
is little evidence Teaching Fellows are less effective than other new teachers (Kane et al.
2008).
3.4 Methodology and Regression Estimates
Our main analysis is based on regressions of the following form:
Aikt = γEvalk +βXit +λTikt +∑g,t
πgtDgit +∑
zπzDz
it + εikt (3.1)
where Aikt is the standardized achievement test score for student i taught by teacher k
in year t, Evalk is a vector of (subjective and/or objective) evaluations of teacher effective-
ness, Xit are student level control variables (including prior achievement), Tikt are controls
for teacher and classroom level characteristics, Dg it is an indicator for whether student i is
in grade g in year t, Dz it is an indicator for whether student i attends a school located in zip
code z in year t, πgt and πz are grade-year and zip code fixed effects, and εikt is an idiosyn-
cratic error term. To gain precision on estimates of fixed effects and other coefficients,
the regressions include students taught by other teachers in the same schools. For these
teachers, evaluation(s) variable(s) are set to zero and we include an indicator variable for
missing evaluation(s). For ease of interpretation, evaluations are normalized to have mean
zero and standard deviation of one, and student test scores are also similarly normalized at
the year-grade level. Standard errors are clustered at the teacher level.

CHAPTER 3. TEACHER EFFECTIVENESS 115
Estimates of the power of subjective evaluations to predict student achievement in a
teacher’s first year are shown in Table 3.3. The coefficients on TF evaluations and mentor
evaluations from the start of the school year for math achievement are both positive (0.015
and 12 0.016) and statistically significant (Columns 1 and 3).11 The coefficients for regres-
sions of achievement in English (Columns 8 and 10) are positive but statistically insignifi-
cant. It is important to note, however, that estimates of variance in teacher effectiveness are
considerably smaller for English than math, both in New York City and elsewhere (Kane et
al. 2008; Kane and Staiger 2008). Thus, we lack sufficient power in our sample to identify
effects in English of the same proportional magnitude as the effects we find for math.
To explore whether the same standards were applied by all evaluators, we test whether
variation in evaluations within evaluators is a stronger predictor of teacher effectiveness
than variation between evaluators. If differences in average evaluations across mentors or
TF interviewers simply reflected differences in the effectiveness of teachers assigned to
them, we would expect the coefficient on the average evaluation they give out (variation
between evaluators) to be equal to the coefficient on the deviation of a teacher’s evaluation
from the evaluator mean (variation within evaluators). In contrast, if evaluators who gave
out higher average evaluations were simply more lenient in applying standards, the between
coefficient should be smaller than the within coefficient.
For evaluations by TF interviewers, we cannot reject that the two coefficients are the
same in either subject. In math, the coefficient on the TF interviewer’s average evalua-
tion is much smaller than the coefficient on the deviation from that average (Column 2),
but in English the coefficient on the TF interviewer’s average evaluation is larger than the
coefficient on the deviation (Column 9). This is perhaps not surprising, since TF interview-
ers were given substantial training in order to standardize their evaluations. However, for11In separate regressions (available upon request) we replace the linear TF evaluation term with indicator variables
for each evaluation score. The coefficients indicate a monotonic positive relationship between evaluations and studentachievement, but the results are driven mostly by the top and bottom groups. The difference in student achievement onaverage between the middle two groups of teachers is quite small.

CHAPTER 3. TEACHER EFFECTIVENESS 116
Table 3.3: Subjective Evaluations and Student Achievement in a Teacher’s First Year

CHAPTER 3. TEACHER EFFECTIVENESS 117
evaluations by mentors, who were not given such training, we do find evidence of varying
standards. In math, the coefficient on the mentor’s average evaluation (0.007) is not signif-
icantly different than zero and is significantly lower than the coefficient on the deviation of
a teacher’s evaluation from the mentor average (0.022). In English, the coefficient on the
average evaluation is slightly smaller, but not statistically different.
In a final set of specifications examining teachers in their first year, we include both TF
evaluations and mentor evaluations, including only teachers with both types of evaluations
(Columns 5 to 7 and 12 to 14). Motivated by our findings above, we continue to split mentor
evaluations into mentor average and deviation from average. In math, the results are quite
similar for this sample. However, in English, we find that variation in evaluations both
within and between mentors has significant predictive power for students’ test scores. The
change in the coefficients across the two samples (from about 0.005 to 0.03) is driven by
a stronger relationship between student achievement and mentor evaluations for Teaching
Fellows; adding a control for whether a teacher is a Teaching Fellow does not materially
change the coefficient on mentor evaluations in the regression that includes all mentored
teachers. It is also worth noting that the coefficients on both sets of evaluations are similar
whether we estimate them in separate regressions or at the same time, consistent with the
weak correlation between them.
We then proceed to examine student achievement in the second year of teachers’ careers
(Table 3.4).12 First, we show that the value-added estimates are highly significant predictors
of the achievement of teacher’s students in the second year (Columns 1 and 7), with more12A potential concern is that teachers who perform poorly in their first year are more likely to leave the teaching
profession or be assigned to non-tested grades or subjects in their second year. We examine both types of attrition usingregression analysis and find no evidence that teachers receiving lower TF evaluations or mentor evaluations were morelikely to exit teaching or not be linked with students in the following year. These results (available upon request) supportthe idea that results from teachers’ second years are not materially affected by endogenous attrition.

CHAPTER 3. TEACHER EFFECTIVENESS 118
variation in achievement predicted in math (0.09) than English (0.02).13 These results are
consistent with prior research (e.g., Gordon et al. 2006; Kane and Staiger 2008).
In both math and English, the relationships between TF evaluations from recruitment
and student achievement in the second year are positive but statistically insignificant (Table
3.4, Columns 2, 3, 8, 9). However, evaluations by mentors—and in particular variation in
evaluations within mentors—bear a substantial positive relationship with student achieve-
ment in teachers’ second years. In math, the within variation in mentors’ evaluations both
at the beginning and end of the school year have significant positive coefficients (0.032 and
0.054, respectively) and in both cases we can reject that the coefficient on mentors’ aver-
age evaluations is equally large. Furthermore, the coefficients on these predictors remain
significant (0.024 and 0.031, respectively) when we include both of them and the objective
evaluation in the same regression. In English, within mentor variation in the end of year
evaluation is a statistically significant predictor of student achievement in a teacher’s sec-
ond year with a coefficient (0.023) that is slightly larger than (and robust to the inclusion
of) our objective evaluation of first-year performance.14 Also, we can reject that the within
and between coefficients on end-of-year evaluations are the same.13The coefficient for math is consistent with a stable value-added model, i.e., the standard deviation of value added in
math for first year teachers is very close to the coefficient in the regression. For English, the coefficient is only half thesize of the standard deviation in value added we estimate among first year teachers. We investigated this issue furtherand found that the decreased power of first year value added to predict second year value added drops in the school year2005-2006, when the English test in New York State was moved from March to January and the format of the test changedin grades five, six, and seven.
14Notably, in all specifications, the coefficient on the average evaluation given out by mentors at the end of the schoolyear is negative and statistically significant, indicating important variation in how mentors applied the teaching standardson which they were trained to evaluate teachers. Indeed, the magnitude of these coefficients suggests that variation inaverage evaluations across mentors bears little relationship with student achievement.

CHAPTER 3. TEACHER EFFECTIVENESS 119
Table 3.4: Subjective and Objective Evaluations and Student Achievement in a Teacher’s SecondYear

CHAPTER 3. TEACHER EFFECTIVENESS 120
Table 3.5: Interactions of Subjective and Objective Evaluations for Mentored Teachers
3.4.1 Interaction of Subjective and Objective Evaluations and the Impact of Evalu-
ator Experience
In this subsection we present extensions to our main results. First, we examine whether
subjective and objective evaluations have important interactions. In other words, do subjec-
tive evaluations have more power to distinguish effective and ineffective teachers for groups
of teachers at different parts of the objective evaluation distribution, and vice versa? To ex-
plore this possibility, we run regressions where we include an interaction of a teacher’s
objective (subjective) evaluation with indicator variables for the tercile of a teacher’s sub-
jective (objective) evaluation. We focus on evaluations by mentors made at the end of a

CHAPTER 3. TEACHER EFFECTIVENESS 121
Table 3.6: Predictive Power of Evaluations and Evaluator Experience

CHAPTER 3. TEACHER EFFECTIVENESS 122
teacher’s first year, since these were found to have the most consistent predictive power for
future student outcomes.
The results (Table 3.5) indicate that objective evaluations are equally predictive of stu-
dent achievement in the second year for teachers with subjective evaluations in each tercile.
In contrast, the coefficient on the interaction of this subjective evaluation and the middle
tercile indicator is larger than interactions with bottom and top tercile for both math and
English achievement, and in English achievement we can reject equality of the three coef-
ficients at conventional levels. In other words, mentor evaluations appear to have greater
power to distinguish effective and ineffective teachers among those whose first year value-
added does not put them either at the lower or upper tail of the distribution.
Our second extension is to investigate whether evaluations by TF interviewers and men-
tors who have more evaluation experience are more powerful predictors of student achieve-
ment. Specifically, to our main regression specification we add a control for the number of
interviews conducted by each TF interviewer prior to their interview with each TF candi-
date, a control for the number of teachers with whom a mentor has worked, and interactions
of these variables with subjective evaluations (Table 3.6). For math scores, we do find a
positive interaction of experience and evaluations given by mentors at the start of the school
year. This provides some suggestive evidence that experienced mentors have more accu-
rate “first impressions” of teacher effectiveness, but the accuracy of evaluations made after
a full year of observation are no better for experienced mentors than their less experienced
colleagues.
3.5 Conclusion
We use data from New York City to examine the power of subjective and objective
evaluations to identify effective and ineffective teachers early in their careers. We find ev-
idence that teachers who receive better subjective evaluations of teaching ability prior to

CHAPTER 3. TEACHER EFFECTIVENESS 123
hire or in their first year of teaching also produce greater gains in achievement, on average,
with their future students. Consistent with prior research, our results support the idea that
teachers who produce greater achievement gains in the first year of their careers also pro-
duce greater gains, on average, in future years with different students. More importantly,
subjective evaluations present significant and meaningful information about a teacher’s fu-
ture success in raising student achievement even conditional on objective data on first year
performance. This is an especially noteworthy finding, considering that variation in sub-
jective evaluations likely also captures facets of teaching skill that may affect outcomes not
captured by standardized tests.
Knowledge regarding the power of subjective evaluations and objective performance
data has important implications for designing teacher evaluation systems, merit pay, and
other polices whose goal is improving teacher quality and student achievement. All school
districts evaluate teachers, but evaluation policies are not typically based in high quality
empirical research and in many cases produce little differentiation among teachers (see
Weisberg et al. 2009). Given the current era of increased accountability for schools and
the research demonstrating the importance 17 of teacher quality, it is likely that states and
school districts will begin to implement policies that put greater stress on teacher effective-
ness.
As this process unfolds, policymakers will need to have a better understanding of the
power and limitations of the measures they use in establishing incentives and accountability
for teachers. Our results, and those of prior work, suggest that evaluation systems which
incorporate both subjective measures made by trained professionals and objective job per-
formance data have significant potential to help address the problem of low teacher quality.
However, we also find that the application of standards can vary significantly across in-
dividuals responsible for making evaluations, and the implementation of any evaluation
system should address this issue.

Bibliography
[1] Aaronson, Daniel, Lisa Barrow, and William Sander. 2007. “Teachers and StudentAchievement in the Chicago Public High Schools.” Journal of Labor Economics,25(1): 95-135.
[2] Abadie, Alberto, Jane Leber Herr, Guido Imbens, and David Drukker. 2004.NNMATCH: Stata module to compute nearest-neighbor bias-corrected estimators.Stata.
[3] Anderson, Harold M. 1954. “A Study of Certain Criteria of Teaching Effectiveness.”Journal of Experimental Education, 23(1): 41-71.
[4] Angrist, Joshua D. 2001. “Estimations of Limited Dependent Variables Models withDummy Endogenous Regressors: Simple Strategies for Empirical Practice.” Journalof Business and Economic Statistics, 19, 2-16.
[5] Angrist, Joshua D., and Jorn-Steffen Pischke. 2009. Mostly Harmless Econometrics.An Empiricist’s Companion. New Jersey: Princeton University Press.
[6] Angrist, Joshua D., Guido Imbens, and Donald B. Rubin. 1996. “Identification ofCausal Effects using Instrumental Variables.” Journal of the American StatisticalAssociation 91, 444-472.
[7] Armor, David, Patricia Conry-Oseguera, Millicent Cox, Nicelma King, LorraineMcDonnell, Anthony Pascal, Edward Pauly, and Gail Zellman. 1976. Analysis ofthe School Preferred Reading Program in Selected Los Angeles Minority Schools.Santa Monica, CA: Rand Corp.
124

BIBLIOGRAPHY 125
[8] Bailey, Thomas R., and Melinda M. Karp. 2003. “Promoting College Access andSuccess: A review of Credit-Based Transition Programs.” Washington, D.C.: U.S.Department of Education, Office of Vocational and Adult Education.
[9] Bailey, Thomas R., Katherine L. Hughes, and Melinda M. Karp. 2002. “What Rolecan Dual Enrollment Play in Easing the Transition from High School to Postsec-ondary Education?” Washington, D.C.: U.S. Department of Education, Office ofVocational and Adult Education.
[10] Breland, Hunter, James Maxey, Renee Gernand, Tammie Cumming, Catherine Tra-pani. 2002. “Trends in College Admission. A Report of a Survey of UndergraduateAdmissions Policies, Practices, and Procedures. Retrieved March 22, 2001, fromhttp://airweb.org/images/trendsreport.pdf
[11] Brookover, Wilbur B. 1945. “The Relation of Social Factors to Teaching Ability.”Journal of Experimental Education, 13(4): 191-205.
[12] Brophy, Jere, and Thomas L. Good. 1986. Teacher Behavior and Student Achieve-ment. In M. C. Wittrock (Ed.), Handbook of Research on Teaching. 3rd ed., 238-375,New York: Simon and Schuster.
[13] Boyd, Donald, Hamilton Lankford, Susanna Loeb, Jonah E. Rockoff, and JamesWyckoff. 2008. “The Narrowing Gap in New York City Teacher Qualifications andIts Implications for Student Achievement in High-Poverty Schools.” Journal of Pol-icy Analysis and Management, 27(4):793-818.
[14] Boyd, Donald, Pamela Grossman, Hamilton Lankford, Susanna Loeb, and JamesWyckoff. 2006. “How Changes in Entry Requirements Alter the Teacher Workforceand Affect Student Achievement.” Education Finance and Policy, 1(2): 176-216.
[15] Calcagno, Juan Carlos, and Bridget T. Long. 2008. “The Impact of PostsecondaryRemediation Using a Regression Discontinuity Approach: Addressing EndogenousSorting and Noncompliance.” National Bureau of Economic Research Working Pa-per 14194.
[16] Camara, Wayne, and Michalis Michaelides. 2005. “AP Use in Admissions: A Re-sponse to Geiser and Santelices.” New York, NY: The College Board.

BIBLIOGRAPHY 126
[17] Cantrell, Steven, Jon Fullerton, Thomas J. Kane, and Douglas O. Staiger. 2007.“National Board Certification and Teacher Effectiveness: Evidence from a RandomAssignment Experiment.” Unpublished Manuscript.
[18] Card, David. 2001. “Estimating the Return to Schooling: Progress on Some Persis-tent Econometric Problems.” Econometrica, 69(5): 1127-60.
[19] Cavalluzzo, Linda. 2004. “Is National Board Certification an Effective Signal ofTeacher Quality?” CNA Corporation Working Paper.
[20] Cellini, Stephanie, Fernando Ferreira, and Jesse Rothstein. 2010. “The value ofschool facility investments: Evidence from a dynamic regression discontinuity de-sign.” The Quarterly Journal of Economics, 125(1): 215-261.
[21] Chay, Kenneth Y., Patrick J. McEwan, and Miguel Urquiola. 2005. "The CentralRole Of Noise In Evaluating Interventions That Use Test Score To Rank Schools."American Economic Review, (95): 1237-1258.
[22] Clotfelter, Charles T., Helen F. Ladd, and Jacob L. Vigdor. 2007. “How and WhyDo Teacher Credentials Matter for Student Achievement?” National Bureau of Eco-nomic Research Working Paper 12828.
[23] Crook, David. 2001. “The impact of College Now: An update: retention and aca-demic progress among program participants who entered CUNY in fall 1987 andfall 1988.” New York: Kingsborough Community College, Office of InstitutionalResearch and Analysis.
[24] College Board. 2008. Annual AP Program Participation 1956-2008. New York, NY:Author.
[25] Commission on the Future of the Advanced Placement Program. 2001. “Access toExcellence: A report of the Commission on the Future of the Advanced PlacementProgram.” New York, NY: College Entrance Examination Board.
[26] Dougherty, Chrys, Lynn Mellor, and Shuling Jian. 2005. “The Relationship betweenAdvanced Placement and College Graduation.” 2005 AP Study Series, Report 1,National Center for Educational Accountability.

BIBLIOGRAPHY 127
[27] Eimers, Mardy, and Robert Mullen. 2003. “Dual Credit and Advanced Placement:Do they help prepare students for success in College?” Paper Presented at Associa-tion of Institutional Research Annual Forum. Tampa, FL.
[28] Epstein, Joyce L. 1985. “A Question of Merit: Principals’ and Parents’ Evaluationsof Teachers.” Educational Researcher, 14(7): 3-10.
[29] Florida Board of Education. 2003. “Study on Acceleration Mechanisms in Florida.”Tallahassee, FL: Florida Department of Education.
[30] Florida Department of Education. 2006. “Community College Dual Enrollment Stu-dents Do Well in Subsequent University Courses.” Fast Fact #83. Tallahassee, FL:Author.
[31] Florida Department of Education. 2004a. “Impact of Dual Enrollment on High Per-forming Students.” Data trend #26. Tallahassee, FL: Author.
[32] Florida Department of Education. 2004b. “Dual Enrollment Students Are MoreLikely to Enroll in Postsecondary Education.” Fast Fact #79. Tallahassee, FL: Au-thor.
[33] Frazier, Calvin M .2000. Dual enrollment: a fifty state overview. Seattle, WA: Insti-tute for Educational Inquiry.
[34] Gallagher, H. Alix. 2004. “Vaughn Elementary’s Innovative Teacher Evaluation Sys-tem: Are Teacher Evaluation Scores Related to Growth in Student Achievement?”Peabody Journal of Education, 79(4): 79-107.
[35] Geiser, Saul, and Veronica Santelices. 2004. “The Role of Advanced Placement andHonors Courses in College Admissions”. Center for Studies in Higher Education.Occasional Paper Series 4.
[36] Goldhaber, Dan and Emily Anthony. 2007. “Can Teacher Quality Be Effectively As-sessed? National Board Certification as a Signal of Effective Teaching.” The Reviewof Economics and Statistics, 89(1): 134-150.
[37] Goldhaber, Dan and Michael Hansen. 2009. “Assessing the Potential of Using Value-Added Estimates of Teacher Job Performance for Making Tenure Decisions.” Centeron Reinventing Public Education Working Paper #2009_2.

BIBLIOGRAPHY 128
[38] Goodman, Joshua. 2009. “The Labor of Division: Returns to Compulsory MathCoursework.” Unpublished manuscript.
[39] Goodman, Tara G., Sarah C. Lathan, Juan C. Copa, David L. Wright. 2001. “Readyor Not, Here They Come: A Longitudinal Analysis of the Effect of Acceleration andRemediation on Baccalaureate Degree Attainment.” Paper presented at the Associa-tion for Institutional Research Annual Forum, Long Beach, CA.
[40] Gordon, Robert, Thomas J. Kane, and Douglas O. Staiger. 2006. The HamiltonProject: Identifying Effective Teachers Using Performance on the Job. Washington,DC: The Brookings Institution.
[41] Gotham, R.E. 1945. “Personality and Teaching Efficiency.” Journal of ExperimentalEducation, 14(2): 157-165.
[42] Greenberg, Arthur R. 1988. "High School Students in College Courses: ThreePrograms." New Directions for Community Colleges, no. 64. San Francisco, CA:Jossey-Bass.
[43] Hahn, Jinyong, Petra Todd, and Wilbert van der Klaauw. 2001. “Identification andEstimation of Treatment Effects with a Regression-Discontinuity Design”, Econo-metrica 69, 201-209.
[44] Hanushek, Eric A. 1971. “Teacher Characteristics and Gains in Student Achieve-ment: Estimation Using Micro Data.” American Economic Review, Papers and Pro-ceedings 61(2): 280-288.
[45] Hargrove, Linda, Donn, Godin, and Barbara Dodd. 2008. “College outcomes com-parisons by AP and non-AP high school experiences.” College Board Research Re-port No. 2008-3. New York, NY: The College Board.
[46] Harris, Douglas N., and Tim R. Sass. 2006. “Value-Added Models and the Measure-ment of Teacher Quality.” Unpublished Manuscript, Florida State University.
[47] Harris, Douglas N., and Tim R. Sass. 2007a. “What Makes for a Good Teacher andWho Can Tell?” Unpublished Manuscript, Florida State University.

BIBLIOGRAPHY 129
[48] Harris, Douglas N., and Tim R. Sass. 2007b. “The Effects of NBPTS-CertifiedTeachers on Student Achievement.” National Center for Analysis of LongitudinalData in Education Research Working Paper #4.
[49] Hill, C.W. 1921. “The Efficiency Ratings of Teachers.” The Elementary School Jour-nal, 21(6): 438-443.
[50] Holtzapple, Elizabeth. 2003. “Criterion-Related Validity Evidence for a Standards-Based Teacher Evaluation System.” Journal of Personnel Evaluation in Education,17(3): 207- 219.
[51] Imbens, Guido. 2004. “Nonparametric Estimation of the Average Treatment EffectsUnder Exogeneity: A Review.” The Review of Economics and Statistics, 86(1):4–29.
[52] Imbens, Guido, and Joshua D. Angrist. 1994. “Identification and Estimation of LocalAverage Treatment Effects.” Econometrica 61: 467-476.
[53] Imbens, Guido, and Thomas Lemieux. 2008. “Discontinuity Designs: A Guide toPractice.” Journal of Econometrics, 142(2): 615-635.
[54] Jacob, Brian A., and Lars J. Lefgren. 2008. “Can Principals Identify Effective Teach-ers? Evidence on Subjective Evaluation in Education.” Journal of Labor Economics,26(1): 101-136.
[55] Jackson, Celement (Kirabo). 2010. “A Little Now for a lot Later: A Look at aTexas Advanced Placement Incentive Program.” Journal of Human Resources, 45(3):591–639.
[56] Jackson, Celement (Kirabo). 2009. “A Stitch in Time: The Effects of a NovelIncentive-Based High-School Intervention on College Outcomes.” Unpublishedmanuscript.
[57] Johnstone, D. Bruce, and Beth Del Genio. 2001. College-level learning in HighSchool: Purposes, Policies and Practical Implications. Washington, D.C.: Associ-ation of American Colleges and Universities.

BIBLIOGRAPHY 130
[58] Kane, Thomas J. 2003. “A Quasi-Experimental Estimate of the Impact of FinancialAid on College-Going.” NBER Working Papers: No. 9703.
[59] Kane, Thomas J., Jonah E. Rockoff, and Douglas O. Staiger. 2008. “What DoesCertification Tell us About Teacher Effectiveness? Evidence from New York City.”Economics of Education Review, 27(6): 615-631.
[60] Kane, Thomas J., and Douglas O. Staiger. 2008. “Estimating Teacher Impacts onStudent Achievement: An Experimental Evaluation.” National Bureau of EconomicResearch Working Paper 14607.
[61] Karp, Melinda M., Juan Carlos Calcagno, Katherine L. Hughes, Dong Wook Jeong,and Thomas R. Bailey. 2007. “The Postsecondary Achievement of Participants inDual Enrollment: An Analysis of Student Outcomes in Two States.” St. Paul, Min-nesota: National Research Center for Career and Technical Education, University ofMinnesota.
[62] Kim, JoHyun. 2006. “The impact of Dual and Articulated Credit on College Readi-ness and Total Credit Hours in Four Selected Community Colleges.” PhD diss. Uni-versity of Illinois at Urbana-Champaign.
[63] Kimball, Steven M., Brad White, Anthony T. Milanowski, and Geoffrey Borman.2004. “Examining the Relationship Between Teacher Evaluation and Student As-sessment Results in Washoe County.” Peabody Journal of Education, 79(4): 54-78.
[64] Kleiner, Brian, and Laurie Lewis. 2005. “Dual enrollment of high school students atpostsecondary institutions, 2002-2003.” Washington, Dc: U.S. Department of Edu-cation, National Center for Education Statistics.
[65] Klopfenstein, Kristin. 2004. “Advanced placement: Do minorities have equal oppor-tunity?” Economics of Education Review, 23:115-131.
[66] Klopfenstein, Kristin, and Kathleen M. Thomas. 2009. “The Link Between Ad-vanced Placement Experience and Early College Success.” The Southern EconomicJournal, 75(3).

BIBLIOGRAPHY 131
[67] Lee, David, and David Card. 2008. “Regression Discontinuity Inference with Spec-ification Error.” Journal of Econometrics, 142(2):655-674.
[68] Lerner, Jennifer B., and Betsy Brand. 2006. “The College Ladder: Linking Sec-ondary and Postsecondary Education for Success for All Students.” Washington, DE:American Youth Policy Forum.
[69] Light, Audrey, and Wayne Strayer. 2000. “Determinants of College Completion:School Quality or Student Ability?” The Journal of Human Resources, 35(2), 299-332.
[70] Lee, David, and Thomas Lemieux. 2010. "Regression Discontinuity Designs in Eco-nomics." Journal of Economic Literature, 48(2): 281–355.
[71] Manatt, Richard P. and Bruce Daniels. 1990. “Relationships Between Principals’Ratings of Teacher Performance and Student Achievement.” Journal of PersonnelEvaluation in Education 4(2): 189-201.
[72] Manski, Charles F. 1989. “Schooling as Experimentation: a Reappraisal of the Post-secondary Dropout Phenomenon”. Economics of Education Review, 8(4), 305-12.
[73] Martorell, Paco, and Isaac McFarlin. 2009. “Help or Hindrance? The Effectsof College Remediation on Academic and Labor Market Outcomes.” UnpublishManuscript.
[74] Matus, Ron, “Elia: AP shift is "the best for kids"”, TheGradebook, May 2004. Retrieved April 15, 2011, fromhttp://www.tampabay.com/blogs/gradebook/content/elia-ap-shift-best-kids
[75] McCrary, Justin. 2008. “Manipulation of the Running Variable in the RegressionDiscontinuity Design: a Density Test.” Journal of Econometrics, 142(2), 698-714.
[76] Medley, Donald M., and Homer Coker. 1987. “The Accuracy of Principals’ Judg-ments of Teacher Performance.” Journal of Educational Research, 80(4): 242-247.
BIBLIOGRAPHY 132
[77] Milanowski, Anthony. 2004. “The Relationship Between Teacher Performance Eval-uation Scores and Student Achievement: Evidence From Cincinnati.” Peabody Jour-nal of Education, 79(4): 33-53.
[78] Morest, Vanessa and Melinda M. Karp. 2006. “Twice the Credit, Half the Time.” InDefending the Community College Equity Agenda. Ed. Thomas Bailey and VanessaMorest. Chapter 9. Baltimore, MD: Johns Hopkins University Press.
[79] Murnane, Richard J. 1975. The Impact of School Resources on the Learning of InnerCity Children. Cambridge, MA: Balinger.
[80] National Center for Education Statistics. 2008. Digest of Education Statistics, 1990-2008. Washington, D. C.: U.S. Department of Education.
[81] National Center for Education Statistics. 2006. Digest of Education Statistics, 2005.Washington, D. C.: U.S. Department of Education.
[82] National Center for Education Statistics. 2004. Digest of Education Statistics, 2004.Washington, D. C.: U.S. Department of Education.
[83] National Center for Education Statistics. 2003. “Remedial Education at Degree-Granting Postsecondary Institutions in Fall 2000” Washington, DC: U.S. Departmentof Education.
[84] National Center for Education Statistics. 1998. Digest of Education Statistics, 1995.Washington, D. C.: U.S. Department of Education.
[85] Nitzke, Joseph E. 2002. “A Longitudinal Study of Dual Credit Enrollment of HighSchool Students as an Accelerator for Degree Completion.” PhD diss. Iowa StateUniversity, College of Education.
[86] O’Brien, Daniel and Teresa D. Nelson. 2004. “Strengthening College Preparationand Access Through Concurrent Enrollment in High School and Community Col-lege.” Texas School Project: unpublished manuscript.
[87] Office of Program Policy Analysis and Government Accountability. 2006.“State’s High School Acceleration Programs Are Funded through a Variety ofSources.”(Report No 06-27). Tallahassee, FL: Florida Legislature.

BIBLIOGRAPHY 133
[88] Office of Program Policy Analysis and Government Accountability. 2006a. “MostAcceleration Students Perform Well, But Outcomes Vary by Program Type.” (ReportNo 06-25). Tallahassee, FL: Florida Legislature.
[89] Office of Program Policy Analysis and Government Accountability. 2006b. “Accel-eration Programs Provide Benefits But the Costs Are Relatively Expensive.” (ReportNo 06-24). Tallahassee, FL: Florida Legislature Rosenbaum, Paul R. 1987. The roleof a second control group in an observational study. Statistical Science, 2(3), 292-306.
[90] Peterson, Kenneth D. 1987. “Teacher Evaluation with Multiple and Variable Linesof Evidence.” American Educational Research Journal, 24(2): 311-317.
[91] Rivkin, Steven G., Eric A. Hanushek, and John Kain. 2005. “Teachers, Schools, andAcademic Achievement.” Econometrica, 73(2): 417–458.
[92] Rockoff, Jonah E. 2004. “The Impact of Individual Teachers on Student Achieve-ment: Evidence from Panel Data.” American Economic Review Papers and Pro-ceedings, 94(2): 247-252.
[93] Rockoff, Jonah E. 2008. “Does Mentoring Reduce Turnover and Improve Skills ofNew Employees? Evidence from Teachers in New York City.” National Bureau ofEconomic Research Working Paper 13868.
[94] Rockoff, Jonah E., Douglas O. Staiger, Eric Taylor, and Thomas J. Kane. 2009.“Information and Employee Evaluation: Evidence from a Randomized Interventionin Public Schools.” Unpublished Manuscript, Columbia University.
[95] Rose, Heather, and Julian Betts. 2004. “The Effect of High School Courses on Earn-ings.” The Review of Economics and Statistics, 86(2): 497-513.
[96] Rubin, D. B. (1974), "Estimating Causal Effects of Treatments in Randomized andNonrandomized Studies." Journal of Educational Psychology, 66, 688-701.
[97] Sanders, William L., and June C. Rivers. 1996. Cumulative and Residual Effectsof Teachers on Future Student Academic Achievement. Knoxville: University ofTennessee Value-Added Research and Assessment Center.

BIBLIOGRAPHY 134
[98] Schacter, John, and Yeow M. Thum. 2004. “Paying for High- and Low- QualityTeaching.” Economics of Education Review, 23(4): 411-440.
[99] Stock, James H., Jonathan H. Wright, and Motohiro Yofo. 2002. “A Survey of WeakInstruments and Weak Identification in Generalized Method of Moments.” Journalof Business and Economic Statistics 20, 518-29.
[100] Swanson, Joni. 2008. “An Analysis of the Impact of High School Dual EnrollmentCourse Participation on Post-Secondary Academic Success, Persistence and DegreeCompletion.” PhD diss. University of Iowa, College of Education.
[101] Tyler, John H., Eric S. Taylor, Thomas J. Kane, and Amy L. Wooten. 2009. “UsingStudent Performance Data to Identify Effective Classroom Practices.” Draft WorkingPaper. Providence, R.I.: Brown University, and Cambridge, Mass.: Harvard Univer-sity.
[102] Waits, Tiffany, J. Carl Setzer, and Laurie Lewis. 2005. “Dual Credit and Exam-Based Courses in U.S. Public High Schools: 2002–03” (NCES 2005–009). U.S.Department of Education. Washington, DC: National Center for Education Statistics.
[103] Weingarten, Randi. 2007. “Using Student Test Scores to Evaluate Teachers: Com-mon Sense or Nonsense?” New York Times Advertisement, March.
[104] Weisberg, Daniel, Susan Sexton, Jennifer Mulhern, and David Keeling. 2009. TheWidget Effect. Brooklyn, NY: The New Teacher Project.
[105] Western Interstate Commission for Higher Education. 2006. “Moving the Needleon Access and Success: A Study of State and Institutional Policies and Practices.”Boulder, CO: Author.
[106] Wilkerson, David J., Richard P. Manatt , Mary A. Rogers , and Ron Maughan. 2000.“Validation of Student, Principal, and Self-Ratings in 360° Feedback® for TeacherEvaluation.” Journal of Personnel Evaluation in Education, 14(2): 179-192.